Hi! My name is Adé Larsen and I am a third-year undergraduate at MIT studying Biology and Finance. I wear a lot of hats on campus: I’m a captain of the Varsity Sailing team, an EMT first-responder with MIT-EMS, a TA for undergraduate physics, and a member of other communities I’ve taken interest in. This semester, I am working on a research project in the Church Lab at Harvard Medical School’s Department of Genetics, and I’m excited to develop my synthetic biology skills in HTGAA! I see biology as a tool to derive creative solutions to the world’s problems with particulat interests in adressing the climate crisis and growing energy problem.
View Image Credits Image courtesy of Vincent Muir
Q1. Describe a biological engineering application or tool you want to develop and why: Concept: Bio-Circuit for CO₂ Sensing and Reduction
3.1. Choose your protein Question: In recitation, we discussed that you will pick a protein for your homework that you find interesting. Which protein have you chosen and why? Using one of the tools described in recitation (NCBI, UniProt, google), obtain the protein sequence for the protein you chose.
The protein I have chosen is Rubisco, the protein responsible for fixing carbon dioxide during photosynthesis. I have chosen this protein because one of my final project ideas was to create a system that is more efficient at fixing carbon.
Published Automation Research Question: Find and describe a published paper that utilizes the Opentrons or an automation tool to achieve novel biological applications.
The Paper Title: An automated cell-free platform for the rapid characterization of genetic regulators Journal: Scientific Reports (2024) Source: https://www.nature.com/articles/s41598-024-52642-x Description This research utilizes the Opentrons OT-2 to automate the setup of cell-free protein synthesis (CFPS) reactions. The authors focused on characterizing genetic parts like promoters and riboswitches. By using automation, they were able to test over 1,000 different conditions in a fraction of the time it would take a human, with much higher reproducibility across plates.
HW – Part A: Amino Acids and Protein Folding 4.1. Quantitative Consumption Question: How many molecules of amino acids do you take with a piece of 500 grams of meat? (On average an amino acid is ~100 Daltons).
1 gram is equal to Avogadro’s number of daltons (6.022E23 Da). To find the total molecules in 500g of meat:
Part 1: Generate Binders with PepMLM The target for this study is the human SOD1 protein (UniProt P00441), specifically focusing on the A4V mutation, which is a common cause of Amyotrophic Lateral Sclerosis (ALS).
Mutant SOD1 Sequence (A4V):
ATKVVCVLKGDGPVQGIINFEQKESNGPVKVWGSIKGLTEGLHGFHVHEFGDNTAGCTSAGPHFNPLSRKHGGPKDEERHVGDLGNVTADKDGVADVSIEDSVISLSGDHCIIGRTLVVHEKADDLGKGGNEESTKTGNAGSRLACGVIGIAQ
Using PepMLM-650M, four peptides of 12 amino acids were generated and compared against the known SOD1-binding peptide FLYRWLPSRRGG.
Assignment Part 1: Intracellular Artificial Neural Networks (IANNs) What advantages do IANNs have over traditional genetic circuits, whose input/output behaviors are Boolean functions? Analog Processing: IANNs process continuous, multi-level inputs to produce graded, proportional responses, rather than being restricted to rigid binary (ON/OFF) states. Complex Integration: A single IANN layer can compute complex, non-linear functions by tuning biological “weights” (like promoter strength), whereas Boolean logic requires fragile, metabolically expensive cascades of multiple gates to achieve the same complexity. Robustness: Because they use graded signals and distributed pathways, IANNs are more resistant to biological noise and mutation, showing gradual performance decline (graceful degradation) instead of catastrophic failure. Describe a useful application for an IANN; include a detailed description of input/output behavior, as well as any limitations an IANN might face to achieve your goal. A potential application could be an environmental risk biosensor that measures the combined threat of multiple water pollutants (e.g., arsenic and pesticides) and outputs a color-coded, continuous risk scale.
Part 1: General Homework Questions 1. Advantages of Cell-Free Synthesis Cell-free protein synthesis (CFPS) offers an “open” architecture, allowing for direct control over the chemical environment. Unlike in vivo methods, CFPS is not limited by cell toxicity or metabolic competition.
Toxic Protein Production: CFPS can produce proteins that would otherwise kill a living host cell. High-Throughput Screening: It allows for the rapid testing of genetic libraries without the need for time-consuming cloning and cell culture. 2. Main Components Cell Extract: The catalytic machinery (ribosomes, polymerases). DNA Template: The genetic instructions. NTPs & Amino Acids: The energy and building blocks. Energy Regeneration: Essential for recycling ATP to sustain translation. 3. Energy Provision Energy regeneration is critical because ATP is consumed rapidly and phosphate byproducts inhibit the reaction. The Creatine Phosphate/Creatine Kinase system is often used to maintain an ATP supply by transferring phosphate groups to ADP.
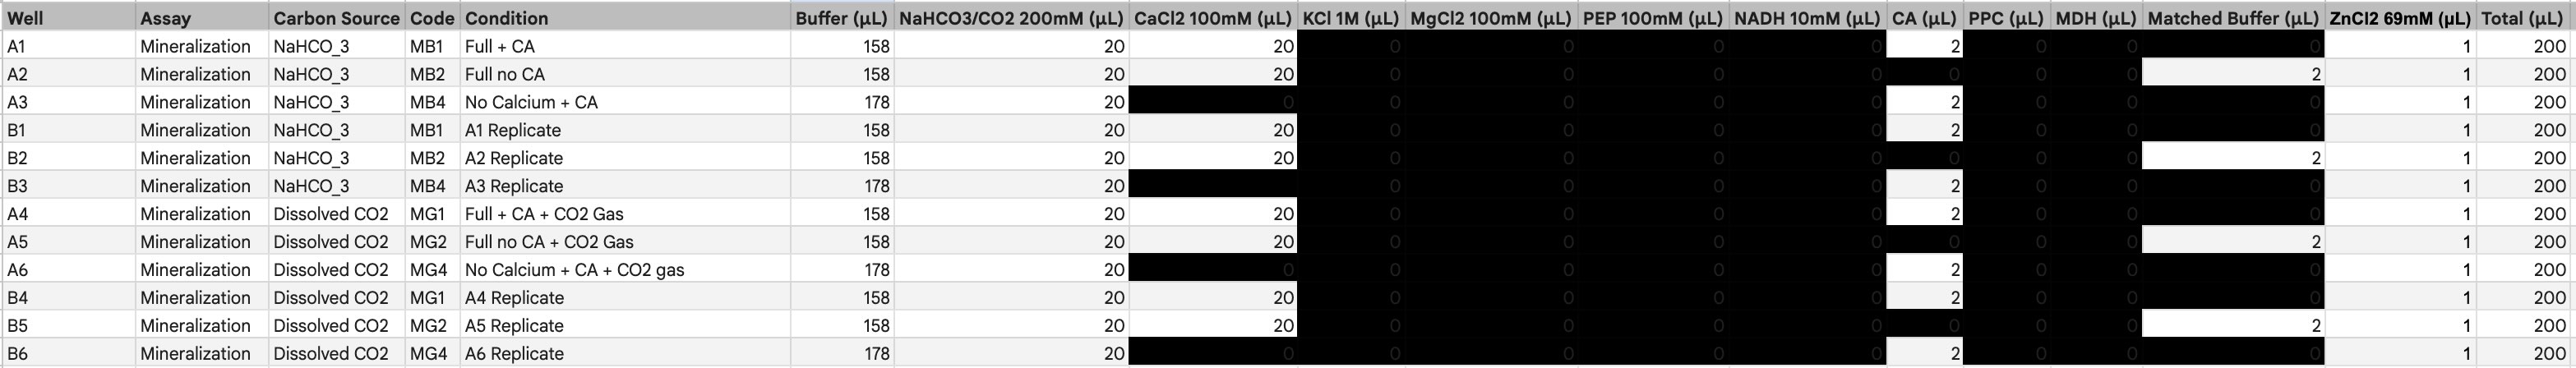
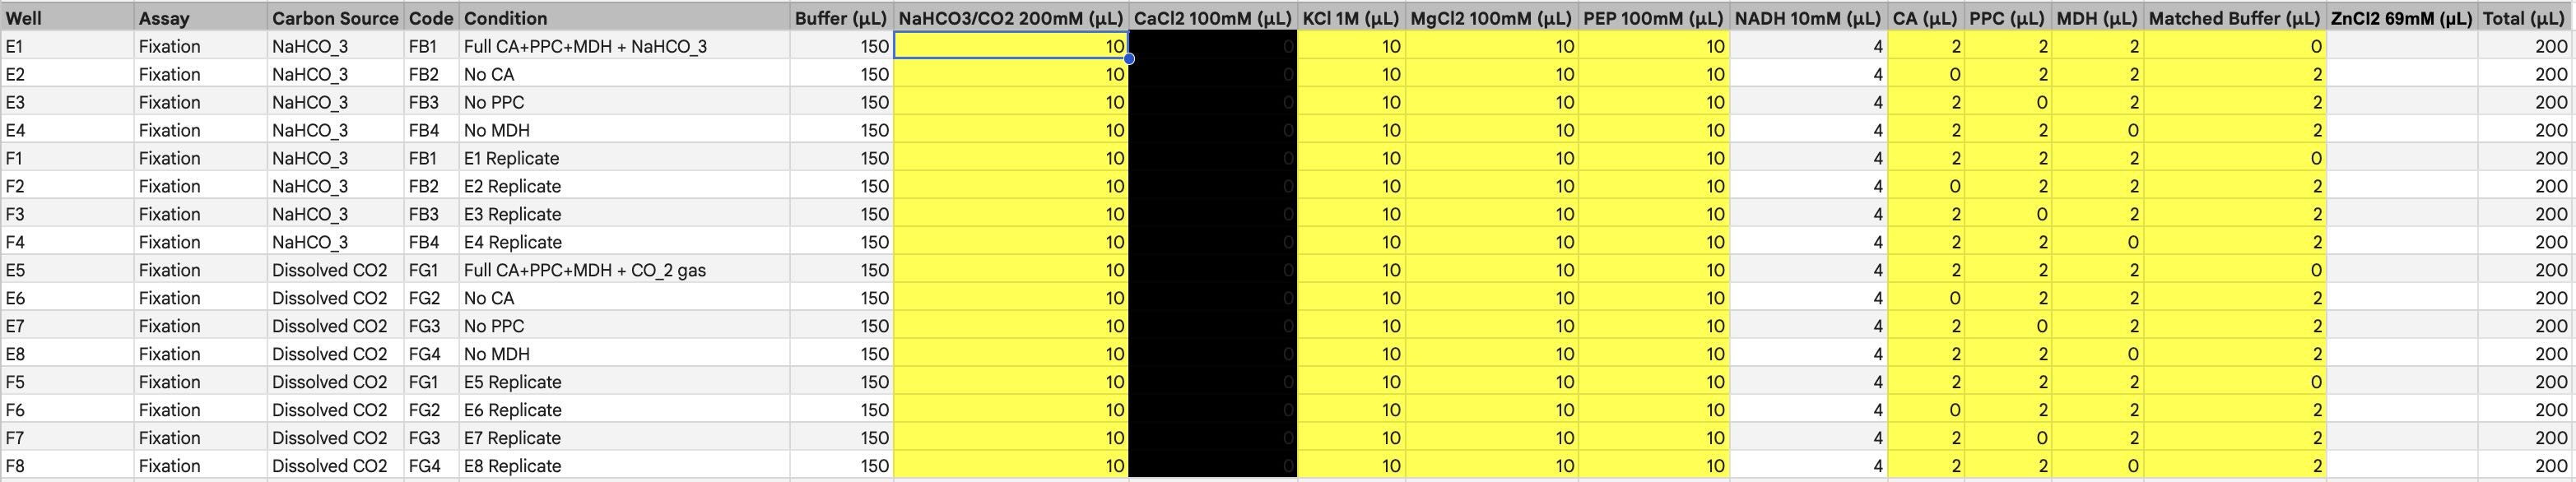
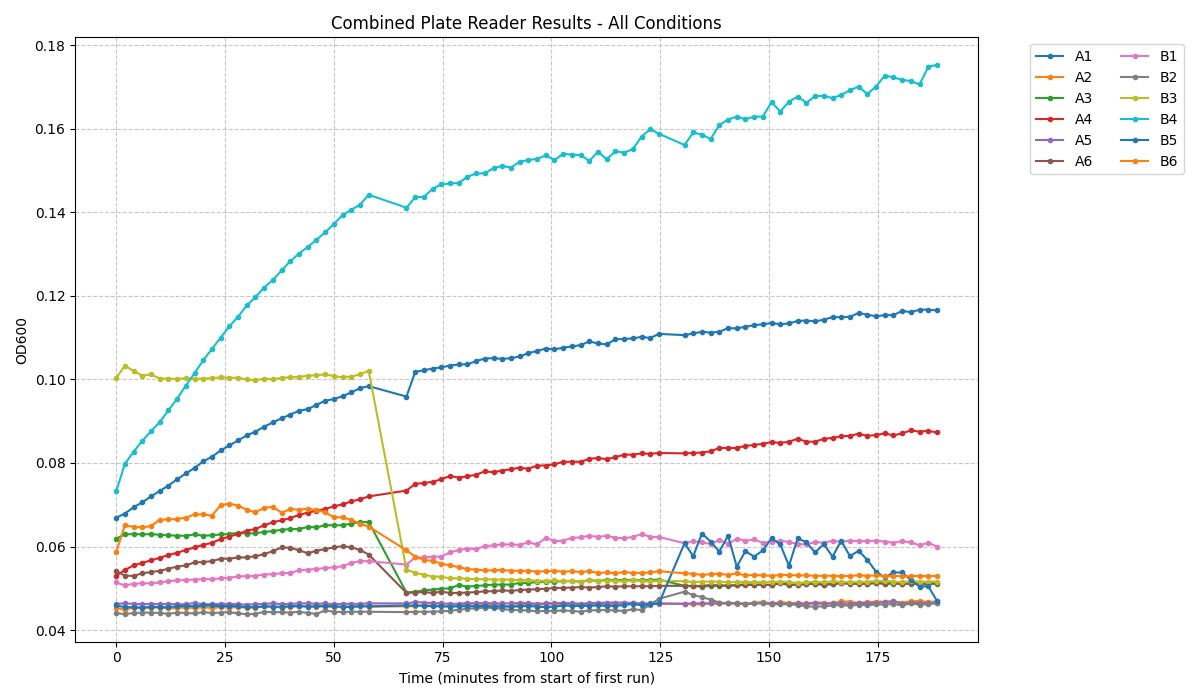
Homework: Final Project Integration Please identify at least one (ideally many) aspect(s) of your project that you will measure. It could be the mass or sequence of a protein, the presence, absence, or quantity of a biomarker, etc. I will be measuring a couple of aspects to assay my experiments. For example, i will be using a spectrophotometer to quantify NADH exchange to validate that the malate products are being formed. I will be looking at turbidity and optical density to evaluate calcium chloride precipitate quantity and formation rate to analyze the efficacy of carbonic anhydrase. Additionally, I ordered some inorganic carbon sats made with heavy carbon, which I plan to compare to a standard to showcase additional evidence of reaction success and product formation.
Homework: Master Mix Component Analysis Referencing the cell-free protein synthesis reaction composition, provide a 1-2 sentence description of what each component’s role is in the cell-free reaction. 1. E. coli Lysate
BL21 (DE3) Star Lysate: Provides the core machinery for translation (ribosomes, tRNAs) and T7 RNA Polymerase for transcription; the “Star” mutation specifically helps by reducing mRNA degradation during the reaction. 2. Salts/Buffer
Q1. Describe a biological engineering application or tool you want to develop and why:
Concept: Bio-Circuit for CO₂ Sensing and Reduction
An idea I have is creating a biological circuit designed to sense CO₂ emissions (or a chemical indicative of excess CO₂ production/presence). The higher goal would be to design a self-sustaining biological system capable of reducing CO₂ emissions with applications for enhancing green climate technology. With modern biosynthesis tools, I envision being able to modify a signal cascade pathway to trigger a fluorescent response for detection, then modify a protein like Rubisco to engineer greater carbon fixation as a potential method for emission reduction.
Q2. Describe a governance or policy goal related to ensuring that this application or tool contributes to an “ethical” future:
Goal: Biosafety and Biocontainment
The biggest concern related to applications of this idea would be biosafety. When working with biological systems, it is important to ensure that biological agents are contained, especially considering this is a living system. The release of synthetic systems into the environment could prove detrimental given the potential for uncontrolled growth and competition with natural systems. It is crucial that my system can “self-prune” or regulate itself to control excess growth of this nature.
Q3. Describe at least three different potential governance “actions.”
Mandatory DNA Synthesis Screening (Option 1):
I propose modifying the actions of commercial DNA synthesis companies and academic researchers. To my knowledge, DNA synthesis screening is typically voluntary and/or specified to a small number of target pathogens. I propose enforcing mandatory screening of all synthetic DNA orders against a broad, consistently updated database of functional genomic markers, regardless of whether they belong to a known pathogen. This would hopefully lead to the characterization of more sequences responsible for hazardous biological activity. Implementation would likely require a standard technical protocol that all synthesis providers must use. Success would require major industry players to opt-in to prevent “offshoring” orders to countries to mitigate the likely associated costs. This assumes current screening algorithms are able to accurately distinguish between benign research and flagged motif sequences without a high rate of false positives.
Incentivizing Responsible Research via Insurance (Option 2):
I propose a model to incentivize responsible research by changing how actors (private insurance companies, research institutions, etc.) behave systematically. Biorisk management is often seen as a bureaucratic cost. Under this model, institutions would receive lower insurance premiums upon demonstration of high-quality biorisk oversight. This could include frequent independent audits, mandatory training, and transparency with quality assessments. This is only executable assuming that private insurers have the technical expertise to judge scientific risk, and that the financial savings from lower premiums are a large enough incentive to reshape institutional behavior.
Mandatory Transparency in Research Publications (Option 3):
Research papers typically do not acknowledge the potential for misuse of new findings. This proposal would create a rule mandating that no federal funding be given, nor publications in major journals be accepted, without a clearly detailed section outlining potential risks and mitigation strategies. Regulators must create a standardized template to ensure quality and compliance. Editing staff would now also include biosecurity reviewers to ensure quality and evaluate these statements before publication. This assumes that scientists are able to envision potential misuse cases of their own work, a task growing in difficulty given assisted ideation with AI.
Q4. Governance Scoring Matrix
Does the option:
Option 1 (Screening)
Option 2 (Insurance)
Option 3 (Transparency)
Enhance Biosecurity
• By preventing incidents
High. Acts as a physical gatekeeper preventing the creation of hazardous sequences.
Medium. Encourages safety culture but doesn’t physically stop bad actors.
Low. Relies on post-hoc review; good for awareness but doesn’t prevent creation.
• By helping respond
High. Creates a digital paper trail of who ordered what sequence.
Medium. Audit trails helps liability but not immediate biological response.
Medium. Ensures mitigation strategies are pre-thought out and published.
Foster Lab Safety
• By preventing incident
Low. Focuses on the “what” (DNA), not the “how” (handling).
High. Directly mandates training and oversight of daily lab practices.
Low. Administrative in nature.
• By helping respond
Low. Not relevant to immediate lab accidents.
High. Insurance protocols would mandate accident reporting/response plans.
Low.
Protect the environment
• By preventing incidents
High. Prevents synthesis of invasive/modified traits before release.
Medium. Better oversight leads to better containment protocols.
Low.
• By helping respond
Medium. Database allows rapid identification of escaped synthetic organisms.
Medium. Funding available for cleanup/remediation via insurance.
Medium. Publication strategies may include kill-switch documentation.
Other considerations
• Minimizing costs/burdens
Low. High technical and administrative burden on providers.
Low. High upfront cost for institutions to reorganize compliance.
Medium. Adds writing/review time, but low financial cost.
• Feasibility?
Medium. Technology exists, but requires international buy-in.
Low. Market forces may not support this without regulation.
High. Journals/Grants can easily add this requirement.
• Not impede research
Low. False positives could delay legitimate experiments.
Medium. Could create cost barriers for small labs/startups.
Medium. Scientists may self-censor or fear “hazard” labeling.
• Promote constructive apps
High. Builds trust that the foundation of bio-economy is safe.
High. Professionalizes the industry.
Medium. Increases public trust through transparency.
Q5. Drawing upon this scoring, describe which governance option, or combination of options, you would prioritize, and why.
In order to combat an evolving landscape trending towards increased biological threats, I recommend that national regulatory bodies (e.g., NIH) prioritize an integrated governance strategy that mandates DNA Synthesis Screening (Option 1). This will function as a gatekeeper, providing a platform to embed Responsible Research Oversight into the budget cycle. This multi-tiered approach assumes that screening stays on pace with AI-driven pathogen design while additionally assuming international industry cooperation to prevent a financial “race to the bottom” in safety standards. The primary trade-off is adding to the administrative burden on researchers, potentially delaying legitimate innovation; however, the combined approach minimizes the risk of accidental (or deliberate) release by creating a physical barrier through sequence production and a procedural/administrative barrier through rigorous researcher training and compliance efforts.
Weekly Reflection
Reflecting on week one of How to Grow Almost Anything 2026, the core ethical challenge that stood out to me centered on the “dual-use dilemma.” This makes logical sense; as we develop more advanced biosynthetic tools, the availability of such tools in non-centralized nodes increases, limiting the ability to control how the technology is used. Additionally, it is slightly concerning to think that AI-driven design with synthetic biology has the ability to produce novel toxins that would be unrecognizable. I would propose a strategy that assumes that “safety-by-design” can mitigate risks without stifling the creative freedom central to the HTGAA mission. This would ensure that labs with access to technology are required to follow compliance protocols that prevent widespread abuse of new technologies for nefarious intentions. I believe it is reasonable to suggest increasing the administrative load for the purpose of maintaining access to groundbreaking technology safely.
Homework Questions
Professor Jacobson: Polymerase & Coding
1. Nature’s machinery for copying DNA is called polymerase. What is the error rate of polymerase? How does this compare to the length of the human genome. How does biology deal with that discrepancy?
Error Rate: Polymerases have a natural error rate of 10^-5 (1 in 100,000 wrong bases).
Comparison: When compared to the length of the human genome, which is approximately 3 x 10^9 (3 billion) base pairs long, this would result in 30,000+ incorrectly copied base pairs per division, which would be detrimental.
Correction Mechanism: Biology deals with this discrepancy through proofreading in the form of 3’ to 5’ exonuclease activity, essentially stalling enzyme activity whenever an incorrect match is made and editing it. Additionally, there are protein complexes responsible for mismatch repair that proofread replicated DNA once completed, bringing the error rate down to approximately 10^-9.
2. How many different ways are there to code (DNA nucleotide code) for an average human protein? In practice what are some of the reasons that all of these different codes don’t work to code for the protein of interest?
Coding Possibilities: The genetic code contains innate degeneracy, which helps to conserve functional loss whenever a mismatch occurs. Amino acids contain as many as 6 degenerate codons. Considering an average of 3 codons per amino acid and 400 amino acids per human protein on average, there are roughly 3^400 distinct DNA sequences that can code for a single protein.
Practical Limitations: In practice, not all of these will code for the protein of interest efficiently. This is partially due to codon usage bias, where the machinery prefers specific coding motifs based on tRNA availability. Additionally, not all DNA is used to code for a protein; splicing of mRNA for transcription changes what code is conserved and, as a result, what protein is actually synthesized.
Dr. LeProust: DNA Synthesis
3. What’s the most commonly used method for oligo synthesis currently?
Currently, solid-phase phosphoramidite chemistry is the most commonly used method for oligo synthesis. This utilizes a technique where a computer controls the chemical workflow to build DNA chains in the opposite direction (3’ to 5’).
4. Why is it difficult to make oligos longer than 200nt via direct synthesis?
Because chemical reactions are imperfect, even given a 99.5% efficiency rate, an oligo of 200nt would only be 0.995^200 accurate (approx. 36% yield). This means more than half of the synthesized DNA would be inaccurate or failed sequences.
5. Why can’t you make a 2000bp gene via direct oligo synthesis?
Utilizing the same math from earlier, 0.995^2000 results in 0.004% accuracy. Effectively, only 1 in 25,000 “genes” synthesized would be accurate, making it chemically impossible to isolate the correct sequence from the mixture of failures.
George Church: The Lysine Contingency
6. What are the 10 essential amino acids in all animals, and how does this affect your view of the “Lysine Contingency”?
Essential Amino Acids: The 10 essential amino acids cannot be synthesized by mammalian cellular machinery and must be consumed through food. They are: Arginine, Histidine, Isoleucine, Leucine, Lysine, Methionine, Phenylalanine, Threonine, Tryptophan, and Valine.
The Lysine Contingency: The “Lysine Contingency” from Jurassic Park is the theoretical fail-safe engineered to prevent dinosaurs from surviving in the wild. However, since lysine is already an essential amino acid, the dinosaurs would naturally need to eat lysine in their diet to survive regardless of genetic engineering. Therefore, removing their ability to produce lysine has the same effect as a standard starvation diet, serving as no additional protective measure.
Gemini AI was consulted for formatting
Week 2 Homework: DNA Read, Write & Edit
3.1. Choose your protein
Question: In recitation, we discussed that you will pick a protein for your homework that you find interesting. Which protein have you chosen and why? Using one of the tools described in recitation (NCBI, UniProt, google), obtain the protein sequence for the protein you chose.
The protein I have chosen is Rubisco, the protein responsible for fixing carbon dioxide during photosynthesis. I have chosen this protein because one of my final project ideas was to create a system that is more efficient at fixing carbon.
Question: The Central Dogma discussed in class and recitation describes the process in which DNA sequence becomes transcribed and translated into protein. The Central Dogma gives us the framework to work backwards from a given protein sequence and infer the DNA sequence that the protein is derived from. Using one of the tools discussed in class, NCBI or online tools, determine the nucleotide sequence that corresponds to the protein sequence you chose above.
Question: Once a nucleotide sequence of your protein is determined, you need to codon optimize your sequence. In your own words, describe why you need to optimize codon usage. Which organism have you chosen to optimize the codon sequence for and why?
Different organisms recognize DNA strands in slightly different ways, so codon optimization is necessary so that motifs that are native to an organism’s machinery are recognized and the gene function is conserved.
3.4. You have a sequence! Now what?
Question: What technologies could be used to produce this protein from your DNA? Describe in your words how the DNA sequence can be transcribed and translated into your protein. You may describe either cell-dependent or cell-free methods, or both.
I could use a standard cloning process to produce this protein from DNA. This involves cutting a circular piece of DNA with restriction enzymes, inserting my gene of interest into the plasmid, and using a ligation reaction to create the genetic insertion I wish to express. Then I would insert the plasmid into an organism (E. coli) to produce my protein of interest.
[Image of molecular cloning workflow]
5.1 DNA Read
(i) What DNA would you want to sequence and why?
I would want to sequence and read the DNA from highly efficient plant species. Again I’m potentially pursuing a final project in which I create a biosensor for carbon dioxide production or an efficient fixation system and understanding the machinery responsible for these reactions is crucial.
(ii) What technology or technologies would you use to perform sequencing on your DNA and why?
To identify the specific genes responsible for efficient carbon fixation, I would utilize PacBio SMRT (Single Molecule Real-Time) Sequencing. Plant genomes are notoriously difficult to read because they are often polyploid and filled with repetitive DNA sections. Older technologies (like Illumina) chop DNA into tiny pieces, making it impossible to puzzle a complex plant genome back together. PacBio uses long reads to span these repetitive gaps, allowing me to fully reconstruct the gene clusters responsible for the plant’s efficiency.
Technology Choice: I would use PacBio SMRT Sequencing
Why: This technology produces “long reads” (reading long stretches of DNA at once) with high accuracy. This is crucial for de novo assembly of plant genomes, which contain highly repetitive sequences that short-read technologies cannot resolve.
Generation: This is a Third-Generation sequencing technology.
How so? Unlike second-generation methods (which require chopping DNA, amplifying it into clusters, and pausing to take photos), third-generation sequencing reads single molecules of DNA in real-time without the need for PCR amplification during the reading process.
Input & Preparation:
Input: High Molecular Weight (HMW) genomic DNA (gDNA).
Preparation:
Extraction: Isolate DNA carefully to keep strands long (15,000+ base pairs).
Fragmentation: Shear the DNA into uniform large sizes (e.g., 15kb).
SMRTbell Construction: This is the essential step. Hairpin-shaped adapters are ligated (glued) to both ends of the double-stranded DNA. This turns the linear DNA into a circle.
Primer Binding: A sequencing primer and DNA polymerase are bound to the adapters.
Essential Steps & Base Calling:
Loading: The SMRTbell templates are loaded onto a chip containing millions of microscopic wells called ZMWs (Zero-Mode Waveguides).
Sequencing: A single DNA polymerase enzyme is anchored at the bottom of the ZMW. As the DNA circle moves through the enzyme, the polymerase incorporates fluorescently labeled nucleotides (A, T, C, G).
Base Calling: Each nucleotide emits a distinct color of light (pulse) as it is added. A camera records this movie of light flashes in real-time to determine the sequence.
HiFi Mode: Because the DNA is a circle, the polymerase reads the same sequence over and over again. The software creates a “consensus” from these passes, eliminating random errors.
Output:
The output is HiFi Reads (High Fidelity Long Reads). These are digital files (typically FASTQ or BAM) containing sequences that are exceedingly long (10,000 to 25,000 base pairs) with >99.9% accuracy.
5.2 DNA Write
(i) What DNA would you want to synthesize and why?
To create a sensor capable of detecting carbon fixation rates, I would synthesize a genetic circuit. This circuit would utilize a specific promoter (such as a cyanobacterial carbon-responsive promoter) upstream of a reporter gene (like GFP). By synthesizing variations of this promoter, I can tune the sensitivity of the sensor. To achieve this, I would use Silicon-based High-Throughput DNA Synthesis (the technology used by Twist!). This platform miniaturizes the chemical process onto a silicon chip, allowing me to “print” thousands of different sensor designs simultaneously to find the most efficient one.
(ii) What technology would you use?
Technology Choice: I would use Silicon-based Phosphoramidite Synthesis (Twist Bioscience Platform).
Why: Unlike traditional synthesis (which uses plastic 96-well plates), this technology uses a silicon chip with millions of microscopic wells. This allows for massive scale; I can synthesize thousands of variations of my carbon sensor circuit to test different sensitivity levels in parallel.
Essential Steps of Synthesis:
Oligonucleotide Printing: The process begins on a silicon chip. Using inkjet-like technology, specific nucleotides (A, C, T, G) are added layer-by-layer using phosphoramidite chemistry. This builds short, single-stranded pieces of DNA called “oligos” (usually <200 base pairs).
Cleavage & Retrieval:** Once the oligos are built, they are chemically cut (cleaved) off the silicon chip and pooled together in a liquid mixture.
Gene Assembly: Since oligos are short and genes are long, the oligos are designed to overlap. Using a reaction similar to PCR (called Polymerase Cycling Assembly), the overlapping oligos act as primers for each other, stitching together to form the full-length double-stranded DNA fragment (e.g., my 1,000bp sensor).
Cloning & QC: The assembled DNA is inserted into an expression vector (plasmid) and usually sequenced (using NGS) to ensure there are no errors before being shipped.
Limitations (Speed, Accuracy, Scalability):
Length (Scalability): We cannot synthesize a whole genome in one continuous strand. The chemical yield drops as the chain gets longer. We are generally limited to synthesizing fragments of 1.8kb to 3kb. Larger constructs (like whole genomes) must be stitched together from these smaller chunks.
Accuracy: Chemical synthesis has an error rate (roughly 1 error every few hundred bases). While highly accurate, deletions or insertions can occur. This requires “error correction” steps or sequencing to find the perfect clones.
Speed: While the “printing” is fast, the downstream assembly and shipping usually take weeks (10–20 business days), which is slower than simply ordering a primer.
5.3 DNA Edit
(i) What DNA would you want to edit and why?
I would propose editing the human genome to modulate the expression of telemorase reverse transcriptase (TERT). Telomere shortening acts as a “molecular clock” that limits the number of times a cell can divide, eventually leading to cellular aging (senescence) and tissue failure. By utilizing gene editing to enhance telomerase activity in specific adult stem cell populations, we could theoretically delay the onset of age-related degenerative diseases, thereby extending human “healthspan” and longevity.
(ii) What technology would you use to perform these DNA edits and why?
I would use the CRISPR-Cas9 System (specifically utilizing Homology Directed Repair (HDR)). CRISPR is currently the most versatile, programmable, and accessible tool for mammalian genome editing. Unlike older zinc finger nucleases, CRISPR relies on a simple RNA guide, making it easy to retarget to the specific telomerase promoter regions I want to modify.
Essential Steps of Editing:
Guide RNA (gRNA) Design:I would synthesize a specific string of RNA (approx. 20 bases) that matches the DNA sequence near the TERT gene.
Cas9 Complex Formation: The gRNA binds to the Cas9 protein (the “molecular scissors”), creating a ribonucleoprotein complex.
Targeting & Scanning: The complex enters the cell nucleus and scans the genome. It looks for a specific molecular anchor called the PAM sequence. Once found, it unzips the DNA to check if the gRNA matches the target.
Cleavage (The Cut): If the sequence matches, Cas9 cuts both strands of the DNA, creating a Double Strand Break (DSB).
Repair (The Edit): This is the critical step. To change the gene (rather than just breaking it), I would provide a Donor DNA Template. The cell uses this template to repair the cut via Homology Directed Repair (HDR), effectively pasting my desired sequence (e.g., a stronger promoter) into the genome.
Limitations:
Off-Target Effects (Accuracy): The biggest risk is that the gRNA might accidentally match a similar sequence elsewhere in the genome, causing Cas9 to cut a gene I didn’t intend to touch which could have no consequence to potentially causing cancer.
HDR Efficiency: Human cells prefer to fix cuts by simply gluing them back together, which is messy and error-prone. Getting the cell to actually use my “Donor Template” is difficult and often happens in only a small percentage of cells, so theres a low efficiency rate.
Delivery: Getting the bulky Cas9 protein and the RNA into the nucleus of a living human (in vivo) is physically difficult. Other viral vectors are often used but have size limits and immune response risks.
Gemini AI was consulted for formatting
Week 3 Homework: Lab Automation
Published Automation Research
Question: Find and describe a published paper that utilizes the Opentrons or an automation tool to achieve novel biological applications.
The Paper
Title: An automated cell-free platform for the rapid characterization of genetic regulators
This research utilizes the Opentrons OT-2 to automate the setup of cell-free protein synthesis (CFPS) reactions. The authors focused on characterizing genetic parts like promoters and riboswitches. By using automation, they were able to test over 1,000 different conditions in a fraction of the time it would take a human, with much higher reproducibility across plates.
This is highly relevant to my interest in carbon fixation. To improve the efficiency of an enzyme like Rubisco, you have to test many different genetic combinations. This paper proves that the OT-2 can handle the tiny volumes and viscosity of cell-free lysates to build those testing libraries accurately.
Final Project Proposal: The Carbon Optimizer
Question: Write a description about what you intend to do with automation tools for your final project. Include core details of what you would automate.
Project Vision
My project involves engineering Rubisco variants to improve carbon fixation rates. Rubisco is a major bottleneck in plant growth because it is slow and often reacts with oxygen instead of CO2. I want to build an automated screening platform to find mutations that improve its carboxylation speed.
Automation Strategy
I plan to use the Opentrons OT-2 as the core of my workflow, potentially integrating with Ginkgo Nebula for large-scale synthesis.
Library Preparation: The robot will be responsible for mixing DNA templates of various Rubisco mutants with cell-free protein synthesis master mix in 384-well plates.
Biosensor Integration: I will include a fluorescent pH-responsive dye in the mixture. When Rubisco fixes CO2, it changes the pH of the well. The automated system will dispense this dye at precise intervals to ensure the readings are consistent across all variants.
Environmental Control: I will use a custom 3D printed plate holder to secure the wells during CO2 gas injection. Automation ensures that every well is treated with the same concentration of CO2 for the same amount of time.
Week 4 Homework: Protein Design Part I
HW – Part A: Amino Acids and Protein Folding
4.1. Quantitative Consumption
Question: How many molecules of amino acids do you take with a piece of 500 grams of meat? (On average an amino acid is ~100 Daltons).
1 gram is equal to Avogadro’s number of daltons (6.022E23 Da). To find the total molecules in 500g of meat:
Total Daltons in 500g: 500g * 6.022E23 Da/g = 3.011E26 Da
Number of Amino Acids: 3.011E26 Da / 100 Da per molecule = 3.011E24 molecules
On average, you consume 3.011E24 amino acids per 500 grams of meat.
4.2. Biological Identity and Digestion
Question: Why do humans eat beef but do not become a cow, or eat fish but do not become fish?
When we eat proteins from another organism, our body breaks them down into their individual building blocks called amino acids. These amino acids are then used by our native machinery to manufacture human proteins. While the raw components come from the fish or cow, they are used to build specific human proteins dictated by our own genetic code.
4.3. The Standard Genetic Code
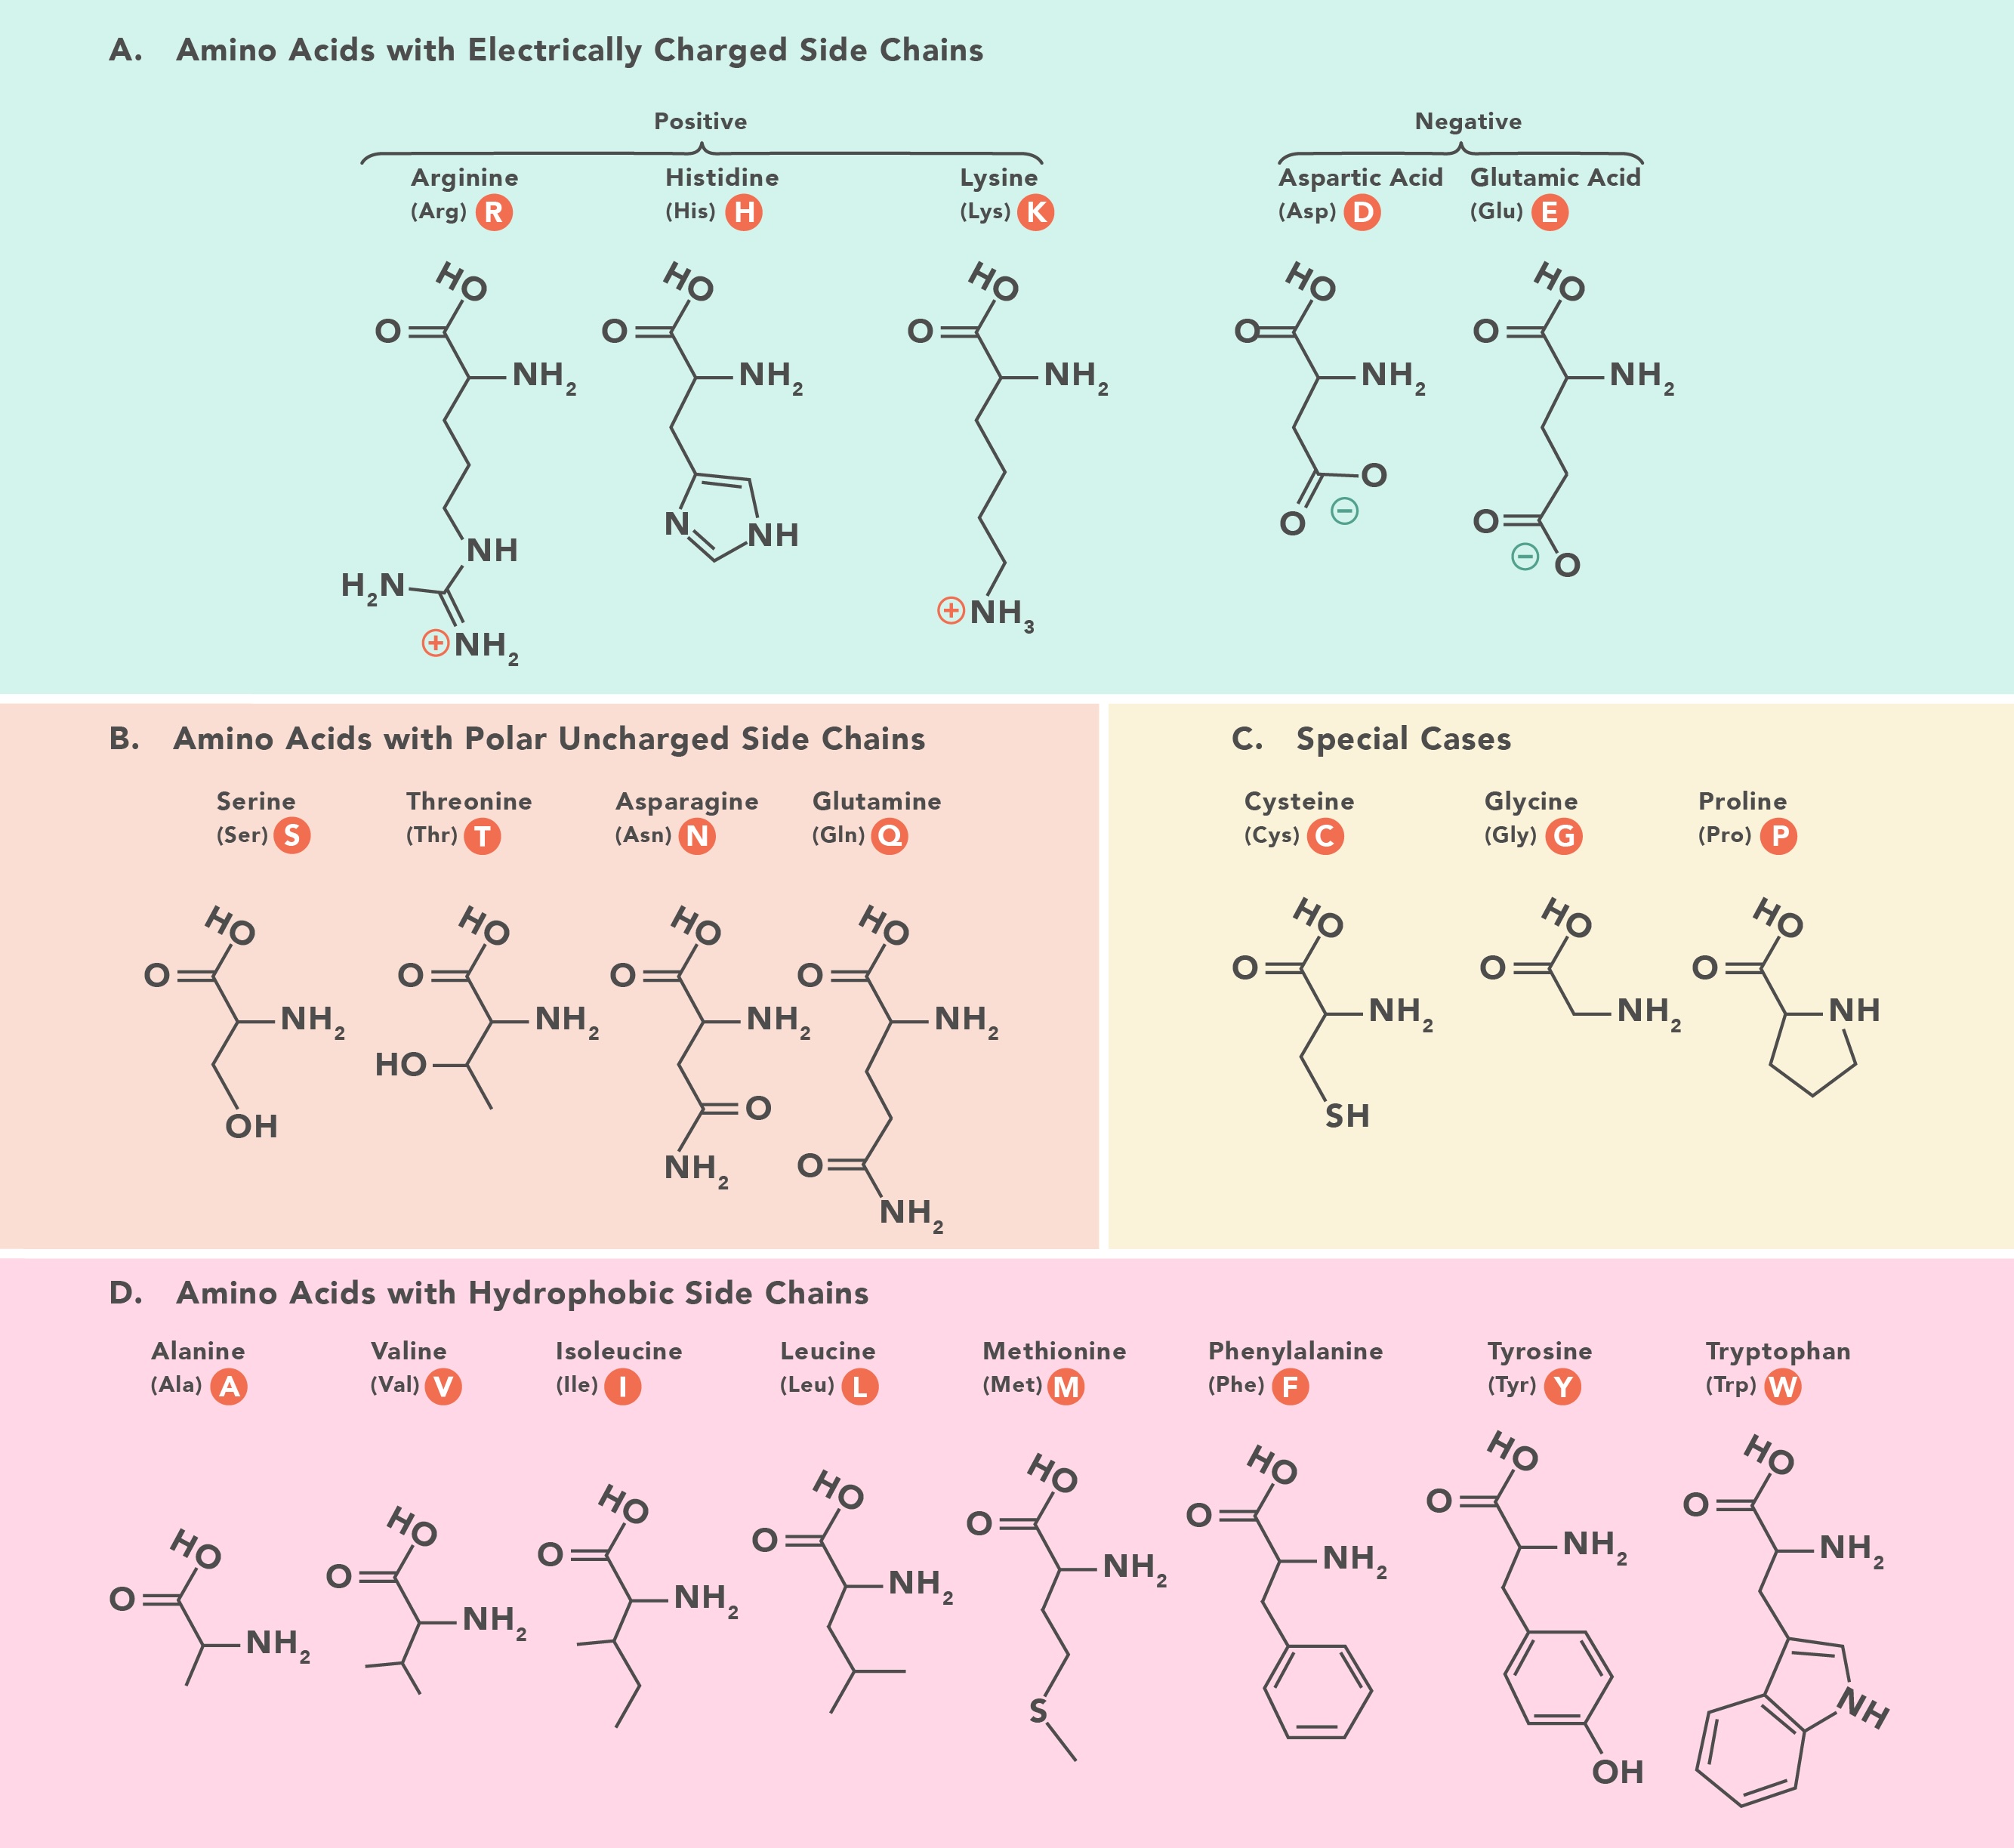
Question: Why are there only 20 natural amino acids?
While there is not one comprehensive answer to this question, it is likely a result of evolutionary efficiency and competency. The 20 naturally occurring amino acids proved to be versatile, stable, and competent enough to support the plethora of life that they compose. They have handled the environmental changes of billions of years, so there were no significant evolutionary pressures for additional amino acids to arise in the standard code.
4.4. Non-Natural Amino Acid Design
Question: Can you make other non-natural amino acids? Design some new amino acids.
Yes, it is possible to make non-natural amino acids by chemically altering the side chain or the backbone. For example, if I wanted an amino acid that I could tag and trace, I could modify the side chain with a molecule containing a recognizable chemical signature that also is a minimal hindrance to normal function.
As an example, the difference between phenylalanine and tyrosine is tyrosine’s alcohol (hydroxyl group) on the aromatic ring. A synthetic amino acid could be the tyrosine base but substituting the alcohol for a ketone, or adding a halogen that I could radiolabel and track. Another option is changing the hydroxyl group into methanol or ethanol to create a chemically viable alternative.
4.5. Prebiotic Origins
Question: Where did amino acids come from before enzymes that make them, and before life started?
Before life started, Earth was a high-energy environment, constantly bombarded with meteorites and materials containing initial organic conditions. The planet was full of ammonia, water, methane, and hydrogen in reactive states. These were subject to UV energy from the sun and lightning, creating the conditions possible for stable molecules to form given the energy needed to achieve thermodynamic and kinetic stability to form more complex building blocks.
4.6. Chirality and Handedness
Question: If you make an alpha-helix using D-amino acids, what handedness (right or left) would you expect?
I would expect it to be left-handed, which is atypical from the norm. D-amino acids are the chiral enantiomers (mirror images) of L-amino acids, which are the ones naturally occurring in nature that form typical right-handed alpha-helix twists. Therefore, the mirror image of a right-handed twist would be a left-handed twist.
4.7. Right-Handed Helices
Question: Why are most molecular helices right-handed?
Molecular helices are typically right-handed because they are the most stable configuration for L-amino acids. Right-handed helices produce favorable hydrogen bond interactions and minimize steric hindrances, resulting in a molecule with greater thermodynamic stability.
4.8. Beta-Sheet Aggregation
Question: Why do beta-sheets tend to aggregate and what is the driving force?
Beta-sheets tend to aggregate due to favorable intermolecular interactions between the planes of the sheets. The driving force for aggregation is hydrogen bonding—the strongest intermolecular force—along with increasing dispersion forces as hydrophobic molecules layer together to limit their exposure to the aqueous environment.
4.9. Amyloid Diseases and Materials
Question: Why do many amyloid diseases form beta-sheets? Can you use amyloid beta-sheets as materials?
Parkinson’s, Alzheimer’s, and other amyloid diseases arise from protein misfolding that produce highly stable amyloid fibrils that layer into beta-sheets. These structures are thermodynamically favorable due to extensive hydrogen bonding and hydrophobic interactions between amino acid residues. This forms a durable structure that stacks into long, rigid fibrils which reduce protein function and disrupt cellular processes.
However, because these beta-sheets are so stable, they could be engineered into sustainable biomaterials. Potential uses include tissue engineering scaffolds, molecular meshes for water filtration, or potentially filaments for biological circuits.
Gemini AI was consulted for formatting
Week 5 Homework: Protein Design Part II
Part 1: Generate Binders with PepMLM
The target for this study is the human SOD1 protein (UniProt P00441), specifically focusing on the A4V mutation, which is a common cause of Amyotrophic Lateral Sclerosis (ALS).
Using PepMLM-650M, four peptides of 12 amino acids were generated and compared against the known SOD1-binding peptide FLYRWLPSRRGG.
PepMLM Confidence Scores
Sequence
Description
Perplexity
FLYRWLPSRRGG
Real Binder
—
WHSPVVAVAHWE
Sim 1
10.949699
WSVGWAAIAWWX
Sim 2
16.027645
WRSYATAIALWK
Sim 3
11.729657
WRYYATGAEWKE
Sim 4
13.769973
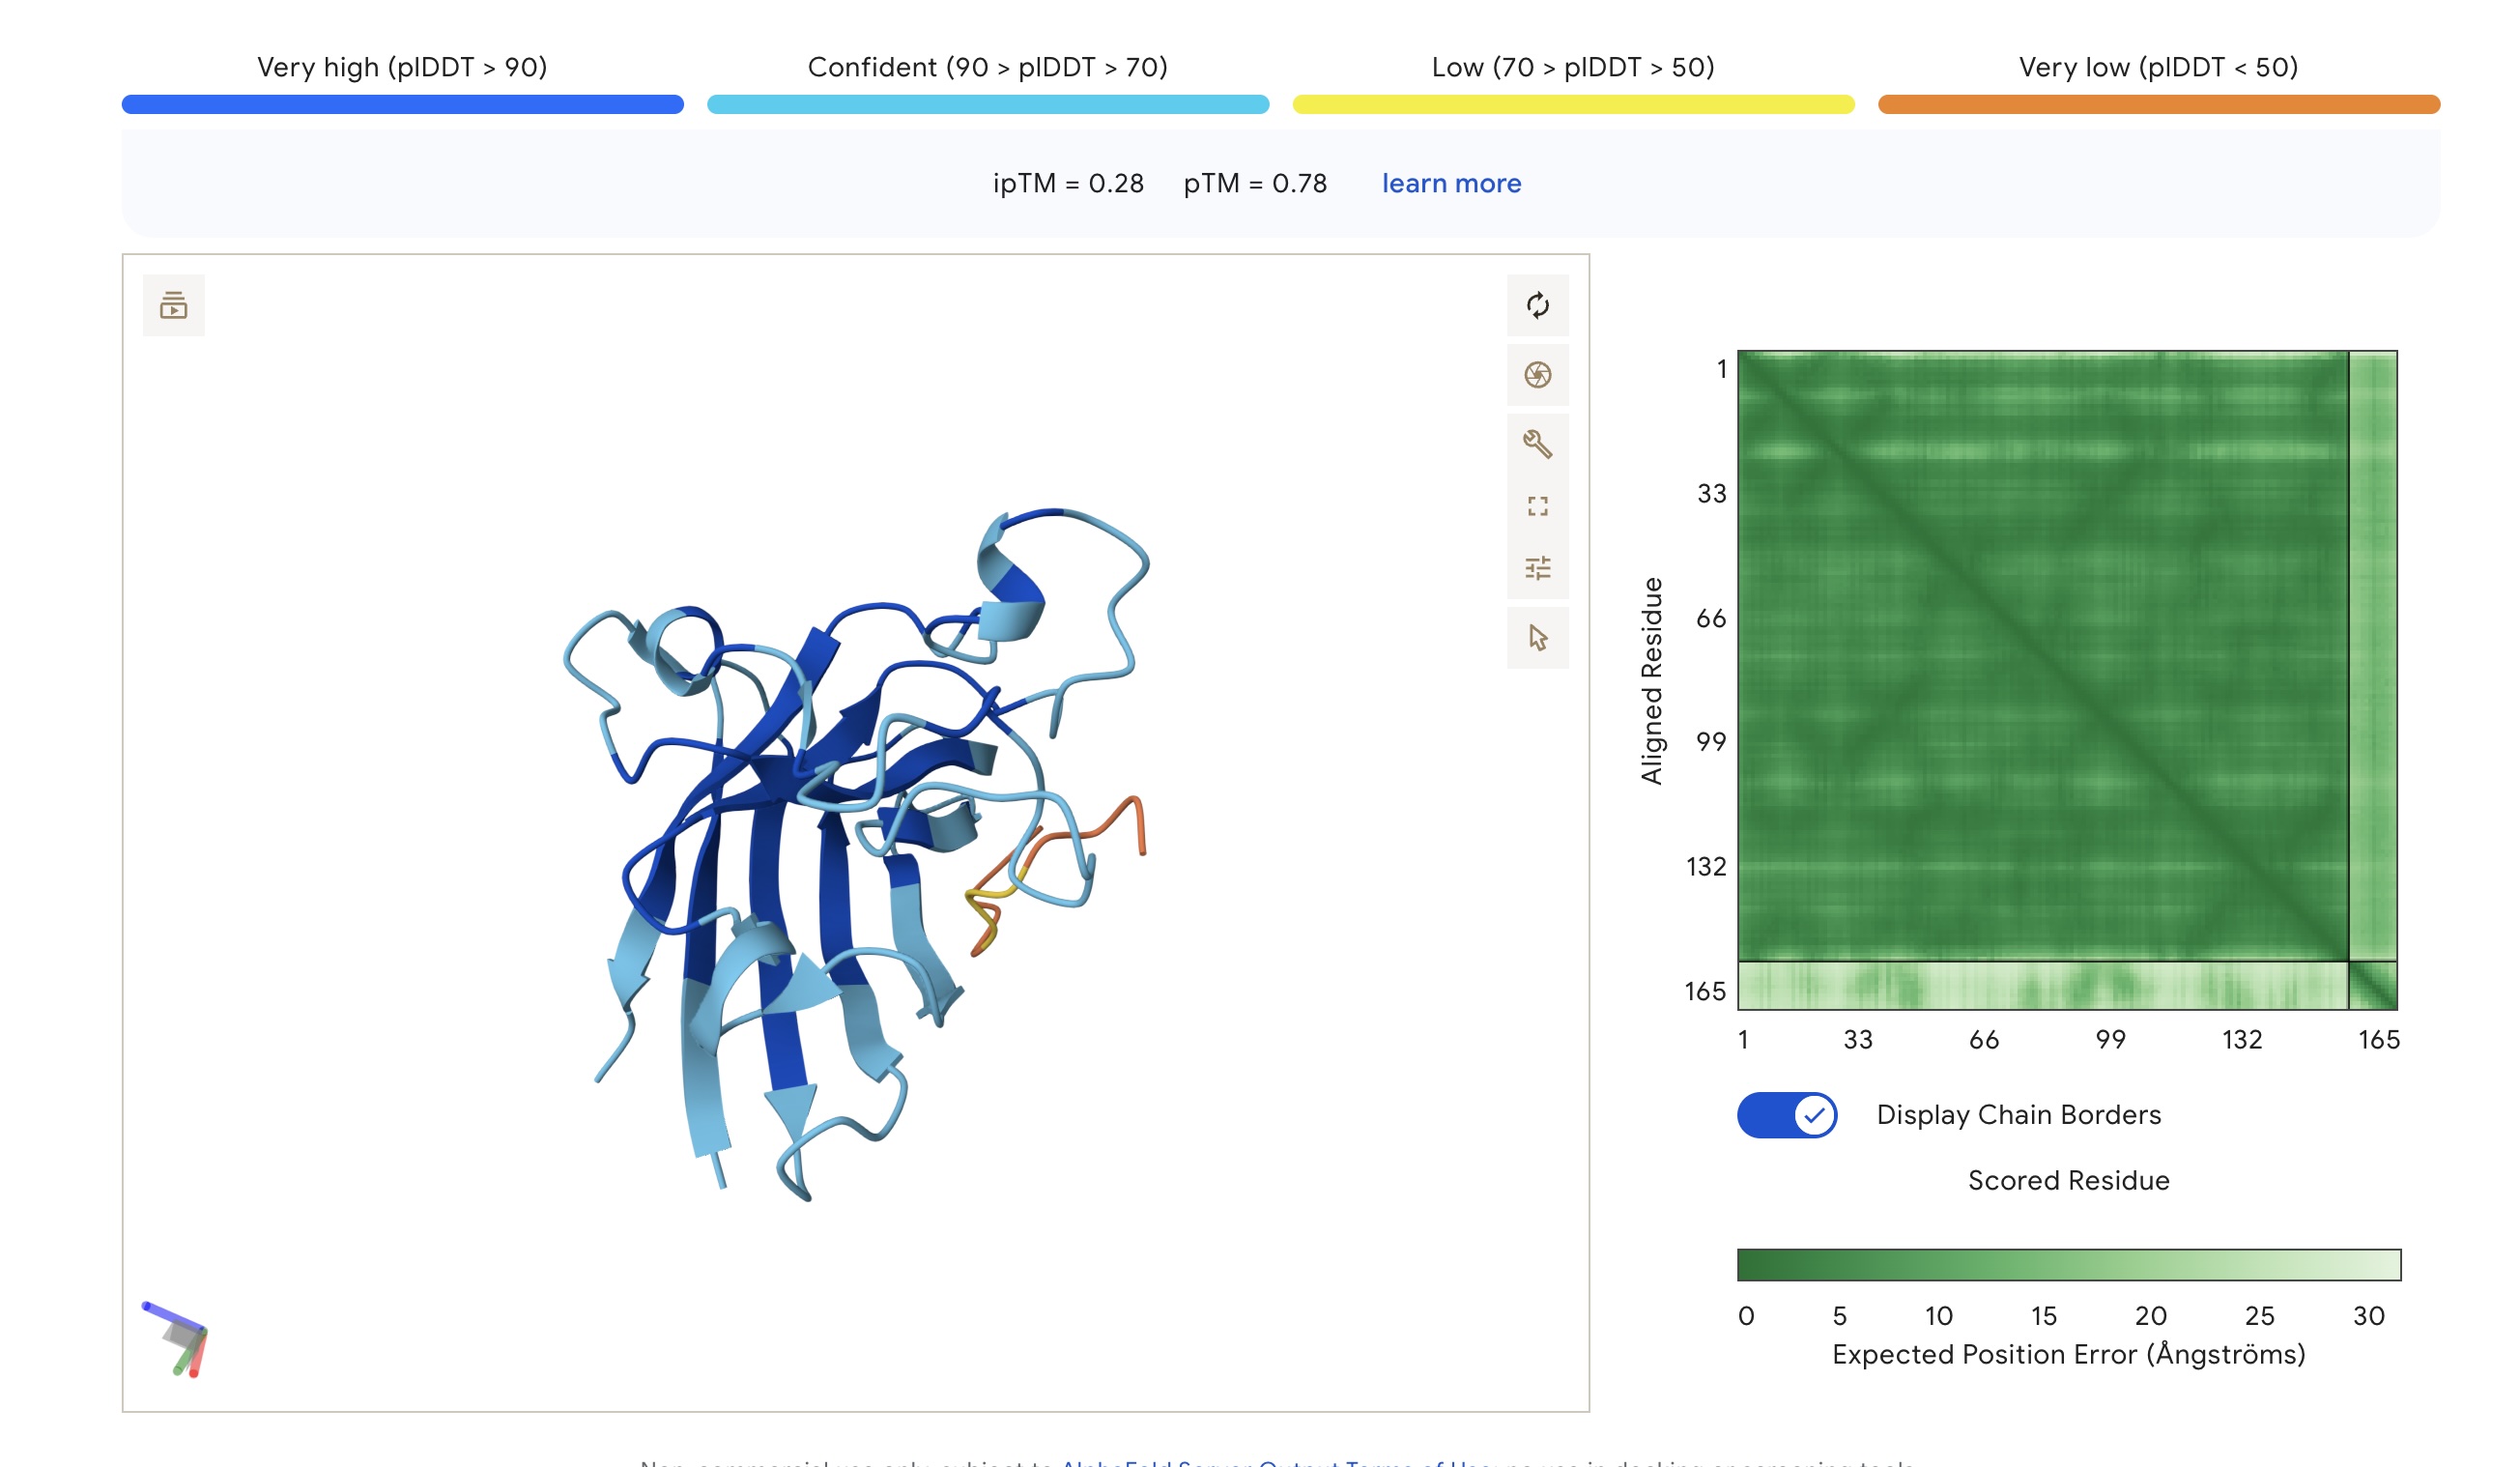
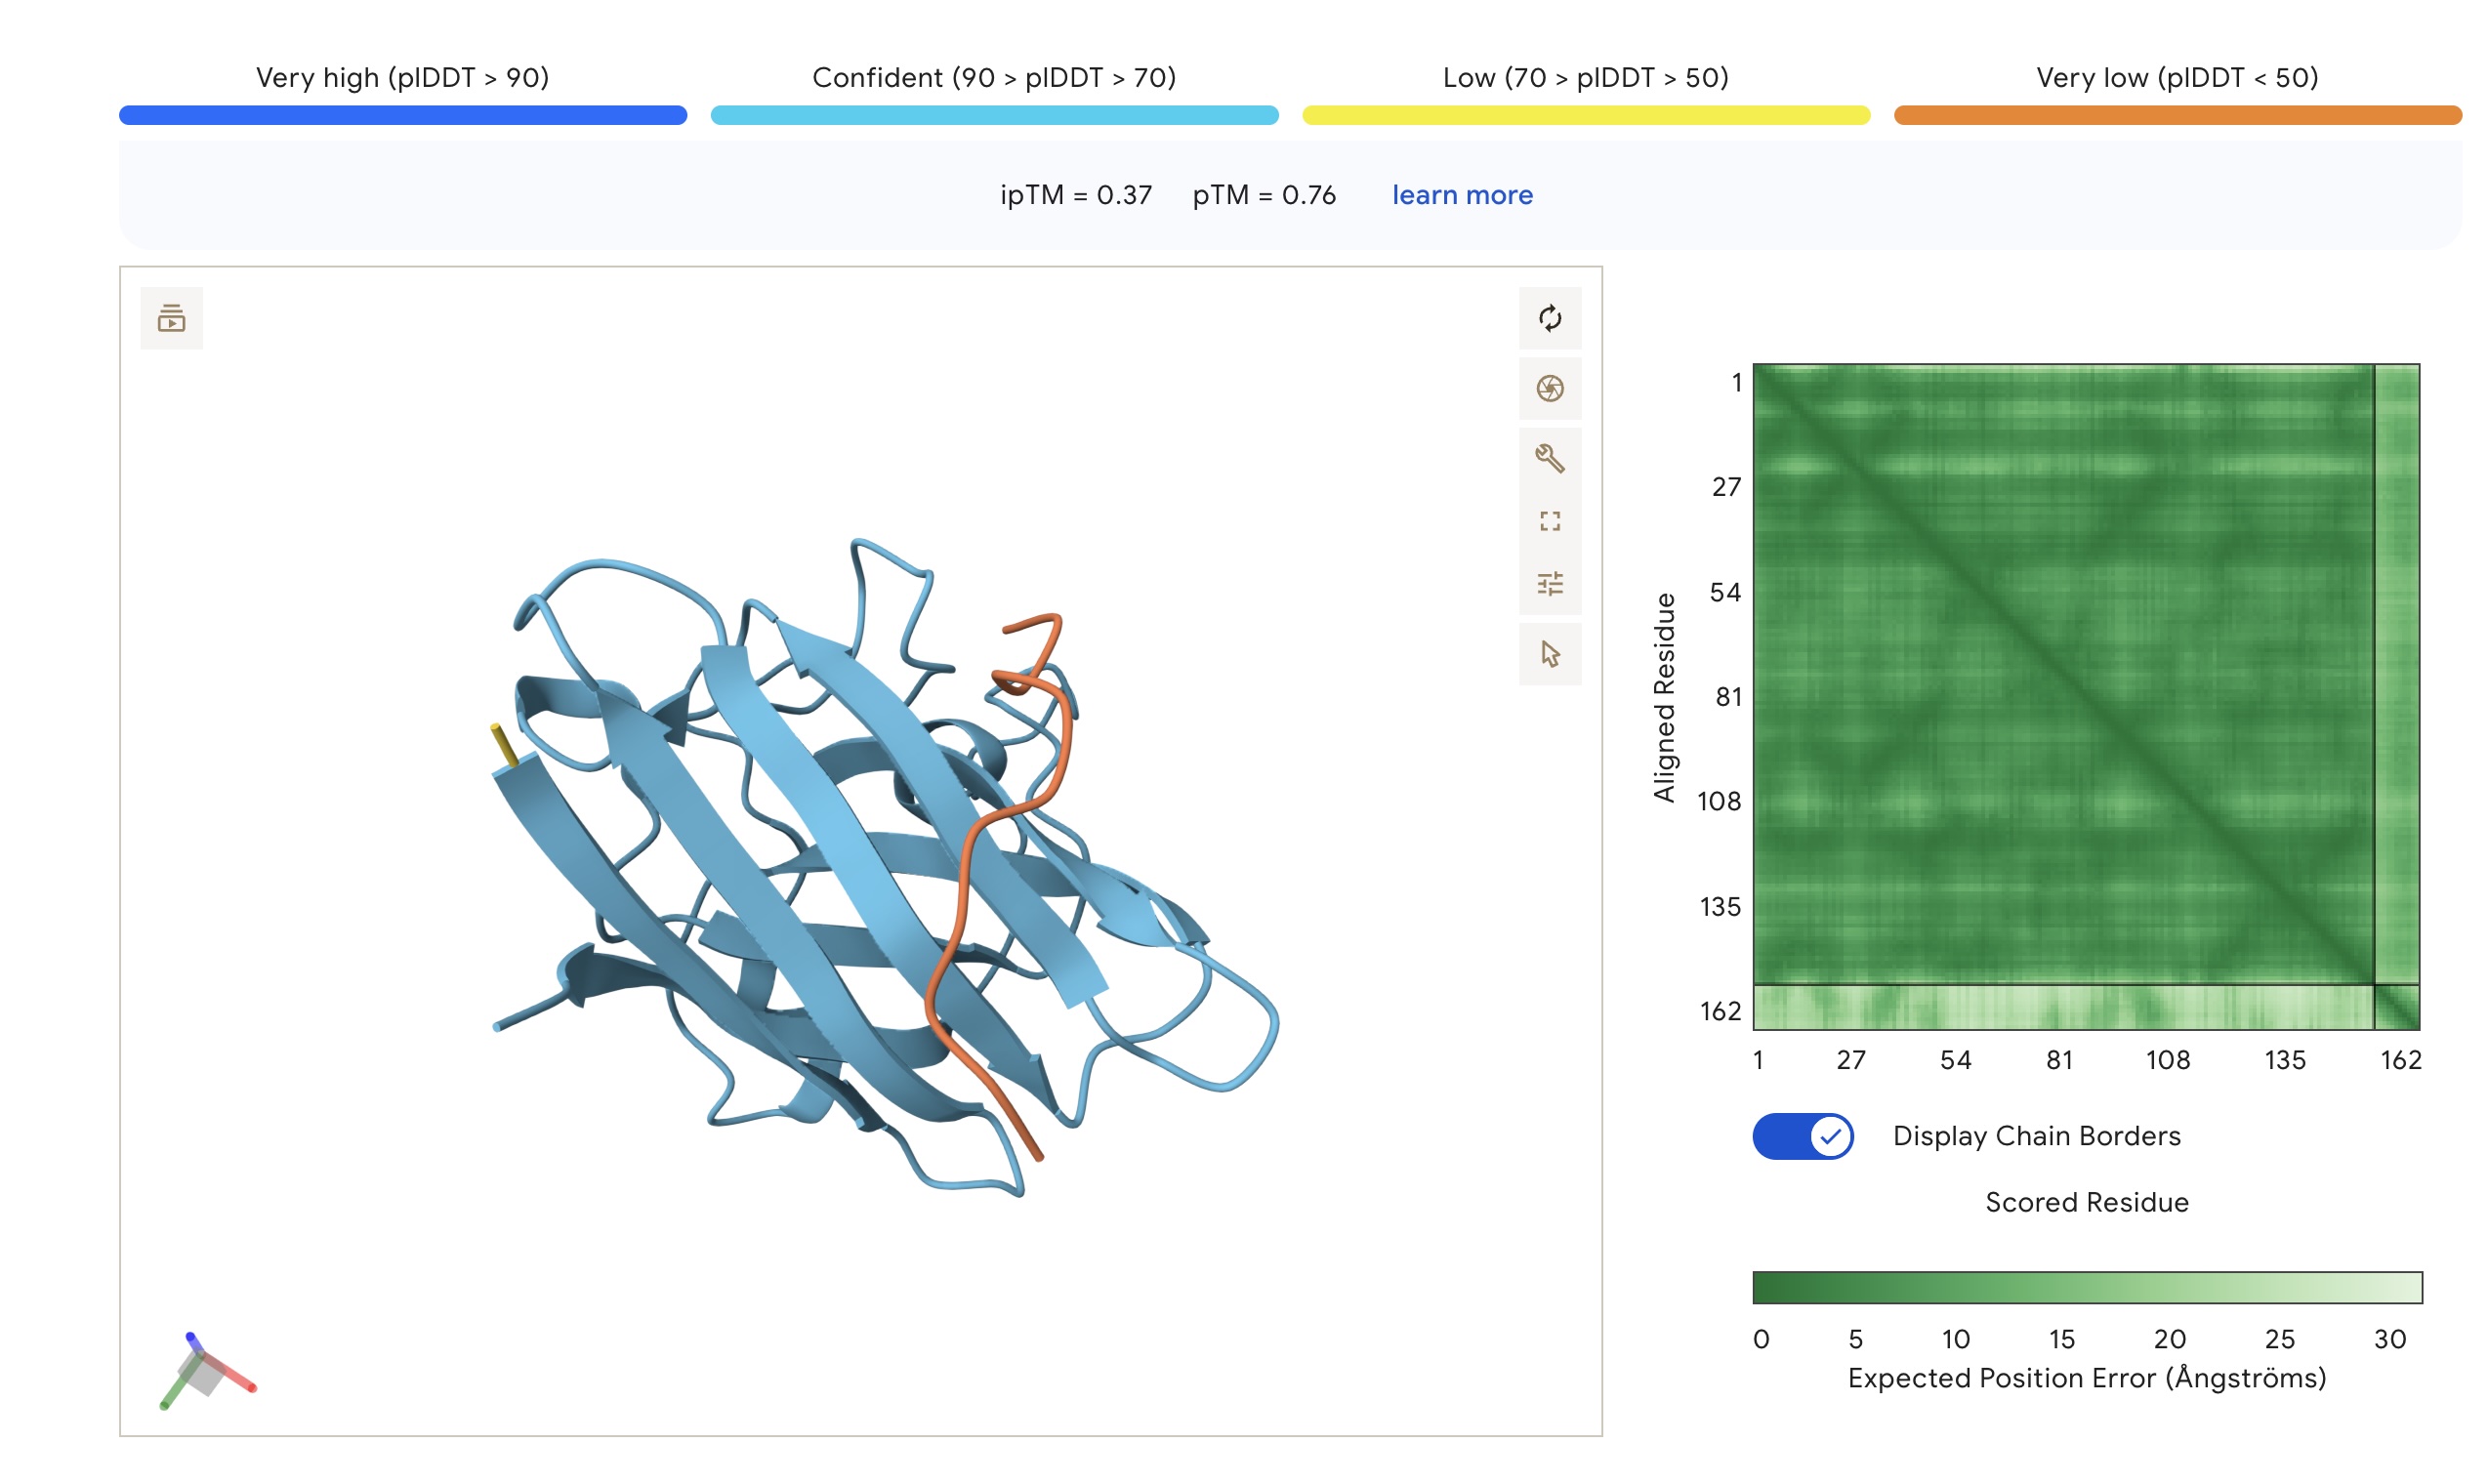
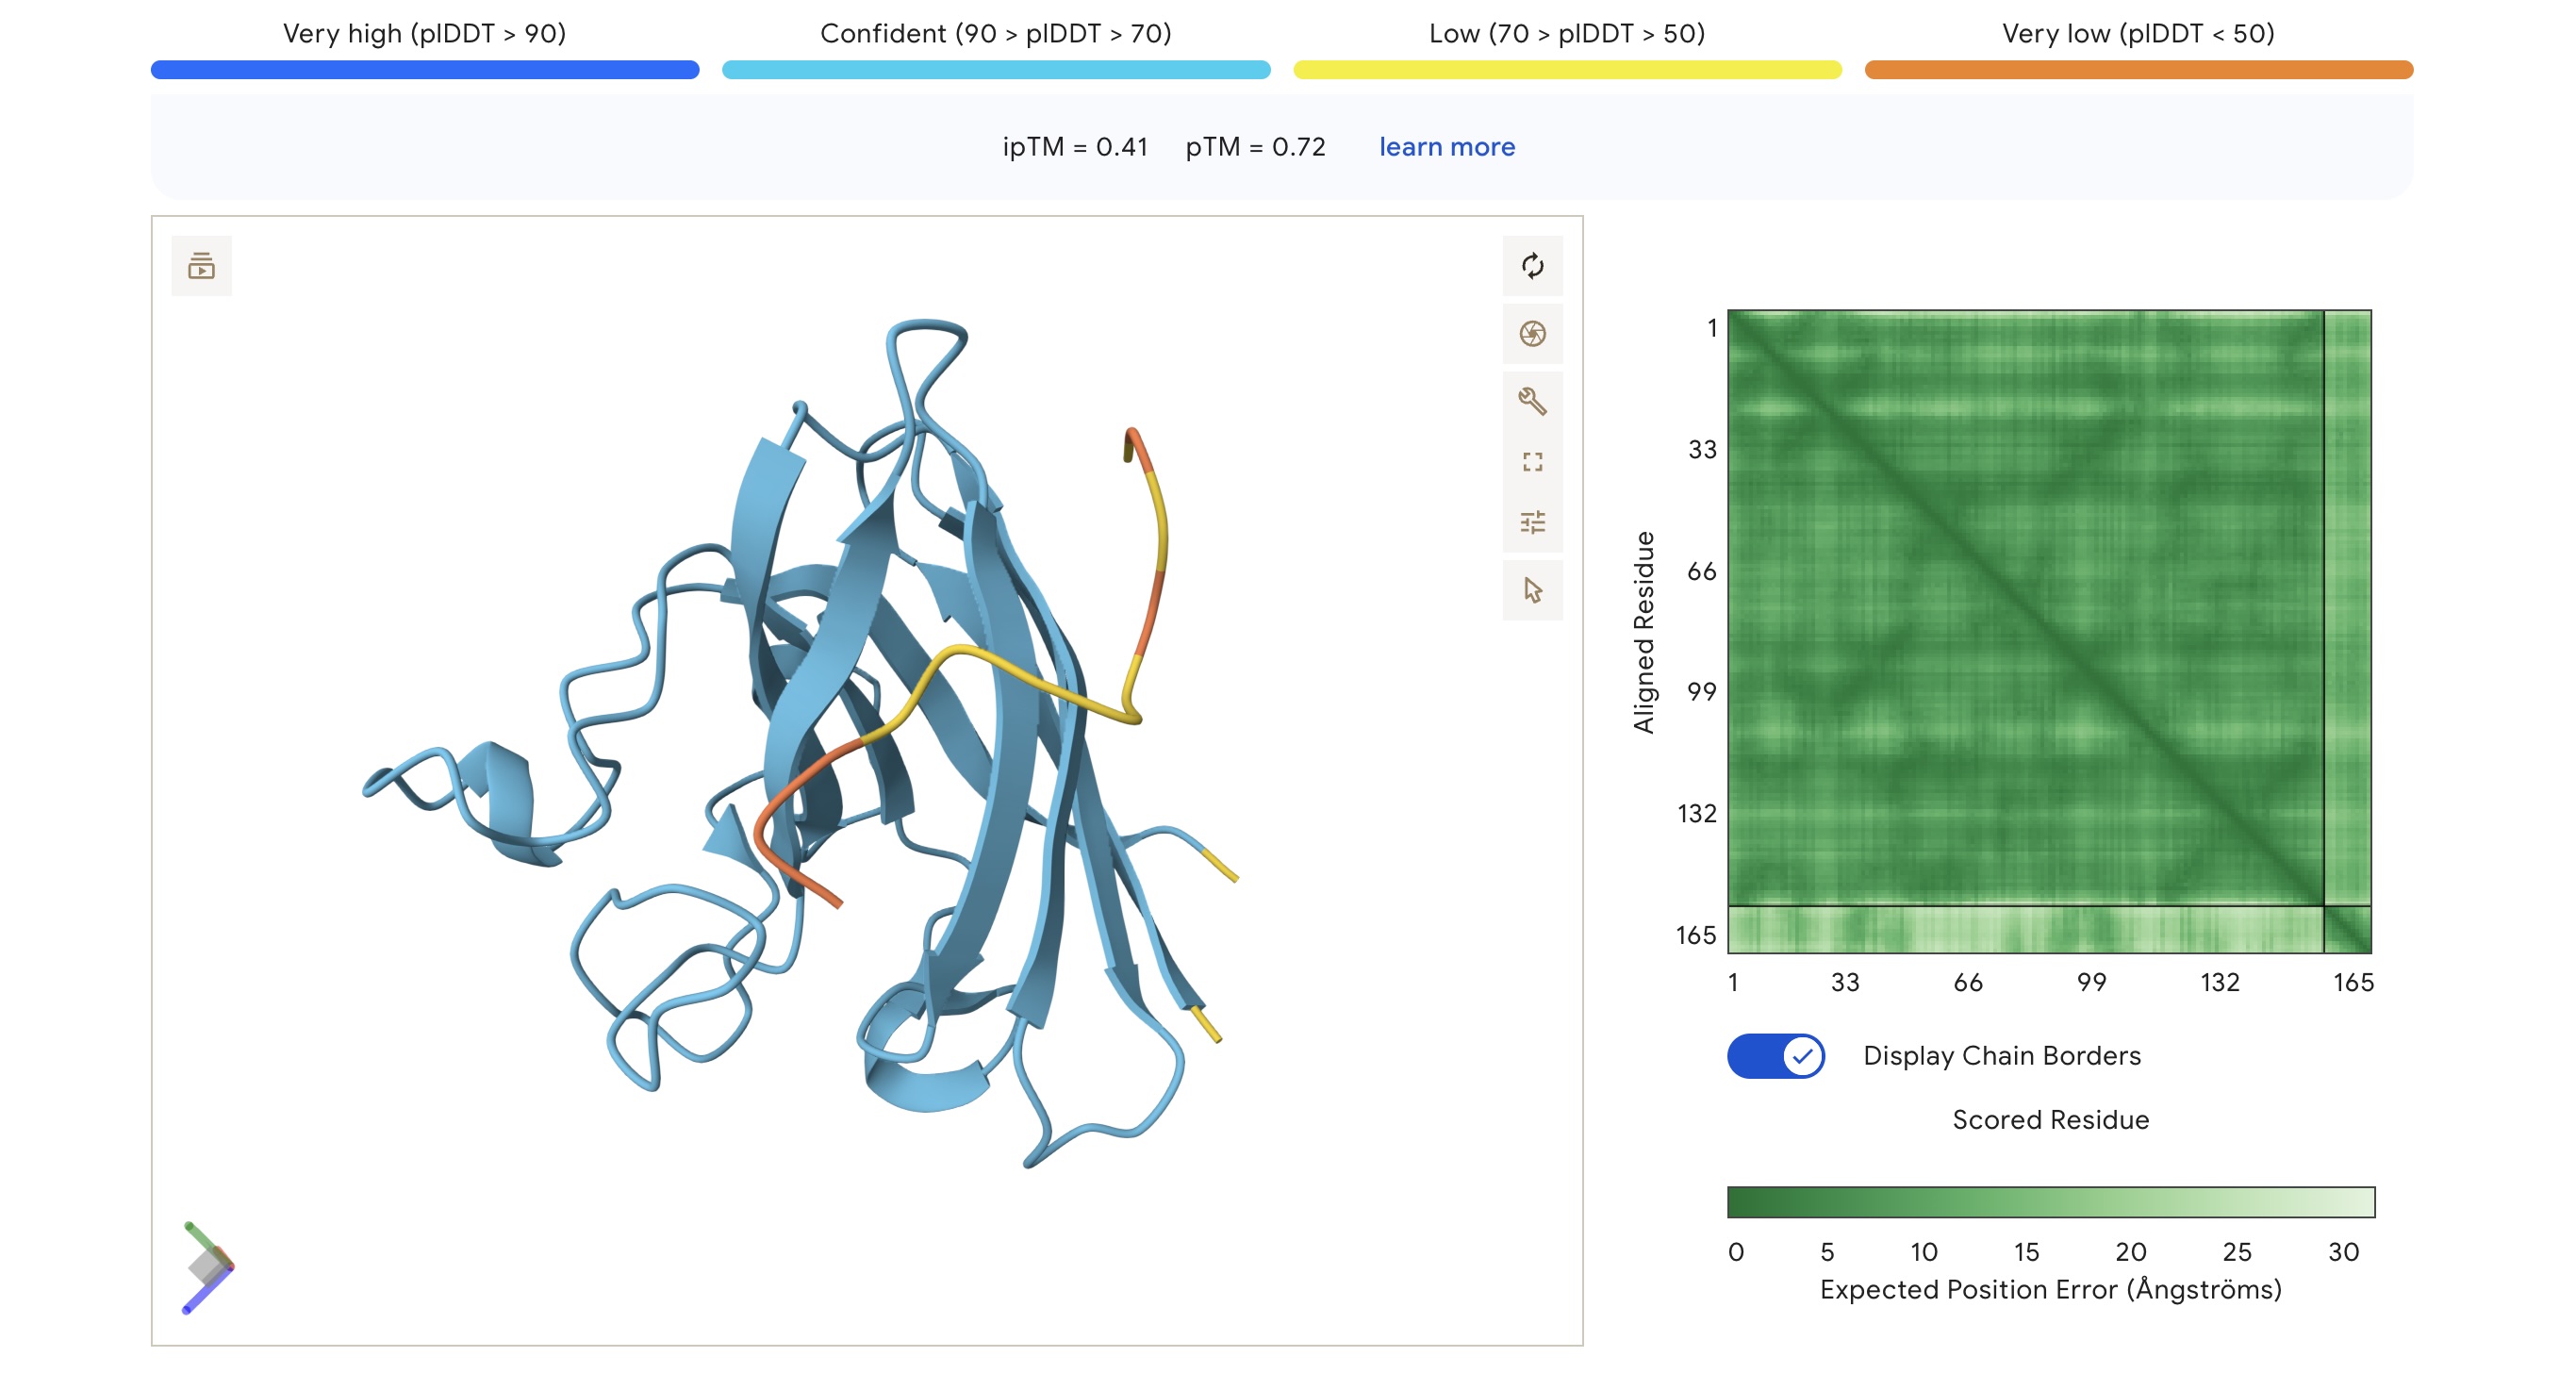
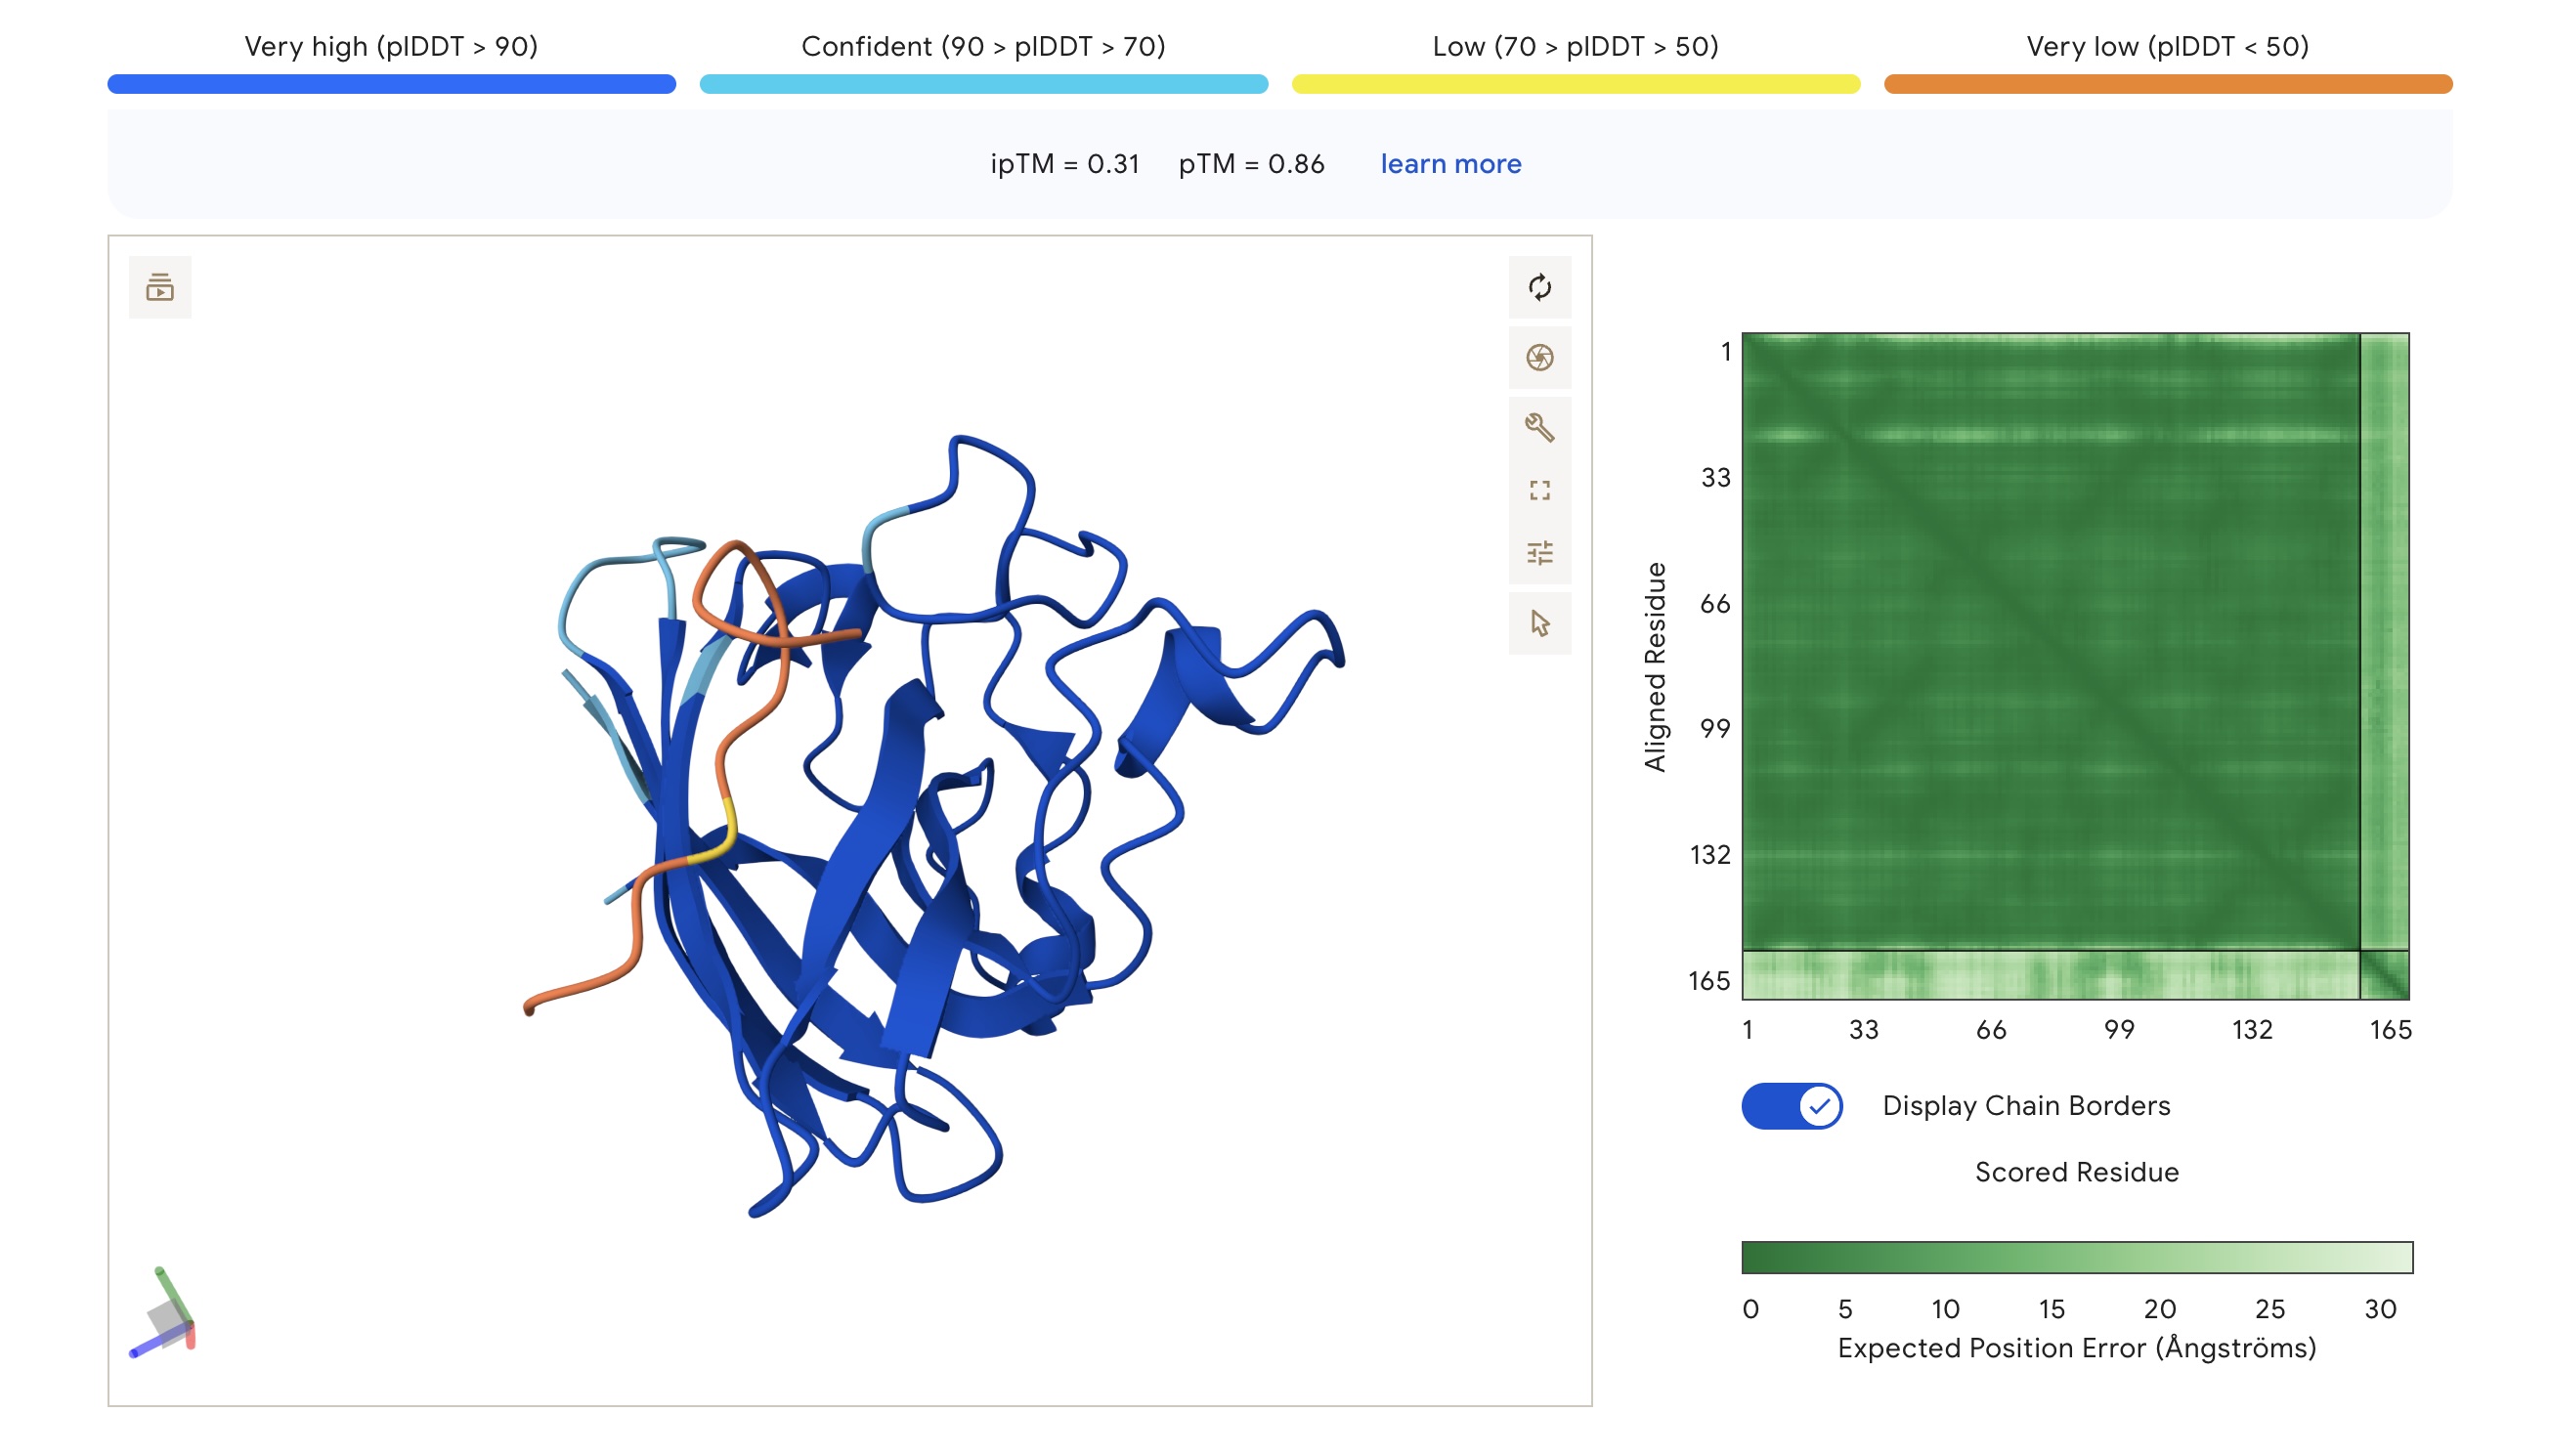
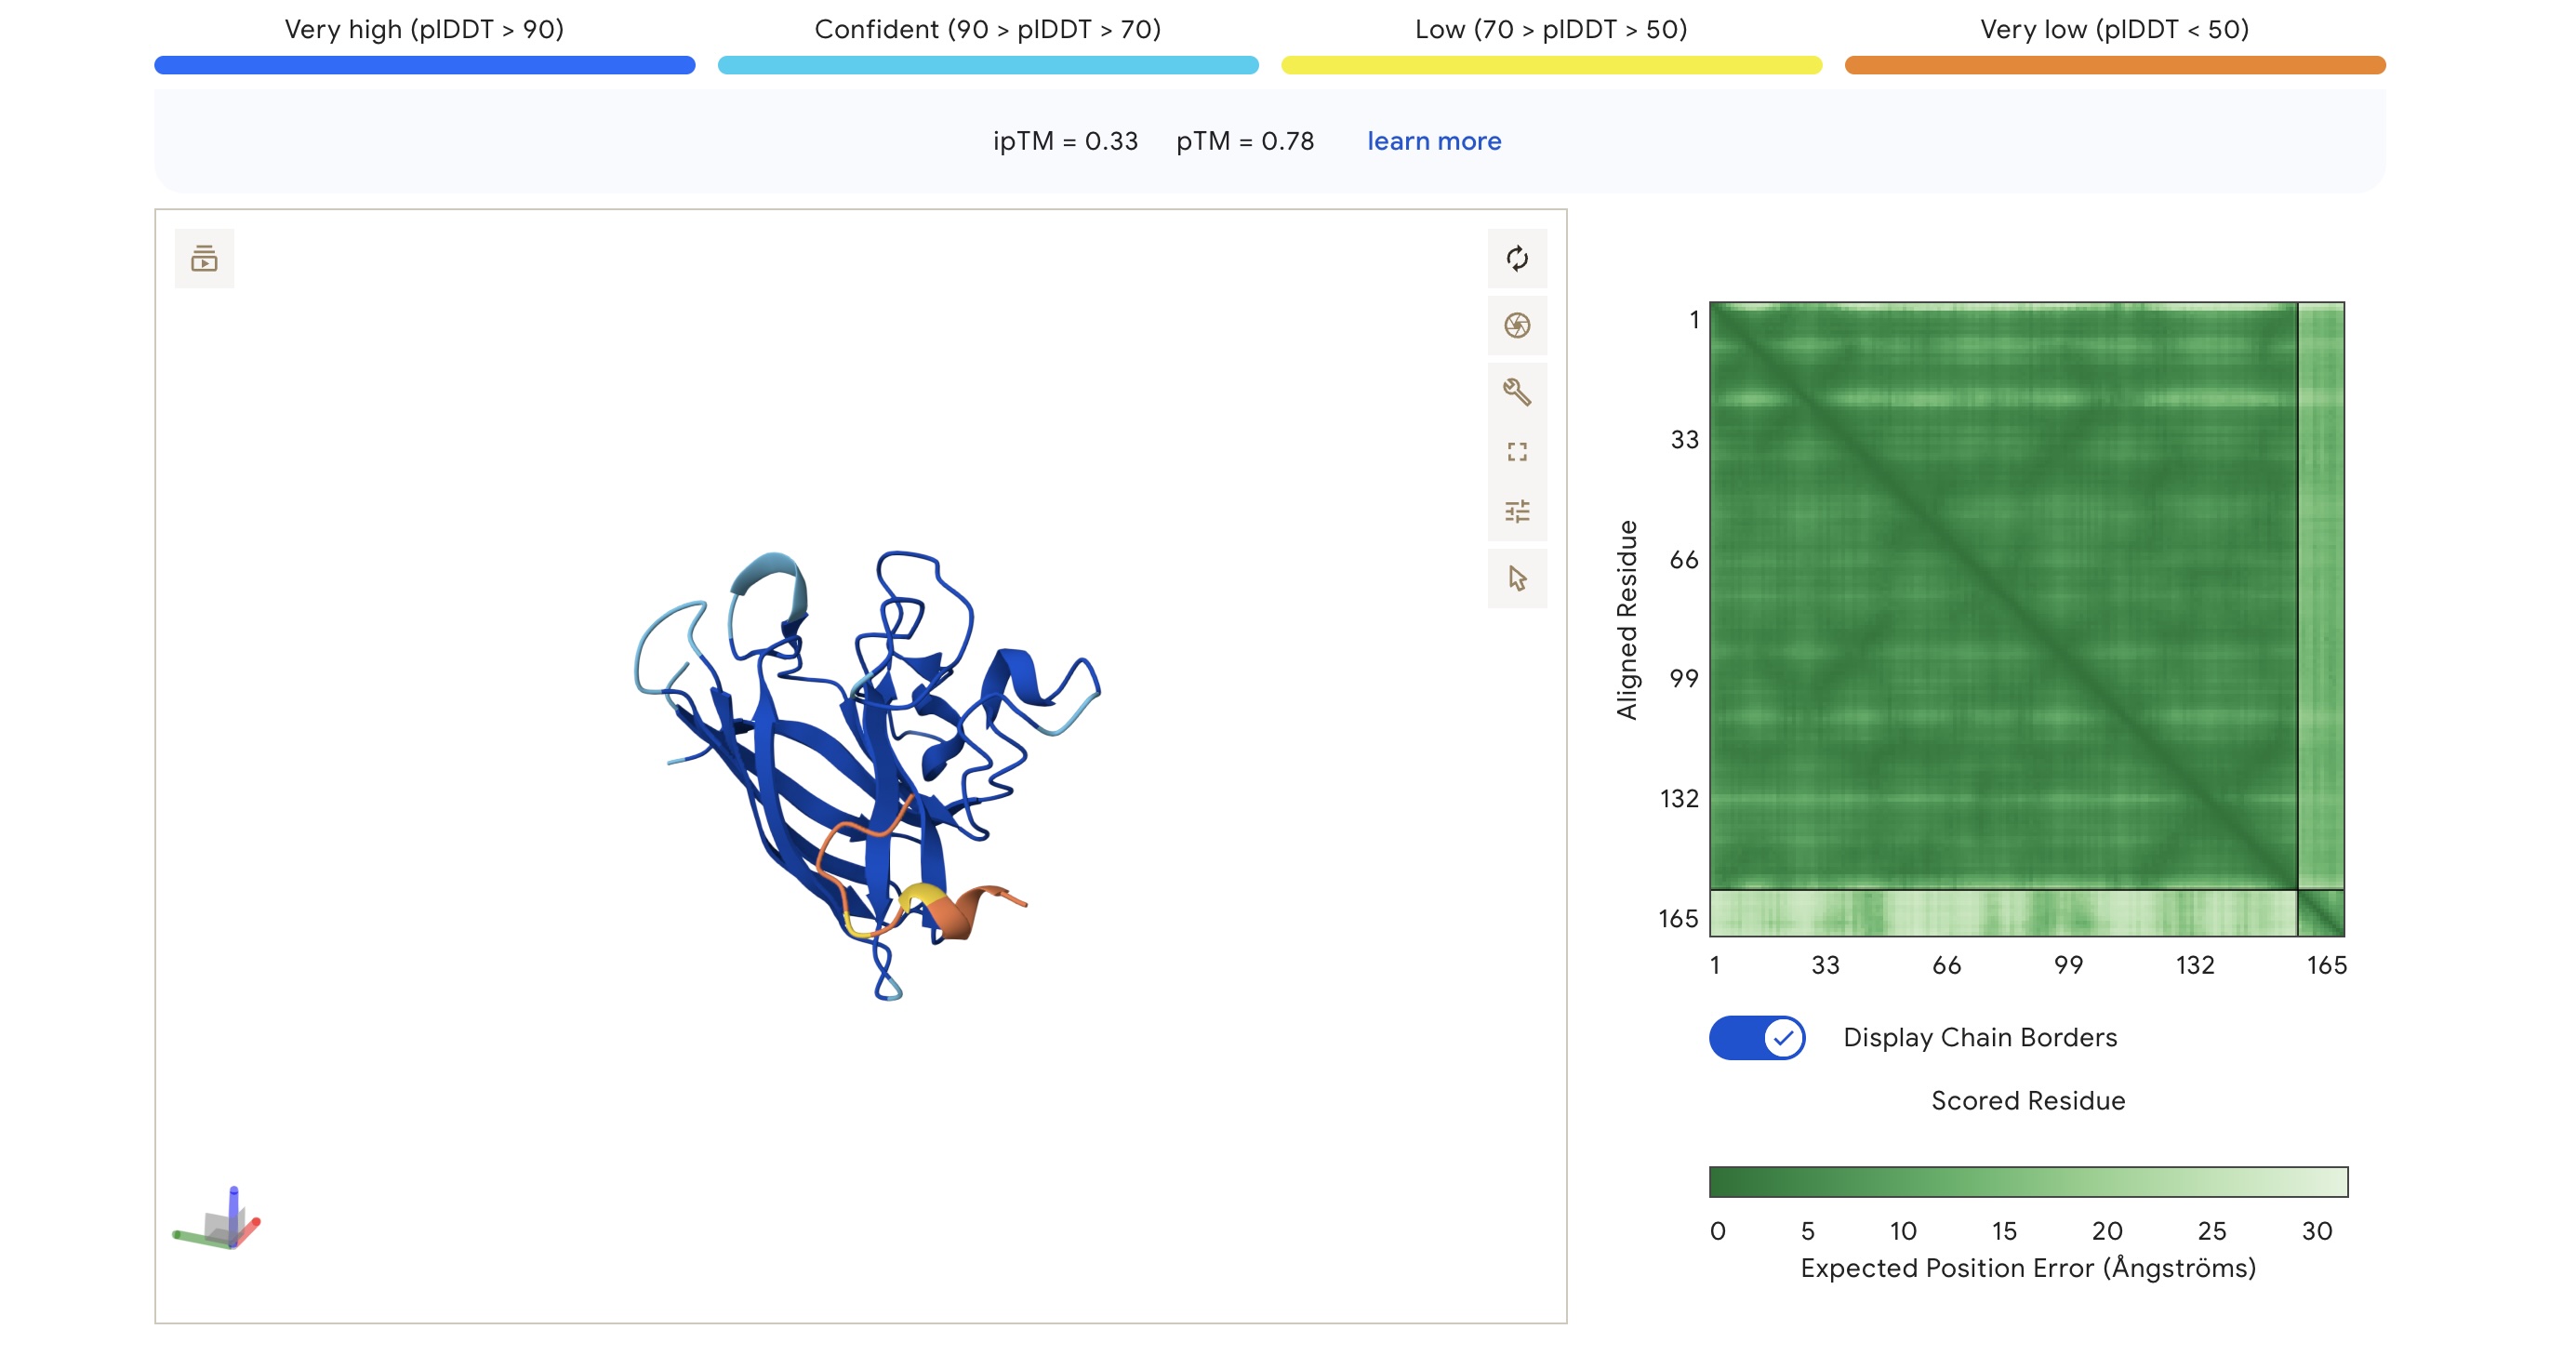
Part 2: Evaluate Binders with AlphaFold3
Each peptide was modeled against the mutant SOD1 sequence using AlphaFold3 to assess structural docking and interface confidence (ipTM).
Structural Observations
Localization: Surprisingly, none of the peptides localized specifically to the A4V mutation site at the N-terminus. All peptides were primarily surface-bound.
Binding Sites: Sim 3 (WRSYATAIALWK) and Sim 4 (WRYYATGAEWKE) both bound to a region that appears to be a potential polymerization site. Sim 2 (WSVGWAAIAWWX) engaged the β-barrel region. The wild-type binder also localized to a suspected polymerization site.
AlphaFold3 Visualizations
Part 3: Evaluate Properties in the PeptiVerse
Beyond structural docking, we evaluated the therapeutic potential (solubility, hemolysis, and affinity) of the generated sequences.
Peptide Property Comparison
Peptide Sequence
Solubility
Hemolysis
Affinity (pKd)
MW (Da)
Net Charge
pI
GRAVY
ipTM
pTM
FLYRWLPSRRGG
1.000
0.047
5.96 (Weak)
1507.7
+2.76
11.71
-0.71
0.33
0.78
WHSPVVAVAHWE
1.000
0.048
5.07 (Weak)
1417.6
-1.06
6.02
0.18
0.28
0.78
WSVGWAAIAWWX
1.000
0.174
7.71 (Med)
1314.6
-0.24
5.53
0.78
0.37
0.76
WRSYATAIALWK
1.000
0.056
6.83 (Weak)
1465.7
+1.76
9.99
0.06
0.41
0.72
WRYYATGAEWKE
1.000
0.063
5.71 (Weak)
1559.7
-0.23
6.28
-1.44
0.31
0.86
Analysis of Results
The observed ipTM values across the PepMLM-generated candidates range from 0.28 to 0.41, reflecting a low-to-moderate confidence in specific interface orientation. However, two PepMLM peptides outperformed the known binder (ipTM 0.33): WRSYATAIALWK (0.41) and WSVGWAAIAWWX (0.37).
There is a general correlation between structural confidence and affinity; the sequence with the highest affinity (WSVGWAAIAWWX, pKd: 7.71) also showed a strong ipTM. Interestingly, the highest ipTM belonged to WRSYATAIALWK, despite it having a lower predicted affinity, suggesting that AF3 finds this specific binding pose more physically convincing even if the thermodynamic prediction is weaker. Critically, all candidates maintain a 1.000 solubility probability and low hemolysis scores.
Selection Candidate: WRSYATAIALWK While WSVGWAAIAWWX has the highest raw affinity, WRSYATAIALWK offers a superior balance of properties. It provides the highest structural confidence (ipTM 0.41) while maintaining a much safer hemolysis profile (0.056) compared to the “riskiest” sequence in the group (0.174).
Part 4: Generate Optimized Peptides with moPPIt
Unlike the sampling method of PepMLM, moPPIt was used for controlled, multi-objective design to steer generation toward specific residues (dimer interface/A4V site) and optimize therapeutic properties.
moPPIt Generated Peptides
Sequence
Solubility
Hemolysis
Affinity
MW (Da)
Net Charge
pI
GRAVY
GGTTTDDTKAES
1.000
0.054
4.20
1182.1
-2.24
4.05
-1.42
ATTGYCGCTMQN
1.000
0.018
5.39
1249.4
-0.22
5.55
-0.21
DEGYKKQKGQIQ
1.000
0.041
4.75
1421.6
+0.76
8.43
-2.23
Comparison and Evaluation
The PepMLM peptides generally focus on high-confidence structural docking and balanced biophysical properties, leaning toward a safe profile while improving affinity over the baseline. In contrast, the moPPIt peptides prioritize diverse chemical spaces and targeted binding.
The moPPIt set introduces extreme charge variations, such as the highly acidic GGTTTDDTKAES (pI 4.05) and the polar-rich DEGYKKQKGQIQ, which differ significantly from the more hydrophobic PepMLM designs. To evaluate these before clinical studies, we would need to perform experimental circular dichroism (CD) to confirm peptide stability and surface plasmon resonance (SPR) to validate the targeted binding affinity at the specific A4V or dimer interface sites chosen during the moPPIt steering process.
Gemini AI was consulted for formatting and content organization
Week 7 Homework: Genetic Circuits Part II
Assignment Part 1: Intracellular Artificial Neural Networks (IANNs)
What advantages do IANNs have over traditional genetic circuits, whose input/output behaviors are Boolean functions?
Analog Processing: IANNs process continuous, multi-level inputs to produce graded, proportional responses, rather than being restricted to rigid binary (ON/OFF) states.
Complex Integration: A single IANN layer can compute complex, non-linear functions by tuning biological “weights” (like promoter strength), whereas Boolean logic requires fragile, metabolically expensive cascades of multiple gates to achieve the same complexity.
Robustness: Because they use graded signals and distributed pathways, IANNs are more resistant to biological noise and mutation, showing gradual performance decline (graceful degradation) instead of catastrophic failure.
Describe a useful application for an IANN; include a detailed description of input/output behavior, as well as any limitations an IANN might face to achieve your goal.
A potential application could be an environmental risk biosensor that measures the combined threat of multiple water pollutants (e.g., arsenic and pesticides) and outputs a color-coded, continuous risk scale.
Input/Output Behavior:
Inputs (X1, X2): Varying concentrations of two different toxins activate specific DNA promoters.
Hidden Layer: The circuit integrates these inputs to produce an intermediate endoribonuclease. Its concentration is a weighted, non-linear reflection of the combined toxin levels.
Final Output (Y): The endoribonuclease proportionally inhibits the production of a fluorescent protein. Low toxins yield high fluorescence (Safe), while high toxins completely inhibit fluorescence (Danger).
What limitations might an IANN face to achieve your goal?
Running multi-layer circuits with numerous unique DNA parts and proteins drains cellular energy, which can cause the host bacteria to grow slowly or mutate the circuit to survive. Additionally, intermediate regulators (like the endoribonuclease) must be perfectly specific. If they accidentally interfere with the host cell’s natural mRNA, the system will fail or the cell will die. Finally, precisely calibrating the “weights” of the network requires finding the exact combination of promoter strengths, ribosome binding sites, and degradation rates, which takes immense trial and error.
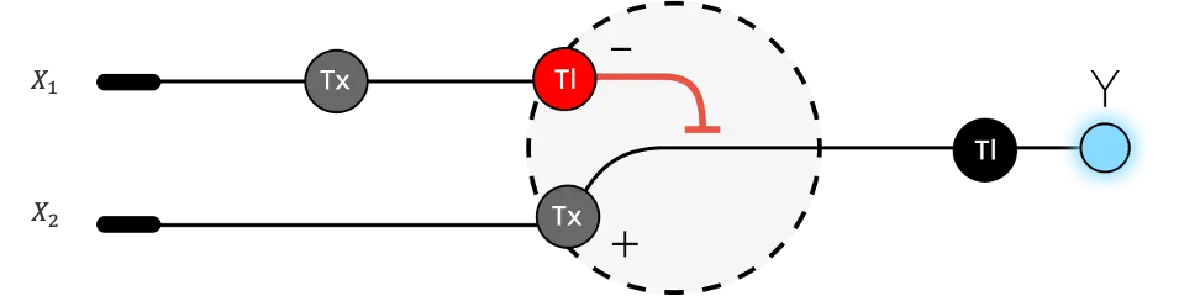
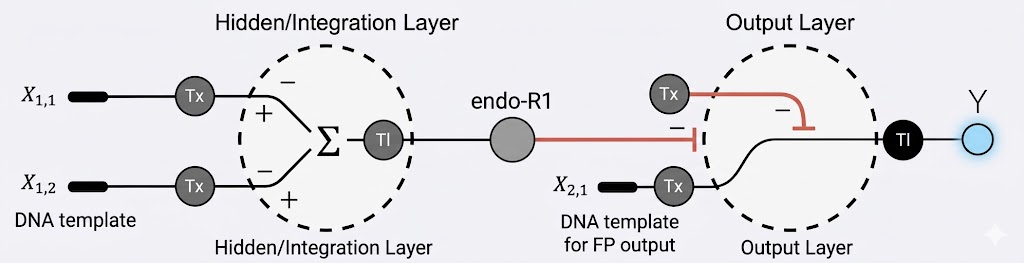
IANN Diagrams
Below is a diagram depicting an intracellular single-layer perceptron where the X1 input is DNA encoding for the Csy4 endoribonuclease and the X2 input is DNA encoding for a fluorescent protein output whose mRNA is regulated by Csy4. Tx: transcription; Tl: translation.
Below is a diagram for an intracellular multilayer perceptron where layer 1 outputs an endoribonuclease that regulates a fluorescent protein output in layer 2.
Assignment Part 2: Fungal Materials
What are some examples of existing fungal materials and what are they used for? What are their advantages and disadvantages over traditional counterparts?
The mycelium network can be bound to things like agricultural waste to create materials and items. For example, mycelium leather can be used for vegan clothing, mycelium can be used as a packaging alternative to foam, and composite structures like bricks can be used as well. They are biodegradable and clean, making them very environmentally friendly considering they also help repurpose waste. Some disadvantages stem in structural capacity and integrity, since its highly water soluble, and the compressive strength is not practical for load bearing weight.
What might you want to genetically engineer fungi to do and why? What are the advantages of doing synthetic biology in fungi as opposed to bacteria?
You could create custom biomaterials, like for example, a water resistant polymer to enhance the strength of mycelium materials. Fungi are also powerful producers and could be used for efficient synthesis of complex biologics, and can also be used to break down environmental crises like oil spills. From a synthetic biology standpoint, fungi utilize eukaryotic machinery allowing for more complex protein folding and molecular synthesis.
Gemini AI was consulted for formatting and content organization
Week 9 Homework: Cell-Free Systems
Part 1: General Homework Questions
1. Advantages of Cell-Free Synthesis
Cell-free protein synthesis (CFPS) offers an “open” architecture, allowing for direct control over the chemical environment. Unlike in vivo methods, CFPS is not limited by cell toxicity or metabolic competition.
Toxic Protein Production: CFPS can produce proteins that would otherwise kill a living host cell.
High-Throughput Screening: It allows for the rapid testing of genetic libraries without the need for time-consuming cloning and cell culture.
2. Main Components
Cell Extract: The catalytic machinery (ribosomes, polymerases).
DNA Template: The genetic instructions.
NTPs & Amino Acids: The energy and building blocks.
Energy Regeneration: Essential for recycling ATP to sustain translation.
3. Energy Provision
Energy regeneration is critical because ATP is consumed rapidly and phosphate byproducts inhibit the reaction. The Creatine Phosphate/Creatine Kinase system is often used to maintain an ATP supply by transferring phosphate groups to ADP.
4. Prokaryotic vs. Eukaryotic Systems
Prokaryotic (E. coli): Best for high-yield, simple proteins like sfGFP.
Eukaryotic (Wheat Germ): Necessary for proteins requiring post-translational modifications, such as Human Insulin.
5. Membrane Protein Optimization
Membrane proteins often aggregate in aqueous environments. To optimize expression, I would use Nanodiscs or Liposomes in the reaction setup to provide a hydrophobic scaffold for co-translational insertion.
6. Troubleshooting Low Yield
Reason: Nuclease degradation. Fix: Use RNase inhibitors.
Reason: Magnesium imbalance. Fix: Perform a Mg(2+) titration.
Reason: Inefficient folding. Fix: Add molecular chaperones like GroEL/ES.
Part 2: Synthetic Minimal Cell Design (Kate Adamala)
Function: An environmental “Lead-Trapper” cell.
Input: Heavy metal ions (Lead/Pb).
Output: Lead sequestration inside the cell and a GFP signal.
Feasibility: Encapsulation is likely needed to physically isolate the lead from the environment in addition to cell-free.
Natural cell? Possible, but a minimal cell is safer as it cannot replicate or spread in the wild.
Design:
Membrane: POPC/Cholesterol phospholipids.
Encapsulation:E. coli PURE system for protein synthesis.
Communication:alpha-Hemolysin (αHL) pores (Gene: hlyA) to allow lead ions to enter the membrane.
Gene 2:pcs (Phytochelatin synthase from S. pombe) to create lead-binding peptides.
Measurement: Fluorescence intensity from sfGFP tied to the PbrR promoter.
Part 3: Cell-Free Materials (Peter Nguyen)
Application Field: Textiles/Fashion
Pitch: A “living” athletic garment that detects dehydration in sweat and triggers a color-changing cooling response.
The Concept: The fabric is embedded with freeze-dried cell-free reactions containing synthetic gene circuits sensitive to sodium concentrations. When sweat salinity reaches a threshold, the circuit expresses a thermochromic pigment or activates an endothermic enzyme reaction. This addresses the risk of heatstroke in high-intensity athletes. To address stability, the reactions are encapsulated in trehalose-stabilized micro-beads that are only activated by the moisture in sweat.
Part 4: Mock Genes in Space Proposal (Ally Huang)
Background: Long-duration spaceflight leads to immune system dysregulation, specifically T-cell suppression. Understanding how immune-related genes, such as Interleukin-2 (IL-2), are transcribed in microgravity is vital for ensuring astronaut health on future Mars missions.
Molecular Target: Human Interleukin-2 (IL-2) promoter and gene sequence.
Target Relation: IL-2 is essential for T-cell proliferation. By using BioBits® to express IL-2 in space, we can determine if transcriptional machinery is hindered by microgravity or radiation independent of complex whole-cell physiology.
Goal: To determine if microgravity affects the yield of immune-related proteins.
Hypothesis: Transcriptional yield in space will be 20% lower than Earth controls due to altered molecular diffusion kinetics.
Reasoning: Microgravity alters fluid dynamics, potentially slowing the interaction between RNA polymerase and DNA templates.
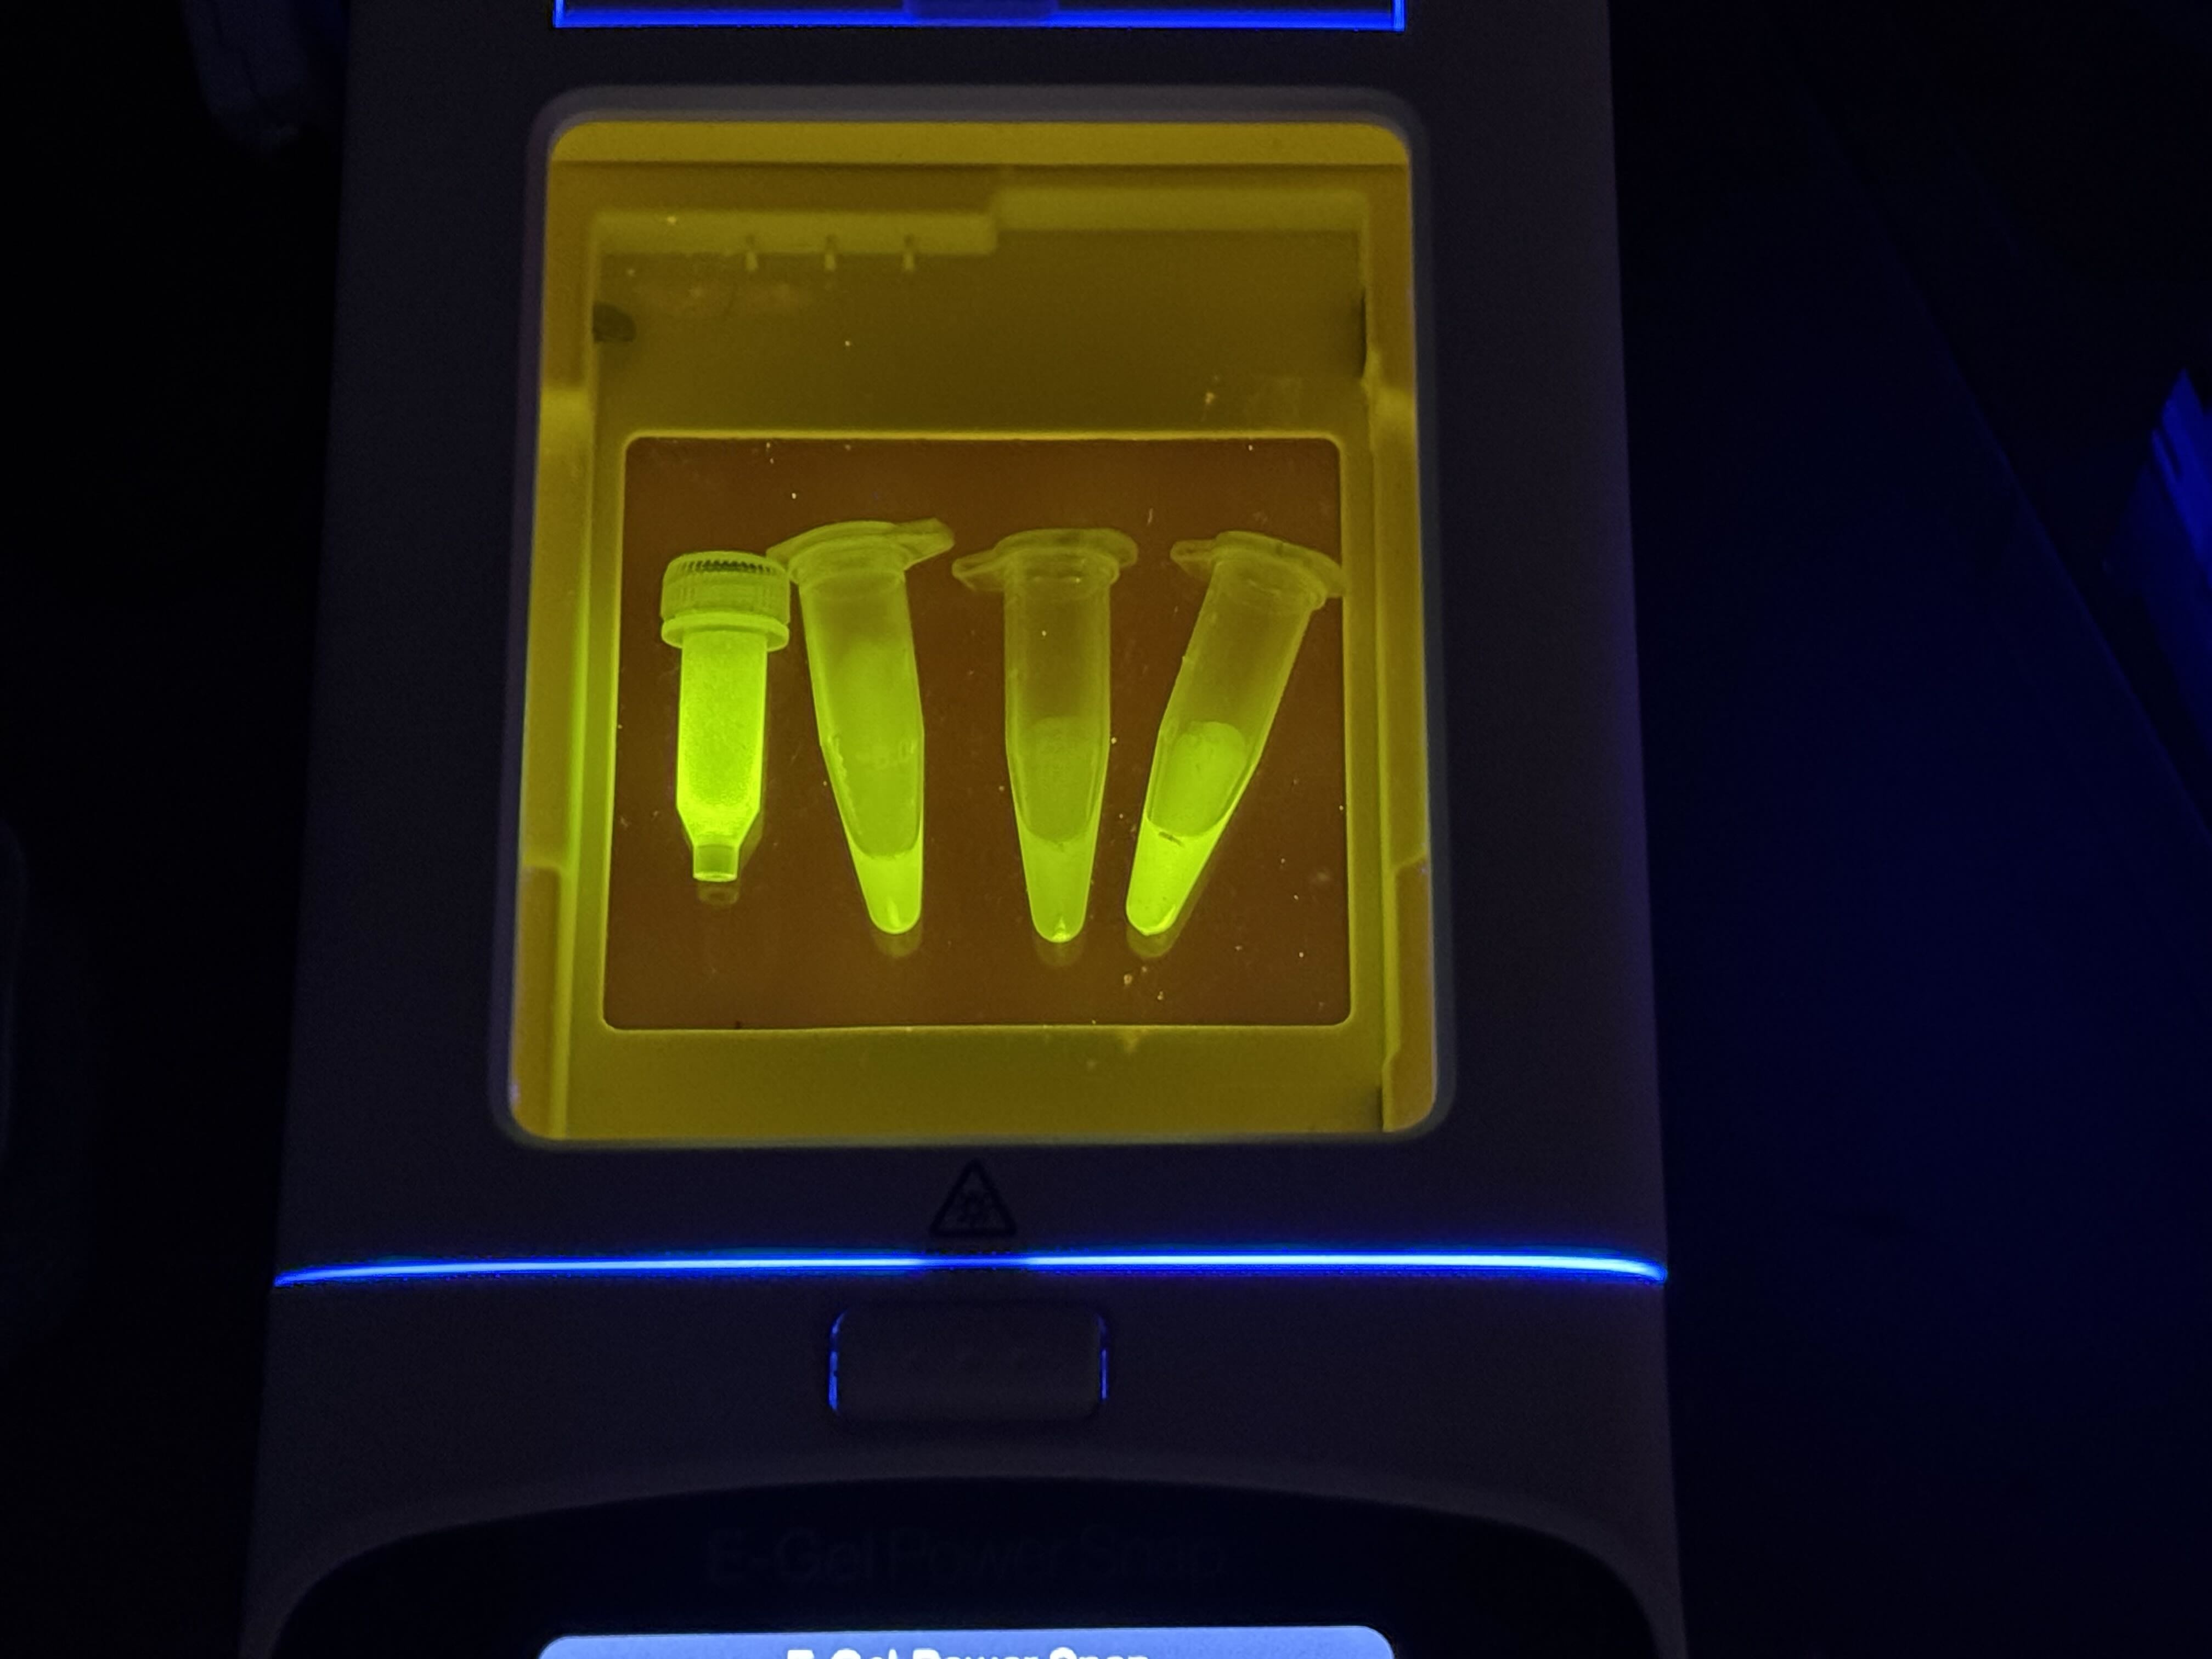
Experimental Plan: Samples consist of freeze-dried BioBits® pellets containing IL-2 DNA. On the ISS, samples are rehydrated and placed in the P51 Molecular Fluorescence Viewer. A matching control experiment is run on Earth. Data is collected via fluorescence photography to measure protein production rates.
Gemini AI was consulted for formatting and content organization
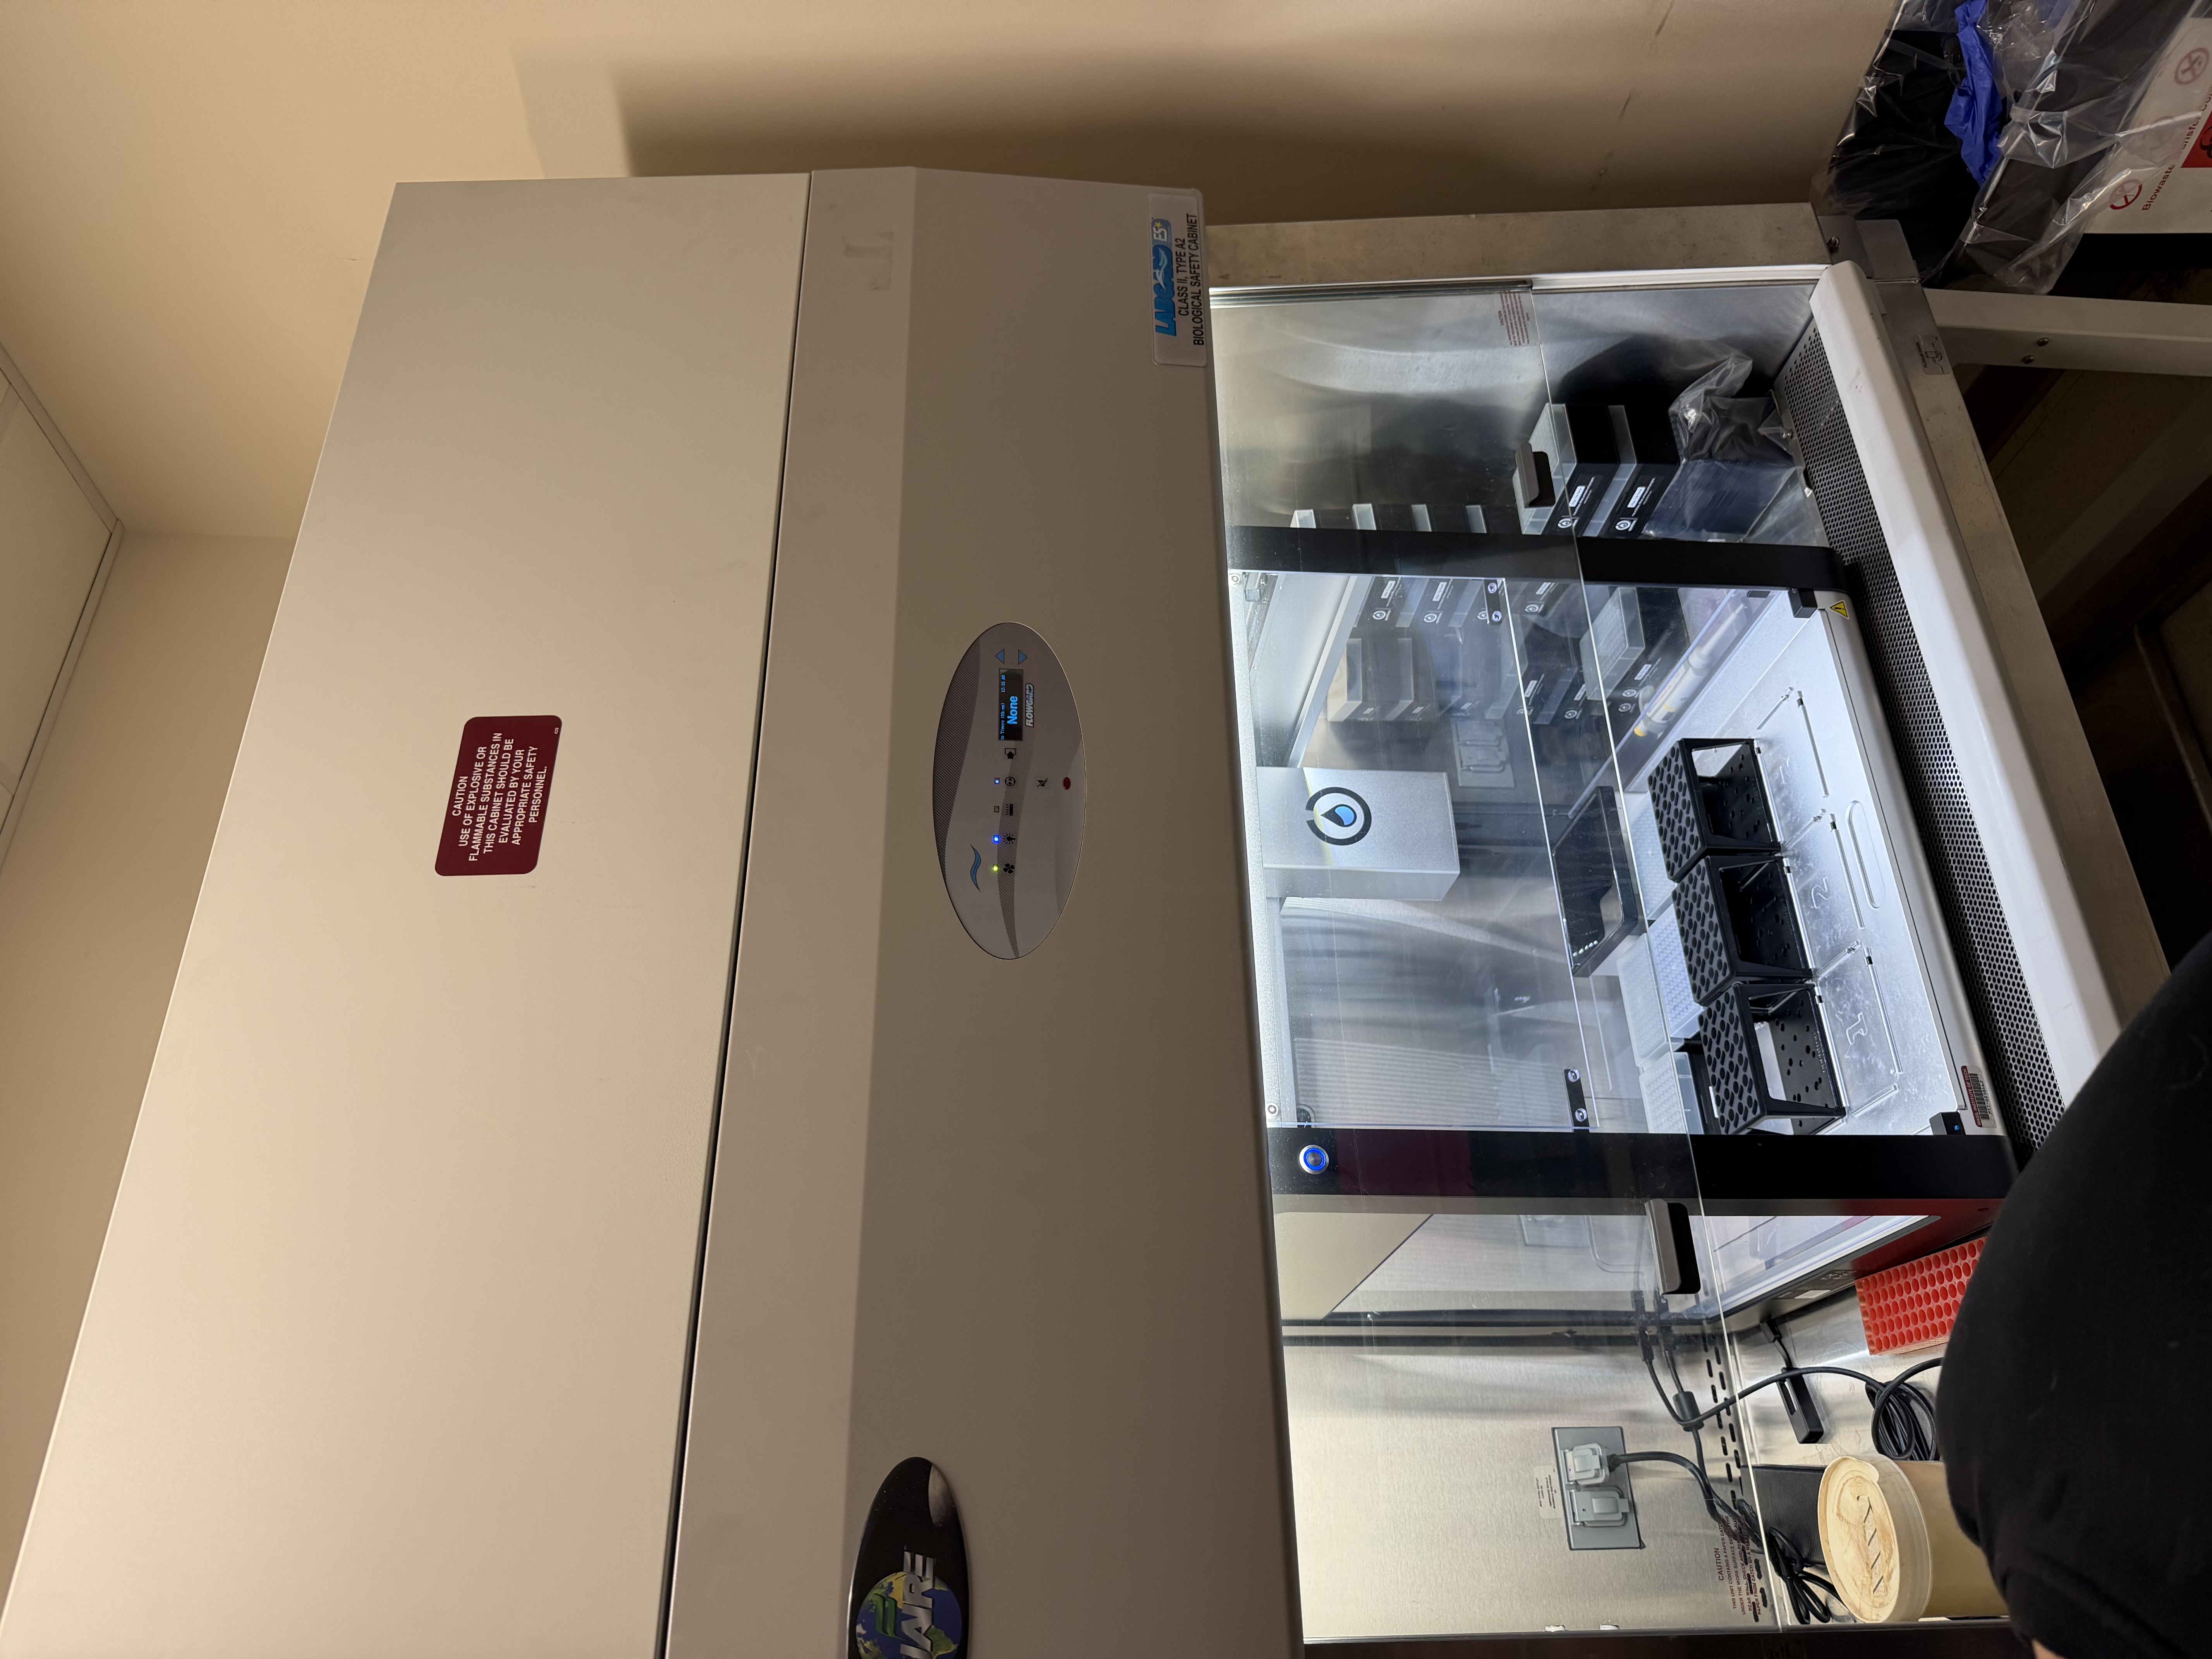
Week 10 Homework: Imaging and Measurement
Homework: Final Project Integration
Please identify at least one (ideally many) aspect(s) of your project that you will measure. It could be the mass or sequence of a protein, the presence, absence, or quantity of a biomarker, etc.
I will be measuring a couple of aspects to assay my experiments. For example, i will be using a spectrophotometer to quantify NADH exchange to validate that the malate products are being formed. I will be looking at turbidity and optical density to evaluate calcium chloride precipitate quantity and formation rate to analyze the efficacy of carbonic anhydrase. Additionally, I ordered some inorganic carbon sats made with heavy carbon, which I plan to compare to a standard to showcase additional evidence of reaction success and product formation.
Please describe all of the elements you would like to measure, and furthermore describe how you will perform these measurements.
I will be using a spectrophotometer to look at the optical density as well as absorbance. I will be measuring time and rates with a stopwatch and serial data collection. I will measure DNA and validate product with gels and concentration of protein. Maybe I could also utilize a mass spectrometer to compare my heavy carbon products to normal products.
What are the technologies you will use (e.g., gel electrophoresis, DNA sequencing, mass spectrometry, etc.)? Describe in detail.
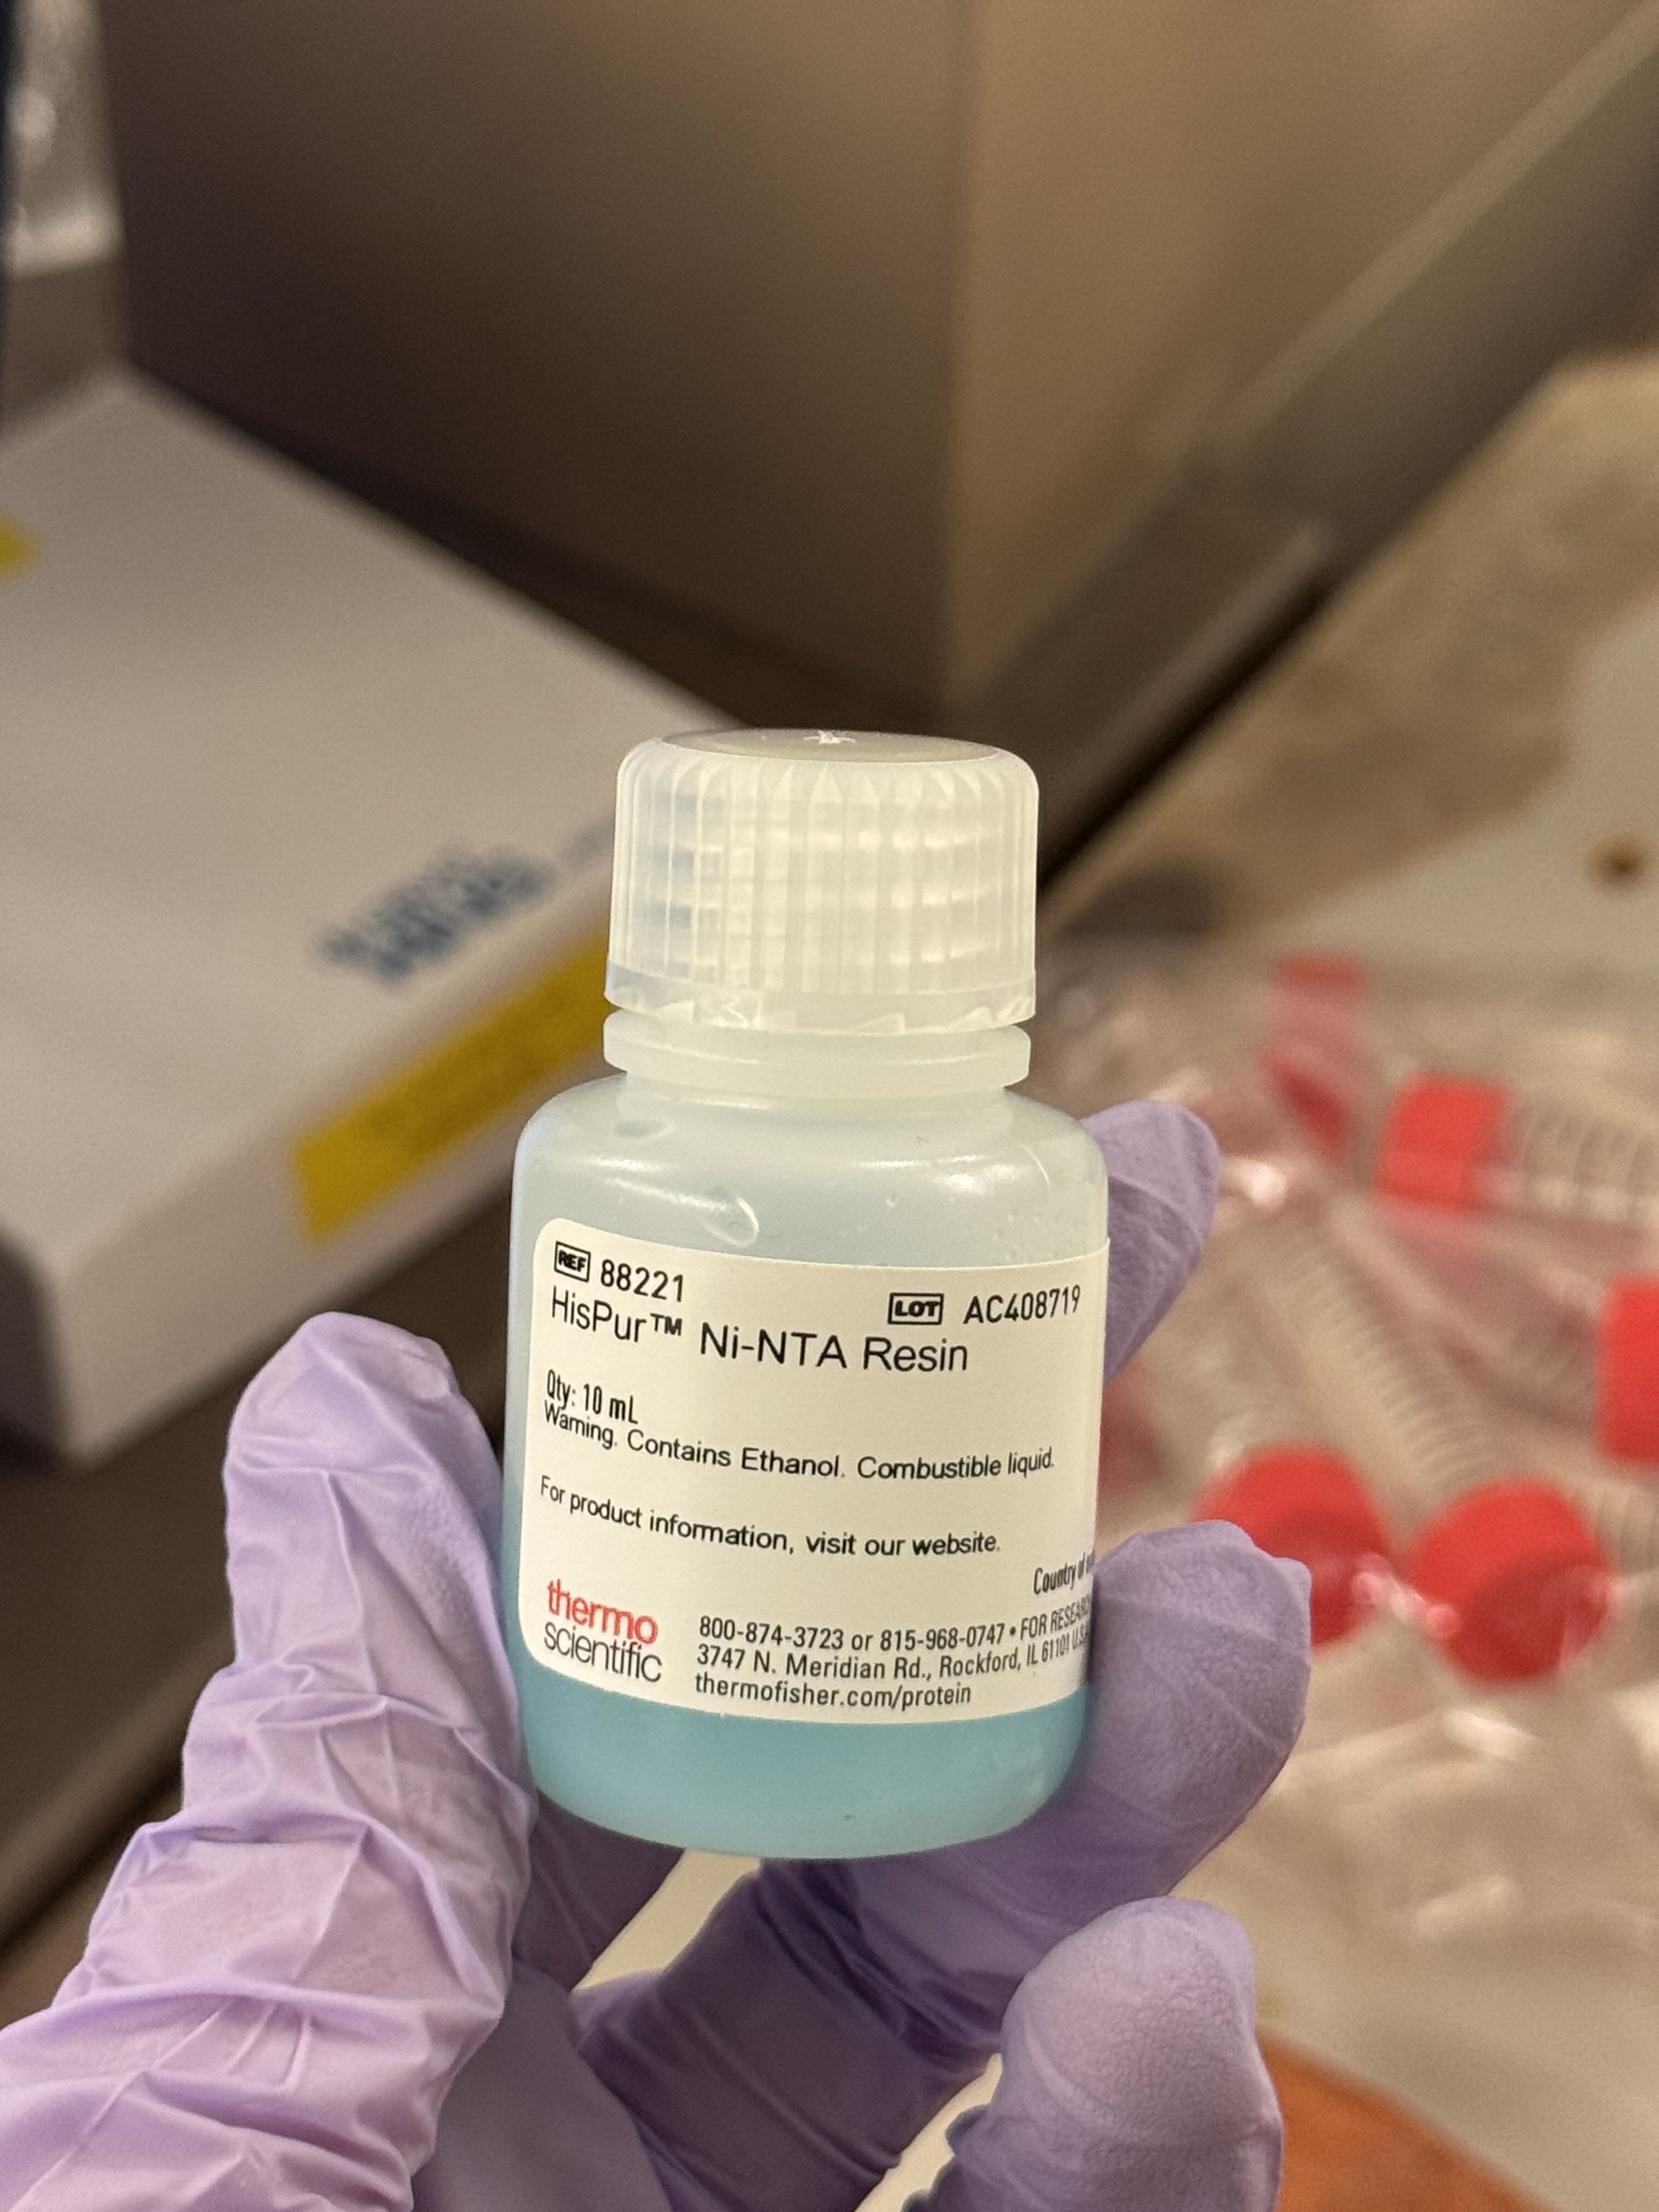
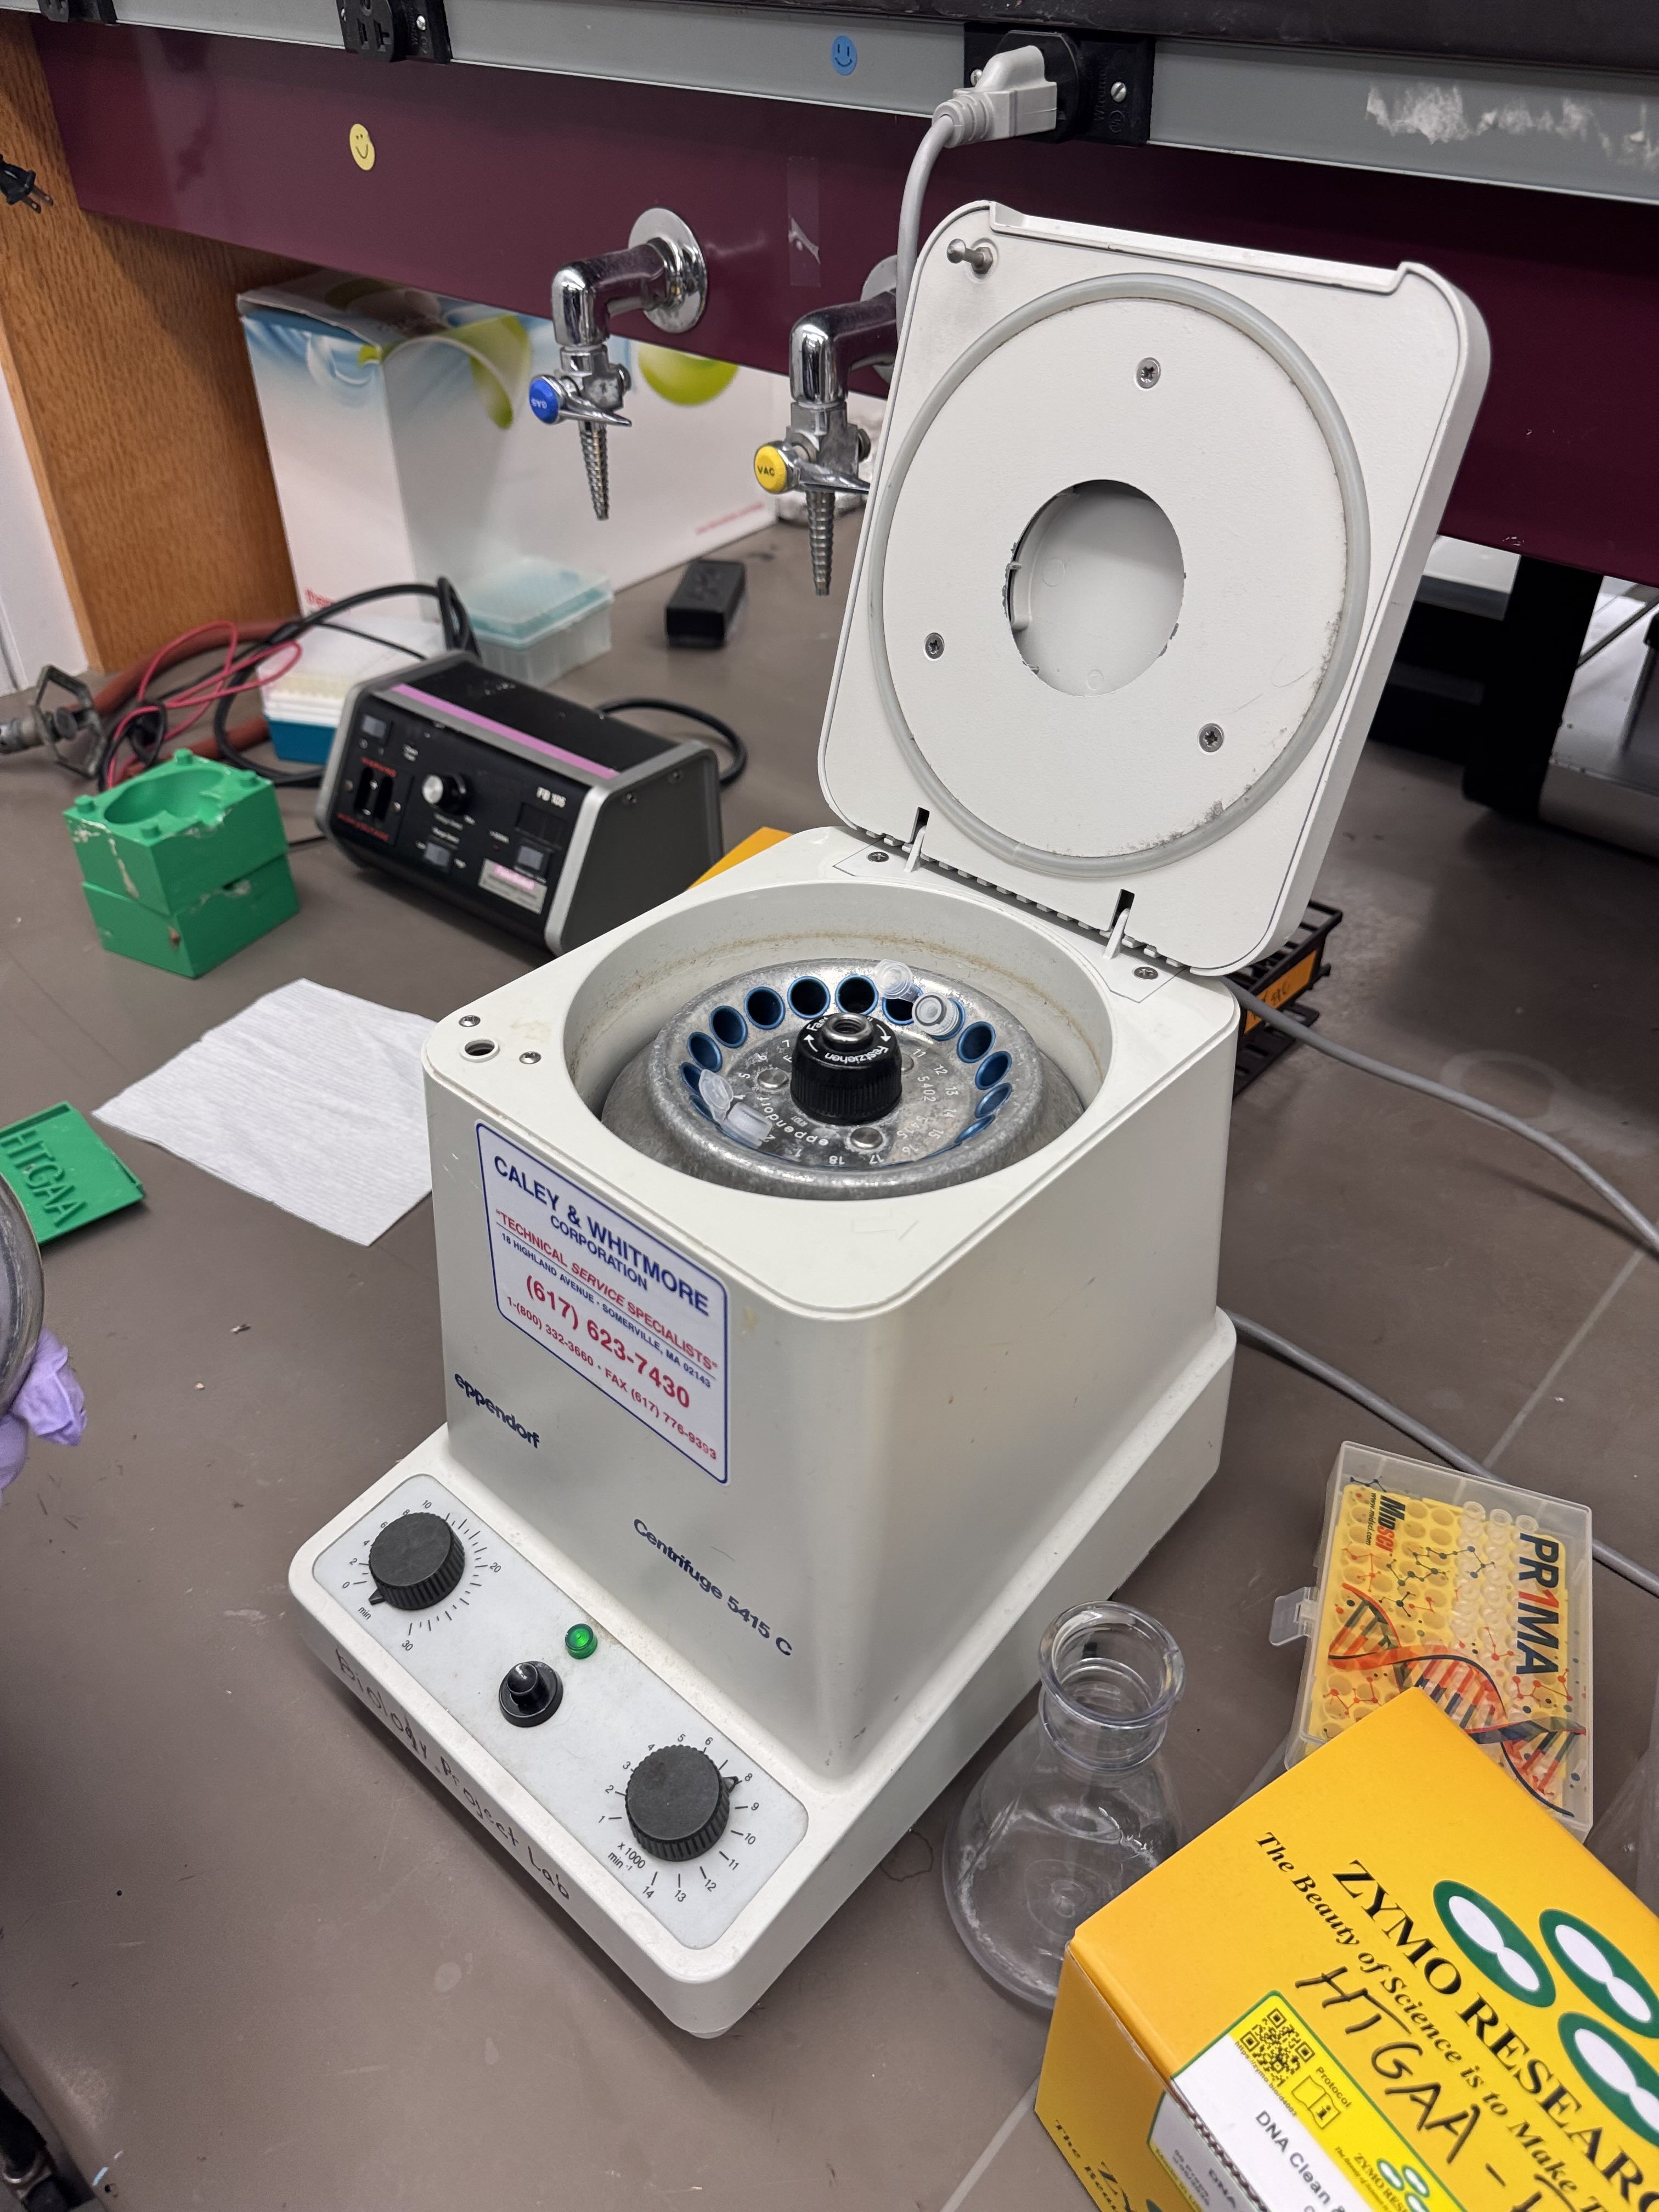
Gel electrophoresis, protein purification and concentration, spectrophotometer, pH indicator, qbit, mass spectrometry, DNA sequencing, nickel column exchange chromatography, desalination centrifugation
Homework: Waters Part I — Molecular Weight
1. Based on the predicted amino acid sequence of eGFP and any known modifications, what is the calculated molecular weight?
eGFP Sequence Analysis: The sequence provided includes the eGFP core, an LE linker, and a 6x-His purification tag.
Calculated Molecular Weight:27,988.97 Da (Daltons).
2. Calculate the molecular weight of the eGFP using the adjacent charge state approach.
Using Figure 1, we select two adjacent peaks:
Peak 1 (m/z_n): 875.4421
Peak 2 (m/z_n+1): 903.7148
2.1 Determine z for each adjacent pair of peaks:
Using the formula for charge state calculation:
$$z = \frac{m/z_{n+1} - 1.0078}{m/z_{n+1} - m/z_{n}}$$
$$z = \frac{903.7148 - 1.0078}{903.7148 - 875.4421} = \frac{902.707}{28.2727} = 31.92$$
Rounding to the nearest integer, the charge state for the 903.7 peak is 31+, and the 875.4 peak is 32+.
2.2 Determine the MW of the protein:
Using the 32+ charge state:
MW = (875.4421 * 32) - (32 * 1.0078)
MW = 28,014.15 - 32.25
Calculated MW:27,981.90 Da
2.3 Calculate the accuracy of the measurement:
Using the formula: Error (ppm) = [|Exp - Theory| / Theory] * 1,000,000
3. Can you observe the charge state for the zoomed-in peak in the mass spectrum for the intact eGFP? If yes, what is it? If no, why not?
No. Because the protein is in its denatured state at a high charge state (32+), the isotopes are spaced by 1/z (1/32 = 0.03 m/z). A mass spectrometer with a resolution of 30,000 cannot resolve individual isotopes for a protein this large at that charge state; they blur into a single “envelope.”
Homework: Waters Part II — Secondary/Tertiary Structure
1. Explain the difference between native and denatured protein conformations.
Denatured State: The protein is unfolded, often due to acidic solvents or heat. This “stretches out” the amino acid chain, exposing basic residues (Lysine, Arginine, Histidine) that were previously hidden in the core. Consequently, the protein picks up many protons, resulting in high charge states and peaks at lower m/z values (the 500-1500 range).
Native State: The protein remains folded (e.g., the eGFP beta-barrel). Many basic residues are buried and inaccessible for protonation. The protein picks up fewer protons, resulting in lower charge states and peaks at higher m/z values (the 2000-4000 range).
2. Can you discern the charge state of the peak at ~2800 m/z in Figure 3? What is it? How can you tell?
Yes. The charge state is 10+.
Reasoning: In the zoomed inset of Figure 3, the individual isotopes are clearly resolved. The spacing between the isotopes is 0.1 m/z. Since the spacing is equal to 1/z, a spacing of 0.1 indicates a charge state of 10 (1/10 = 0.1).
Homework: Waters Part III — Peptide Mapping
1. How many Lysines (K) and Arginines (R) are in eGFP?
Based on the sequence analysis, there are 20 Lysines (K) and 6 Arginines (R).
2. How many peptides will be generated from tryptic digestion of eGFP?
Using the PeptideMass tool with zero missed cleavages, 27 peptides are predicted.
3. How many chromatographic peaks do you see between 0.5 and 6 minutes in Figure 5a?
Looking at the Total Ion Chromatogram (TIC), there are approximately 18 distinct peaks that meet the >10% relative abundance threshold.
4. Does the number of peaks match the number of peptides predicted?
No. There are fewer peaks in the chromatogram (18) than predicted peptides (27). This is common because some peptides are too small to be retained on the column, others are too hydrophobic to elute, and some co-elute (overlap) at the same time.
5. Identify the m/z and charge (z) of the peptide in Figure 5b. Calculate the mass of the singly charged form (MH+).
m/z: 525.76712
Charge (z): The isotopes are spaced by 0.5 m/z. Therefore, $z = 2$ (since 1/2 = 0.5).
Singly Charged Mass (MH+): (525.767 * 2) - 1.0078 = 1050.53 Da.
6. Identify the peptide and calculate the mass accuracy in ppm.
Comparing the mass to the predicted list, the peptide is FEGDTLVNR (Theoretical MH+ = 1049.52 Da).
Error:5.7 ppm. This is highly accurate and confirms the peptide identity.
7. What is the percentage of the sequence confirmed?
According to Figure 6, the sequence coverage is 88%.
8. Bonus: What is the sequence for the fragmentation spectrum in Figure 5c?
The sequence is FEGDTLVNR. The spectrum displays the characteristic y-ion and b-ion series that confirm this specific amino acid order.
9. Does the peptide map data make sense?
Yes. 88% coverage is excellent. The high mass accuracy (under 10 ppm) and the matching fragmentation patterns definitively prove that the protein produced is the eGFP standard.
Homework: Waters Part IV — Oligomers
Based on the CDMS mass spectrum in Figure 7 and the subunit masses:
7FU Decamer: Observed at 3.4 MDa.
8FU Didecamer: Observed at 8.33 MDa.
8FU 3-Decamer: Observed at 12.67 MDa.
8FU 4-Decamer: This would be represented by the furthest right, lower-abundance peaks near 16.0-17.0 MDa.
Homework: Waters Part V — Did I make GFP?
Metric
Theoretical
Observed (Measured)
PPM Mass Error
Molecular weight (kDa)
27.989 kDa
27.982 kDa
252.6 ppm
Gemini AI was consulted for data synthesis and formatting
Week 11 Homework: Bioproduction & Cloud Labs
Homework: Master Mix Component Analysis
Referencing the cell-free protein synthesis reaction composition, provide a 1-2 sentence description of what each component’s role is in the cell-free reaction.
1. E. coli Lysate
BL21 (DE3) Star Lysate: Provides the core machinery for translation (ribosomes, tRNAs) and T7 RNA Polymerase for transcription; the “Star” mutation specifically helps by reducing mRNA degradation during the reaction.
2. Salts/Buffer
Potassium Glutamate: Acts as the primary salt to maintain the necessary ionic strength and provides a potassium source essential for ribosomal catalytic activity.
HEPES-KOH pH 7.5: A robust chemical buffer used to maintain a stable pH environment as metabolic byproducts accumulate over the 20-hour run.
Magnesium Glutamate: Supplies magnesium ions, which are critical cofactors for ribosomal assembly and the function of various enzymes in the lysate.
Potassium phosphate (monobasic/dibasic): Serves as a secondary buffer system and provides the inorganic phosphate required for the regeneration of ATP.
3. Energy / Nucleotide System
Ribose & Glucose: These act as the primary carbon and energy sources, which the lysate’s internal metabolic pathways utilize to regenerate ATP and GTP for long-duration production.
AMP, CMP, GMP, UMP: These nucleoside monophosphates serve as the foundational, recyclable building blocks that the lysate converts into active NTPs for transcription.
Guanine: A specific nucleobase precursor that allows the salvage pathway to synthesize additional GTP when initial pools are exhausted.
4. Translation Mix (Amino Acids)
17 Amino Acid Mix: Supplies the majority of the essential building blocks needed to assemble the polypeptide chain.
Tyrosine: Added separately due to its extremely low solubility at neutral pH, which would cause it to precipitate out of a combined master mix.
Cysteine: Added separately because it is highly reactive and prone to oxidation, which can lead to unwanted disulfide bond formation if not managed.
5. Additives & Backfill
Nicotinamide: A precursor for NAD+/NADH redox cofactors, essential for maintaining the metabolic flux of the energy regeneration system over 20+ hours.
Nuclease Free Water: The solvent used to bring the reaction to its final volume while ensuring no contaminating enzymes are introduced to degrade the DNA or RNA templates.
Homework: Reaction Dynamics
Describe the main differences between the 1-hour optimized PEP-NTP master mix and the 20-hour NMP-Ribose-Glucose master mix.
The 1-hour PEP-NTP mix is designed for high-speed “sprint” production, utilizing high-energy Phosphoenolpyruvate (PEP) and pre-formed NTPs for immediate reaction. In contrast, the 20-hour NMP-Ribose-Glucose mix is built for a “marathon,” using cheaper precursors (NMPs and sugars) and relying on the lysate’s endogenous metabolic salvage pathways to sustain energy and nucleotide production over a significantly longer period.
Bonus question: How can transcription occur if GMP is not included but Guanine is?
Transcription is possible because the E. coli lysate contains salvage pathway enzymes that can convert Guanine into GMP by adding a phosphoribosyl group. This GMP is then further phosphorylated by kinases within the lysate into GTP, which is the required substrate for RNA polymerase to perform transcription.
Homework: Part C — Planning the Global Experiment
Given the 6 fluorescent proteins used, identify and explain at least one biophysical or functional property of each protein that affects expression or readout in cell-free systems.
sfGFP: Features extremely robust folding and fast maturation, making it the most reliable reporter across various lysate conditions and temperatures.
mRFP1: Characterized by a relatively slow maturation time, meaning its fluorescence signal often lags significantly behind the actual translation of the protein.
mKO2: An exceptionally bright orange protein, but it can be sensitive to photobleaching during the repeated reads of a long 36-hour experiment.
mTurquoise2: Possesses an exceptionally high quantum yield (brightness), allowing for high-sensitivity detection even when total protein yields are low.
mScarlet_I: One of the brightest red proteins available, but it has a high oxygen requirement for chromophore maturation, which can limit signal in deep, stagnant wells.
Electra2: Specifically engineered for high stability and rapid maturation, providing near real-time data on the rate of protein production in cloud lab setups.
Create a hypothesis for how adjusting one or more reagents in the cell-free mastermix could improve a specific biophysical or functional property.
Target Protein: mScarlet_I Reagent Adjustment: Increase Glucose and Nicotinamide by 25%. Hypothesis: Because mScarlet_I has a slow, energy-intensive maturation process, increasing the primary fuel (Glucose) and its metabolic cofactors (Nicotinamide) will extend the metabolic lifespan of the reaction. This sustained energy availability will allow more protein molecules to complete their final oxygen-dependent maturation step over a 36-hour incubation, maximizing total fluorescence.
Gemini AI was consulted for data synthesis and formatting
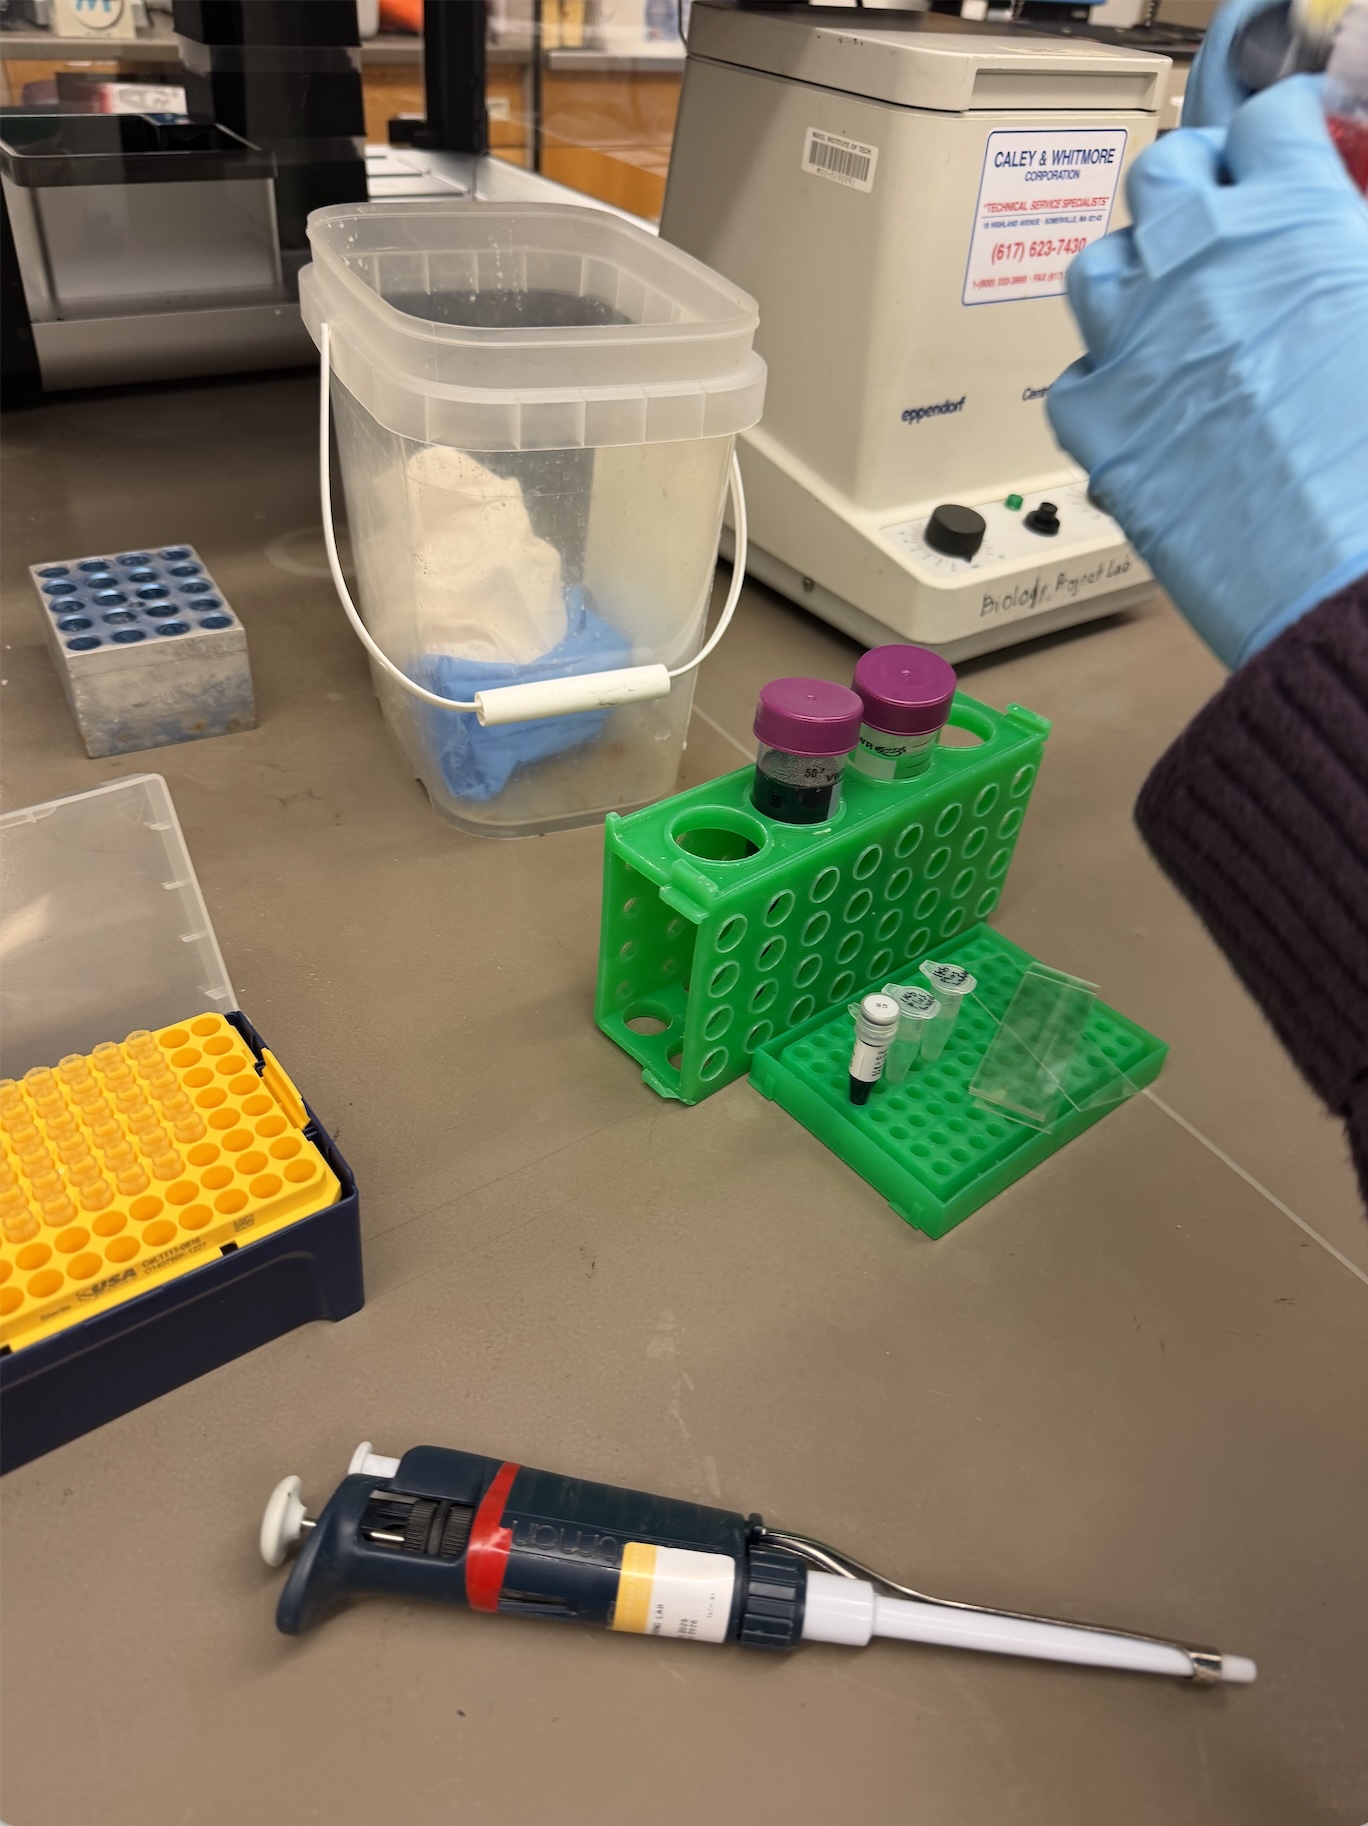
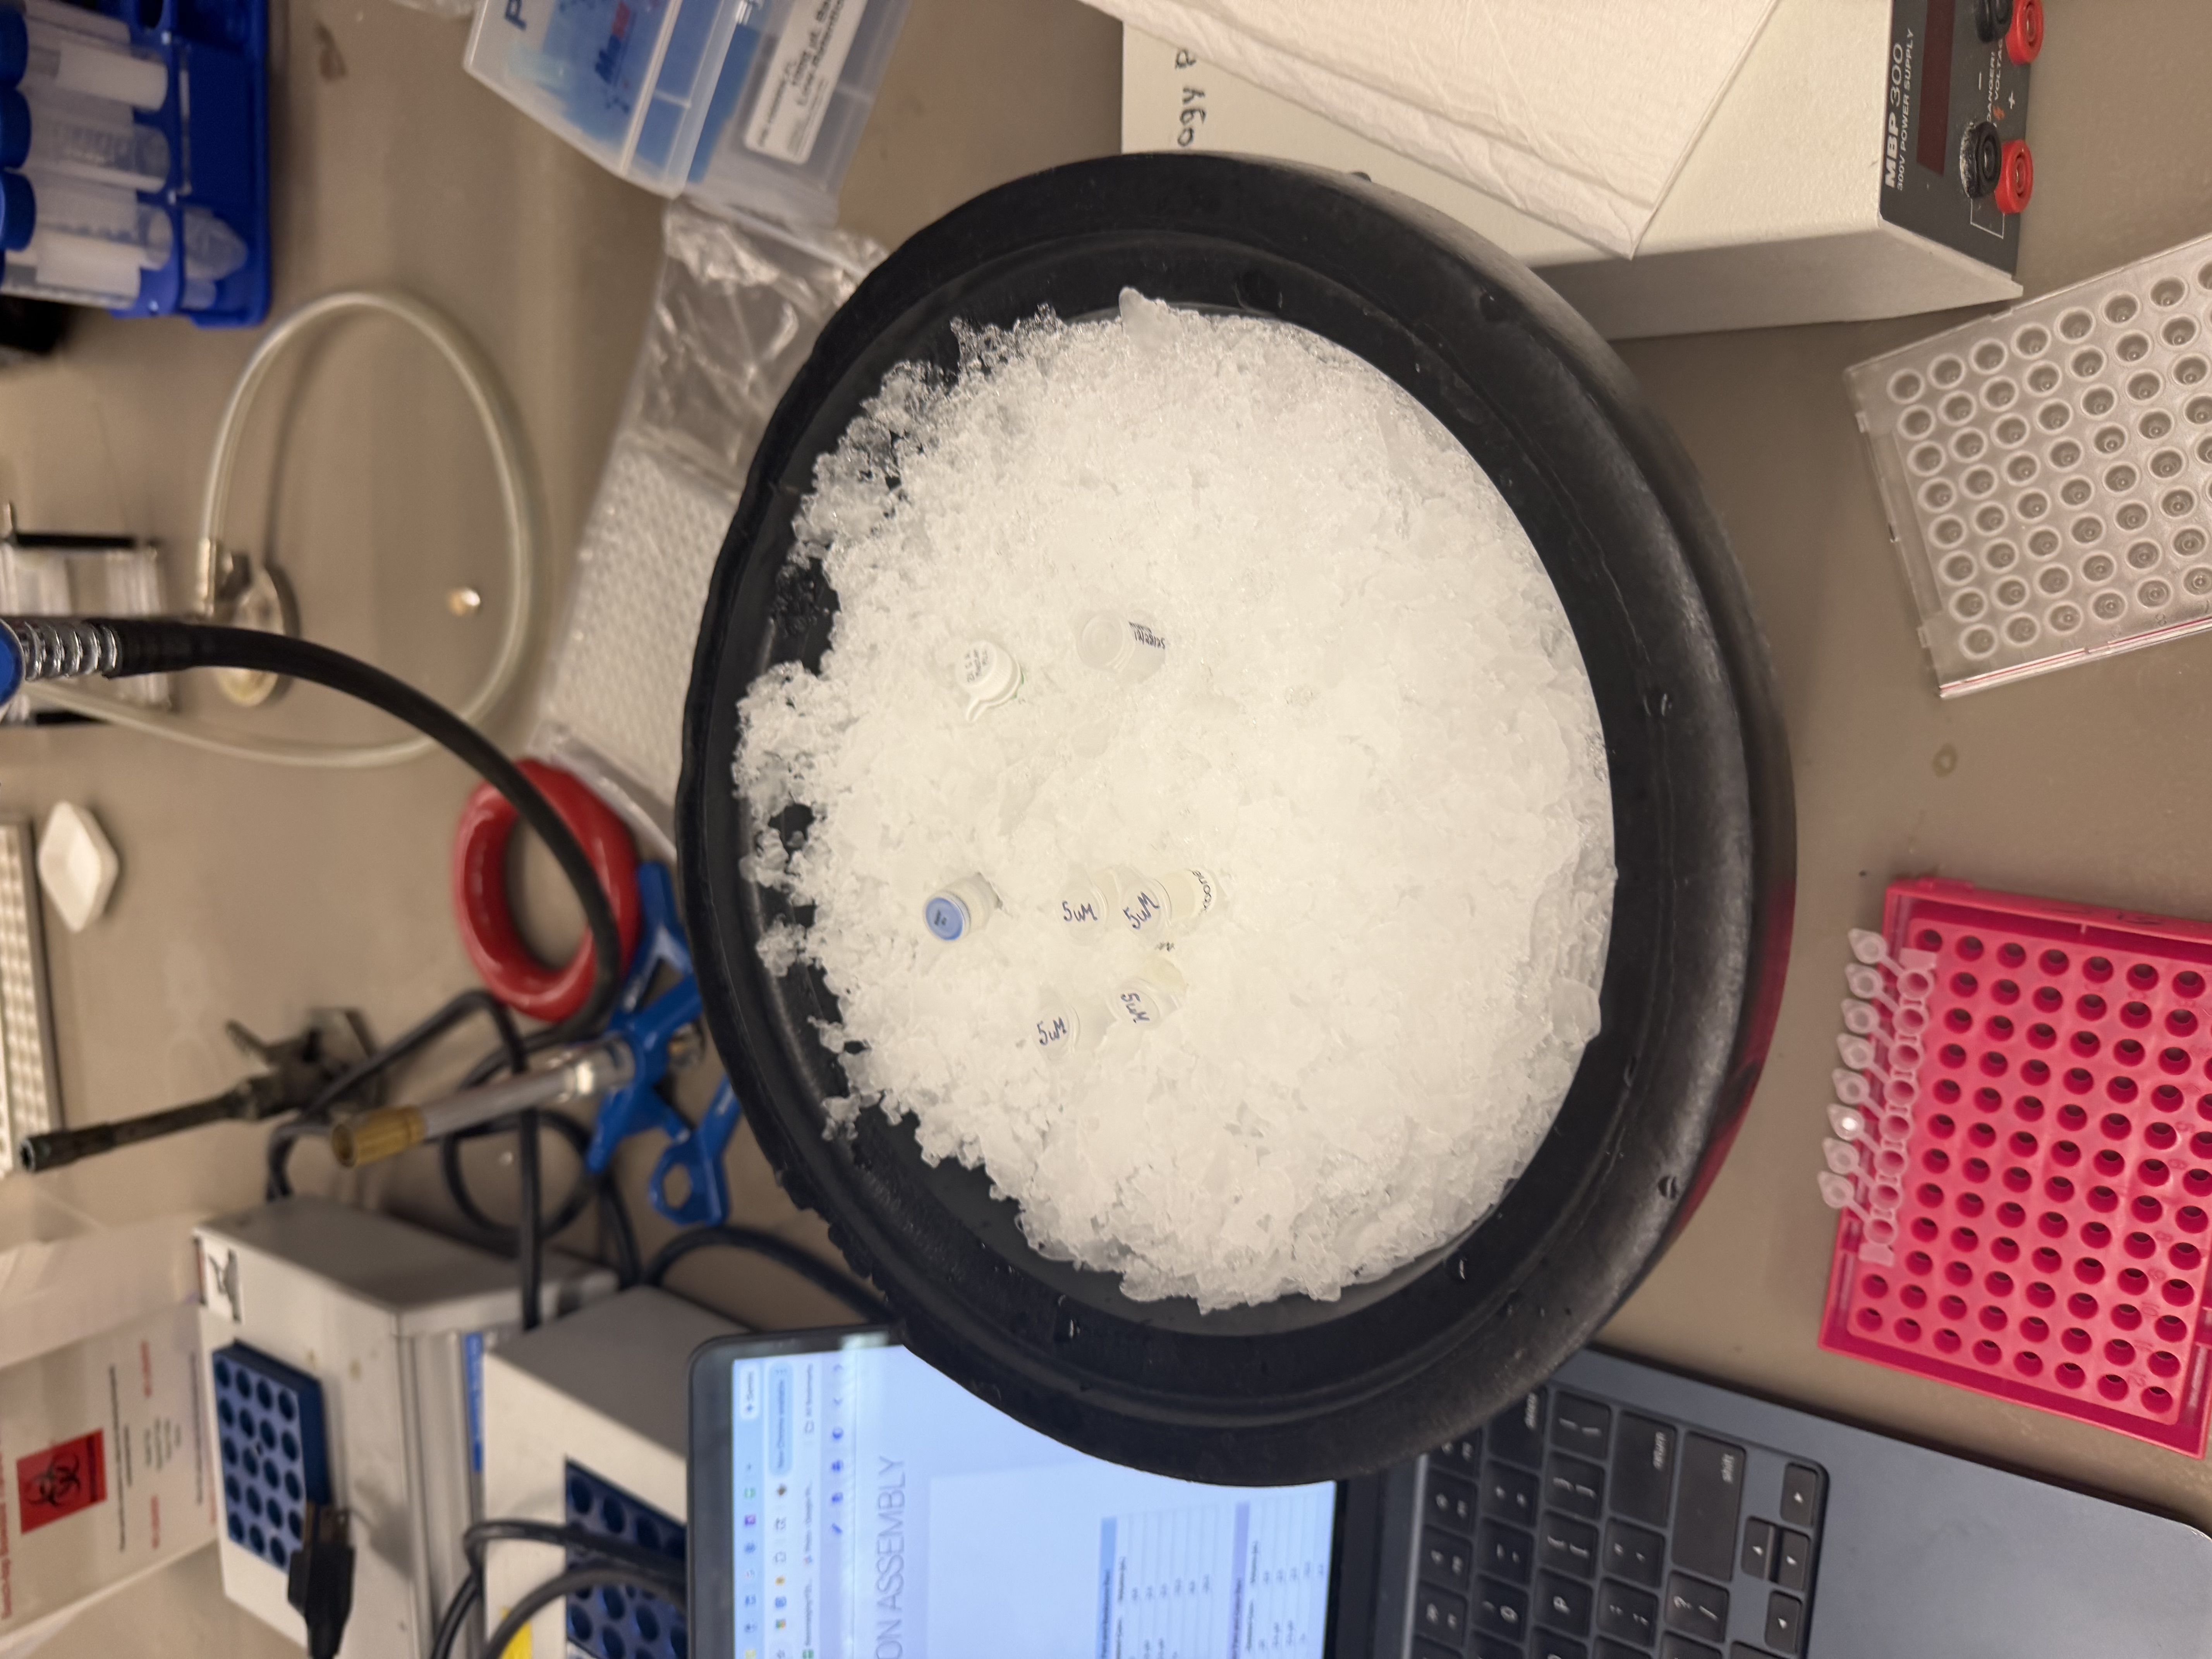
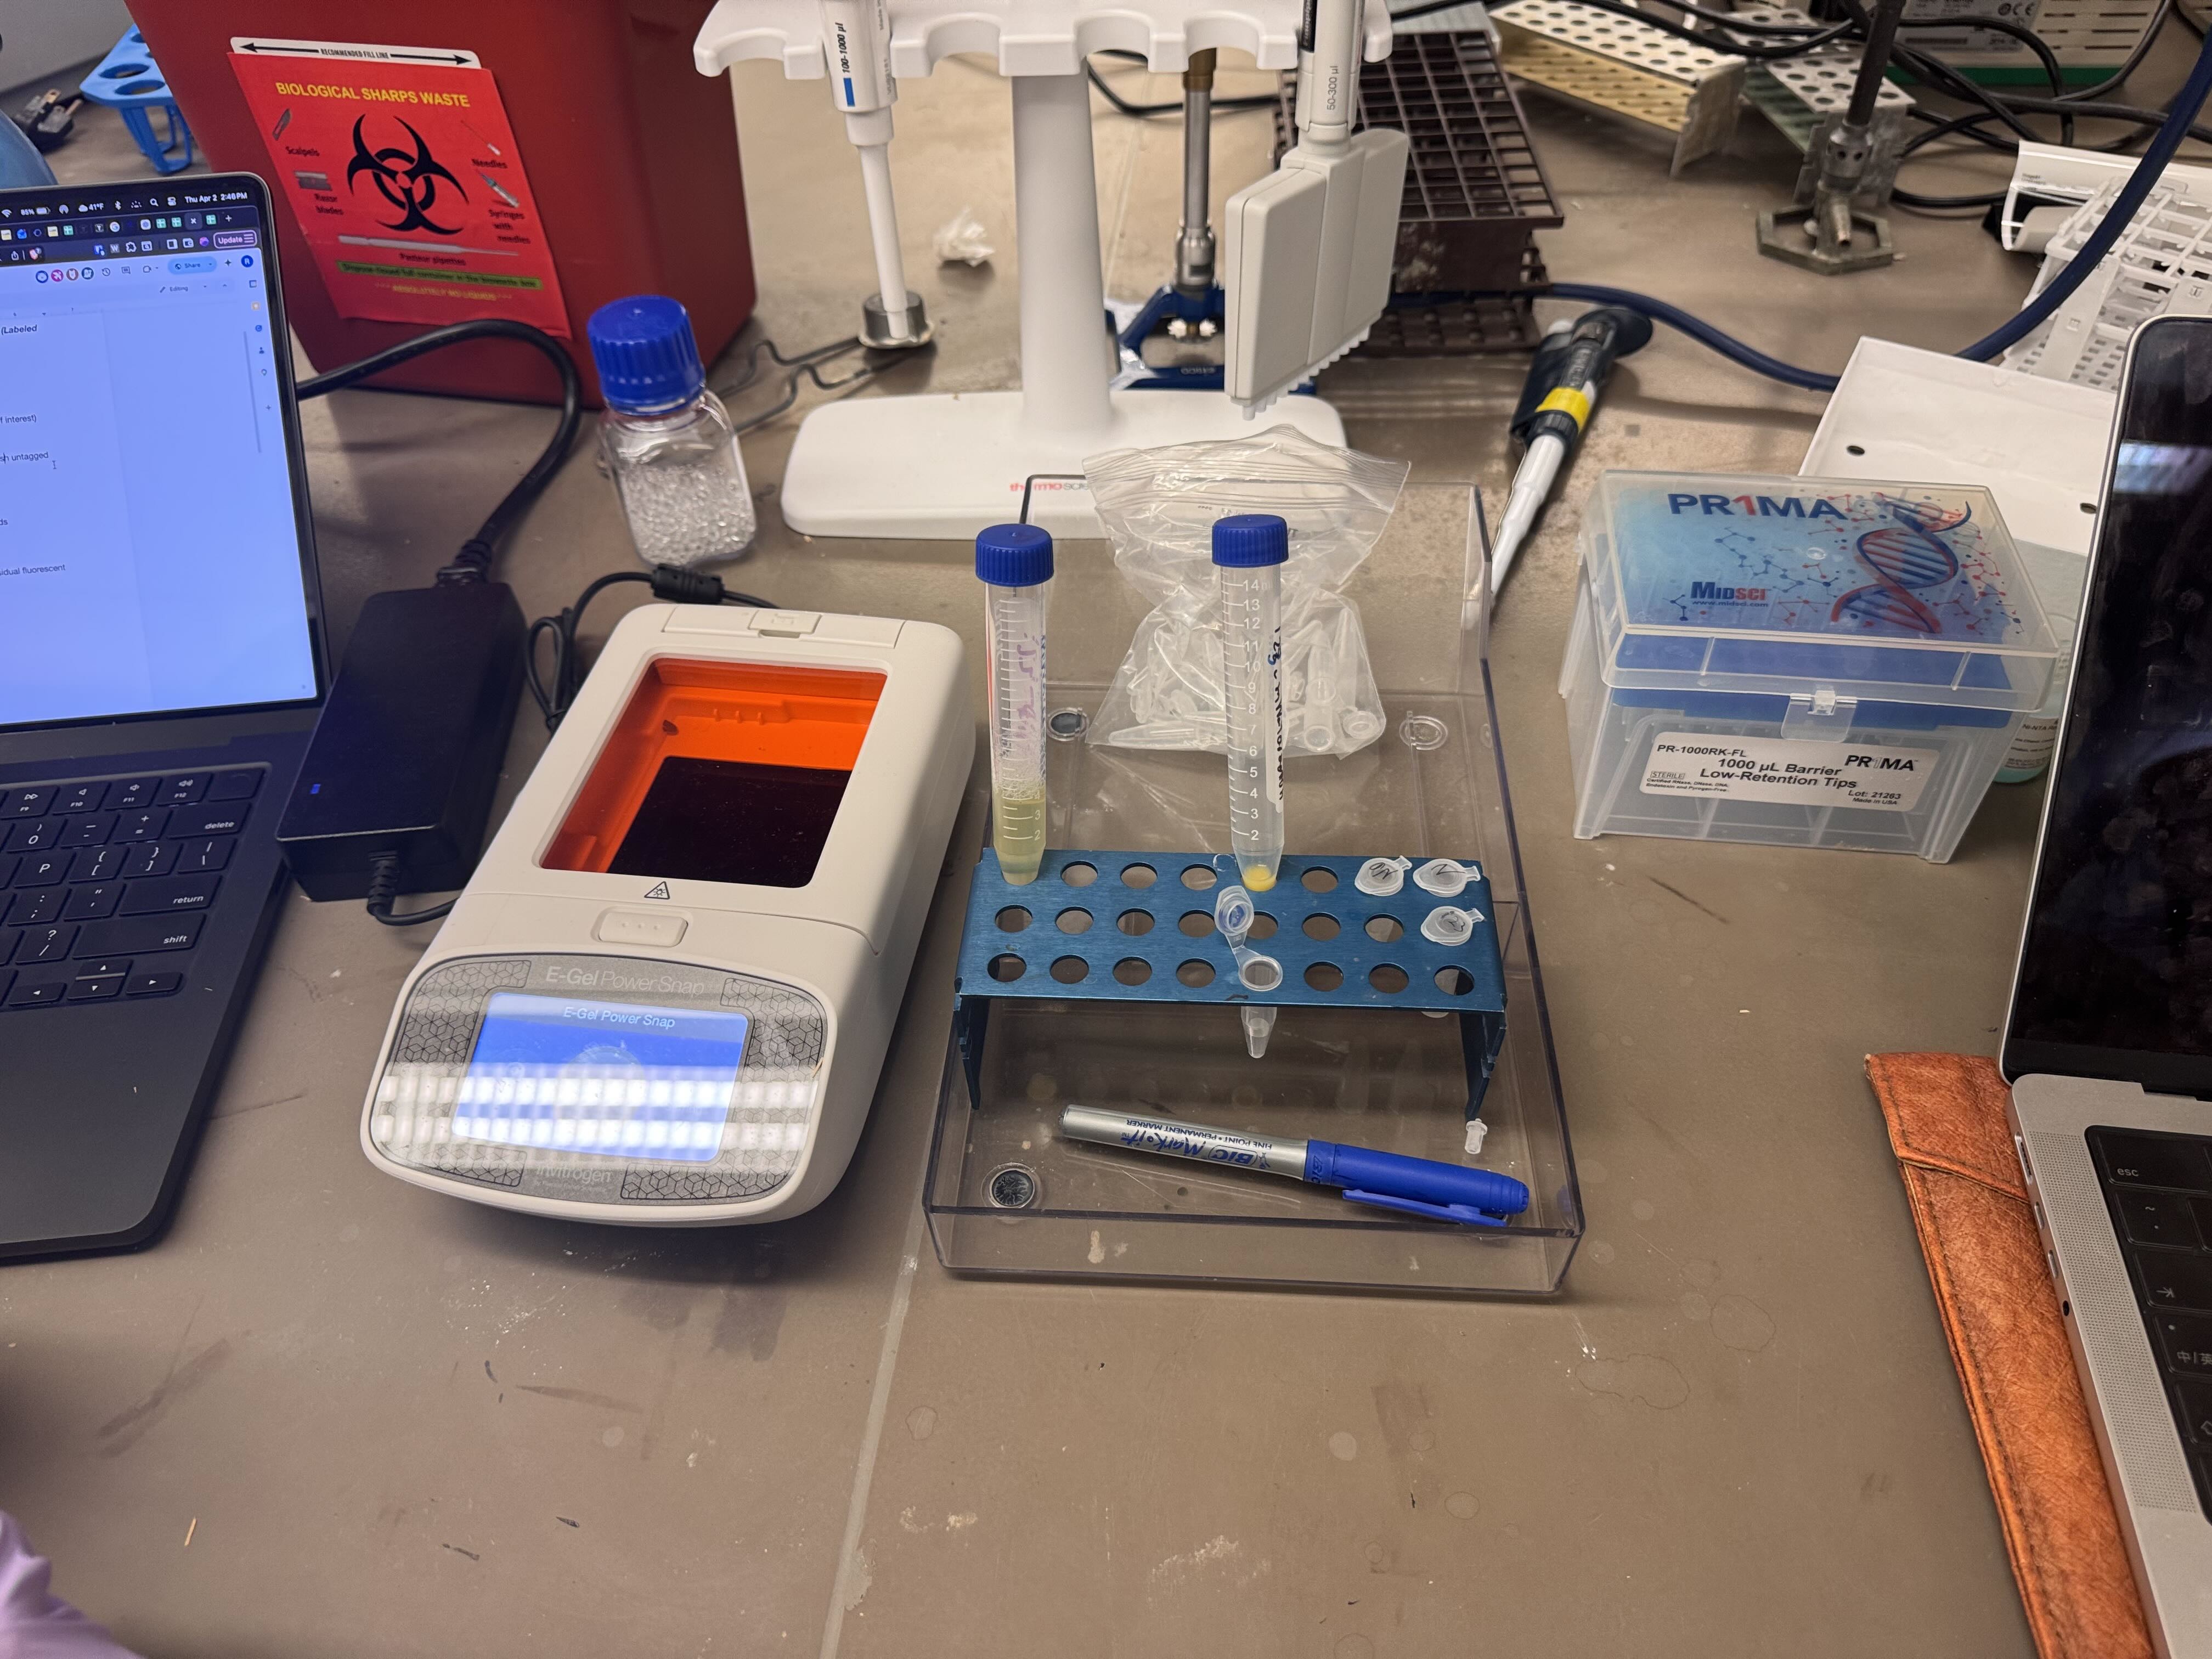
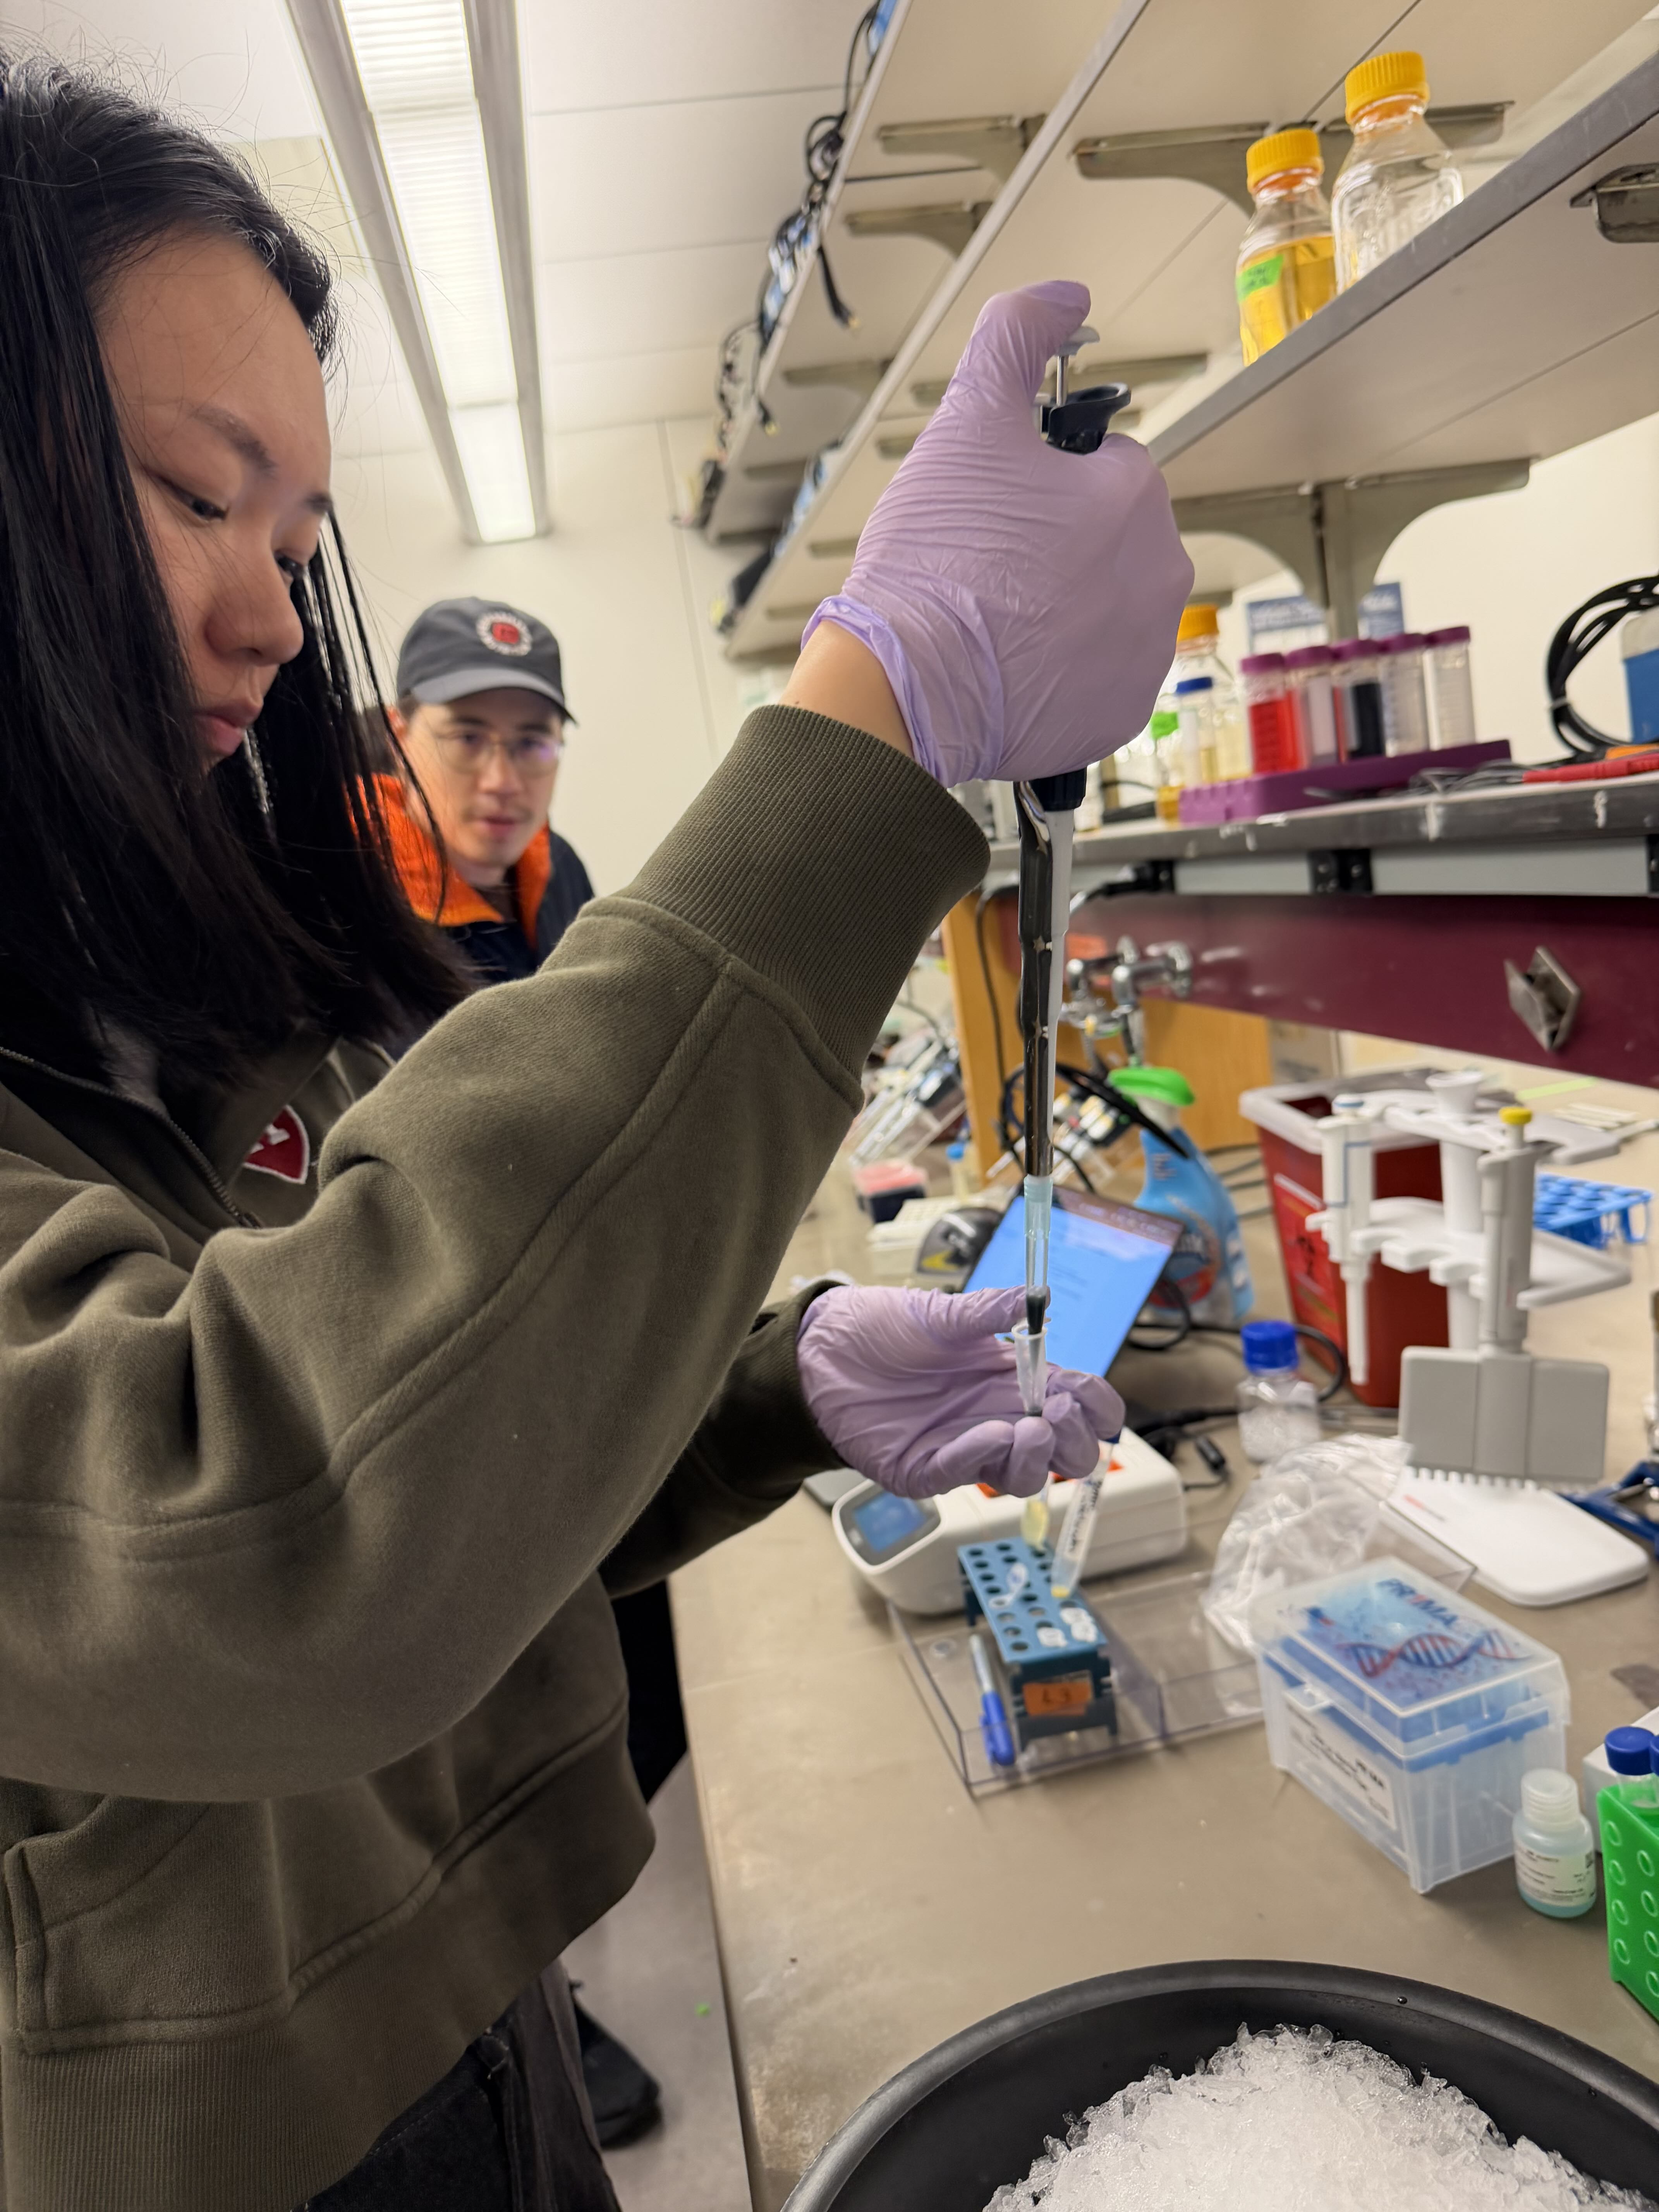
Pipetting & eGels
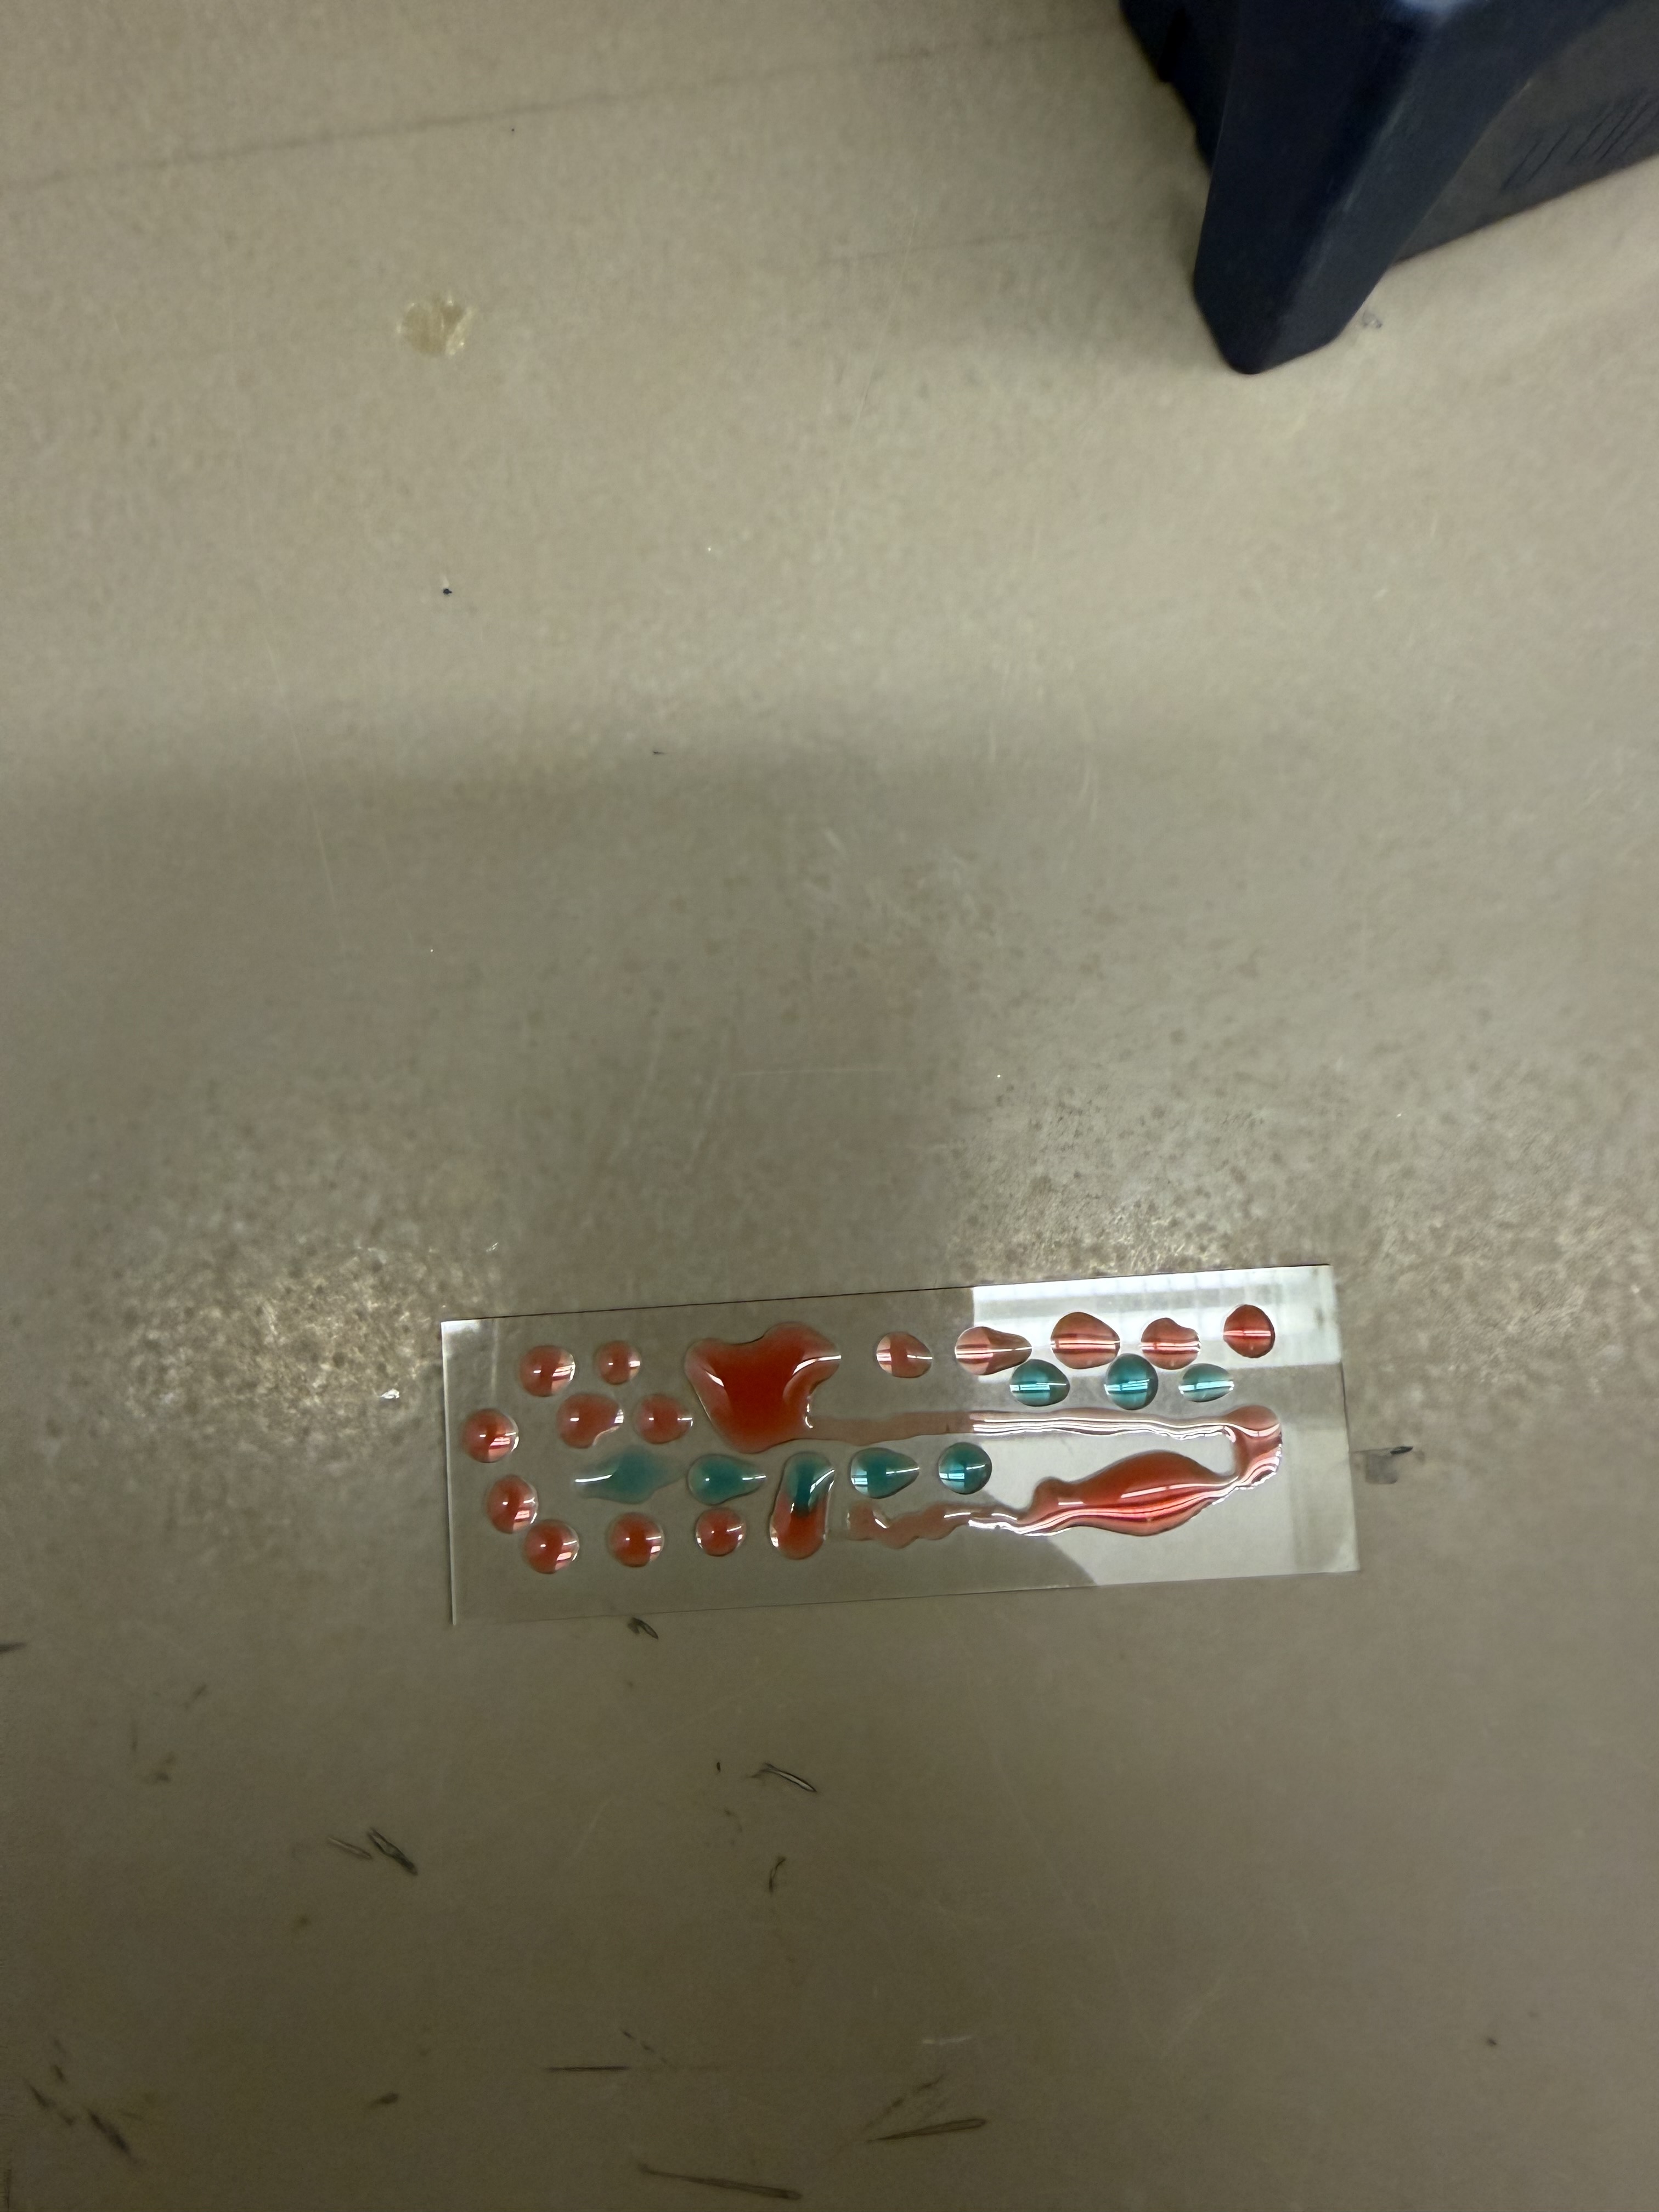
In this week’s lab, we were tasked with familiarizing ourselves with standard pipetting equipment. We utilized P20, P200, and P2000 micropipettes, along with petri dishes and glass slides. Having prior experience in a wet lab, it was fun to explore the equipment artistically.
I started by creating some “droplet art” on a glass slide using colored water.
I then decided to make a smiley face and a DNA strand in the same fashion, pipetting individual droplets of colored water and “streaking” them to create lines.
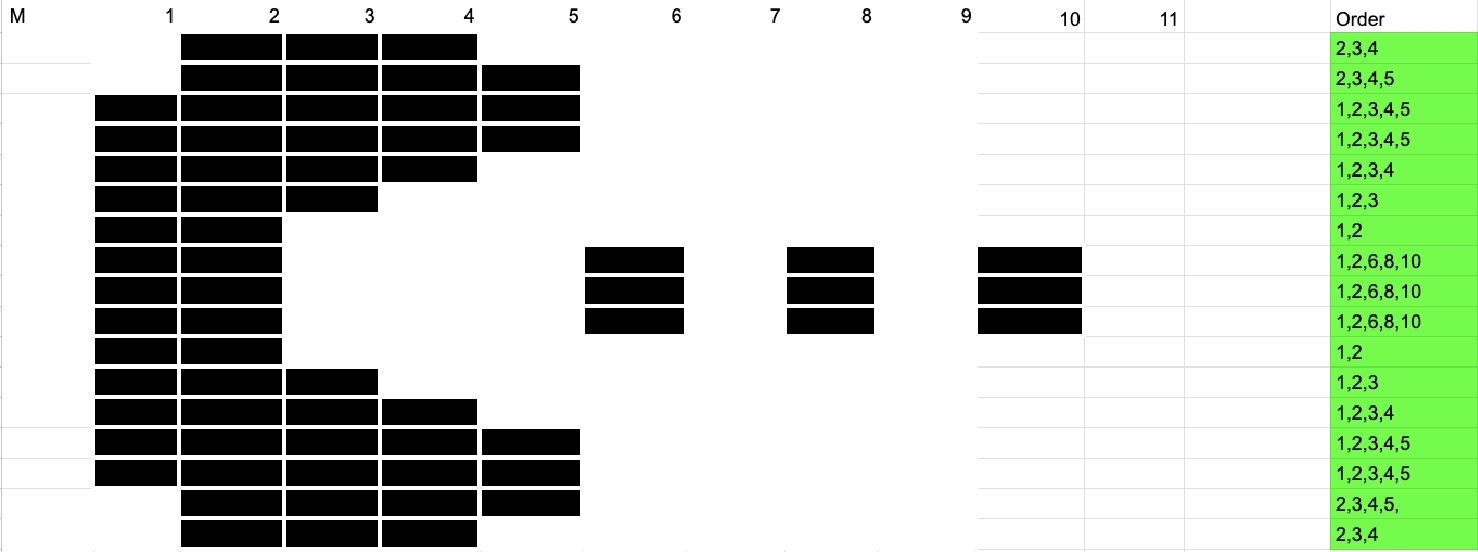
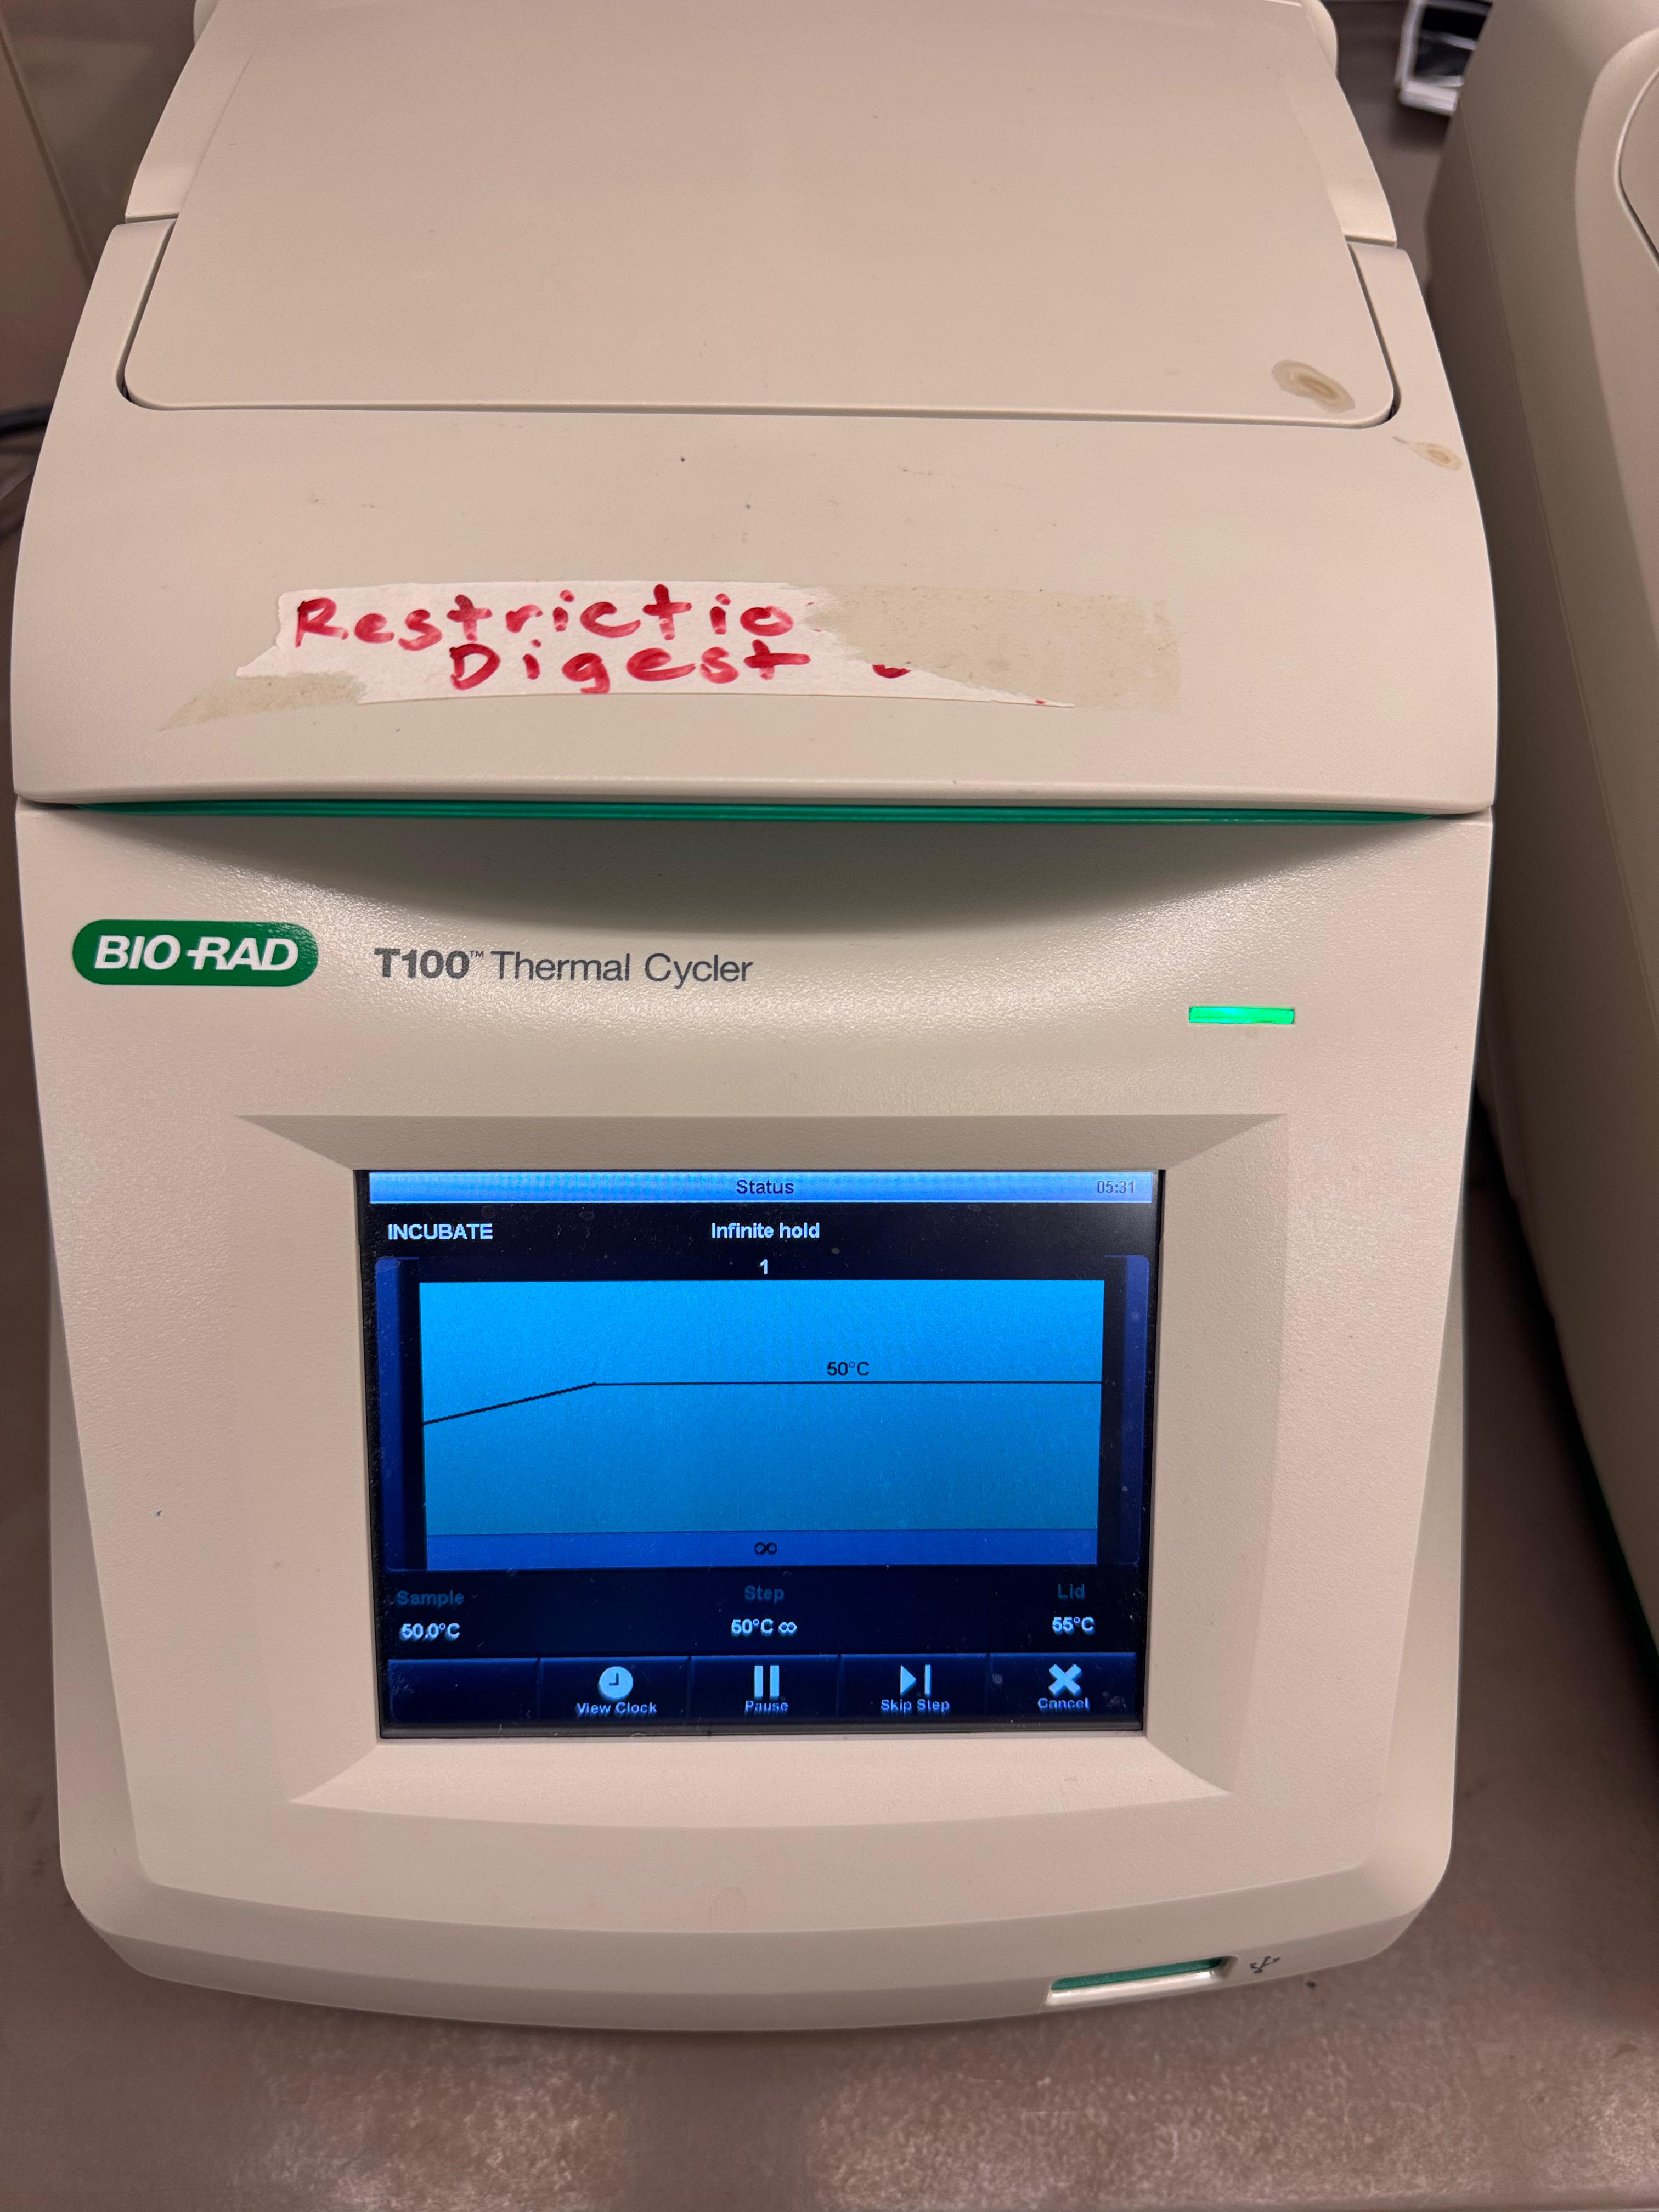
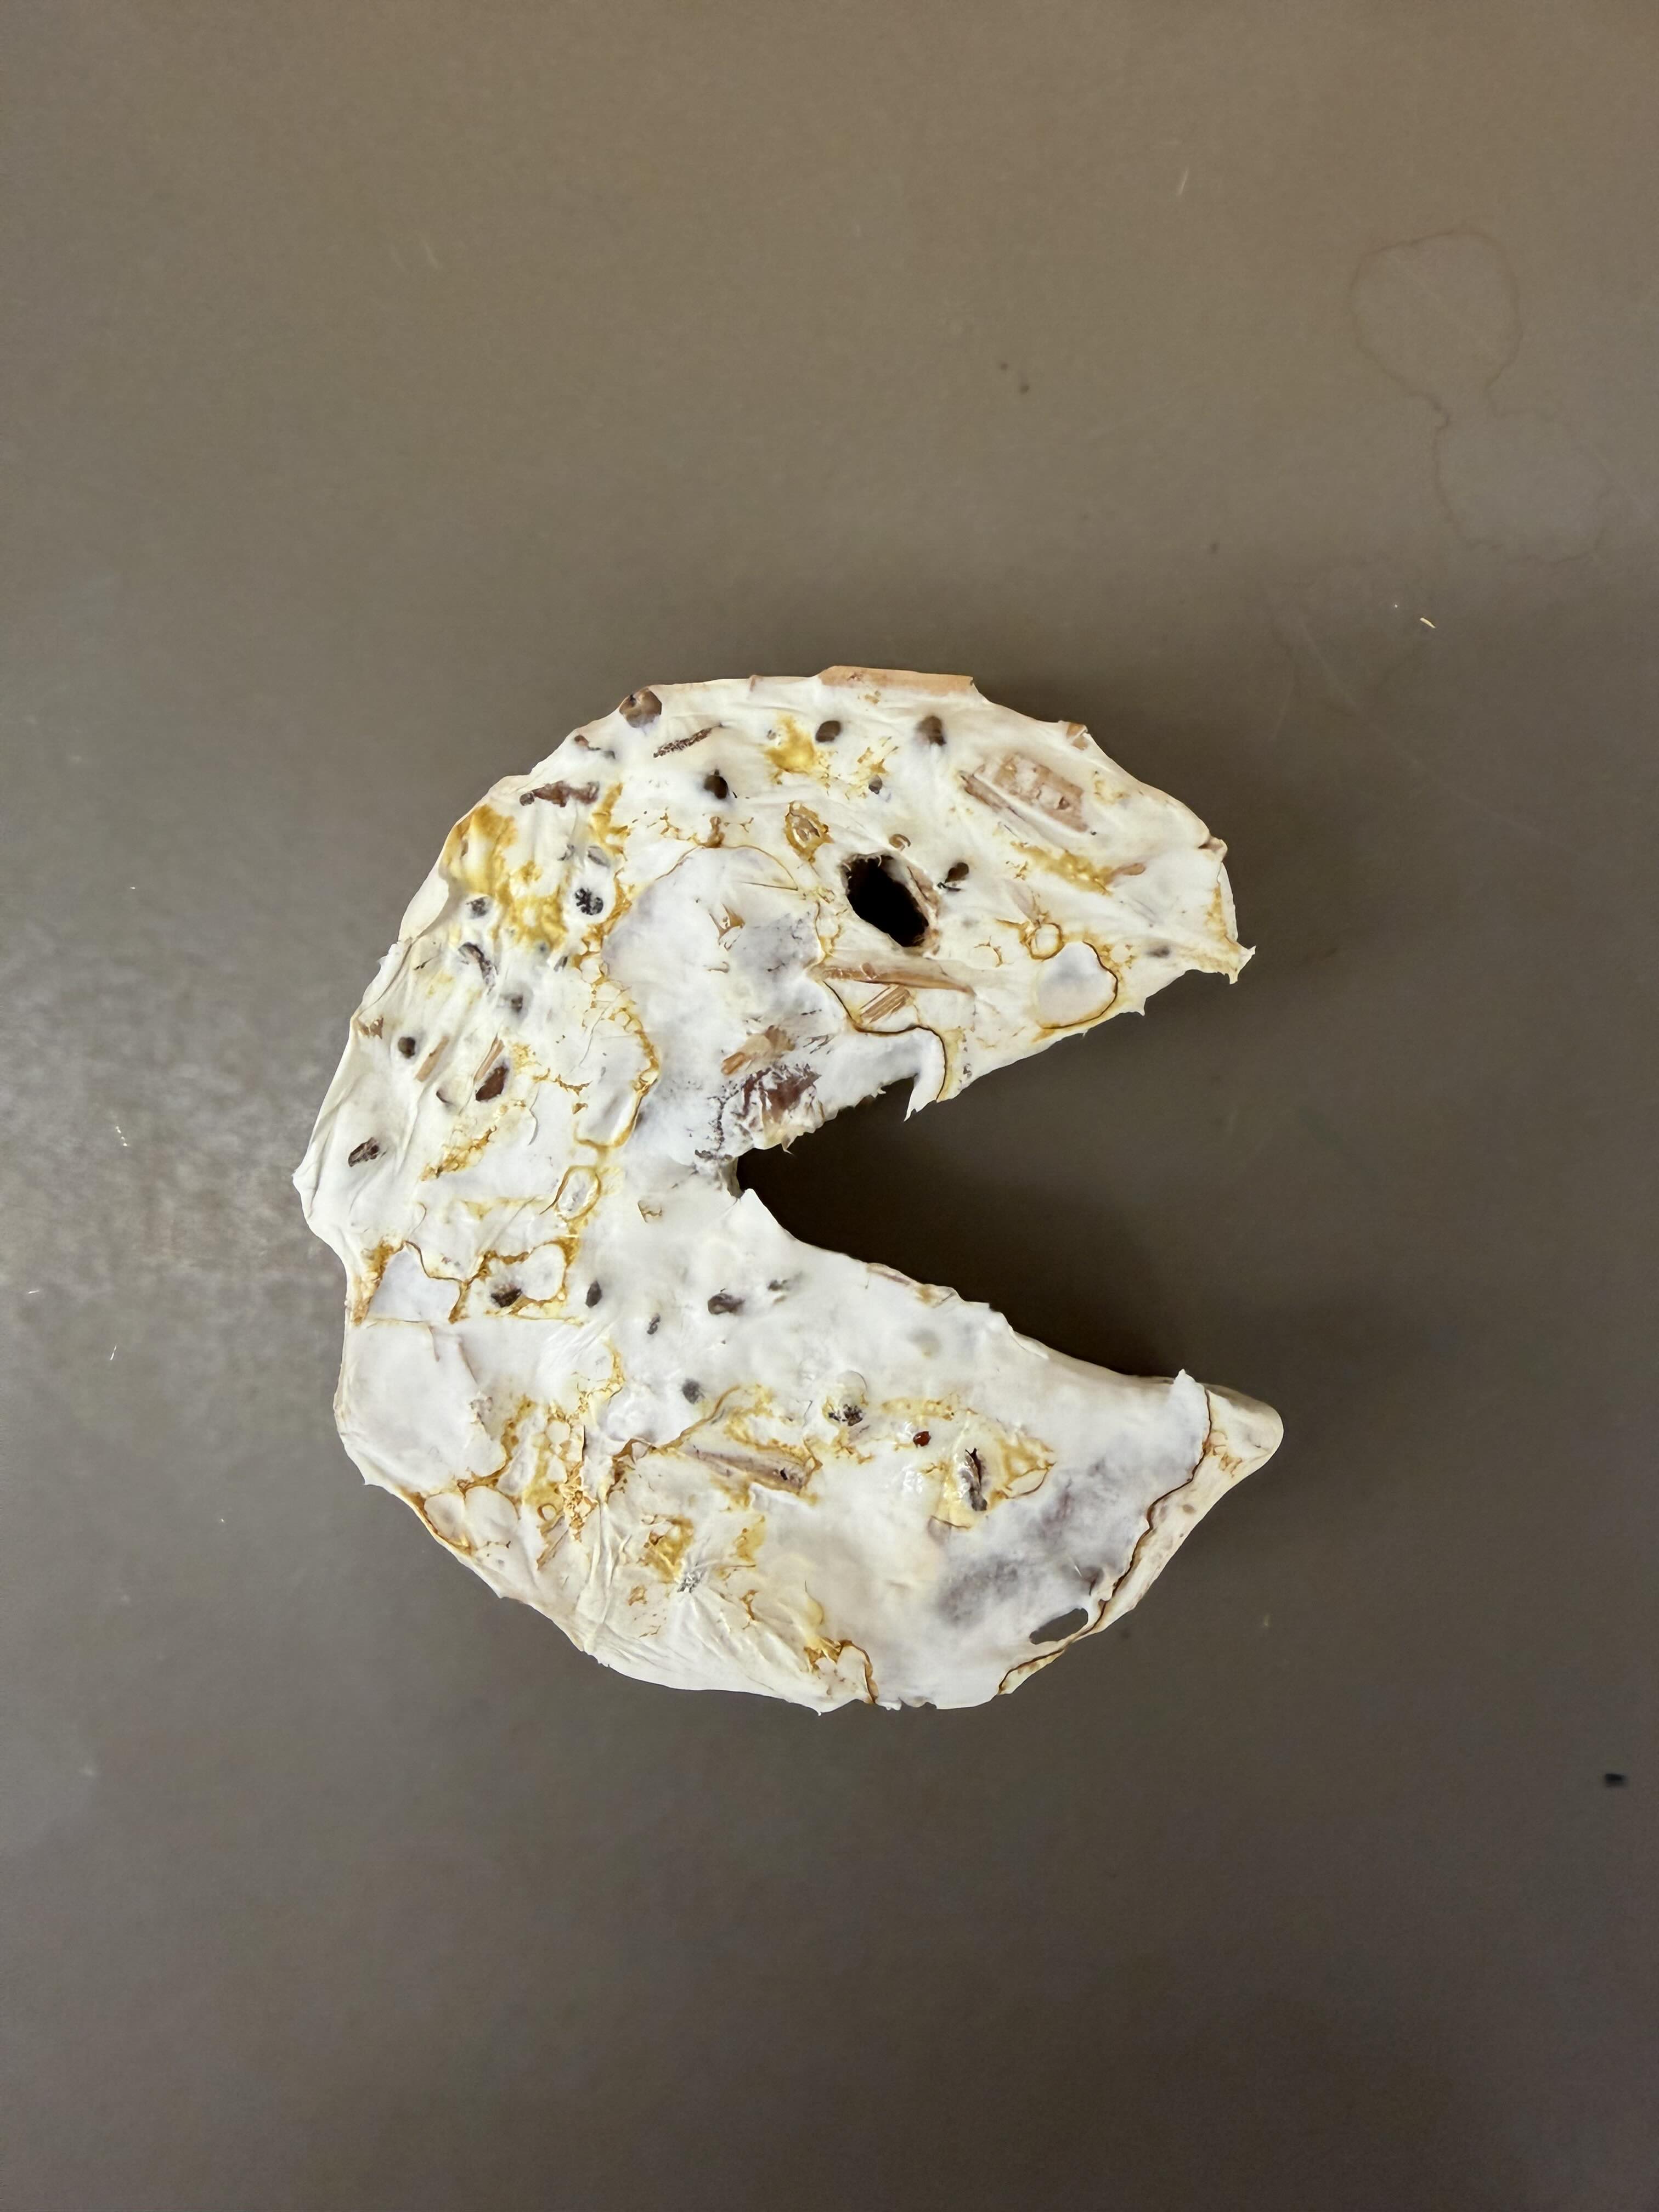
Lab: DNA Gel Art Today in lab, we attempted to make DNA Gel Art using restriction enzymes and software (Benchling). In recitation, we were given an example of someone using time-controlled gel work to create an image, so I came up with a plan to use that framework to create an image of Pac-Man.
I used SalI, which cuts only a single 500 bp strand from lambda DNA, for my digest to create my “blocks” that I would effectively “stack” as I pipetted them at interval times on the gel.
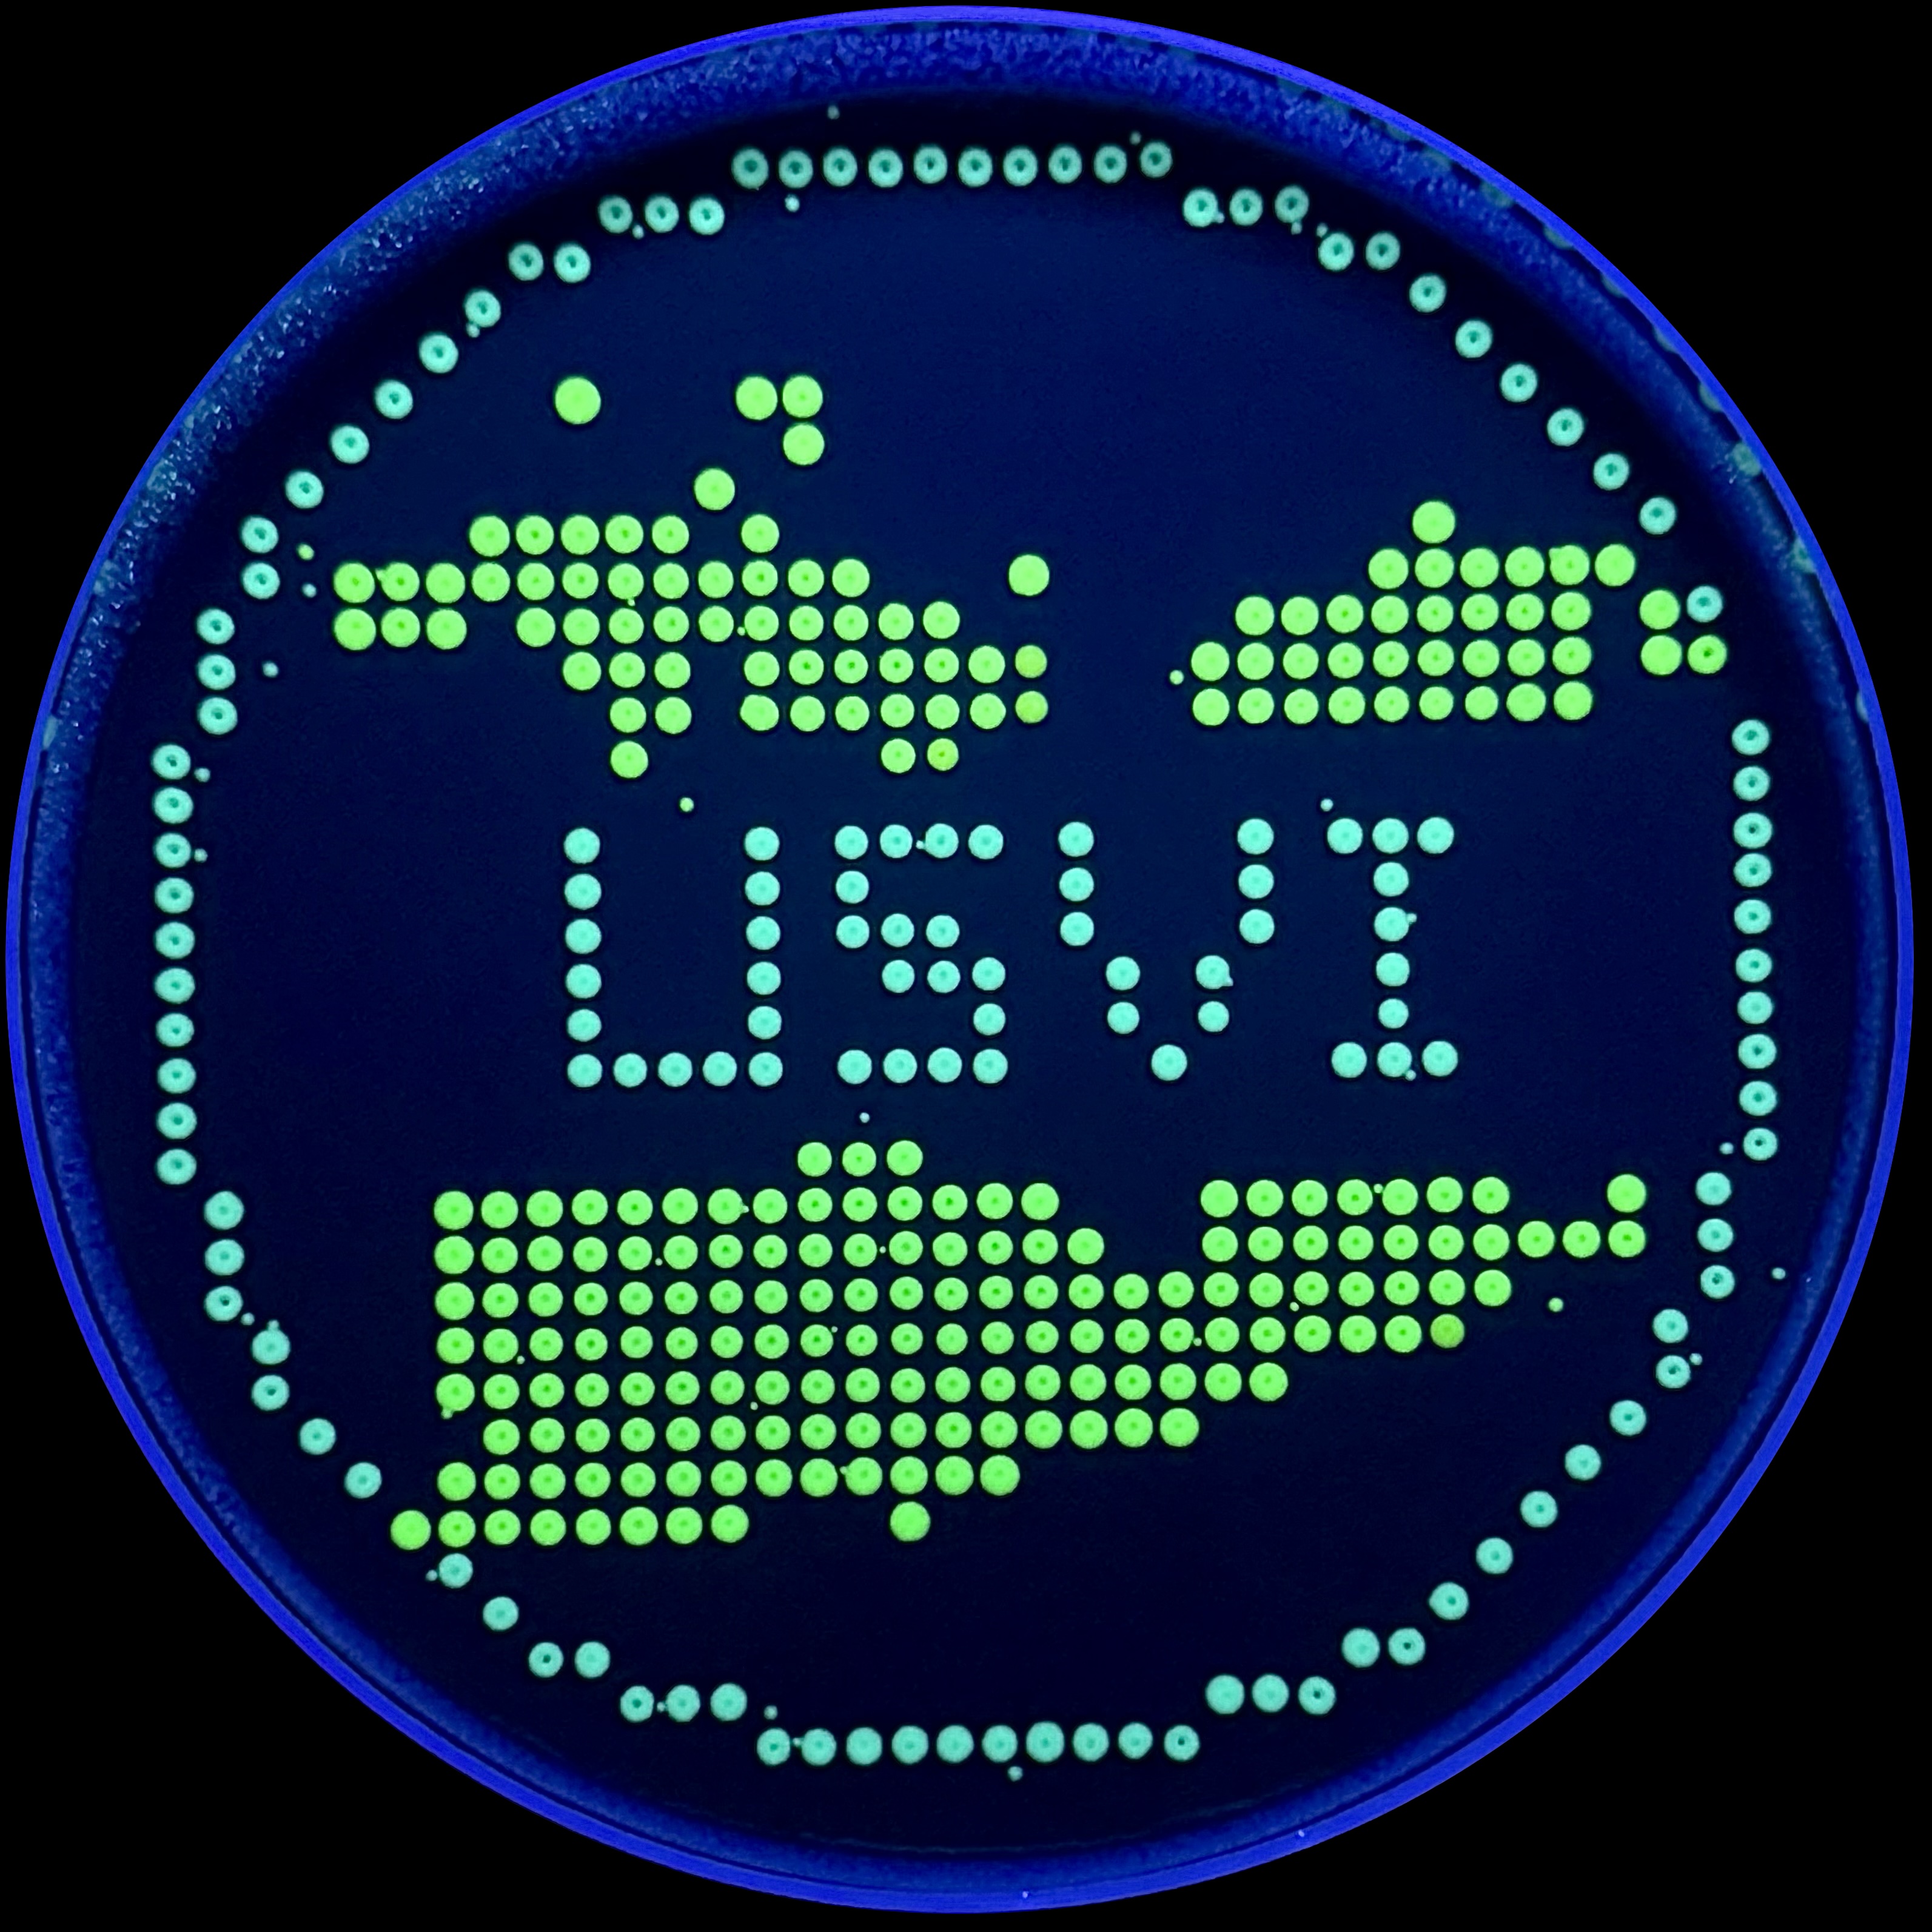
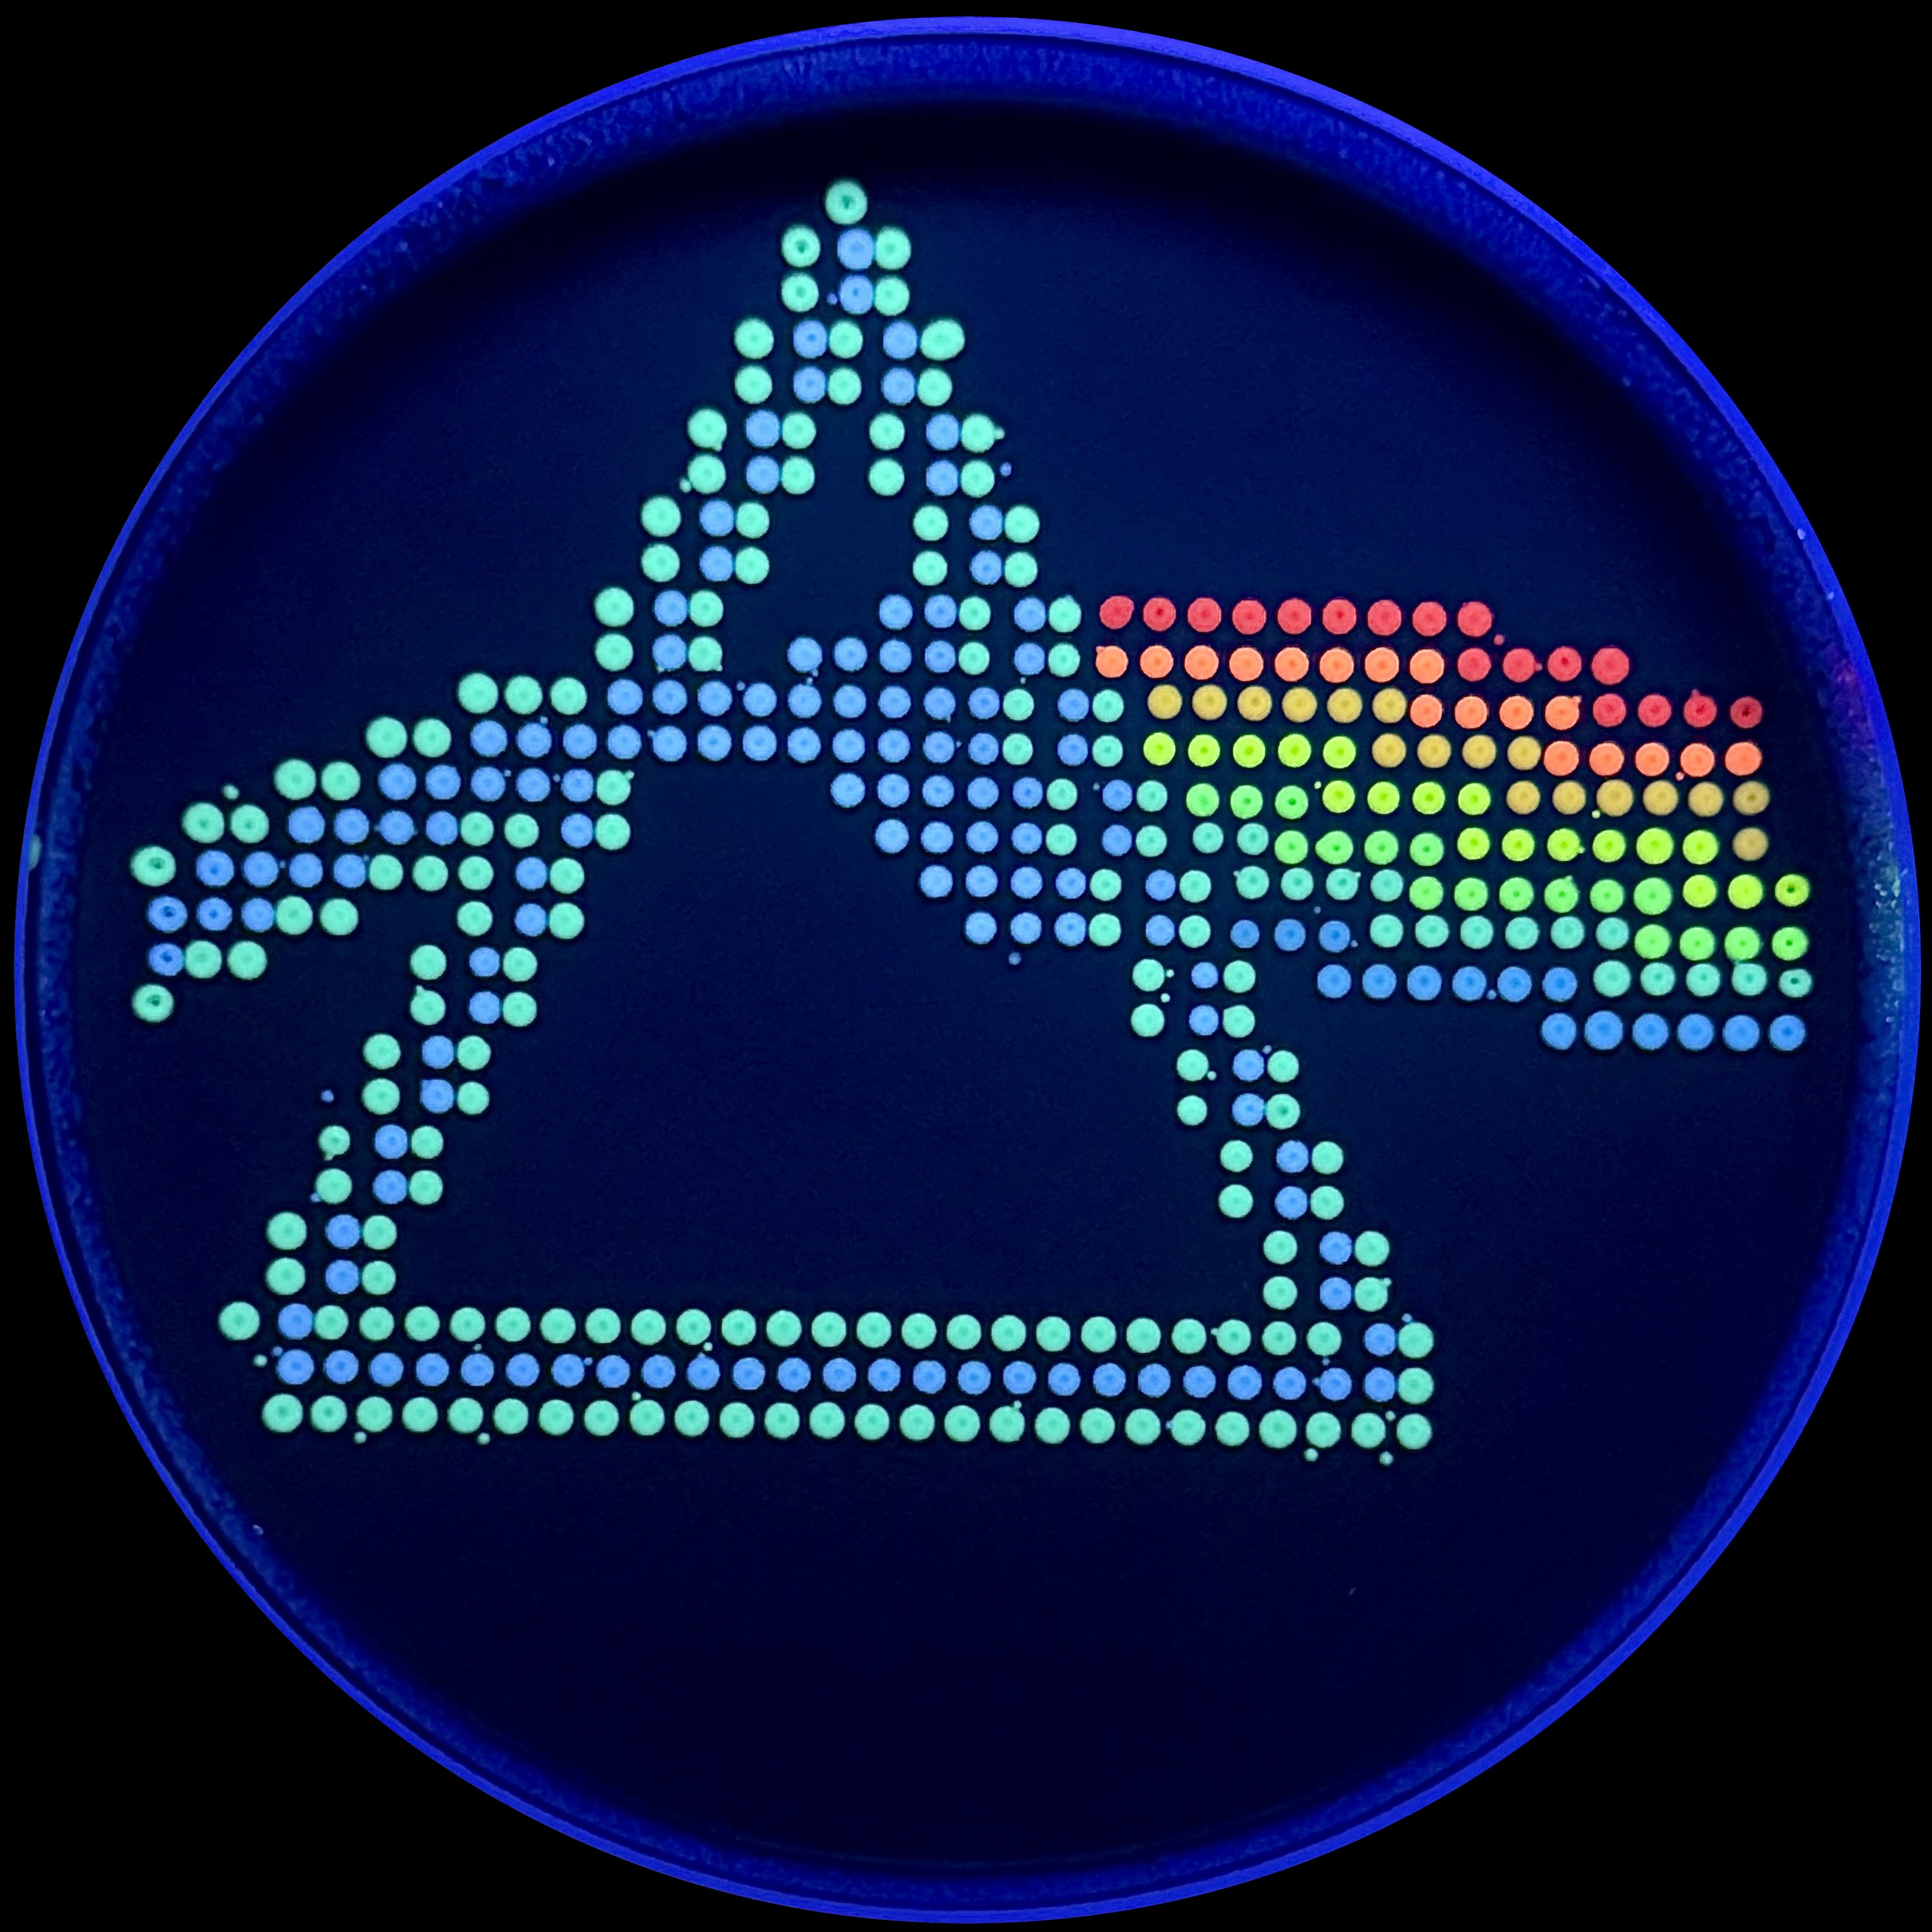
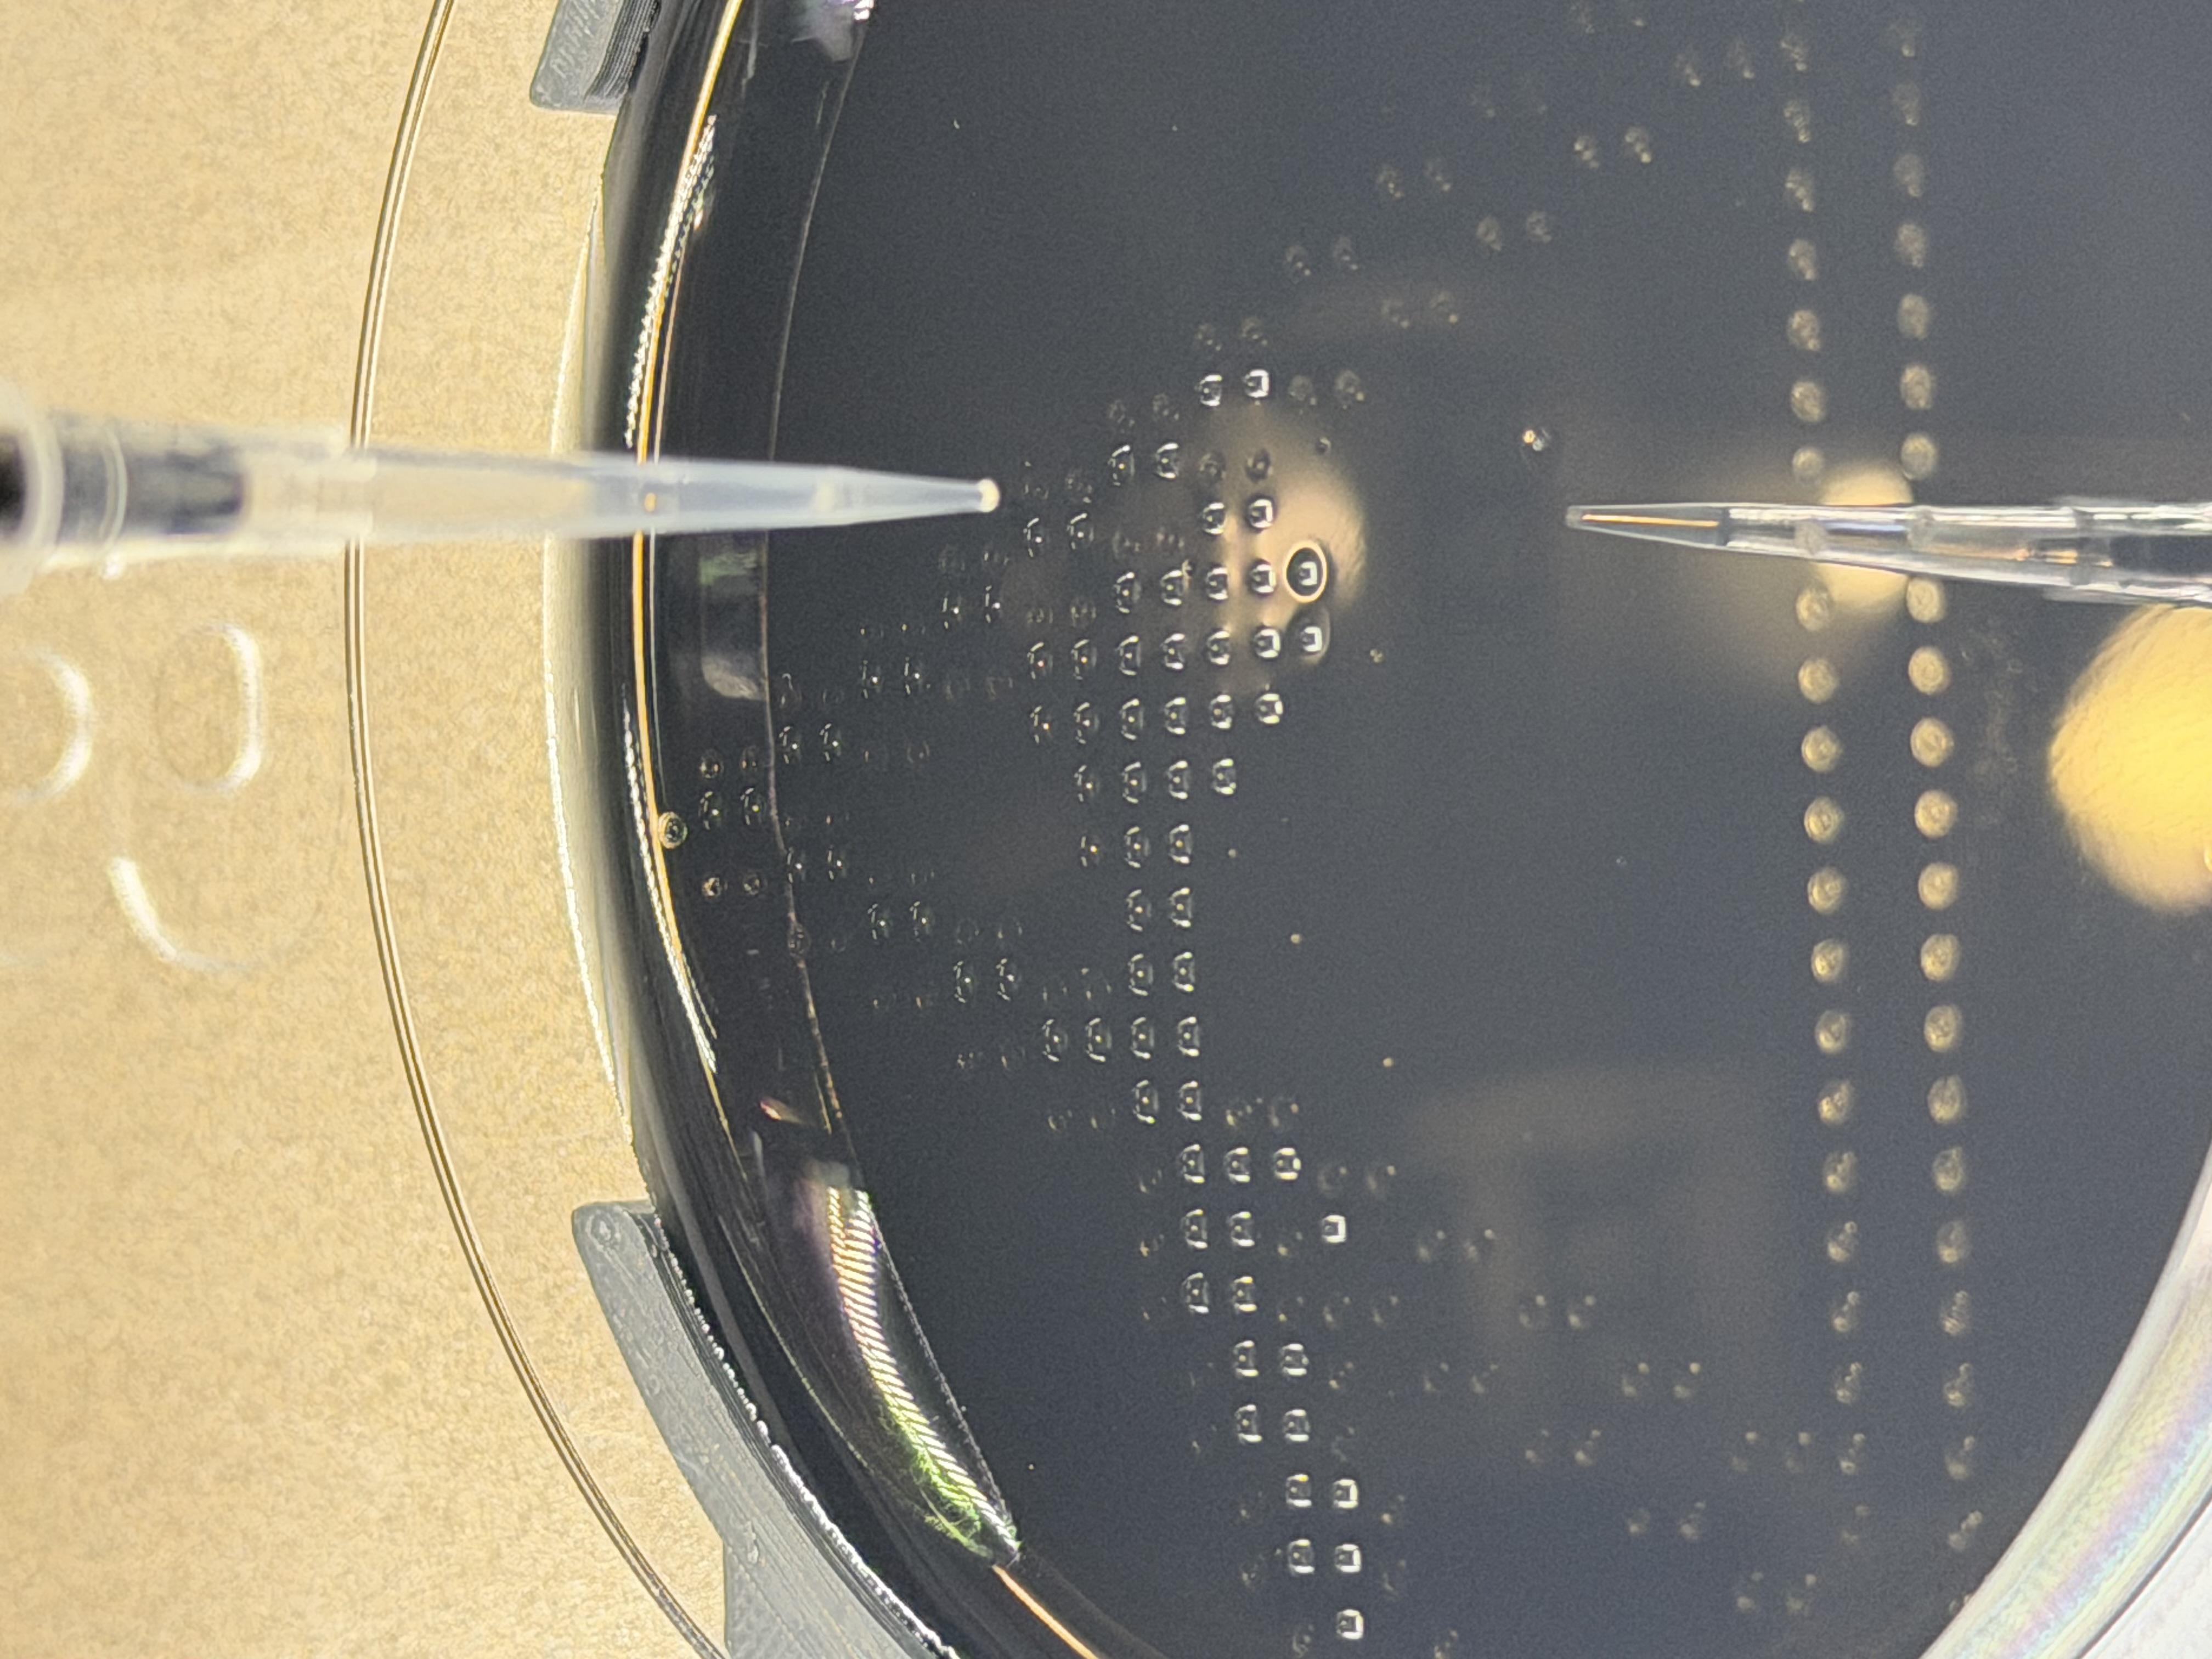
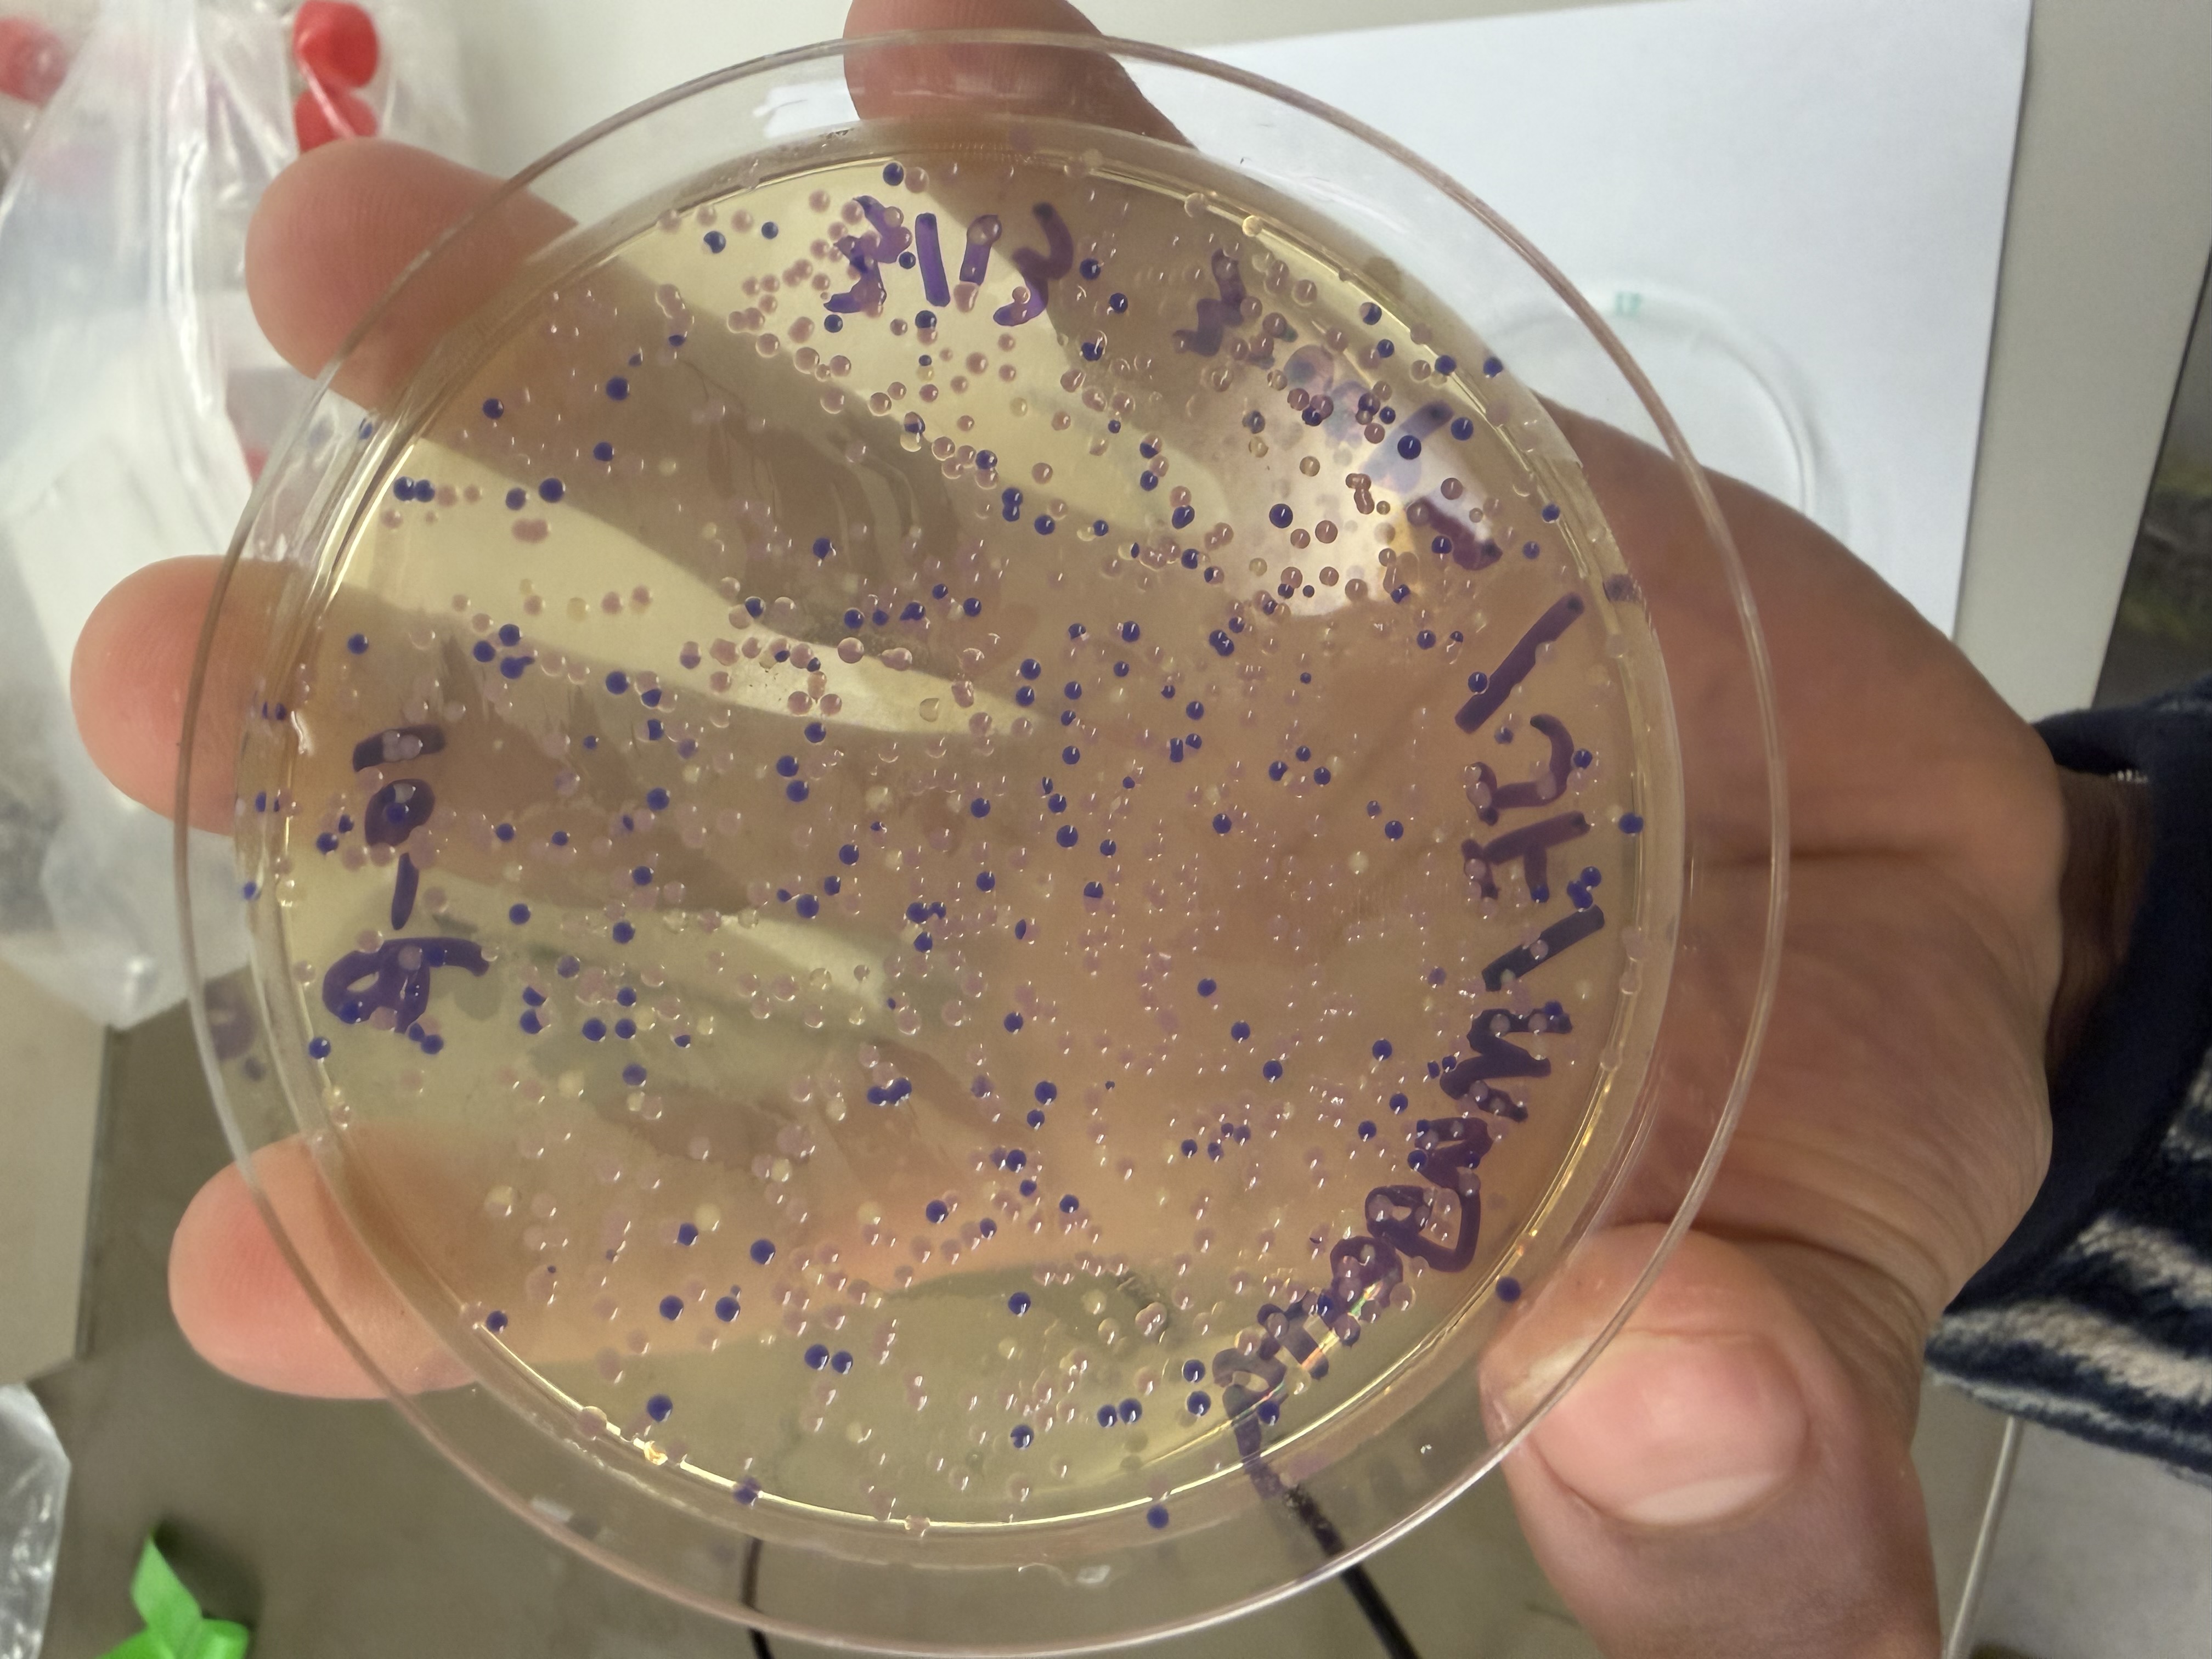
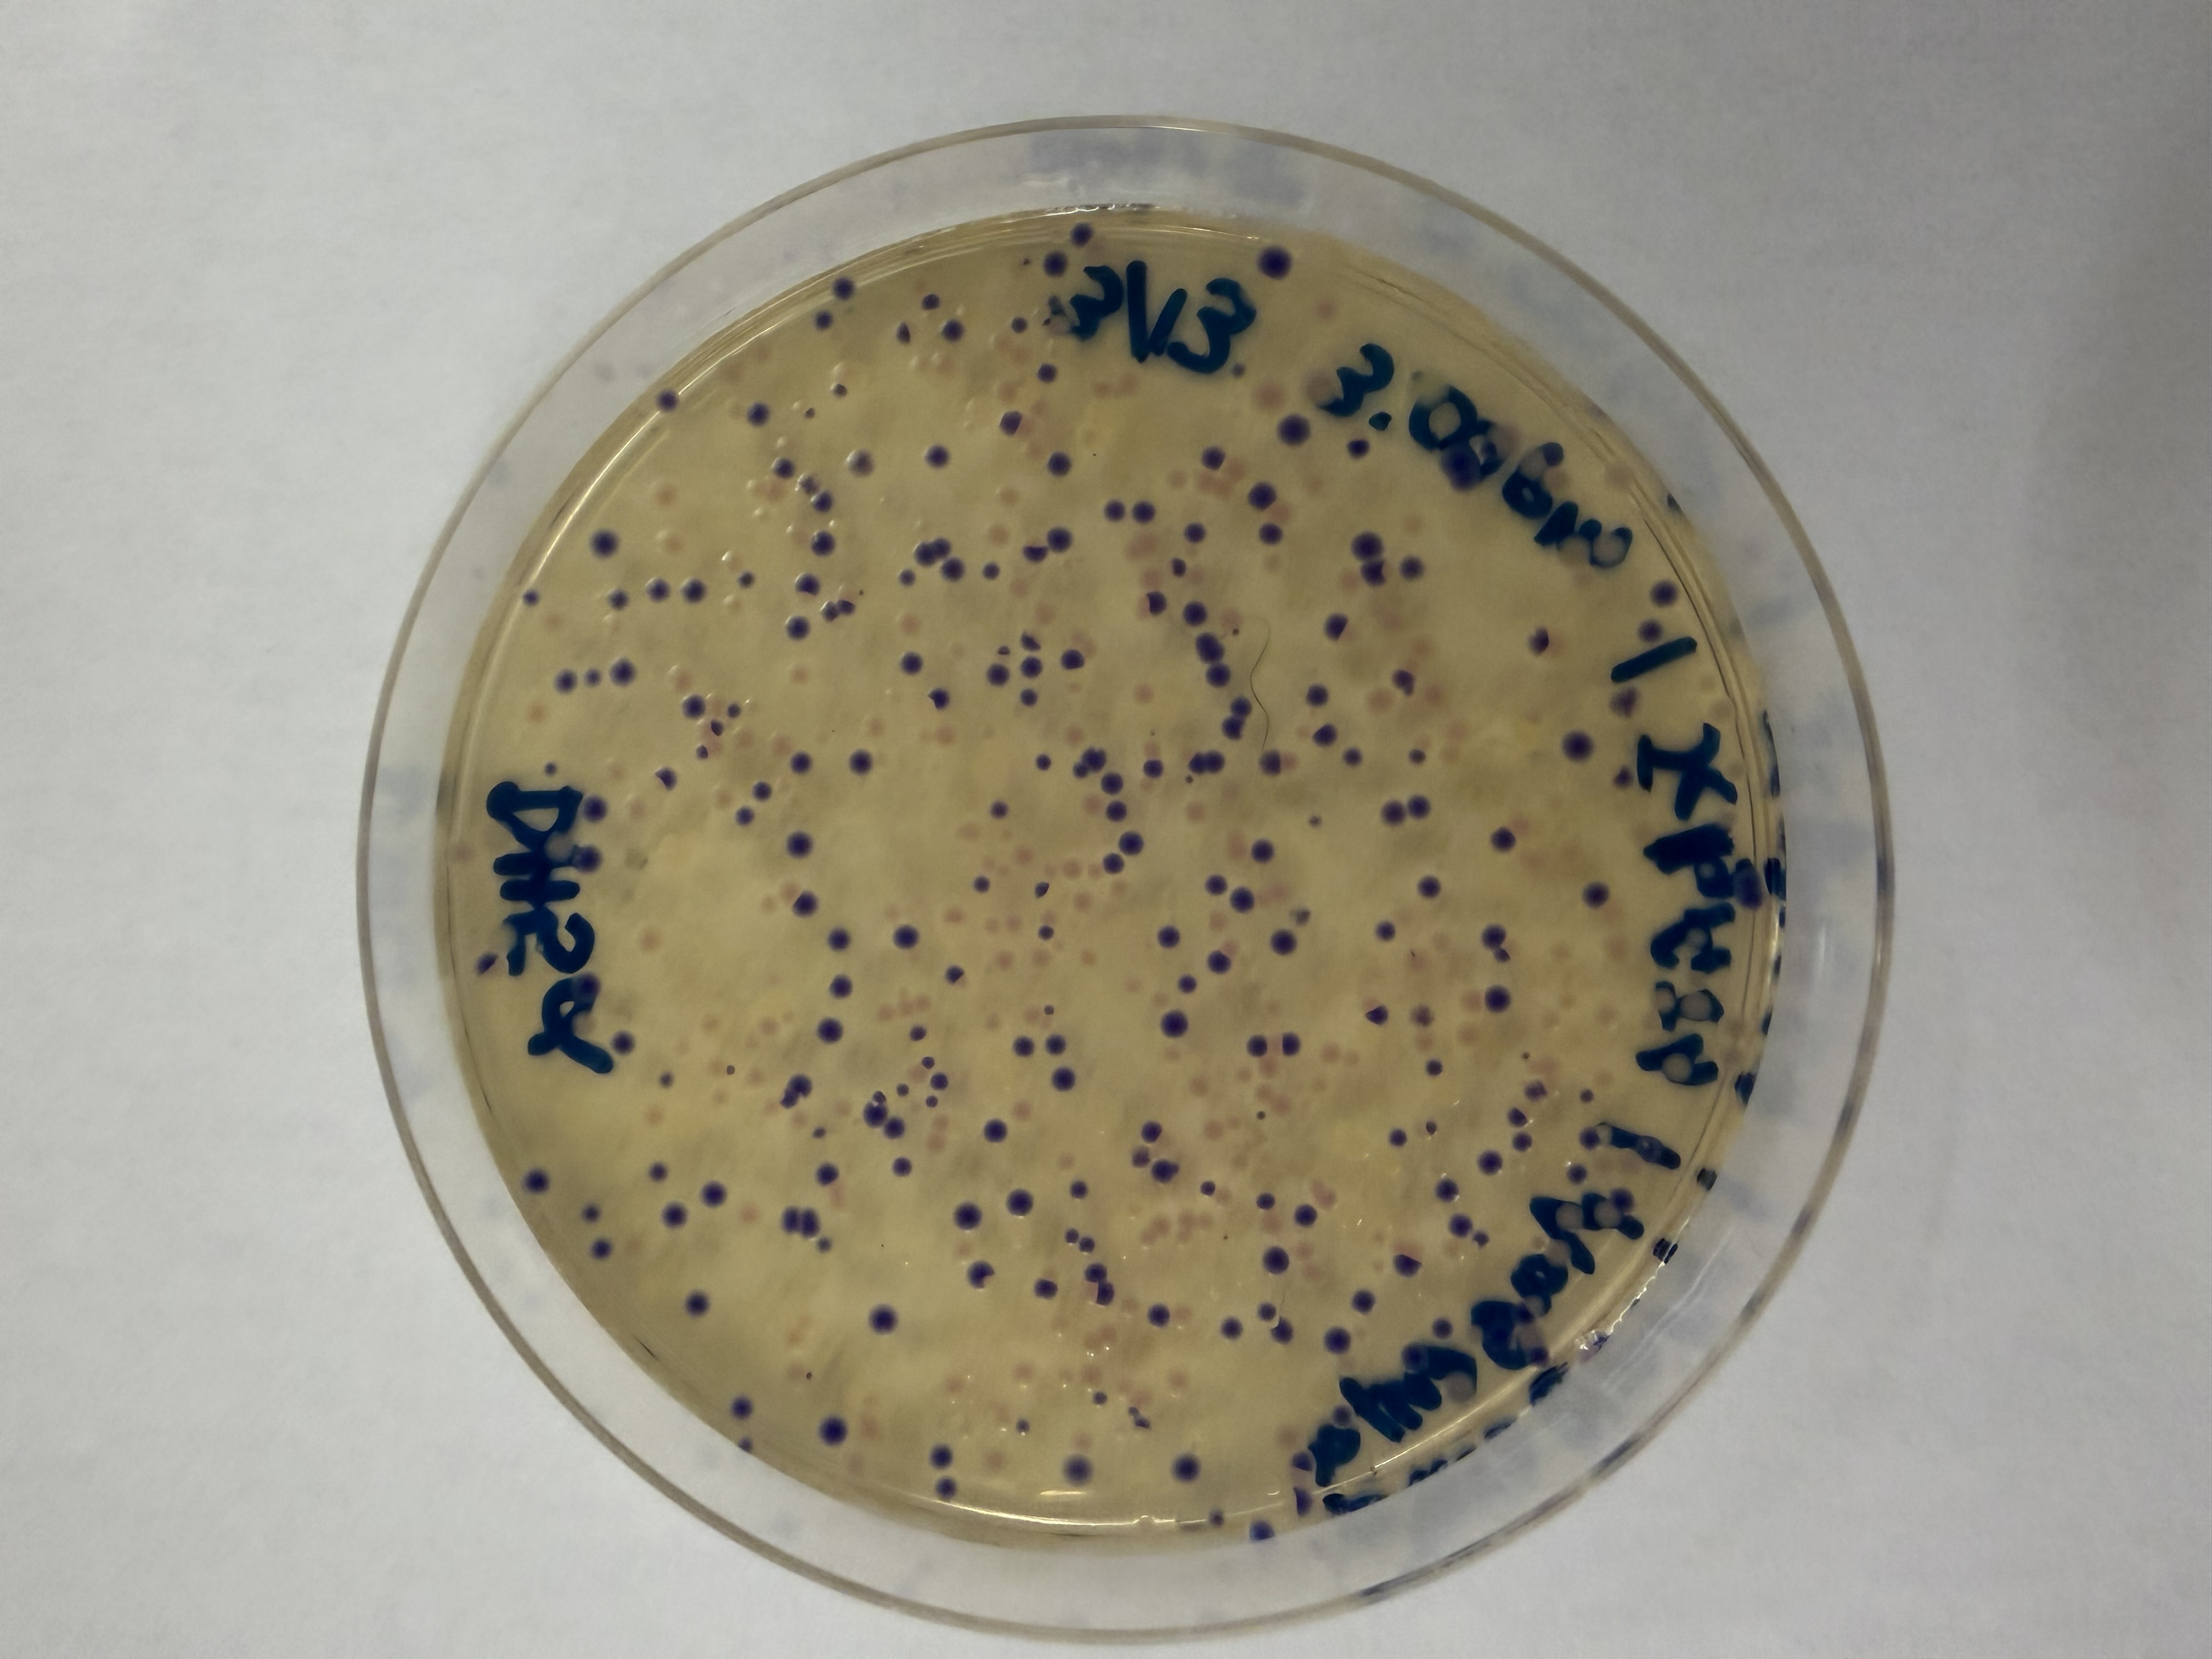
This week in lab, we used the Opentrons machine, giving us a taste of lab automation with an artistic twist. We pipetted flourescent, genetically engineered E.coli onto agar mixed with activated charcoal to create our design and canvas respectively. After a 16 hour incubation period, we were able to see images of our results under UV light! I decided to make two designs, one of the US Virgin Islands to pay homage to where I’m from, and the other was the Dark Side of the Moon Album Cover, as I thought it used a good variety of colors. The robot moved from top left to bottom right, which prompted a discussion with Ronan about the most optimal pathing system for the trajectory. The robot’s movement is controlled by a Python script, and Ronan created a website to generate the coordinates of each colored pixel, which the script implemented.
Protein Selection Briefly describe the protein you selected and why you selected it. Again, continuing with my idea for designing a carbon sequestration system, I am going to be looking at Rubisco, the most abundant protein on earth. Rubisco catalyzes photosynthesis in plants, converting atmospheric CO2 into an organic three-carbon acid that eventually is built up into sugars for plant growth. It is made of 8 large subunits and 8 small subunits.
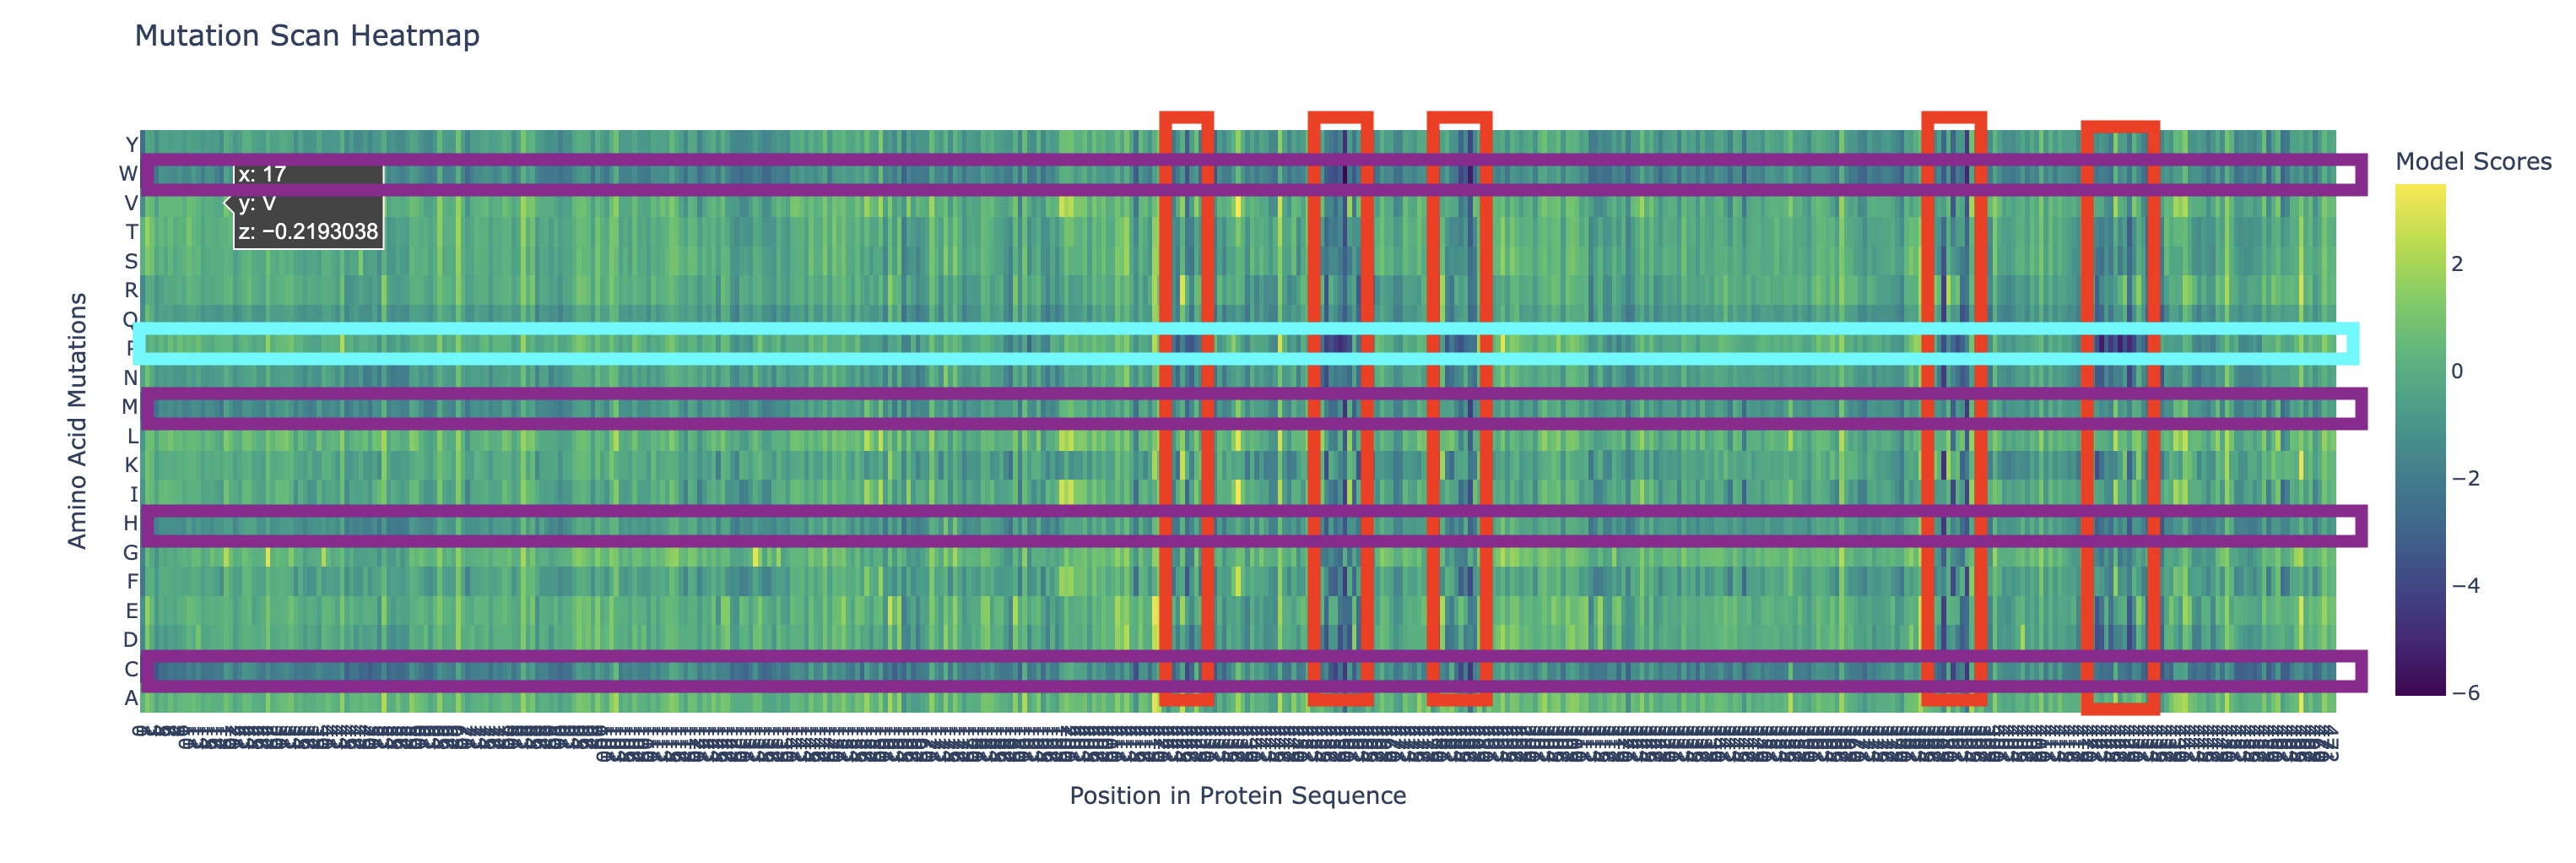
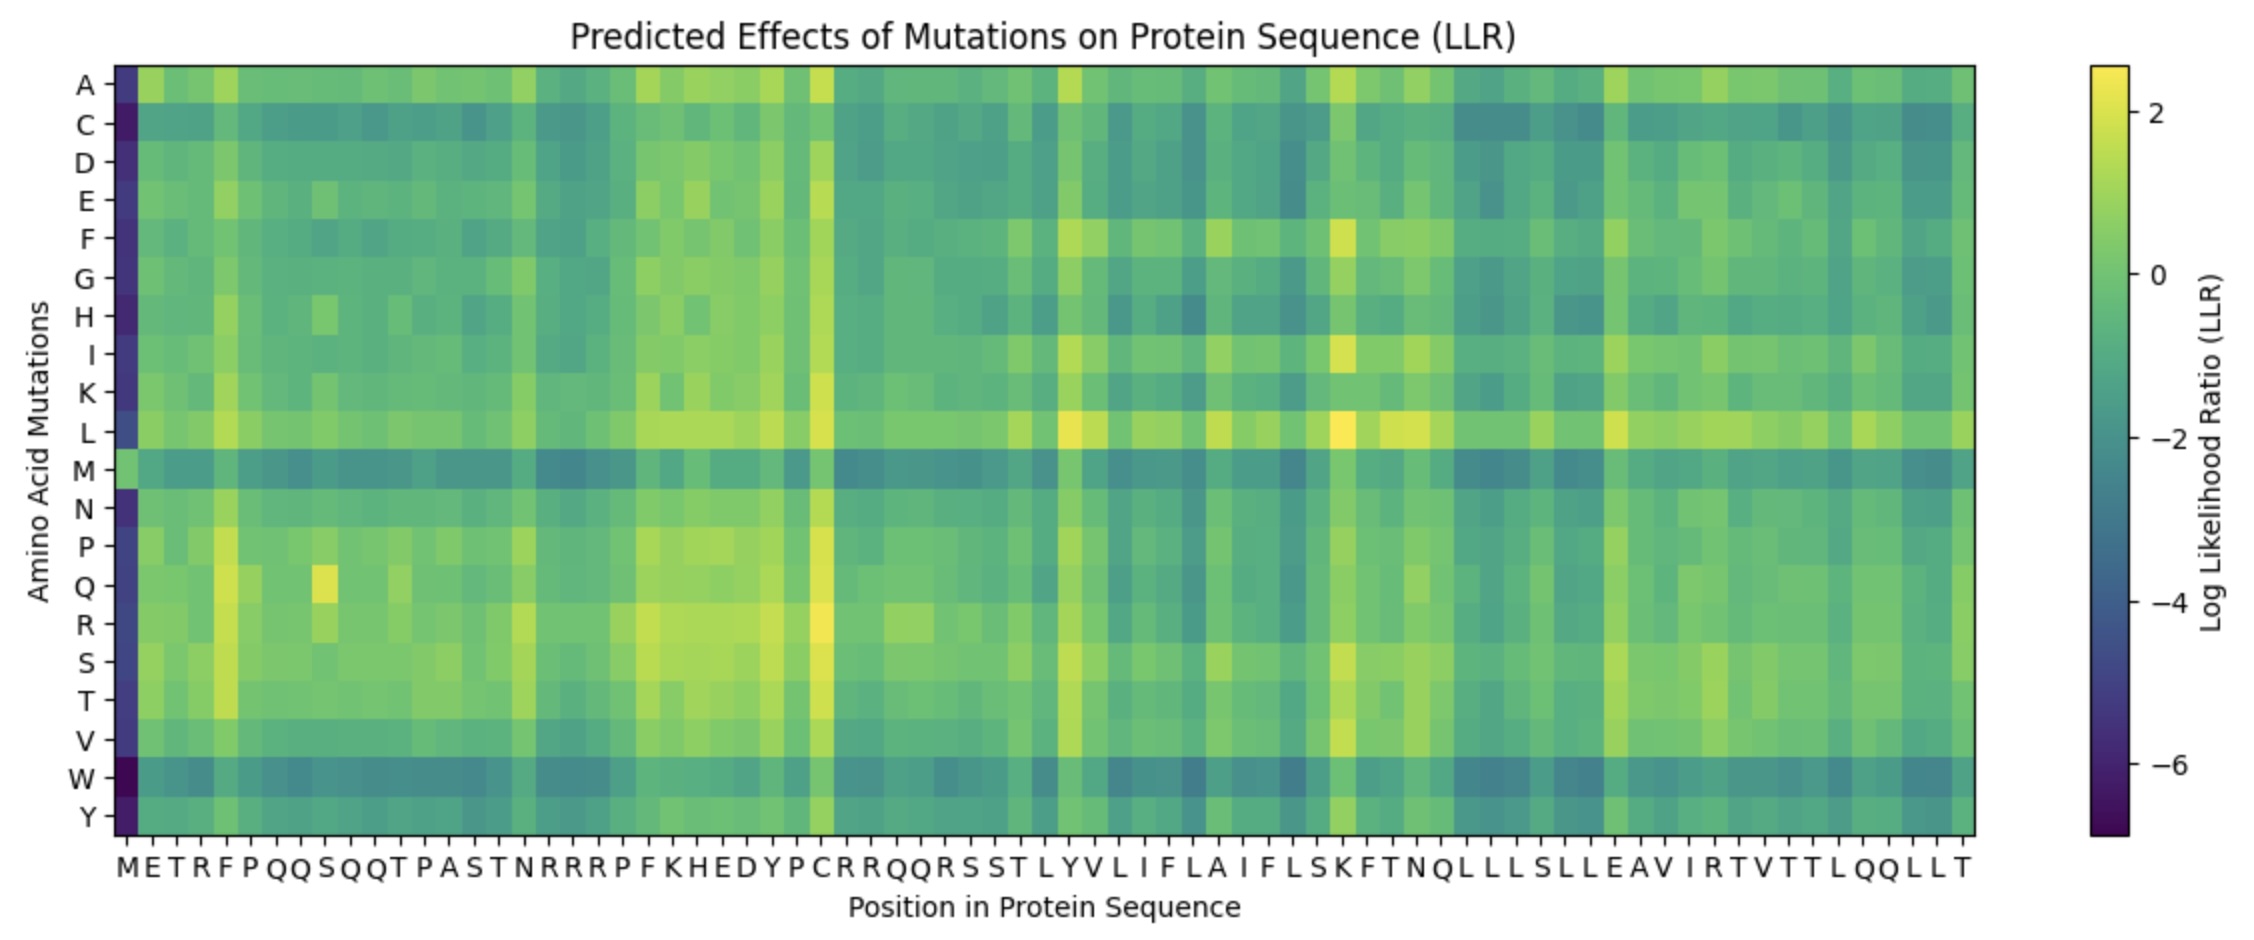
Lab Option 1: L-Protein Mutational Analysis Experimental Validation & DMS This lab provides a Deep Mutational Scanning (DMS) style validation of the L-Protein. By cross-referencing experimental lysis results—where a score of 1 indicates functional lysis and 0 indicates non-functional—with the Log-Likelihood Ratio (LLR) Heatmap generated via ESM2, we can assess the predictive power of protein language models.
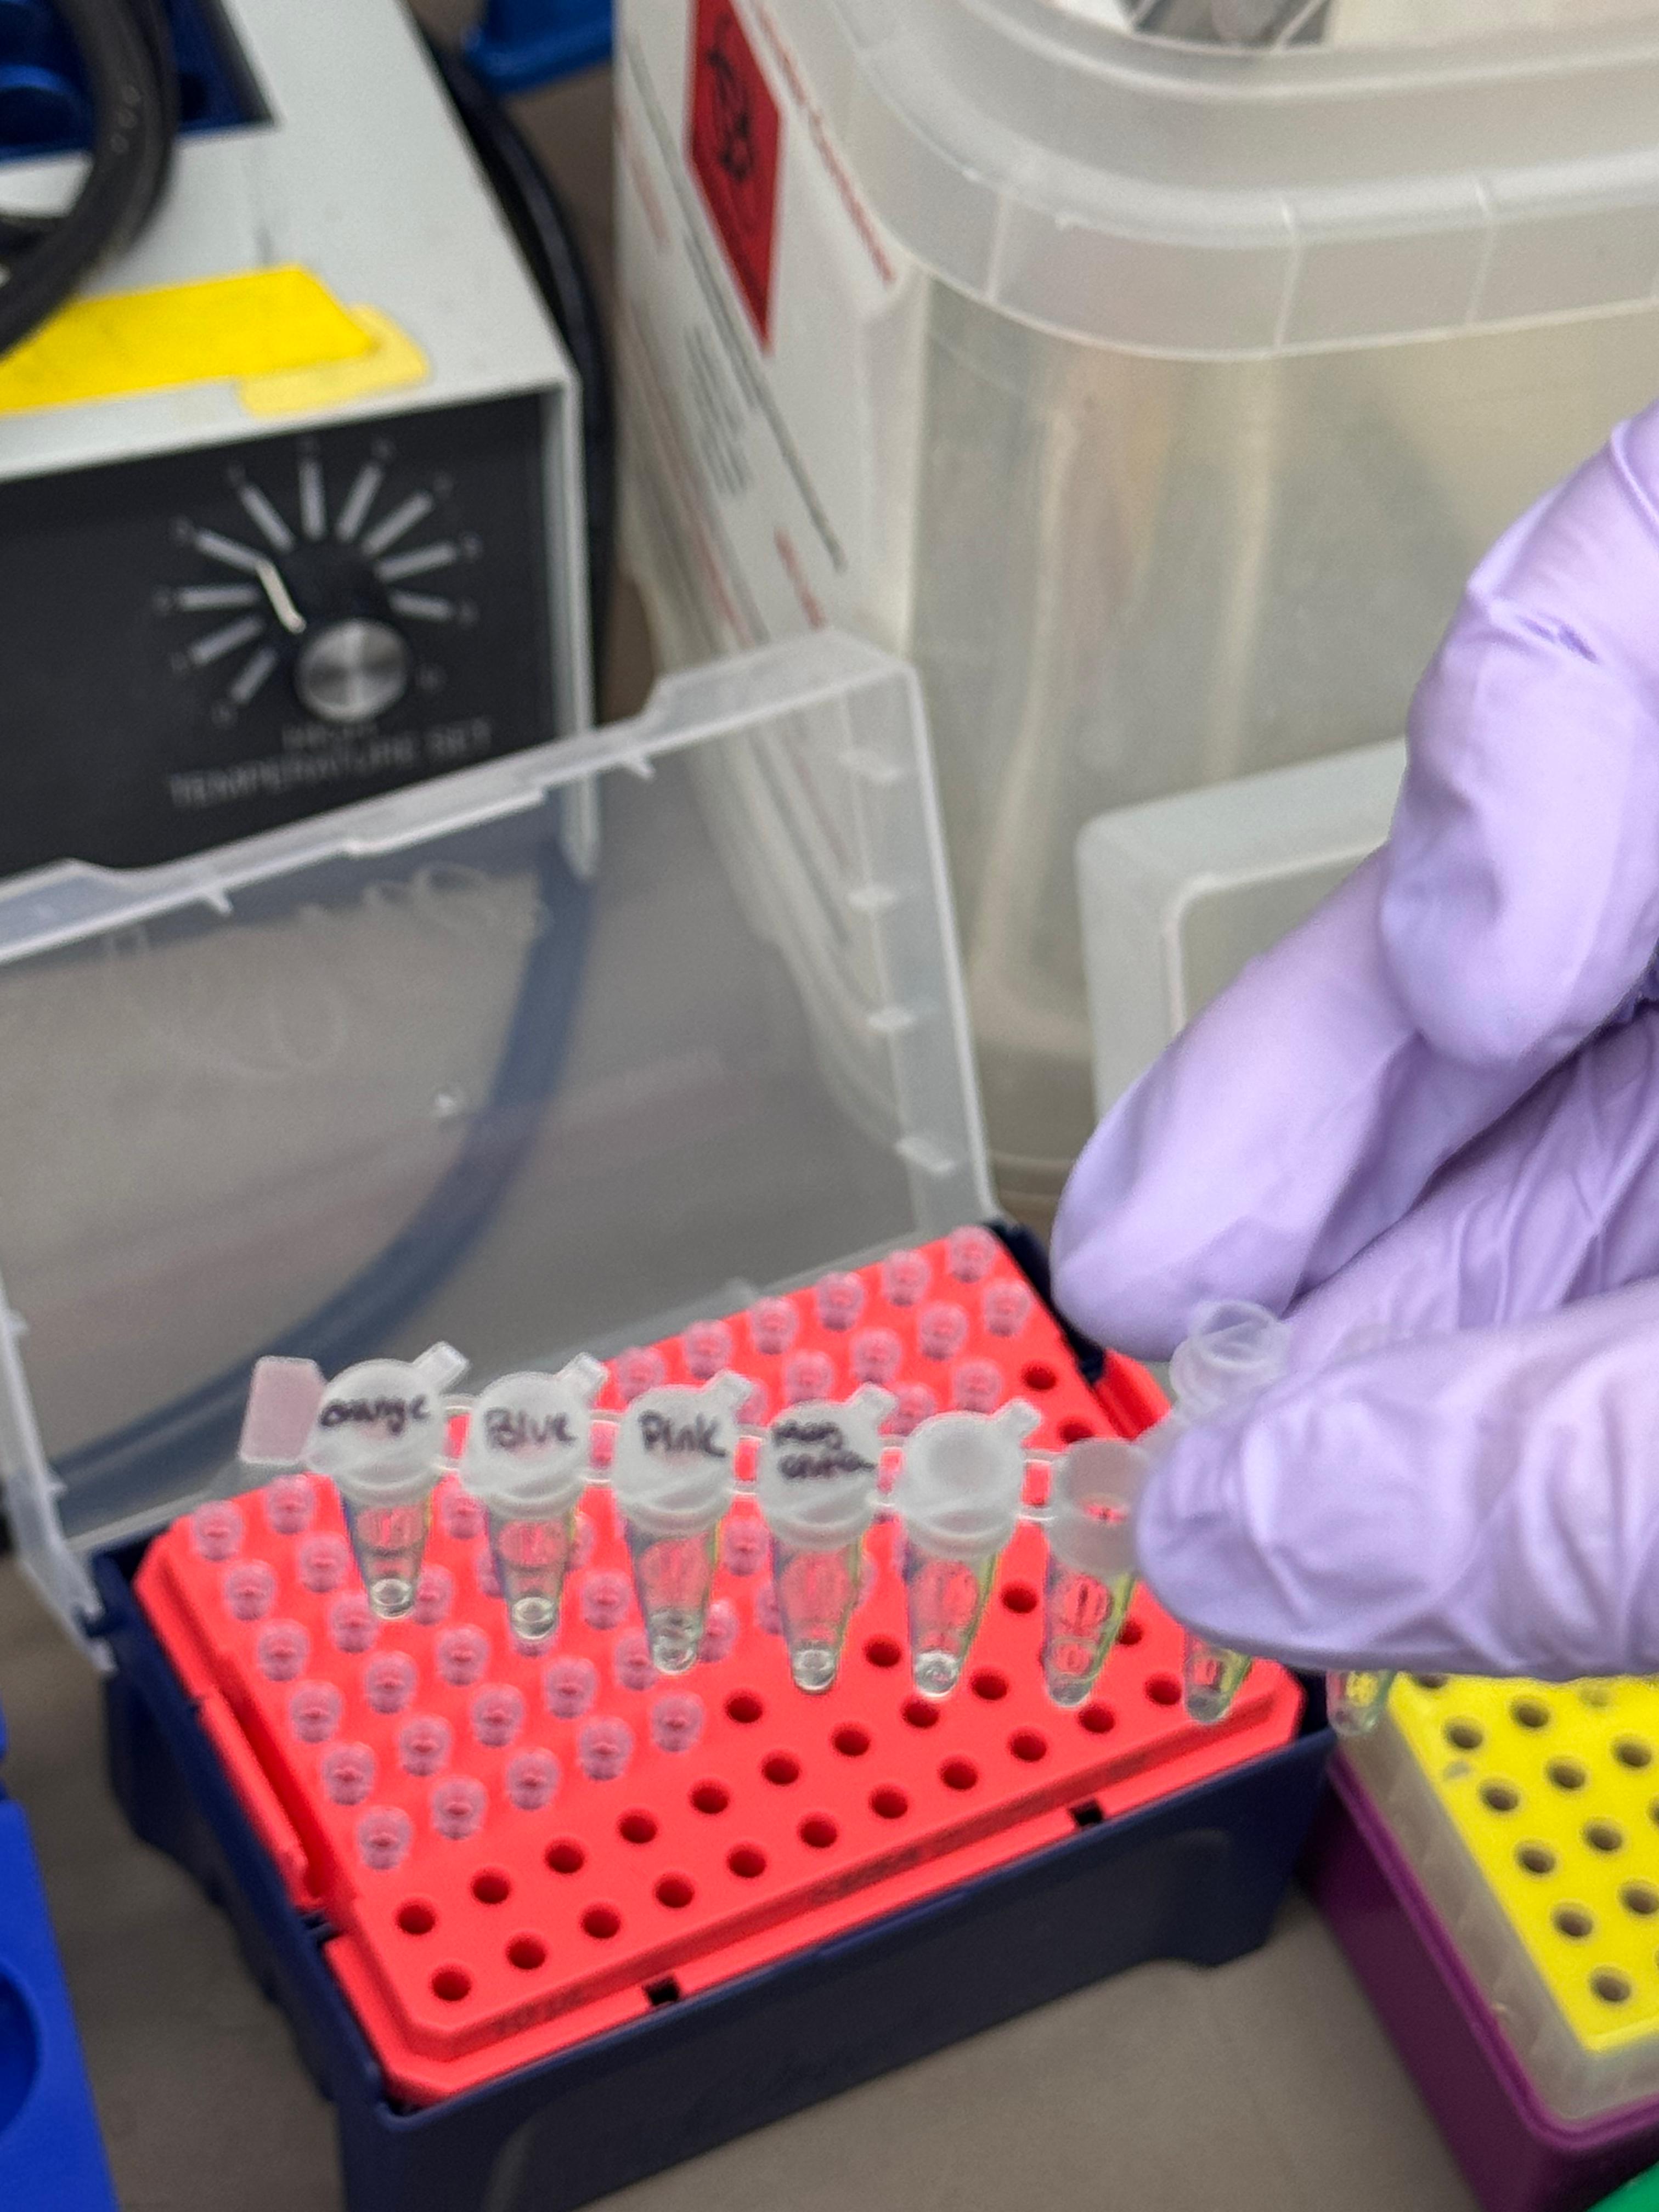
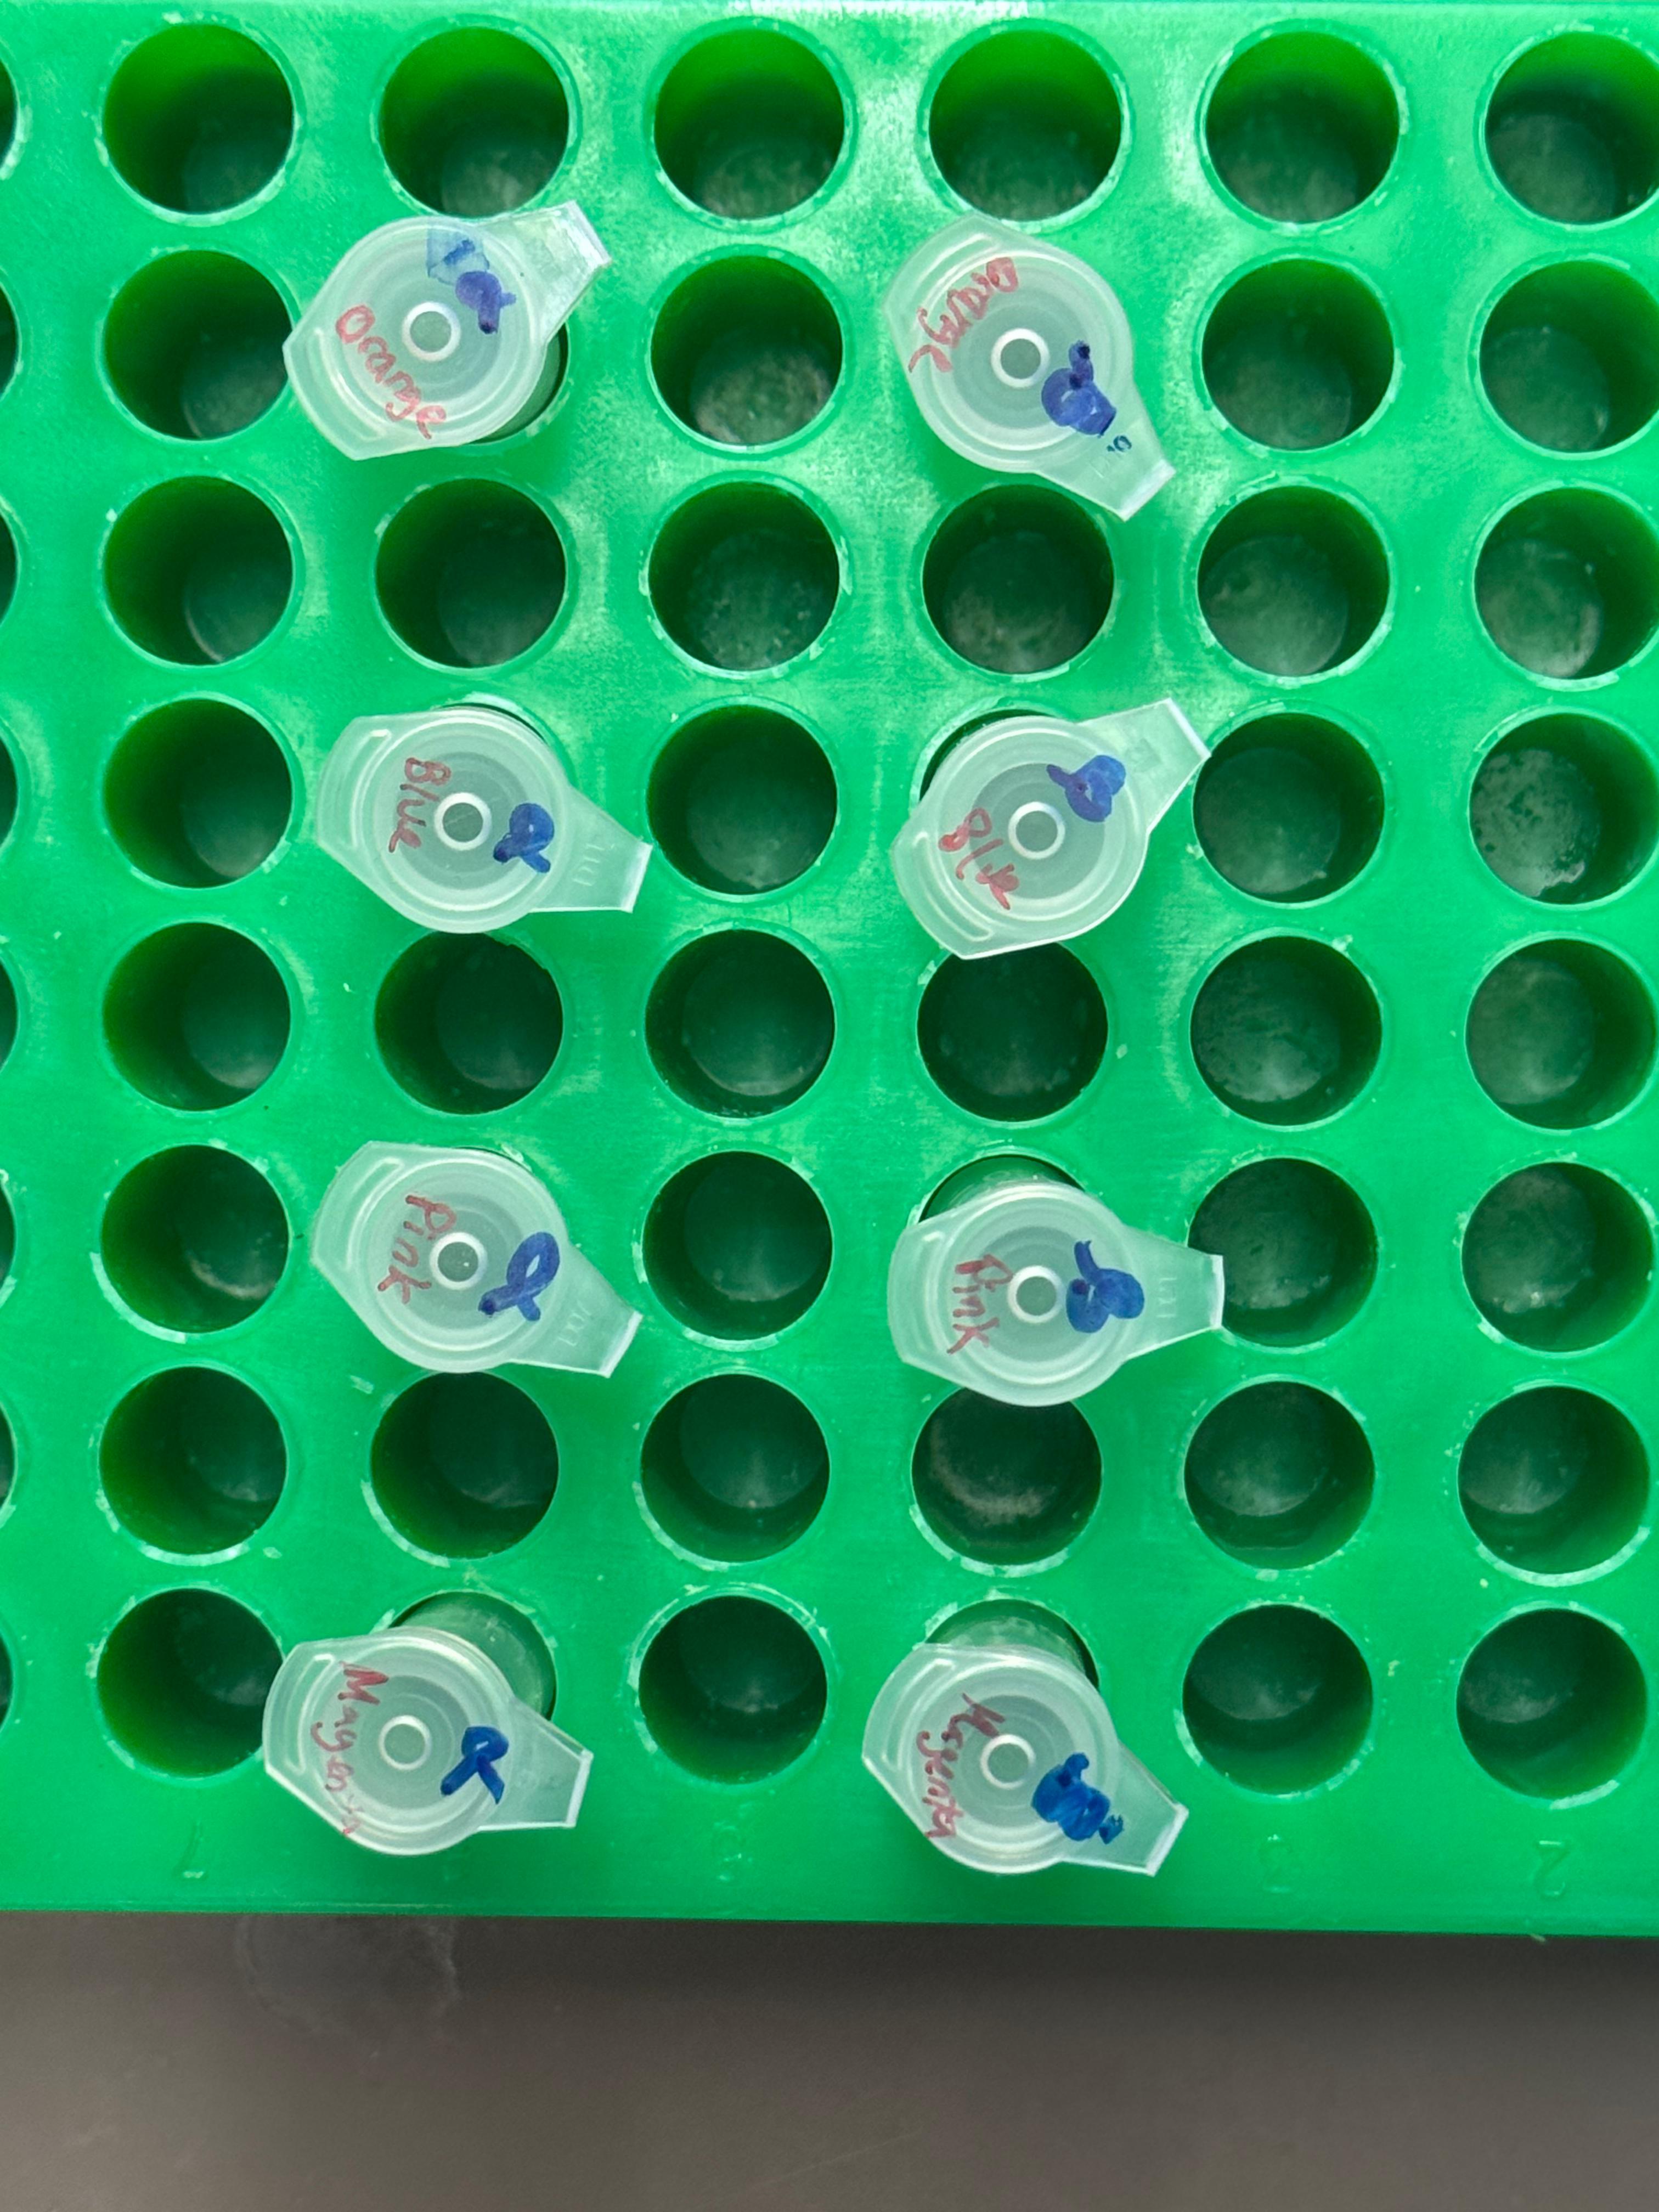
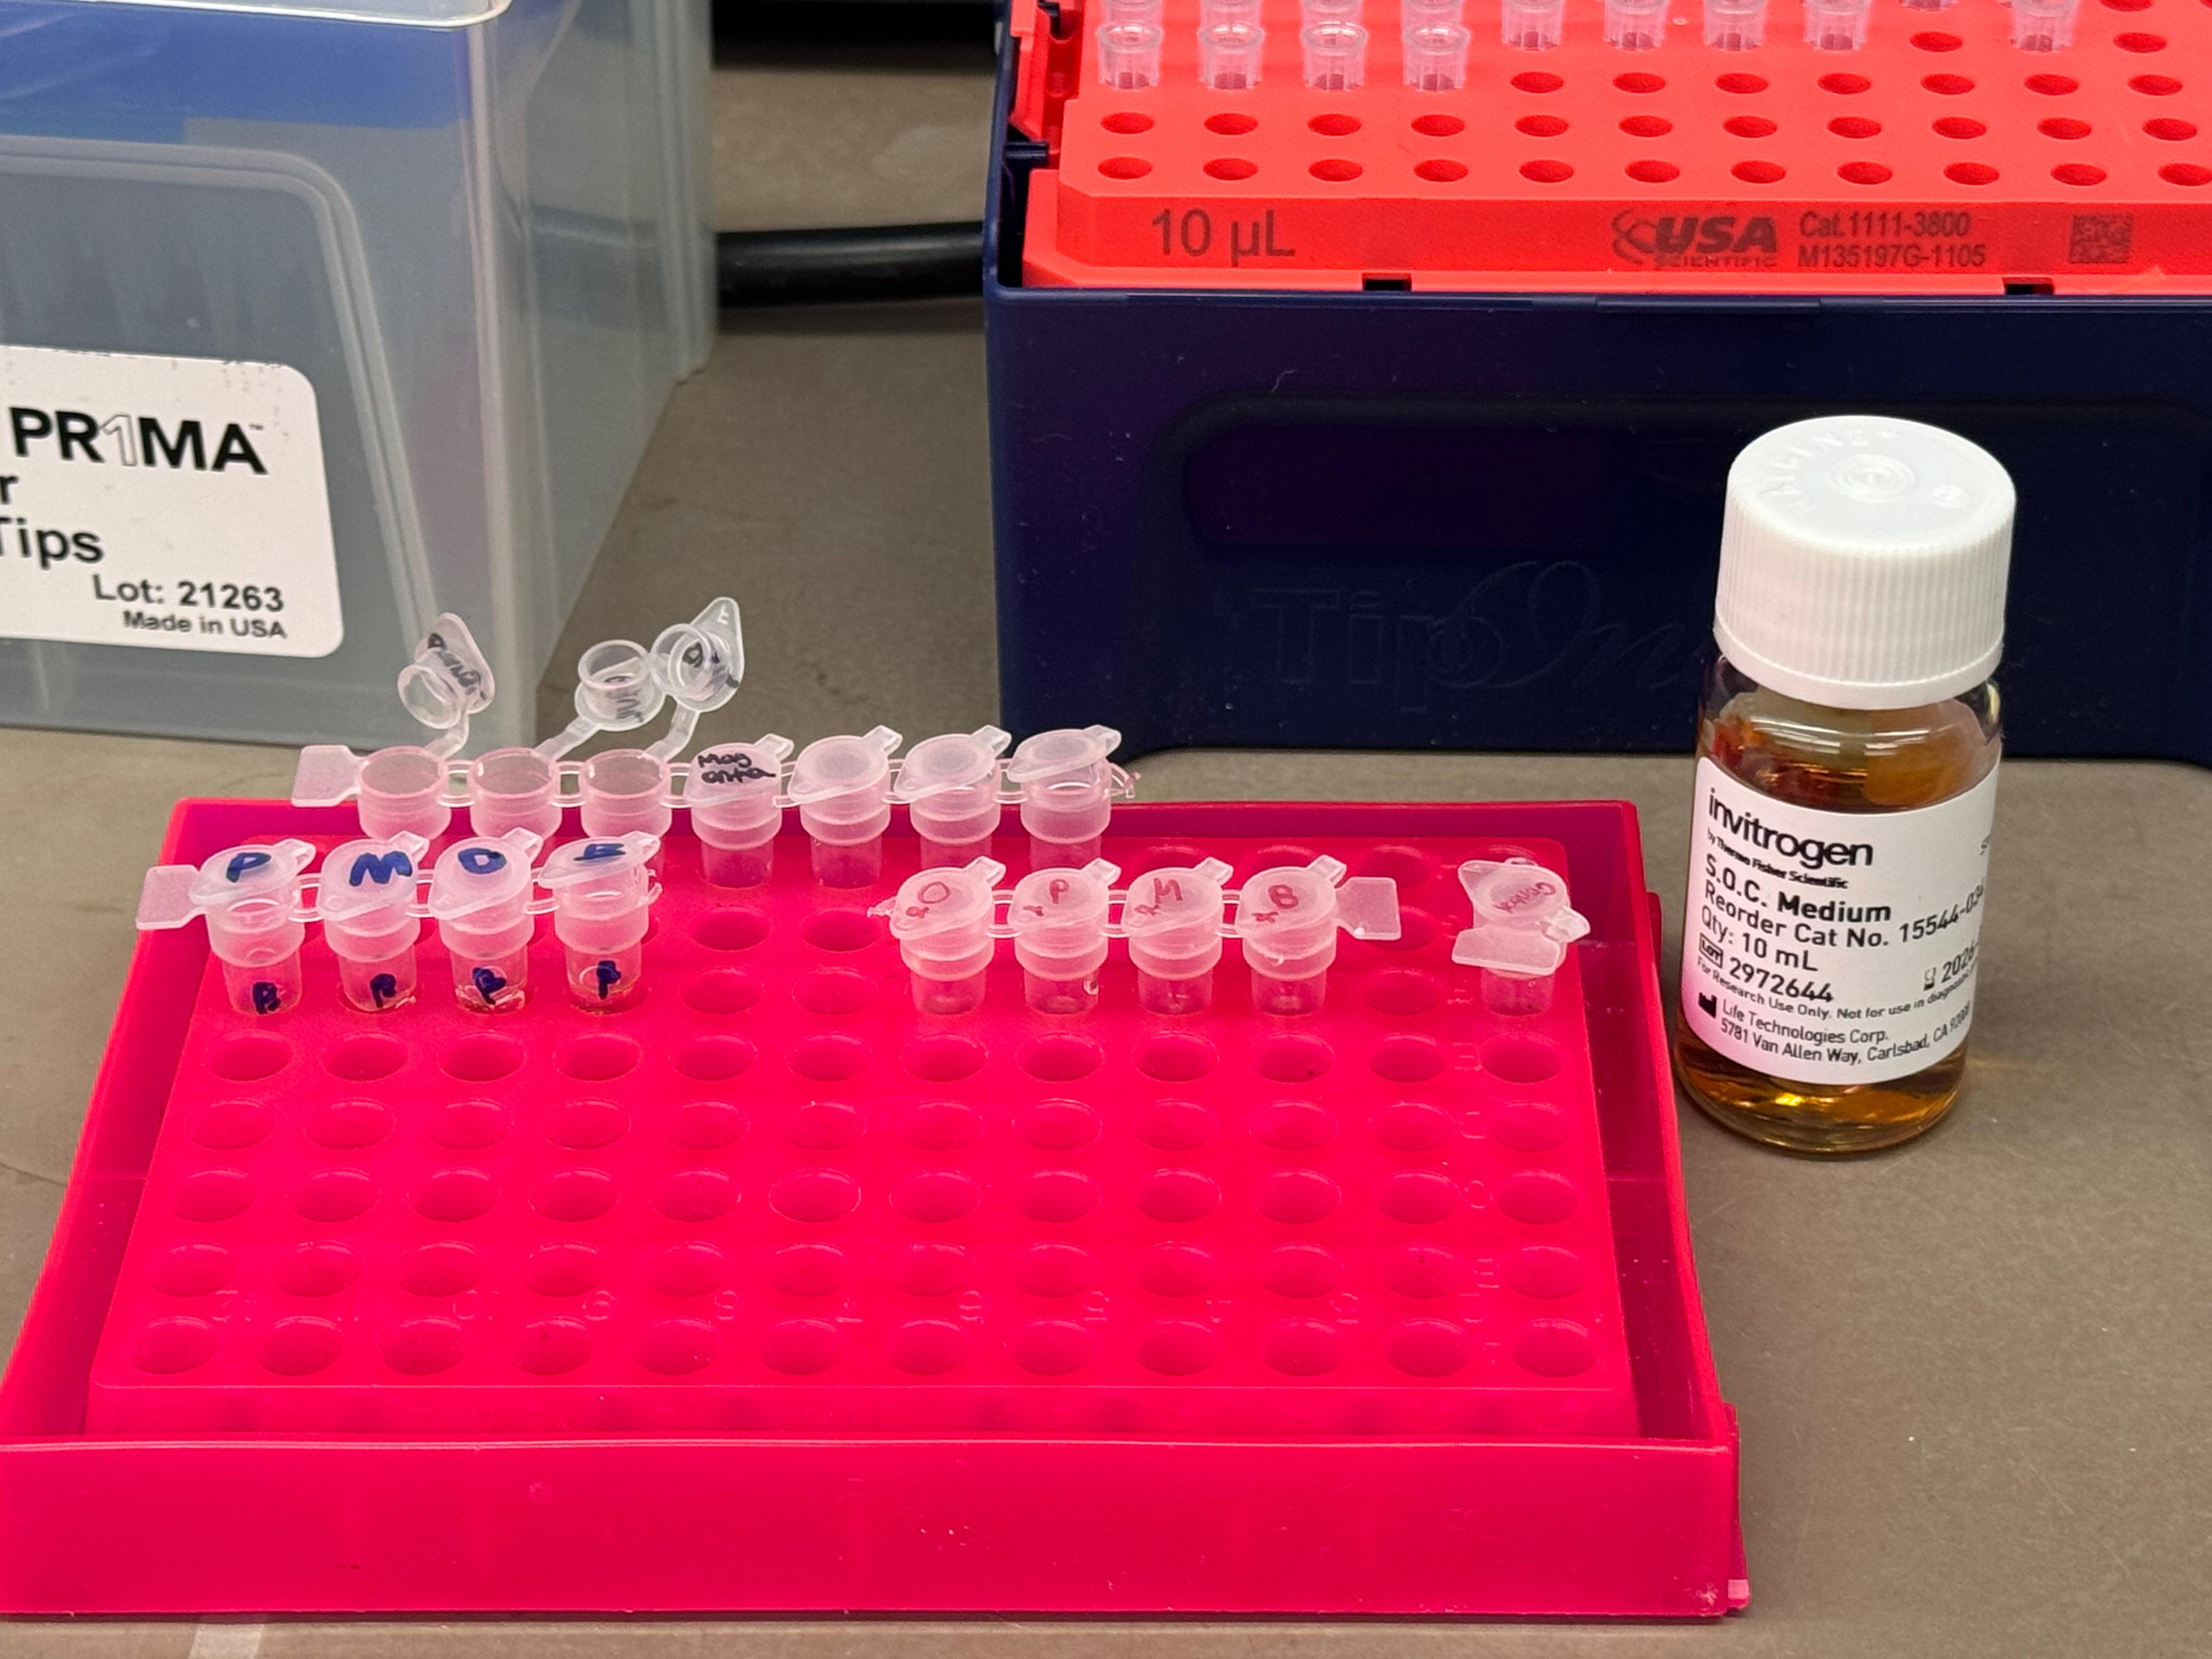
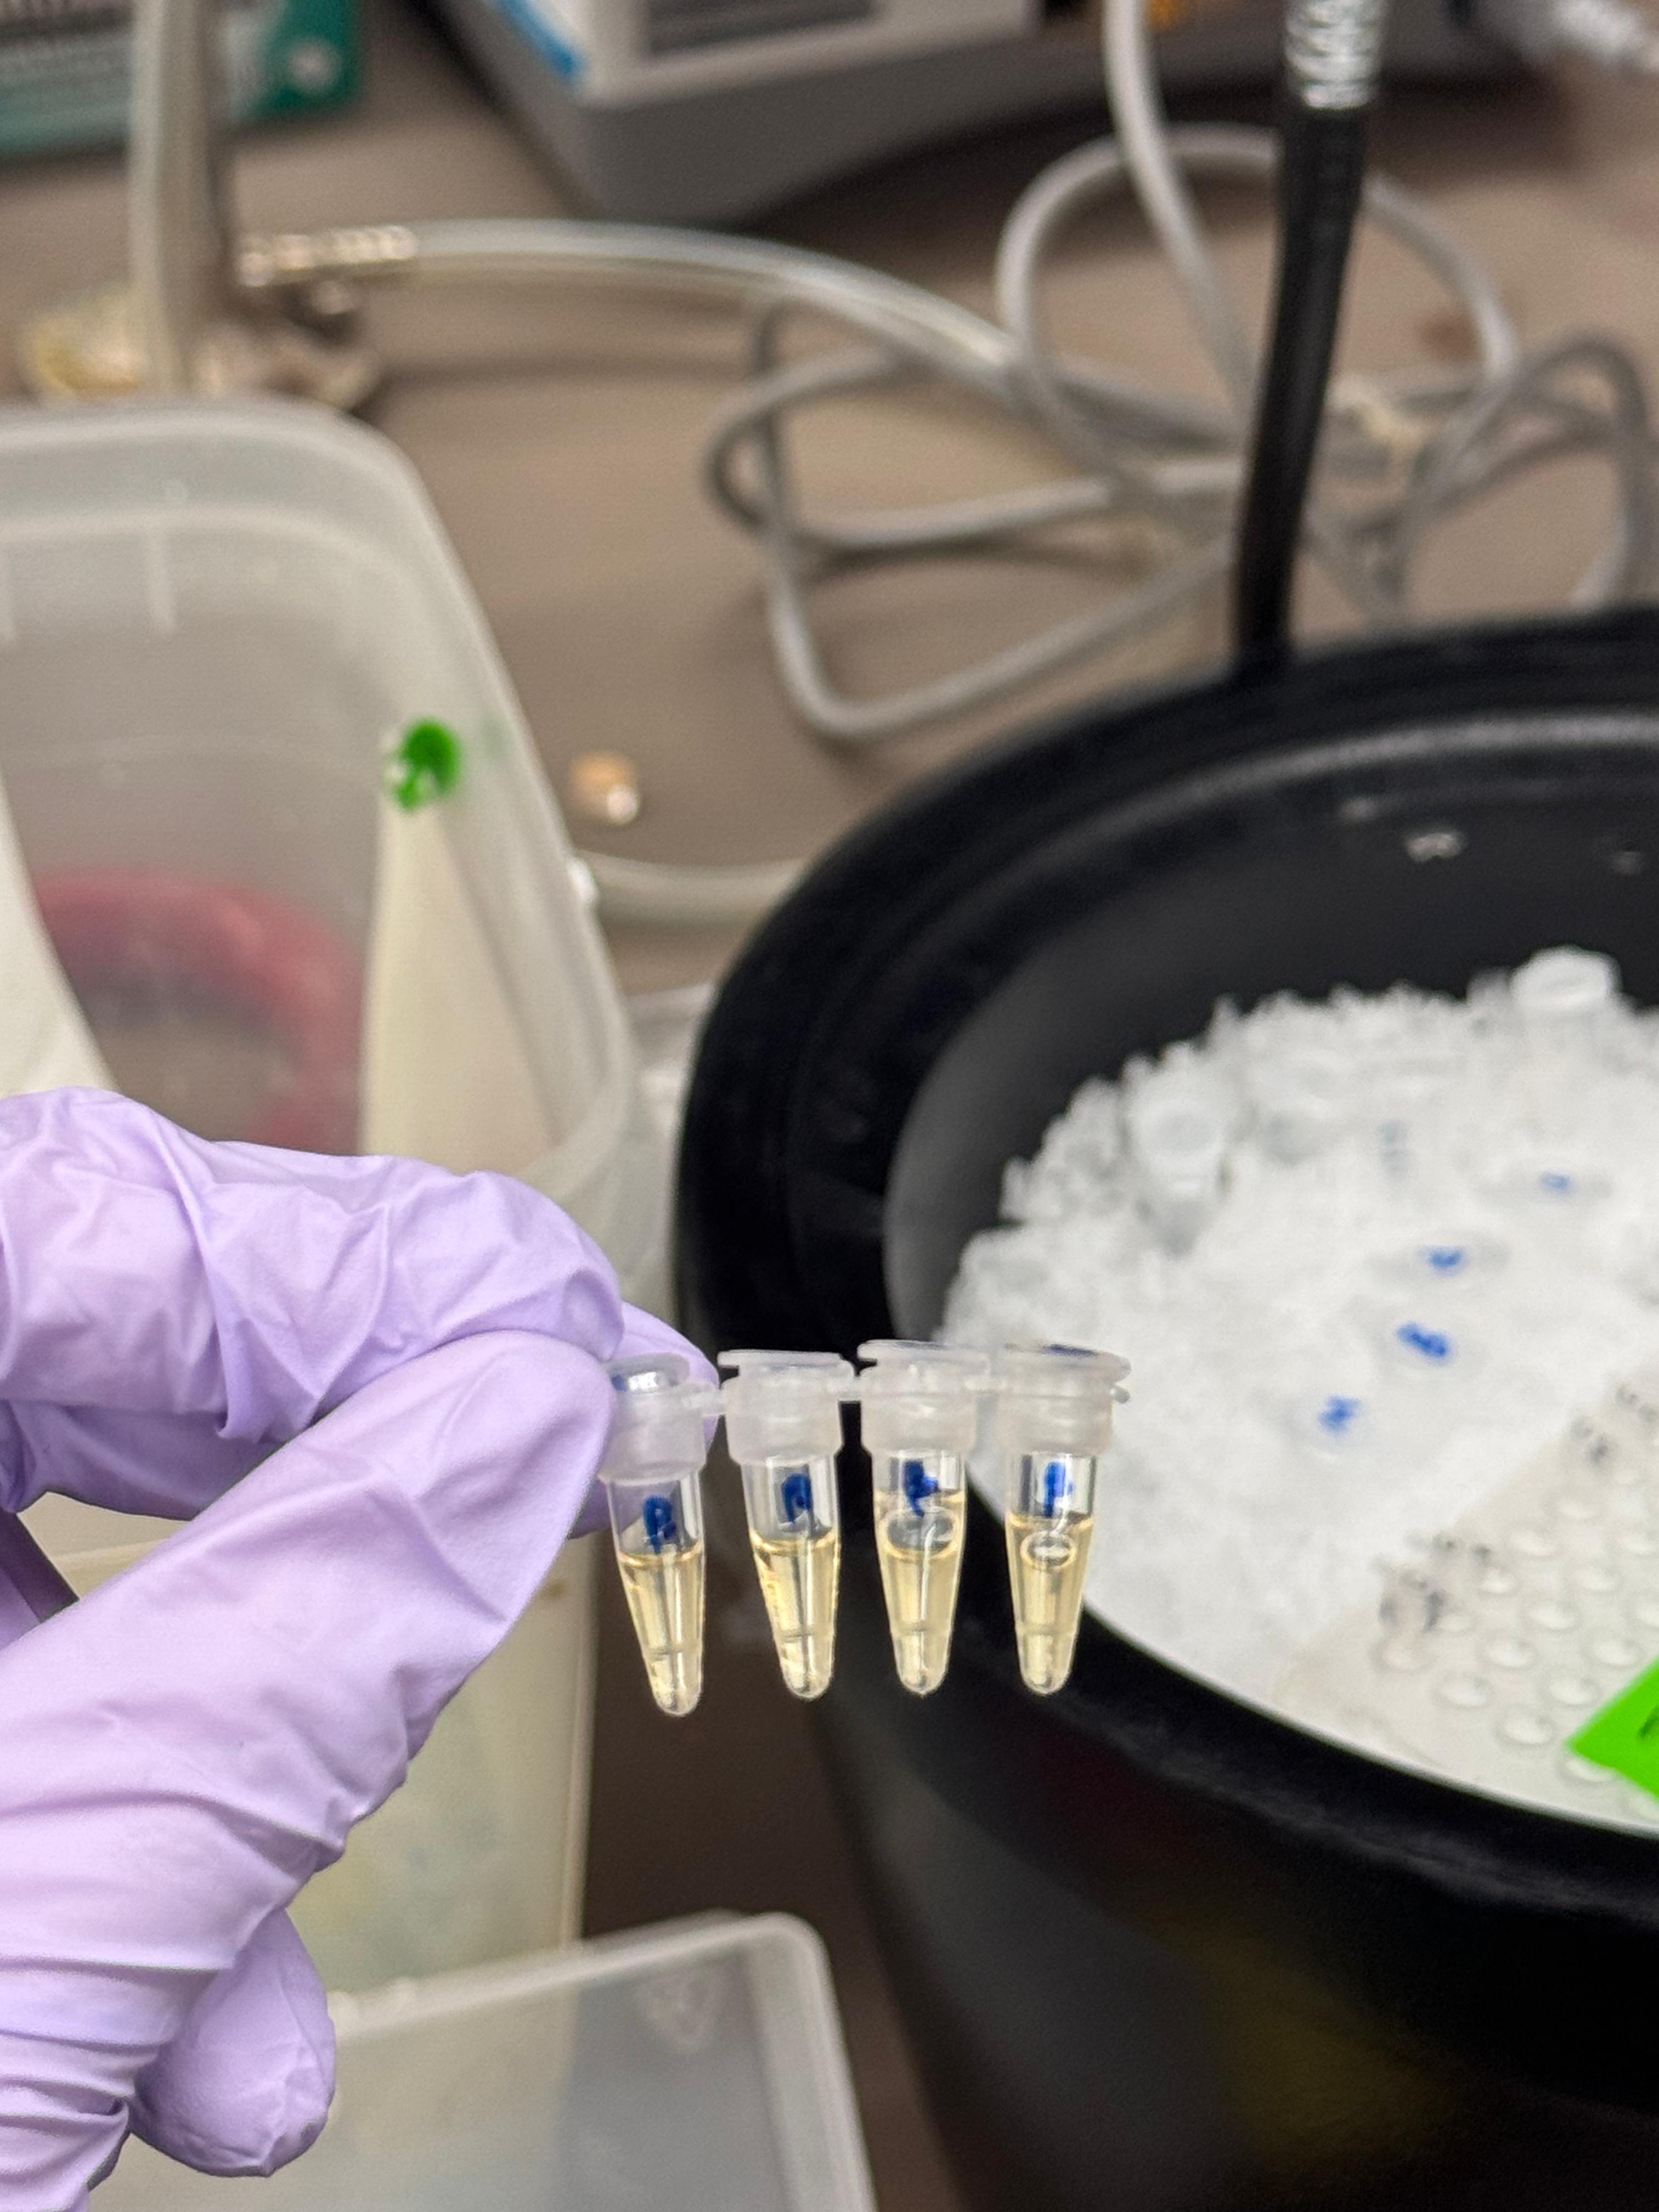
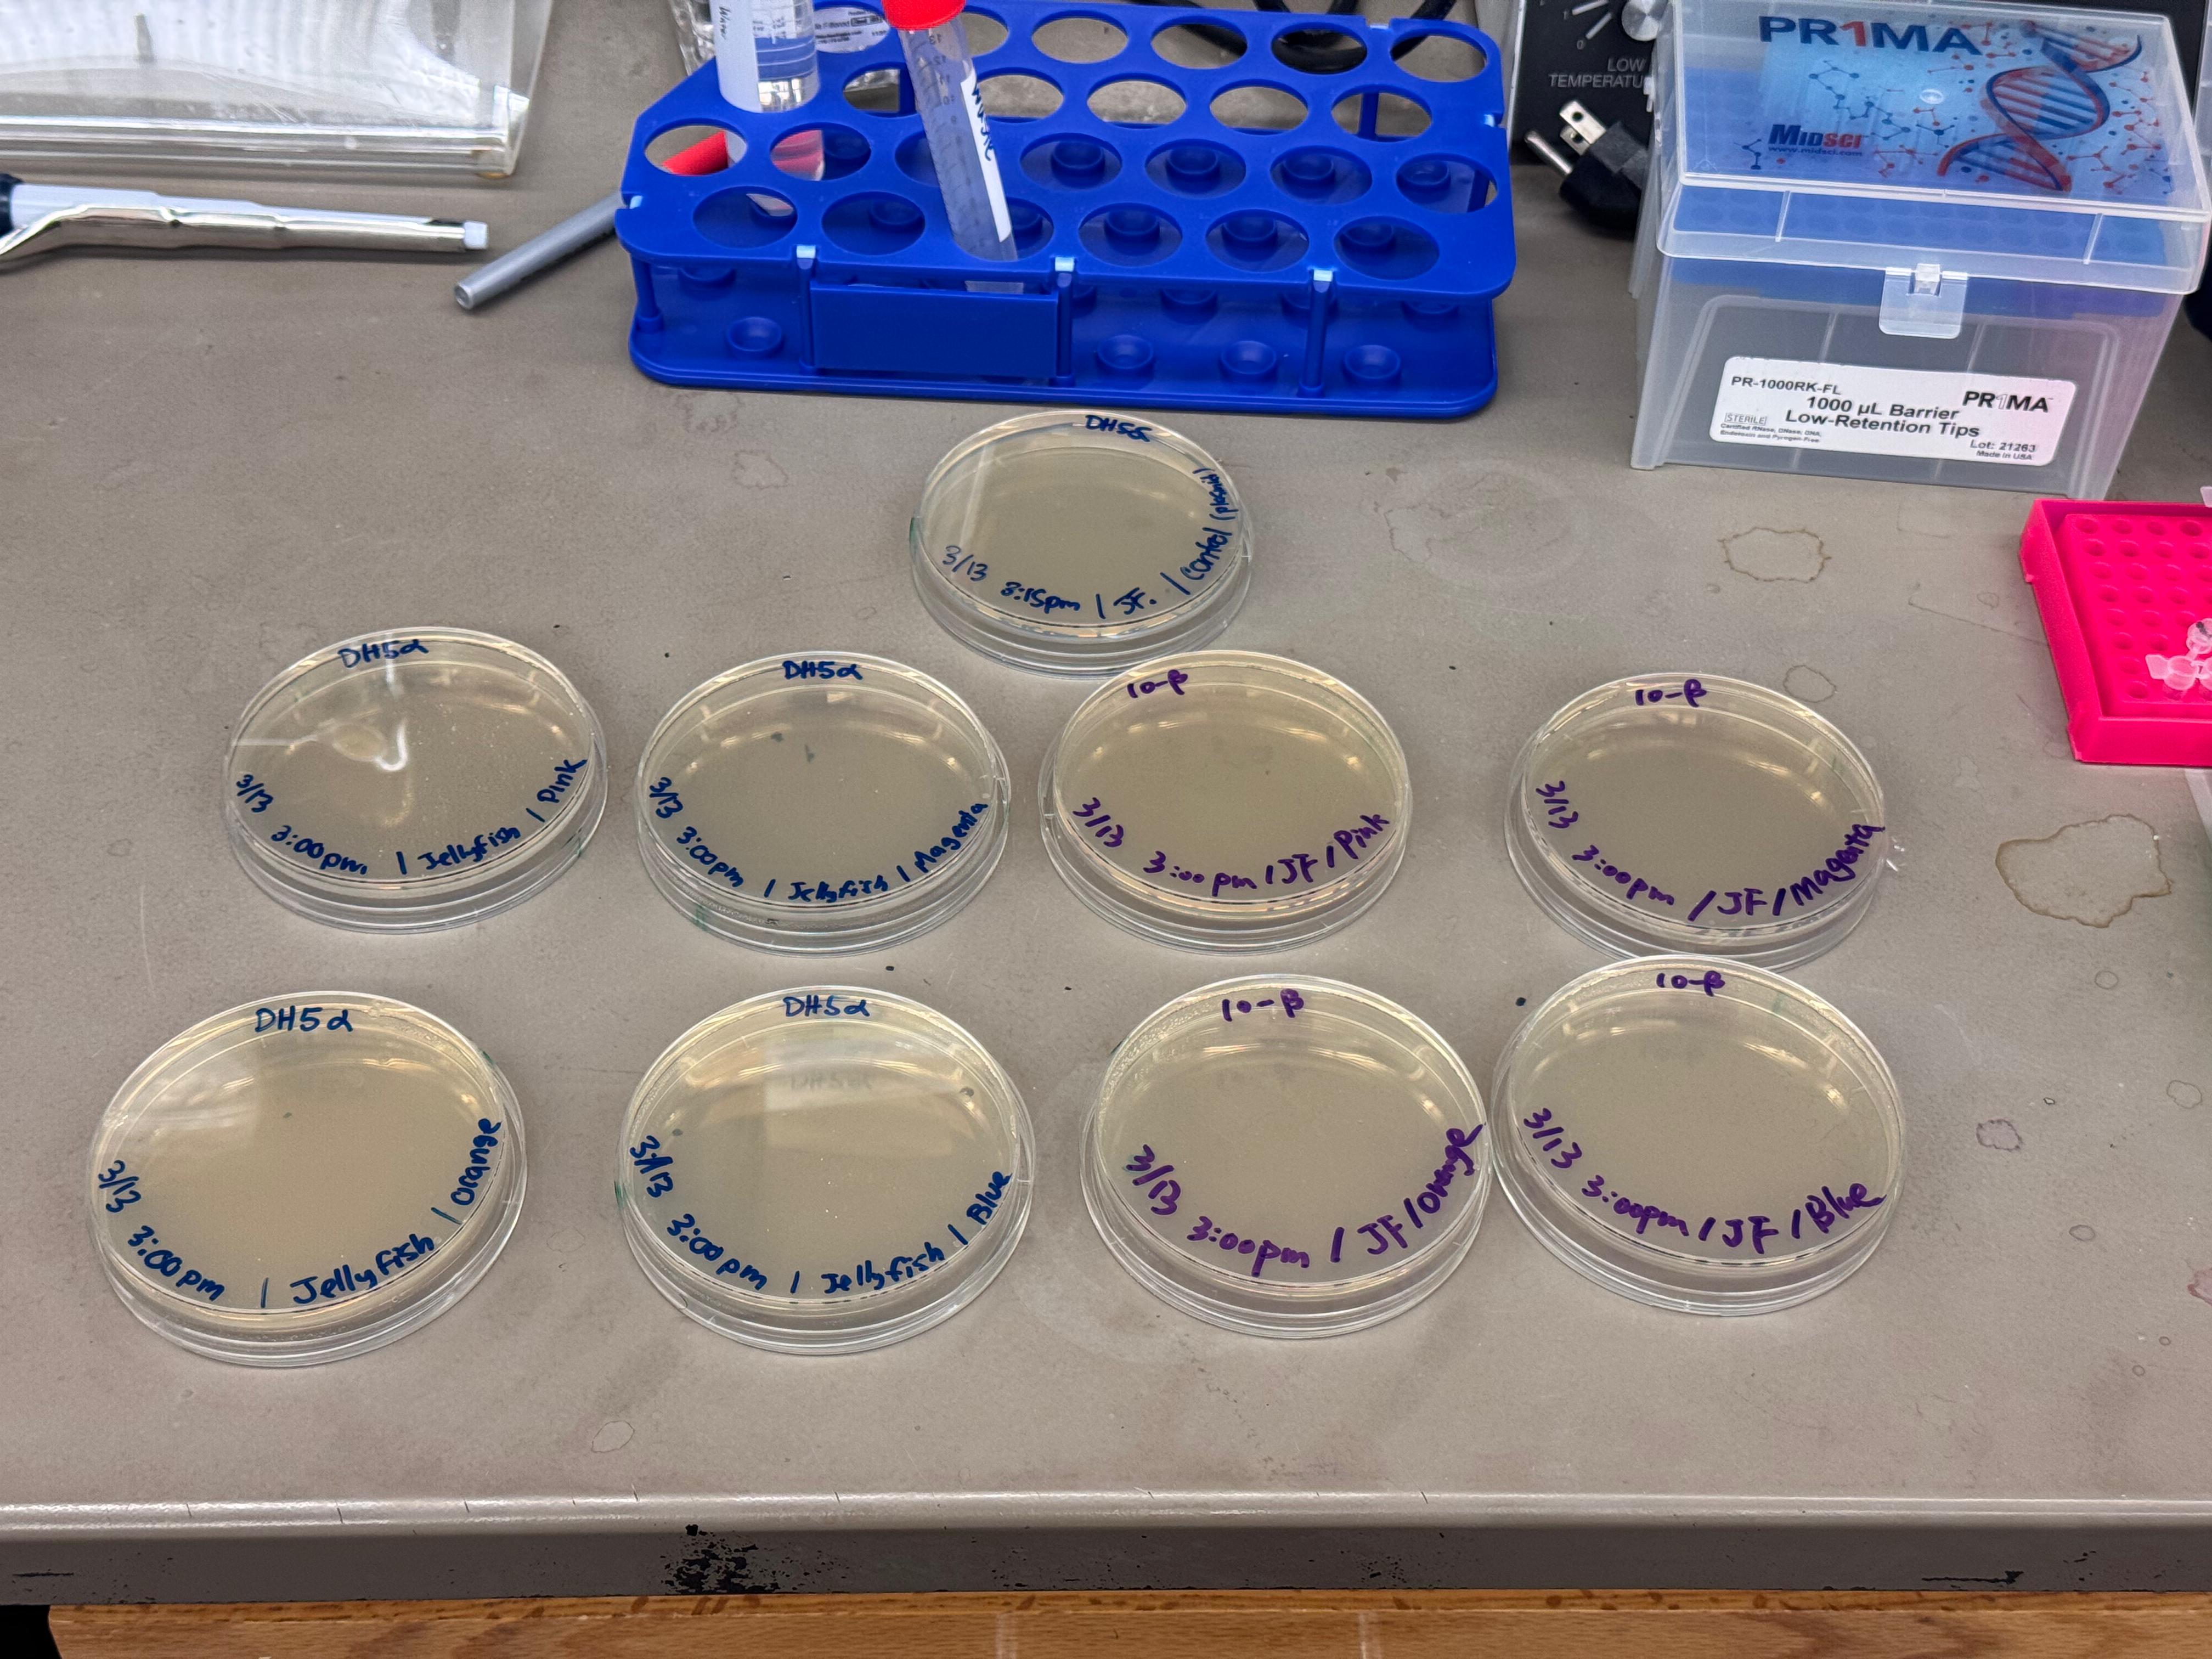
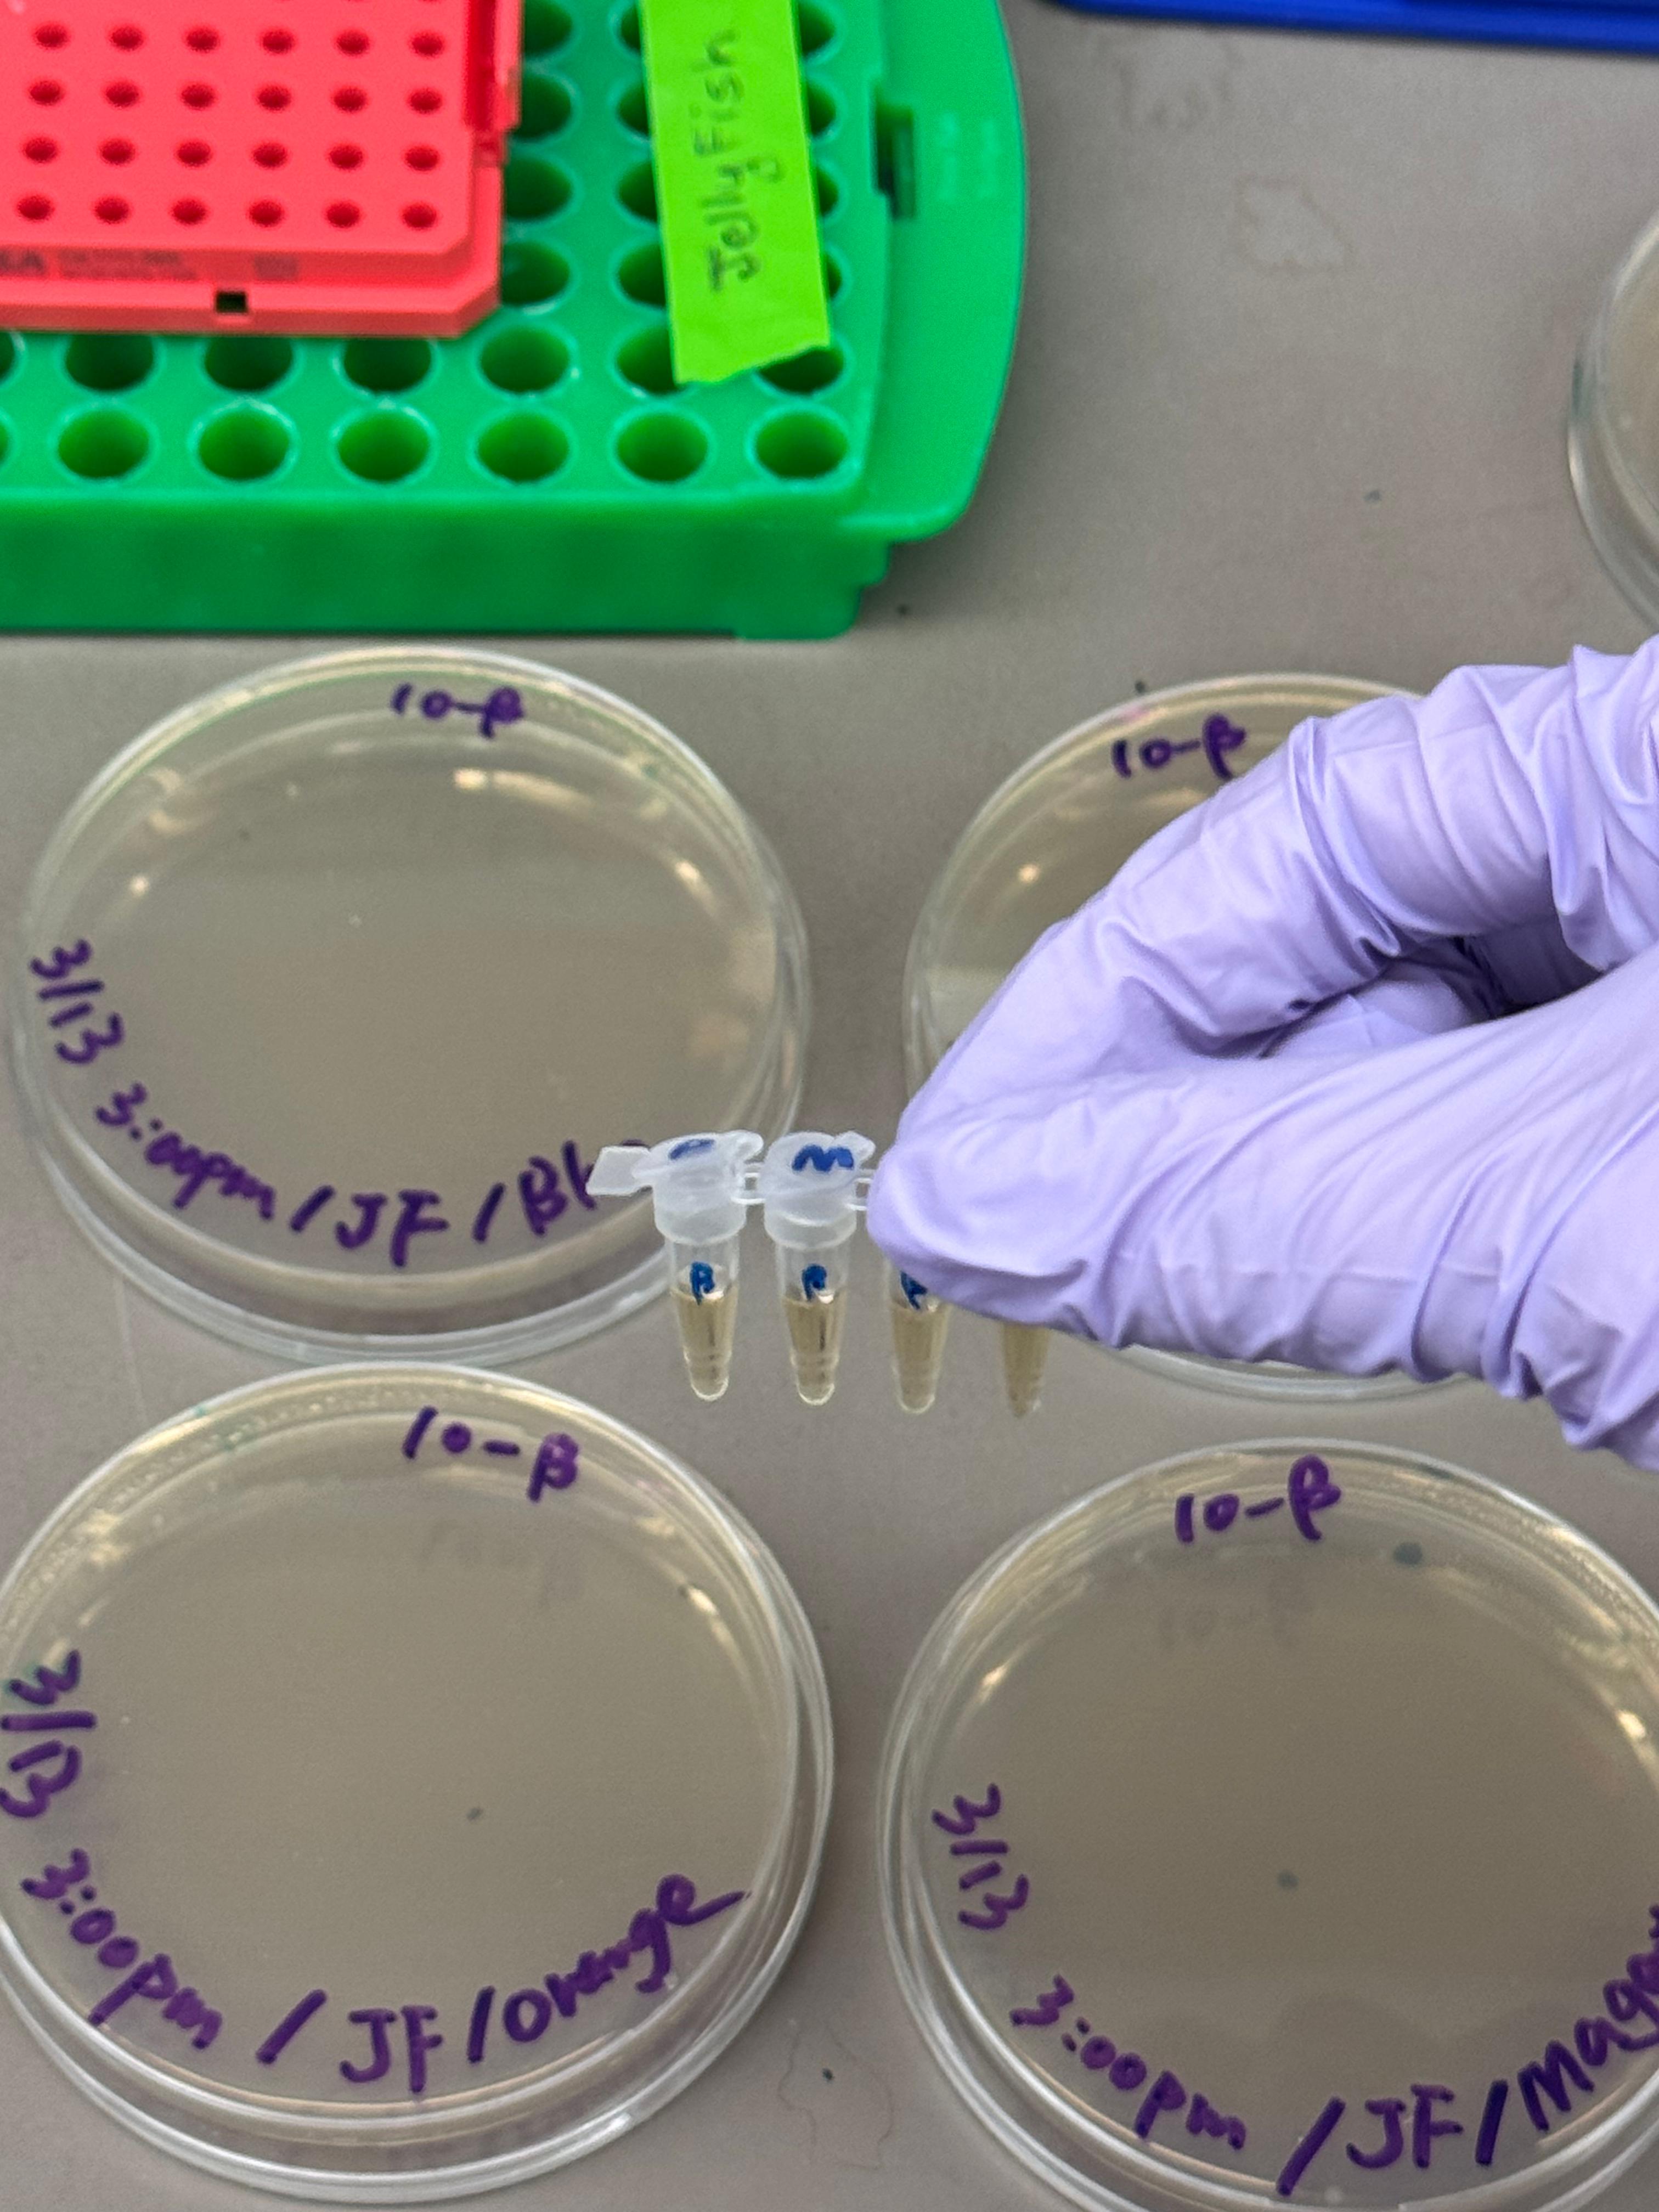
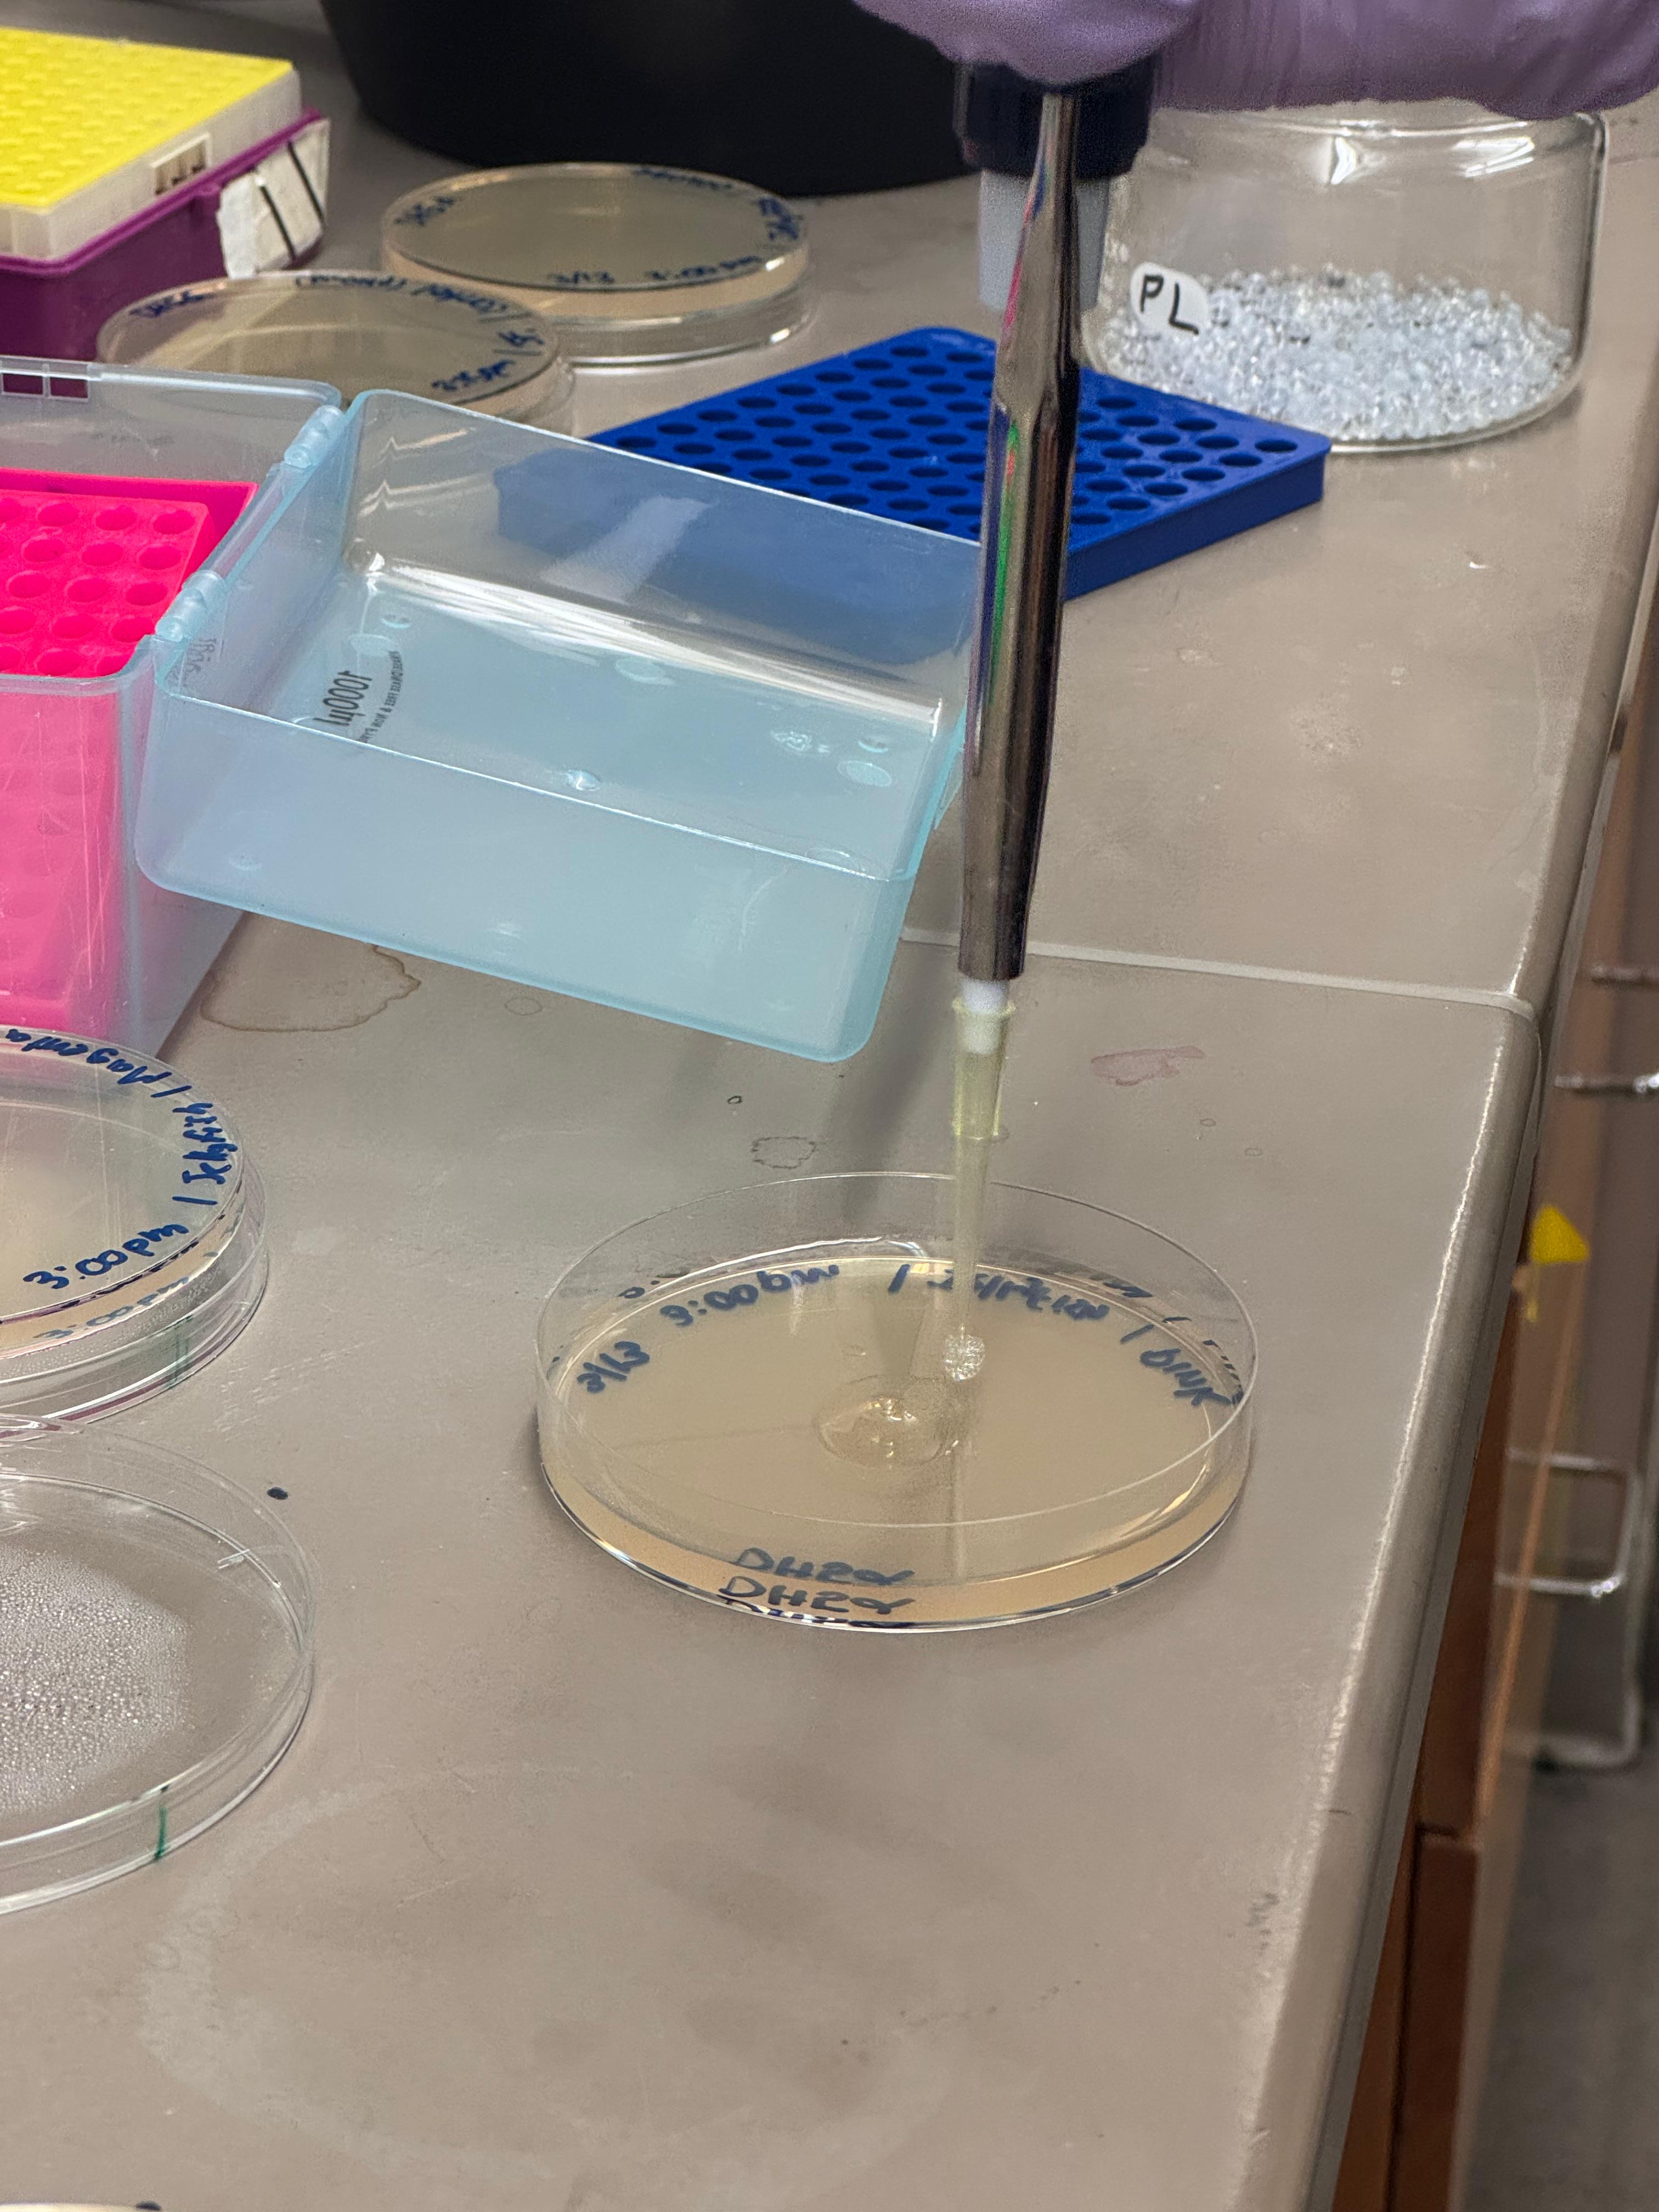
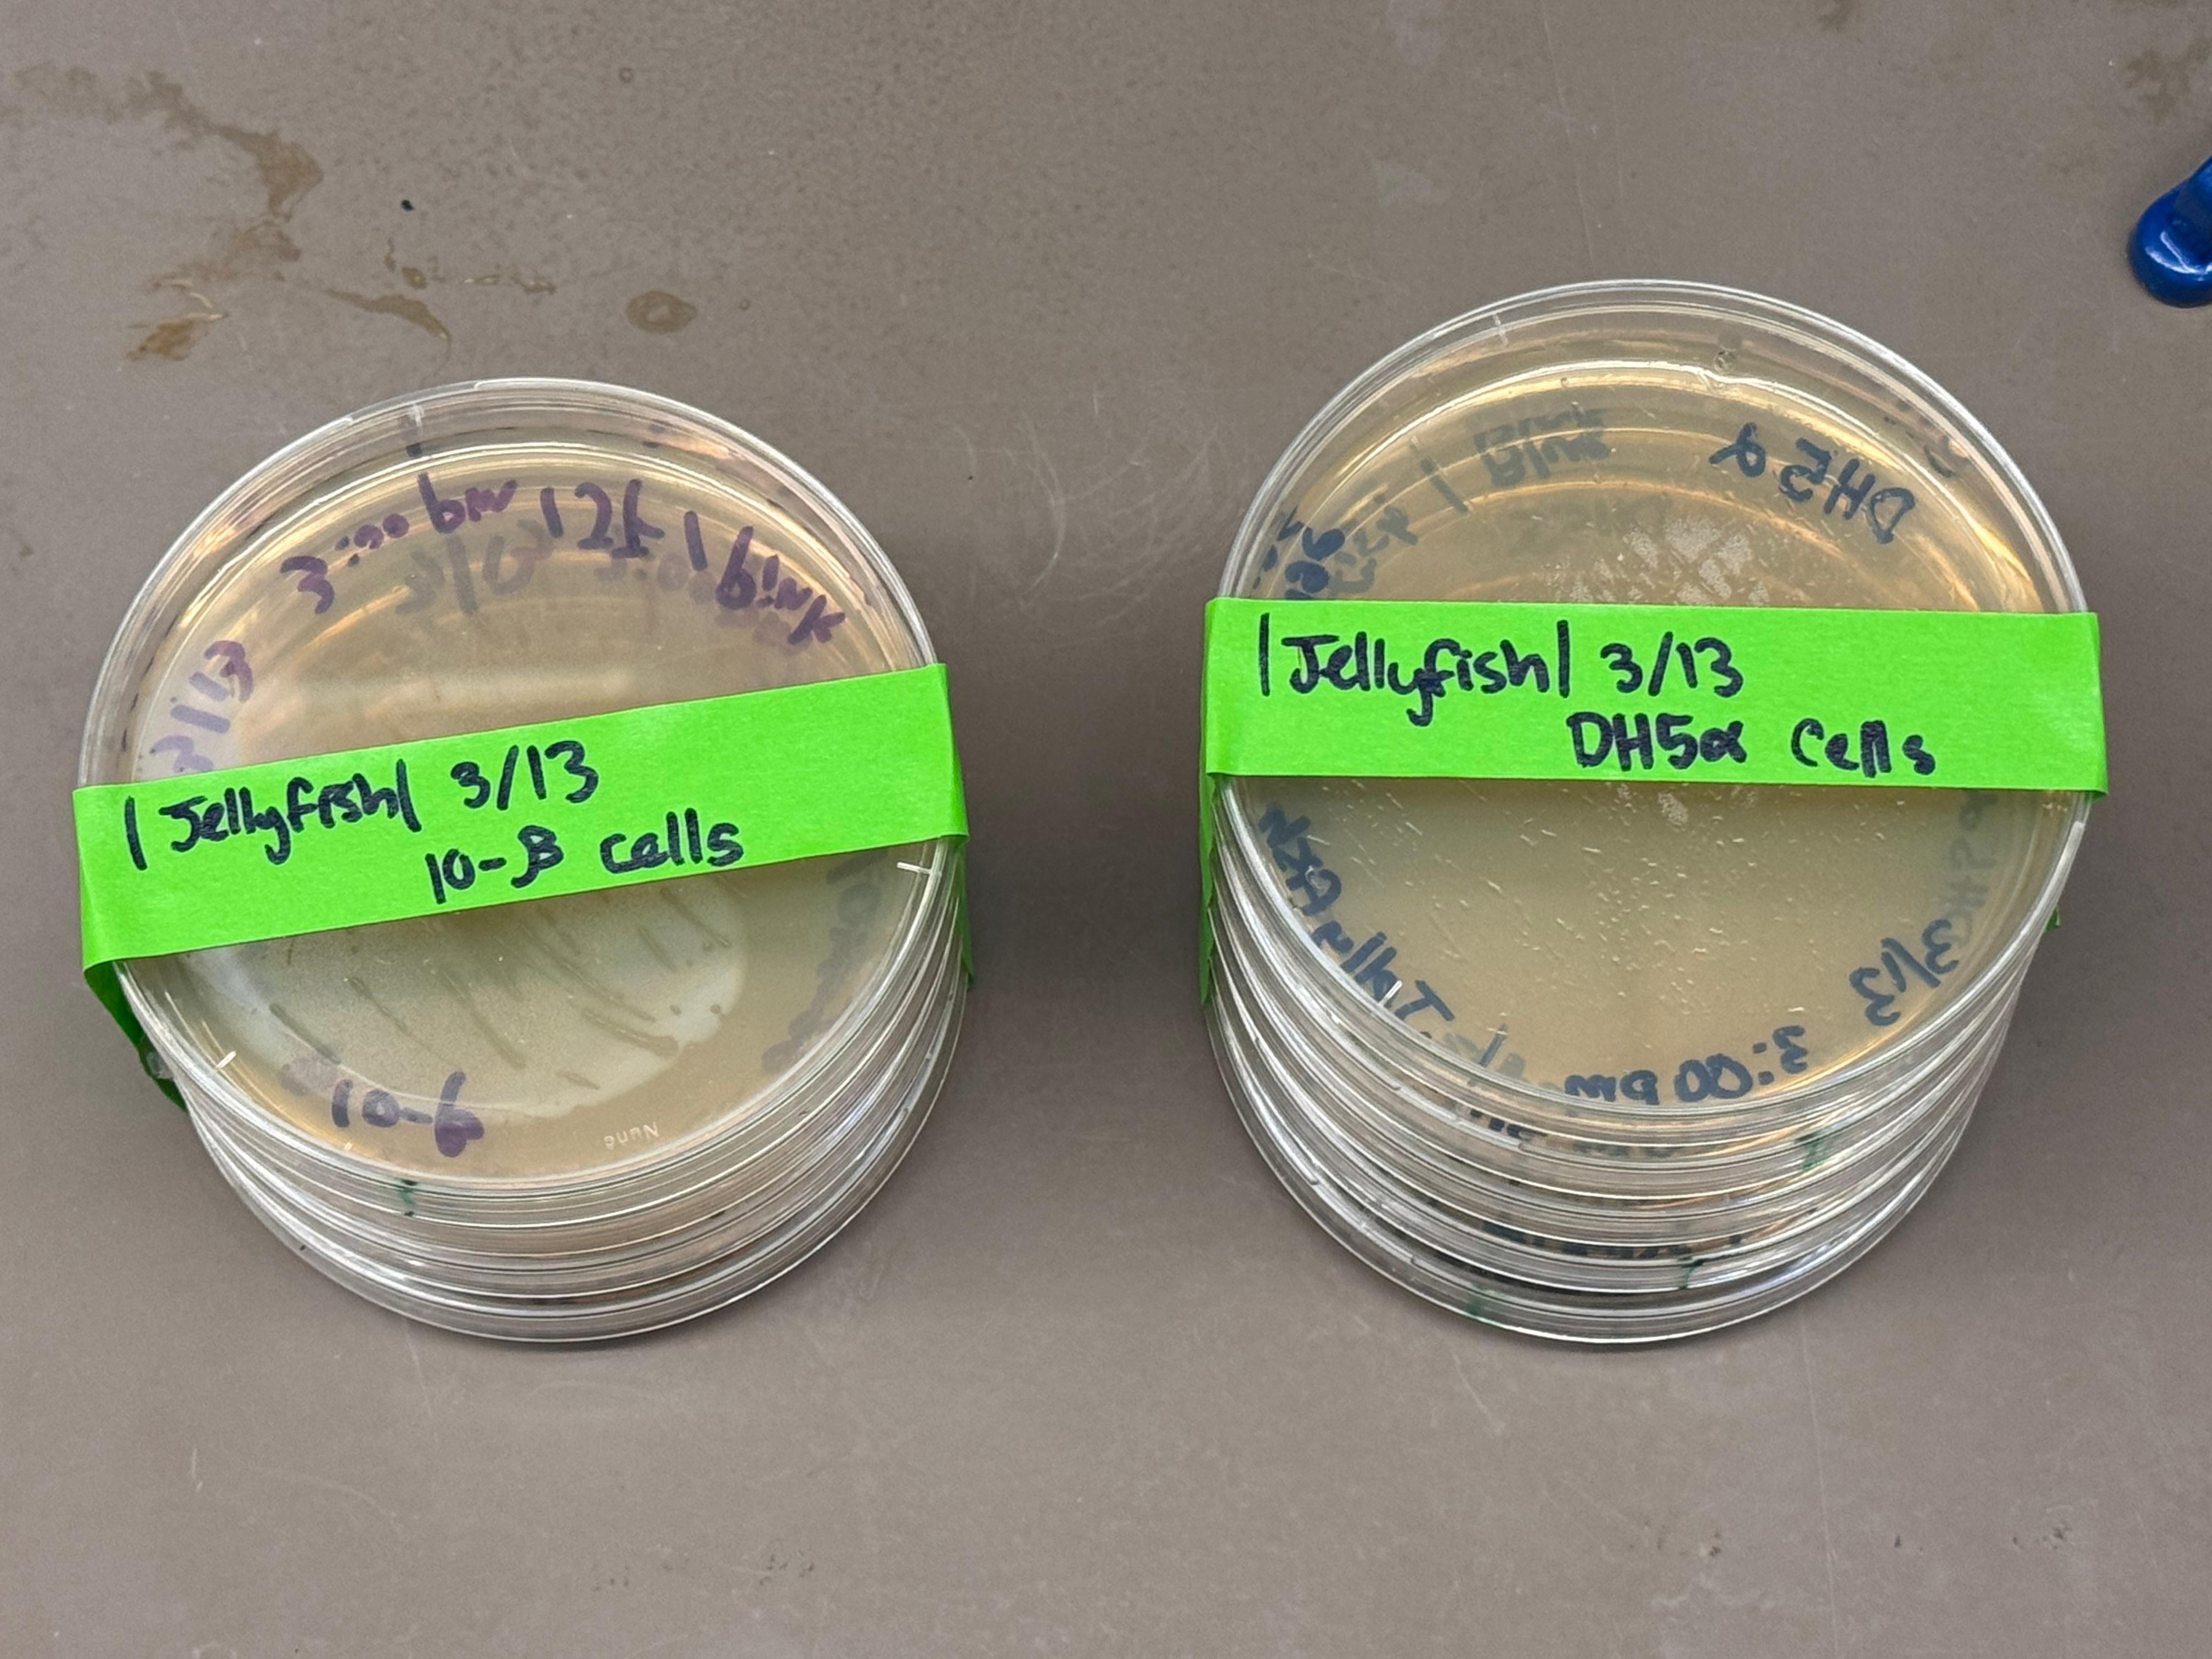
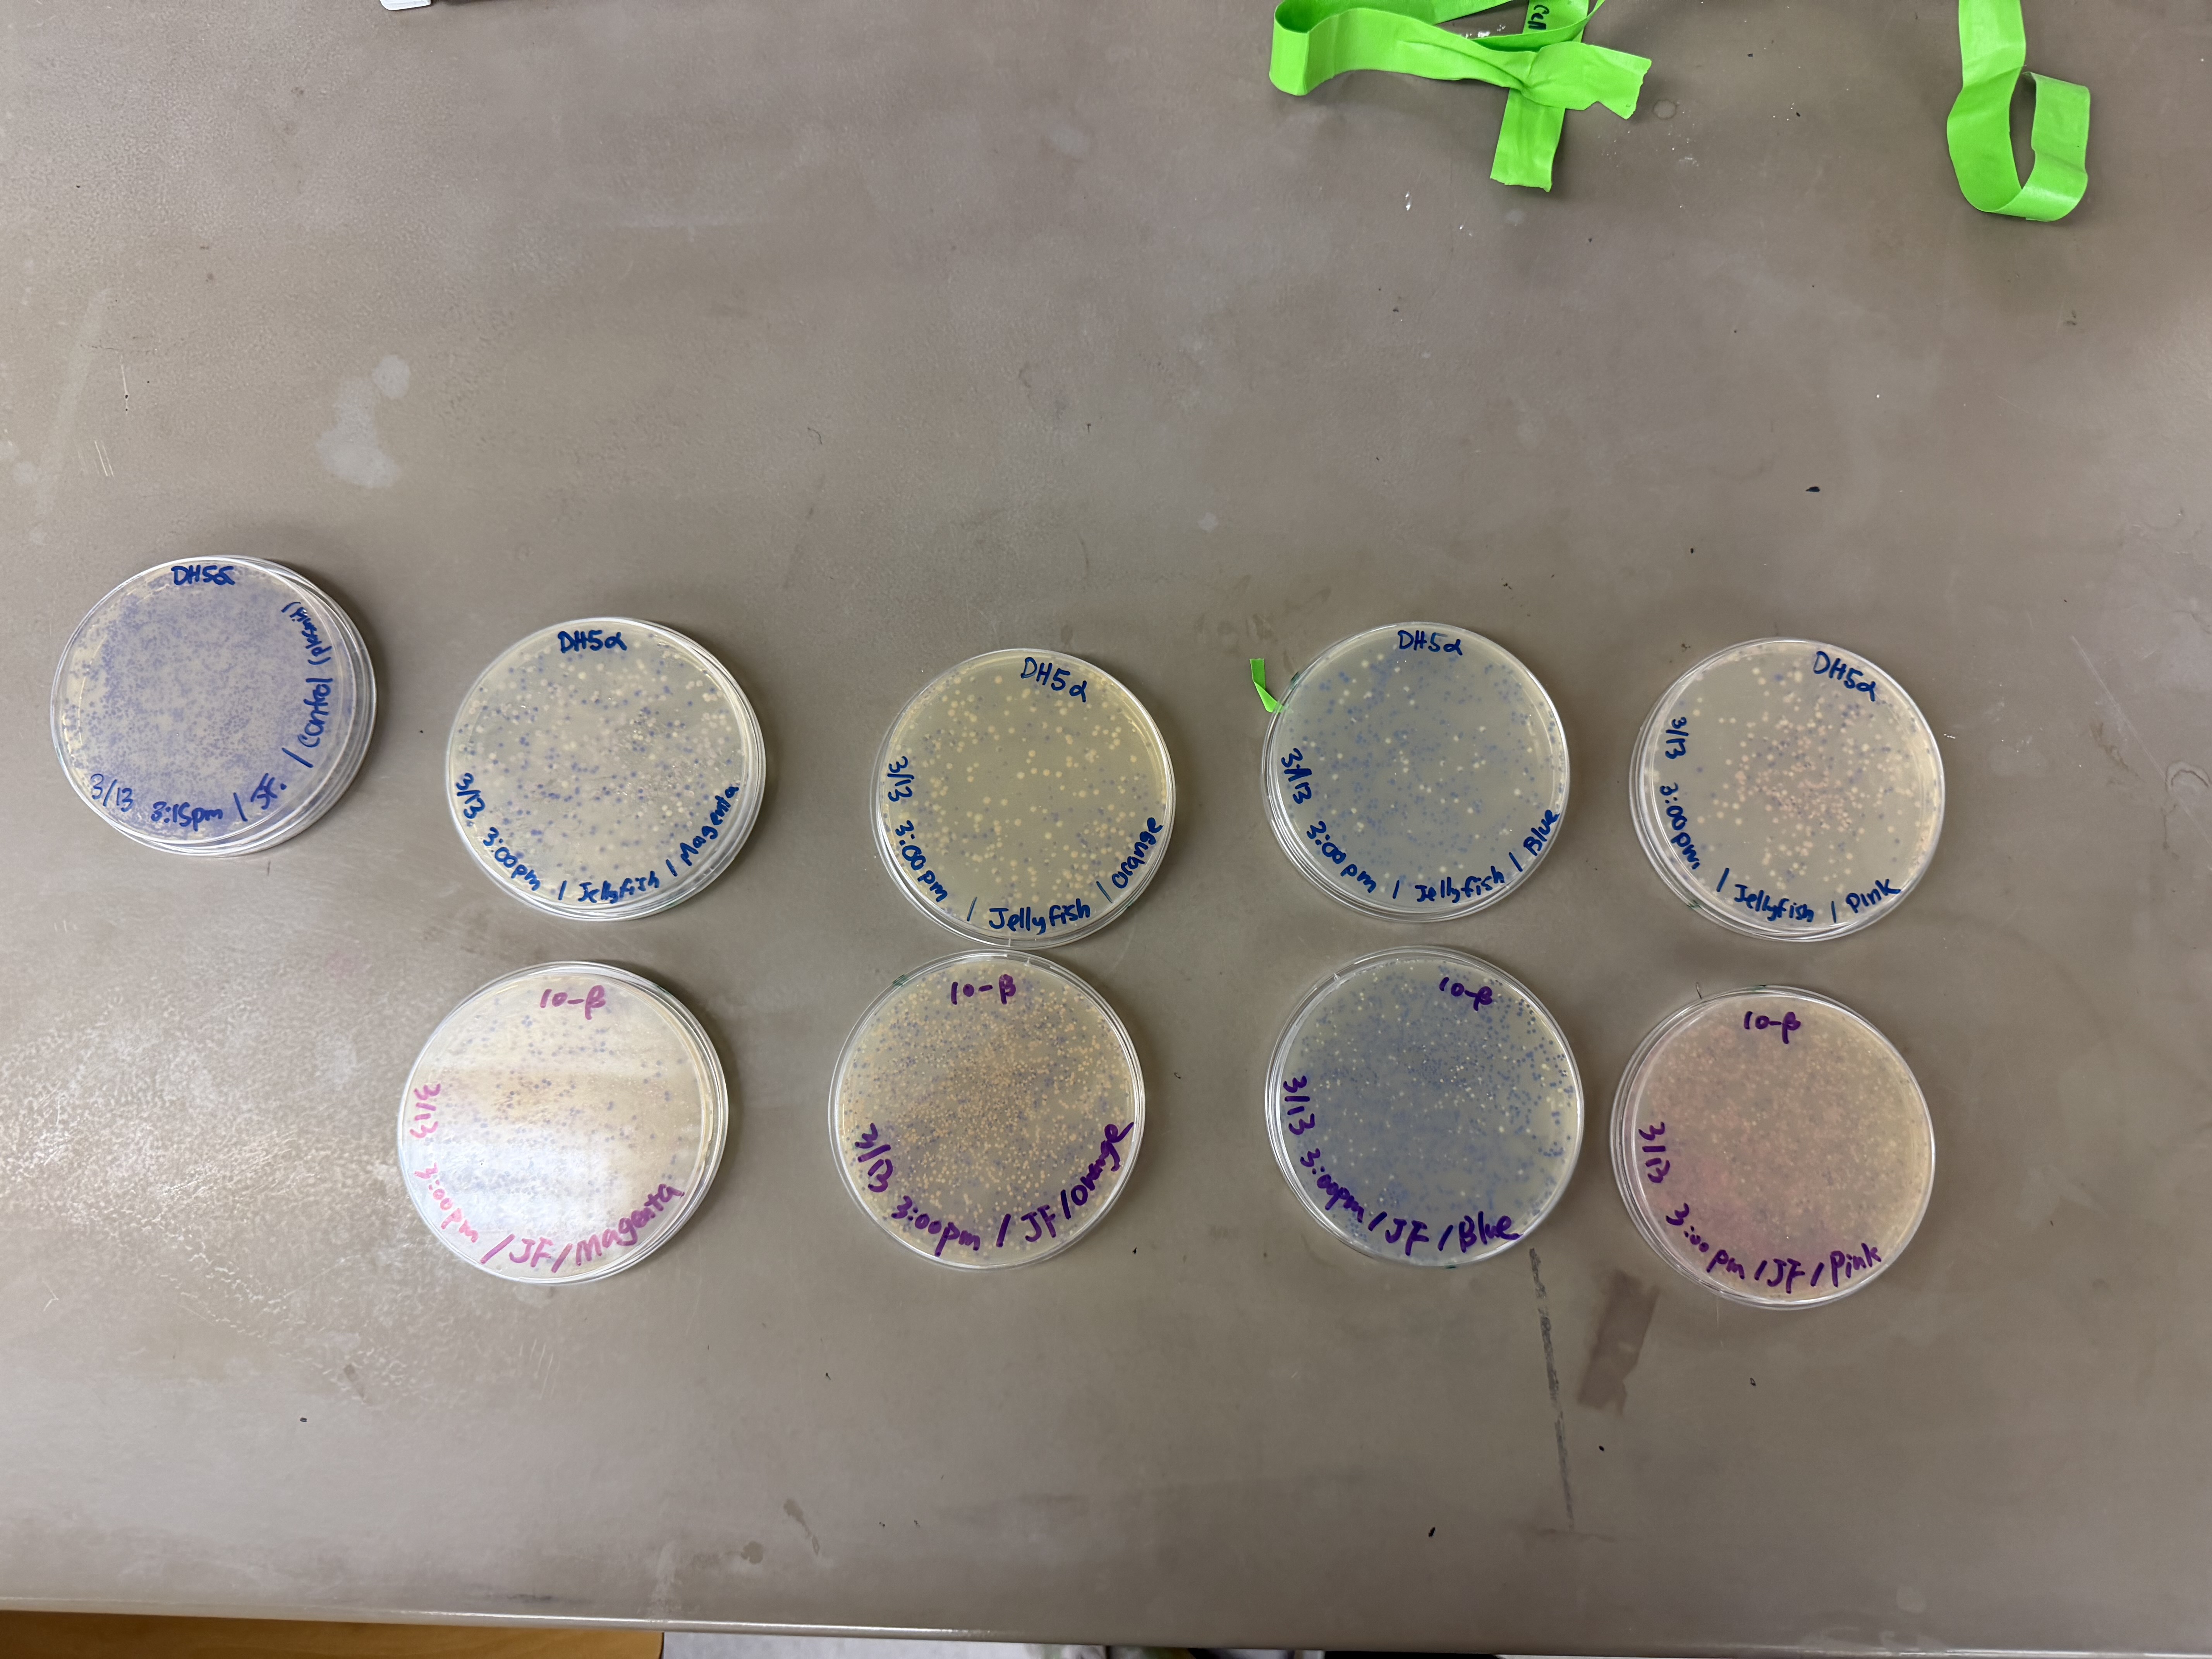
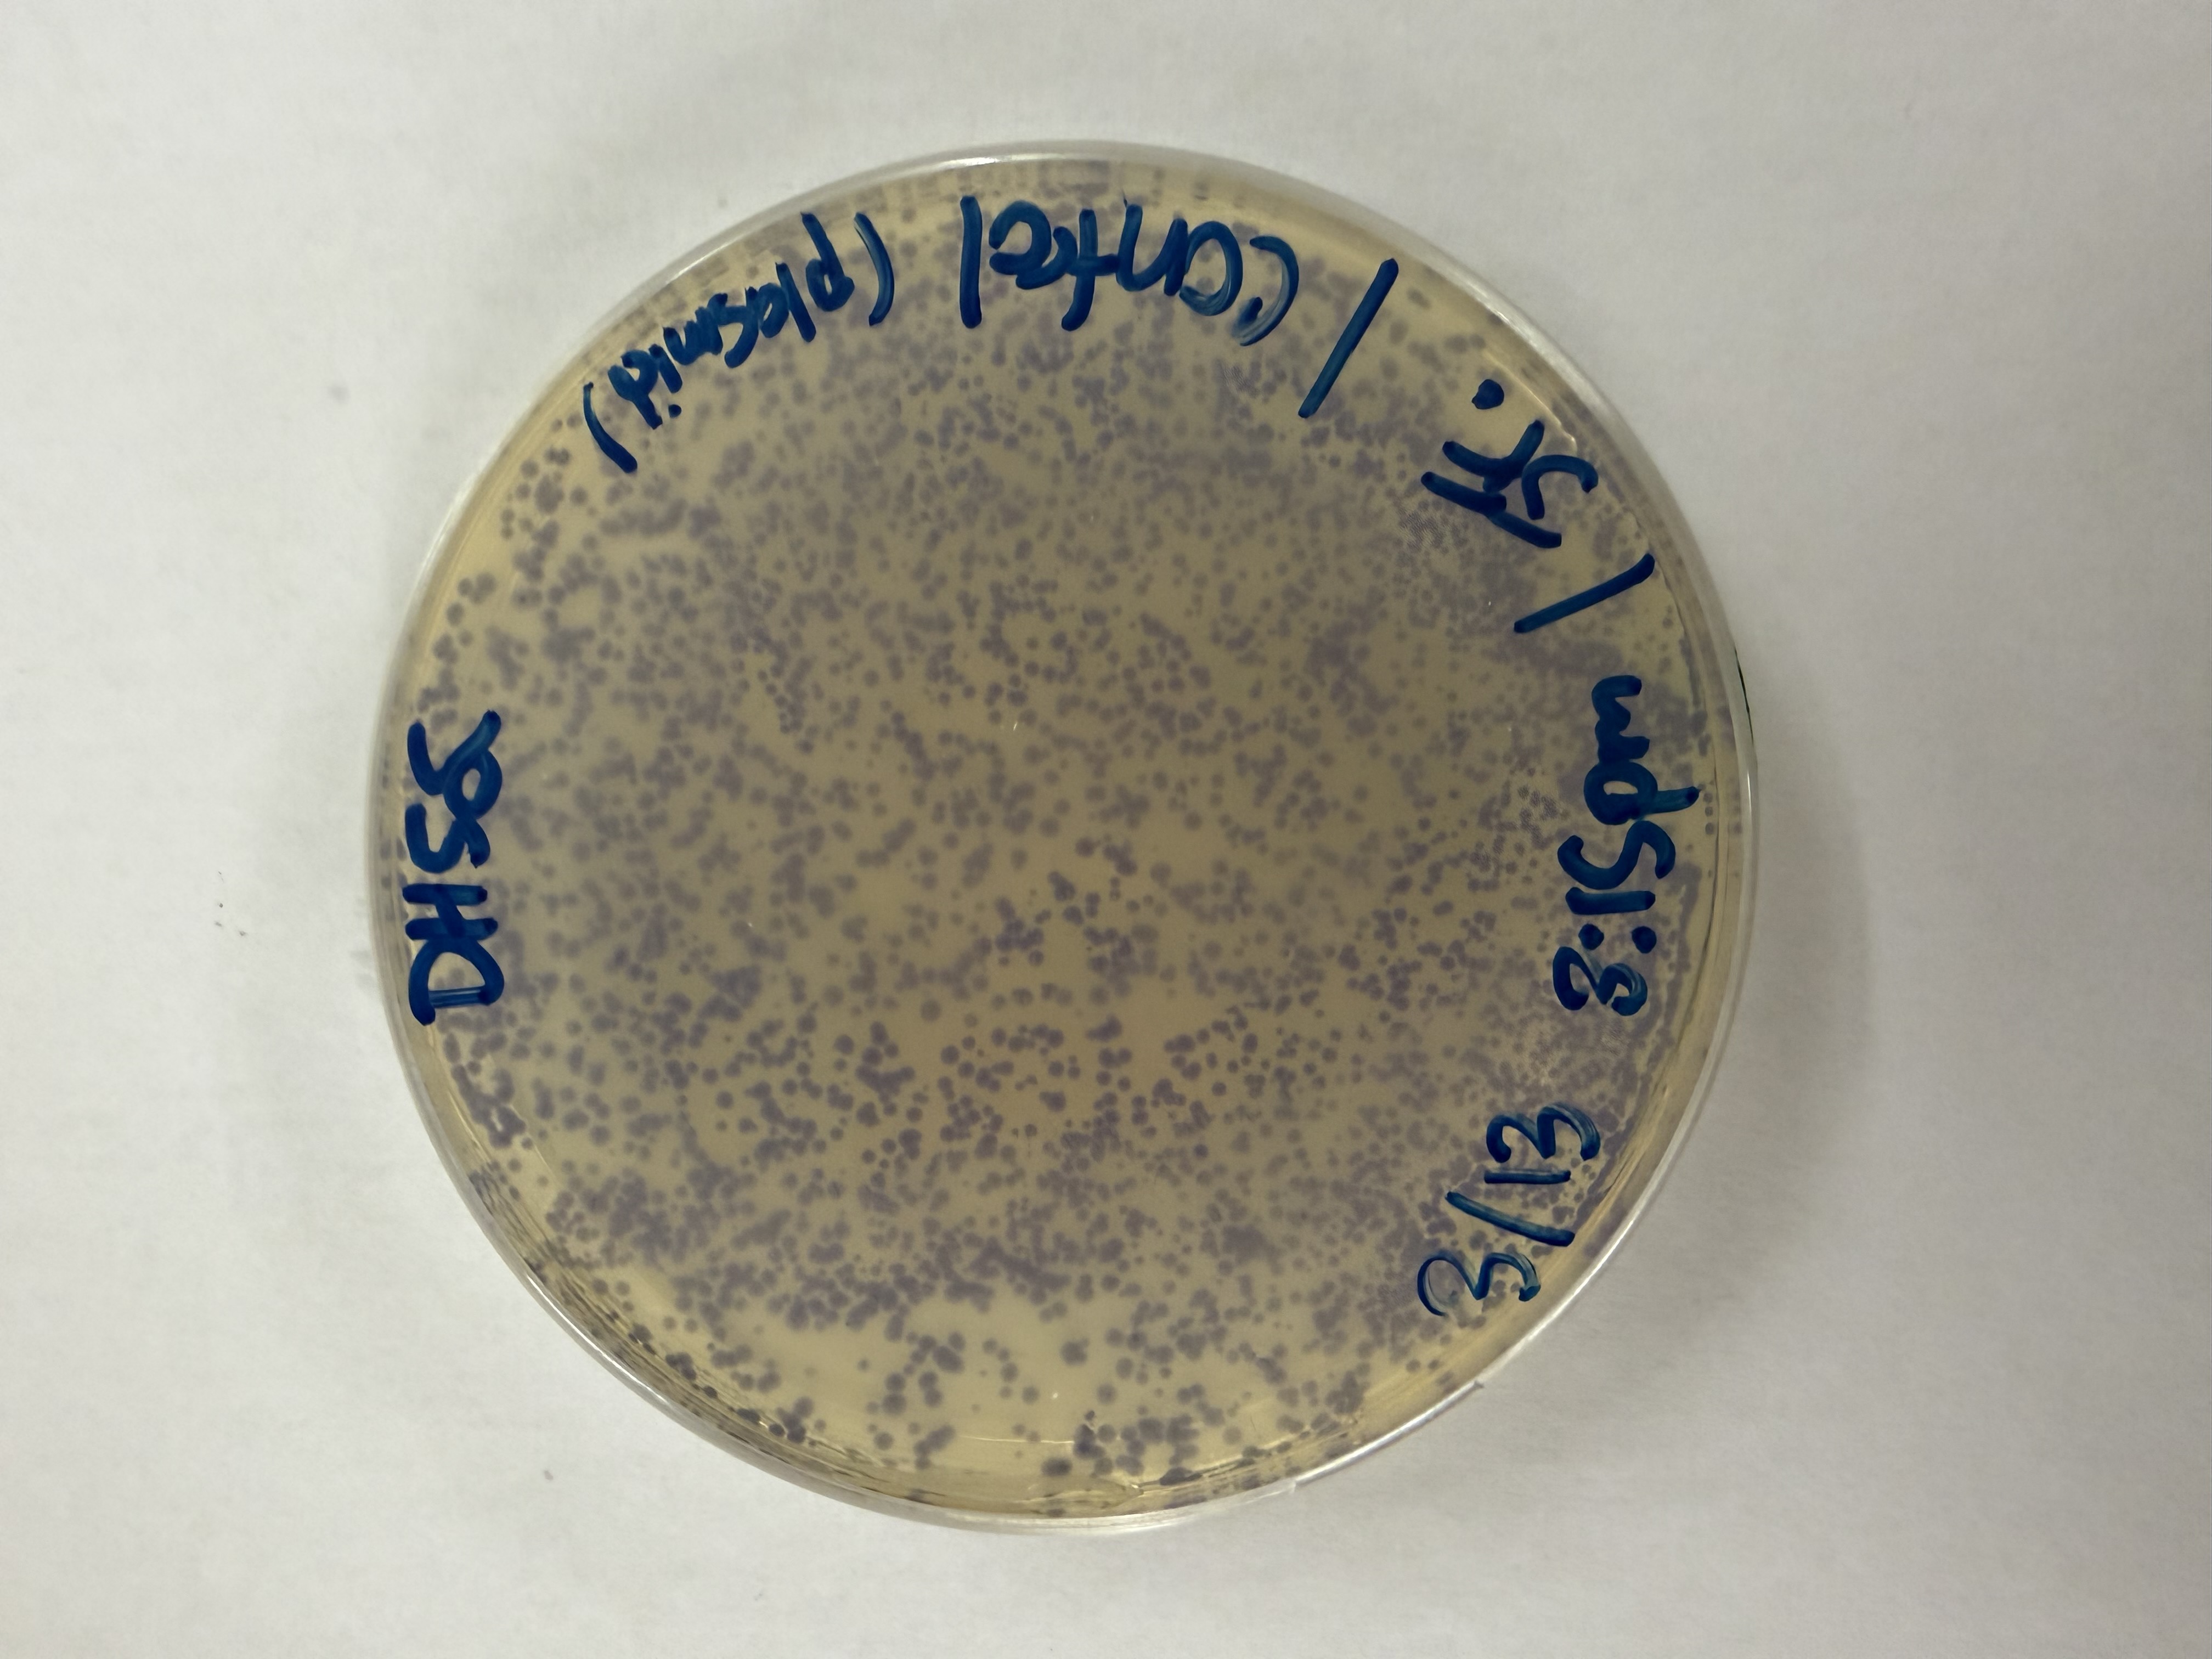
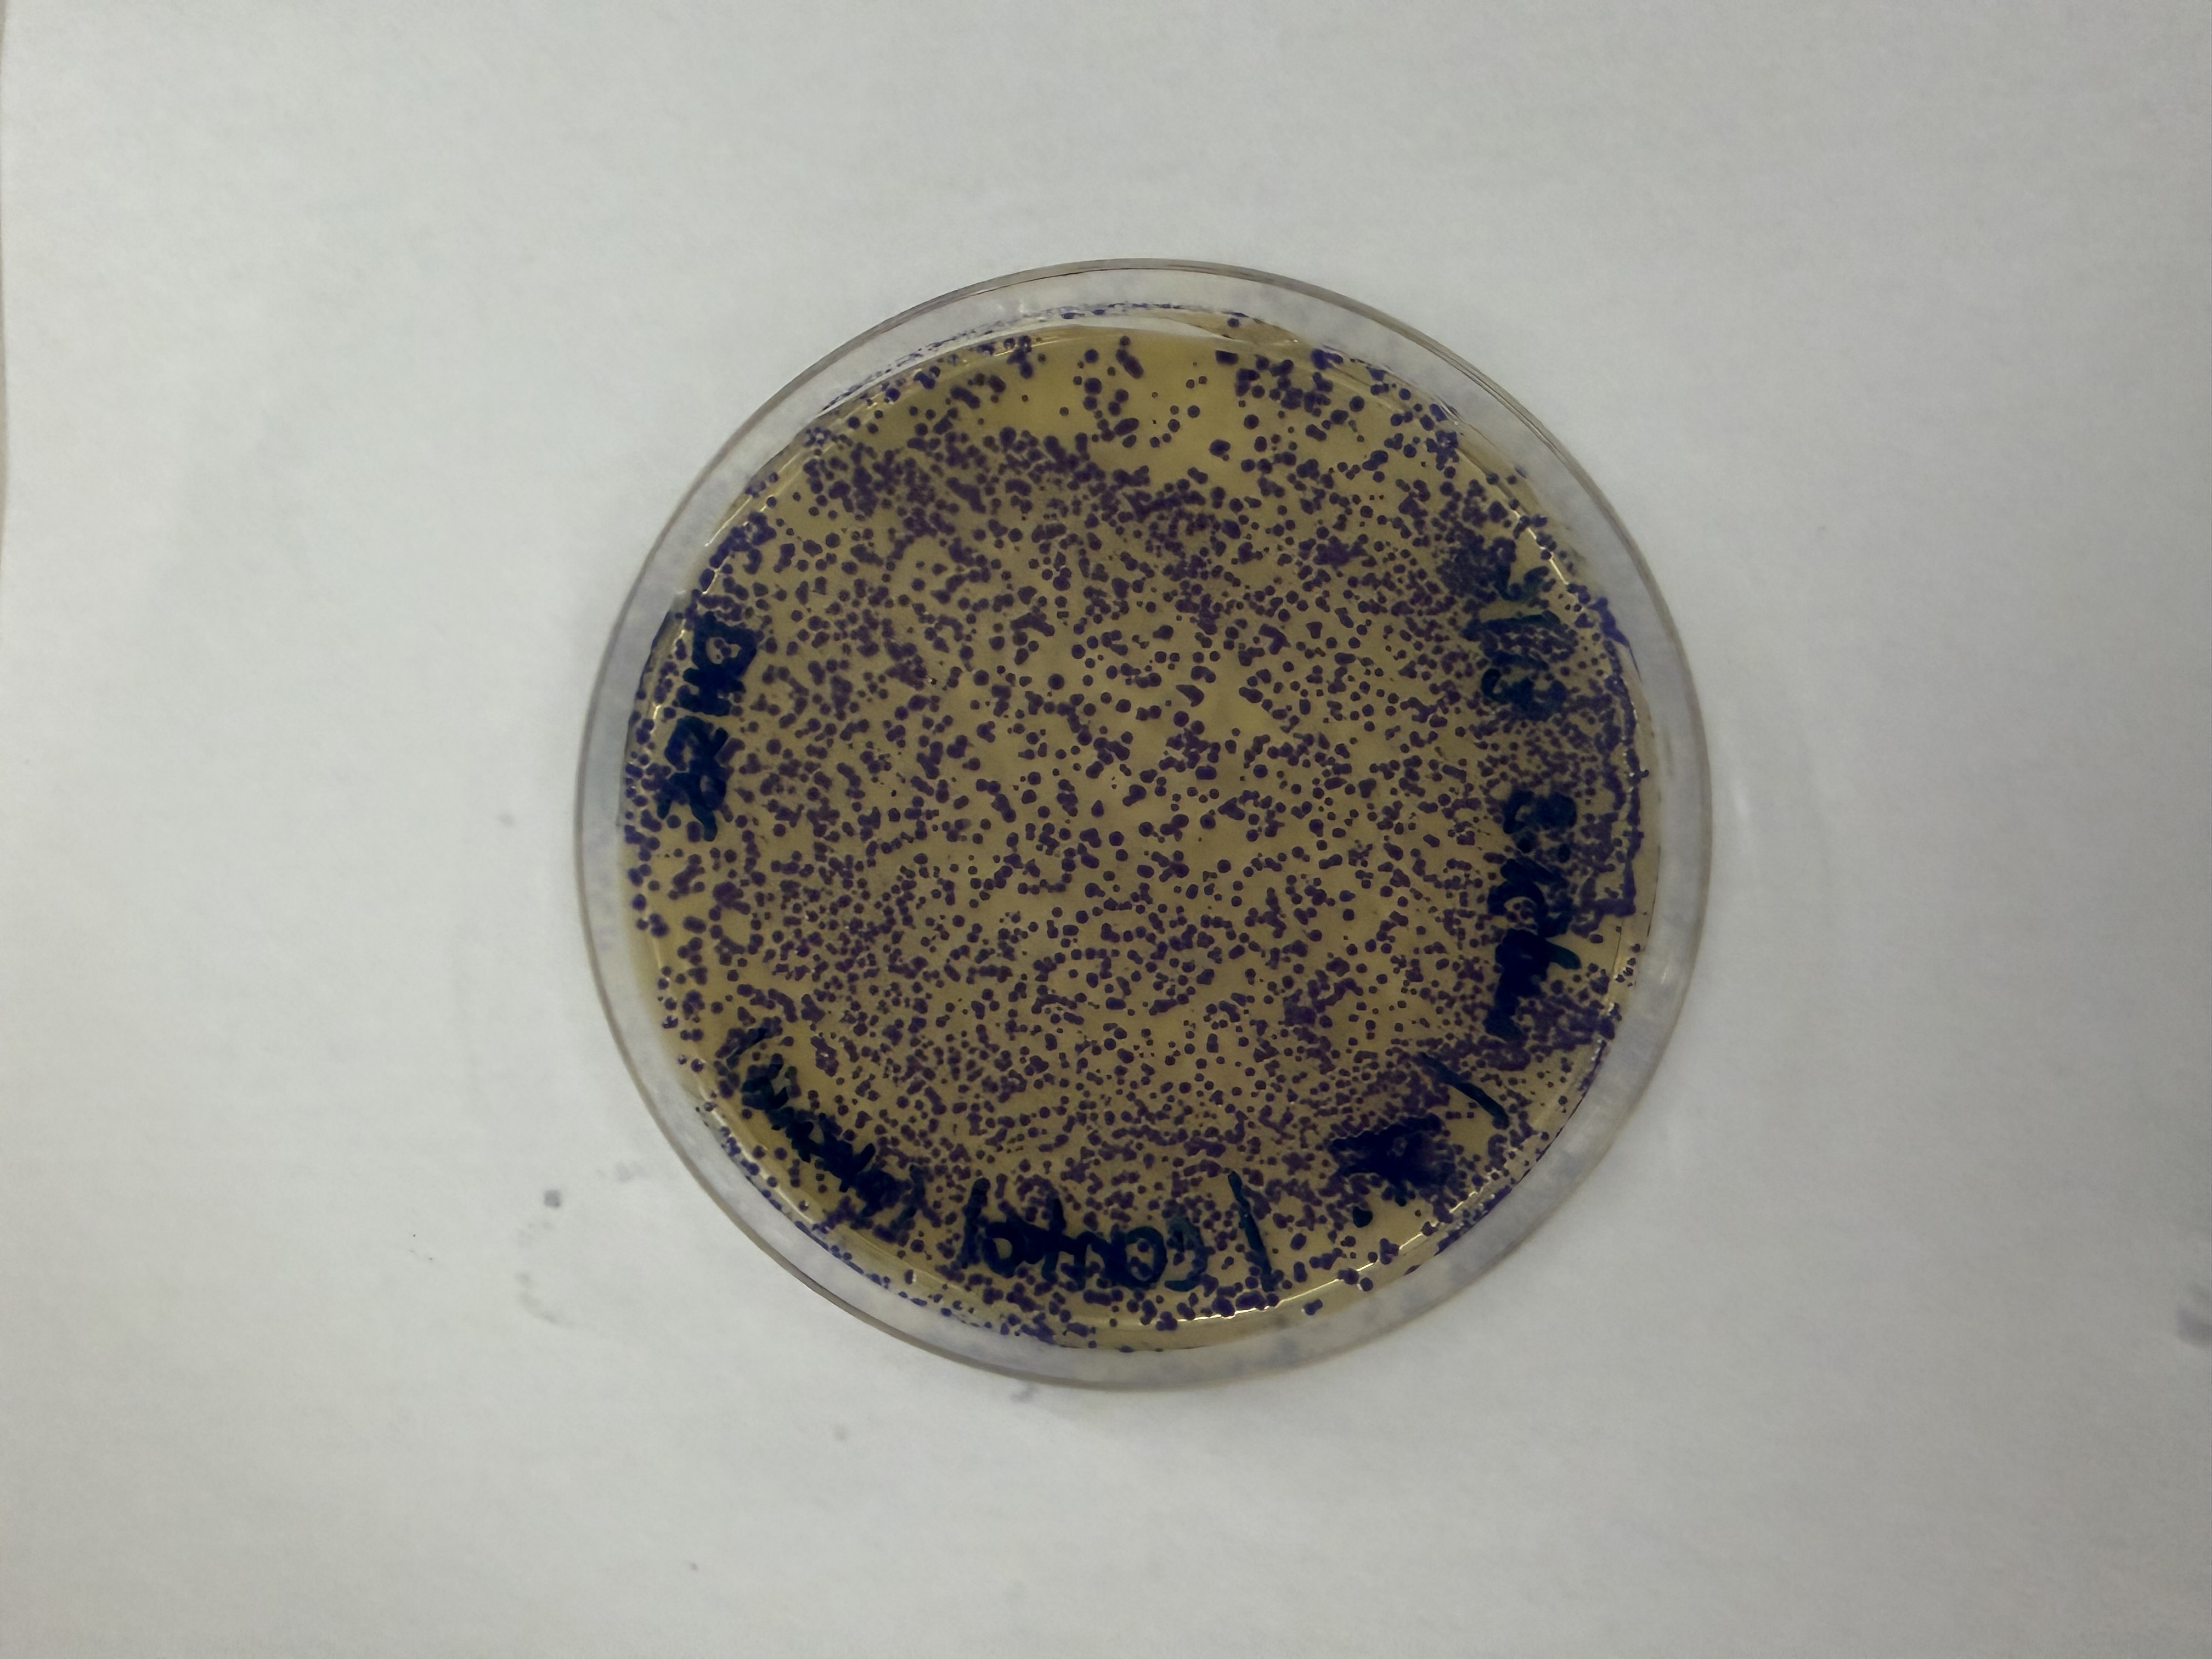
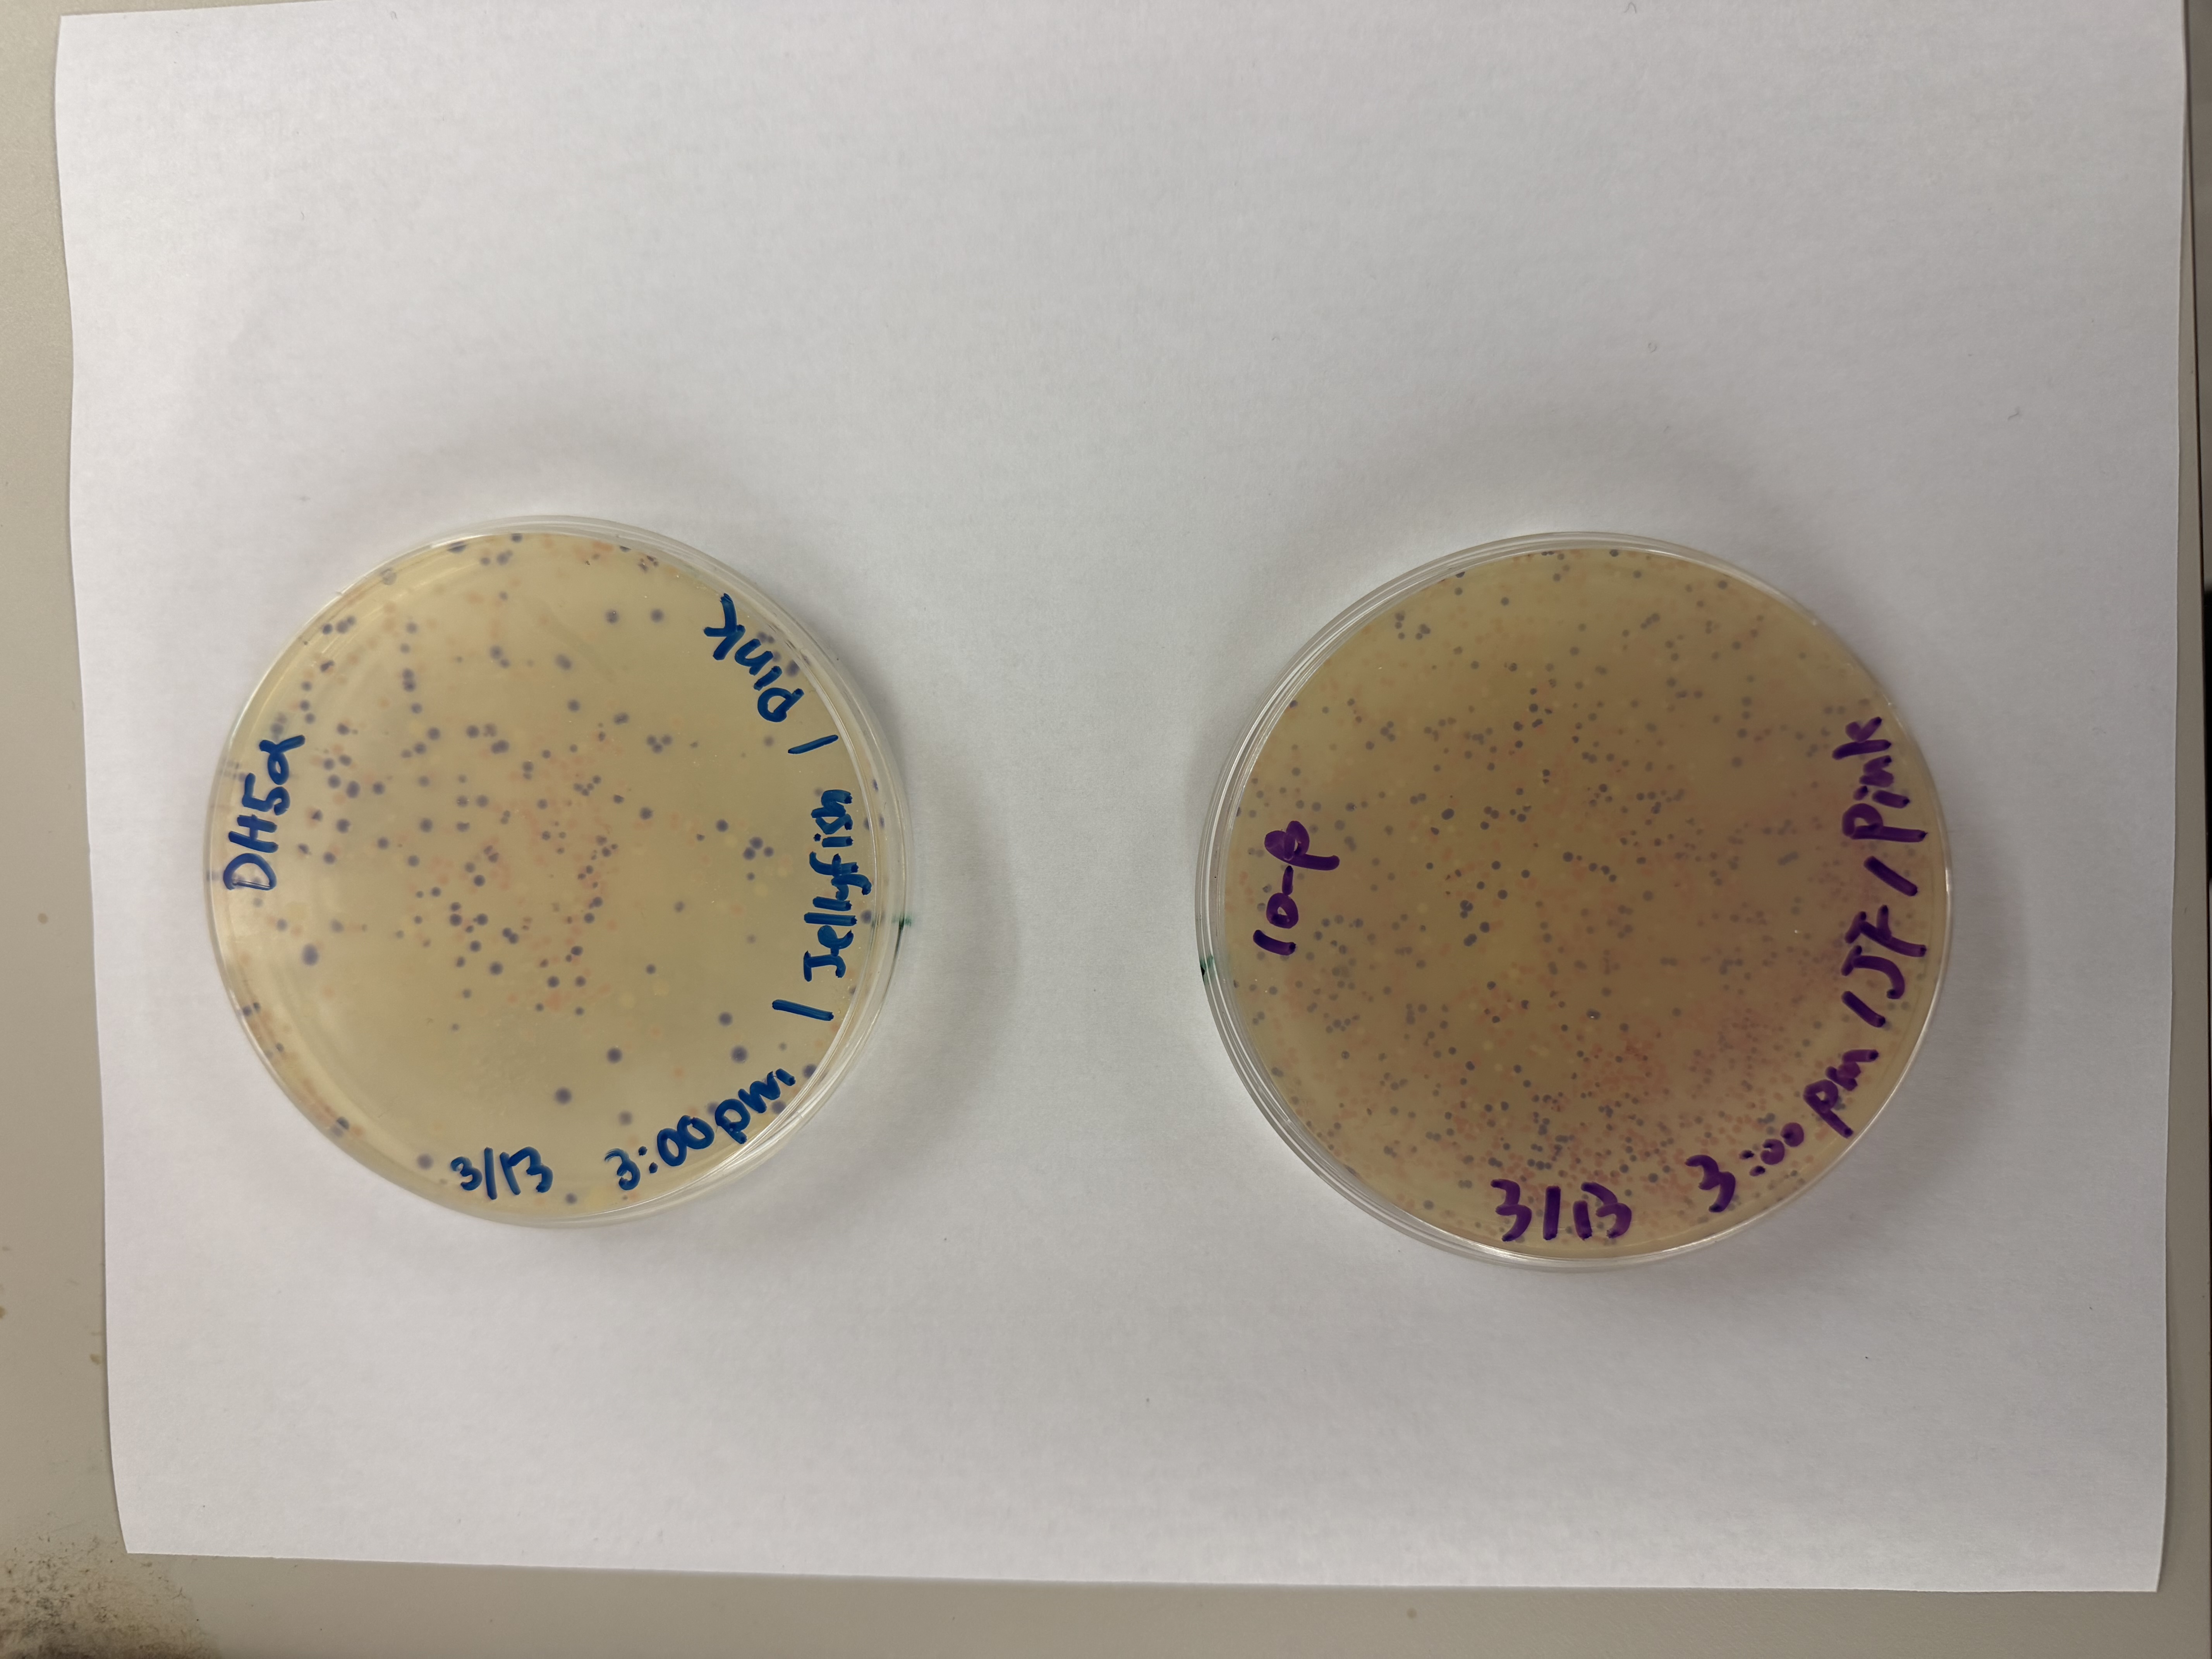
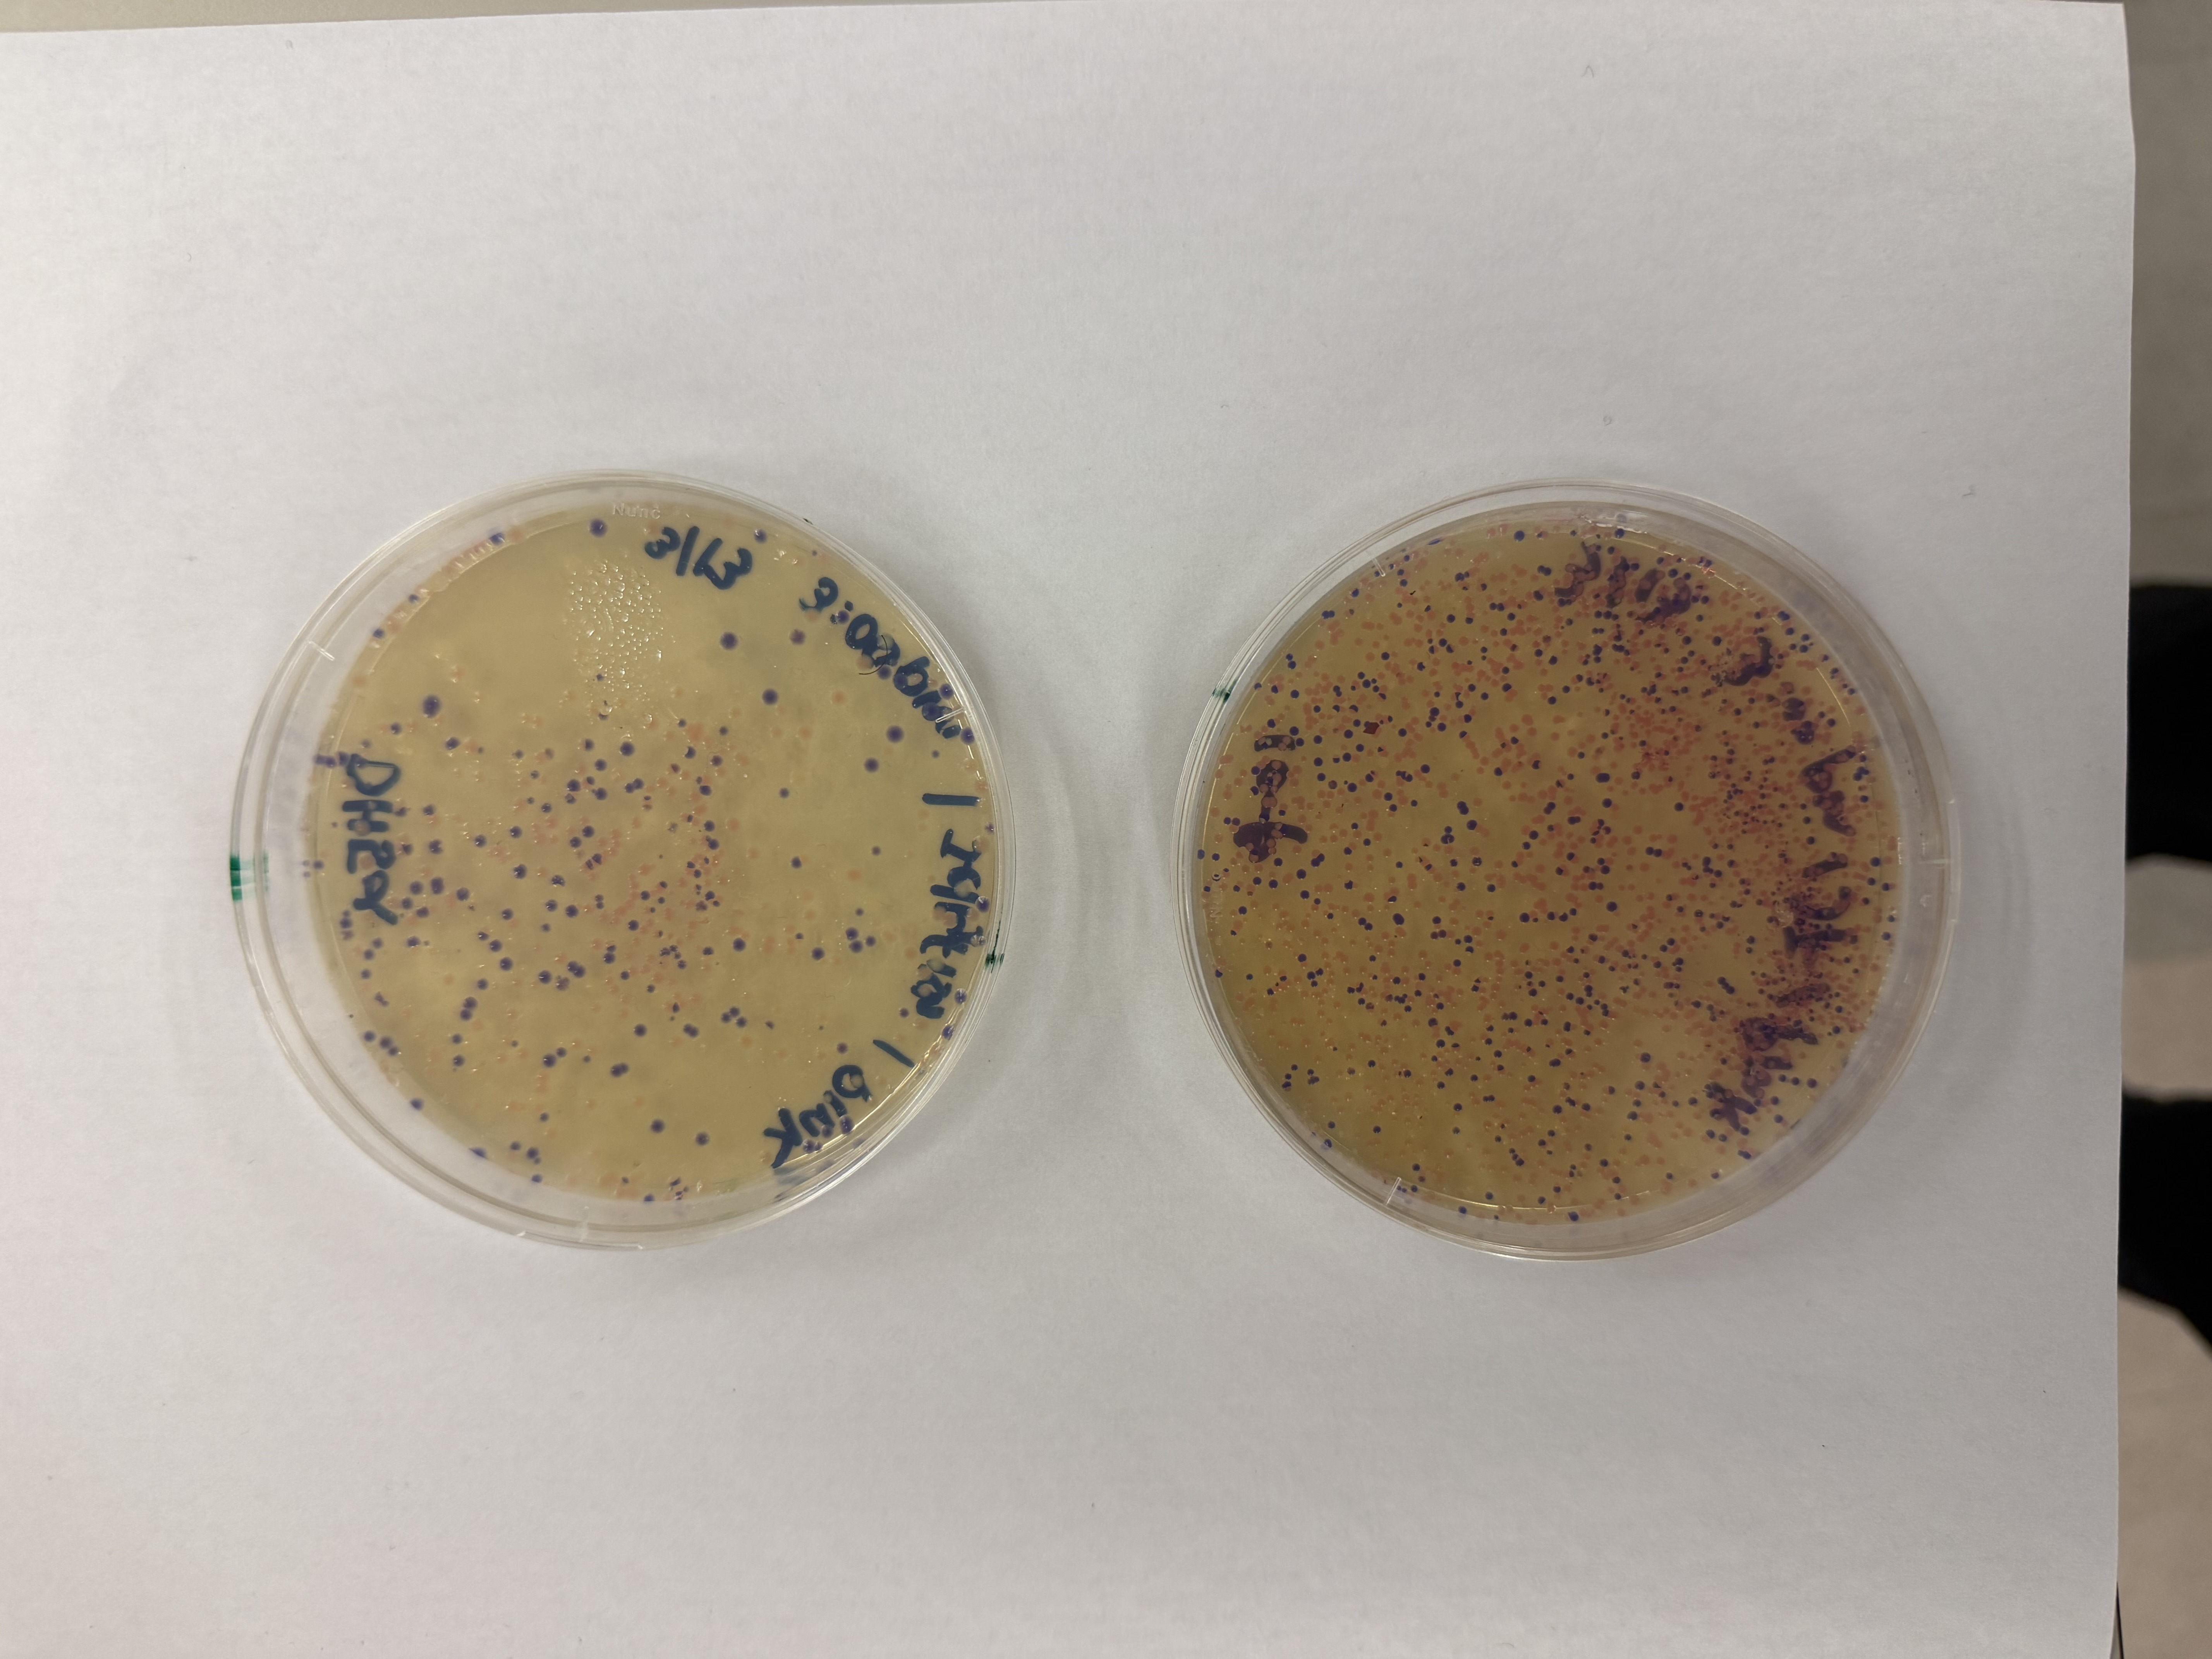
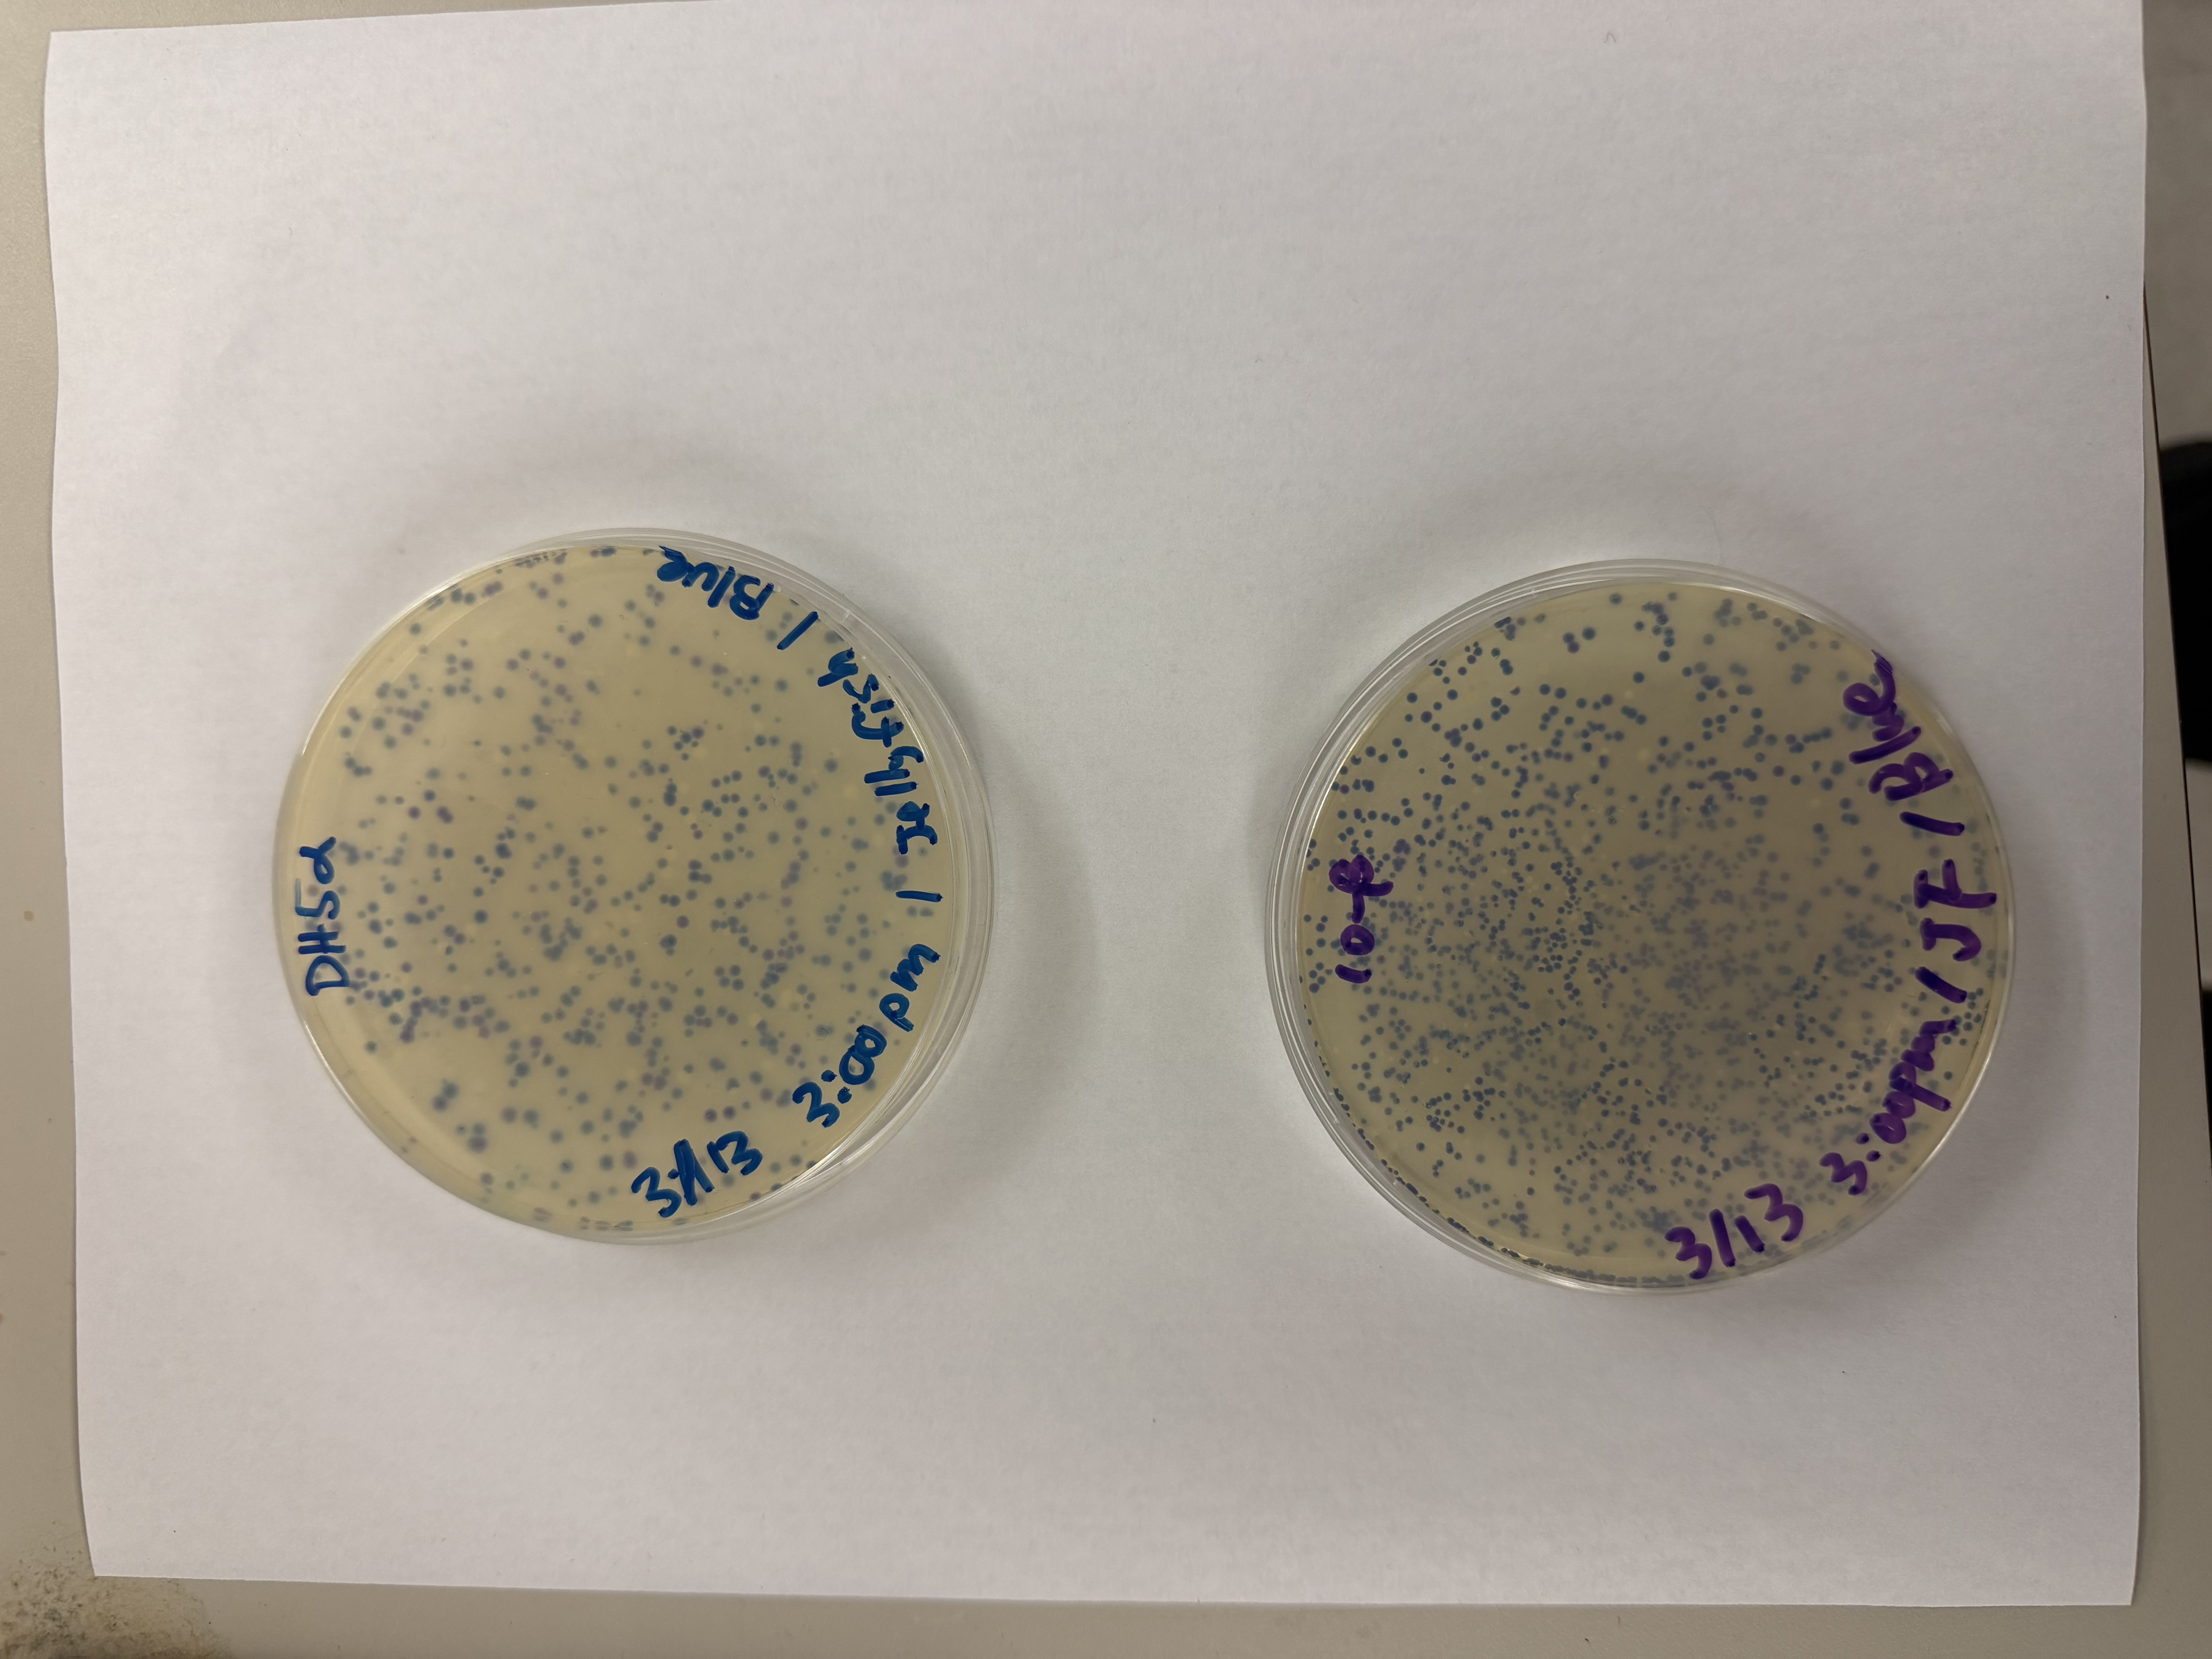
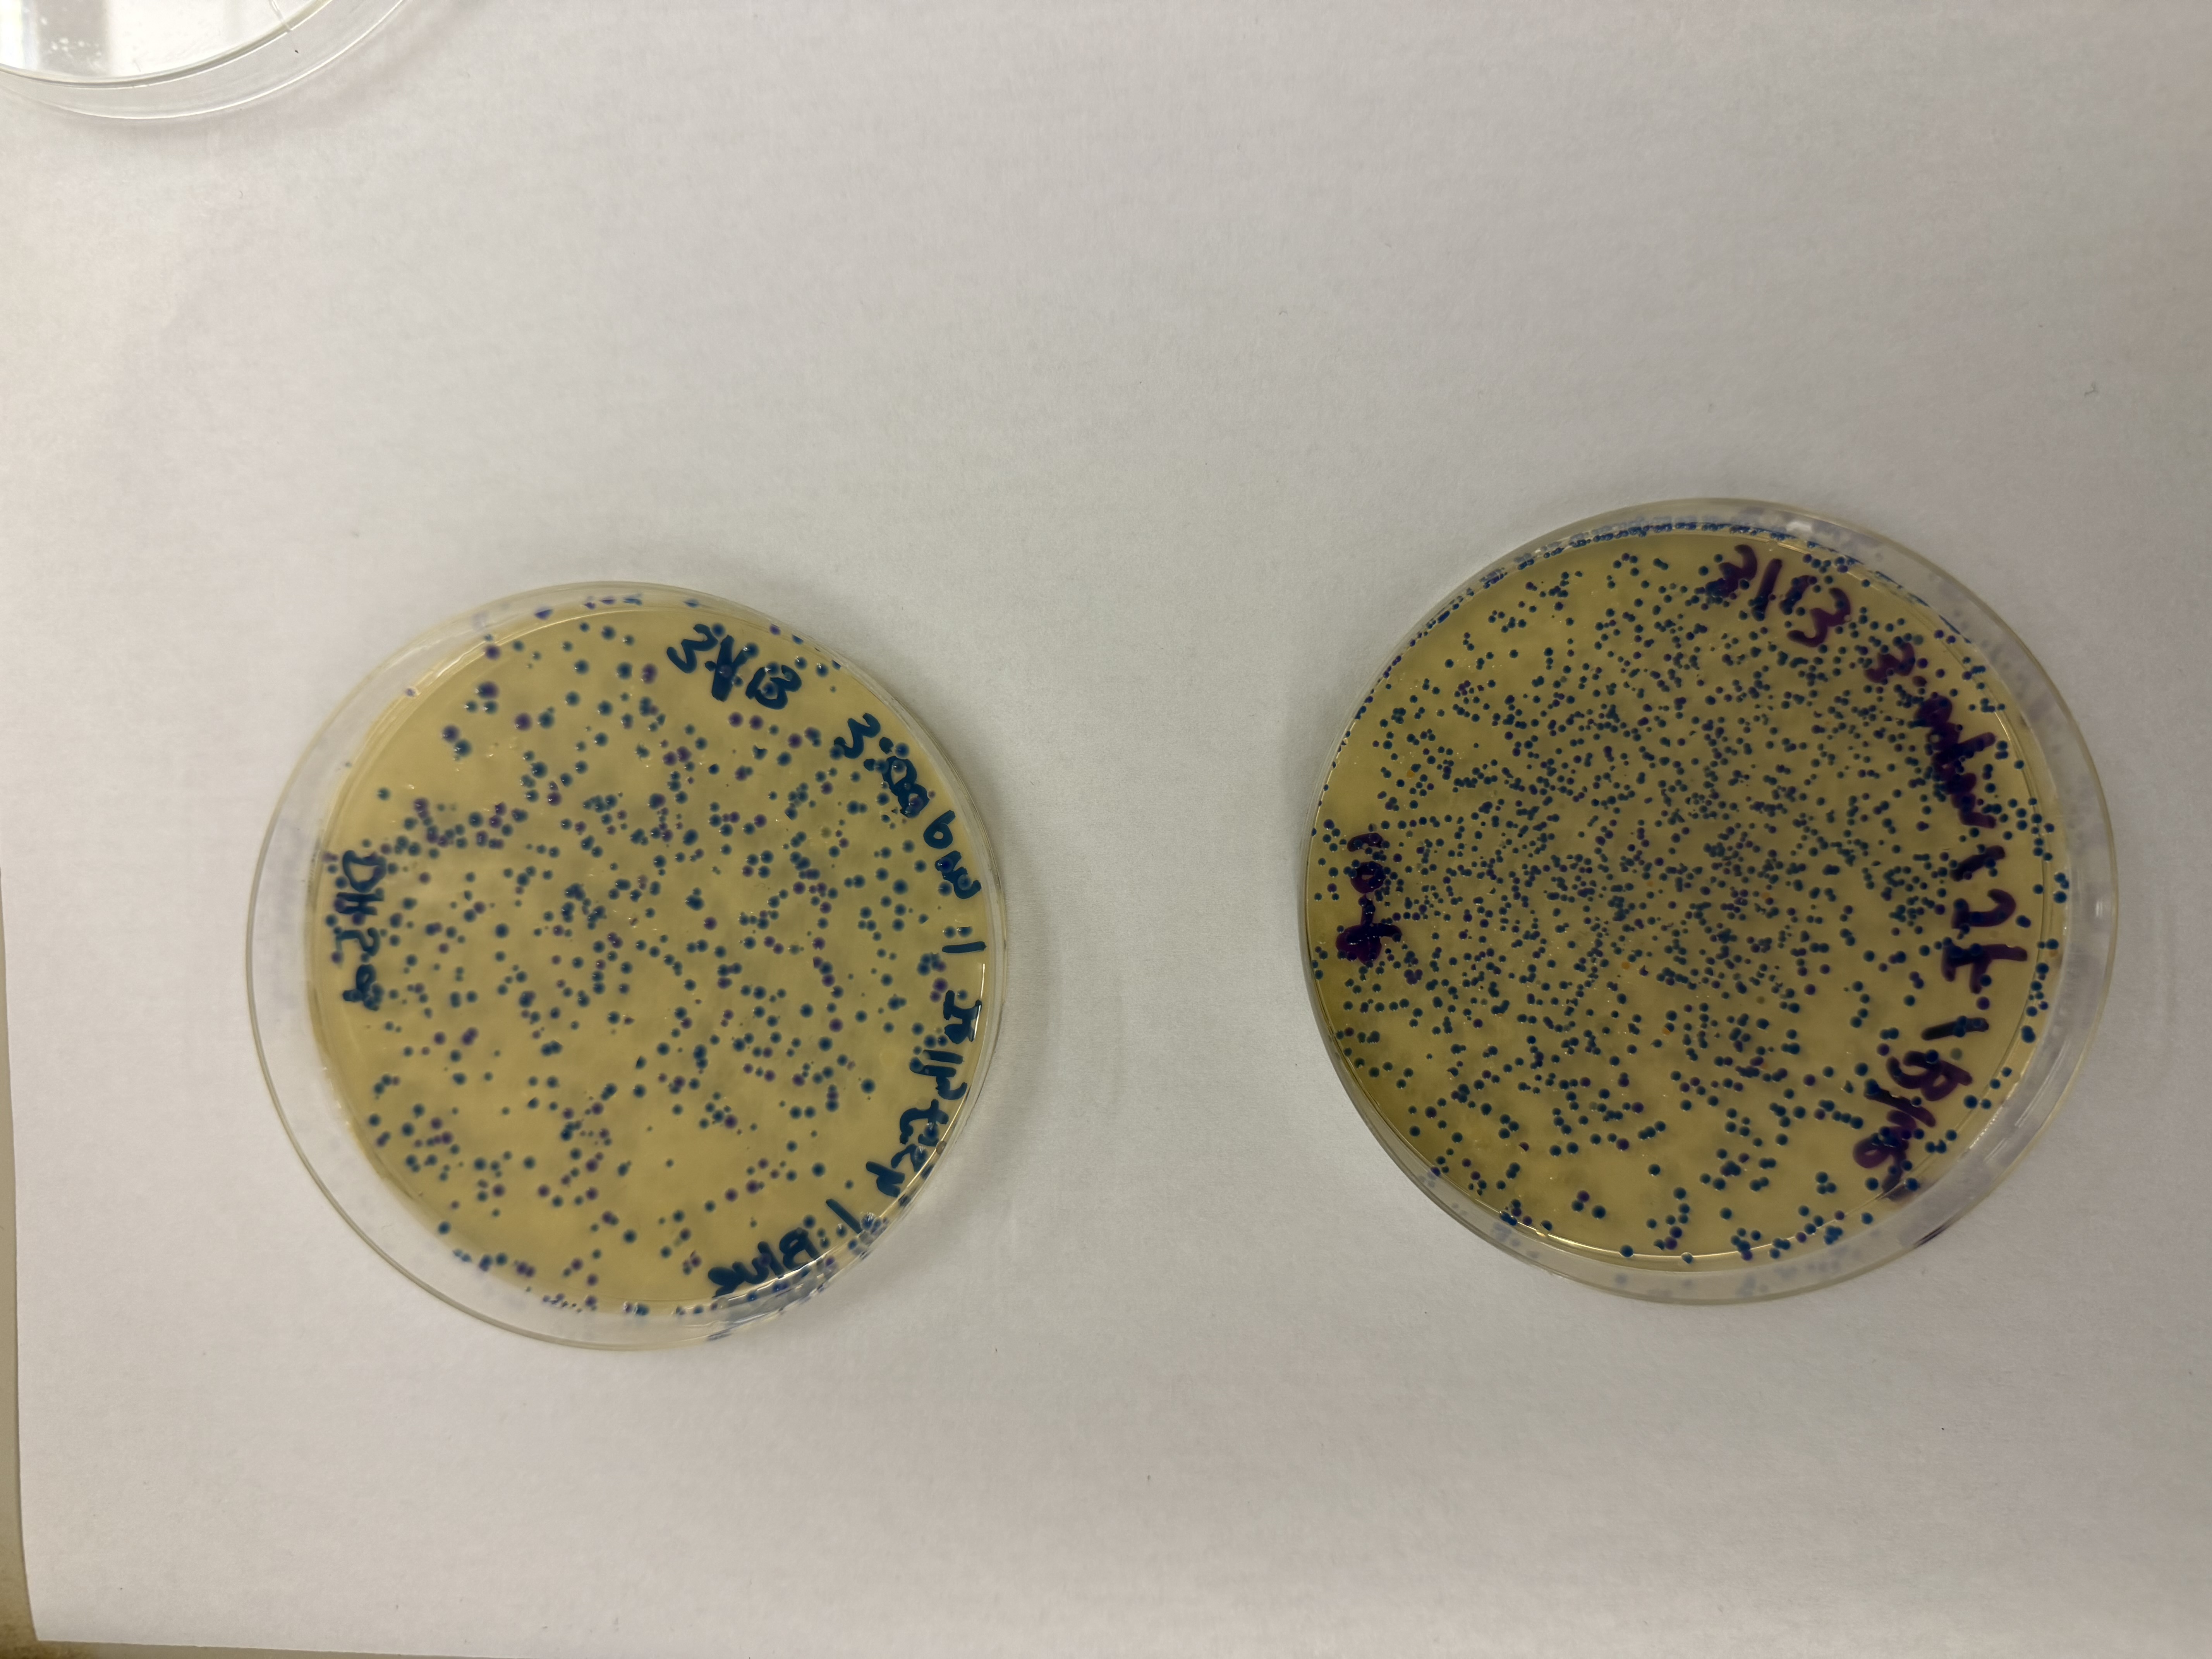
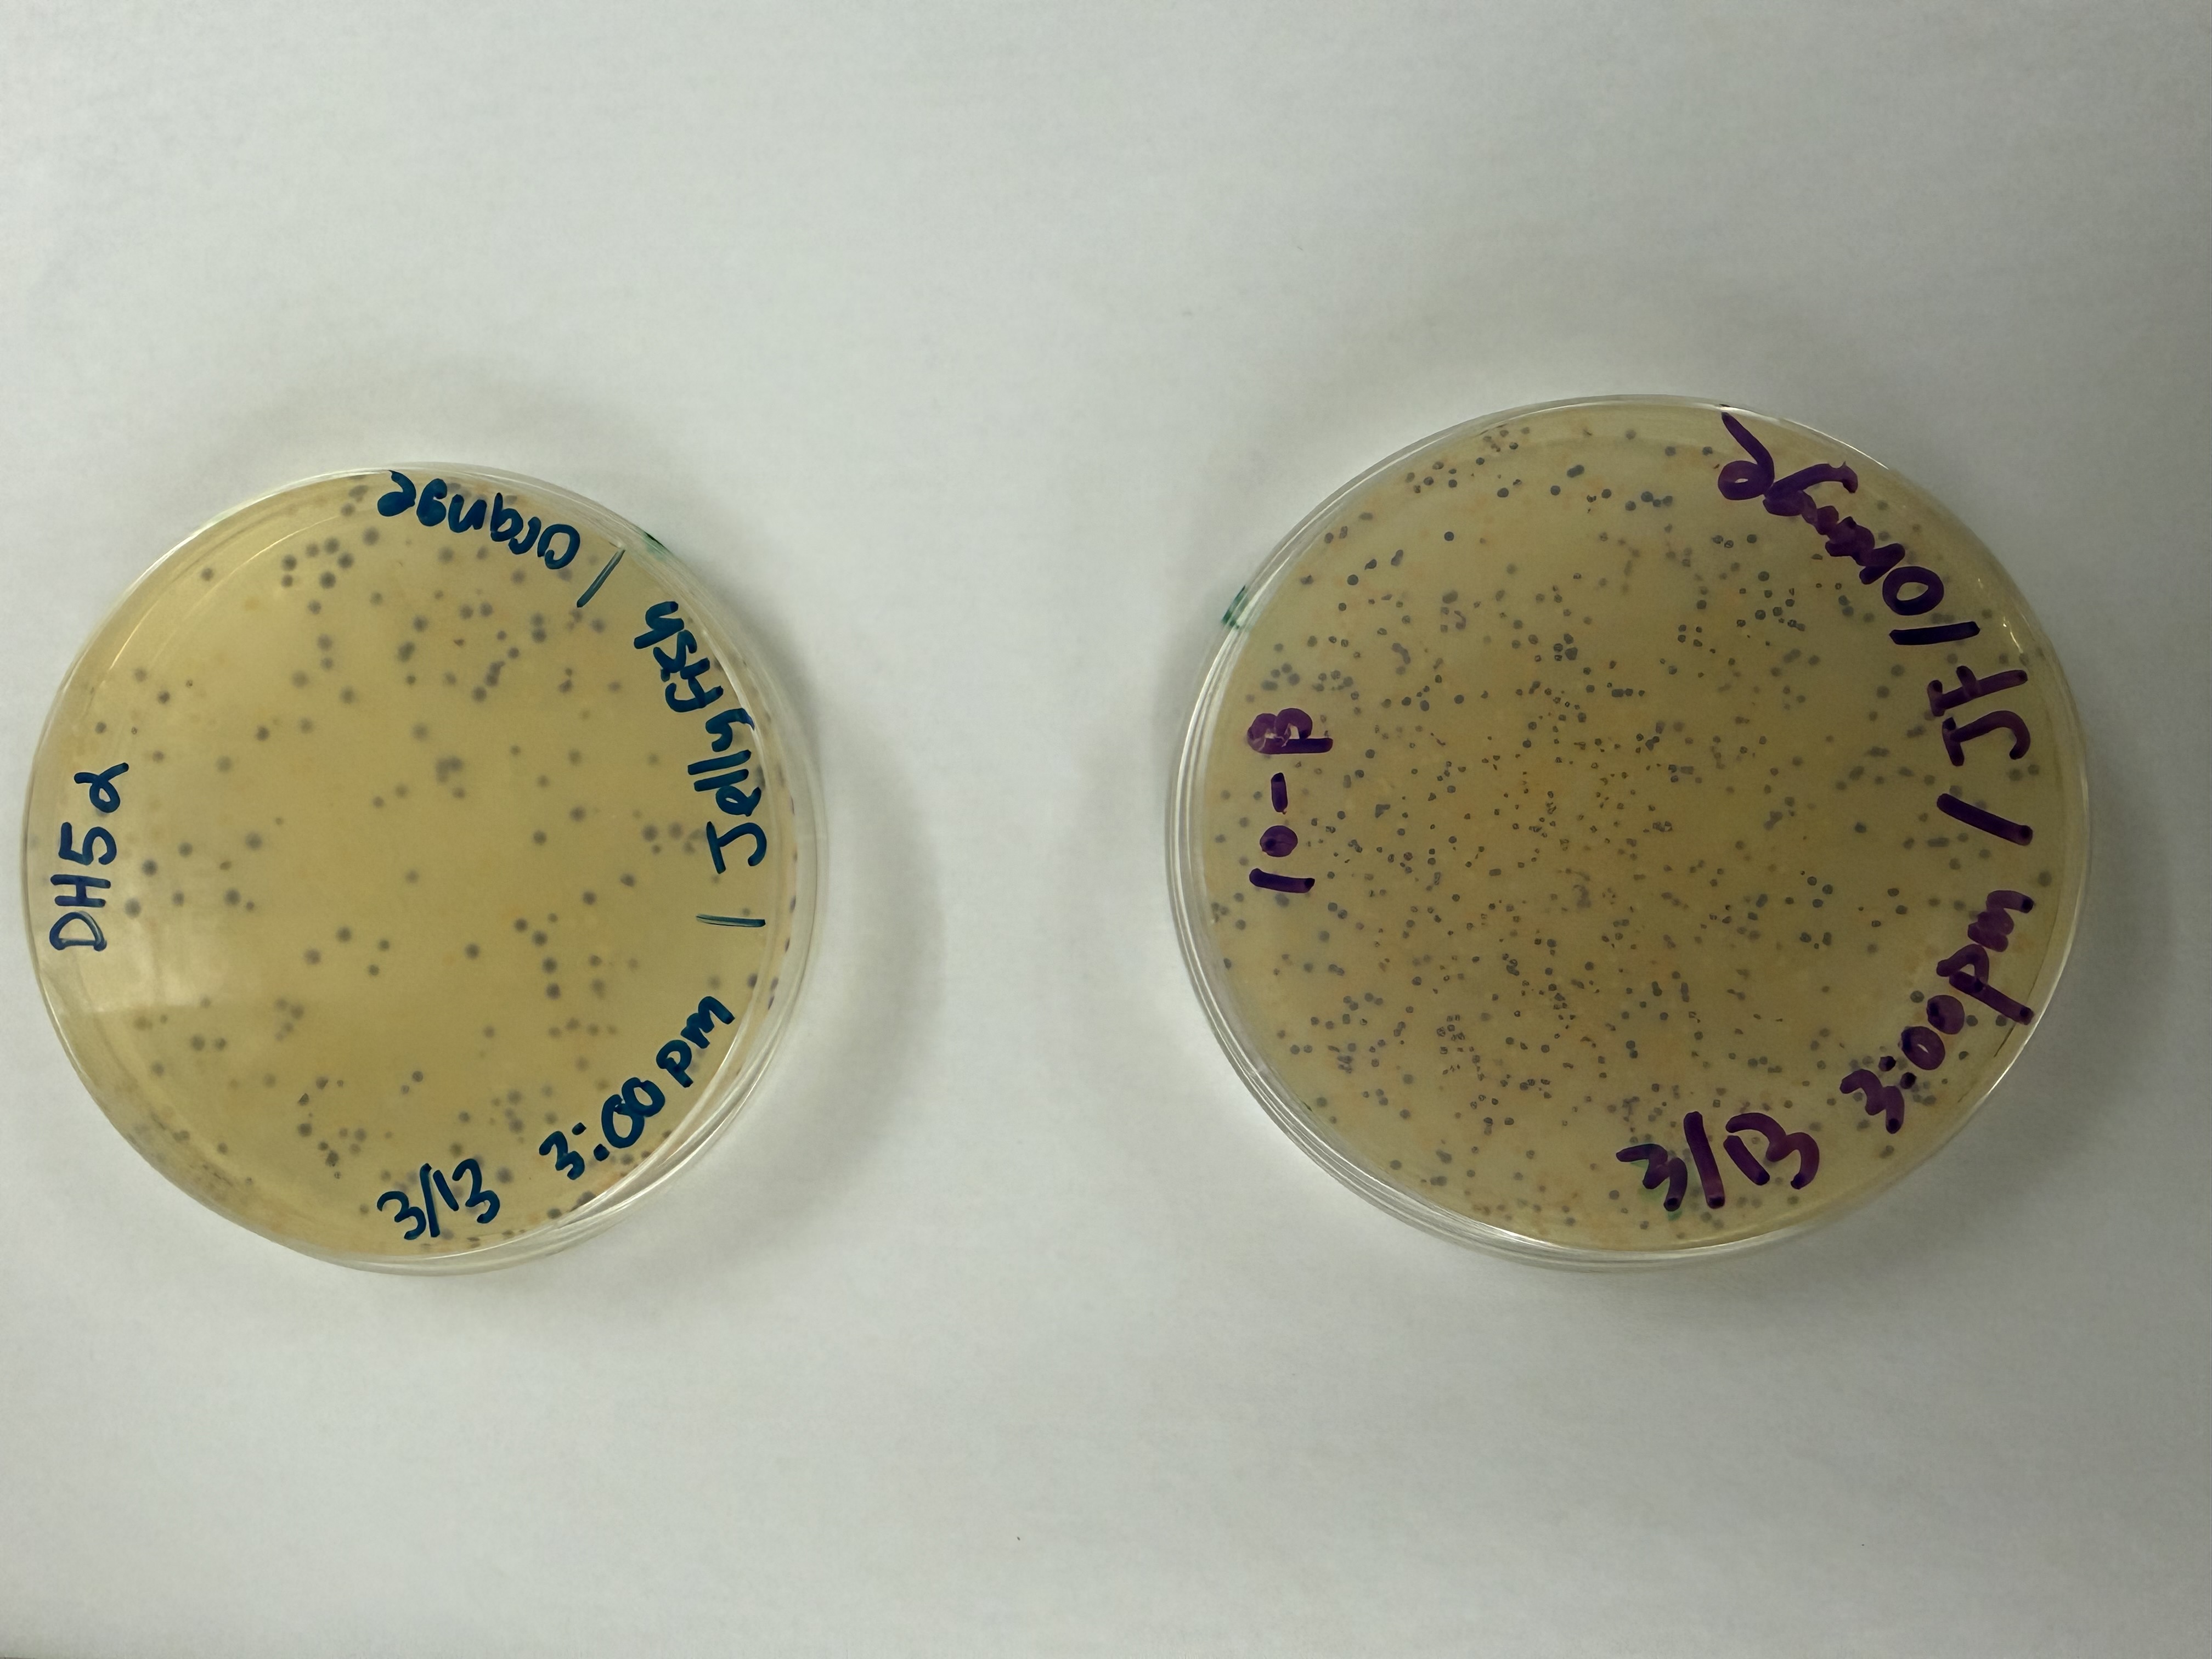
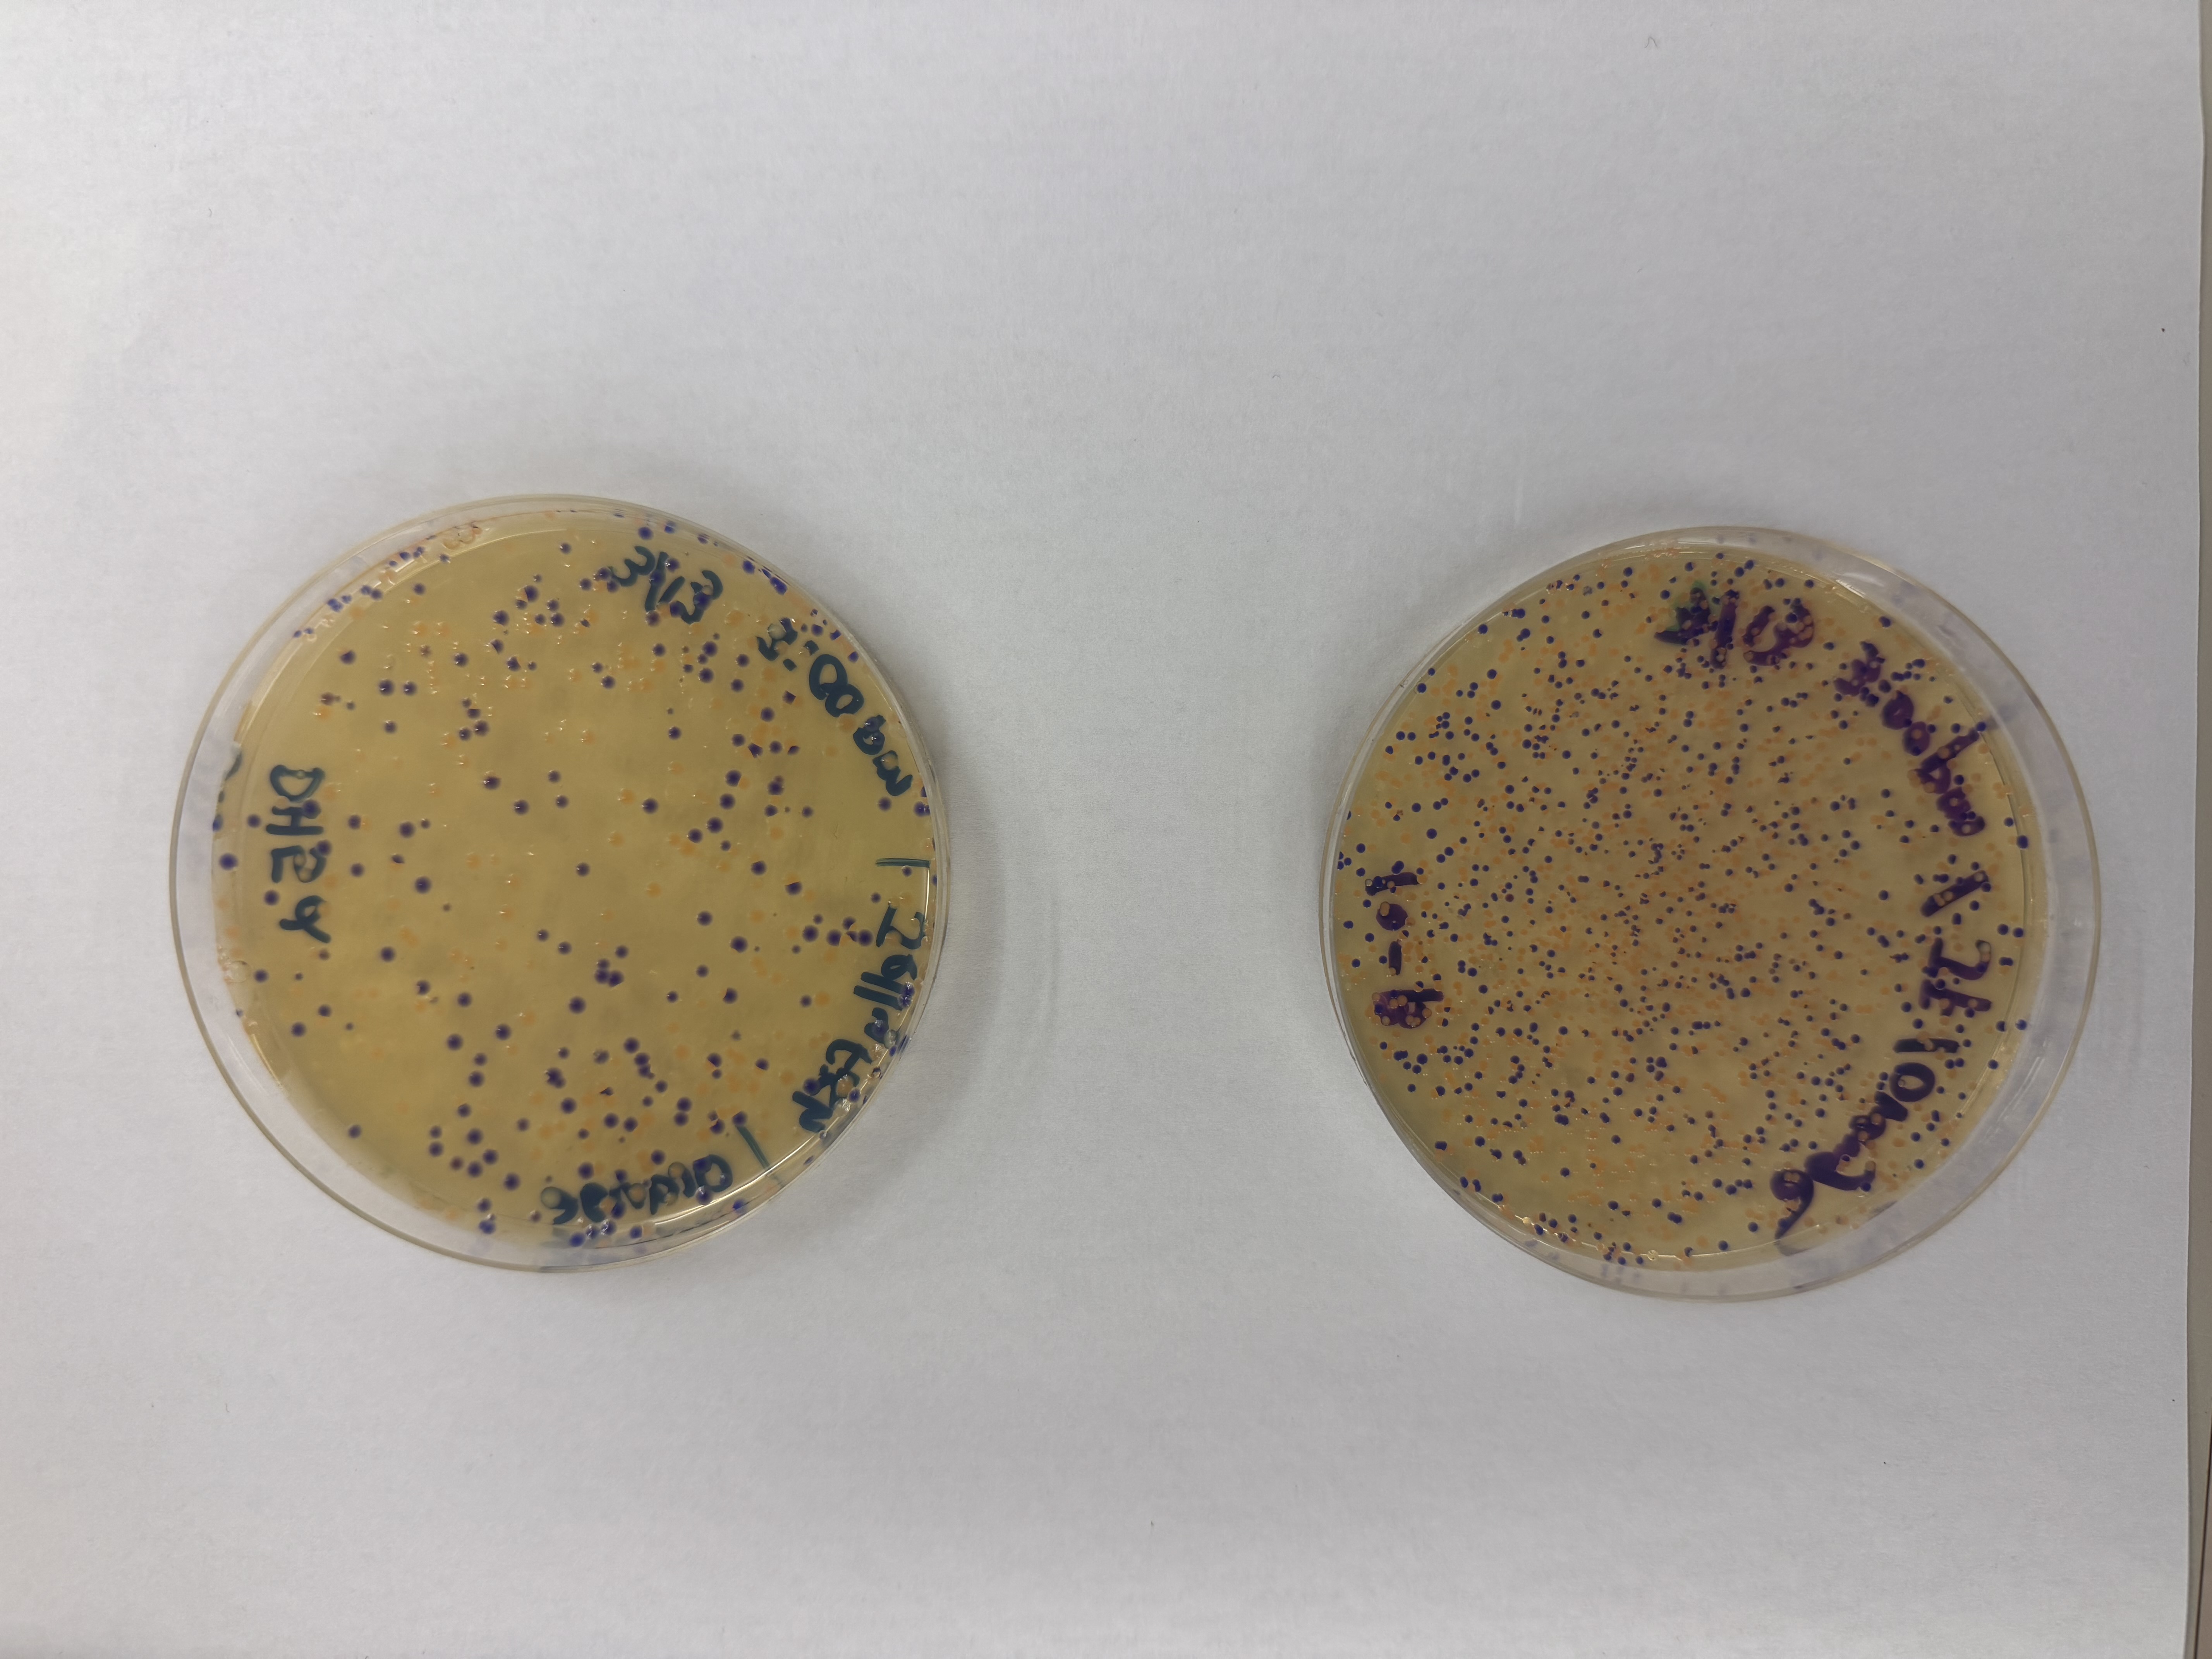
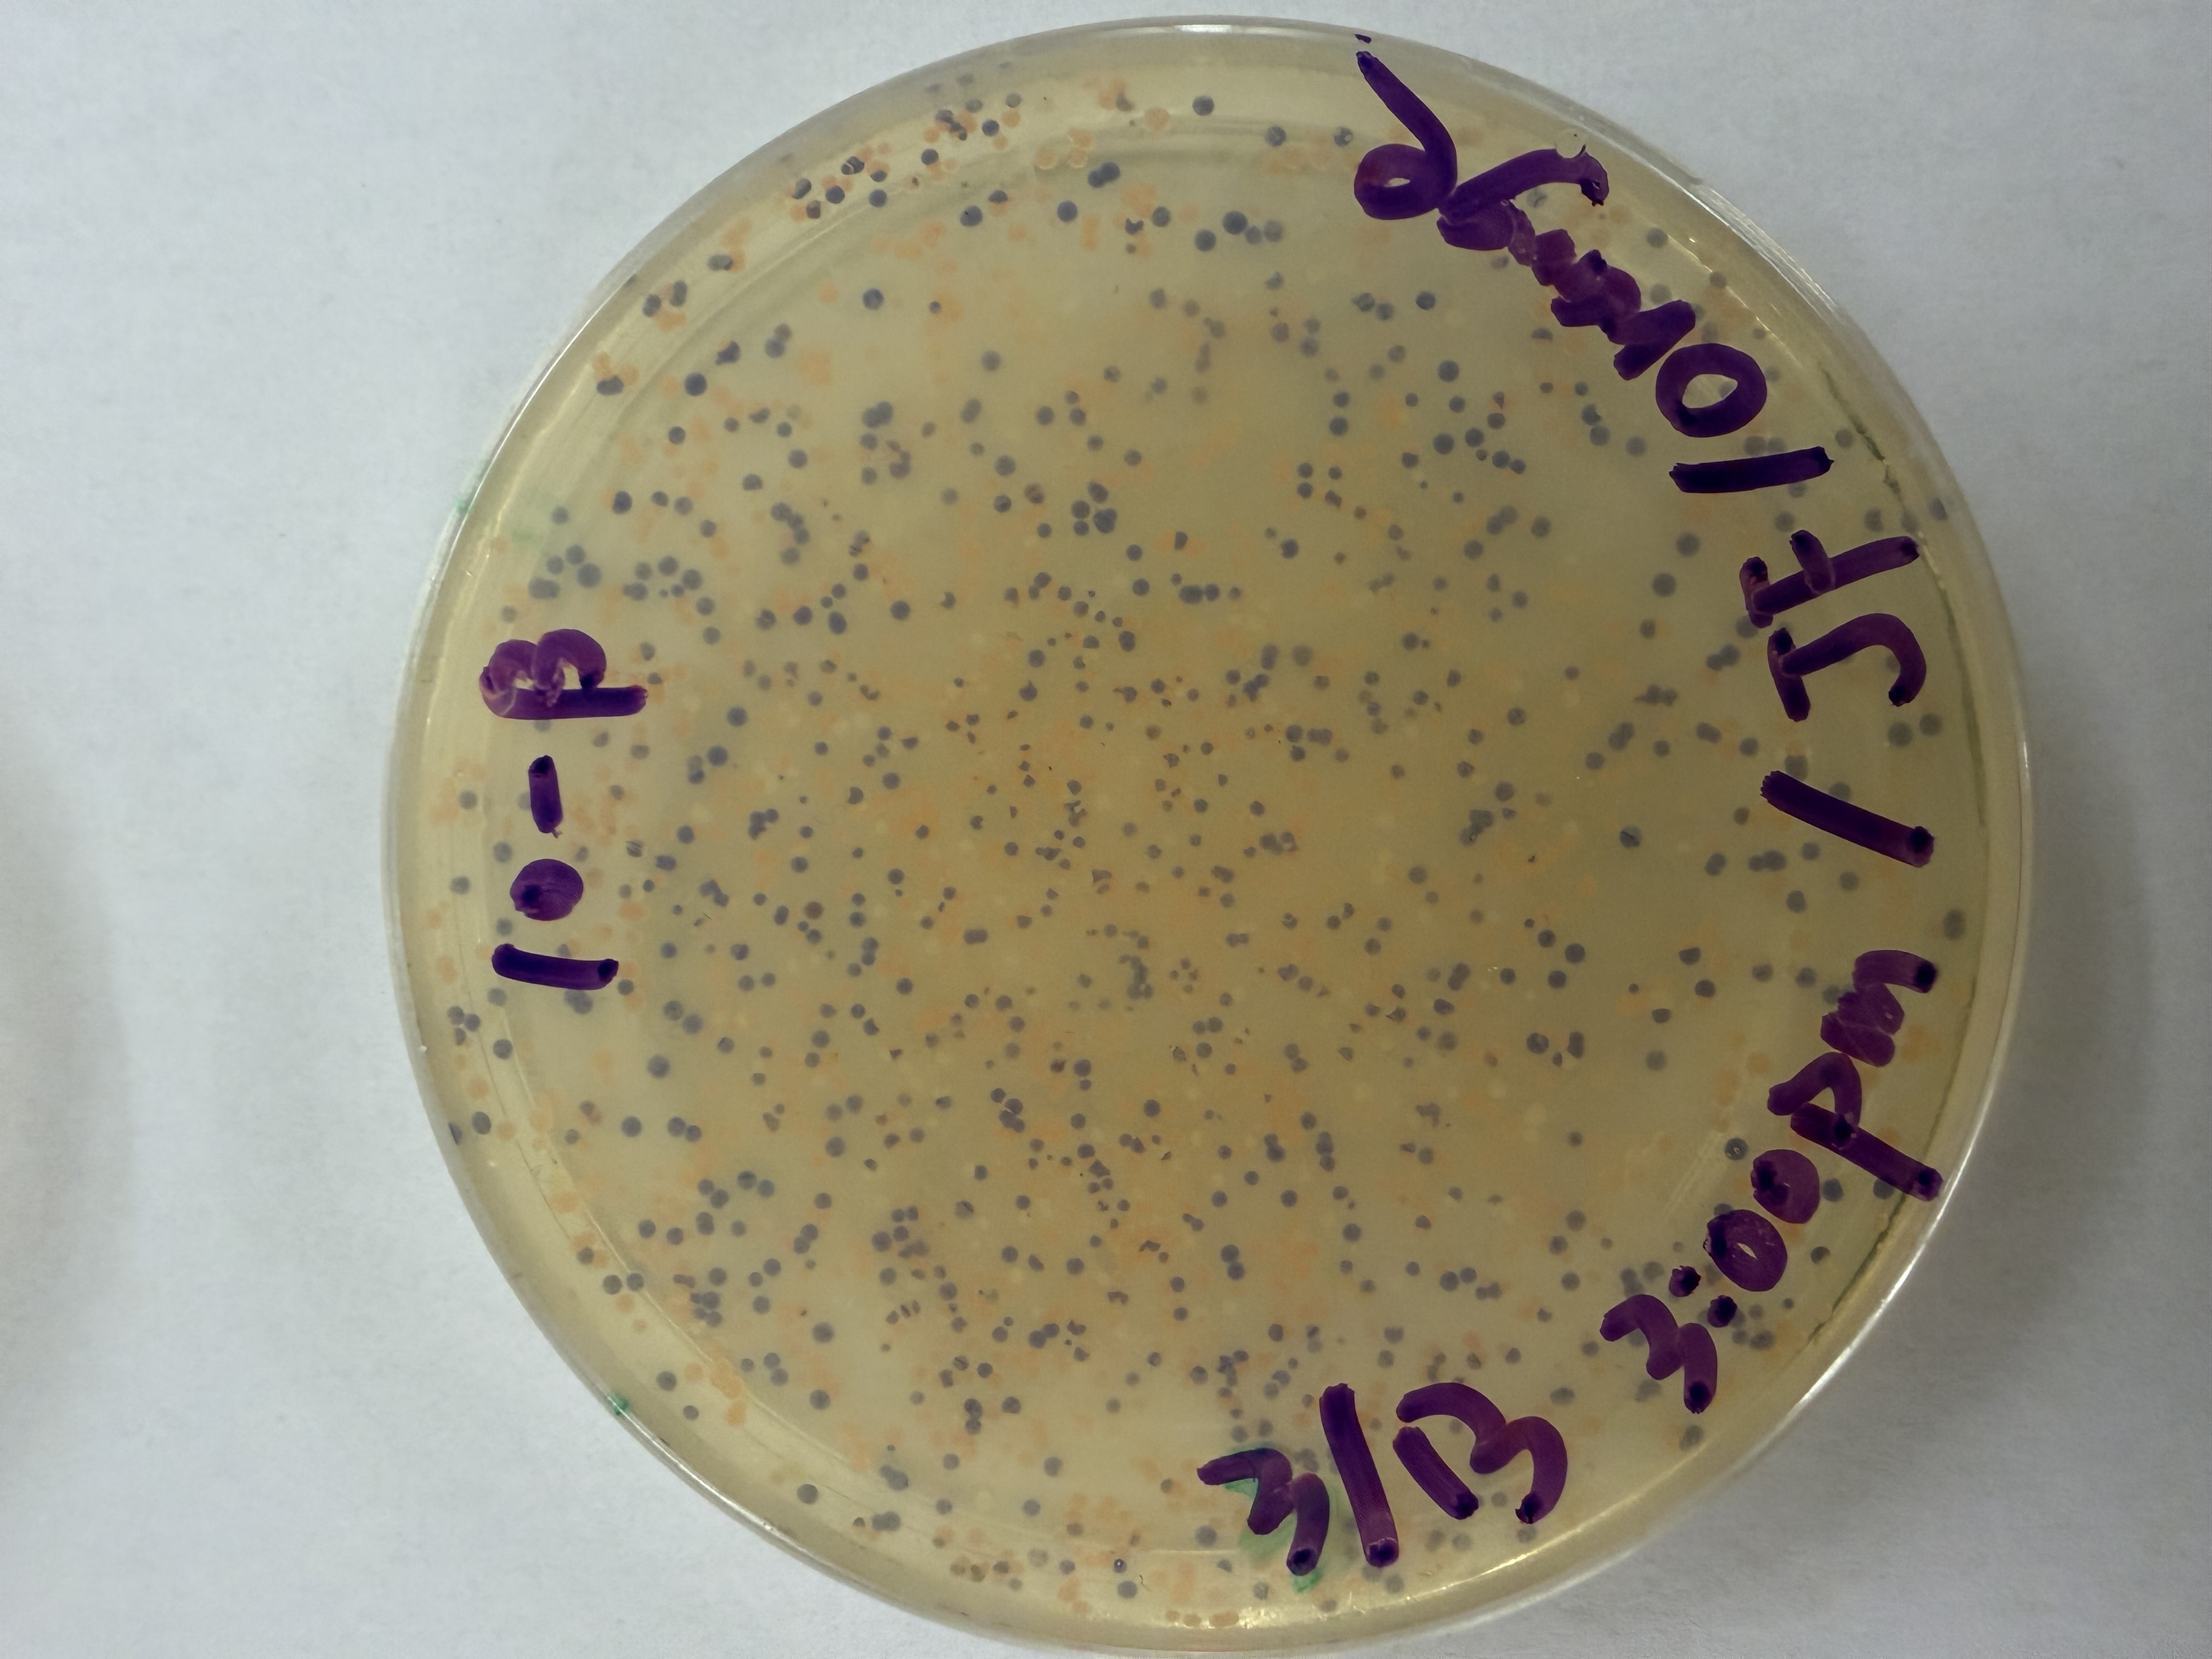
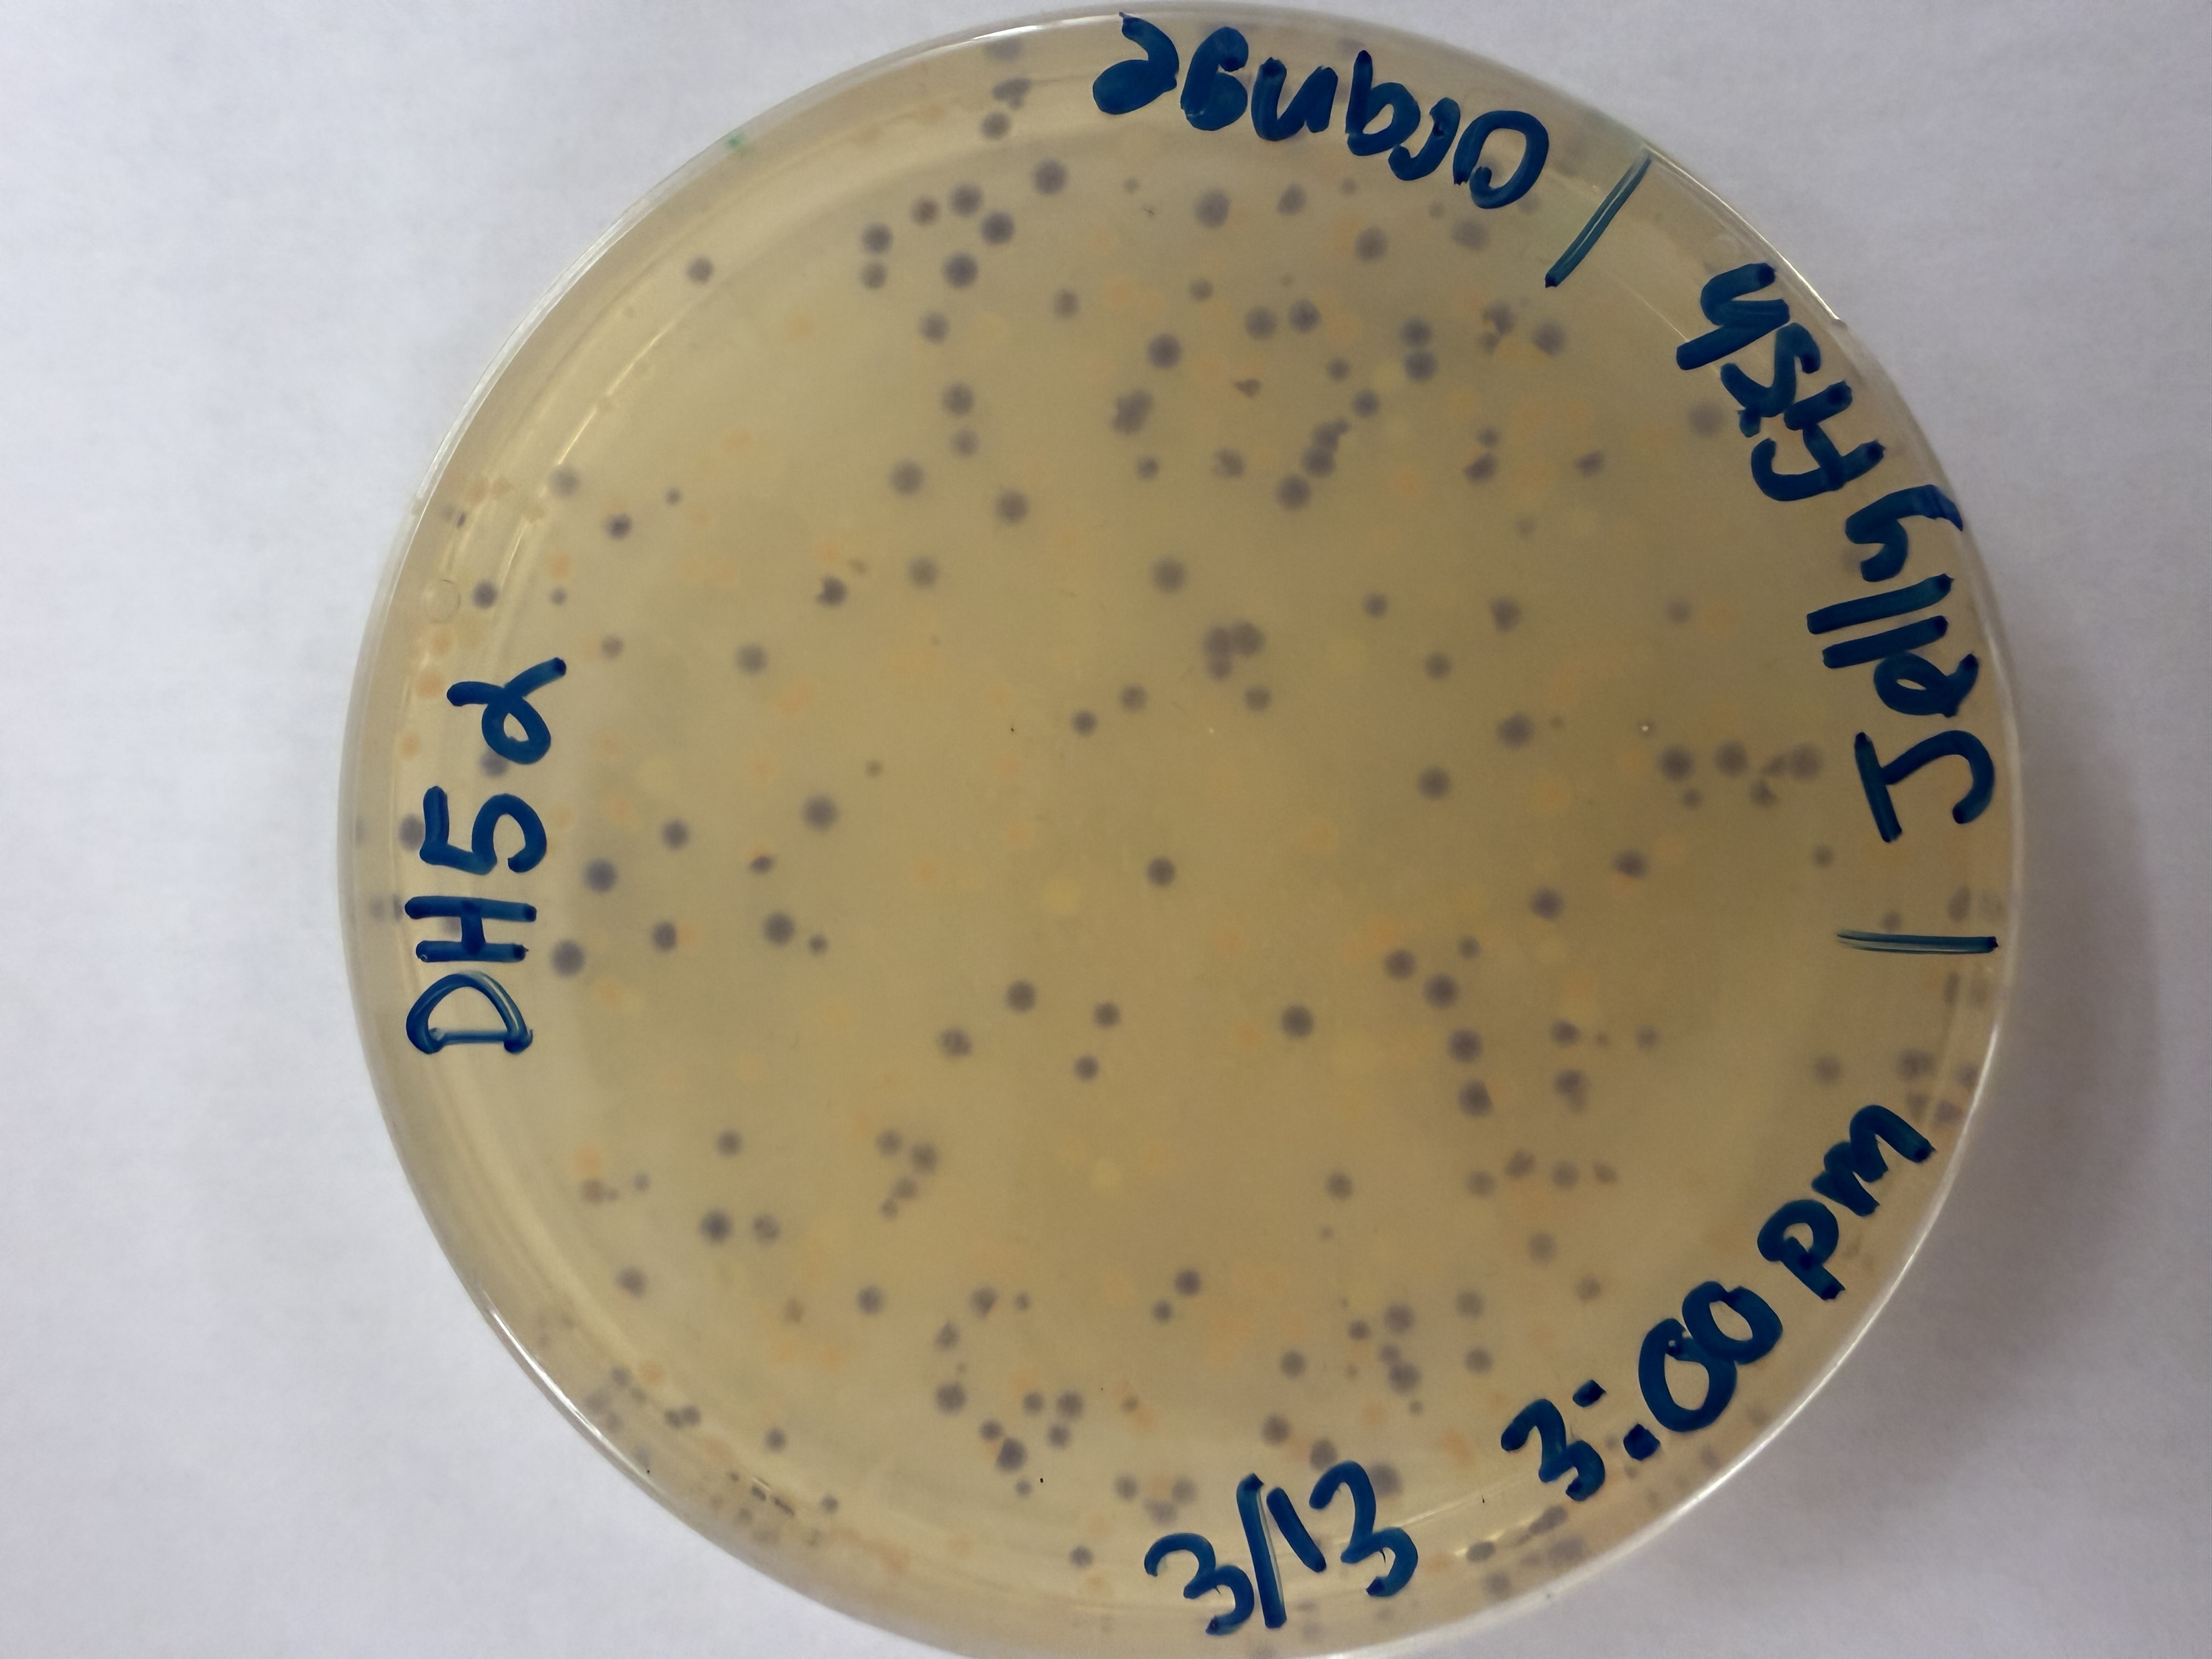
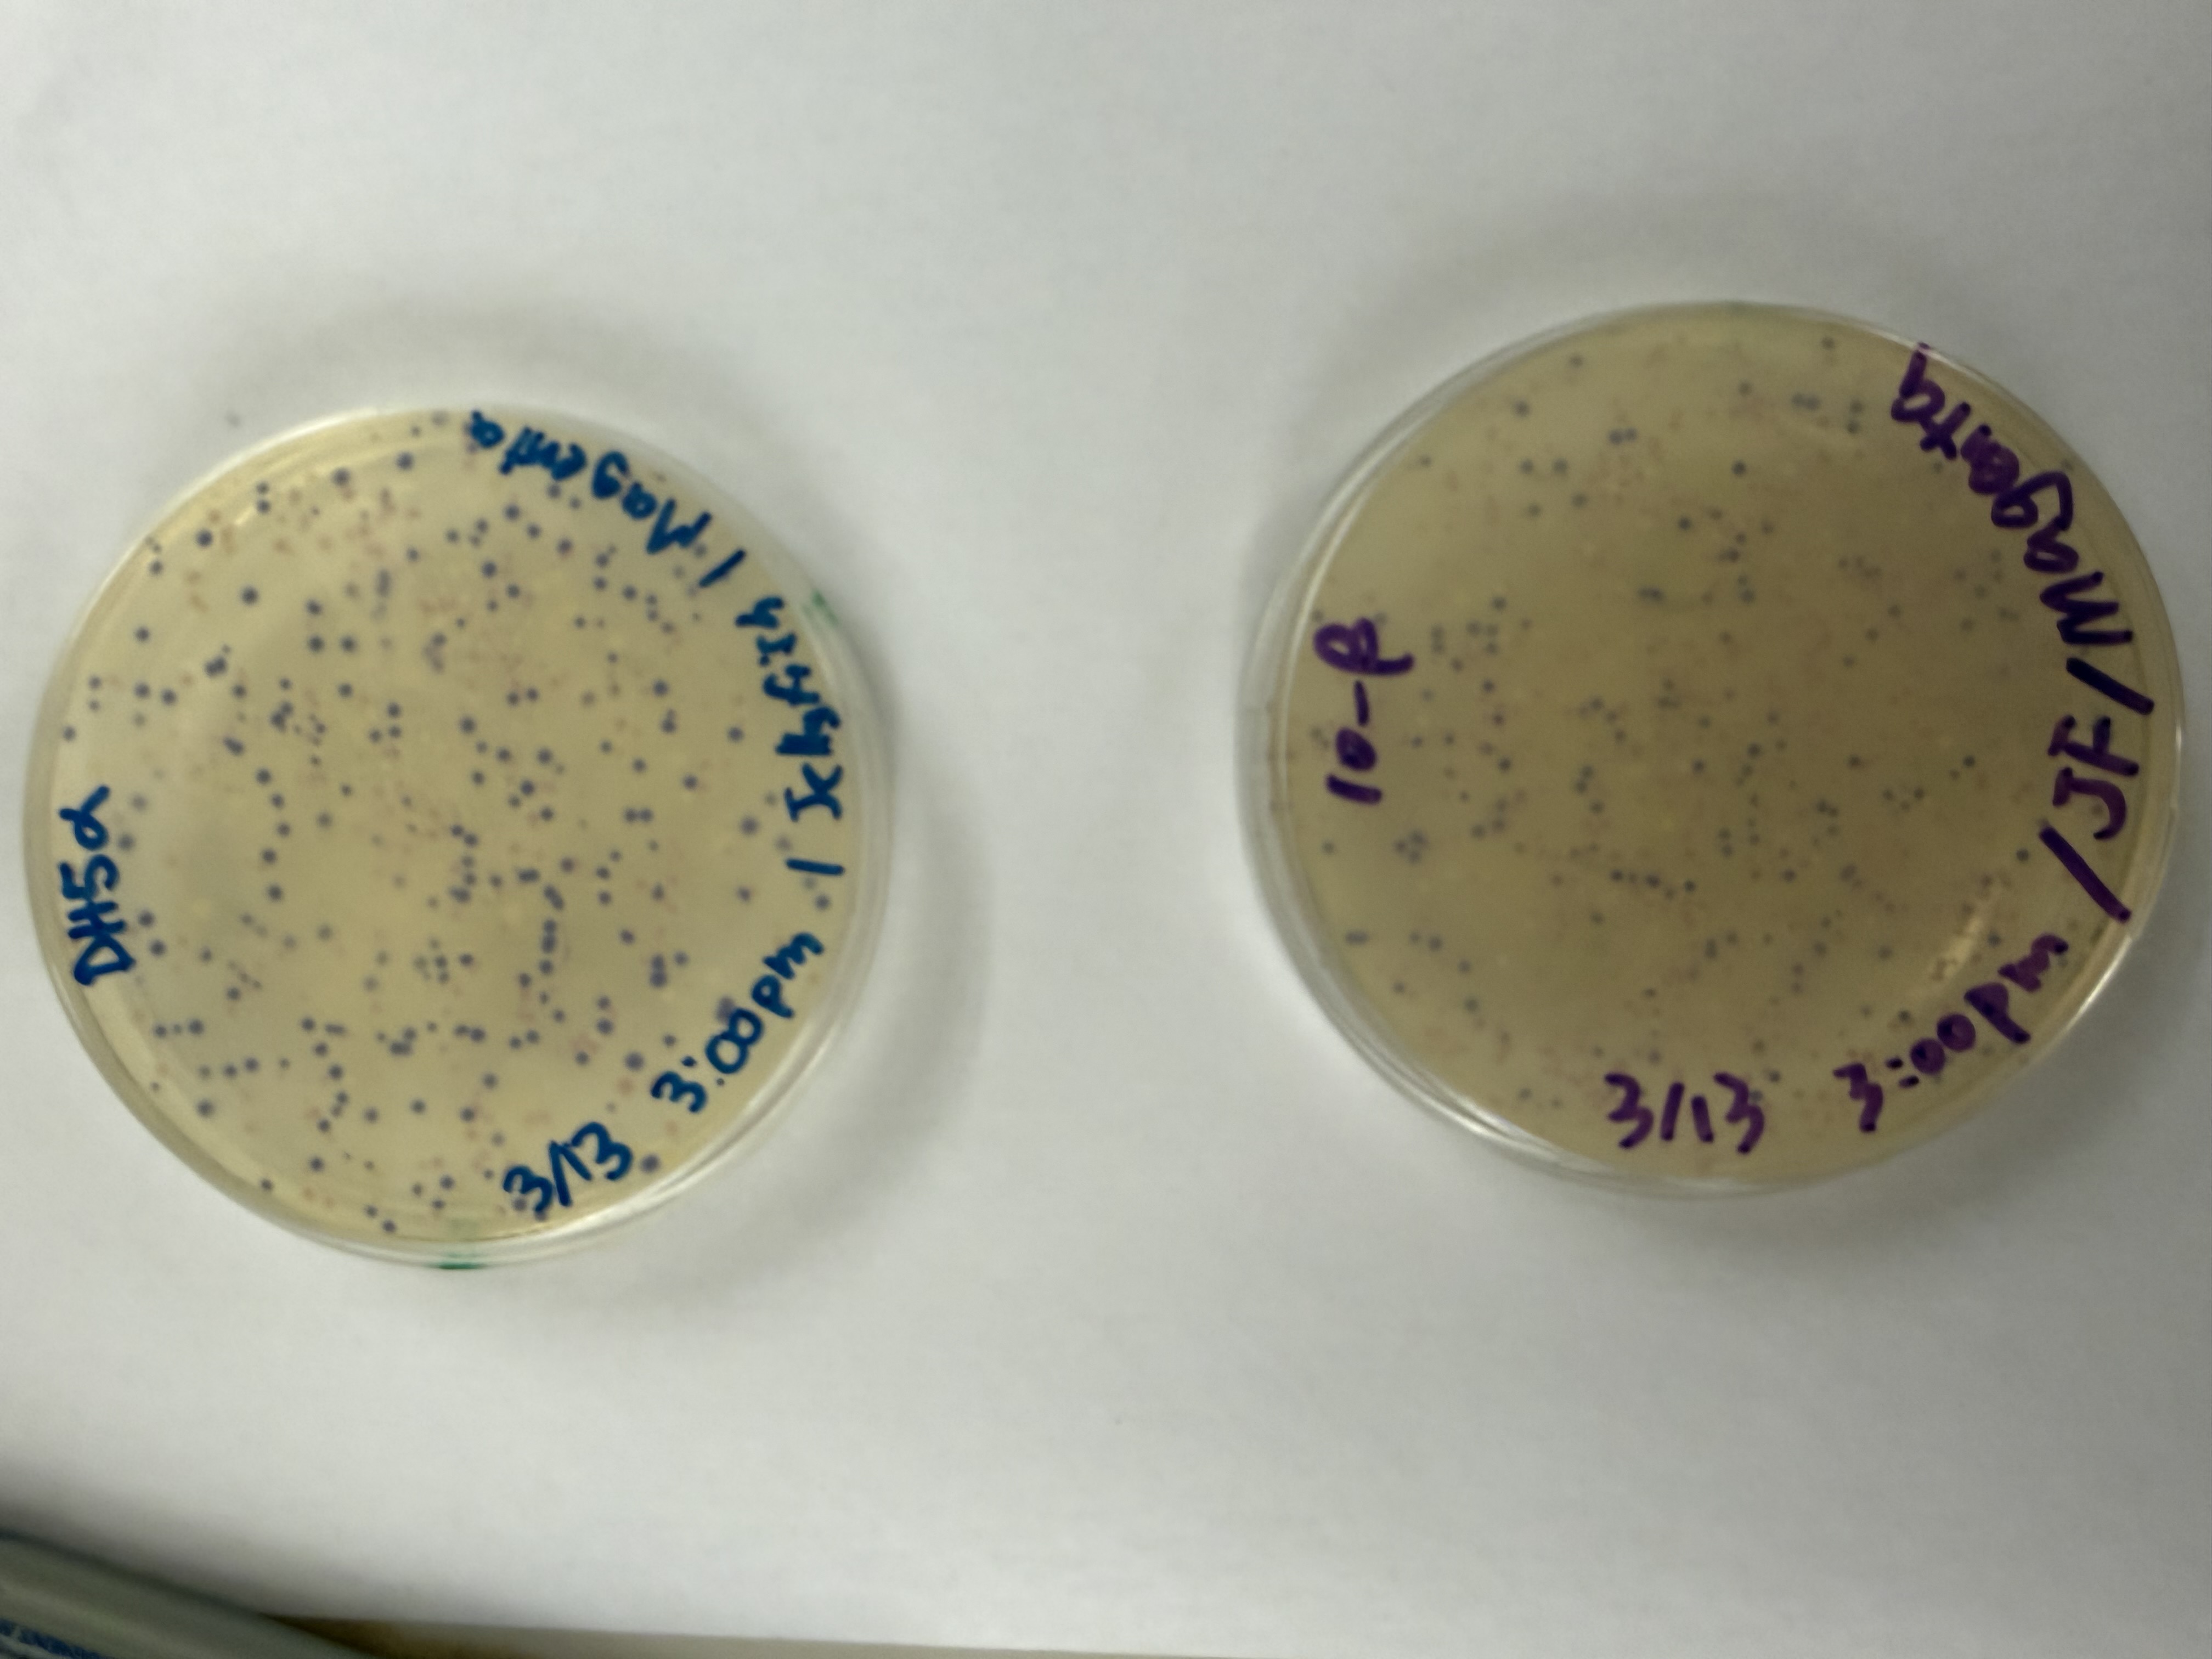
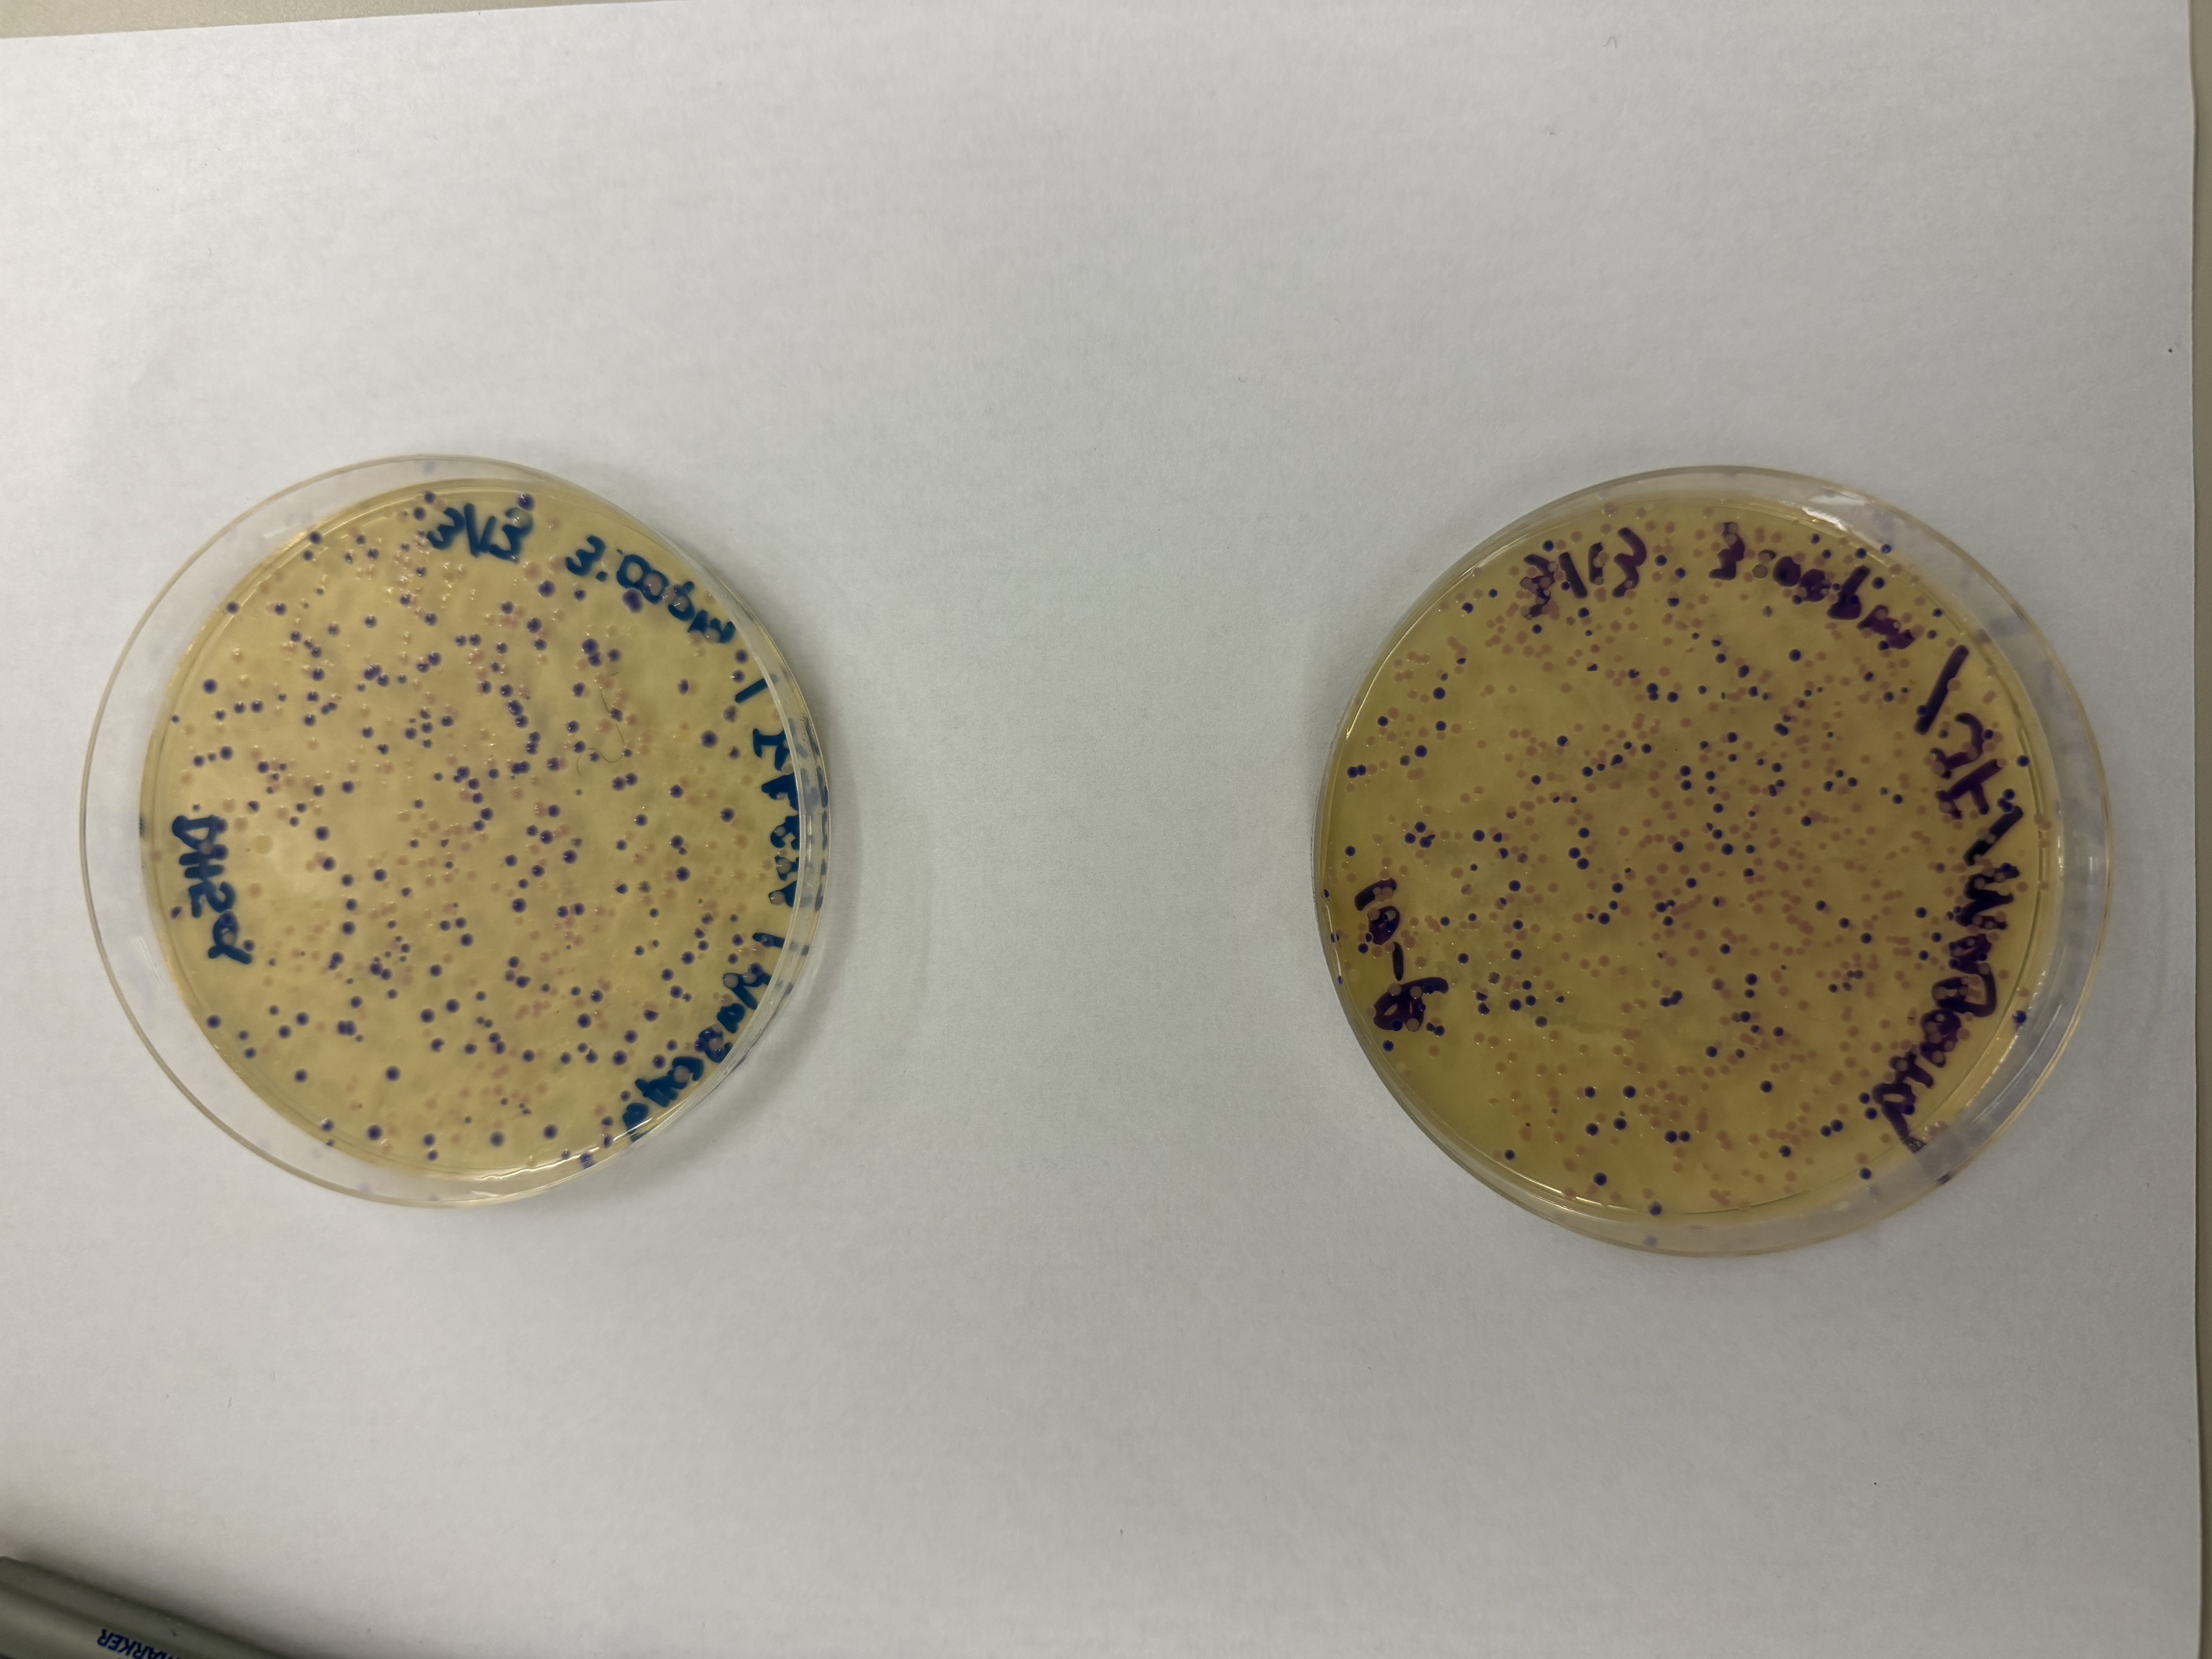
Day 1: Preparation of DNA Fragments Background In this two-day lab, we modified the color-generating chromophore of the purple Acropora millepora chromoprotein (amilCP) to create a variety of orange, pink, and blue mutants.
We performed two sets of Polymerase Chain Reactions (PCR) to prepare for a Gibson Assembly. The insert PCR region spans the 24 base pairs before the chromophore to just beyond the gene transcription terminator. The forward primer includes an intentional mismatch for site-directed mutagenesis of the mUAV DNA plasmid. These mutants were then expressed in chemically competent E. coli cells.
Intracellular Artificial Neural Networks (IANNs) In this two-day lab, we designed and built our very own IANN using a library of plasmids from the Ron Weiss lab and human embryonic kidney (HEK) 293 cells. IANNs differ from traditional synthetic genetic circuits because IANNs can perform analog computations, rather than being limited to digital computations. IANNs are also universal function approximators—given an adequate number of intracellular artificial neurons, you can use an IANN to achieve any input/output behavior you’d like.
Fungal Materials Follow-up The first thing we did was look at our mycelium molds (no pun intended). We are tracking the growth and structural integrity of the fungal networks as they colonize the substrates.
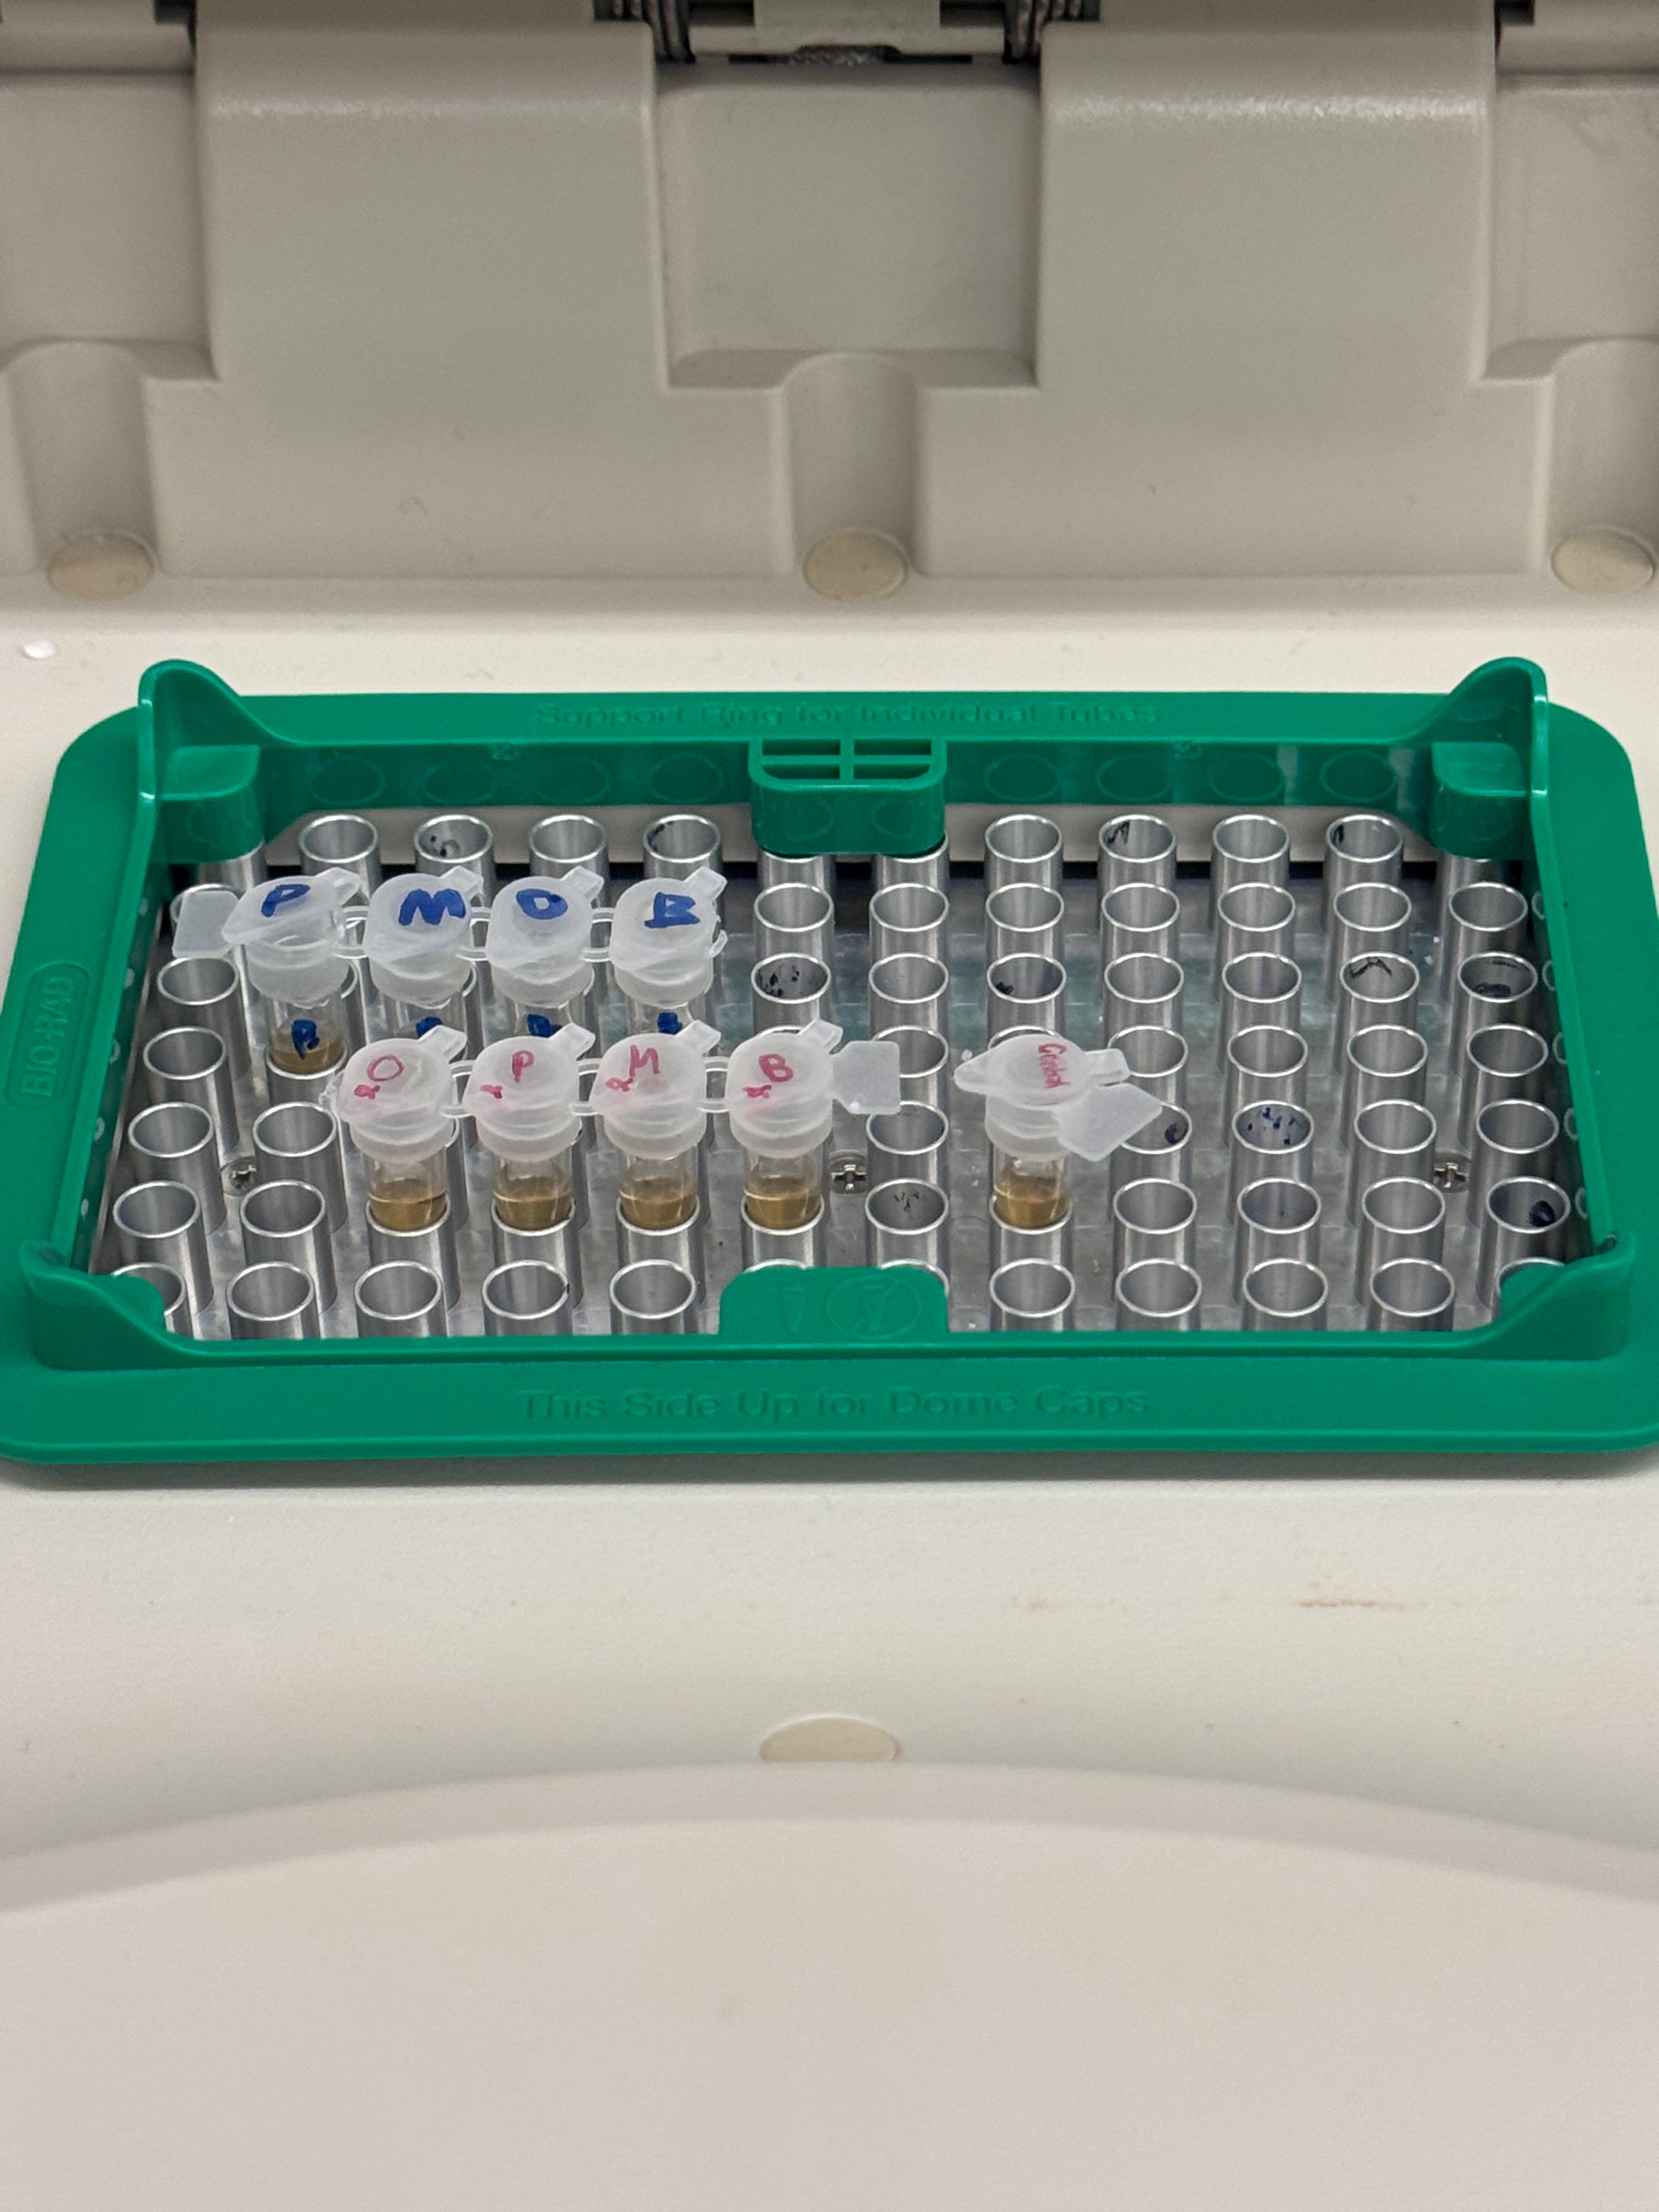
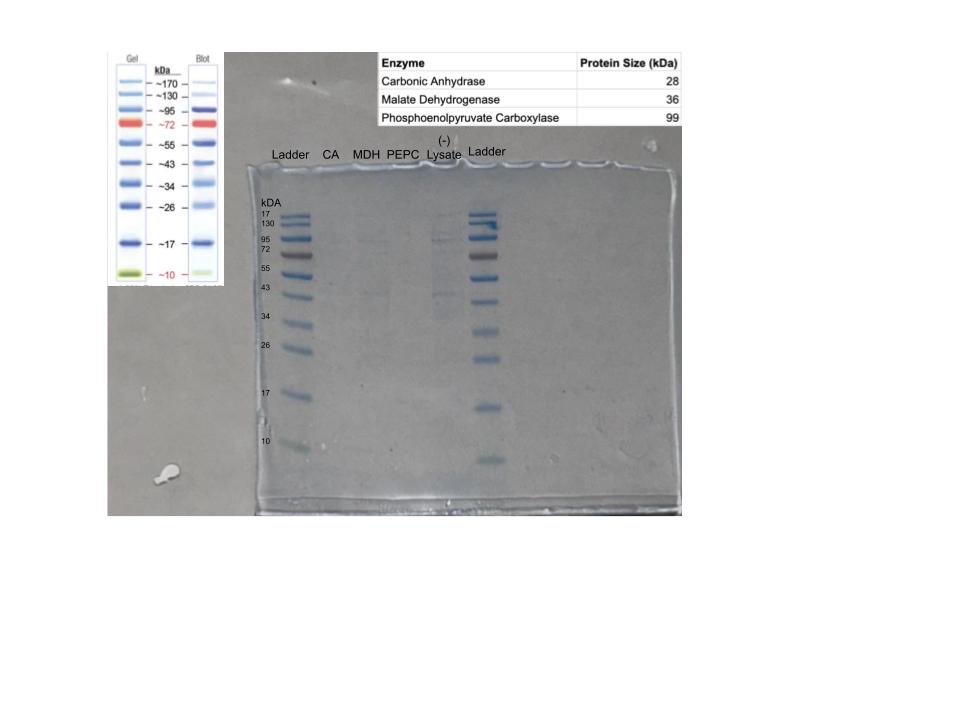
Protein Purification: An Introduction To isolate our protein of interest, we first had to grow the cells and then lyse them using a combination of B-PER (Bacterial Protein Extraction Reagent) and sonication. This process breaks open the cell membranes, resulting in a lysate solution (labeled as Tube A) that contains the total protein content of the cells.
Subsections of Labs
Week 1 Lab: Pipetting
Pipetting & eGels
In this week’s lab, we were tasked with familiarizing ourselves with standard pipetting equipment. We utilized P20, P200, and P2000 micropipettes, along with petri dishes and glass slides. Having prior experience in a wet lab, it was fun to explore the equipment artistically.
I started by creating some “droplet art” on a glass slide using colored water.
I then decided to make a smiley face and a DNA strand in the same fashion, pipetting individual droplets of colored water and “streaking” them to create lines.
I noticed another labmate using petri dishes for her art. Given the hydrophobic coating on the plate, the droplets formed more uniform spheres that maintained their geometry better than on the glass slides. I proceeded to create another drawing on the petri dish.
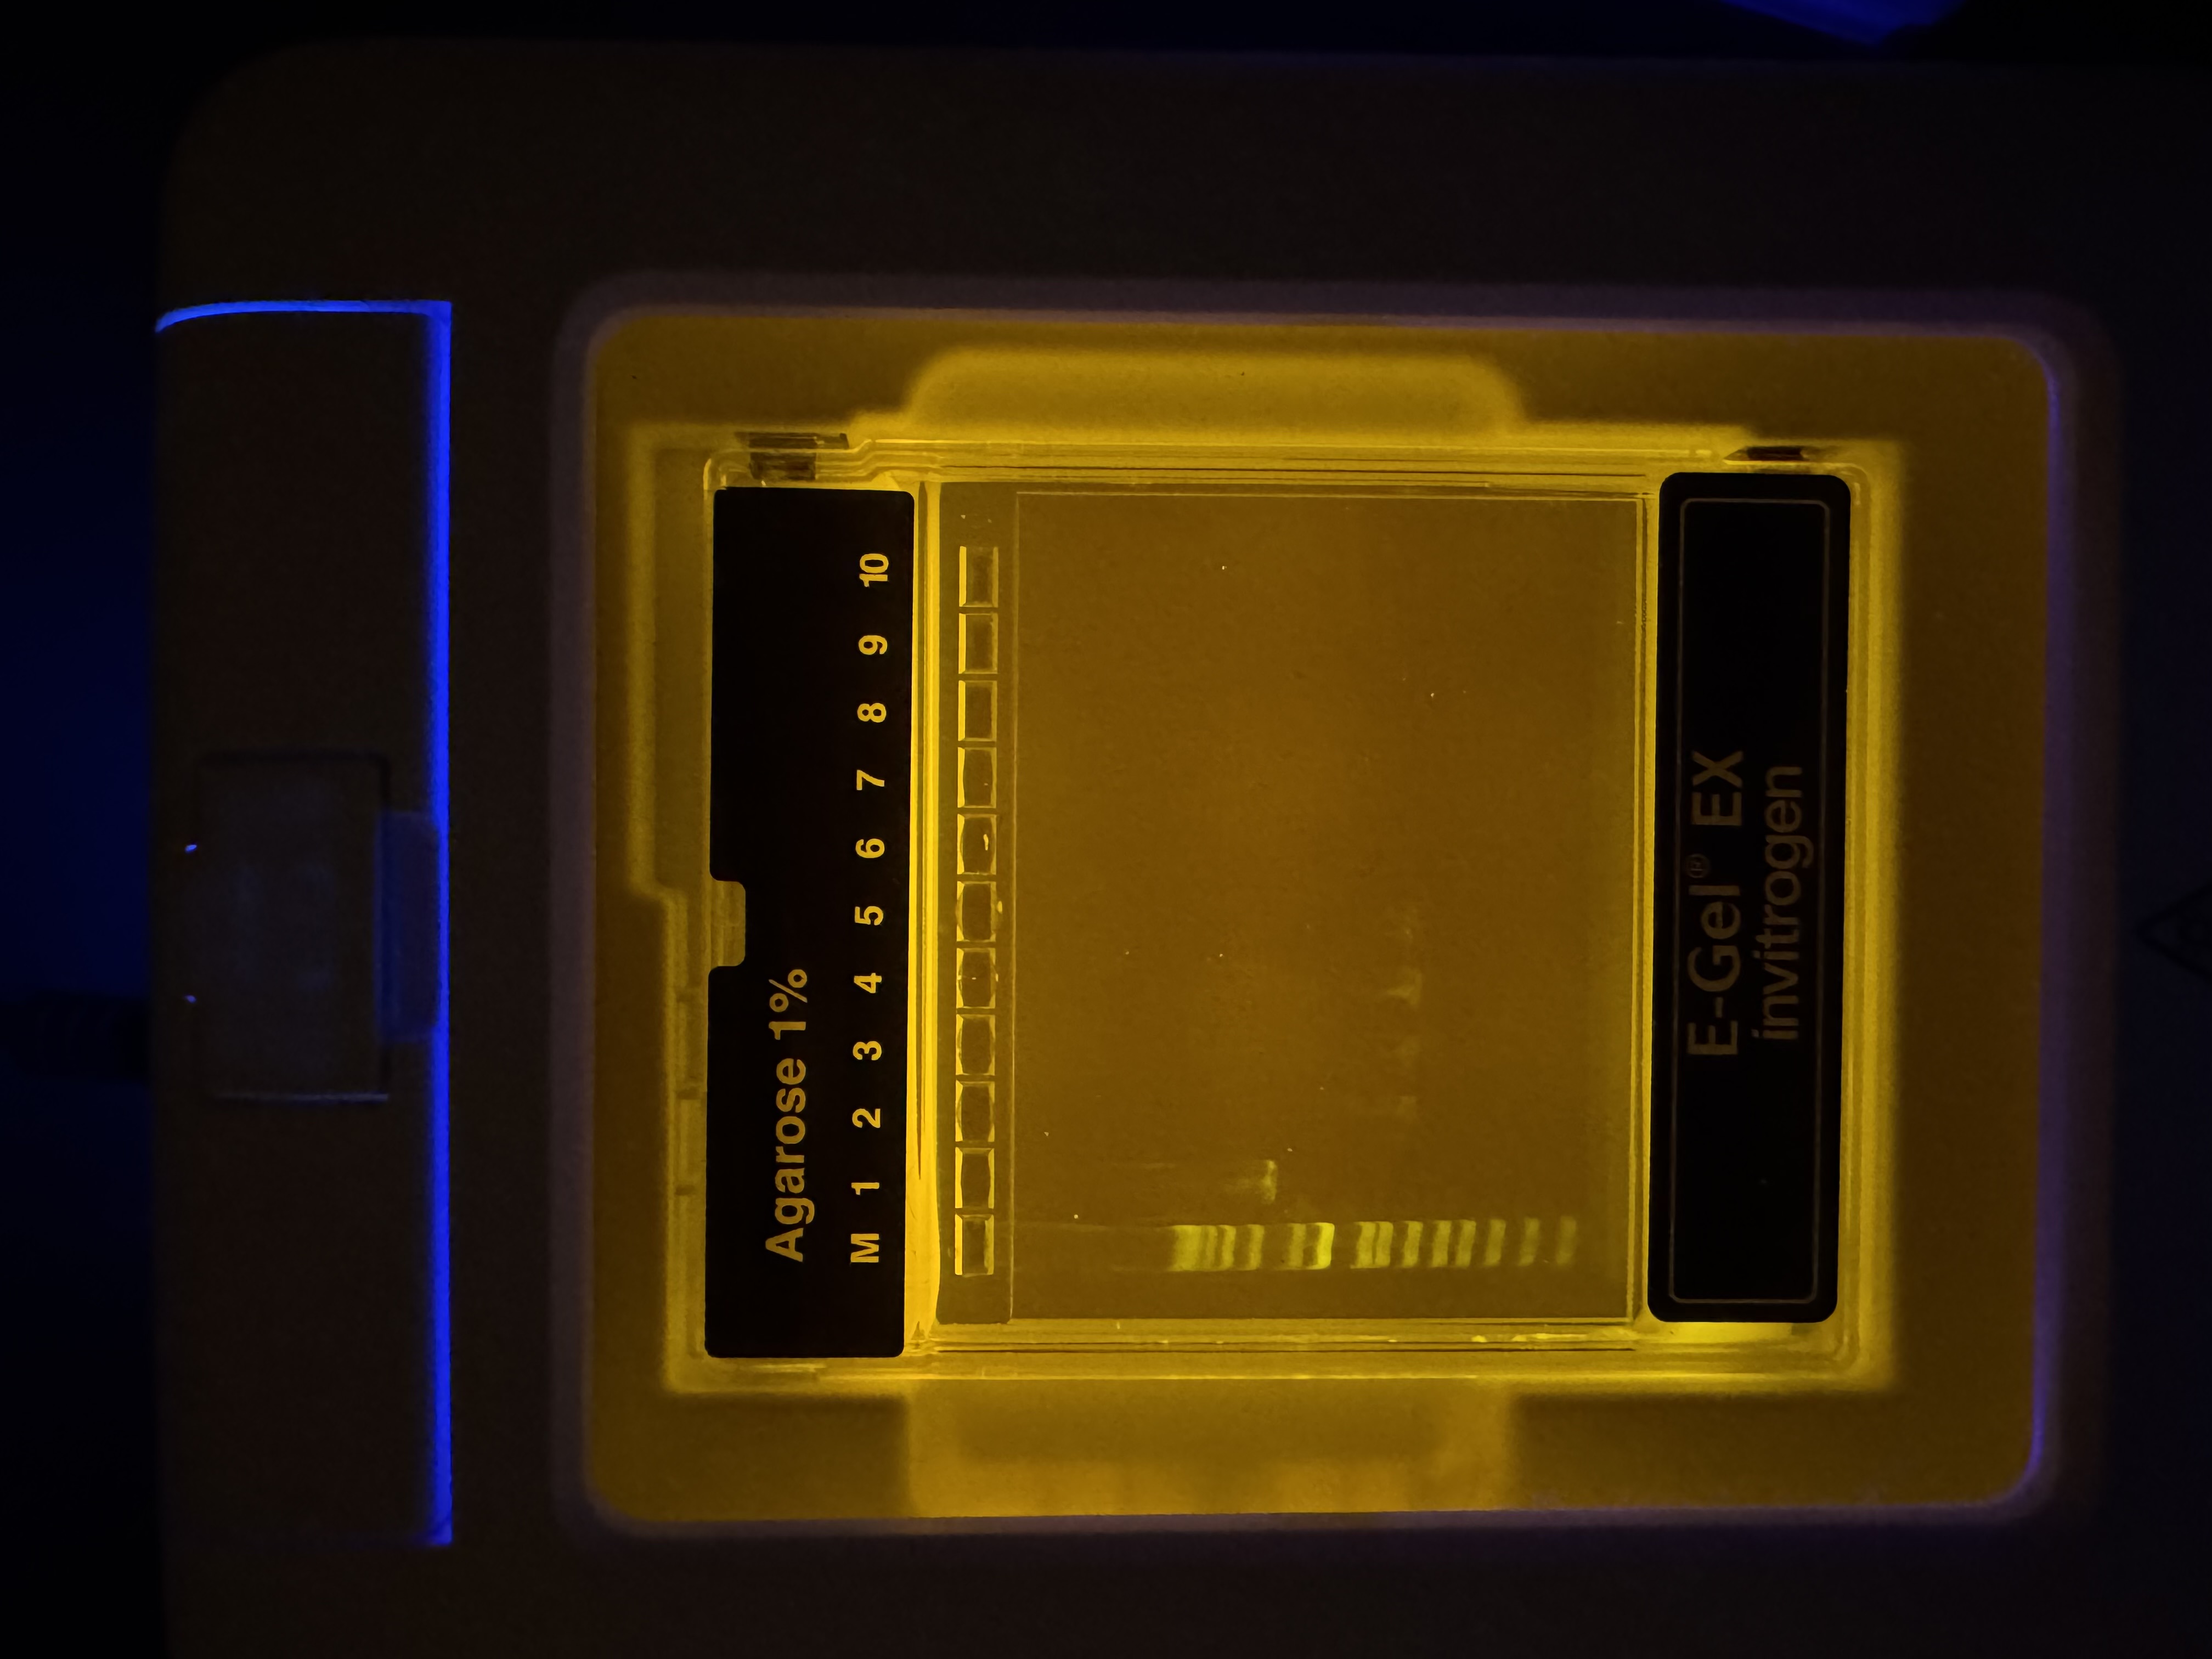
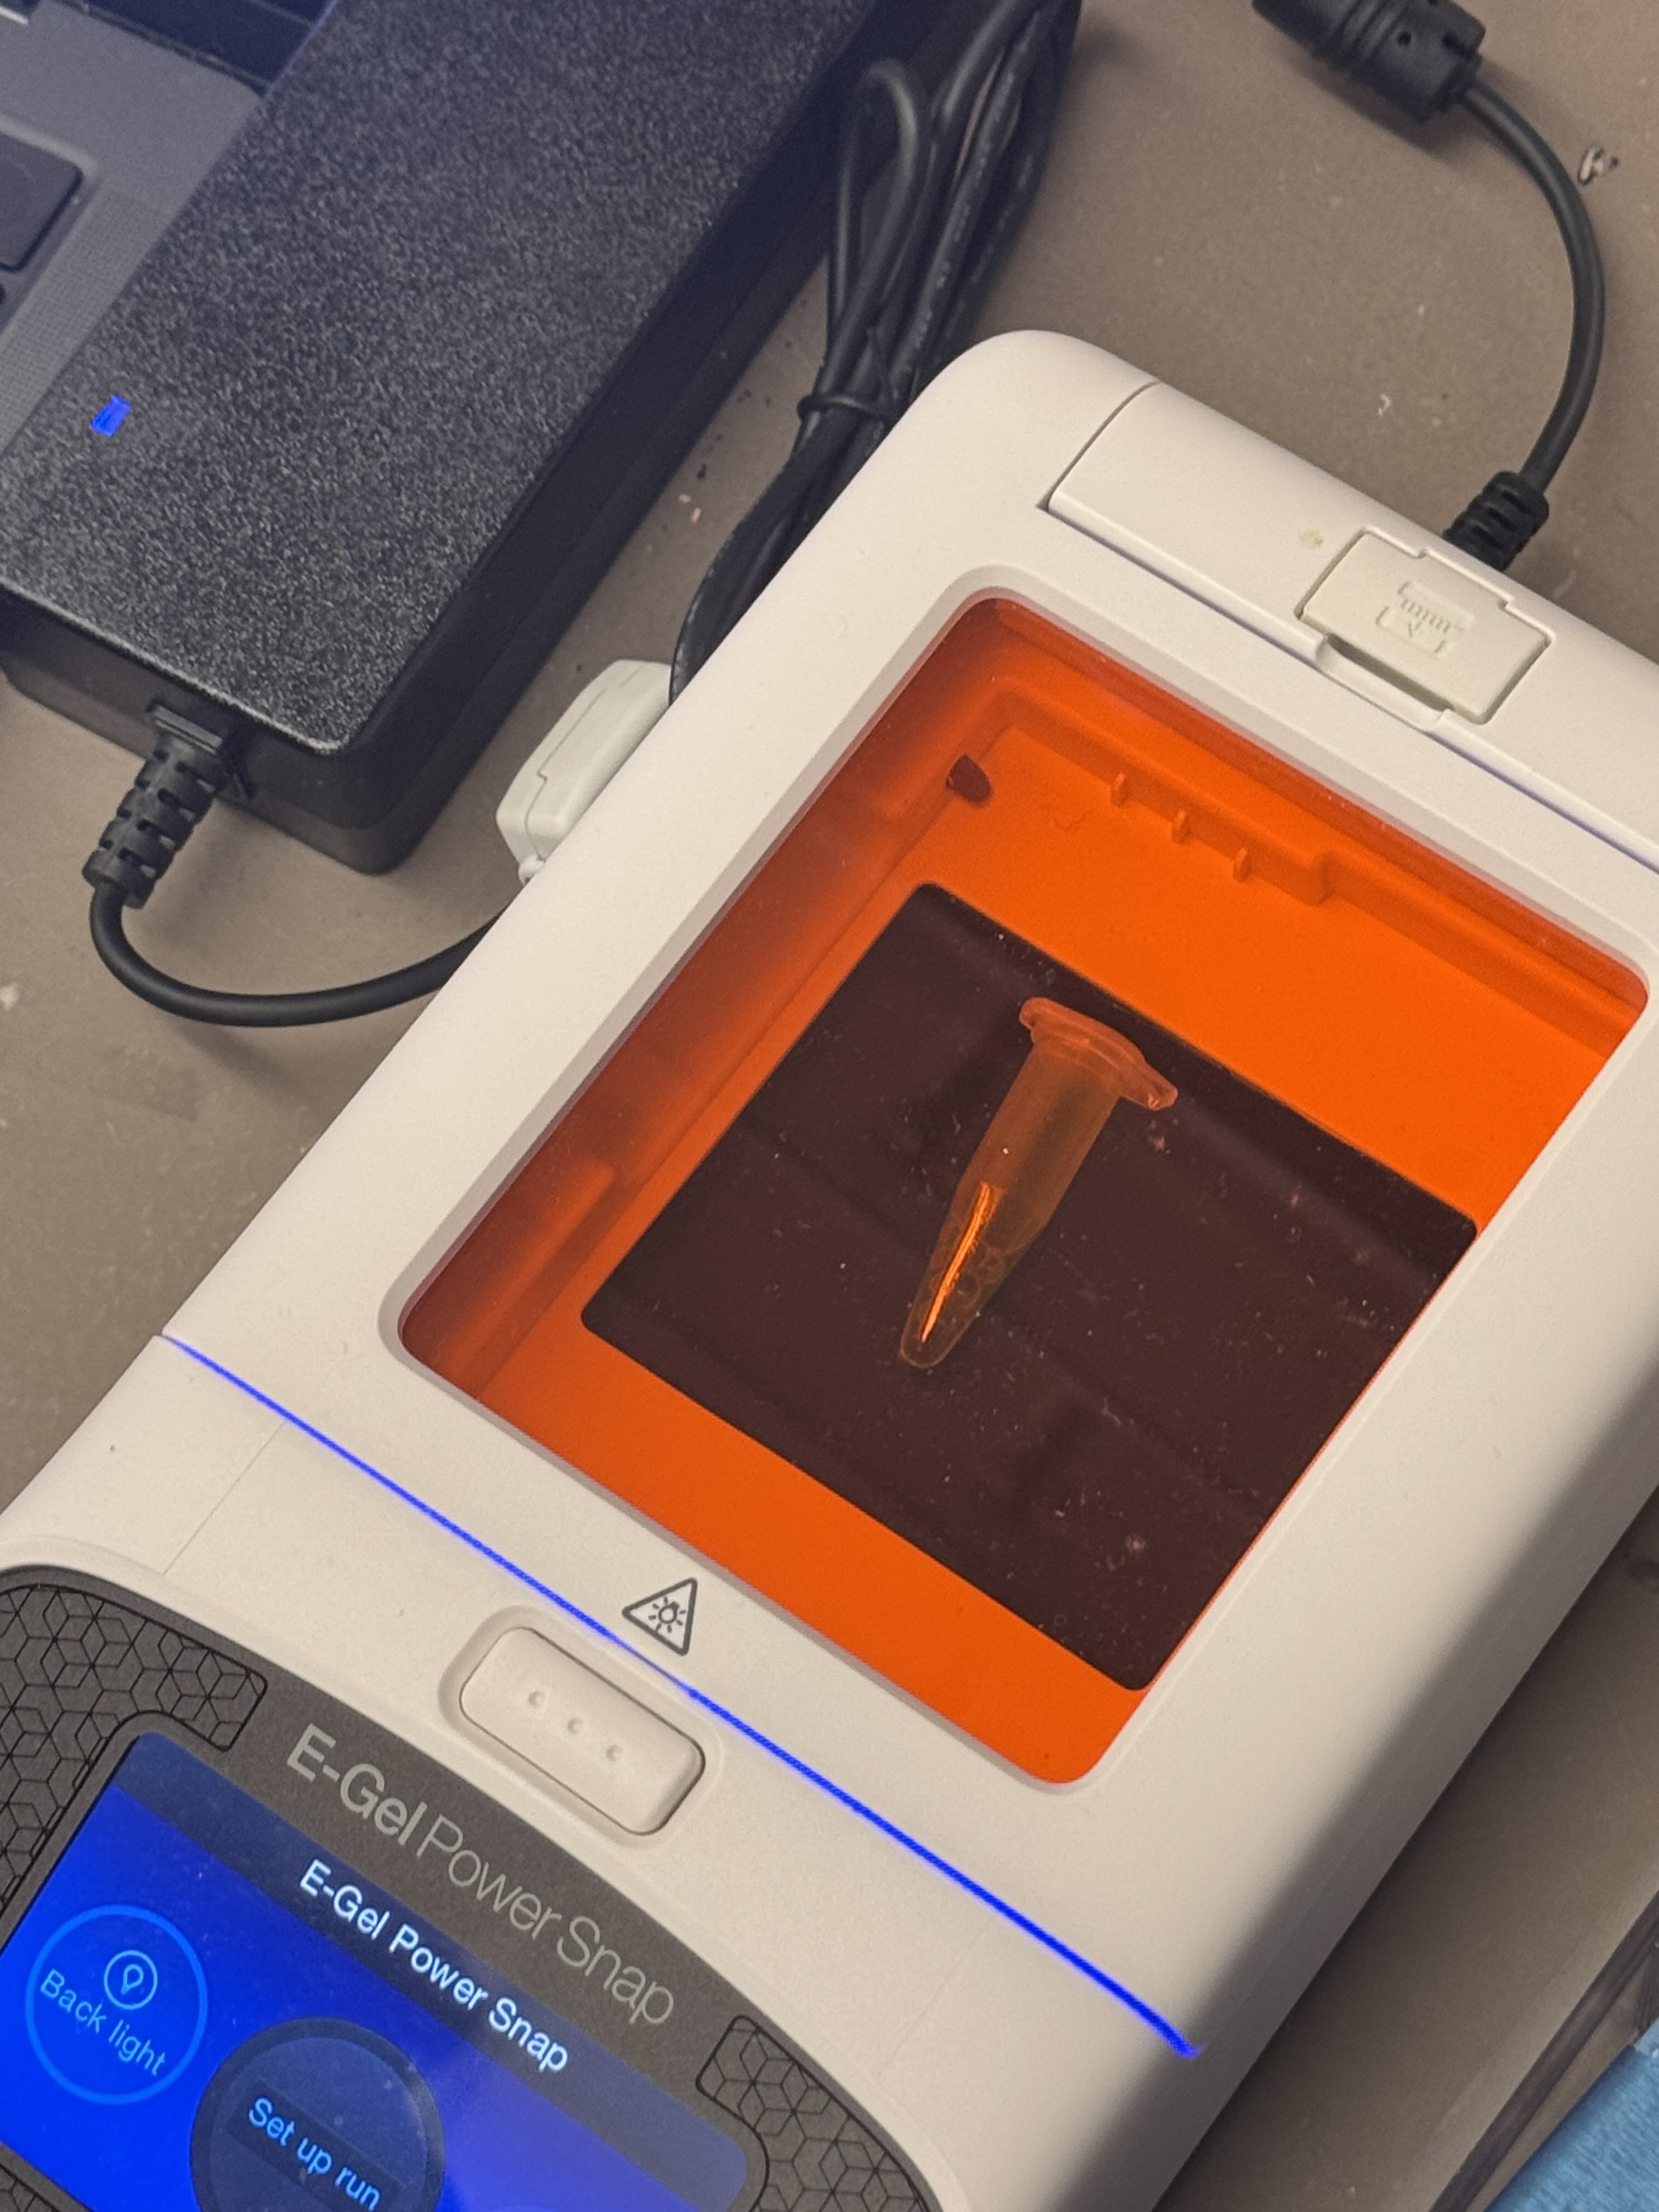
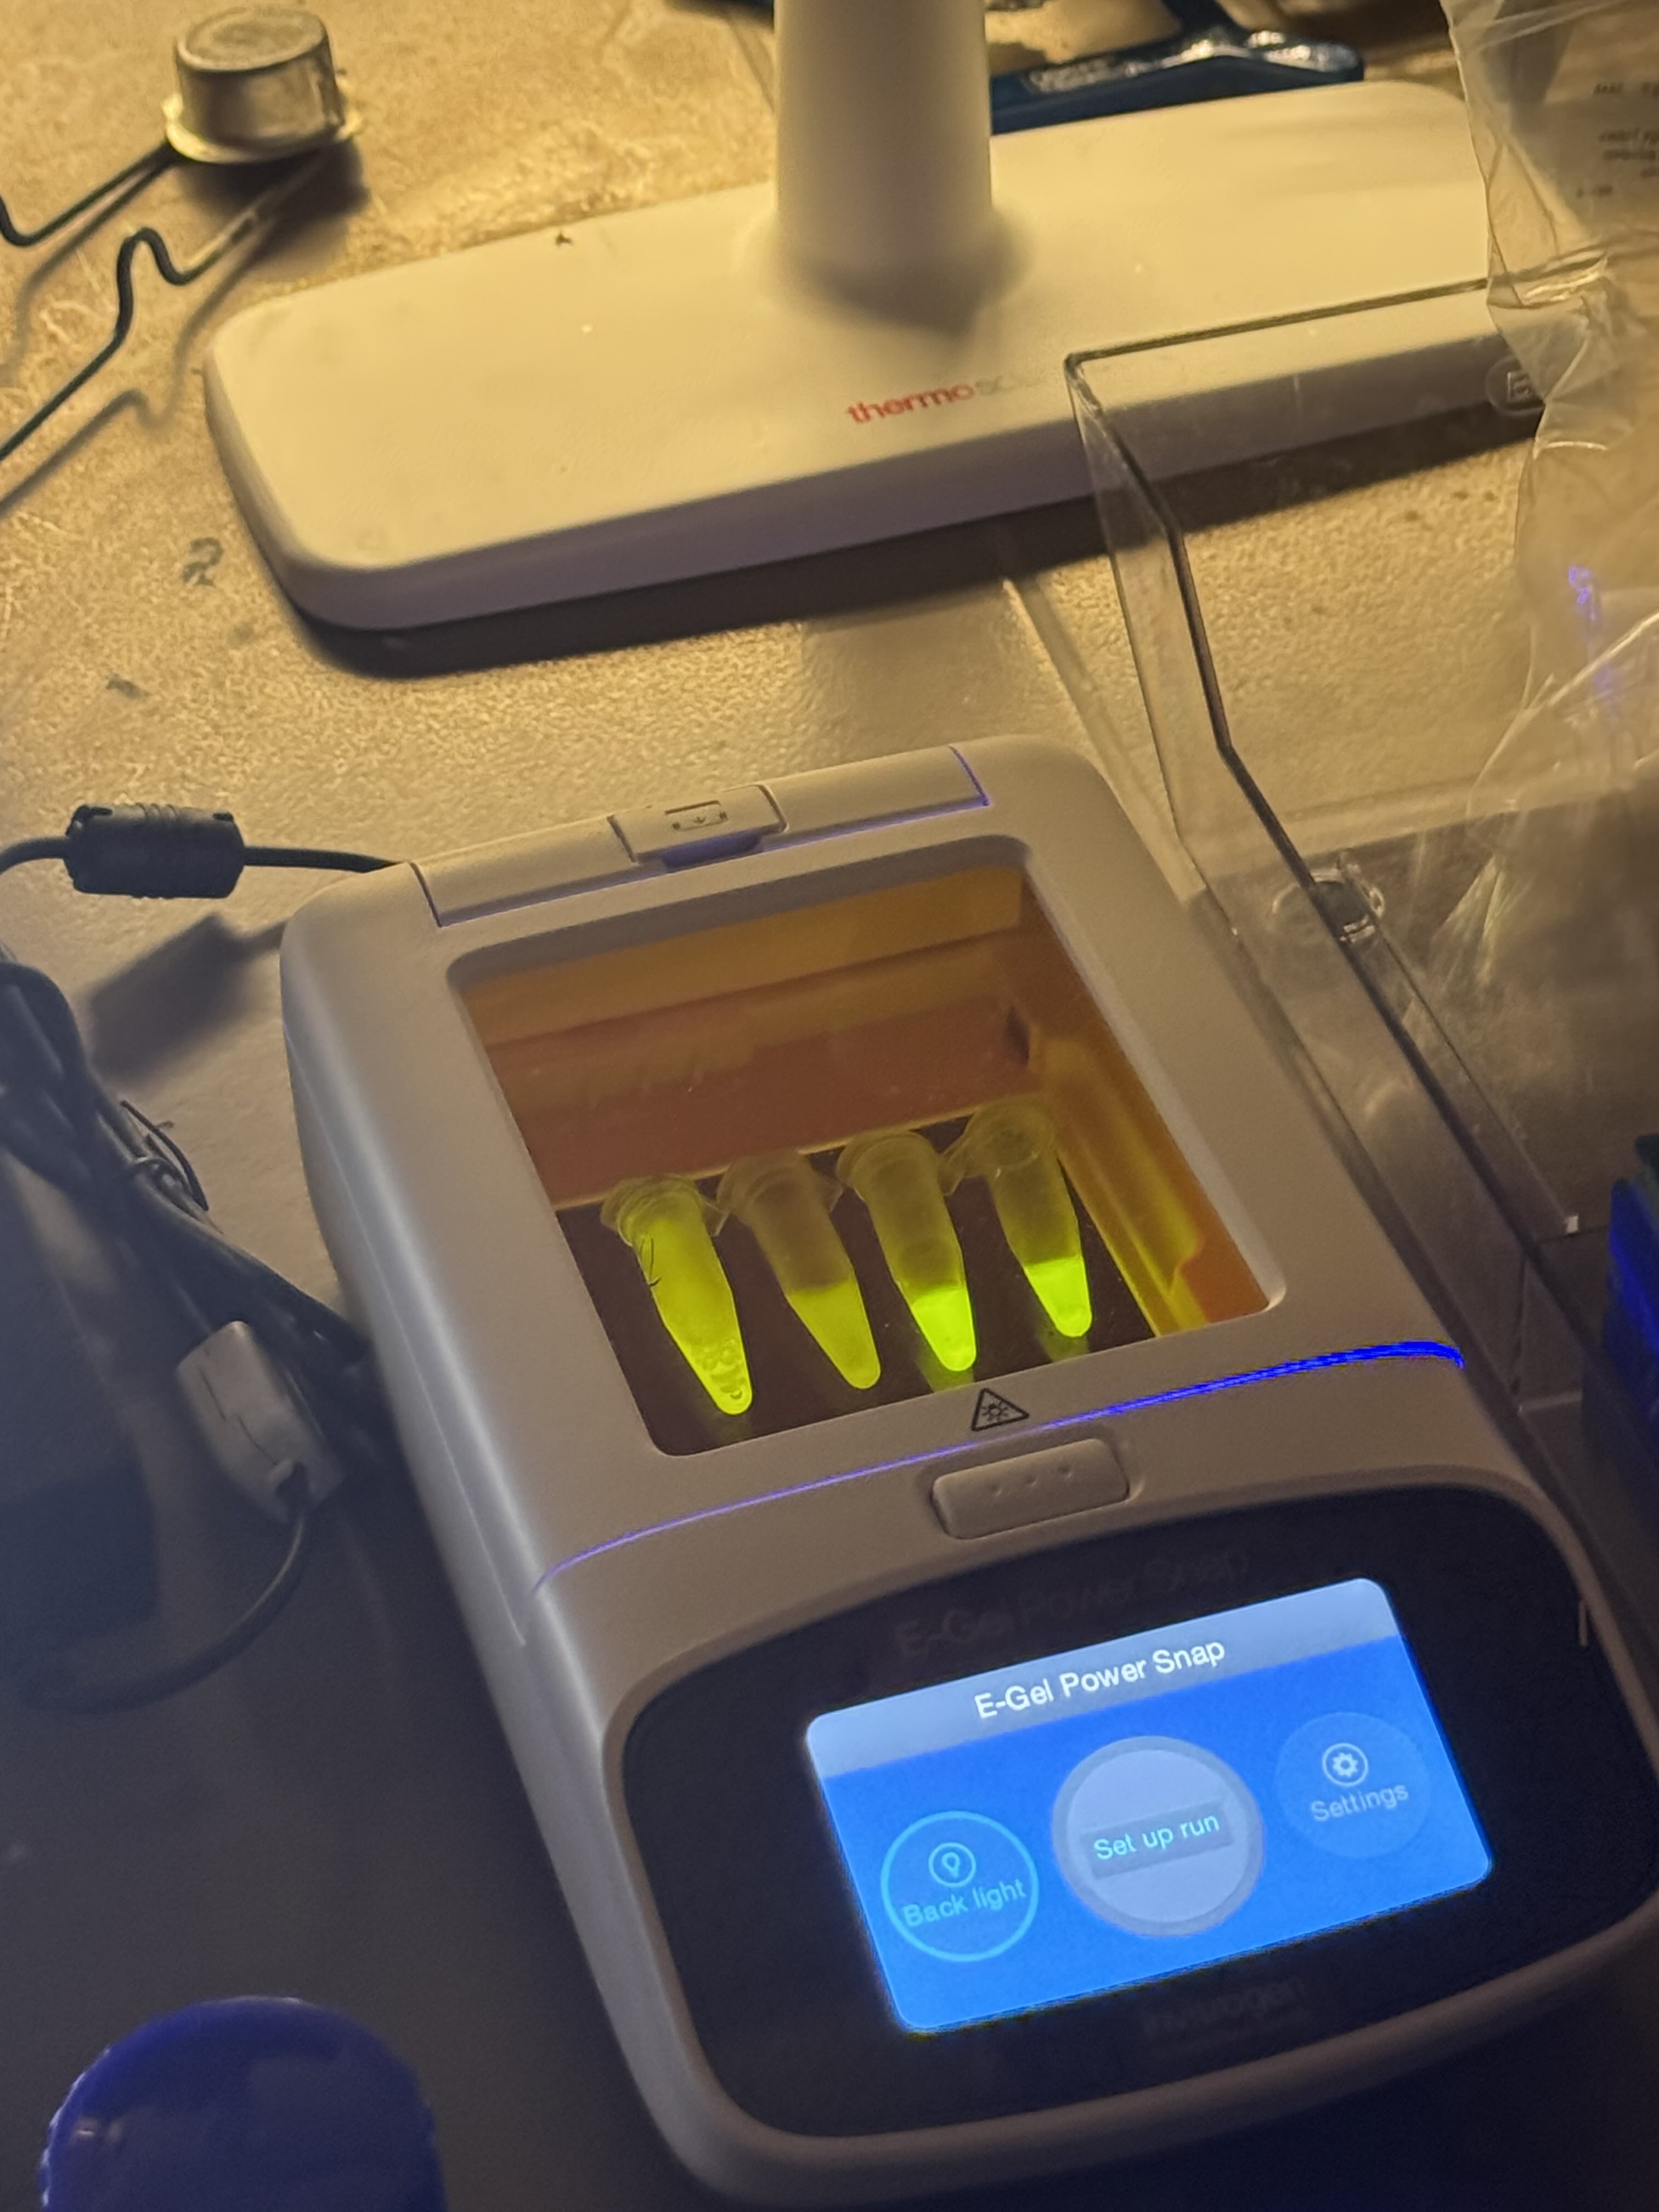
Finally, we used an eGel, a piece of technology I had never seen before. I was thoroughly impressed—no loading buffer, no separate imaging box, and no dye required. The process was incredibly streamlined. Another classmate and I alternated pipetting the provided ladder sample and dH2O into the lanes of the gel. The eGel even allows for mid-run imaging, which I was delighted to take advantage of.
The first lab has definitely made me excited to get my hands on the rest of the equipment we will use in this class, and it provided a nice artistic lens through which to view a simple task like pipetting. :)
Gemini AI was consulted for formatting
Week 2 Lab: DNA Gel Art
Lab: DNA Gel Art
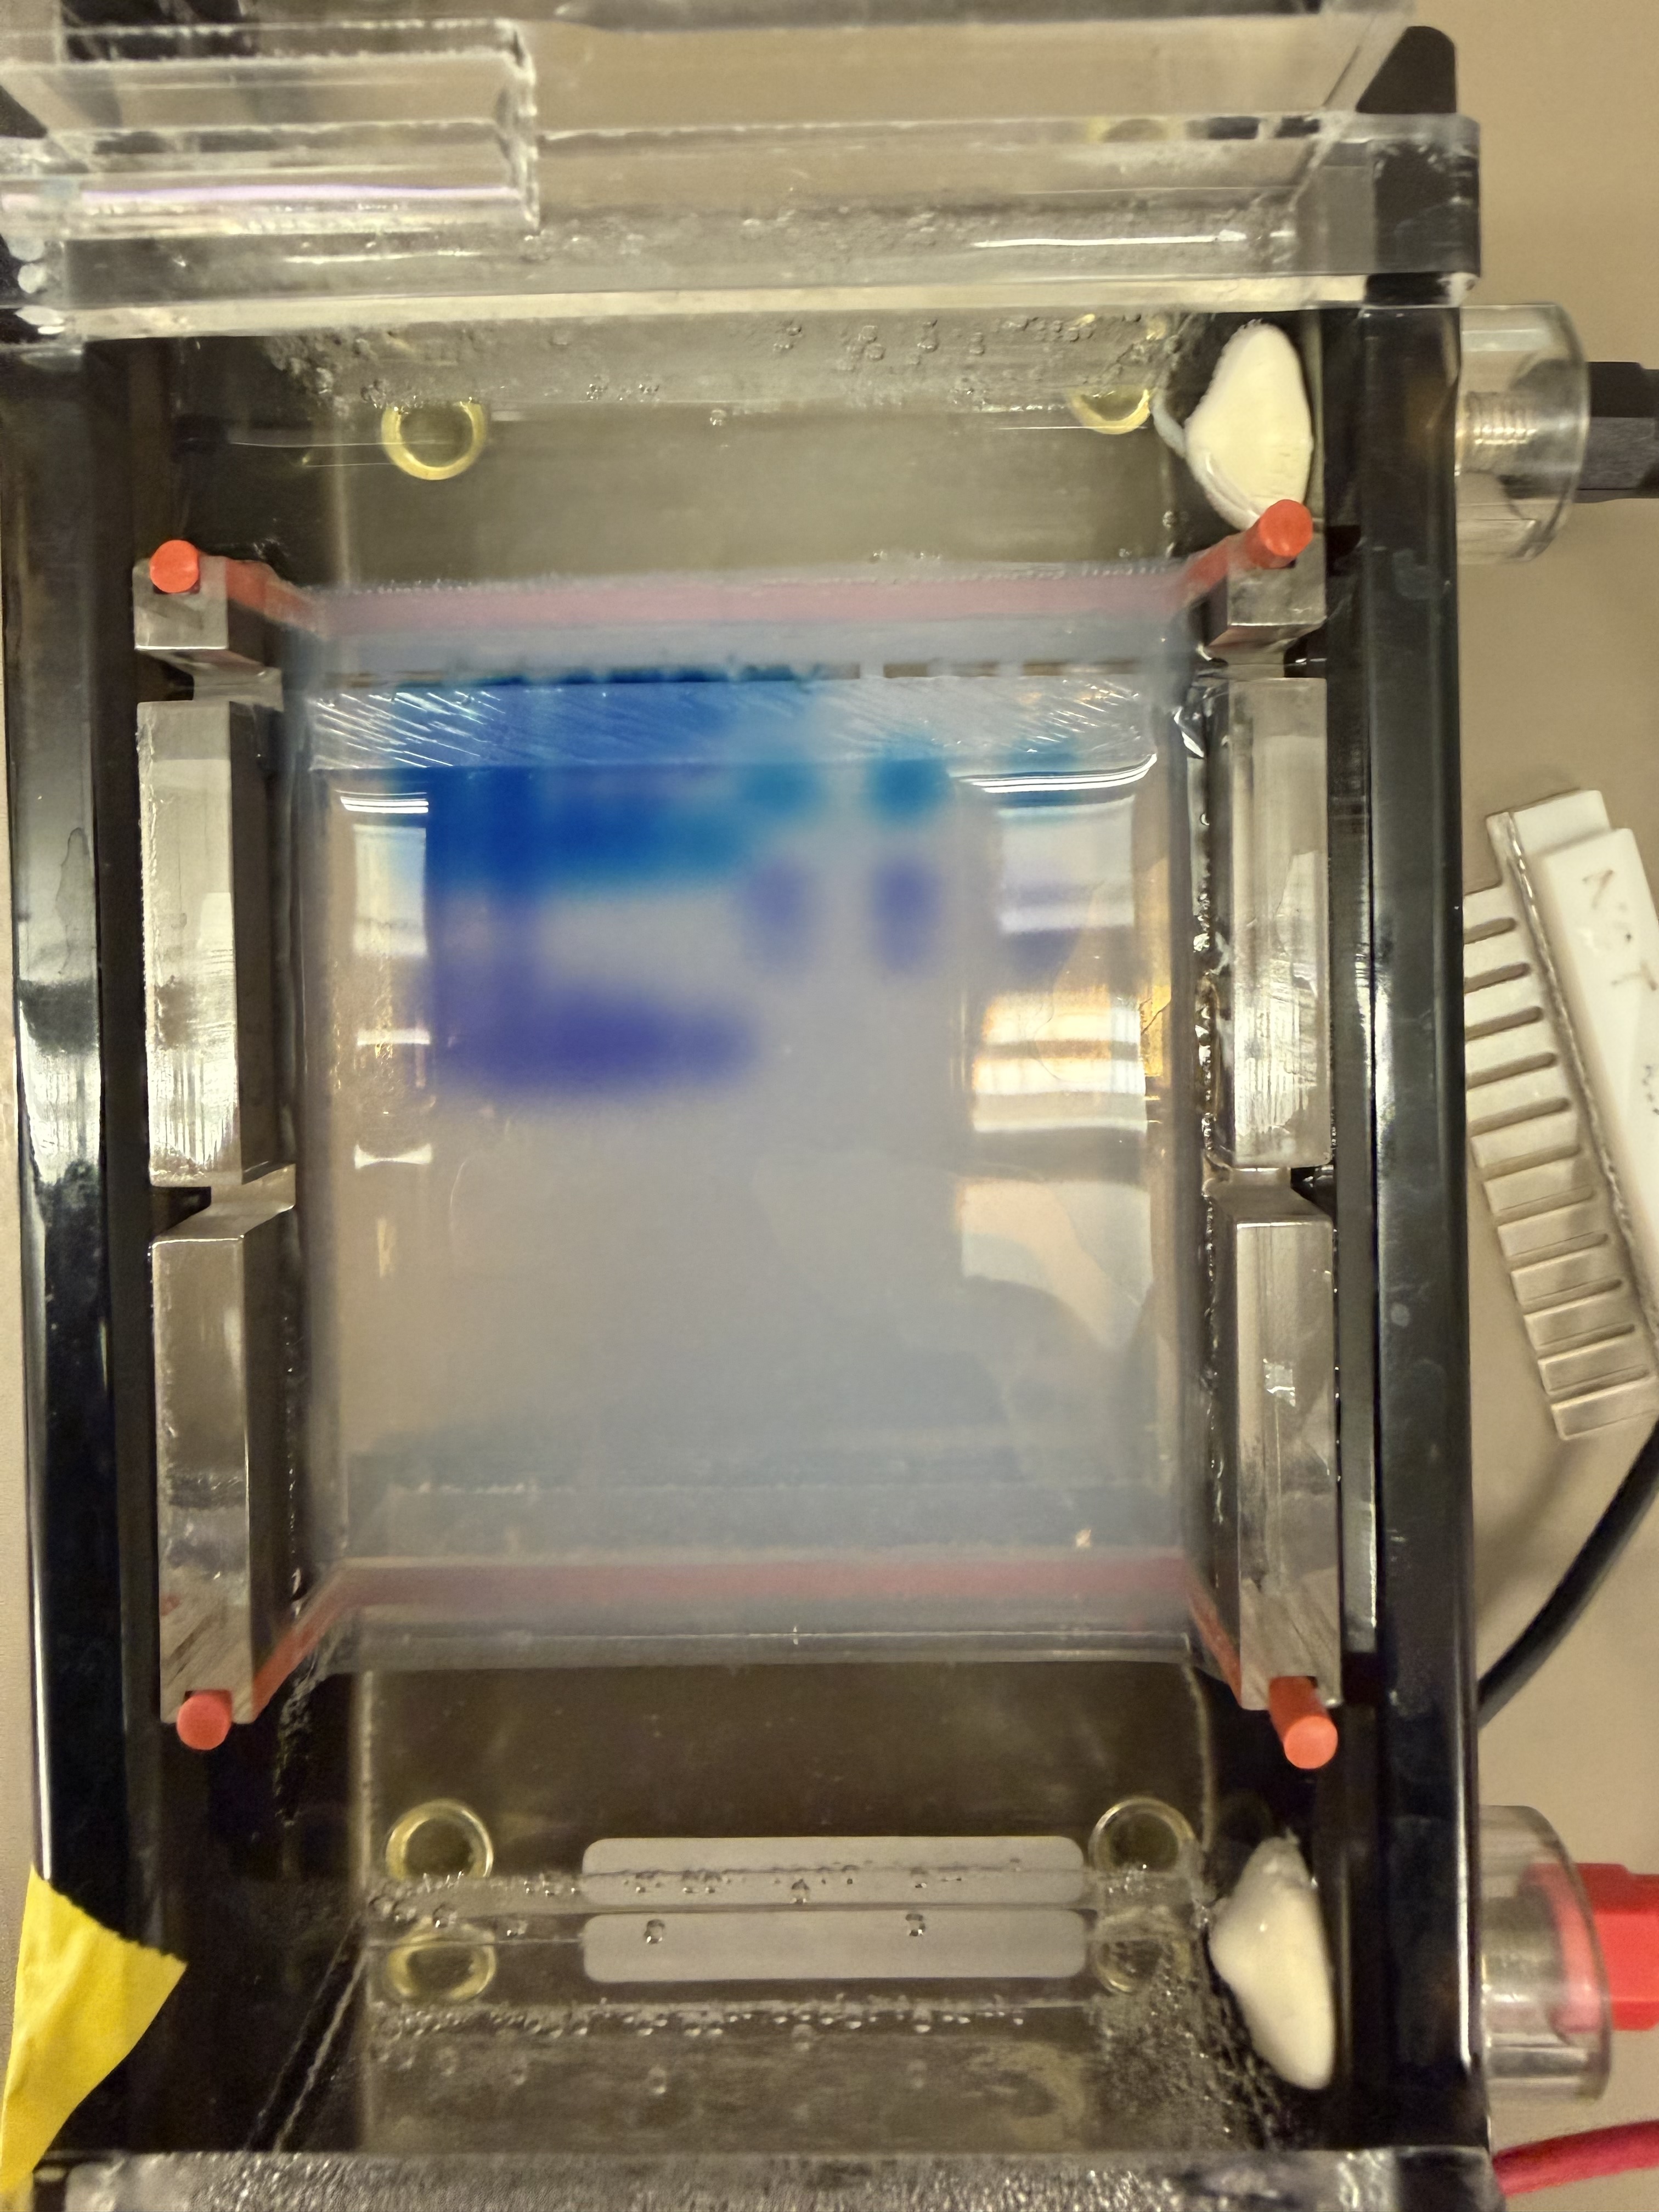
Today in lab, we attempted to make DNA Gel Art using restriction enzymes and software (Benchling). In recitation, we were given an example of someone using time-controlled gel work to create an image, so I came up with a plan to use that framework to create an image of Pac-Man.
I used SalI, which cuts only a single 500 bp strand from lambda DNA, for my digest to create my “blocks” that I would effectively “stack” as I pipetted them at interval times on the gel.
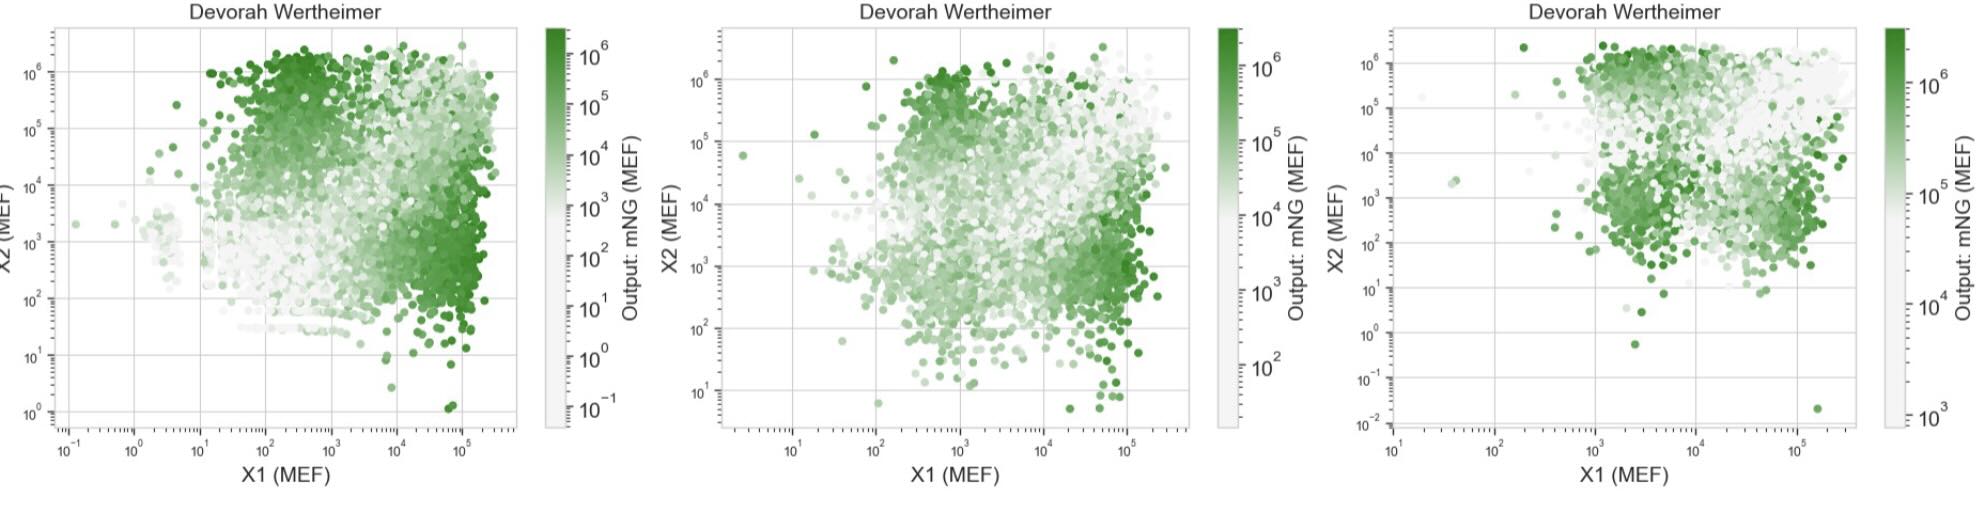
I worked with another classmate, Devorah, and together we created our gel with the agar and TAE buffer, and ran our gels at 150+ volts.
Devorah tried to make a dragonfly-looking structure, which required a variety of restriction enzymes. After making our gel, we let our digest reactions incubate for 30 minutes, then created the loading samples and ran the gels. I set serial, 4-minute timers that prompted me to pipette the next “row” to create my pacman image.
After I was finished, my gel took an unfortunate tumble to the ground, and was imaged in pieces.
In the end, it looks like the digestion did not go according to plan, as no DNA appeared to have traveled down the gel, and only the dye created the facade image. However, It is also entirely possible that by serially pipetting into the same wells, a buildup of DNA occurred and the 500bp strands that were supposed to fall into place got stuck (I am less inclined to believe this, though, because I would expect at least 1 500bp band to make it to the bottom, and none were present effectively). Overall, this was a fun project, and I took pleasure in trying to come up with an alternative approach to execute my creative goal, eventhough my results didn’t come out as expected.
Devorah’s design also wasn’t quite what we were expecting, and I think its also related to an improper digestion reaction.
Gemini AI was consulted for formatting
Week 3 Lab: Opentrons
This week in lab, we used the Opentrons machine, giving us a taste of lab automation with an artistic twist. We pipetted flourescent, genetically engineered E.coli onto agar mixed with activated charcoal to create our design and canvas respectively. After a 16 hour incubation period, we were able to see images of our results under UV light! I decided to make two designs, one of the US Virgin Islands to pay homage to where I’m from, and the other was the Dark Side of the Moon Album Cover, as I thought it used a good variety of colors. The robot moved from top left to bottom right, which prompted a discussion with Ronan about the most optimal pathing system for the trajectory. The robot’s movement is controlled by a Python script, and Ronan created a website to generate the coordinates of each colored pixel, which the script implemented.
Week 4 Lab: Protein Design Part I
Protein Selection
Briefly describe the protein you selected and why you selected it.
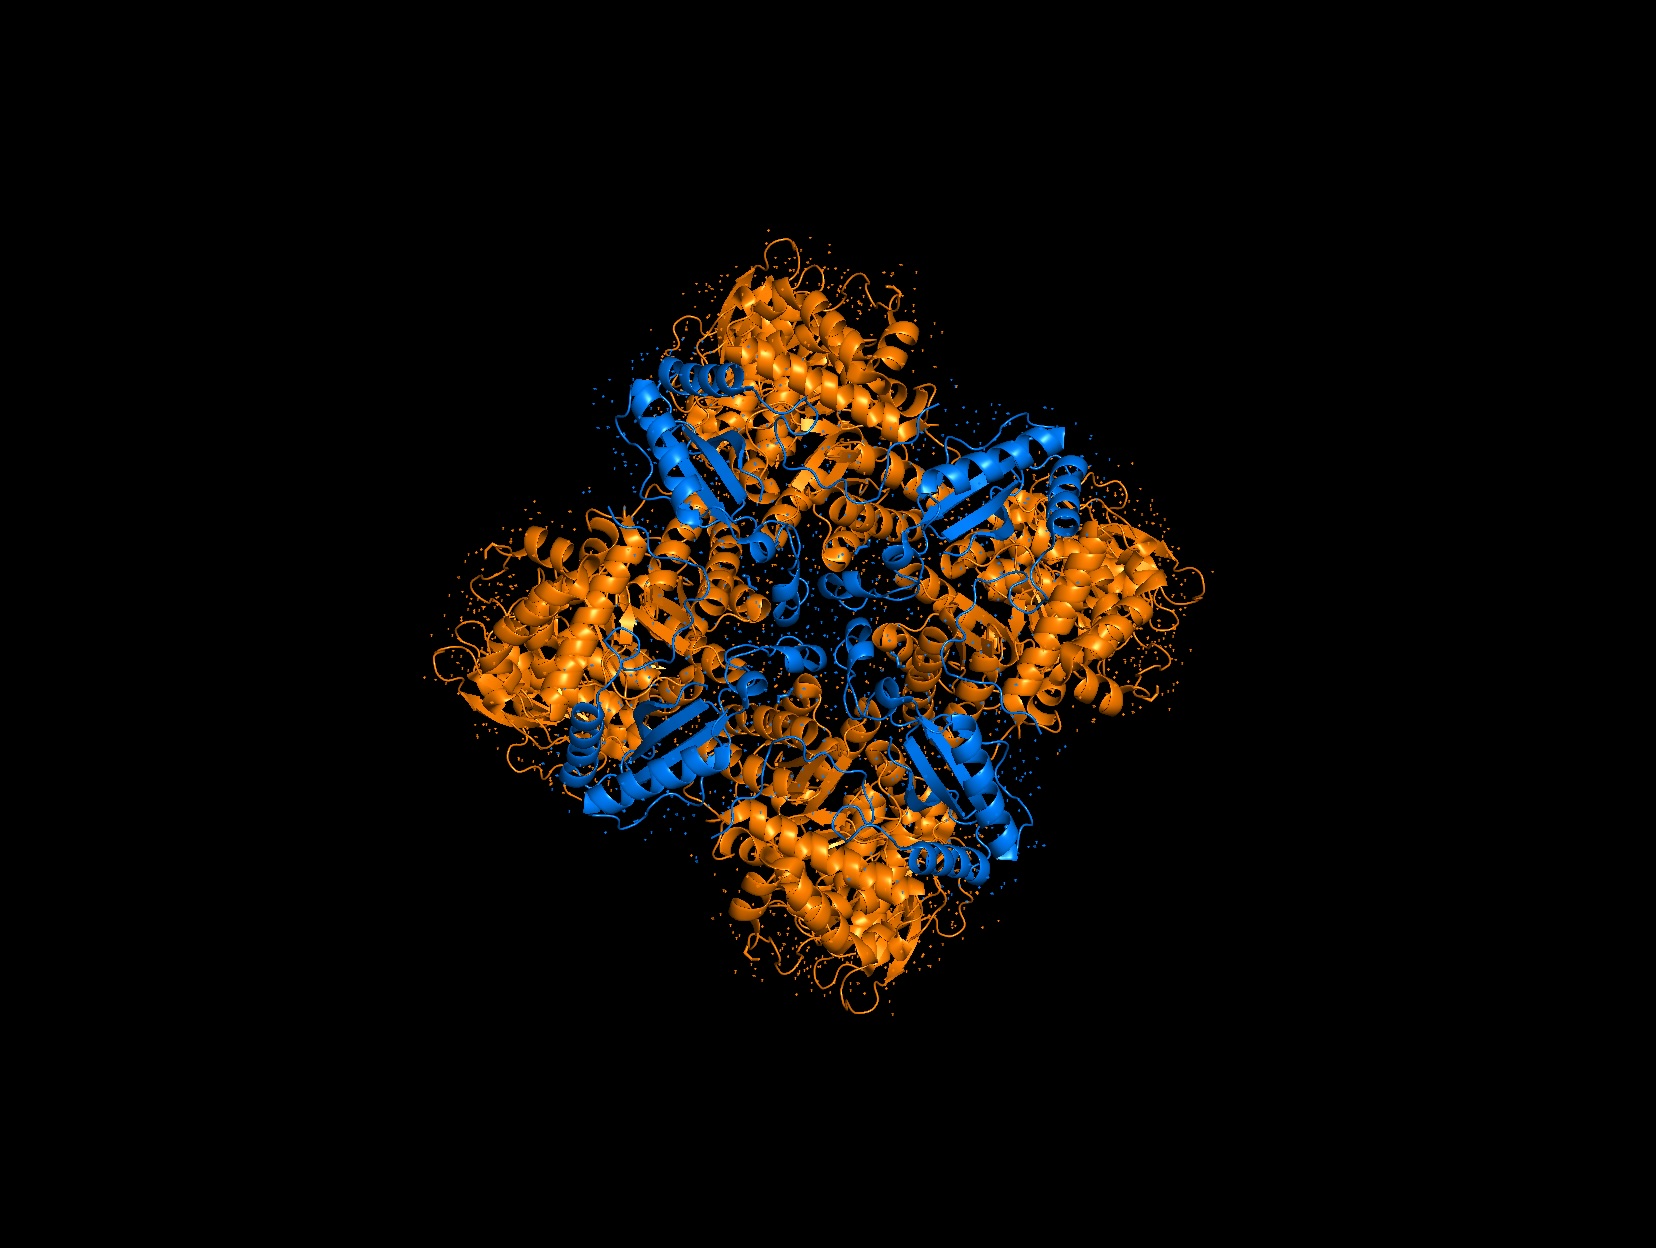
Again, continuing with my idea for designing a carbon sequestration system, I am going to be looking at Rubisco, the most abundant protein on earth. Rubisco catalyzes photosynthesis in plants, converting atmospheric CO2 into an organic three-carbon acid that eventually is built up into sugars for plant growth. It is made of 8 large subunits and 8 small subunits.
How long is it? What is the most frequent amino acid?
The Large Subunit is roughly 475 amino acids long and the small subunit is roughly 175 amino acids long. The most frequent amino acid is Alanine (A) in both subunits with ~13 A’s in the small chain and ~46 in the large chain.
Homologs and Structure
How many protein sequence homologs are there for your protein?
There are 8 versions of Rubisco Large and Small subunits that are marginally different and assemble together to create a 16-mer (hexadecamer) protein.
Does your protein belong to any protein family?
They belong to the Rubisco Large and Small subunit chain families.
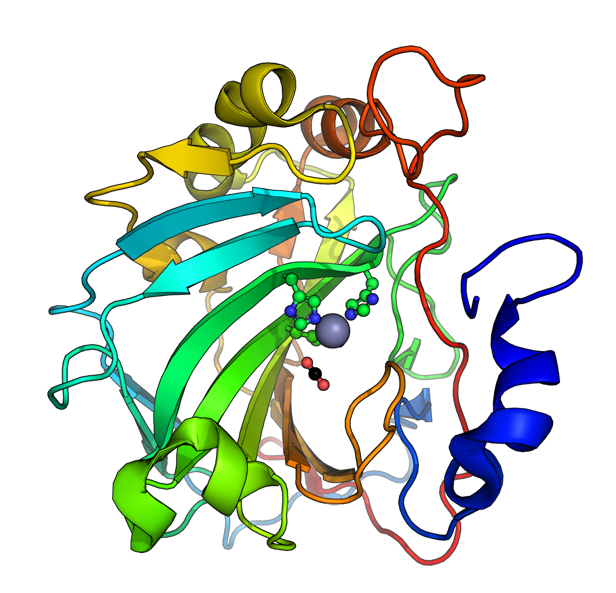
When was the structure solved? Is it a good quality structure?
Form I, the 8L, 8S hexadecamer was solved in the 1990s with an initial resolution of 2.2 angstroms, with specific structures like that of Chlamydomonas reinhardtii being solved for 1.4 angstroms in 2001. This is a very good quality structure (smaller resolution is better, typically < 2.70 Å).
Are there any other molecules in the solved structure apart from protein?
Yes, magnesium ions and carbamylated lysine.
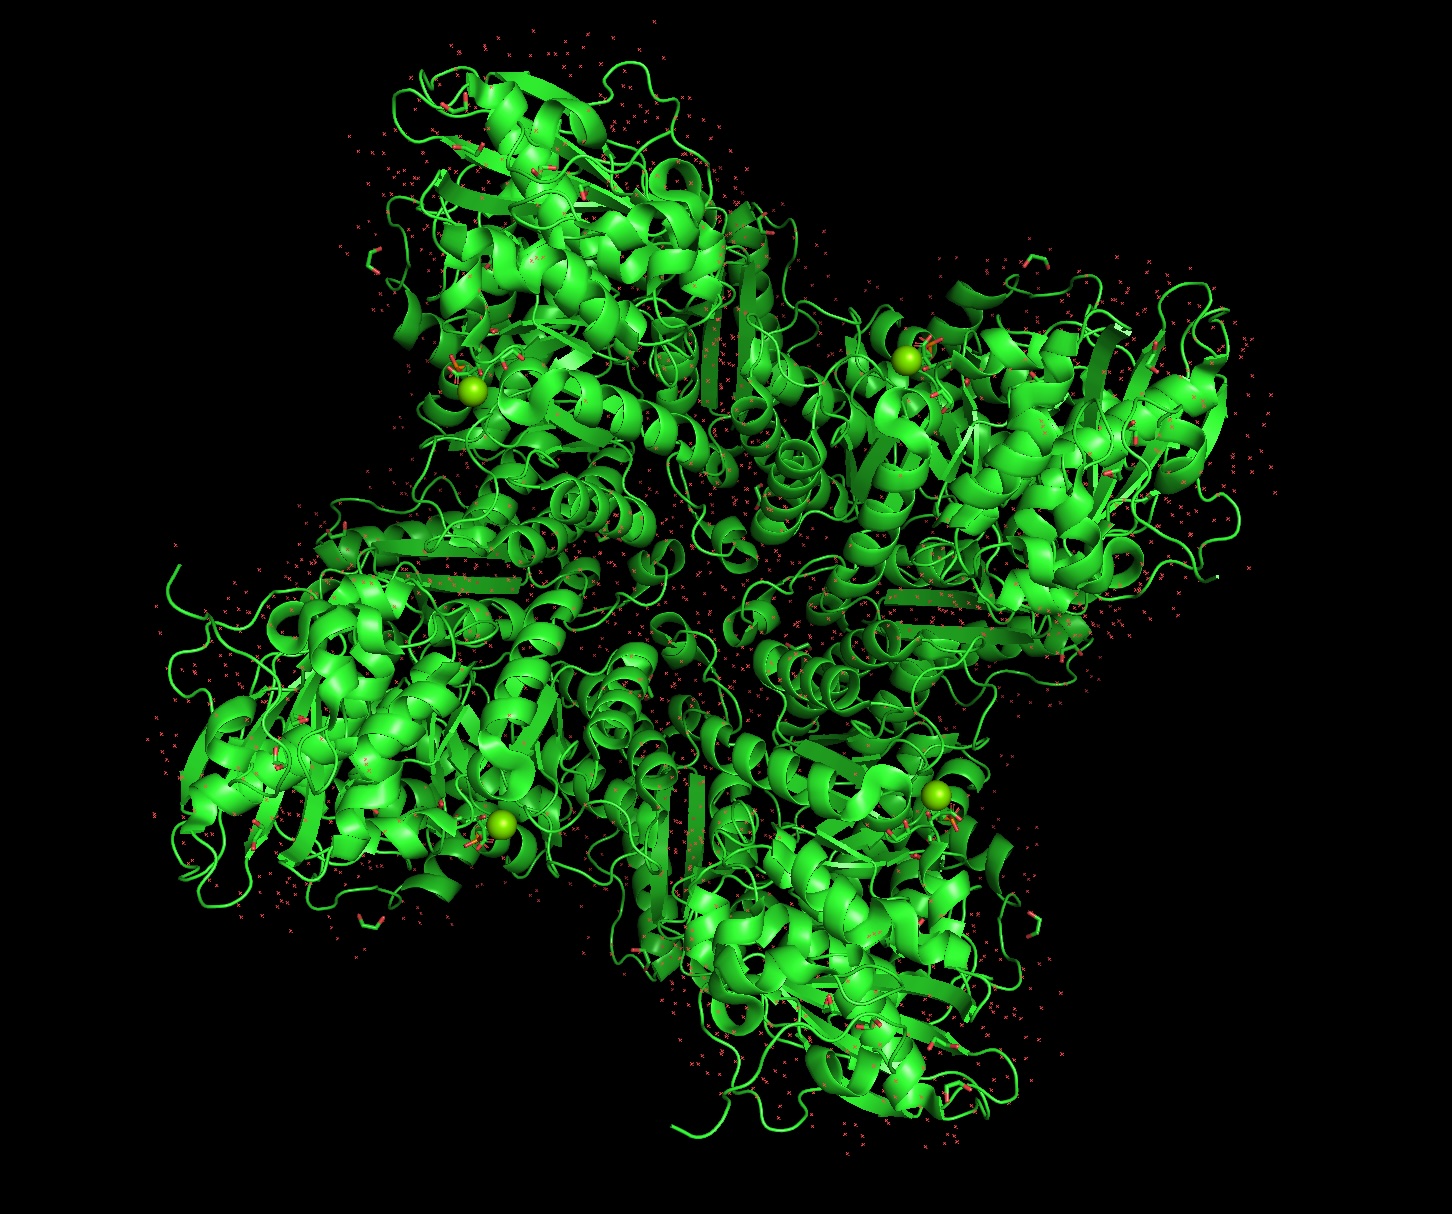
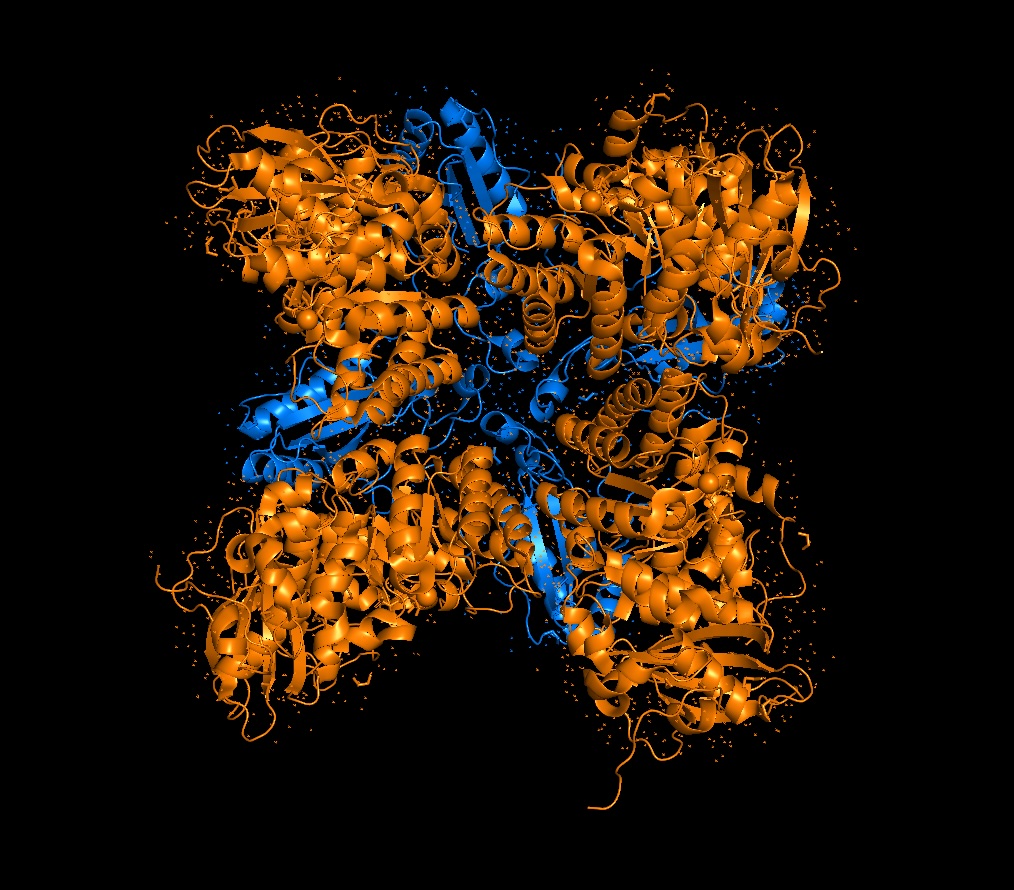
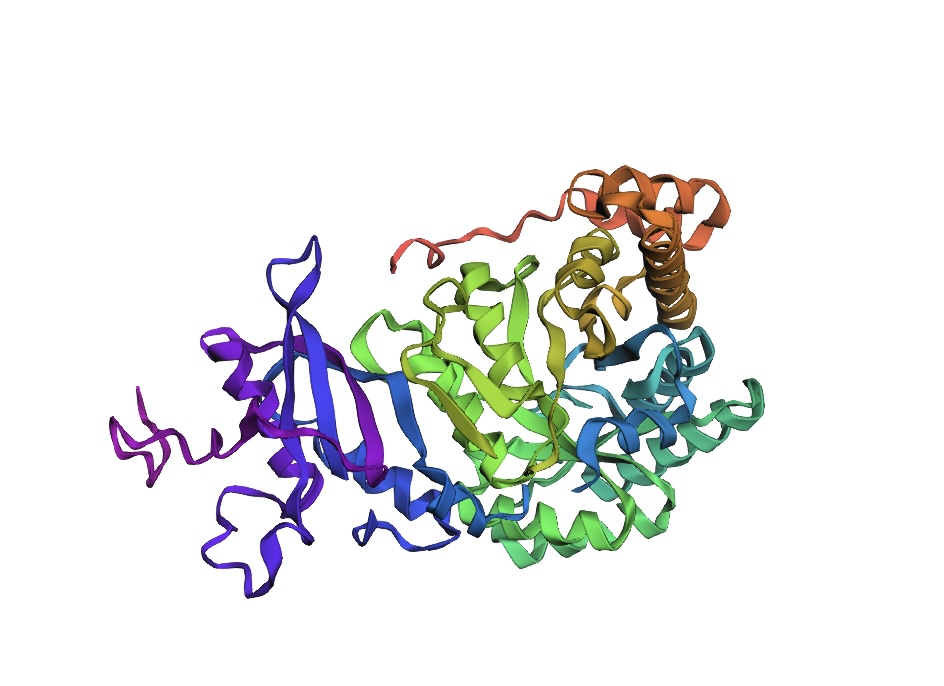
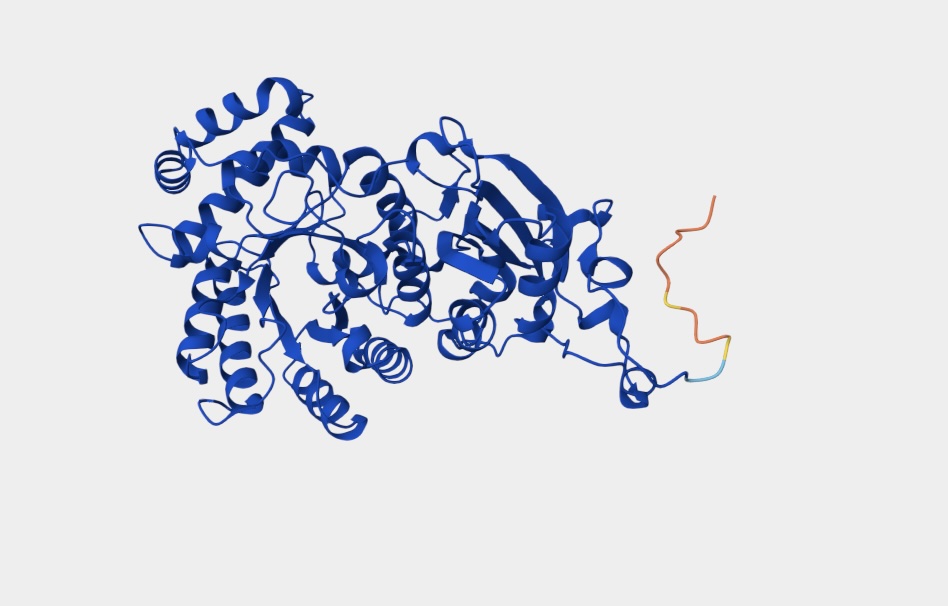
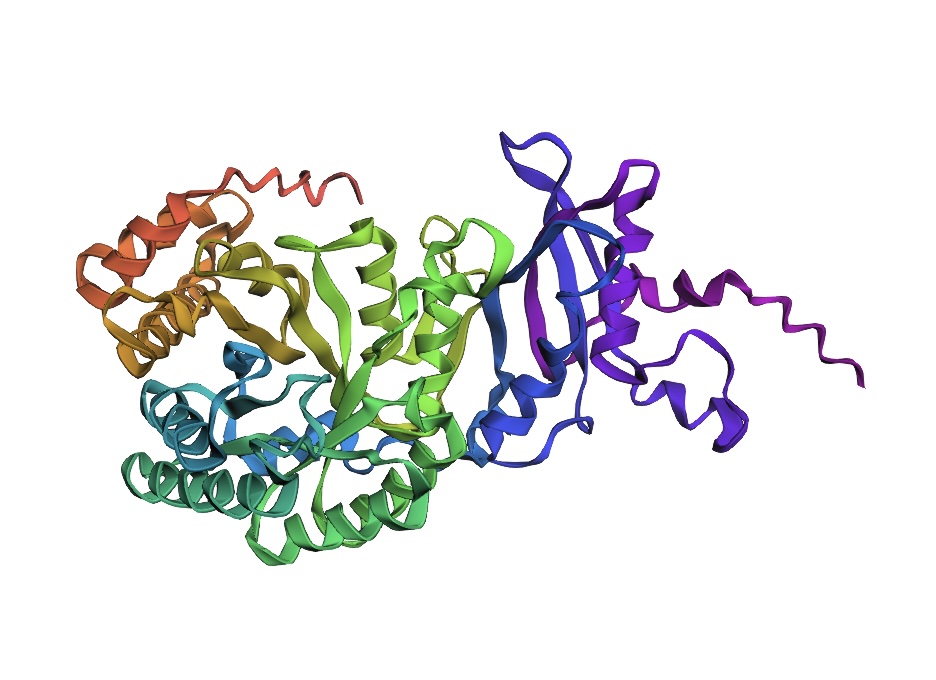
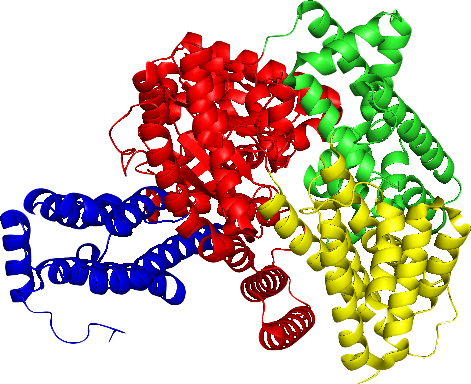
3D Molecule Visualization (PyMol)
Visualize the protein as “cartoon”, “ribbon” and “ball and stick”.
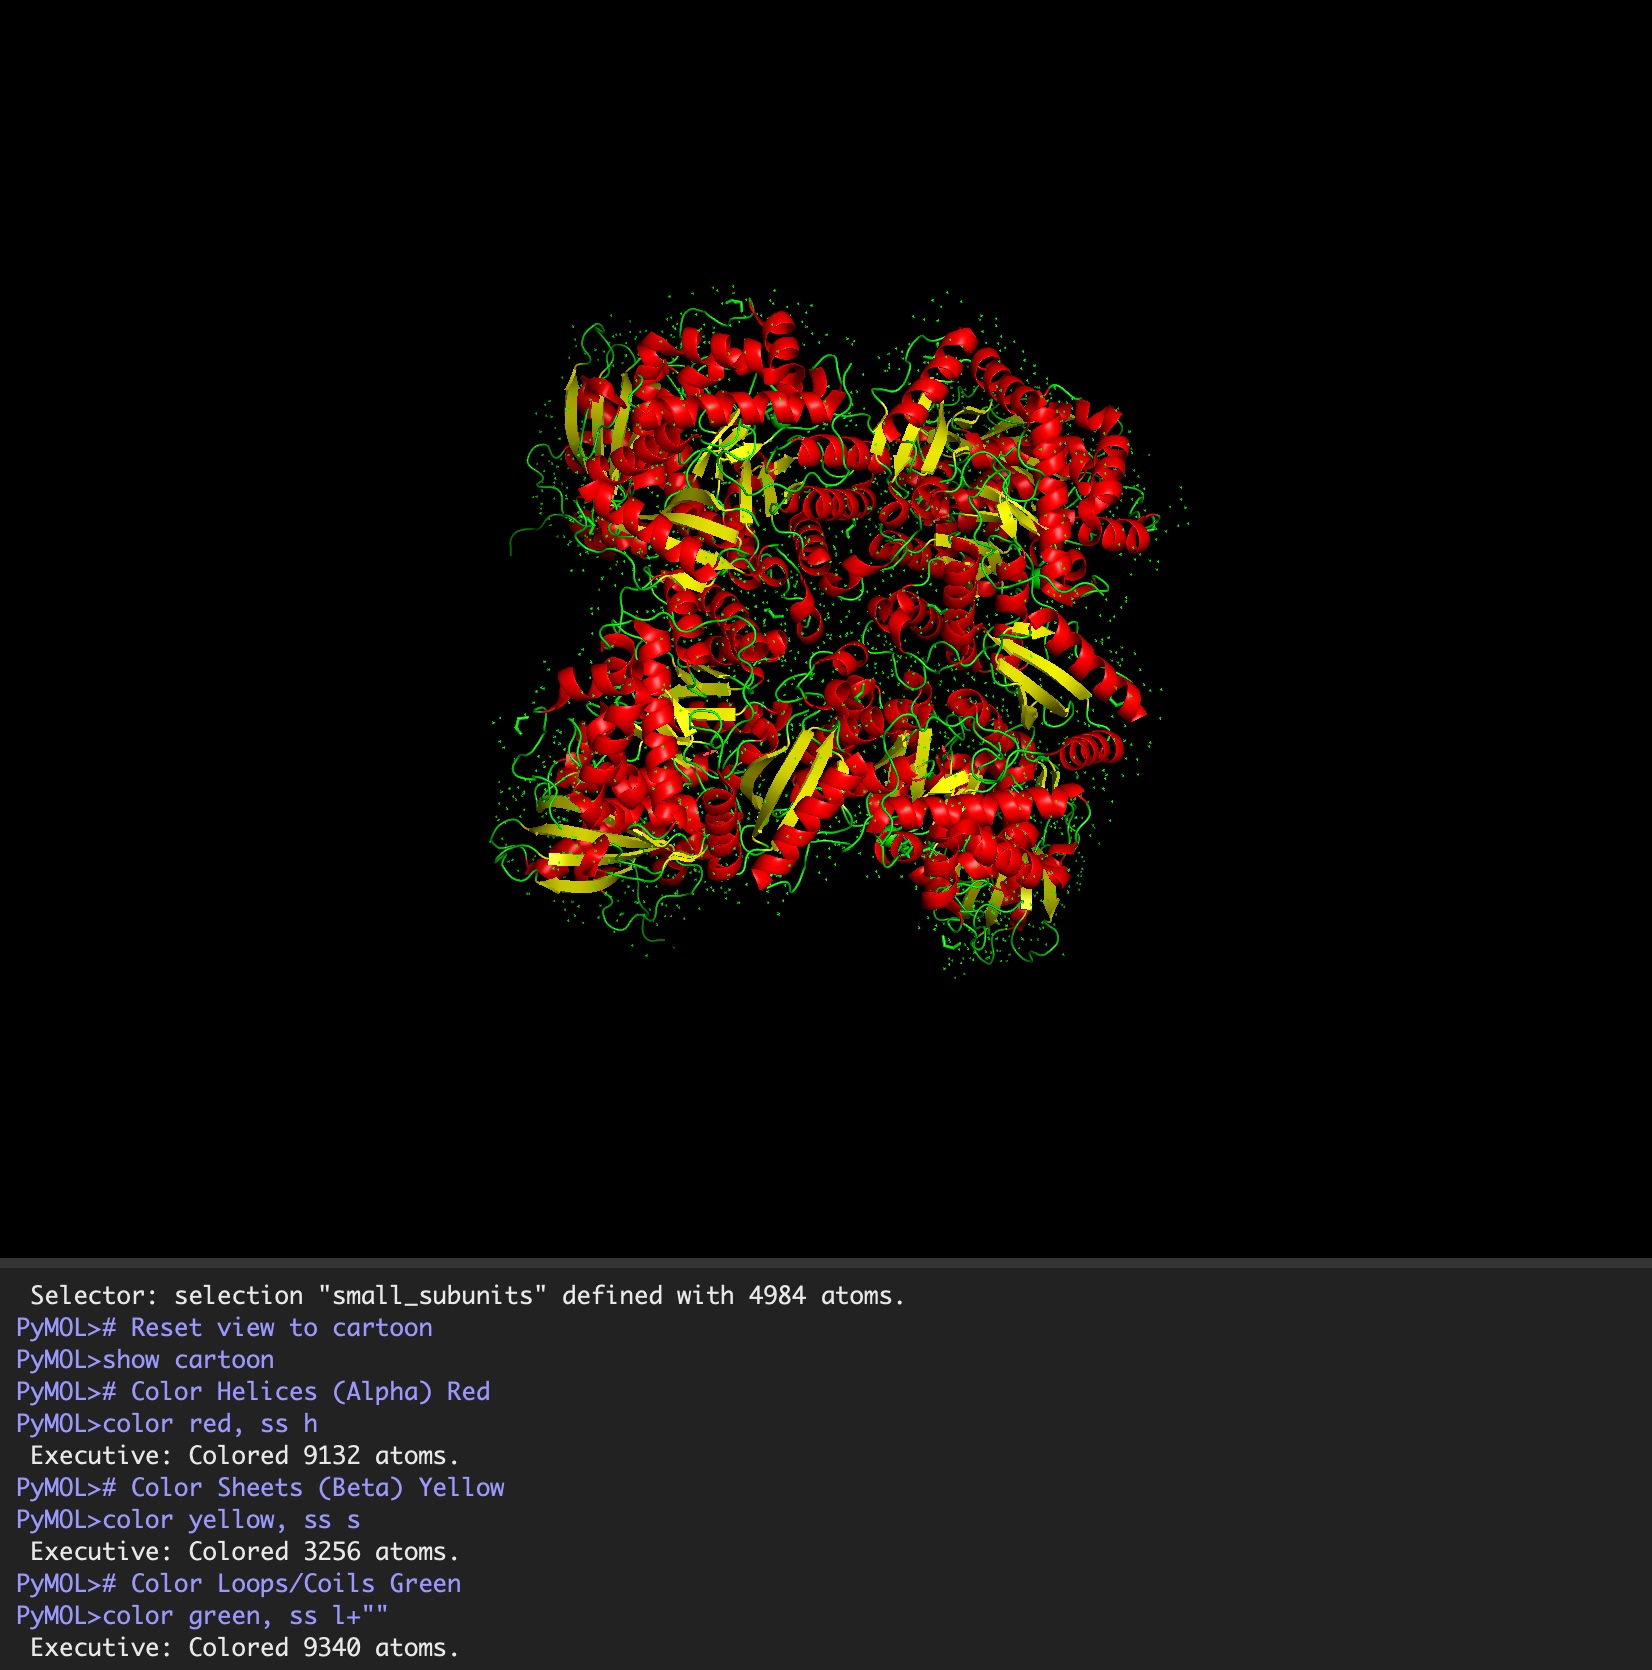
Color the protein by secondary structure. Does it have more helices or sheets?
It has roughly 40% helices and 20% beta sheets.
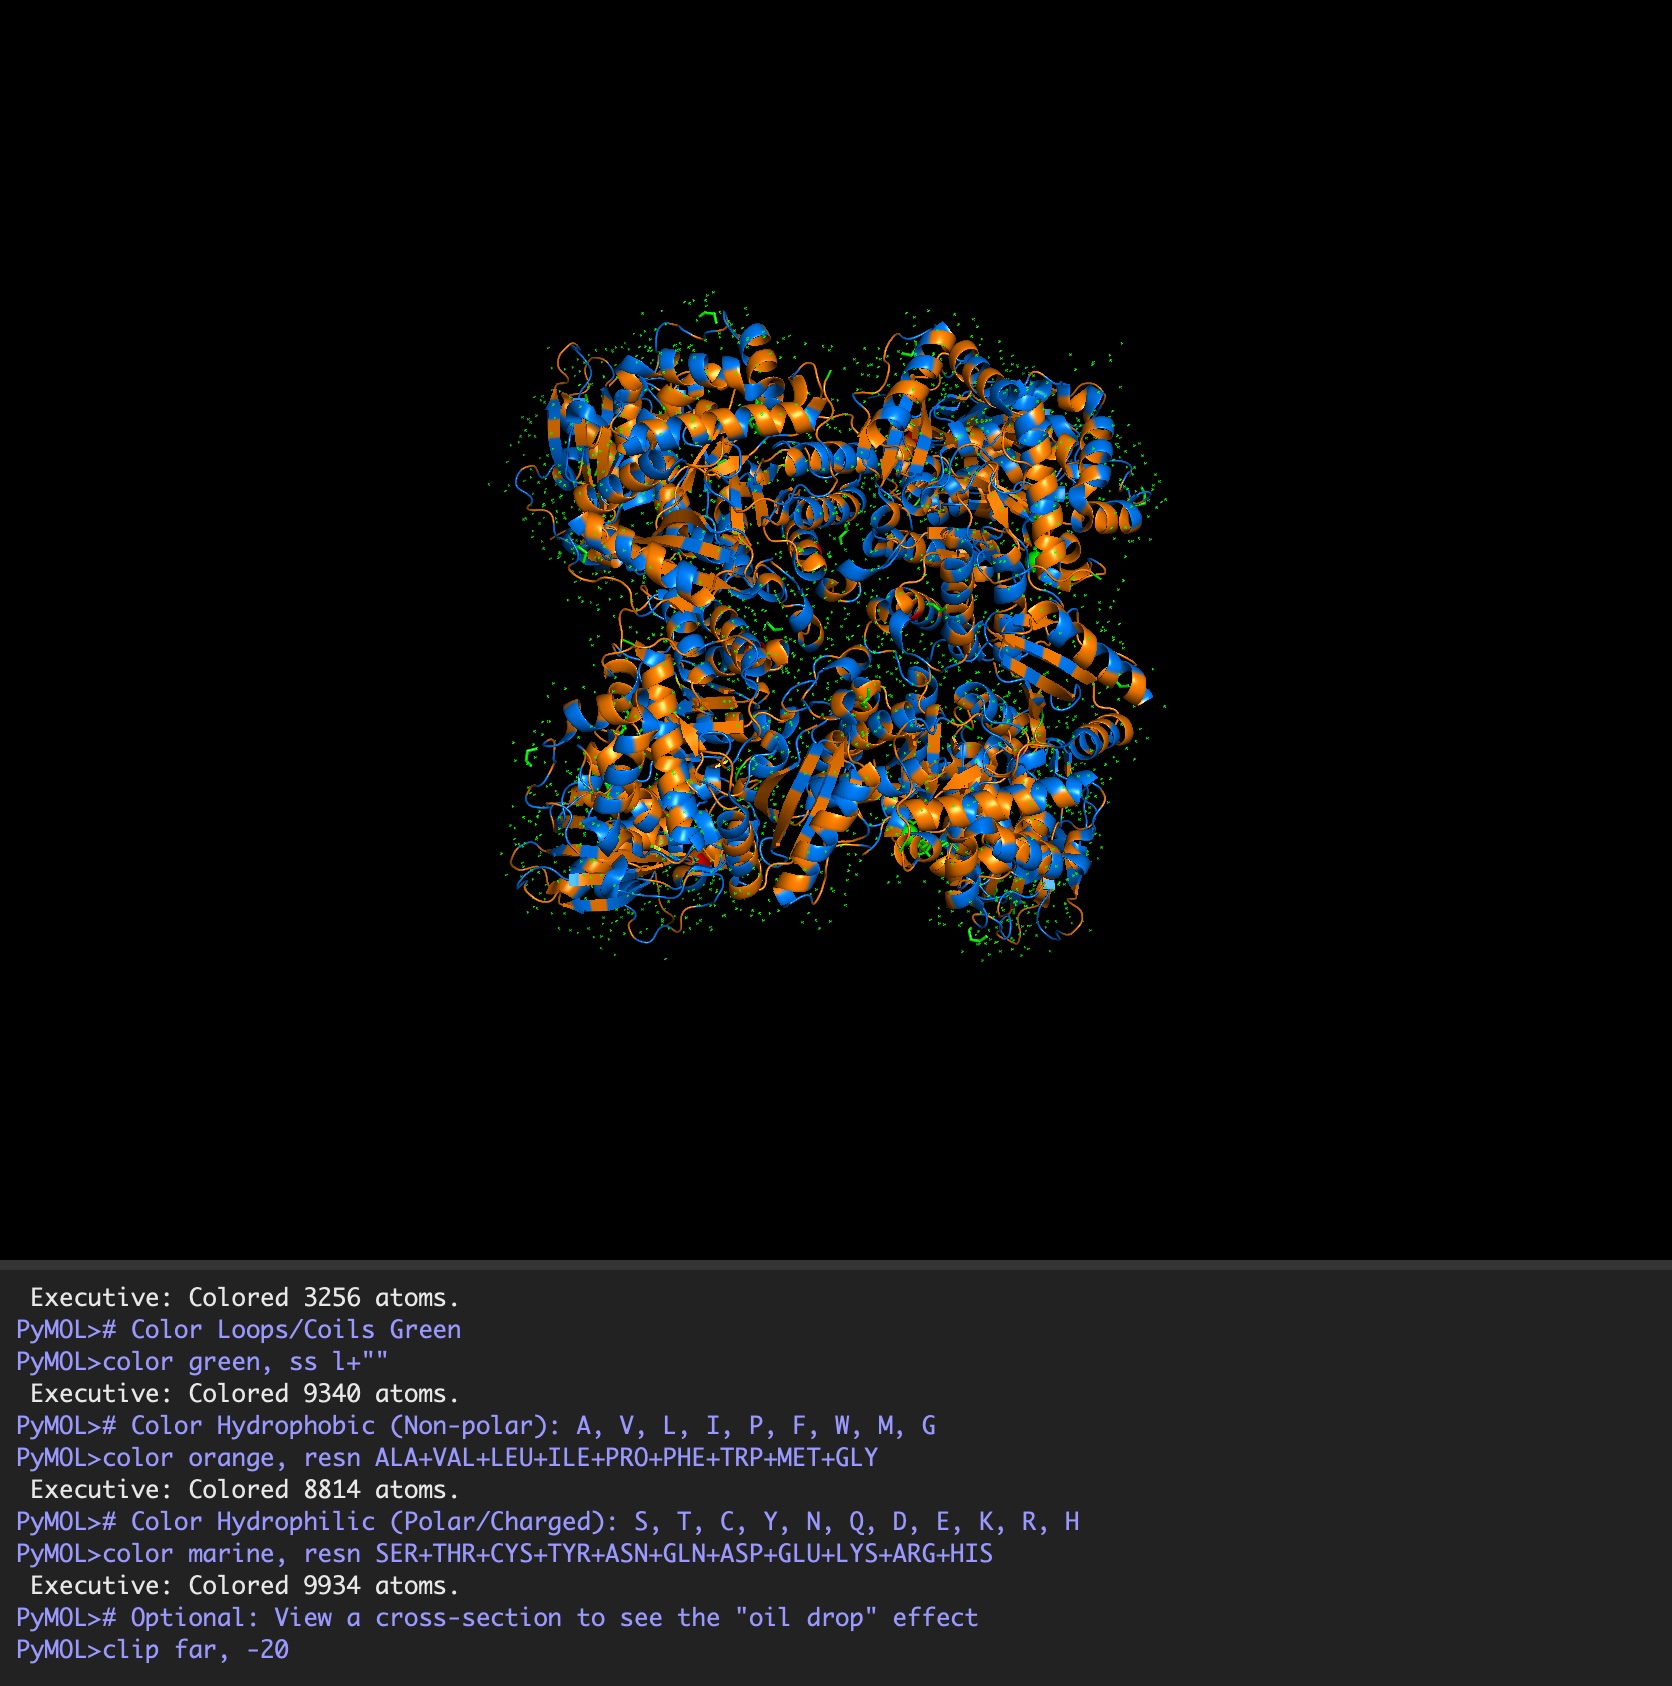
Color the protein by residue type. What can you tell about the distribution of hydrophobic vs hydrophilic residues?
It is a mosaic of hydrophobic and hydrophilic residues, making it efficient in aqueous environments but also able to interact with hydrophobic residues.
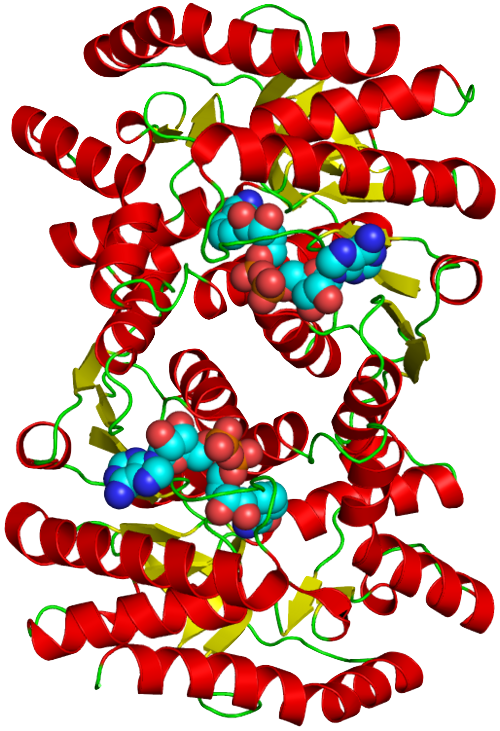
Visualize the surface of the protein. Does it have any “holes” (aka binding pockets)?
Because the holoenzyme is made of 8 large subunits, it has 8 identical active sites. The active pocket sites contain deep indentations located at the mouth of each TIM barrel. This is where Ribulose-1,5-bisphosphate and CO2 meet to be converted into sugar.
The central pore is visible from the “top” (along its axis of symmetry) and is a prominent hole/channel running through the center of the entire L8S8 complex. There are also smaller crevices between the small subunits and the large subunit core, which some researchers believe might play a role in gas or metabolite diffusion. Deep into those 8 pockets is where the magnesium ions are located, which coordinate the substrates and are necessary for the reaction to proceed.
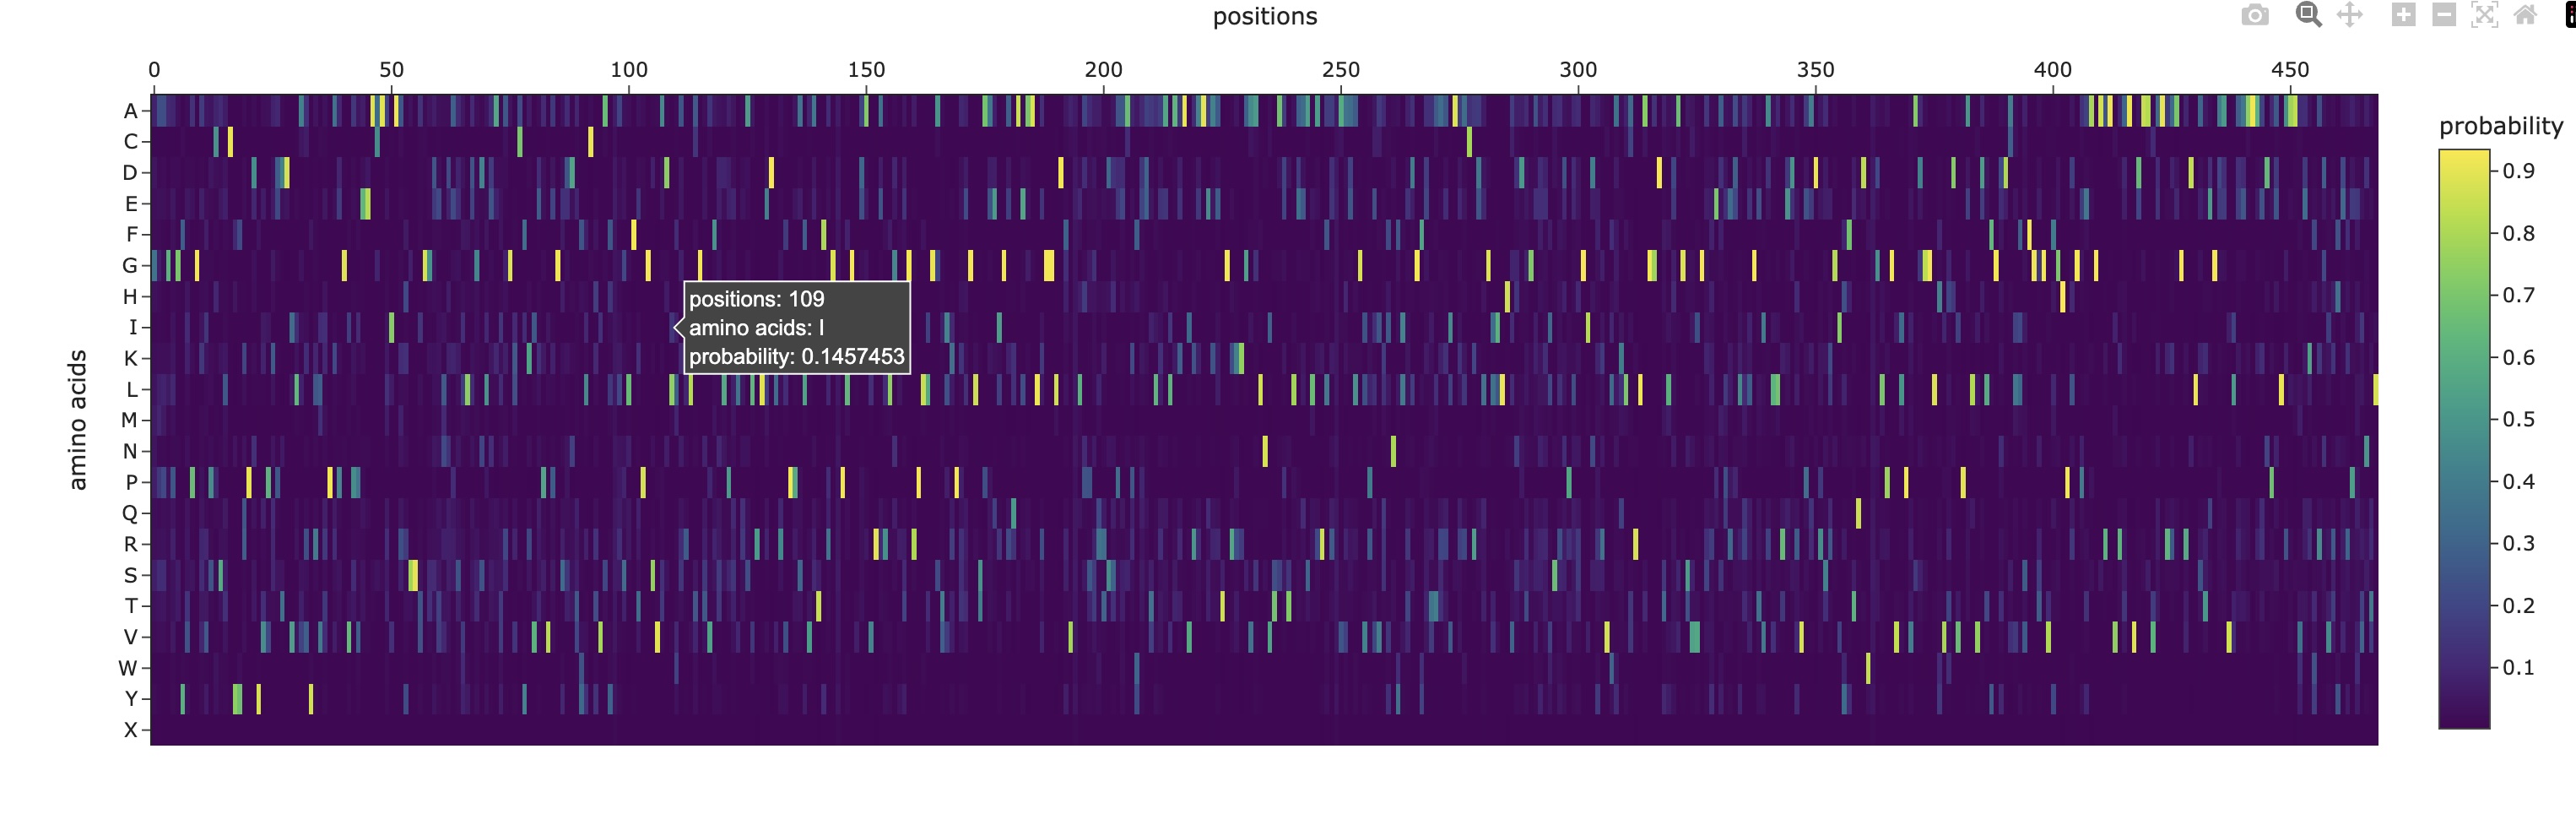
Deep Mutational Scans
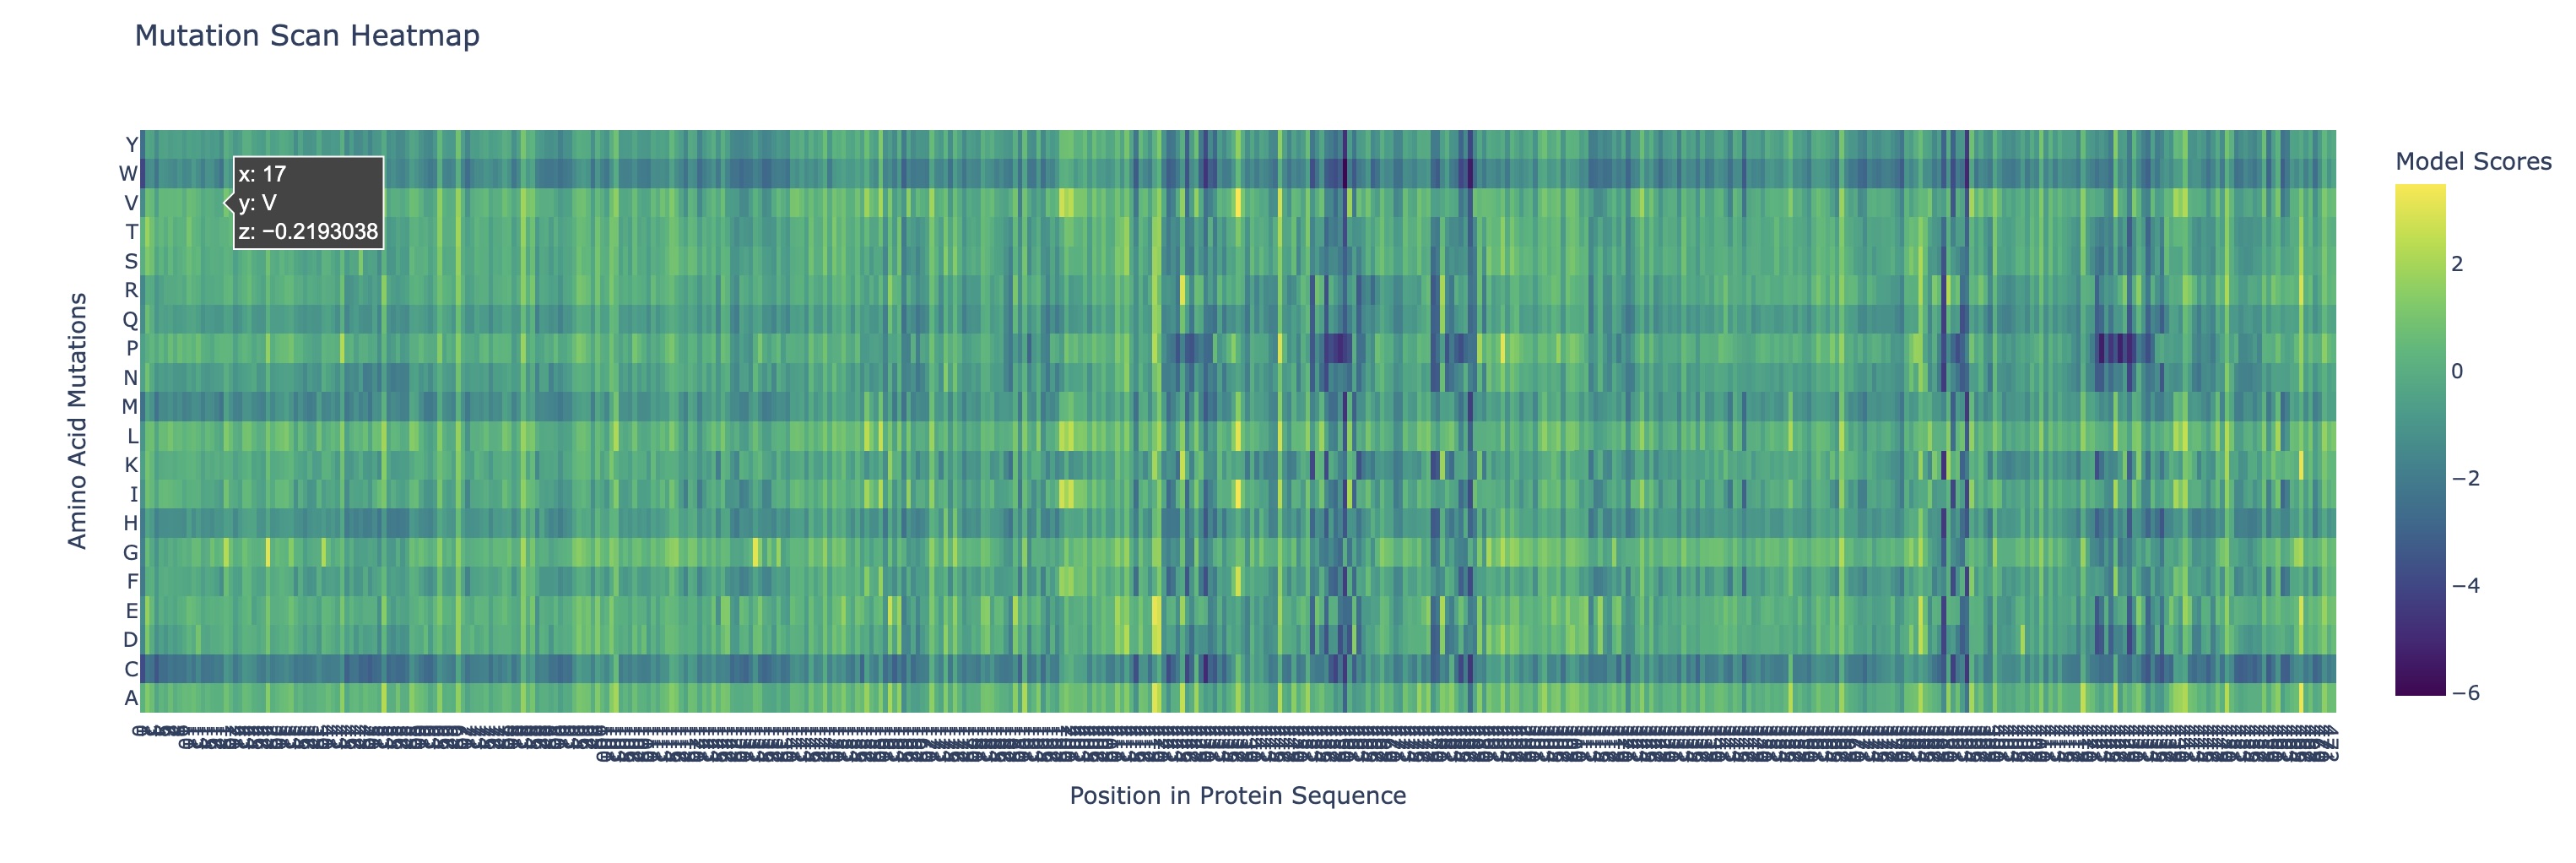
Use ESM2 to generate an unsupervised deep mutational scan of your protein based on language model likelihoods.
Can you explain any particular pattern? (choose a residue and a mutation that stands out)
There are a couple of trends I’ve noticed from this mutational scan. There seem to be 5 main evolutionarily conserved sequences that result in catastrophic damage to the protein if substituted (these are the vertical lines I’ve highlighted in red). Additionally, there are many faintly dark vertical bands, indicating that Rubisco is generally highly conserved which I think is strongly supported by the fact that it’s the most abundant protein on earth (the sequence works and thus has resisted change over a long time scale).
Additionally, there are a couple main horizontal bands of negative change, mainly in amino acids W, C, M, H, Q (outlined in purple). This is actually not that surprising in my opinion. Methionine (M) and Cysteine (C) are unique in that they are the only two that contain sulfur atoms which could cause negative effects in a multitude of ways (sulfur is huge so steric hindrance is likely, it’s very polarizable so it makes an excellent nucleophile with higher reactivity, and its redox affinity allows for structural organizations like disulfide bridges to occur). Tryptophan (W) is a gigantic amino acid with its aromatic ring that again causes a lot of conformational changes due to sterics. Histidine (H) is one of three positively charged amino acid residues and altering electrostatic character (acidity/basicity) usually has significant effects. And Glutamine (Q) is a polar amino acid, again introducing a tangible change to binding character.
What I found interesting was that a substitution of Proline (P) (teal) across the protein was predicted to increase efficiency except at the highly conserved regions I highlighted earlier, where a substitution to proline was significantly more negatively impactful than other amino acids which I found a bit strange.
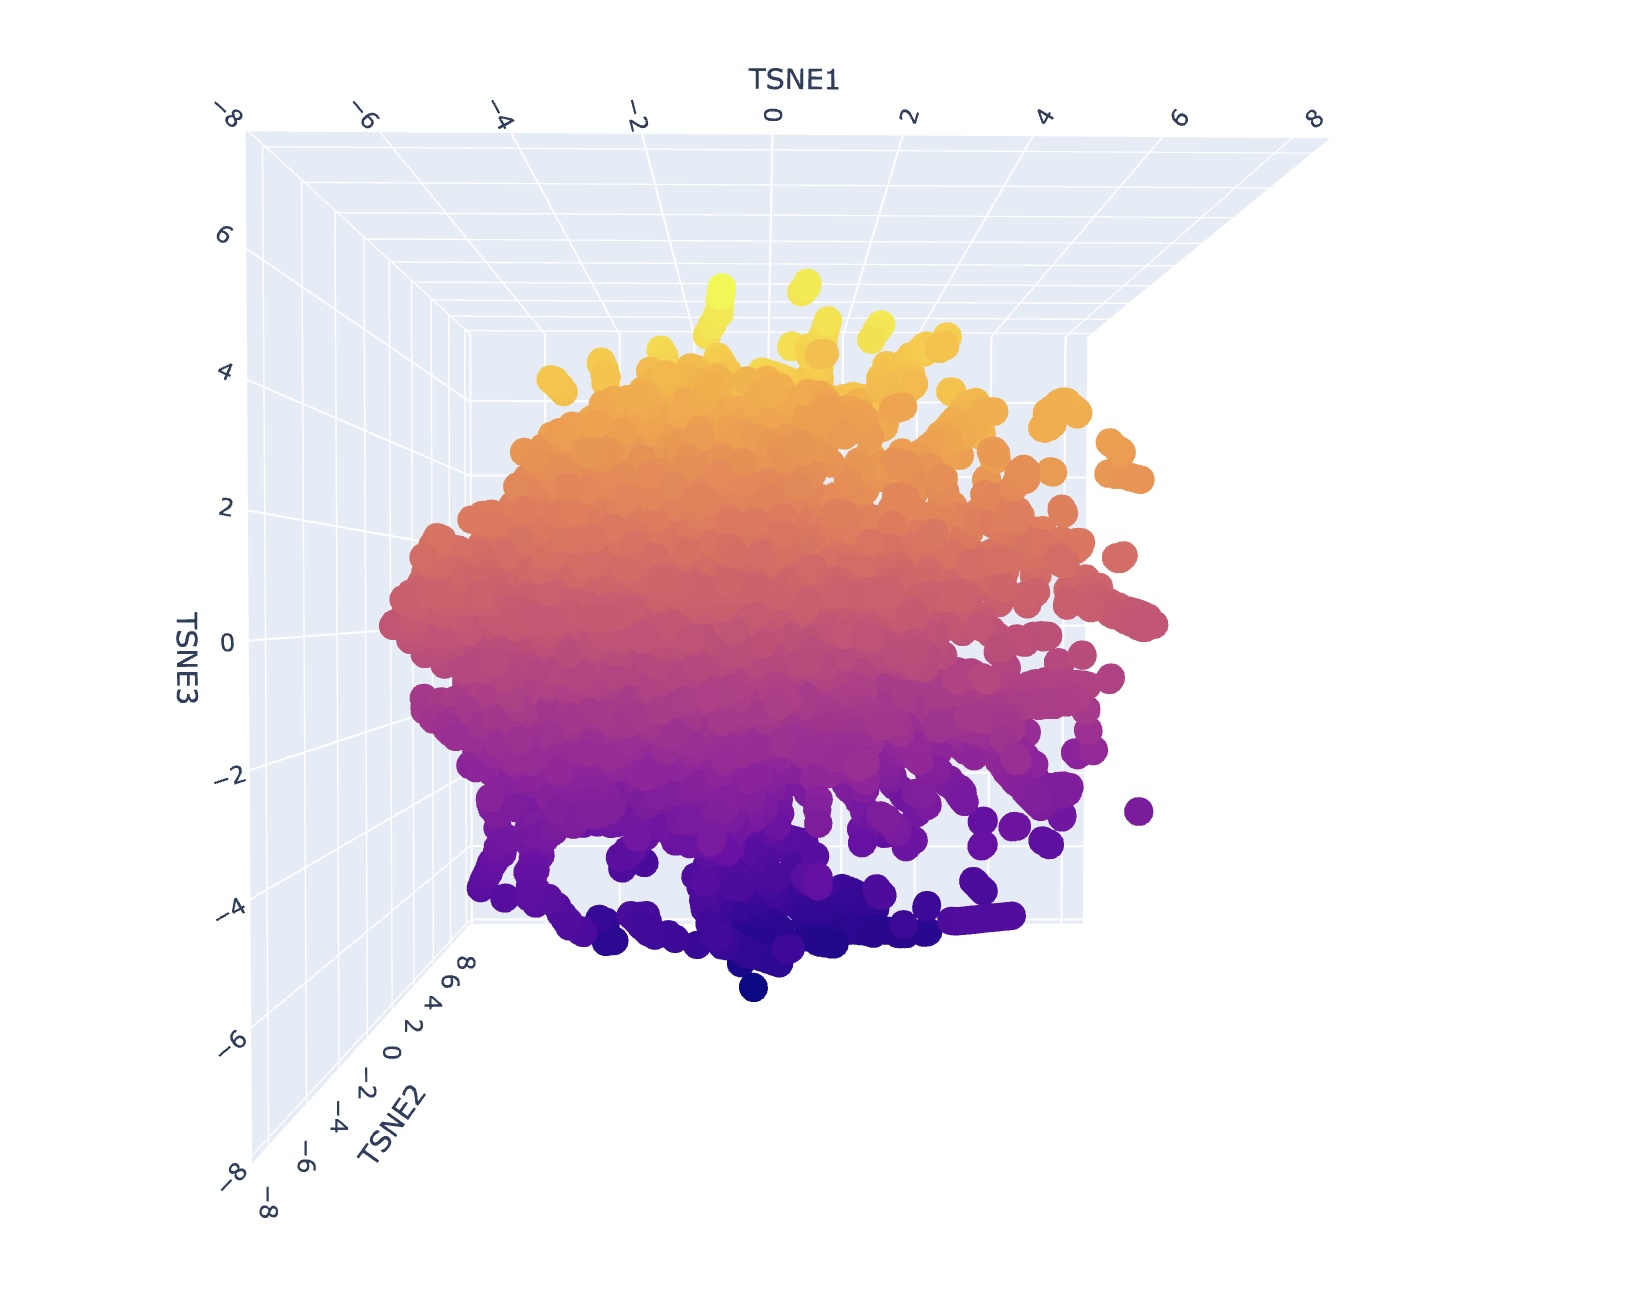
Latent Space Analysis
Use the provided sequence dataset to embed proteins in reduced dimensionality.
Analyze the different formed neighborhoods: do they approximate similar proteins?
I generally could not find super consistent themes or narratives when looking at different neighborhood clusters. I think this is reflective of how protein structure might appear similar but depending on the environment can have significantly different functional attributes. However, upon a second search, I saw that some families contained only bacterial proteins/prokaryotes. Some families also contained only human proteins or proteins of mammals.
Folding a Protein
Fold your protein with ESMFold. Do the predicted coordinates match your original structure?
The predicted coordinates are similar to my original structure but not a perfect match.
Try changing the sequence, first try some mutations, then large segments. Is your protein structure resilient to mutations?
The protein structure is not resilient to mutations featuring distinct changes.
Inverse-Folding a Protein
Let’s now use the backbone of your chosen PDB to propose sequence candidates via ProteinMPNN.
Analyze the predicted sequence probabilities and compare the predicted sequence vs the original one.
Input this sequence into ESMFold and compare the predicted structure to your original.
The predicted structure is somewhat similar to the original structure indicating the viability of ESMFold readout for protein identification, modification, and discovery.
Week 5 Lab: Protein Design Part II
Lab Option 1: L-Protein Mutational Analysis
Experimental Validation & DMS
This lab provides a Deep Mutational Scanning (DMS) style validation of the L-Protein. By cross-referencing experimental lysis results—where a score of 1 indicates functional lysis and 0 indicates non-functional—with the Log-Likelihood Ratio (LLR) Heatmap generated via ESM2, we can assess the predictive power of protein language models.
Key Findings
Correlation: The agreement between the experimental data and the LLR Heatmap is remarkably high, approximately 90-95%.
Predictive Accuracy: The heatmap serves as a highly reliable predictor of whether a specific mutation will allow the protein to retain its ability to lyse bacterial cells.
Challenges: Designing mutants with high computational confidence remains difficult, highlighting the current limitations of some structure-based models.
Targeted Mutation Strategy
To identify promising variants, I cross-referenced the ESM2 scores with experimental lab data, specifically looking for residues that are not strictly conserved (via pBLAST) and show positive mutational effects.
Selection Criteria:
Soluble Region (N-tail): Targeted to assess how surface-exposed changes affect function.
Transmembrane Region: Targeted to test the hypothesis that the L-protein assembles to perforate the bacterial membrane.
Combined Effects: Testing synergistic effects of multiple “positive-score” mutations.
Proposed Mutants
Mutant
Substitution
Location
Index
Sequence Snippet
1
P –> Q
Soluble (N-tail)
6
METRFQQQSQQTPASTNRRRPFKHEDYPCRRNQRSST...
2
C –> S
Soluble (N-tail)
29
METRFPQQSQQTPASTNRRRPFKHEDYPSRRNQRSST...
3
S –> L
Transmembrane
49
...LYVLIFLAIFLLKFTNQLLLSLLEAVIRTVTTL...
4
K –> L
Transmembrane
50
...LYVLIFLAIFLSLFTNQLLLSLLEAVIRTVTTL...
5
C, K –> S, L
Combined
29 & 50
...PSRRNQRSSTLYVLIFLAIFLSLFTNQLLLSL...
Structural Hypothesis: Multimeric Assembly
A running hypothesis for L-protein function is that it assembles into a multimeric complex to create perforations in the bacterial membrane. To investigate this, I utilized AF2_Multimer to generate a predicted multimeric assembly.
By modeling these specific mutations (particularly those in the transmembrane region like Mutant 3 and 4) in a multimeric context, we can observe if the substitutions stabilize the pore-forming structure or increase the efficiency of membrane lysis.
Gemini AI was consulted for data organization and Markdown formatting
Week 6 Lab: Gibson Assembly
Day 1: Preparation of DNA Fragments
Background
In this two-day lab, we modified the color-generating chromophore of the purple Acropora millepora chromoprotein (amilCP) to create a variety of orange, pink, and blue mutants.
We performed two sets of Polymerase Chain Reactions (PCR) to prepare for a Gibson Assembly. The insert PCR region spans the 24 base pairs before the chromophore to just beyond the gene transcription terminator. The forward primer includes an intentional mismatch for site-directed mutagenesis of the mUAV DNA plasmid. These mutants were then expressed in chemically competent E. coli cells.
PCR Reaction Setup
We prepared a backbone reaction alongside four color-specific reactions: Blue, Light Pink, Magenta, and Orange.
1. Backbone DNA Fragment
Primers: Backbone Fwd and Backbone Rev
Reagent
Stock Conc.
Desired Conc.
Volume (µL)
Template mUAV Plasmid
38.5 ng/µL
20 ng
0.8
Backbone Forward Primer
5 µM
0.5 µM
2.5
Backbone Reverse Primer
5 µM
0.5 µM
2.5
Phusion HF PCR Mix
2X
1X
12.5
Nuclease-free water
—
—
6.8
Total Volume
—
—
25.0
2. Color DNA Fragments
Primers: Color Fwd and Color Rev
Reagent
Stock Conc.
Desired Conc.
Volume (µL)
Template mUAV Plasmid
38.5 ng/µL
20 ng
0.8
Color Forward Primer
5 µM
0.5 µM
2.5
Color Reverse Primer
5 µM
0.5 µM
2.5
Phusion HF PCR Mix
2X
1X
12.5
Nuclease-free water
—
—
6.8
Total Volume
—
—
25.0
After mixing, the tubes were placed in the thermocyclers. The backbone was run on one specialized program while the color mutations were run on another.
Note: DpnI digest was skipped as our reactions did not contain methylated DNA.
Purification & Analysis
We purified the PCR products using the Zymo DNA Clean & Concentrator kit.
We utilized Zymo-Spin columns, performed two washes, and eluted the DNA for storage. The listed protocol was for 50µL of PCR product. We made 25µL total in our PCR reactions, so we used 20µL of PCR product (saved 5µL) in the purification process and scaled the other volumes to equal proportion. Gel electrophoresis was performed to verify the amplification.
Gel Results: We had a 1kb ladder furthest left, and Lane 1 contains the native plasmid. Lanes 2–5 show the expected amplified fragments for the Gibson Assembly, all roughly around 650bp. Our gel results were very convincing, we didn’t see formation of primer dimers or miscellaneous bands indiciating reduced PCR efficacy and polymerase fideltiy. Each sample contained a strong band at the expected bp length. Samples were then stored in fridge until the next lab day.
Day 2: Assembly & Transformation
Gibson Assembly
We diverged slightly from the standard protocol by utilizing unpurified PCR products for the assembly. This decision was made for a couple of reasons. We realized we had very small samples of each color in both the purified and unpurified results, effectively forcing us to chose between assaying the concentration via nano-drop or assembling the reaction with our theoretical maxium concentration. Additionally, other groups were reporting very low (almost negligible) concentrations when they tested purified PCR products. So, we decided to use our unpurified products and followed the rest of the protocol as stated (given our gel result, we deemed it reasonable to assume that the majority of DNA content was the desired amplicon.
Reagent
Stock Conc. (ng/µL)
Desired Conc (ng/µL)
Volume (µL)
Backbone Fragment
50
25
0.5
Color Fragment (Single)
50
50
1.0
Gibson Assembly Mix
2X
1X
5.0
Nuclease-free water
—
—
3.5
Total Volume
—
—
10.0
The reaction was incubated at 50°C in the thermocycler for 30 minutes.
Transformation
We compared two competent E. coli strains: DH5α and 10-beta.
We thawed our competent cells, and mixed 20µL of cells with 4µL from each of our Gibson Assembly reactions and incubated for 30 minutes on ice. We also did an additional reaction with just the native plasmid (DH5α with mUAV) to serve as a positive control for successful transformation. To create the control, I only utilized 1µL of the plasmid to try and somewhat match the total concentration of the samples.
At this next step, we again diverged slightly from the protocol. We transfered the transformation reactions into PCR tubes containing 100µL of SOC medium and performed the heat shock step in that solution in the thermocycler. The heat shock importantly was only 45 seconds, and the cells were put on ice immediately after.
Incubation: Mixed competent cells with Gibson products and incubated on ice for 30 minutes.
Heat Shock: Performed in the thermocycler for 45 seconds in SOC medium, then immediately returned to ice.
Outgrowth: Incubated for 60 minutes (it was really ~45 minutes) using a makeshift shaker made from a pipette tip box.
We plated the entire incubation (~124µL) of each transformation onto LB-Agar plates with Chloramphenicol using glass beads for even spreading.
Results
After 72 hours of incubation, the results were highly successful! We achieved the targeted chromophore mutations across both cell lines.
Analysis
The positive control confirmed the effectiveness of the assembly. While some purple colonies (native plasmid) were present on all plates, each plate showed distinct colored colonies (Orange, Pink, Blue, Magenta), indicating successful Gibson Assembly and transformation.
Control
Pink
Blue
Orange
Magenta
Gemini AI was consulted for formatting and content organization
Week 7 Lab: Neuromorphic Circuits
Intracellular Artificial Neural Networks (IANNs)
In this two-day lab, we designed and built our very own IANN using a library of plasmids from the Ron Weiss lab and human embryonic kidney (HEK) 293 cells. IANNs differ from traditional synthetic genetic circuits because IANNs can perform analog computations, rather than being limited to digital computations. IANNs are also universal function approximators—given an adequate number of intracellular artificial neurons, you can use an IANN to achieve any input/output behavior you’d like.
Day 1
I worked with a group of three, and this was the circuit we designed:
Here are the predicted results by the biocompiler:
Day 2
On day 2, we took a trip to the Weiss Lab and Evan started the protocol on the Opentrons machine to begin construction of our neuromorphic circuits. We also looked at some immortalized human cells on a microscope, giving insight to experimental mammalian cell biology.
Results
Our results didn’t quite match the prediction. This is due to the fact that our uploaded circuit violated some of the “laws” governing the system’s design (we learned this later), but the computer still allowed these “illegal” circuits to be generated and simulated.
Gemini AI was consulted for formatting and content organization
Week 9 Lab: Protein Purification & Mycelium
Fungal Materials Follow-up
The first thing we did was look at our mycelium molds (no pun intended). We are tracking the growth and structural integrity of the fungal networks as they colonize the substrates.
Protein Purification: An Introduction
To isolate our protein of interest, we first had to grow the cells and then lyse them using a combination of B-PER (Bacterial Protein Extraction Reagent) and sonication. This process breaks open the cell membranes, resulting in a lysate solution (labeled as Tube A) that contains the total protein content of the cells.
Method 1: Magnetic Bead Protein Purification
This method utilizes functionalized magnetic beads to “grab” tagged proteins out of the lysate.
The Procedure:
Binding: Added magnetic beads to the solution (labeled Tube B).
Separation: Took 500µL of the mWatermelon + mag beads and placed them onto a magnet tray. The beads (now bound to our protein of interest) sat tight against the magnet.
Clearing: Pipetted out the residual volume (excess proteins and buffer).
Washing: Added 500µL of Wash Buffer (containing a small amount of imidazole, 20mM) to wash any untagged, non-specific proteins from the beads. Mixed well and returned to the magnet tray to remove the wash.
Elution: Added 200µL of Elution Buffer (containing a high concentration of imidazole, 500mM) to strip the protein from the beads.
Collection: After the beads settled on the tray, we pipetted the liquid out. This is Solution 4.
Repeat: Repeated the elution step with another 200µL of Elution Buffer to catch any residual fluorescent protein. This resulted in Solution 5, which still contained a significant amount of FPs.
Method 2: Ni-NTA Spin Column Protein Purification
As an alternative to magnetic beads, we used Ni-NTA (Nickel-Nitrilotriacetic acid) beads in a spin column format, which relies on centrifugal force to move the buffers through the resin.
The Procedure:
Incubation: Combined 200µL of Ni-NTA bead solution with 2mL of lysate. We let this incubate for 30 minutes to allow the His-tagged proteins to bind to the nickel resin.
Binding Spin: Transferred to an eppy tube and spun at 8,000 RPM for 1 minute. We collected and observed the flow-through.
Wash Step: Added 500µL of wash buffer to the column and spun again at 8,000 RPM for 1 minute.
Elution: Added 200µL of Elution buffer and performed a final spin at 8,000 RPM for 1 minute.
Observation: We analyzed the final flow-through to confirm the presence of our purified protein.
Gemini AI was consulted for formatting and content organization
Final Project Document Link to Presentation
Final Project Gallery
Project Description My goal is to develop a system capable of converting carbon dioxide into more chemically inert compounds as a means of combating carbon pollution via carbon capture. The system at a baseline should function in two parts: efficient conversion of carbon dioxide into bicarbonate, and conversion of bicarbonate into chemically locked compounds for storage or other practical usage. By utilizing enzymes like carbonic anhydrase to speed up the process, this system could contend with other methods of carbon capture technology or see application as a sustainable, carbon dioxide scrubbing system. Continued iteration would hopefully result in a completely self-replenishing, stable system capable of fixing CO2 with minimal intervention.
My goal is to develop a system capable of converting carbon dioxide into more chemically inert compounds as a means of combating carbon pollution via carbon capture. The system at a baseline should function in two parts: efficient conversion of carbon dioxide into bicarbonate, and conversion of bicarbonate into chemically locked compounds for storage or other practical usage. By utilizing enzymes like carbonic anhydrase to speed up the process, this system could contend with other methods of carbon capture technology or see application as a sustainable, carbon dioxide scrubbing system. Continued iteration would hopefully result in a completely self-replenishing, stable system capable of fixing CO2 with minimal intervention.
Aim 1: Experimental Aim
My goal for this project is to be able to successfully link the two systems together as a proof of concept. I will use cell-free protein expression to produce the enzymes carbonic anhydrase, phosphoenolpyruvate carboxylase, and malate dehydrogenase. I will combine carbonic anhydrase in a solution containing calcium ions and inorganic dissolved carbon dioxide from a sodium derivative, and then measure calcium bicarbonate precipitate output as a proxy for carbonic anhydrase mineralization capabilities. A secondary experiment will be performed using my “Sodastream” to directly dissolve CO2 into the liquid (gaseous carbon dioxide source) as functional evidence for CO2 emission elimination. Secondly, carbonic anhydrase, phosphoenolpyruvate carboxylase, and malate dehydrogenase will be combined in solution without calcium ions, allowing for bicarbonate incorporation into catalyzed reactions to produce malate. Readout will be determined by NADH utilization, which can be measured with a spectrophotometer (NADH is consumed by malate dehydrogenase). Should time permit, I hope to use LLM tools to try to increase the efficiency and stability of these enzymes.
Aim 2: Development Aim
The key technical limitations of this project arise in achieving a stable system capable of functioning with minimal human intervention. Currently, my proposed mechanism requires serial addition of reagents, and the sequestered output has limited viability and utility. A developmental aim for this project would be to optimize the system mechanics to be functional on a commercially viable scale. For example, the enzymes are not capable of sustained function for more than a few hours, so a secondary aim would be designing more kinetically stable enzymes or a system to cheaply manufacture enzymes at a large scale with long chemical viability so that resupply isn’t a prohibitive barrier. Additionally, optimizing the mechanism to utilize the minimum amount of reagents or to utilize exclusively self-regenerating reagents would push the concept to a practical, commercial scale as well.
Aim 3: Visionary Aim
Once viable, the global application of this system would help combat carbon emissions to aid in the battle against climate change. Ideally, this system would be able to capture the majority of CO2 output from an emission source, preventing the accumulation of more carbon in our atmosphere. From car-exhaust pipes, power plant smoke stacks, and home heating systems, a liquid sequestration system could take on many different carbon emission sources with applications across a variety of industries and products. Finally, creating a cell-free system capable of attacking the source problem could then be applied to attacking the atmospheric cleanup problem by deploying biological machinery across new mediums and scales.
Spectrophotometer (340nm for NADH, 600nm for mineralization)
96-Well Plate Reader
-20ºC Freezer
4ºC Frdige
30ºC/37ºC Warm Room
Centrifuge
Mineralization Assay
Buffer: 20 mM HEPES or Tris (pH 8.2–8.4)
Substrates: 10–25 mM NaHCO3, 5–15 mM CaCl2
Enzyme: Carbonic Anhydrase (variable for testing)
Note: pH near 8.3 supports carbonate availability. A non-phosphate buffer avoids false precipitation, and calcium carbonate forms cleanly under these conditions compared to phosphate systems (avoids Ca3PO4 contamination).
NaHCO3 is used first for a simple proof of concept. Further testing with dissolved CO2/carbonated water/gas-equilibrated solution as the carbon source will follow. CA will accelerate hydration and mineralization, providing evidence for capture.
Reaction Conditions
Full reaction w/ CA
No Carbonic Anhydrase
No CaCl2
Readout
Analyze the change in turbidity at 600nm (expected increase)
Pellet sample and analyze behavior (CaCO3-like?)
Relative to controls, Full Reaction with CA should show faster turbidity and/or more precipitate and/or reproducible solid formation
Fixation Assay
CA supplies bicarbonate efficiently from dissolved CO2/bicarbonate pool.
Reaction Step 1 (PPC): PEP + HCO3− → oxaloacetate + Pi
Ran the SDS-PAGE gel at 150→50→70 volts for ~1.5hrs until the dye reached the bottom
Pried the gel out of the box and rinsed 3 times with dH2O
Added enough SimpleBlue SafeStain to coat the entire gel
1 hour staining on tilt-table
O/N destaining in ddH2O
Liquid Culture Preparation
Retrieved LB+Agar plates from incubation
Prepared 3 flasks of LB+Amp at 25ml volumes
Inoculated liquid culture with colony from LB+Agar plates for each sample
Placed liquid cultures in 37ºC warm room for incubation
Lab Day 3:
SDS–Page Gel Imaging
Removed stained gel from the tilt table
Imaged both with iPhone camera and gel box
Plasmid Mini-Prep
Grabbed liquid cultures from the 37ºC warm room
Spun down duplicate 1.5mL samples from each culture
Followed Monarch Spin Plasmid Mini-Prep Protocol
Eluted with heated elution buffer to make 50ul plasmid mixtures
Left in -20C
Ronan then created CFPS reactions for each of my mini-preps while I was away
Lab Day 4:
Ginkgo Preperation
Brought all my reagents to Ginkgo to run my assays
Prepared fresh dissolved CO2 and measured pH to determine concentration (~10mM)
Prepared fresh PEP, HEPES, and NADH for the reaction series
Setup two scripts to run the Fixation Assay and the Mineralization Assay
Mineralization Assay
Setup script for 96-Well Plate Reader
Initial shake
OD600 reading every two minutes for 1 hour
Repeated protocol 3 times
Data export
Fixation Assay
Setup Script for 96-Well Plate Reader
Initial Shake
380nm and 340nm absorbance readings every 30 seconds for 3 hours
Data export
(Wells E and F were actually ran in A and B on a separate plate)
Results
SDS-Page Gel
The gel results were interesting. The bands that appeared were very faint and some were nearly impossible to capture on camera. Based on visual interpretation (I promise I saw these bands): There were bands present at the expected MW for Carbonic Anhydrase and Malate Dehydrogenase. There were no bands present in the Phosphoenolypyruvate Carboxylase lane and there were control bands present in the Lysate lane. Because there were no bands at all present in the PEPC lane, its very likely that the loaded sample was too dilute so this did not invalidate that PEPC was expressed cell-free. Additionally, given the very faint bands across the entire gel, its likely that they were also quite dilute, which actually supports the data from the Mineralization and Fixation Assays.
I was very excited with the results of this assay! Its important to note that conditions A(n) and B(n) differ only in the enzyme added. A’s all had the initial CFPS reaction I ran (the one with finnicky SDS-Page results) and B’s all had the secondary CFPS reaction that was prepared from the plasmids that I minipreped. Conditions n= 1-3 and n= 4-6 differ only in the carbon source, A’s using NaHCO3 and B’s using dissolved CO2 from my Sodastream. B4 was the full reaction with dissolved CO2 and showed exactly what I had hoped: faster formation of calcium precipitate, indicating effective conversion of dissolved CO2 into bicarbonate! A4 yeilded a similar result, though at a diminished level which I hypothesize is due to low protein yeild in the initial CFPS reaction. A1 and B1, again, behaved as expected, and were the same reaction except dissolved CO2 was from NaHCO3 which in solution forms CO2. The 6’s and 3’s both behaved as expected: these were reactions without calcium chloride, so they maintained a constant turbidity as no precipitate was forming (there are some weird step-function looking shapes that are almost definetely experimental artificat. Each incidence happens when the script finished and then resumed again, so the OD calibration might have been effected, but within a 1 hour interval, the value stayed constant). Overall very happy with these results!
Fixation Assay
,
This assay was a little more interesting, but again I was definitely very happy with the overall results! Its important to note that conditions A(n) and B(n) differ only in the enzyme added. A’s all had the initial CFPS reaction I ran (the one with finnicky SDS-Page results) and B’s all had the secondary CFPS reaction that was prepared from the plasmids that I minipreped. Conditions n= 1-4 and n= 5-8 differ only in the carbon source, A’s using NaHCO3 and B’s using dissolved CO2 from my Sodastream. Consumption of NADH should result in a decrease in absorbance at 340nm. This should be the case in wells n=1,2,5, and 6. 1 and 5 are full reaction conditions, and 2 and 6 are missing only Carbonic Anhydrase which is a catalyst that increases HCO3 availability in the reaciton, but is not necessary for the reaction cascade to proceed. Other conditions removed PEPC or MDH, and both are necessary for NADH consuption to occur. The way the results played out are as follows: The conditions yeilded expected results for the functional, experimental groups but in weird ways. The B’s had the biggest initial absorbance then decline, where as the A’s had a smaller initial absorbance followed by their decline. However, the other groups also featured a decline in abosorbance over time, but strangely. NADH is unstable so there was likely oxidation and reduction of other substances within the reaction that caused the decline in NADH as it became NAD+. However, looking at the data with all wells, the 1,2,5,6 samples are the cluster that are the lowest on the graph! And after running some statistics across the conditions (comparing experimental to constants (A1 vs A3, A1 vs A4, etc.)) the rate and total absorbance were statistically significant (p < 10^-40) and the normalized rates and absorbances were also significant to the same degree. So despite the weird curves, there was a significant, measurable difference in NADH consumption, indicating that the reactions were successful, and CO2 was being fixed into malate!
Summary
Overall I had a really incredible experience working on my final project and through this class in general. I want to give special thanks to Ronan who supported me through long lab hours and even while I was away to make this final project come together. I am excited and proud to say that my final project was a success!
I designed 3 distinct plasmids with custom t7 promoters and 7x Histidines tags that were successfully created
The proteins I selected are very complex and large, and yet were expressed cell-free which is remarkable!
My assays provided effective proof of concept: measurable CO2 conversion into HCO3 and measurable fixation into 4-C Malate
With these results I would be eager to further explore making this system a reality. I assayed across one set of buffer conditions and can experiment with adjusting the buffer conditions to find an optimal rate for the system! I assayed across one temperature and can add that variable into testing. I used the enzymes in their wildtype form and can now try and optimize them to increase stablity, efficiency, and availability with language models! This project has opened the door for what is possible with biology and cell-free reactions and I am excited to continue doing work in this field.