week-10-hw-imaging and measurment
Final Project
My final project proposes an optogenetically controlled bacterial cellulose system in Komagataeibacter rhaeticus. The long-term goal is to use projected blue light as a spatial input to locally repress bacterial cellulose production, creating differences in material density, thickness, and structure during growth.
The proposed circuit combines two systems from the literature. The input layer is the Opto-T7RNAP system, where blue light reconstitutes a split T7 RNA polymerase and activates transcription from a T7 promoter. The output layer is an sRNA module targeting UGPase, an enzyme required for UDP-glucose production, which is the precursor for bacterial cellulose biosynthesis. In the proposed design, light would activate sRNA expression, repress UGPase, and therefore reduce cellulose production in illuminated regions.
What I would measure
For Aim1 my project is fully in silico however for aim2 the most important measurements for this project are:
Optogenetic input performance
I would measure how strongly the Opto-T7RNAP system turns on gene expression in response to blue light, and how much expression occurs in the dark. This is important because dark-state leakage would reduce the contrast between illuminated and non-illuminated regions.
I would first measure this using a fluorescent reporter such as mCherry under a T7 promoter. Cultures would be grown with different arabinose concentrations, exposed either to blue light or kept in darkness, and then measured using a plate reader or spectrometer. The output would be fluorescence normalized to cell density, for example mCherry fluorescence / OD600. This would allow calculation of the light/dark fold-change and the optimal arabinose concentration.
sRNA expression and UGPase repression
The next measurement would test whether light-induced sRNA expression actually represses the cellulose pathway. This could be measured at the RNA level using RT-qPCR. I would compare UGPase mRNA levels in light-exposed and dark samples. If the system works, illuminated samples should show reduced UGPase mRNA or reduced effective UGPase expression compared with dark controls.
A second option would be to add a reporter output before testing the real cellulose output, for example a fluorescent reporter under the same T7 promoter. This would confirm that the light-controlled transcription system works before connecting it to the sRNA module however it is harder to quantify.
- Bacterial growth / toxicity control
Although already indicated by the Walker, K. T. et al. (2025). paper that it doesn’t, it is still important to measure whether the circuit changes cellulose production without strongly reducing cell growth. I would measure OD600 in liquid culture with cellulase added to prevent cellulose clumping. This would allow comparison of growth in light and dark conditions, and between induced and uninduced controls.
This control is important because reduced cellulose production should ideally come from UGPase repression, not from poor growth, cell toxicity, or plasmid burden.
Cellulose production
The main material output would be cellulose production. This can be measured by growing pellicles under different light conditions, washing them, drying them under standardized conditions, and weighing the dry cellulose. The result would be dry cellulose mass per sample or per culture volume.
This would directly test whether light exposure causes a measurable reduction in cellulose production. Controls would include wild-type K. rhaeticus, a no-light condition, a full-light condition, and a projected-pattern condition.
Spatial pattern resolution
Because the project is about patterned material growth, I would measure how accurately a projected light pattern is transferred into the cellulose output. This could be done by projecting stripe patterns with different widths during pellicle growth, then imaging the final wet and dried pellicles.
Image analysis could be used to measure contrast between intended high-cellulose and low-cellulose regions. The key values would be minimum visible feature size, edge blur, and contrast between regions.
Material structure and morphology
If patterned cellulose regions are produced, I would measure whether they differ structurally. Optical microscopy could be used for low-resolution imaging of pellicle thickness and surface texture. SEM could be used to examine cellulose fibril morphology in high- and low-production regions.
For a more material-focused version of the project, I would also measure thickness, dry mass per area, water uptake, shrinkage after drying, and possibly tensile strength. These measurements would show whether the genetic pattern creates a real material difference, not only a visual difference.
Measurement technologies
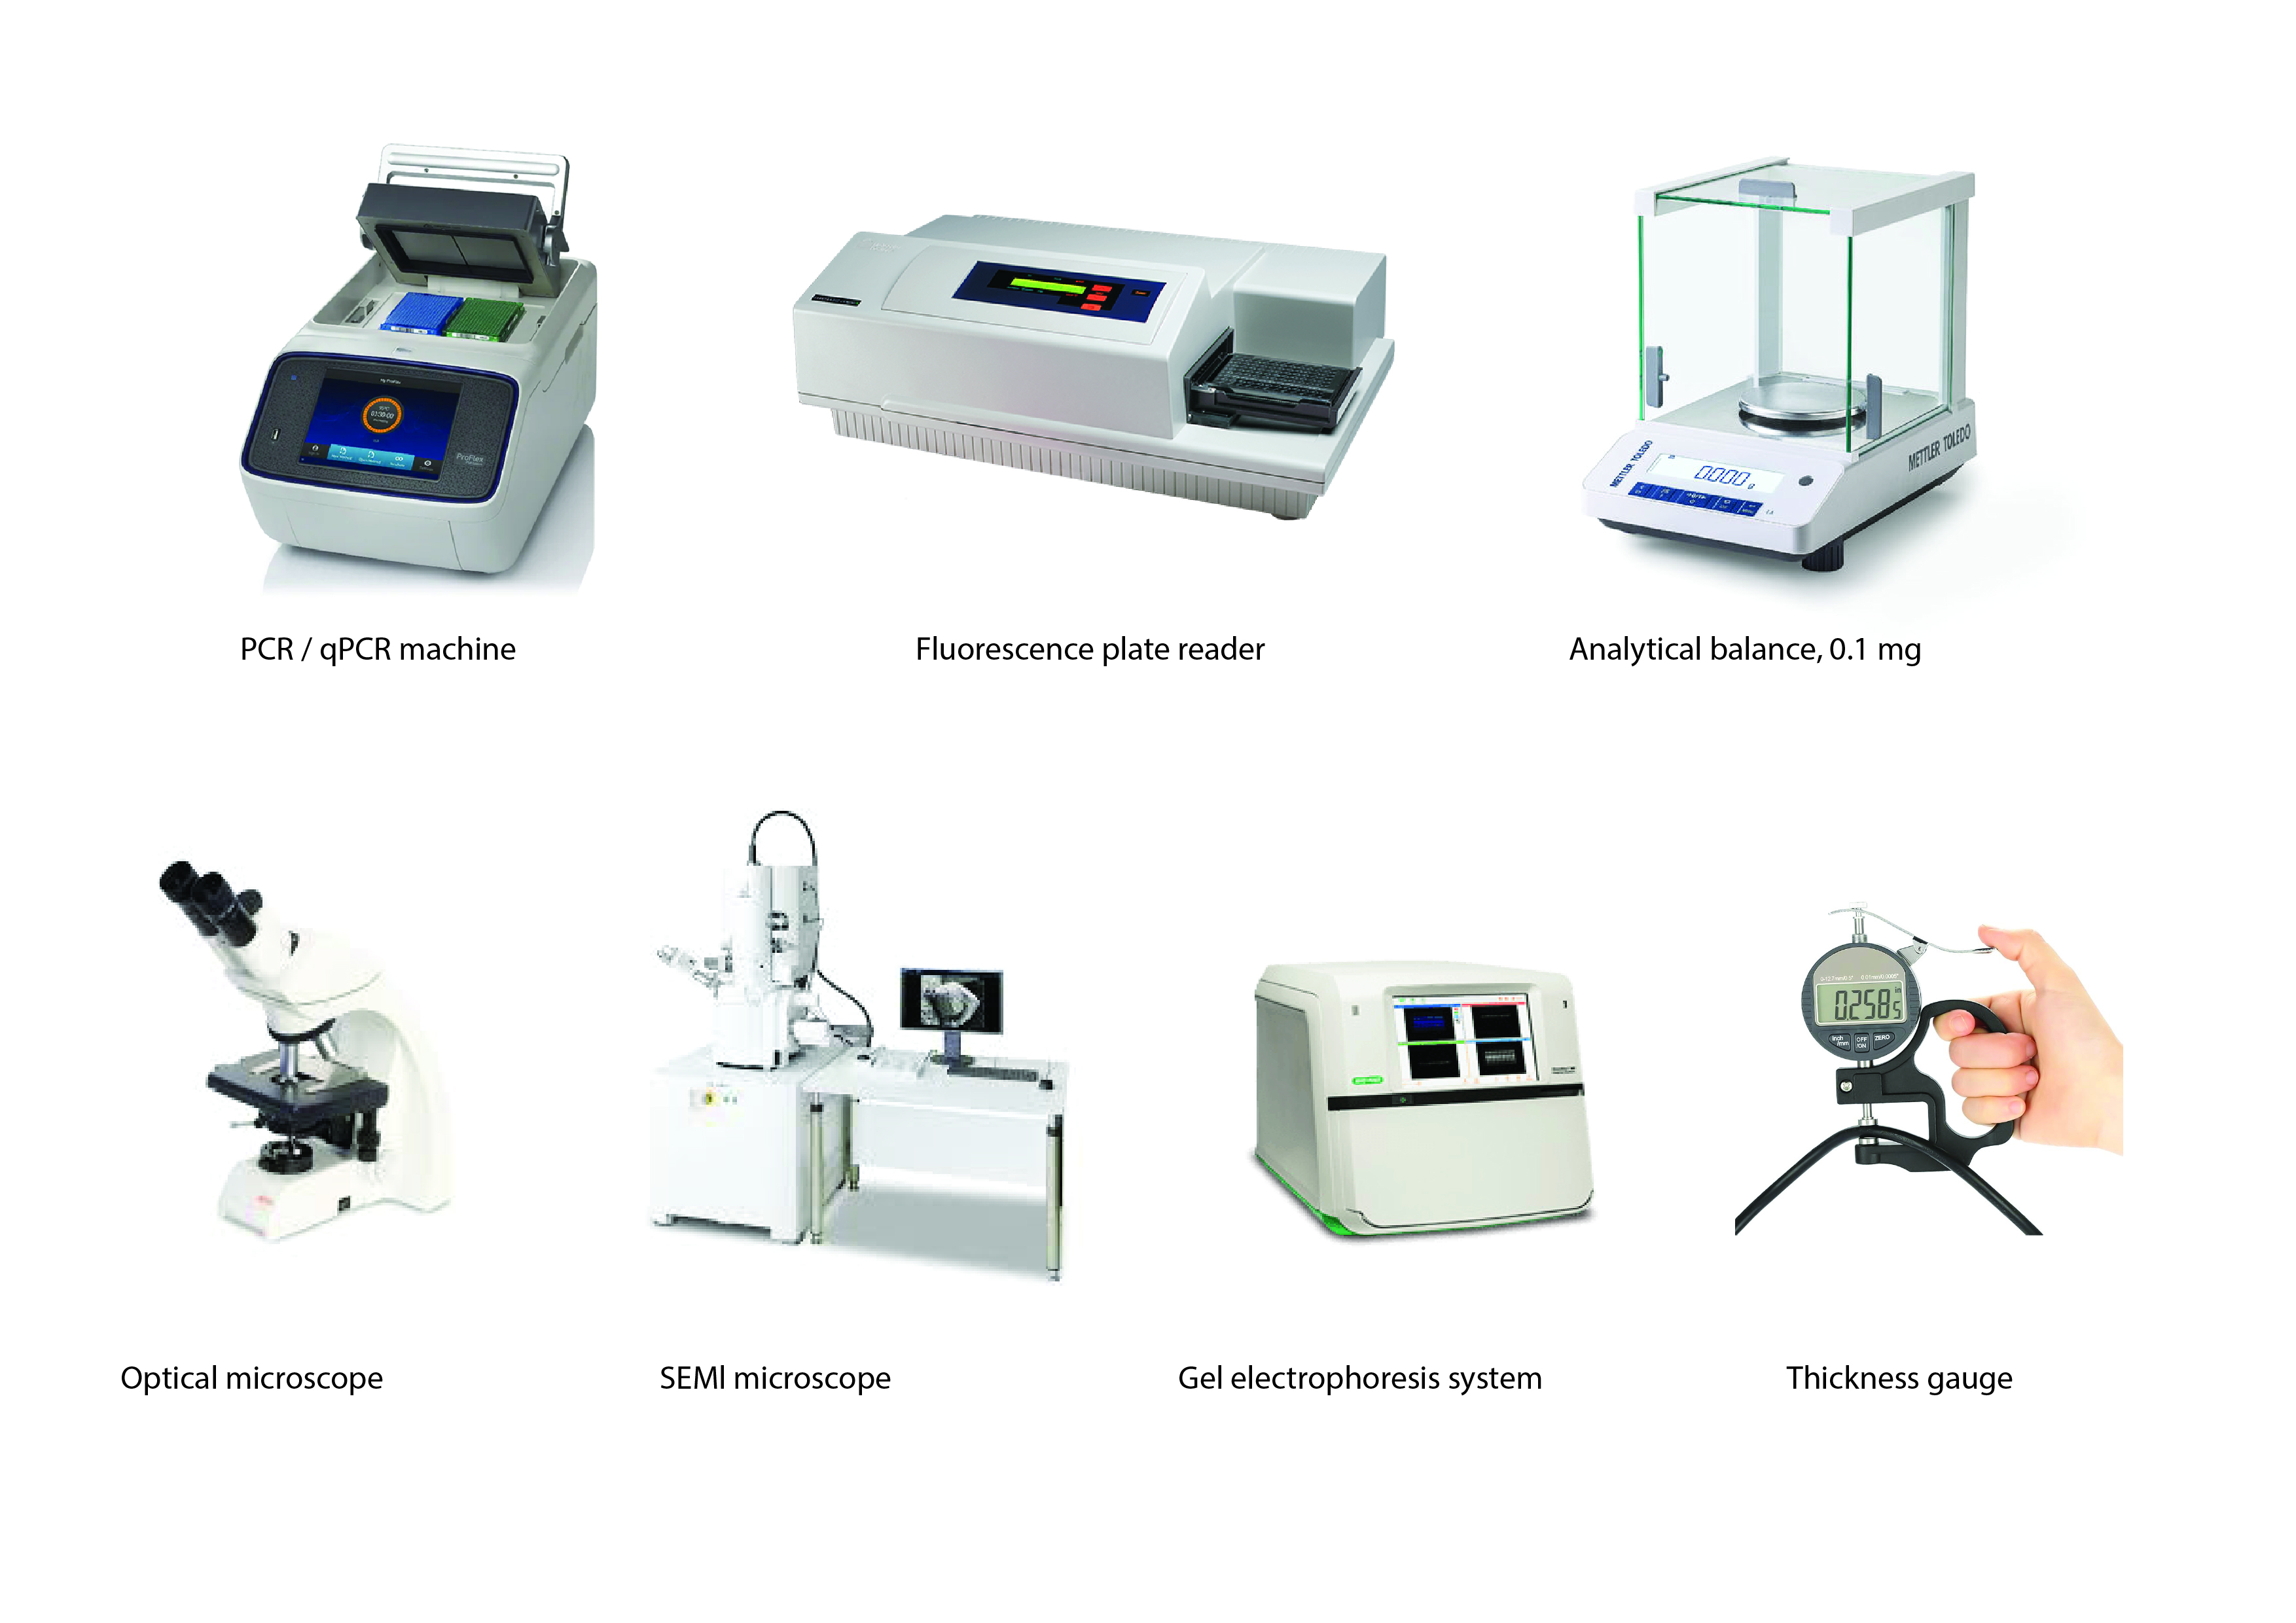 Some of the main tools/machines that I would use for this project
The main technologies I would use are:
- Fluorescence plate reader: to measure reporter expression such as mCherry or GFP, normalized to OD600.
- OD600 measurement: to quantify bacterial growth and check whether repression affects growth.
- RT-qPCR: to measure UGPase mRNA levels and confirm that the sRNA output represses the target pathway.
- Dry-weight measurement: to quantify cellulose production by washing, drying, and weighing pellicles.
- Fluorescence microscopy / stereo microscopy: to image reporter expression and spatial pattern formation in pellicles.
- ImageJ or Python image analysis: to quantify pattern contrast, edge blur, and minimum visible feature size.
- SEM: to compare cellulose fibril morphology between patterned regions.
- Basic material testing: thickness measurement, water uptake, shrinkage, and tensile testing to evaluate whether local cellulose repression changes material properties.
Waters Part I — Molecular Weight
The predicted molecular weight of the full eGFP construct, including the LE linker and His6-tag, is approximately 28,006.6 Da based on the amino acid sequence. Mature eGFP forms an internal chromophore, which results in a mass loss of approximately 20 Da. Therefore, the expected molecular weight of mature eGFP is approximately 27,986.6 Da.
To calculate the molecular weight from the LC-MS data, I selected two adjacent charge-state peaks from Figure 1 (blue circle):
m/z = 1000.4302
m/z = 1037.4423
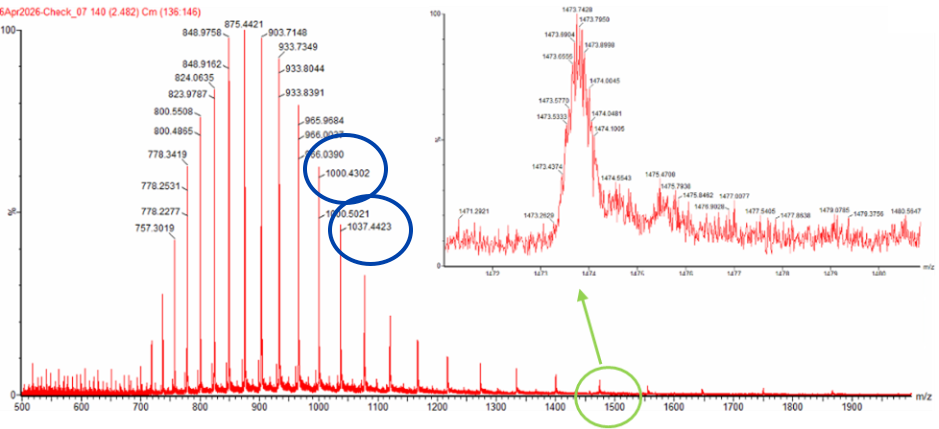
The lower m/z peak corresponds to the higher charge state. Using the adjacent charge state equation:
z = (1000.4302 - 1.0073) / (1037.4423 - 1000.4302)
z ≈ 27
Therefore, the peak at m/z 1037.4423 corresponds to the 27+ charge state, and the peak at m/z 1000.4302 corresponds to the 28+ charge state.
Using the relationship between m/z, charge state, and molecular weight, the calculated experimental molecular weight is approximately:
MW ≈ 27,986.4 Da
This is very close to the predicted mature eGFP molecular weight of 27,986.6 Da.
Accuracy = |27,986.4 - 27,986.6| / 27,986.6
Accuracy ≈ 0.0005%
For the zoomed-in peak around m/z 1474, the charge state can be estimated from the molecular weight:
z = 27986.6 / (1474 - 1.0073)
z ≈ 19
Therefore, the zoomed-in peak corresponds approximately to the 19+ charge state. The isotope spacing should be about 1/19 = 0.053 m/z, which is close to what is observed in the zoomed-in spectrum.
Homework: Waters Part II — Secondary/Tertiary structure
1. Native vs denatured protein conformations
A native protein is folded into its functional three-dimensional structure. In eGFP, this means that the amino acid chain is compactly folded into the characteristic GFP beta-barrel structure, with the chromophore protected inside the protein. A denatured protein has lost this folded secondary and tertiary structure. When a protein unfolds, hydrophobic and charged regions that were previously buried inside the protein become exposed to the solvent.
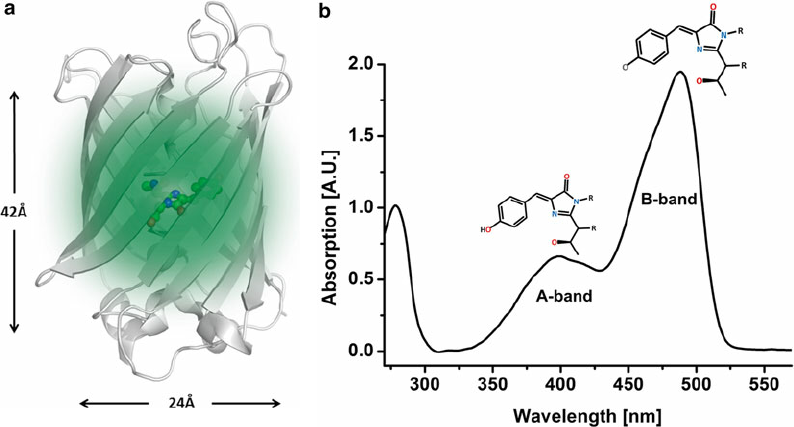 Enhanced green fl uorescent protein (EGFP). ( a ) The crystal structure (Protein Data Bank (PDB) ID 2Y0G) of a single chain is represented in gray cartoons . The green-glowing chromophore is represented in balls and sticks and stands in the center of the barrel. ( b ) Absorption spectrum of EGFP. Two bands are attributed to the neutral form (A-band) and the anionic form (B-band) of the chromophore. Lewis structures of the corresponding chromophore are represented as insets link
This difference can be observed by mass spectrometry because folded and unfolded proteins pick up different numbers of charges during electrospray ionization. A folded/native protein is more compact, so fewer protonation sites are accessible. This usually produces a lower charge-state distribution, meaning peaks appear at higher m/z values. A denatured/unfolded protein is more extended, so more sites are exposed and can become protonated. This produces a higher charge-state distribution, meaning peaks appear at lower m/z values.
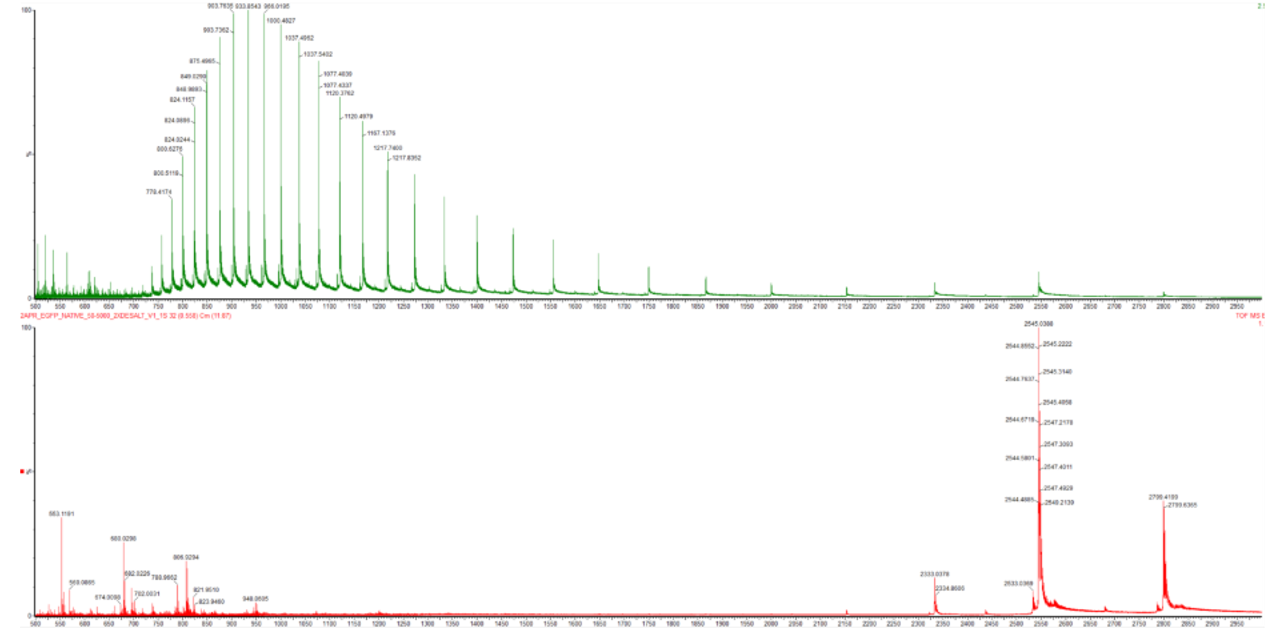
In Figure 2, the denatured eGFP spectrum shows many more highly charged ions spread across lower m/z values. The native eGFP spectrum shows fewer, lower-charge ions at higher m/z values. The mass of the protein is essentially the same, but the charge-state distribution changes because the protein conformation changes.
2. Charge state of the native eGFP peak at ~2800 m/z
The peak at approximately 2800 m/z in the native eGFP spectrum is most likely the +10 charge state.
This can be determined from the isotope peak spacing in the zoomed-in spectrum. In mass spectrometry, the spacing between isotope peaks is related to the charge state:
isotope spacing = 1 / charge state
In the zoomed-in native eGFP peak, the isotope peaks are separated by about 0.1 m/z.
So:
charge state = 1 / 0.1 = 10
This means the ion carries approximately 10 positive charges. This also matches the expected mass of eGFP: a protein of around 28 kDa with a +10 charge would appear close to 2800 m/z.
Waters Part III — Peptide Mapping
 K and R highlighted in word
The eGFP sequence contains 20 lysines (K) and 6 arginines (R), giving 26 possible trypsin cleavage residues. Using trypsin with 0 missed cleavages, the eGFP sequence generates 27 theoretical tryptic fragments in total. With the PeptideMass settings shown in the assignment, where only peptides larger than 500 Da are displayed, 19 peptides are reported.
 Fig 5a from homwwork
From the peptide map TIC in Figure 5a, I count approximately 19 chromatographic peaks between 0.5 and 6 minutes that are above ~10% relative abundance. This approximately matches the number of predicted tryptic peptides above 500 Da. However, the match is not expected to be exact because some peptides may co-elute, some may ionize poorly, and some peptides may appear in multiple charge states or modified forms.
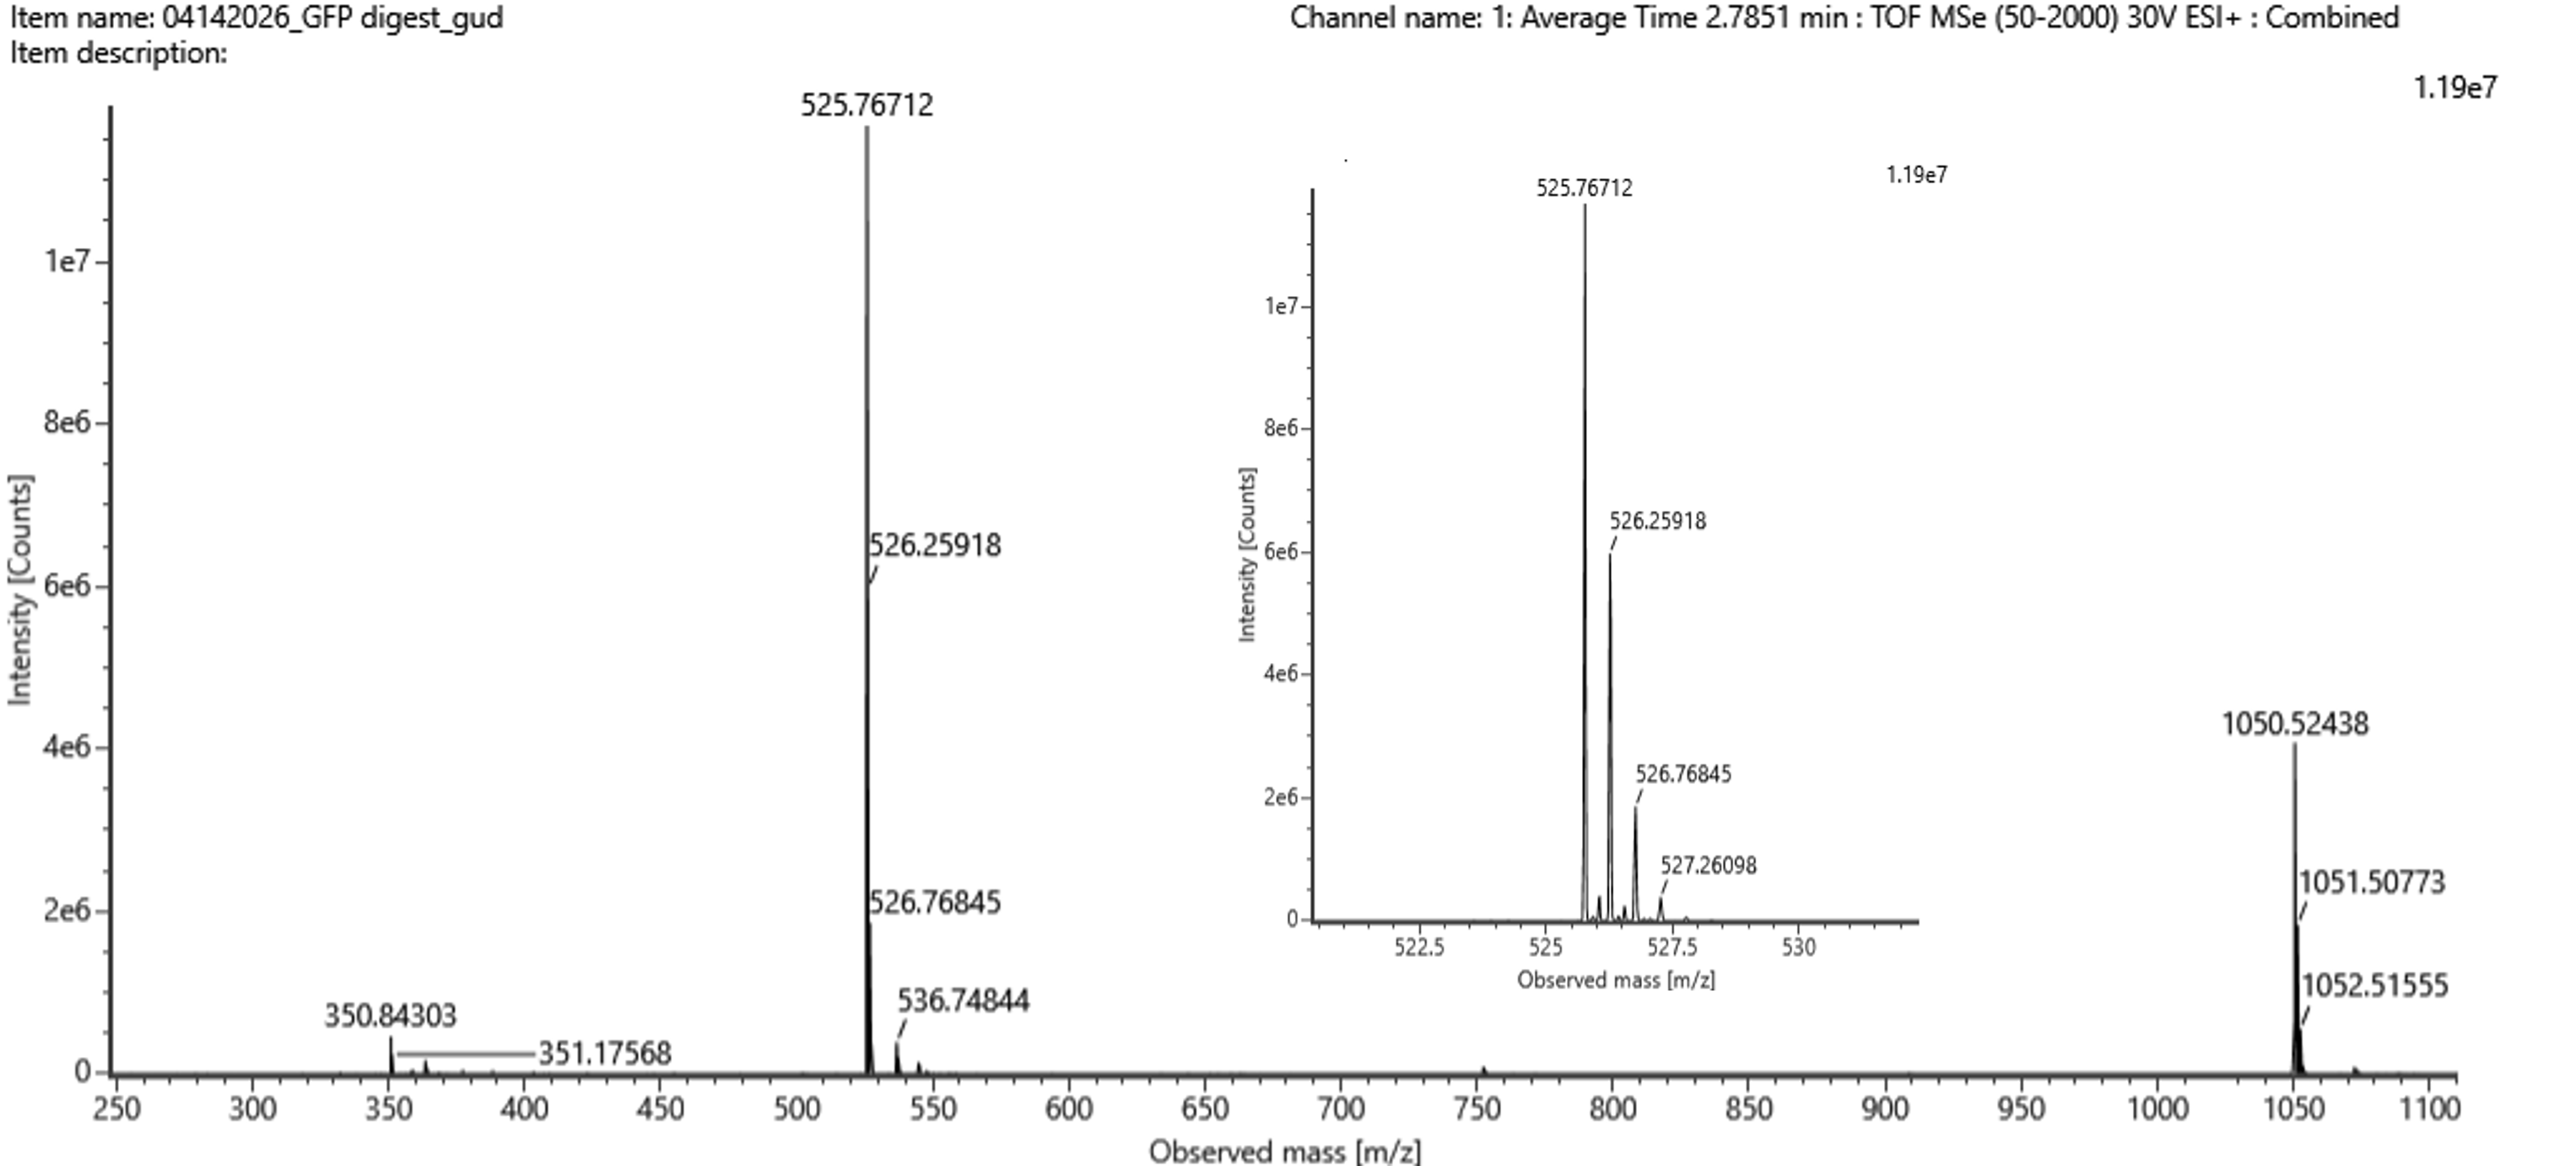 Fig 5b from homwwork
For the chromatographic peak at 2.78 minutes, the most abundant ion in Figure 5b has an m/z of 525.76712. The isotope spacing is approximately 0.492 m/z, indicating a 2+ charge state.
The neutral peptide mass was calculated as:
M = z(m/z) - zH
M = 2(525.76712) - 2(1.0073)
M ≈ 1049.5197 Da
The singly protonated mass is therefore approximately:
[M+H]+ = 1050.5270
Comparing this mass to the predicted tryptic peptide masses from PeptideMass, the best matching peptide is:
FEGDTLVNR
The theoretical monoisotopic neutral mass of FEGDTLVNR is approximately 1049.5142 Da. The mass error is:
ppm = ((1049.5197 - 1049.5142) / 1049.5142) × 10^6
ppm ≈ 5.3 ppm
According to the amino acid coverage map in Figure 6, 88% of the eGFP sequence was confirmed by peptide mapping.
Overall, the peptide map data supports that the sample is the eGFP standard because the detected peptide masses and fragmentation data match the expected tryptic peptides from eGFP, and the sequence coverage is high at 88%.
Bonus:
The peptide sequence that best matches the fragmentation spectrum in Figure 5c is FEGDTLVNR. This assignment is supported by the measured precursor m/z of 525.76712 with charge state 2+, giving a neutral mass of approximately 1049.5197 Da. This closely matches the theoretical monoisotopic mass of the tryptic peptide FEGDTLVNR.
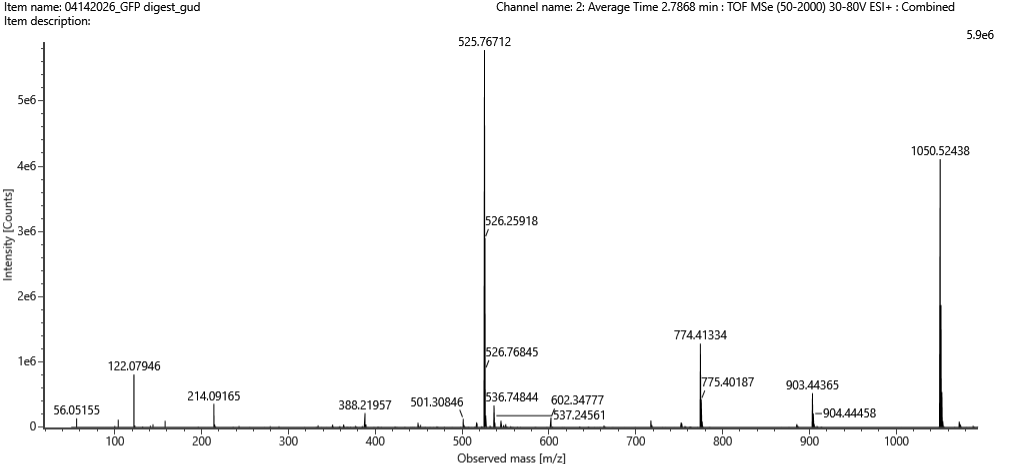 Fig 5c from homwwork
The peptide map data makes sense and supports identification of the sample as eGFP. The LC-MS peptide map identifies peptides distributed across most of the eGFP sequence, giving 88% amino acid coverage. The combination of accurate peptide mass and fragmentation pattern confirmation indicates that the analyzed protein is consistent with the eGFP standard.
Waters Part IV — Oligomers
Based on the known subunit masses, the expected oligomeric states are:
- 7FU decamer: 10 × 340 kDa = 3,400 kDa = 3.4 MDa
- 8FU didecamer: 20 × 400 kDa = 8,000 kDa = 8.0 MDa
- 8FU 3-decamer: 30 × 400 kDa = 12,000 kDa = 12.0 MDa
- 8FU 4-decamer: 40 × 400 kDa = 16,000 kDa = 16.0 MDa
In the CDMS spectrum, the 7FU decamer corresponds to the peak near 3.4 MDa. The 8FU didecamer corresponds to the large peak near 8.33 MDa. The 8FU 3-decamer corresponds to the peak near 12.67 MDa. The 8FU 4-decamer is expected near 16 MDa and appears, if present, only as a weak/broad signal in the 16–17 MDa region.
Waters Part V — Did I make GFP?
Yes, The theoretical molecular weight of mature eGFP, including the LE linker and His6-tag, is 27.9866 kDa. The observed intact LC-MS molecular weight calculated from the adjacent charge states was approximately 27.9864 kDa. This gives a mass error of approximately -7 ppm. The close agreement between the theoretical and observed molecular weights supports that the measured protein is consistent with GFP/eGFP.