Week 04 – Protein Design Part I
Part A: Conceptual Questions
For an average amino acid, the molecular weight is about 100 Daltons, which is equivalent to 100 g/mol. If I assume meat is about 20% protein, then 500 g of meat contains roughly 100 g of protein. The relationship is: number of moles = mass (g) / molar mass (g/mol) So, 100 g ÷ 100 g/mol ≈ 1 mole of amino acids. One mole corresponds to approximately 6×10²³molecules. Therefore, consuming 500 g of meat corresponds to on the order of 1023amino acid molecules.
Proteins from food are first digested in the gastrointestinal tract into smaller peptides and eventually into individual amino acids. These amino acids are absorbed into the bloodstream and become part of the body’s amino acid pool. Human cells then reuse these amino acids to synthesize new proteins according to human gene expression and the cellular molecular machinery. Because each organism has its own genes and regulatory systems, the same amino acids can be assembled into completely different proteins. This is why eating fish or chicken does not make us become those organisms.The amino acids are simply recycled by our own cells to build human proteins.
According to the article from FEBS Press, the standard set of 20 amino acids was selected early in evolution because it provides a near-ideal mix of charge, size, and hydrophobicity that enables proteins to fold into soluble, stable, close-packed structures with functional binding pockets. This selection happened after the RNA World had cofactors that already performed most catalysis, so amino acids were chosen mainly to support folding and structural stability, not just chemistry. While other amino acids are chemically possible, these 20 were favored because they collectively cover the chemical properties needed for diverse protein structures. (FEBS Press – Andrew J. Doig, 2016)
Yes, it is possible to design non-natural amino acids. All amino acids share the same backbone (amino + carboxyl), and the side chain (R group) is what varies. By changing or substituting the R group, many new amino acids can be created. Non-natural amino acids are used in synthetic biology and drug design to explore chemistry beyond the 20 natural ones, but they are not part of the standard genetic code. (Supported by general protein chemistry and synthetic biology literature)
The astrobiology article explains that amino acids could form abiotically through chemical reactions in the early Solar System and on early Earth. Processes like Strecker synthesis under prebiotic conditions, reactions in hydrothermal vents, and organic chemistry on planetesimals delivered by meteorites could produce amino acids before life existed. These amino acids do not require enzymes; they form through random but plausible chemical reactions in environments with water, heat, and simple carbon compounds.
In biology, proteins are made of L-amino acids, and these form right-handed α-helices because of the stereochemistry of the backbone. If the same sequence were built entirely from D-amino acids, the mirror image geometry would favor left-handed α-helices instead.
Yes. In addition to the common α-helix, proteins also contain other helical structures such as 3₁₀ helices and π-helices that are observed in real proteins. These alternative helices differ in hydrogen bonding patterns and geometry. More exotic or engineered helices could also be possible if non-natural amino acids or non-canonical backbones are used, expanding the structural possibilities.
Most protein helices are right-handed because proteins use L-amino acids almost exclusively in nature. The stereochemistry of L-amino acids puts constraints on backbone torsion angles that favor right-handed helices energetically and sterically. Left-handed helices are possible in principle but are unstable with L-amino acids due to steric clashes and unfavorable geometry.
β-sheets are secondary structures formed by extended polypeptide chains connected by backbone hydrogen bonds. The edges of β-sheets expose hydrogen-bond donors and acceptors. If these edges are not satisfied internally, they tend to pair with similar edges on other β-strands or sheets, leading to aggregation. The main driving forces behind β-sheet aggregation are:
A. Backbone hydrogen bonding between β-strands in different molecules. B. Hydrophobic interactions between nonpolar side chains, which reduce exposure to water. C. Entropy gain from releasing ordered water as hydrophobic surfaces come together and as hydrogen bonds form.
This explains why β-sheet-rich structures such as amyloids and fibrils tend to form in aggregation-prone conditions.
10 and 11 are skipped.
Part B: Protein Analysis and Visualization
I chose the human glucocorticoid receptor because it is directly involved in sensing cortisol, which is one of the main stress hormones in the body. I was drawn to this protein because, in my own life and work in Iraq, I have seen how prolonged stress and anxiety can affect people deeply, especially students, through poor focus, memory problems, sleep disturbance, digestive complaints, and other health issues. This made me interested in a protein that helps the body detect and respond to stress at the molecular level. I also chose it because it connects neuroscience, hormones, and real-life health challenges in a very meaningful way.
The amino acid sequence of the human glucocorticoid receptor (NR3C1) was obtained from the UniProt database (P04150).
“MDSKESLTPGREENPSSVLAQERGDVMDFYKTLRGGATVKVSASSPSLAVASQSDSKQRRLLVDFPKGSVSNAQQPDLSKAVSLSMGLYMGETETKVMGNDLGFPQQGQISLSSGETDLKLLEESIANLNRSTSVPENPKSSASTAVSAAPTEKEFPKTHSDVSSEQQHLKGQTGTNGGNVKLYTTDQSTFDILQDLEFSSGSPGKETNESPWRSDLLIDENCLLSPLAGEDDSFLLEGNSNEDCKPLILPDTKPKIKDNGDLVLSSPSNVTLPQVKTEKEDFIELCTPGVIKQEKLGTVYCQASFPGANIIGNKMSAISVHGVSTSGGQMYHYDMNTASLSQQQDQKPIFNVIPPIPVGSENWNRCQGSGDDNLTSLGTLNFPGRTVFSNGYSSPSMRPDVSSPPSSSSTATTGPPPKLCLVCSDEASGCHYGVLTCGSCKVFFKRAVEGQHNYLCAGRNDCIIDKIRRKNCPACRYRKCLQAGMNLEARKTKKKIKGIQQATTGVSQETSENPGNKTIVPATLPQLTPTLVSLLEVIEPEVLYAGYDSSVPDSTWRIMTTLNMLGGRQVIAAVKWAKAIPGFRNLHLDDQMTLLQYSWMFLMAFALGWRSYRQSSANLLCFAPDLIINEQRMTLPCMYDQCKHMLYVSSELHRLQVSYEEYLCMKTLLLLSSVPKDGLKSQELFDEIRMTYIKELGKAIVKREGNSSQNWQRFYQLTKLLDSMHEVVENLLNYCFQTFLDKTMSIEFPEMLAEIITNQIPKYSNGNIKKLLFHQK”
Length: 777, Mass (Da): 85,659
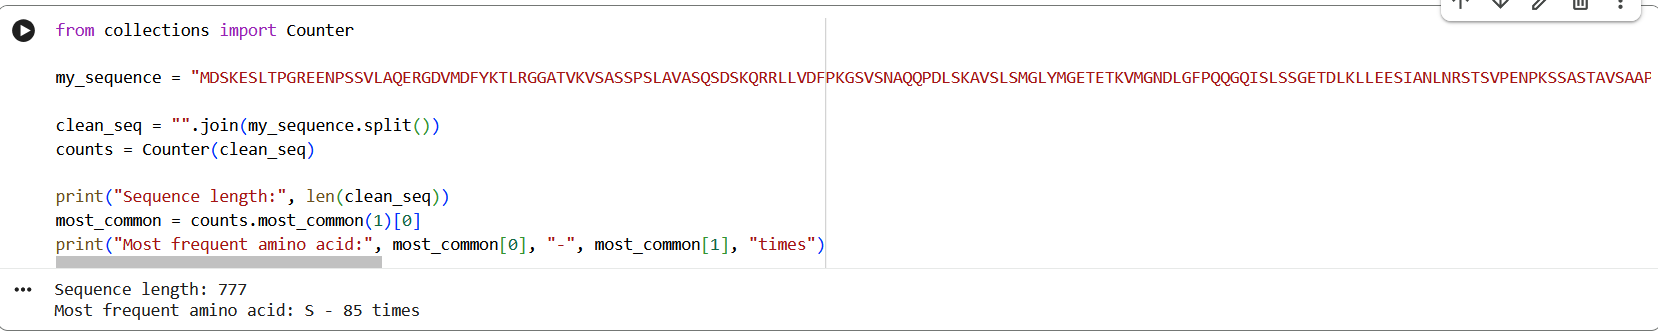
Figure 1: NR3C1 human glucocorticoid receptor amino acid sequence
The protein consists of 777 amino acids. Using the Google Colab amino acid counting notebook, the most frequent amino acid in the sequence is serine (S), which appears 85 times. A UniProt BLAST search for the glucocorticoid receptor returned 250 homologous protein sequences in UniProtKB. These homologs are found across several vertebrate species, including humans, chimpanzees, bonobos, and orangutans, indicating that the protein is evolutionarily conserved.
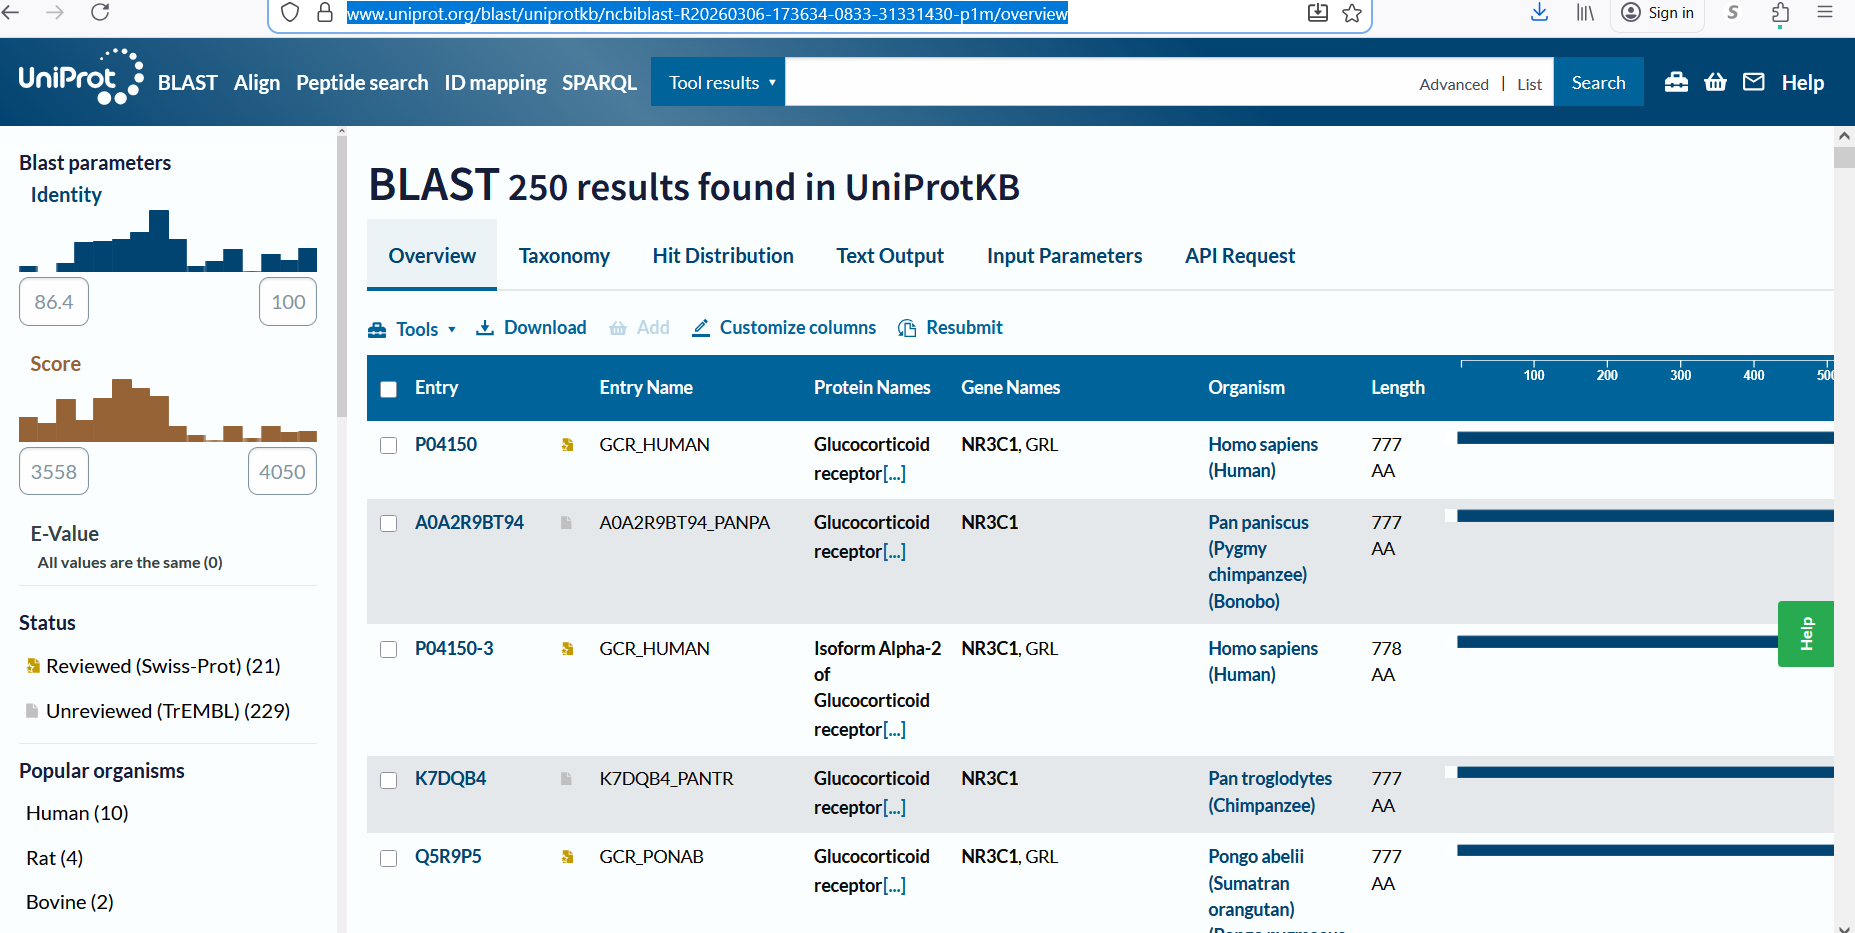
Figure 2: Protein sequence homologs.
The glucocorticoid receptor belongs to the nuclear receptor protein family, specifically the steroid hormone receptor family, which functions as ligand-activated transcription factors that regulate gene expression.
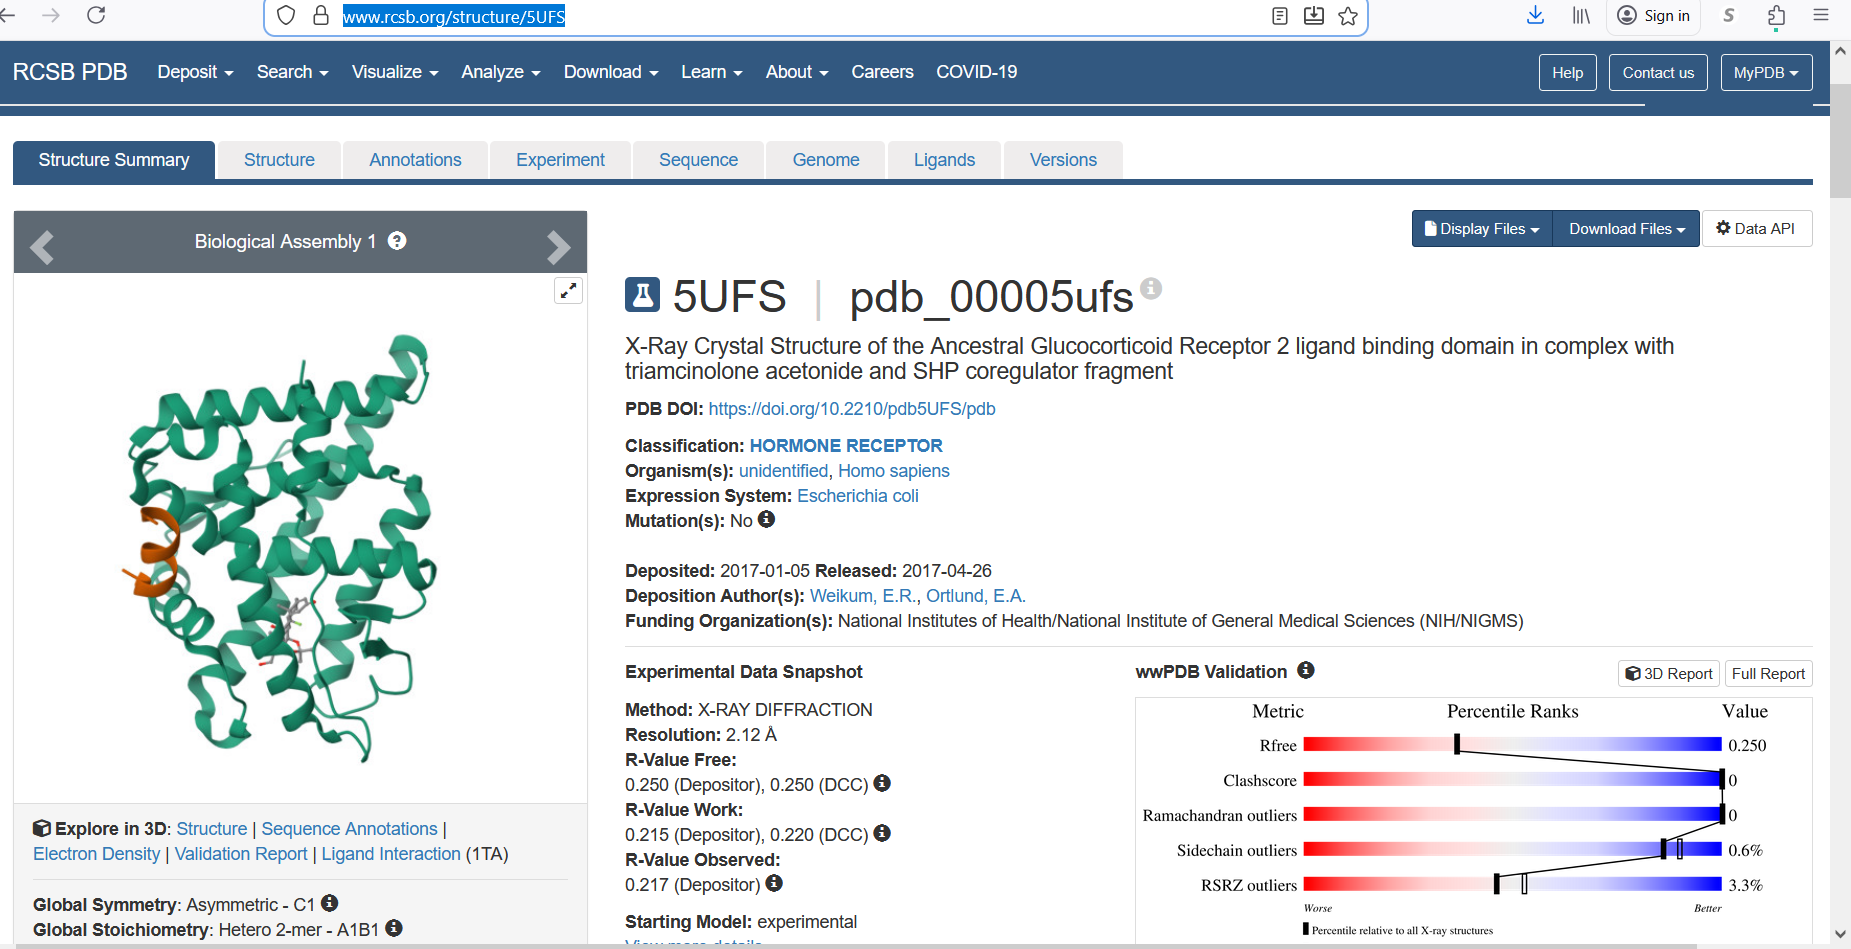
Figure 3: Protein family
- The protein was solved in 2017, and the structure was determined using X-ray diffraction. As well as the structure has a resolution of 2.12 Å, which indicates a high-quality crystal structure. The structure contains additional molecules besides the protein. These include triamcinolone acetonide, which is a glucocorticoid ligand bound in the receptor’s binding pocket, and a coregulator peptide fragment (SHP) that interacts with the receptor.
According to the SCOP structural classification database, the glucocorticoid receptor DNA-binding domain belongs to the glucocorticoid receptor-like DNA-binding domain superfamily. This superfamily adopts a GATA zinc-finger-like fold, which enables the receptor to bind specific DNA sequences and regulate gene transcription.
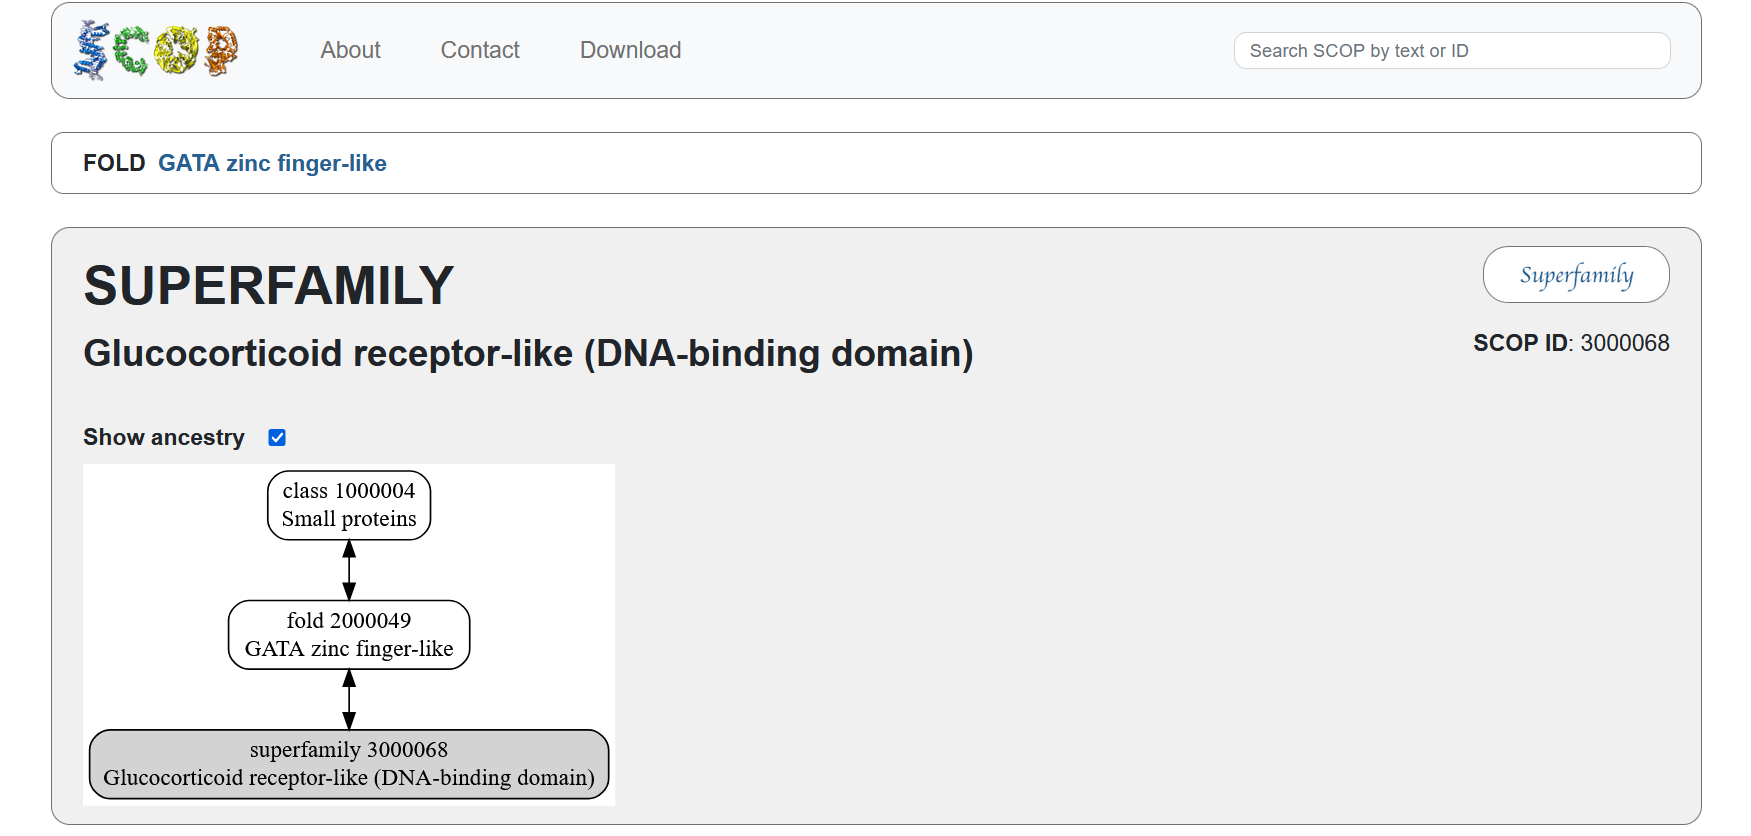
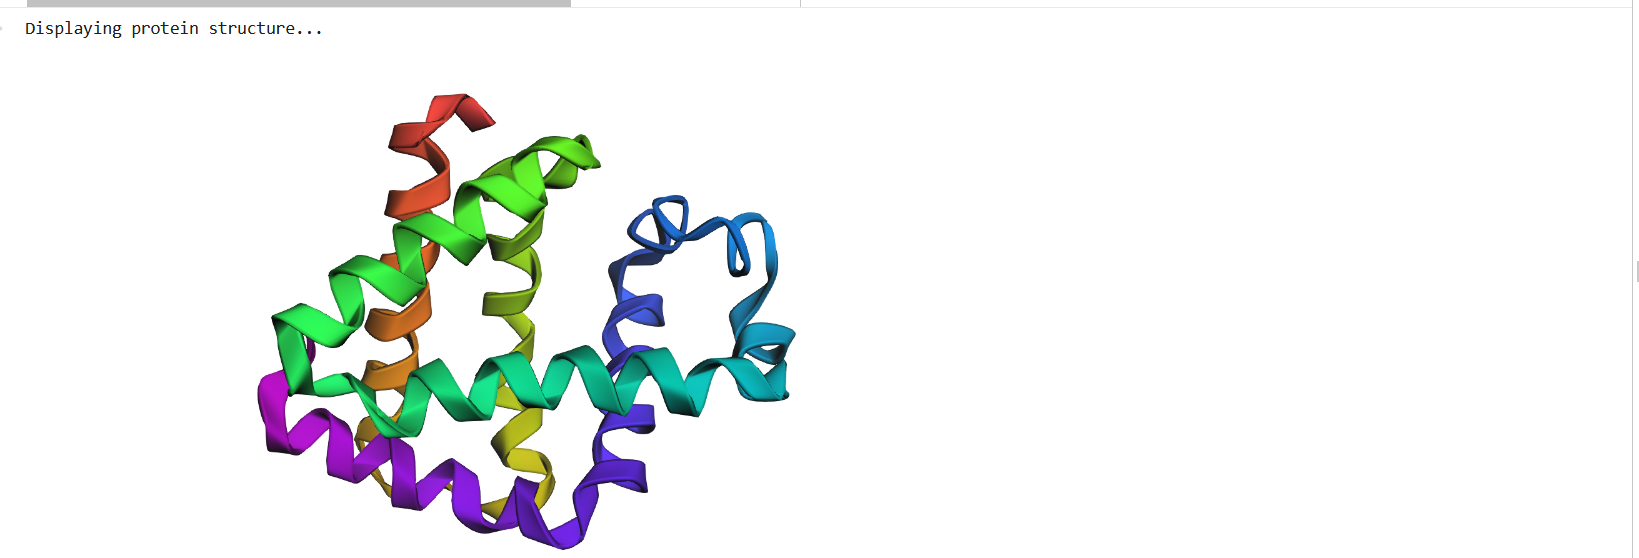
Figure 4: Protein Structure
- The protein structure was visualized in PyMOL and RBCS using different representations, including cartoon, ribbon, and ball-and-stick models, as shown in Figures 5 and 6. The secondary structure of the protein was examined by coloring the structure according to helices and sheets, which is presented in Figure 9. In addition, the distribution of hydrophobic and hydrophilic residues across the protein is illustrated in Figures 10, 11 and 12. Finally, the surface representation of the protein was generated to observe possible cavities or binding pockets, as shown in Figure 13.
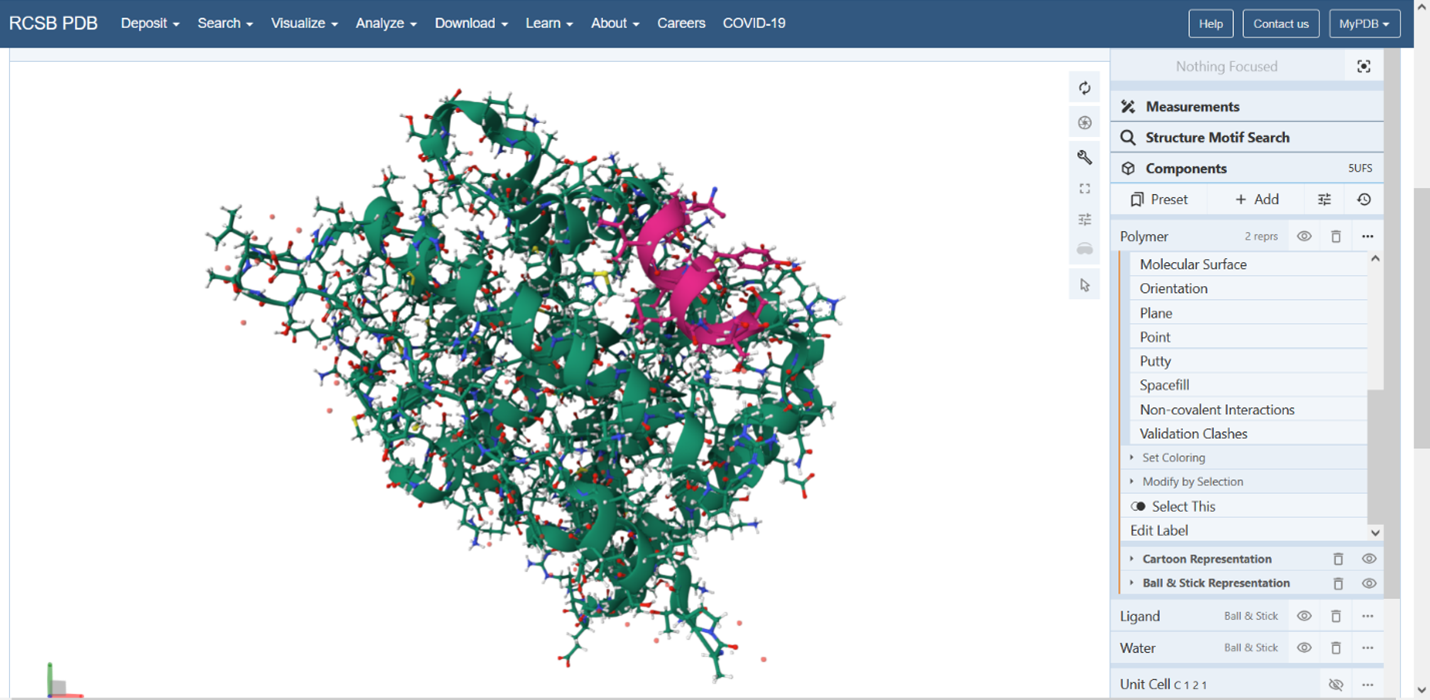
Figure 5: Cartoon representation of the protein structure using RCSB
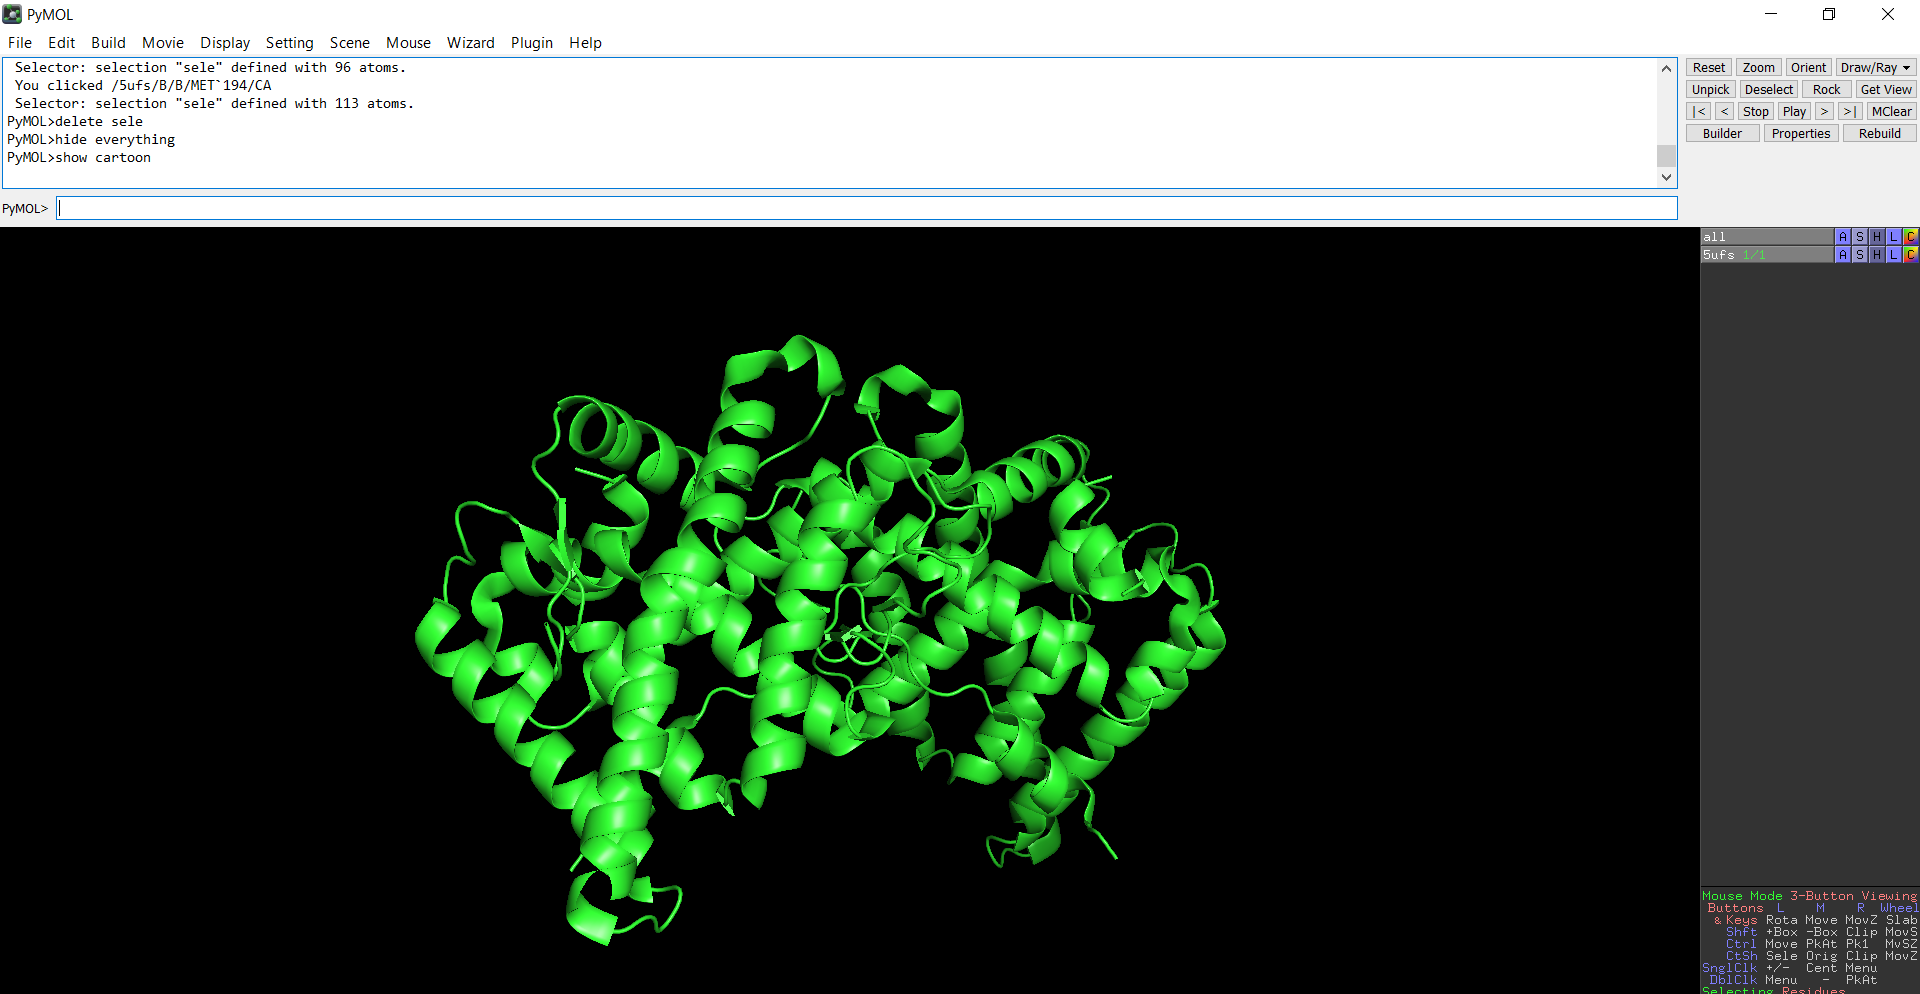
Figure 6: Cartoon representation of the protein structure using PyMol
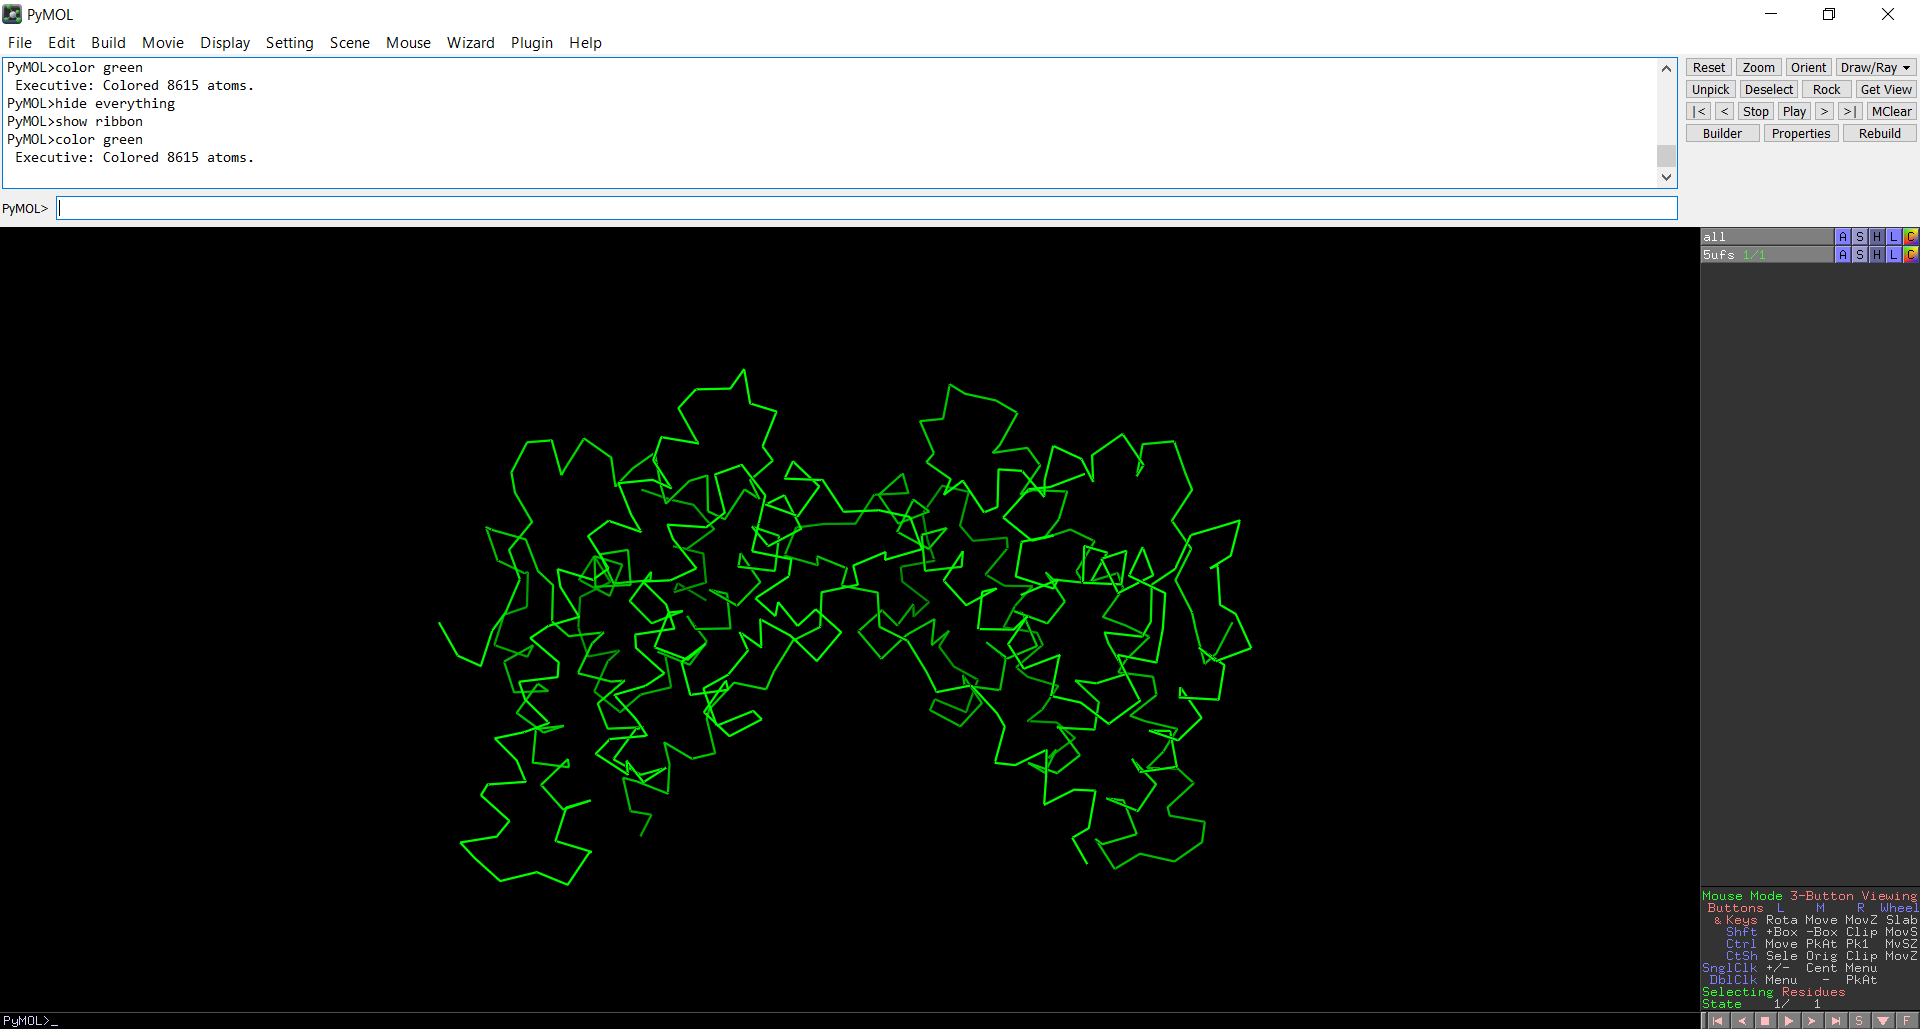
Figure 7: Ribbon representation of the protein structure using PyMol
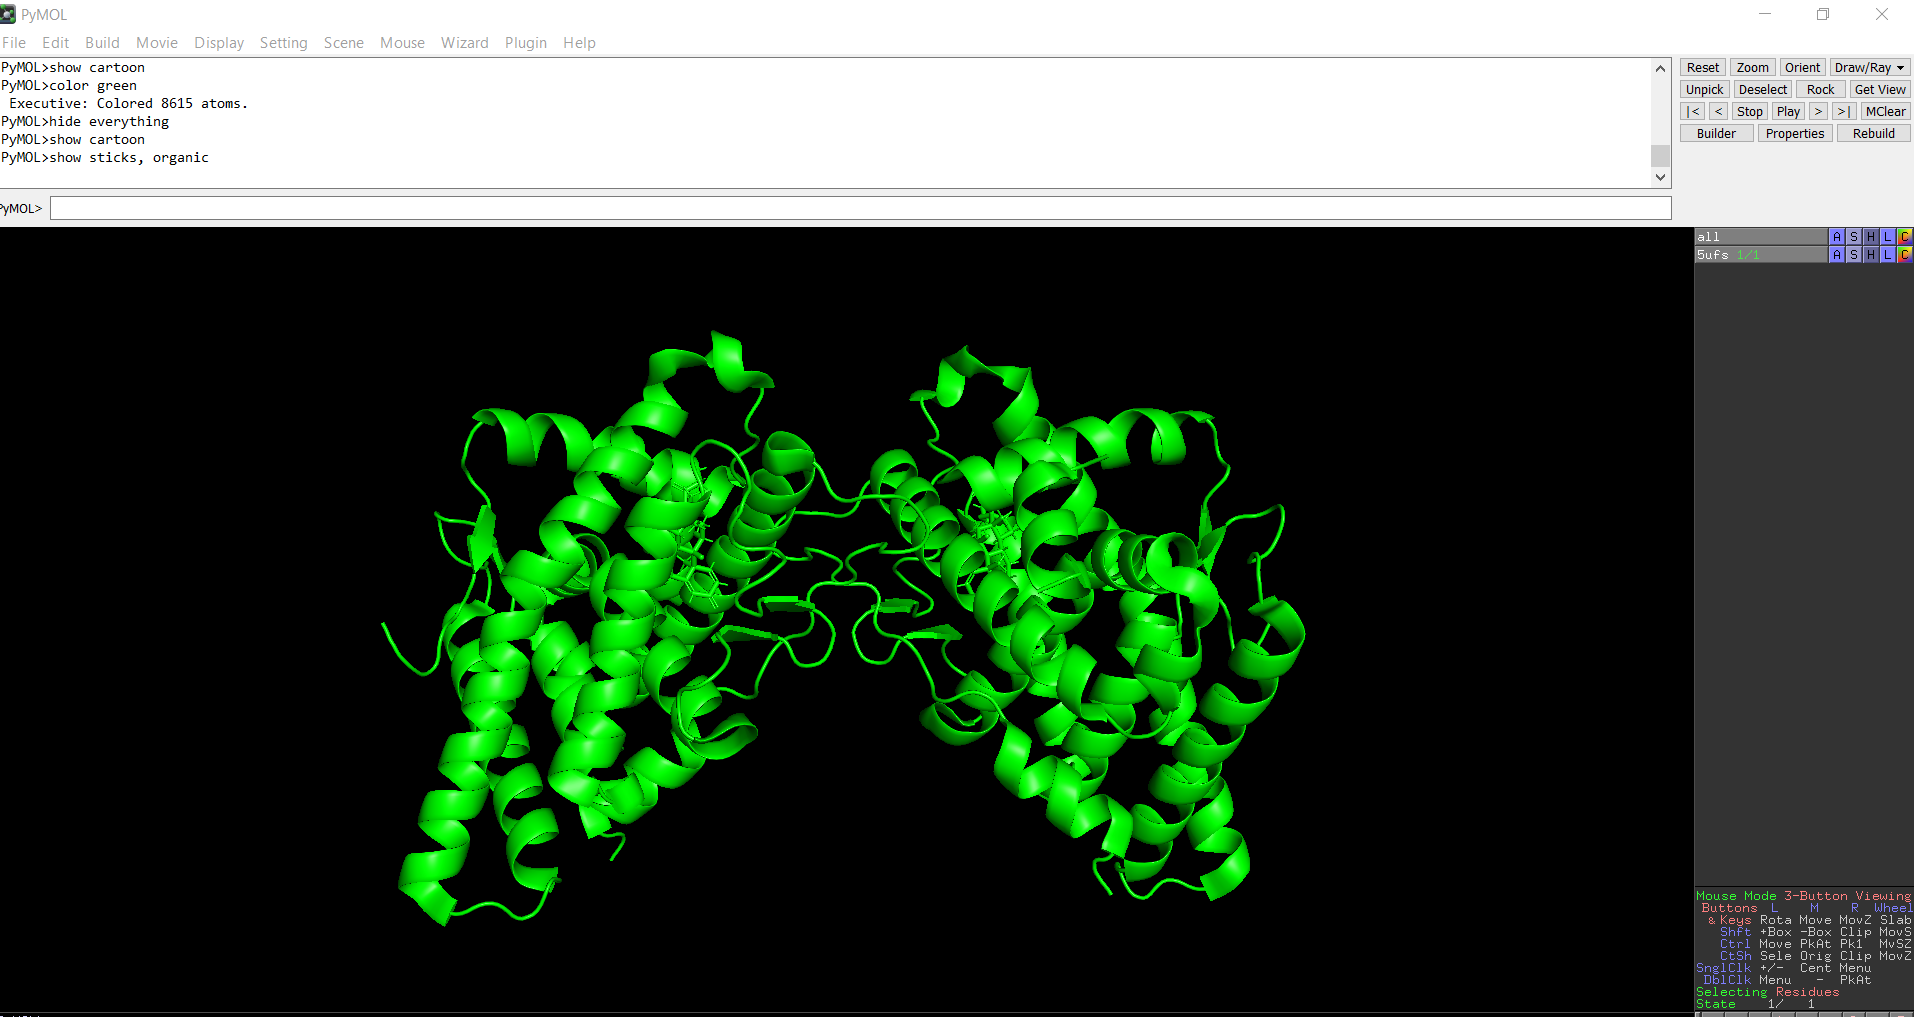
Figure 8: Ball-and-stick models representation of the protein structure using PyMol
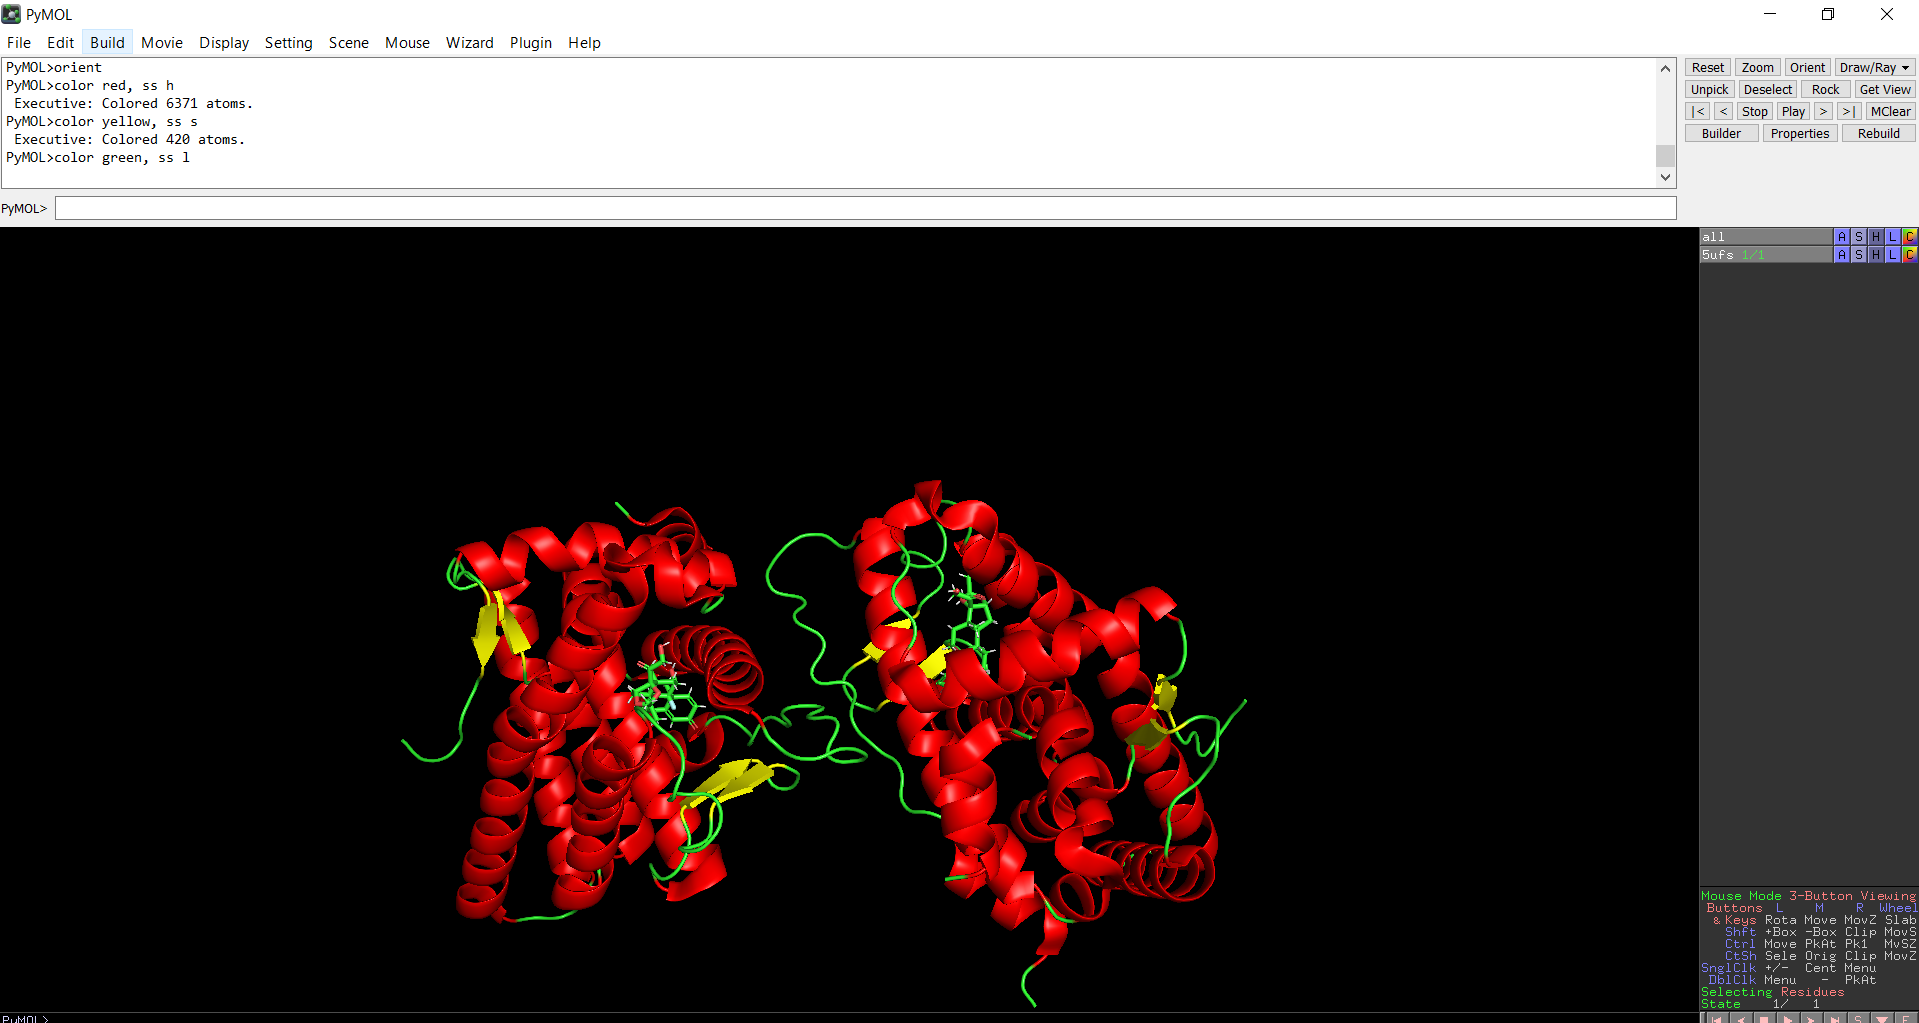
The protein does contain more alpha helices than beta pleated sheets.
When the protein surface is colored by residue type, hydrophilic residues are primarily distributed on the outer surface of the protein where they can interact with water. Hydrophobic residues appear in patches and are more commonly buried within the protein interior or located in pockets, helping stabilize the protein structure and potentially forming ligand-binding regions.
Figure 9: Secondary structure of the protein was colored using PyMol
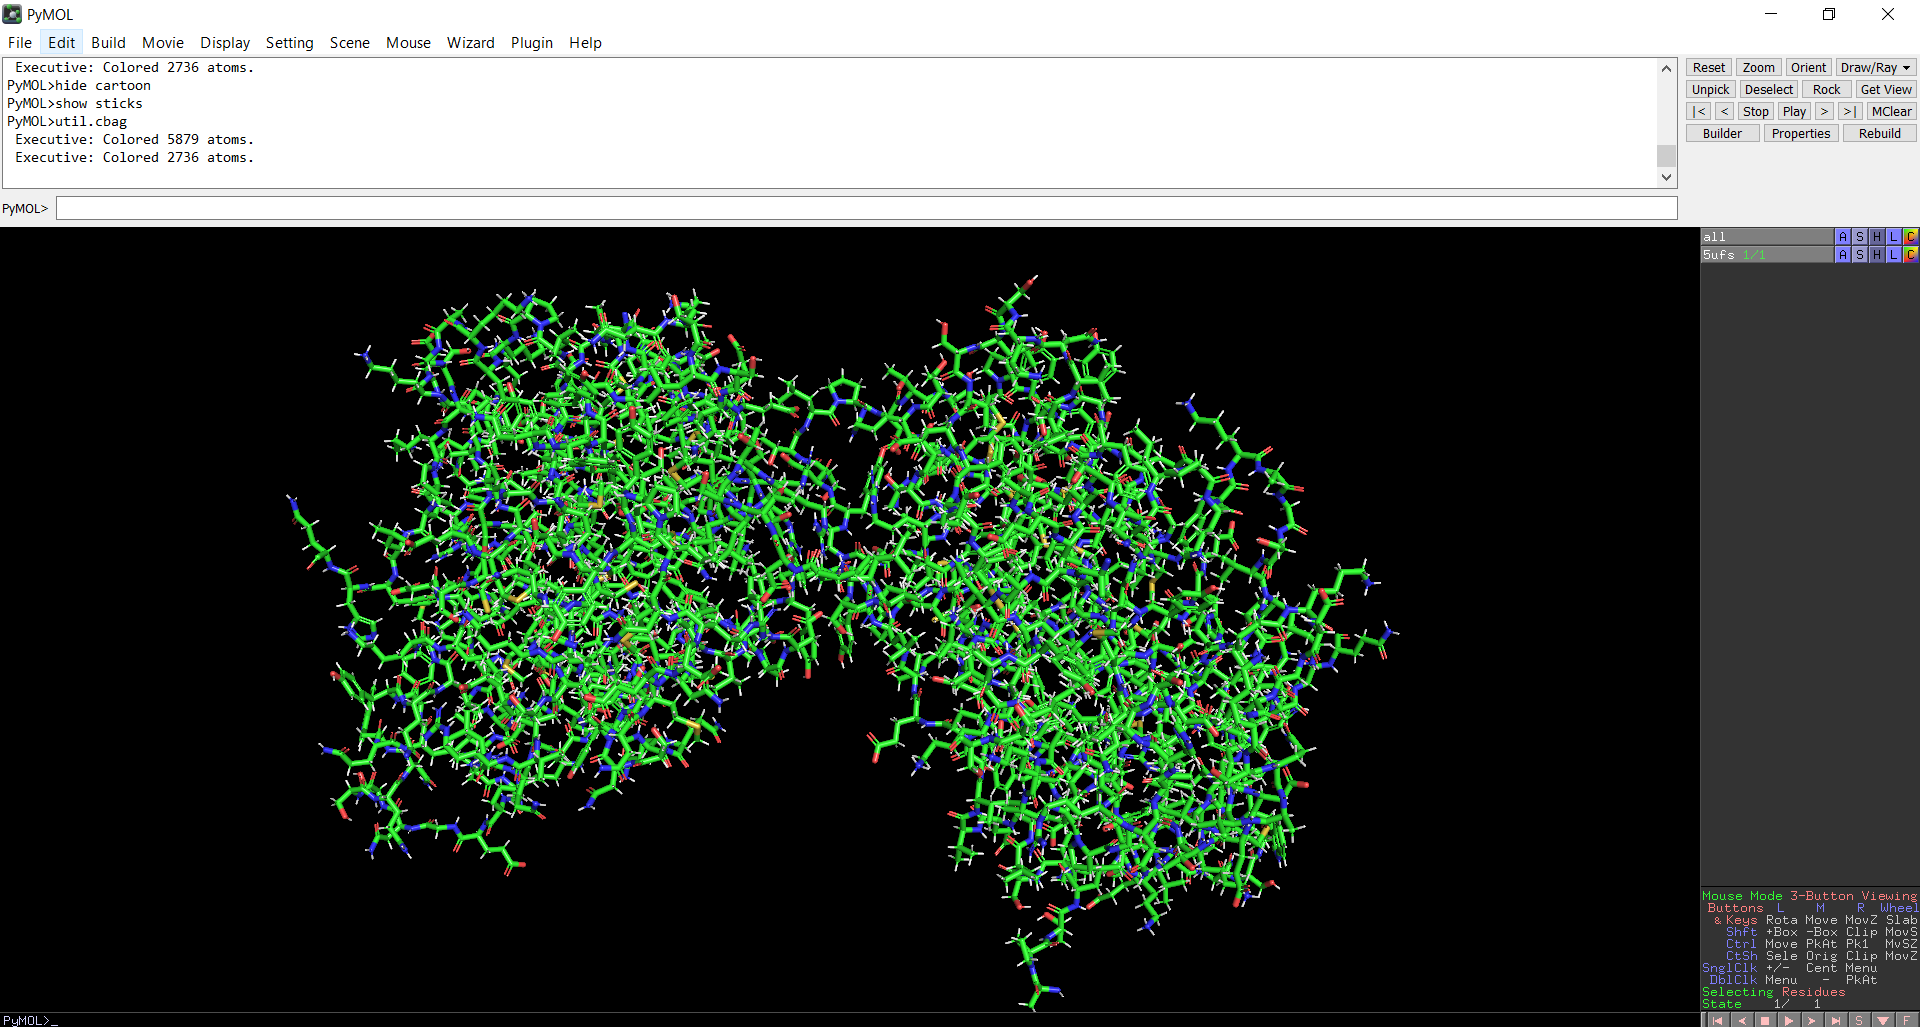
Figure 10: Distribution of hydrophobic and hydrophilic residues across the protein
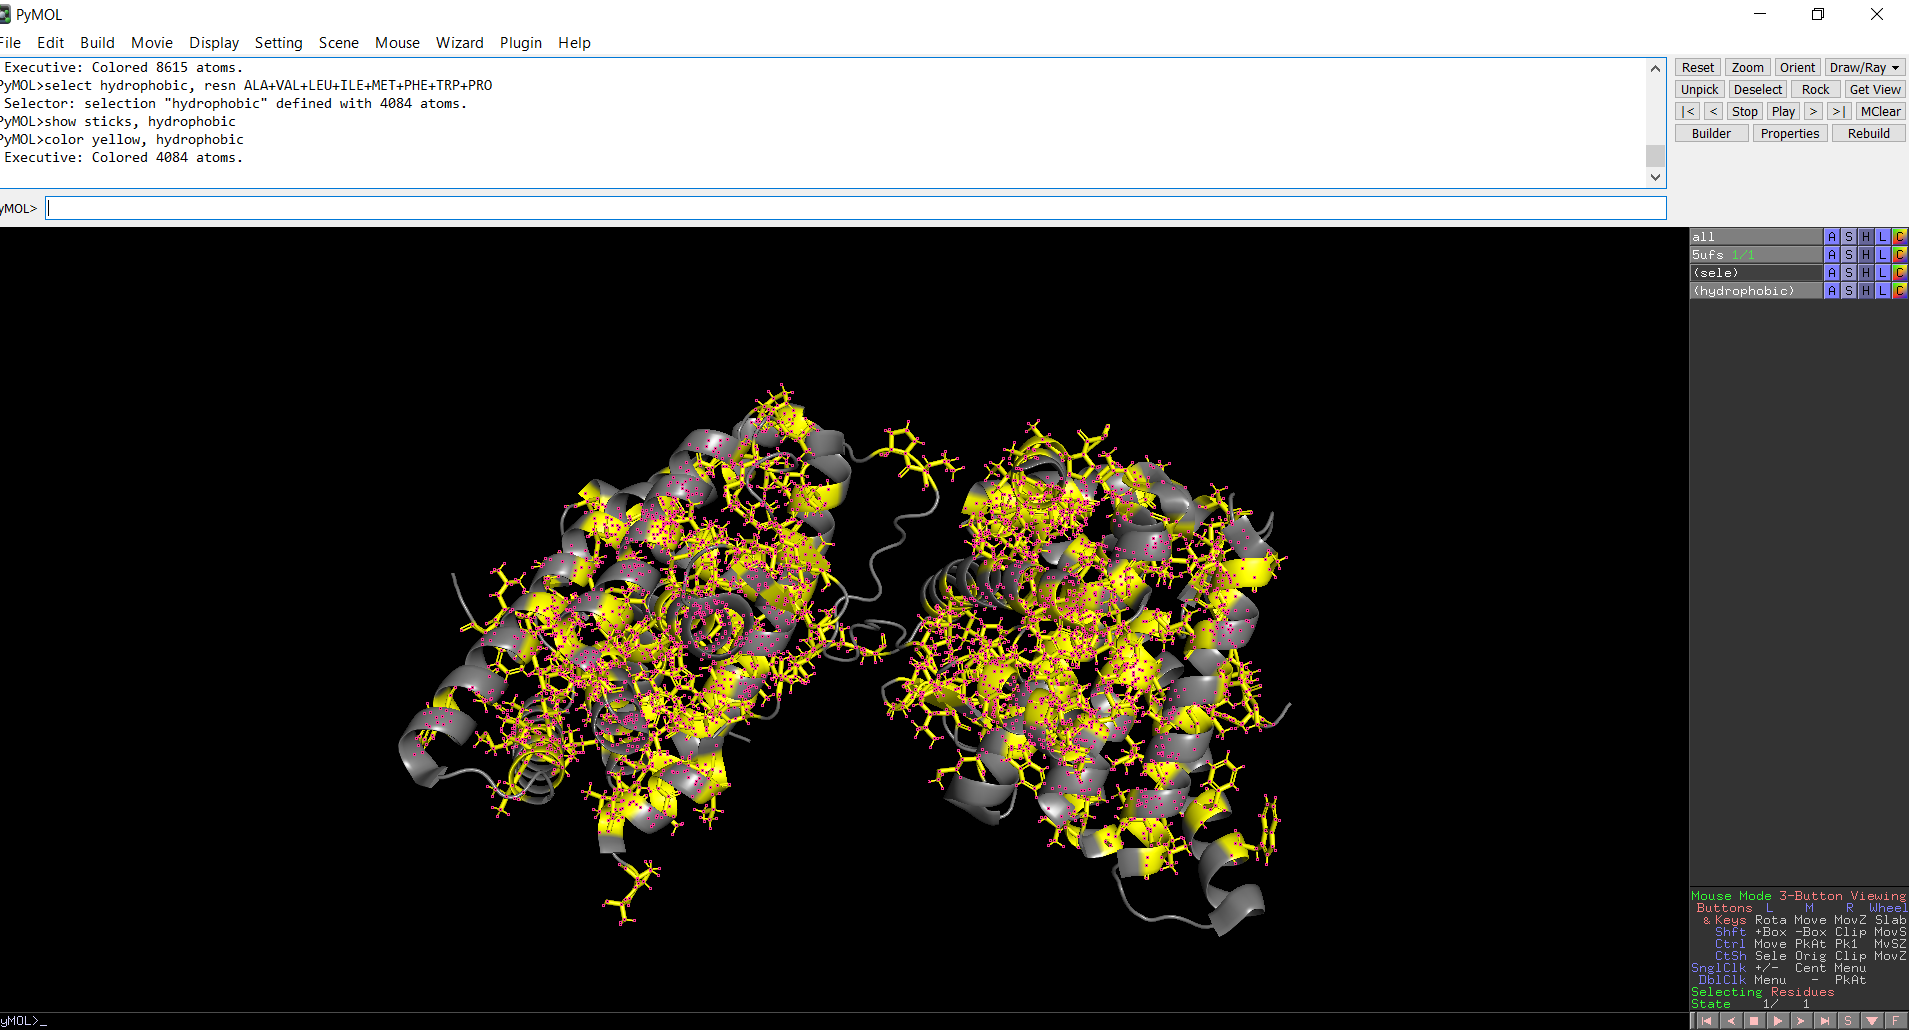
Figure 11: Distribution of hydrophobic residues across the protein
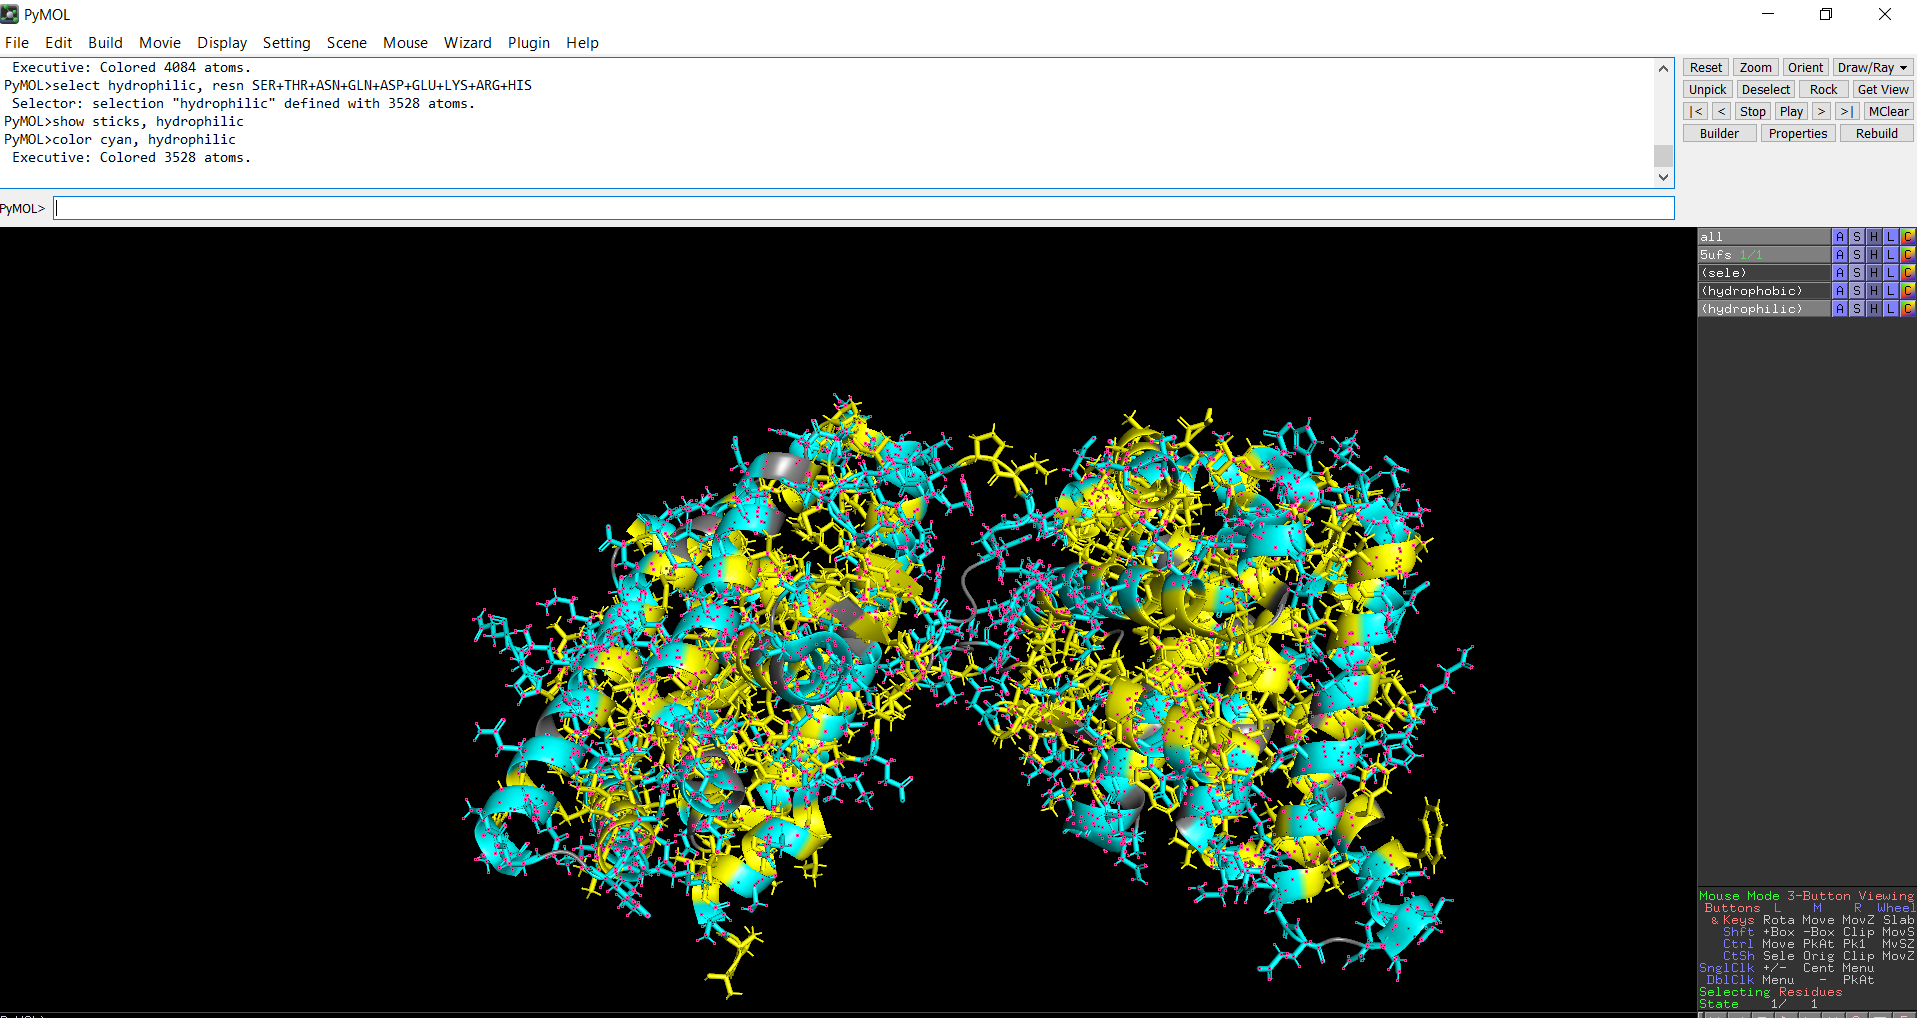
Figure 12: Distribution of hydrophilic residues across the protein
The surface representation reveals several cavities and grooves on the protein surface. One noticeable pocket appears near the center between the two domains, which could function as a ligand-binding site.
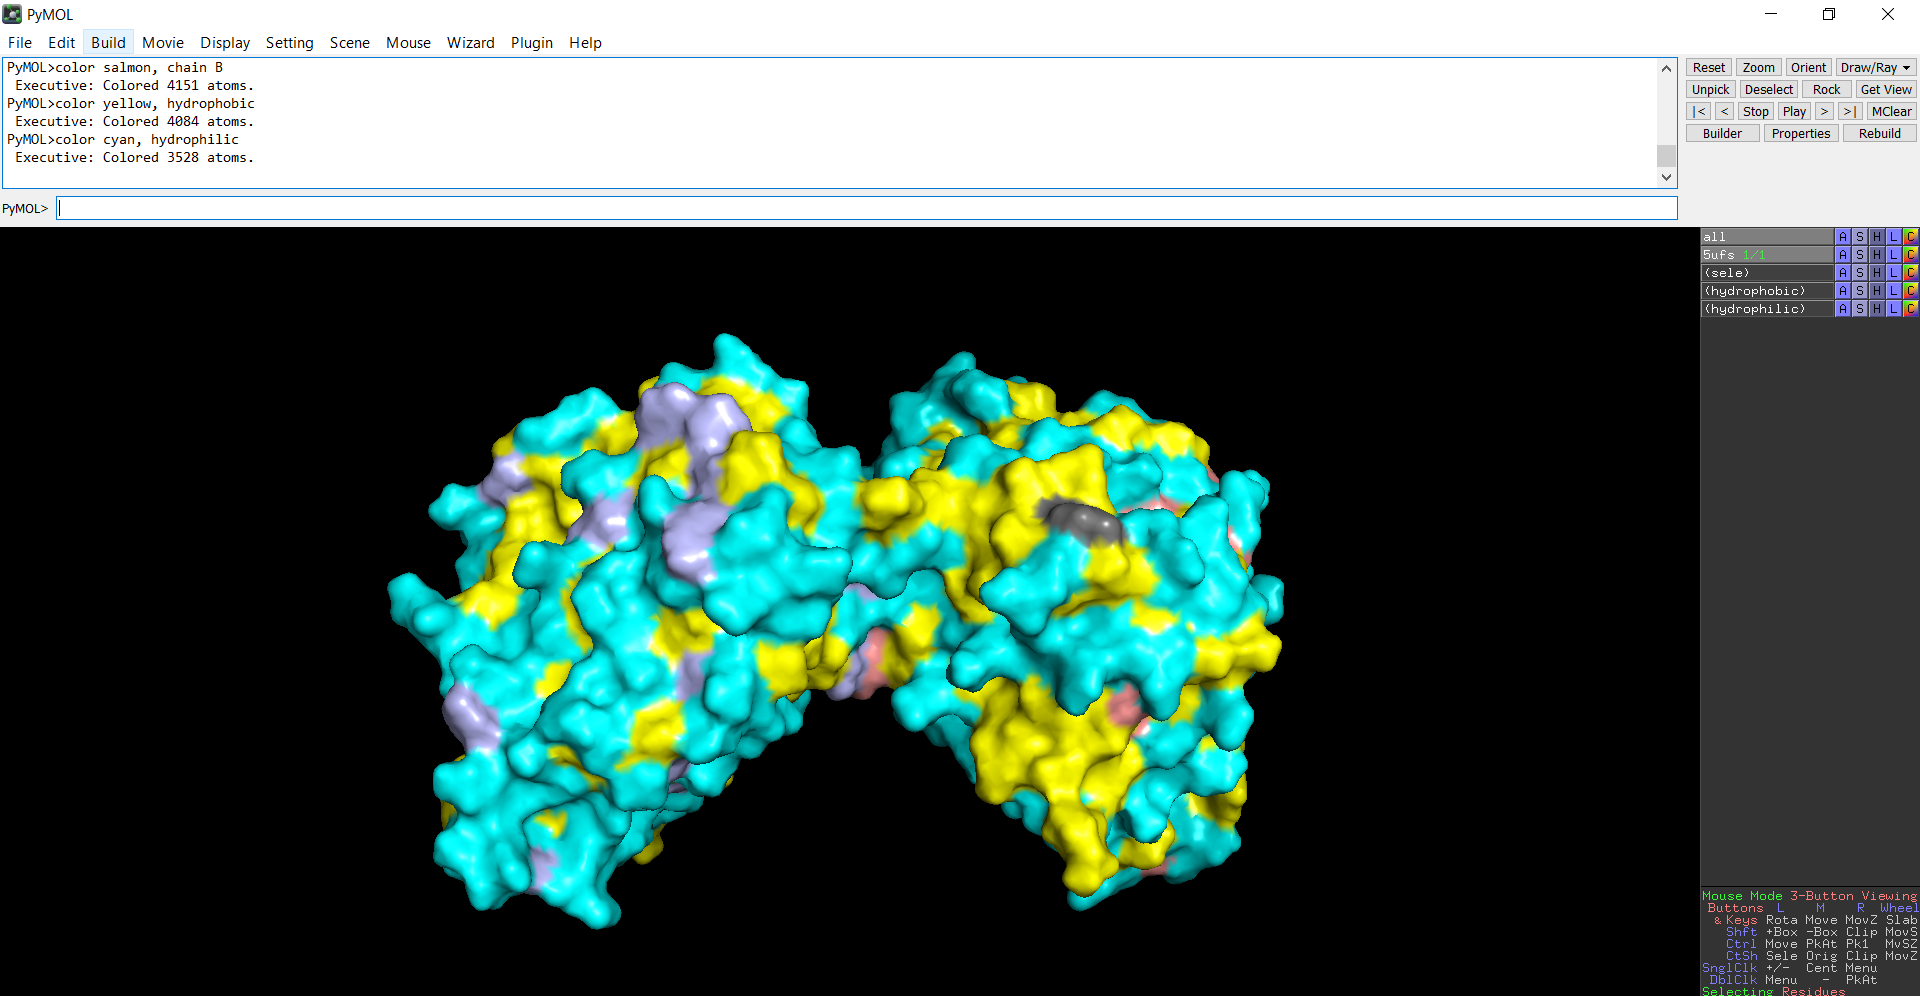
Figure 13: The surface representation of the protein
Part C: Using ML-Based Protein Design Tools
When looking at the mutation heatmap I noticed that position 58 shows a strong negative score for some substitutions. For example, mutating that residue to tryptophan (W) gives a score of about −2.62, which is one of the darkest values in the heatmap. This suggests that the original amino acid at that position is important for the protein structure and that introducing a bulky residue like tryptophan is not tolerated.
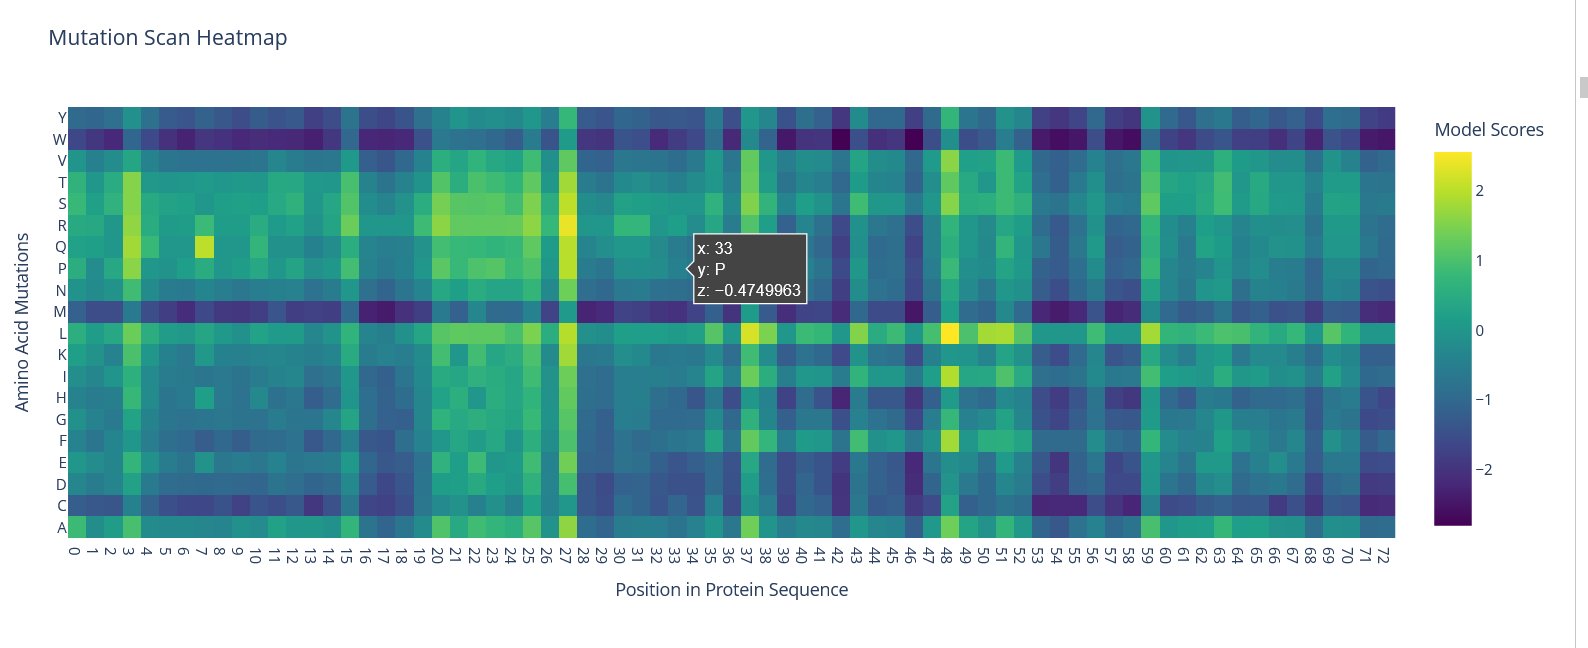
Figure 14: Mutation Scan HeatMap
In the latent space visualization, proteins that appear closer together in the t-SNE space share more similar sequence embeddings generated by the ESM model. The clustering pattern suggests that proteins with related sequence features are grouped together. The color scale corresponds to the value of the third t-SNE dimension and mainly helps visualize the structure of the embedding space.
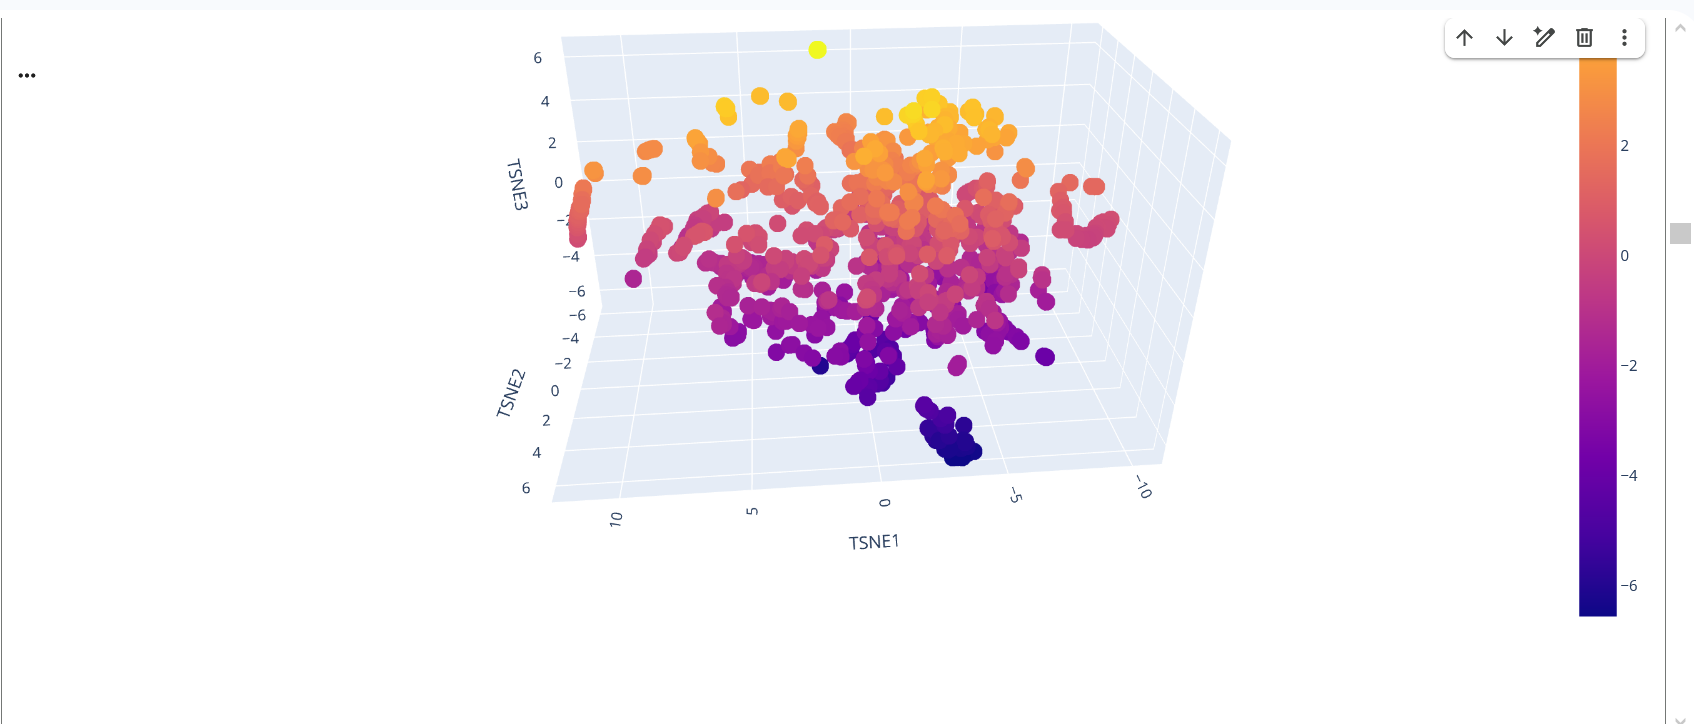
Figure 15: Protein Folding by ESM
The structure predicted by ESMFold shows a similar overall fold compared to the experimentally determined PDB structure. Both structures contain multiple α-helices arranged in a compact configuration. However, the structures are not identical. The PDB structure represents a multimeric assembly with multiple chains, while the ESMFold model predicts a single-chain structure. Additionally, experimental structures often contain ligands or small molecules that are not predicted by ESMFold. Despite these differences, the general secondary structure arrangement appears consistent between the two models.
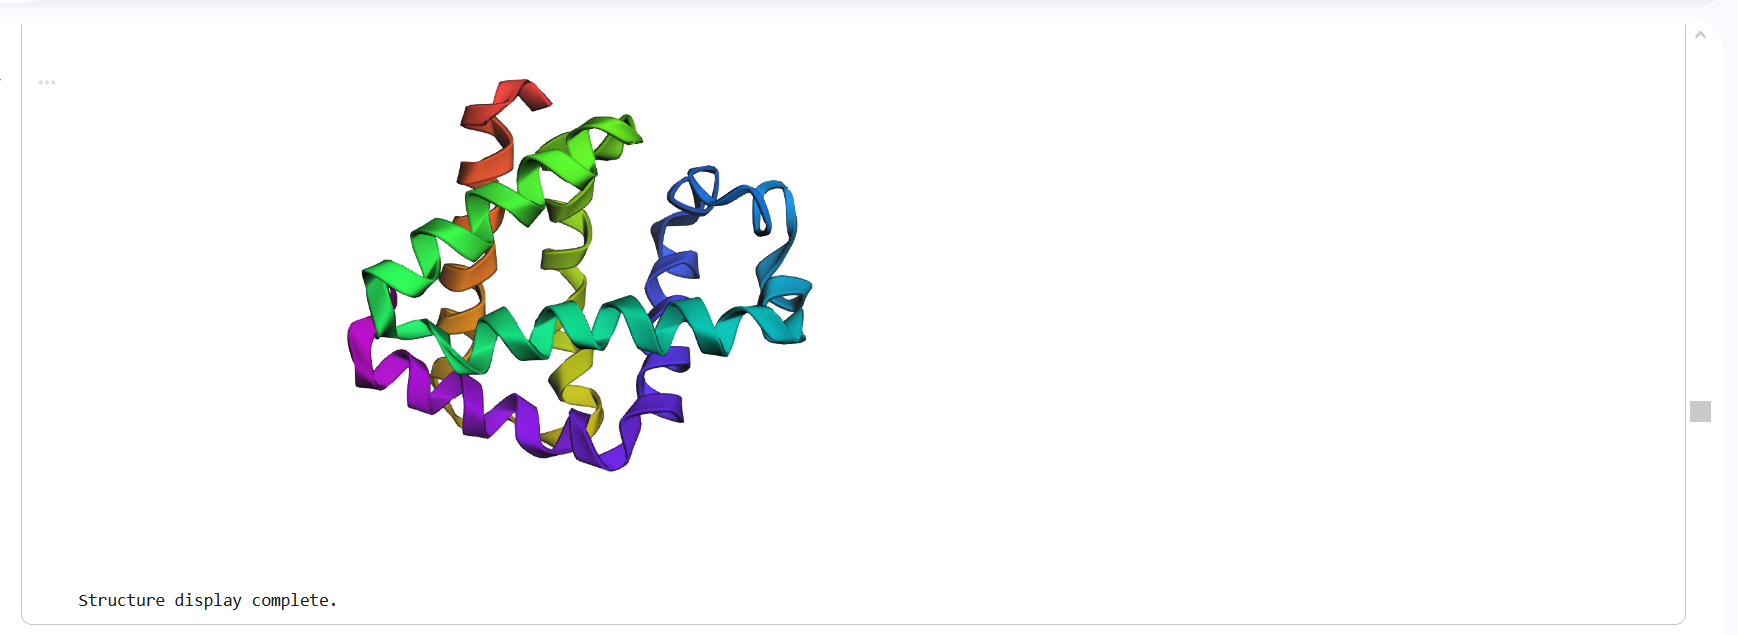
Figure 16: Protein Structure Predicted by ESMFold
I first introduced a single mutation by changing one amino acid in the sequence and then folded the modified sequence using ESMFold. The predicted structure remained very similar to the original structure, with the alpha-helical regions still preserved, as shown in Figure (17 ).
I then introduced larger mutations by replacing several residues with alanine (AAAAAA) and also tested additional mutations such as proline substitutions. Despite these modifications, the predicted structures remained largely similar to the original model, with only minor local differences, as shown in Figure (18 ). Overall, these results suggest that the protein fold is relatively resilient to moderate sequence mutations.
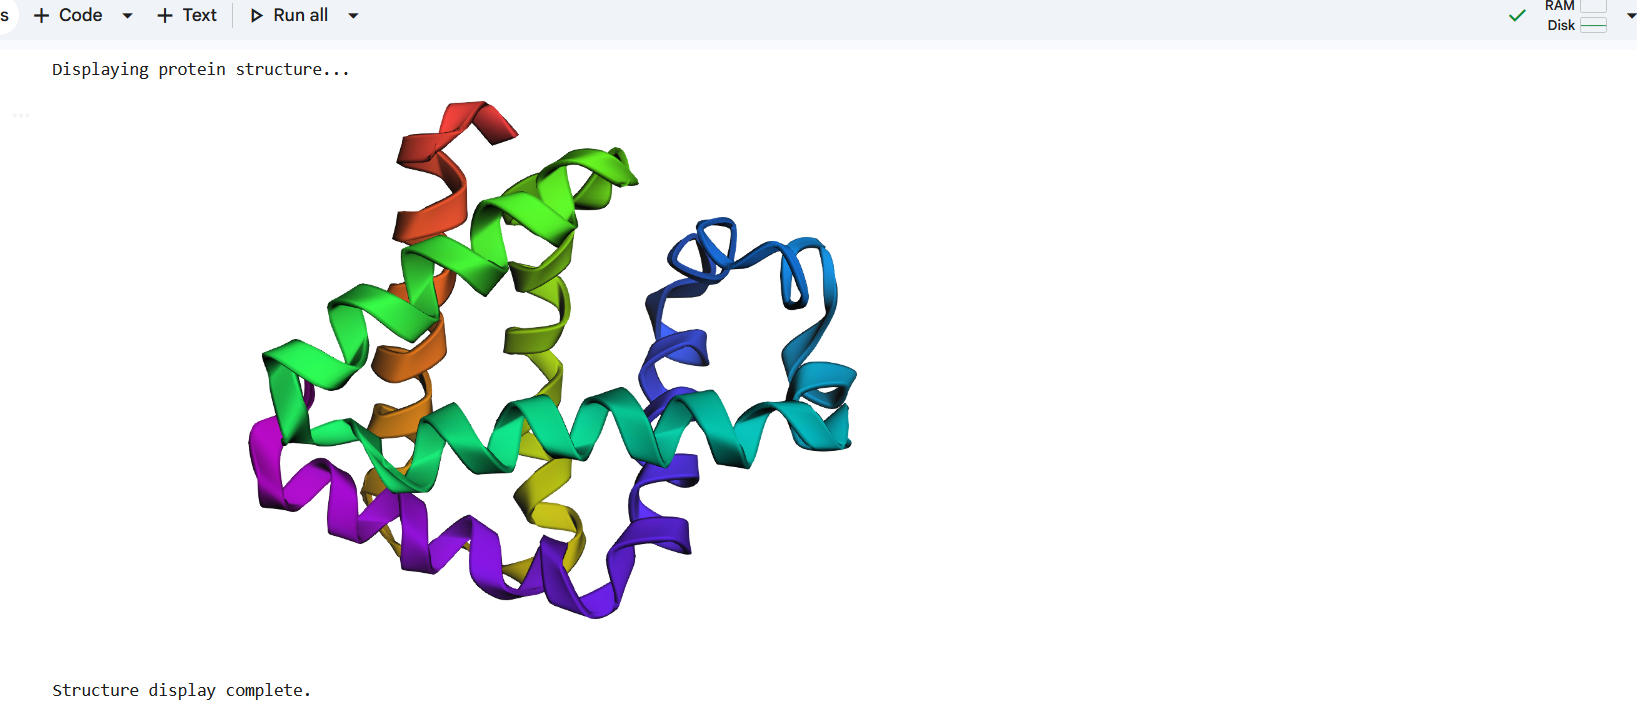
Figure 17: Making a mutation by changing one letter from P to A in the amino acid sequence.
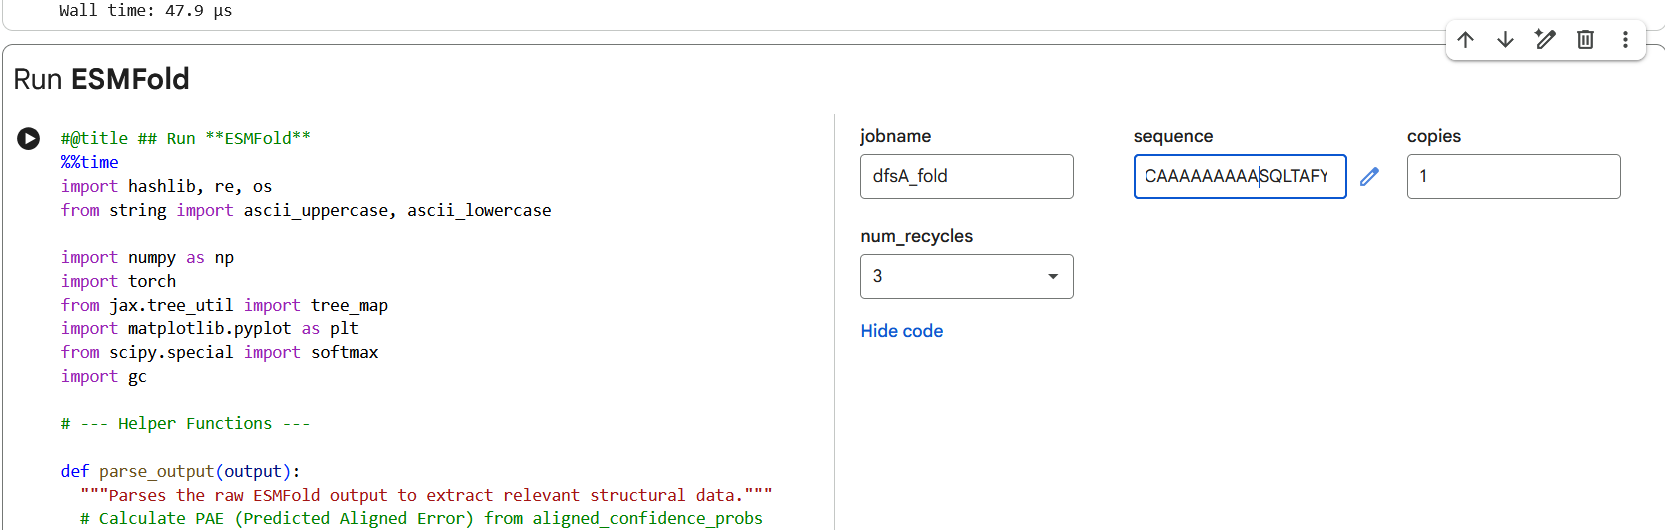
Figure 18: Making a mutation by changing a large segment of the amino acid sequence.
The heatmap shows the probability of different amino acids at each position in the protein. The yellow regions indicate higher probabilities, meaning the model strongly prefers those residues at those positions. For example, at position 58 leucine (L) has a probability of about 0.91, and at position 36 proline (P) has a probability of about 0.92. In contrast, the green regions show lower probabilities, meaning those positions are more flexible and can tolerate different amino acids. This suggests that some residues are more important for maintaining the protein structure while others are less constrained.
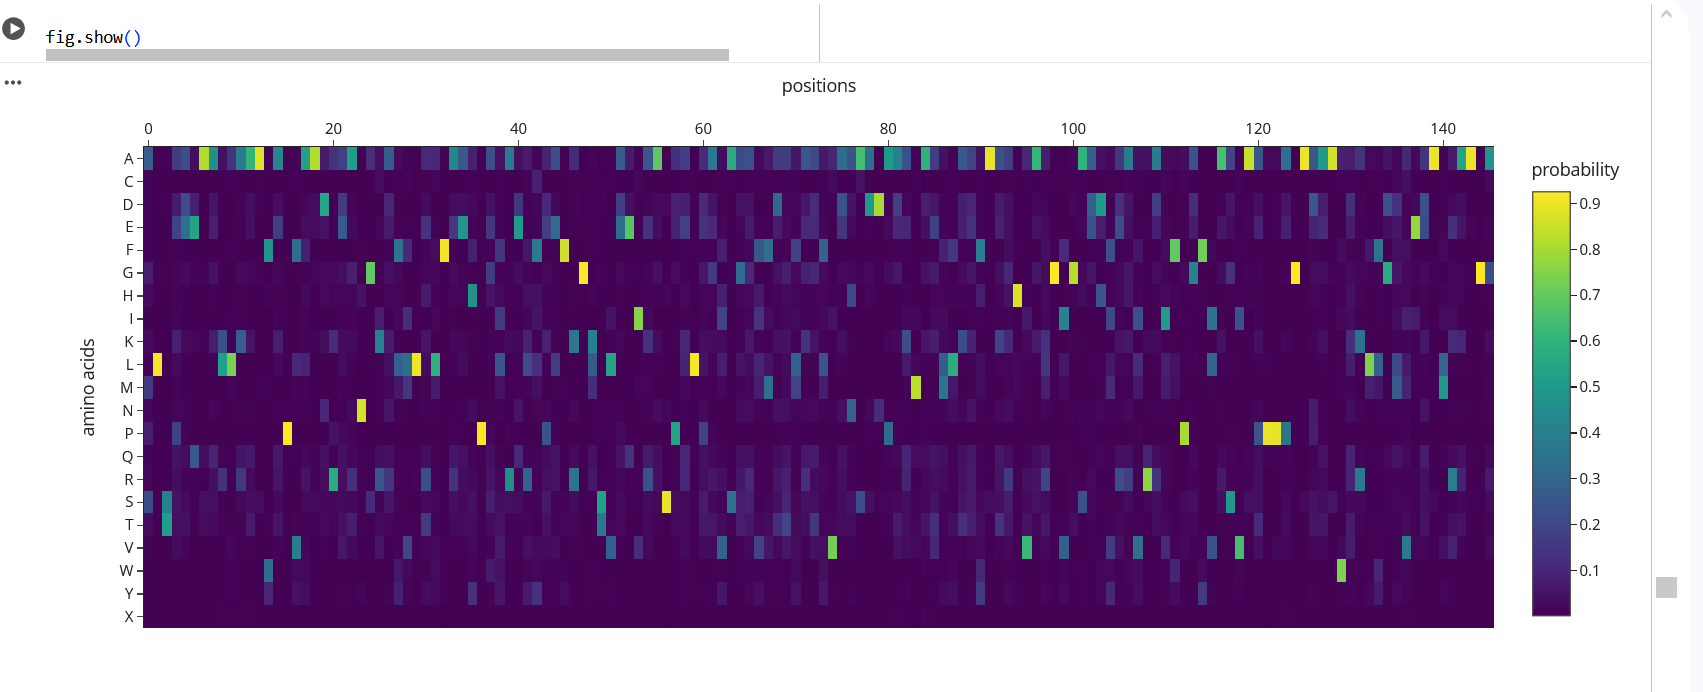
Figure 19: The heatmap shows the probability of different amino acids at each position in the protein.
The sequence generated by ProteinMPNN was folded using ESMFold and compared to the original structure. The predicted structure shows a very similar overall fold, with helices appearing in similar positions. Although there are small differences in some regions, the general shape of the protein remains the same. This suggests that the designed sequence is compatible with the same backbone structure.
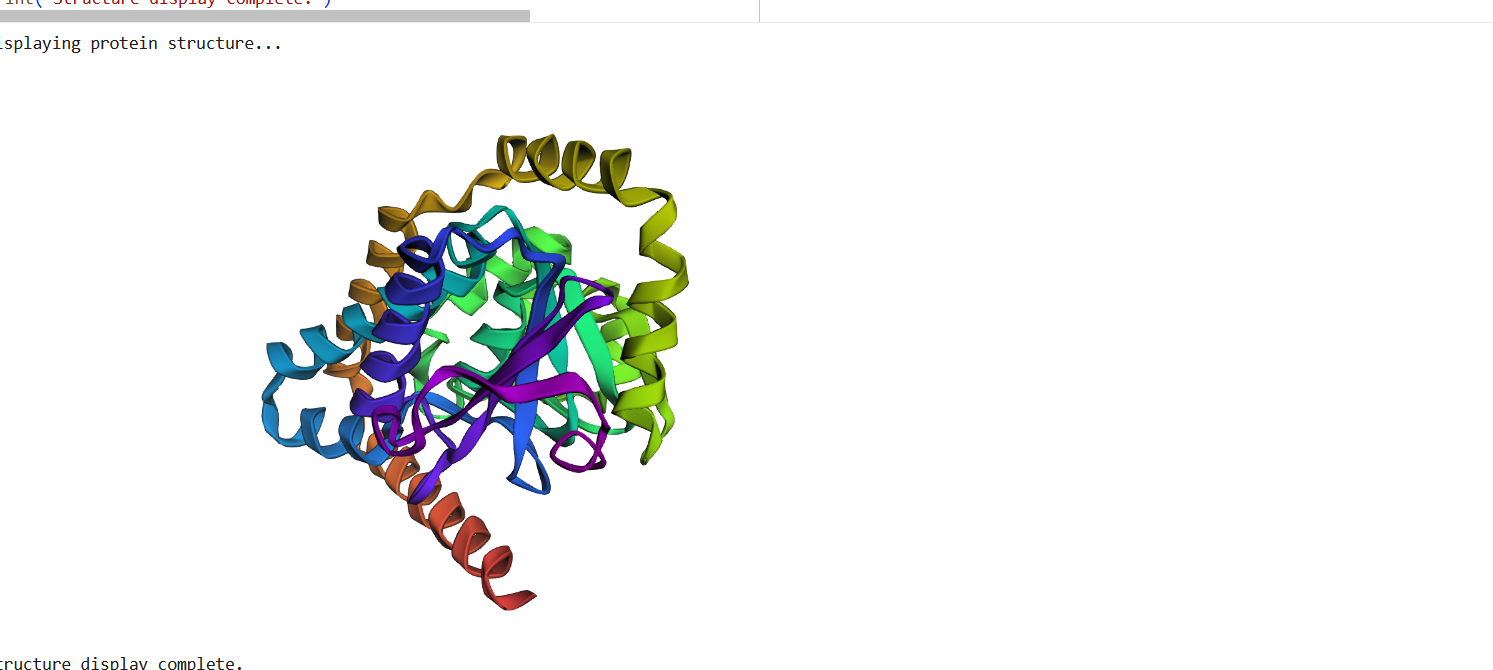
Figure 20: The Protein sequence generated by ProteinMPNN