Week 10 – Imaging and Measurement

Homework: Final Project
I would mainly want to see whether the redesigned GR-LBD protein is successfully produced and whether introducing the Q642K mutation improves cortisol selectivity compared with cortisone. Since the DNA construct was designed and ordered through Twist Bioscience, I would first verify the received construct sequence before moving into expression studies.
I would then express the construct in E. coli BL21(DE3) and purify the protein using affinity chromatography. SDS-PAGE gel electrophoresis would be used to check whether the expected protein band is present and whether expression was successful.
I would also compare cortisol versus cortisone binding using fluorescence-based ligand binding assays to determine whether the redesigned protein shows improved selectivity. Since the long-term goal is a saliva-based biosensor, I would also test the protein under saliva-like conditions to see whether proteins, enzymes, or salts interfere with signal performance.
The main technologies I would use include DNA sequencing verification, protein expression in E. coli BL21(DE3), affinity chromatography, SDS-PAGE gel electrophoresis, fluorescence-based ligand binding assays, and saliva-like testing.
Homework: Waters Part I — Molecular Weight
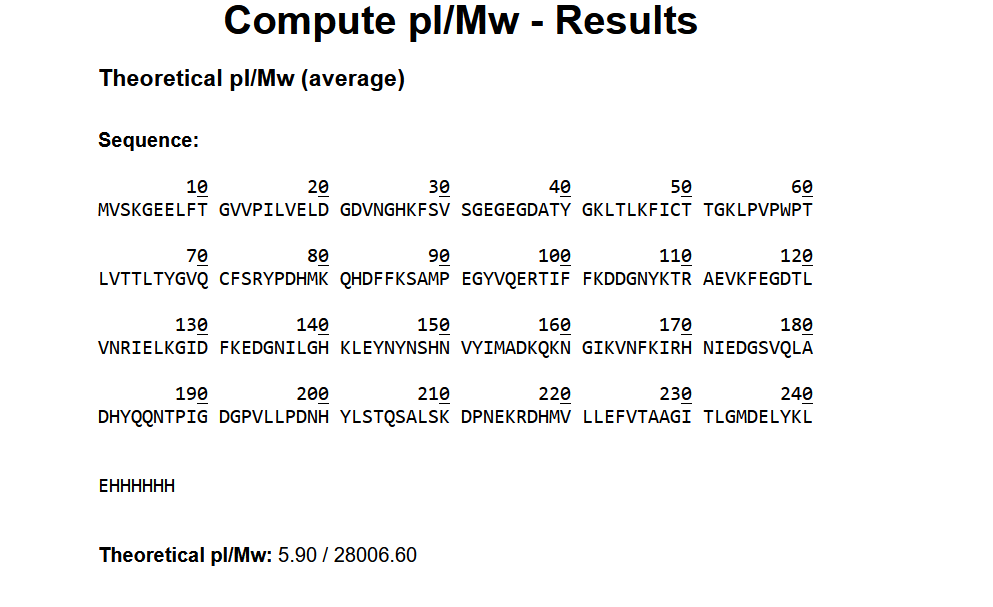
- Theoretical Molecular Weight of eGFP
The theoretical molecular weight of eGFP was first calculated using the ExPASy Compute pI/Mw tool based on the provided amino acid sequence, including the LE linker and the 6× His purification tag.
The calculated molecular weight was: 28,006.60 Da
Since mature eGFP undergoes chromophore cyclization during folding, a small mass loss of approximately 20 Da was considered. [28006.60 - 20 = 27986.60]
Therefore, the corrected theoretical molecular weight of mature eGFP is approximately: 27,986.60 Da
- Two adjacent peaks were selected from Figure 1: • 903.7148 • 933.8044 Using the adjacent charge state equation, the charge state was calculated to be: z ≈ 30 Therefore: • 933.8044 = 30+ • 903.7148 = 31+
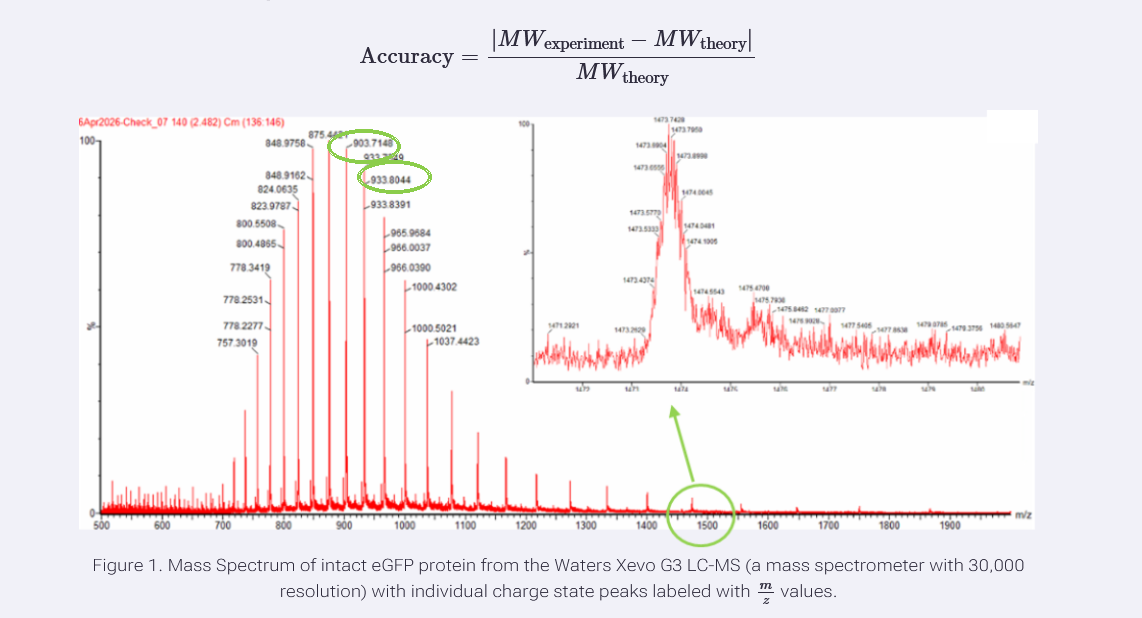
Using the relationship between m/z, MW, and z, the experimental molecular weight of eGFP was calculated to be: 27,983.91 Da The accuracy compared to the theoretical molecular weight (27,986.60 Da) was: ~0.01% error
Yes, the charge state can be roughly estimated from the zoomed-in peak because the isotope peaks are very closely spaced. Based on Lindsay’s explanation during the recitation that smaller isotope spacing corresponds to higher charge states, this peak appears to have a relatively high charge, approximately between 15+ and 20+
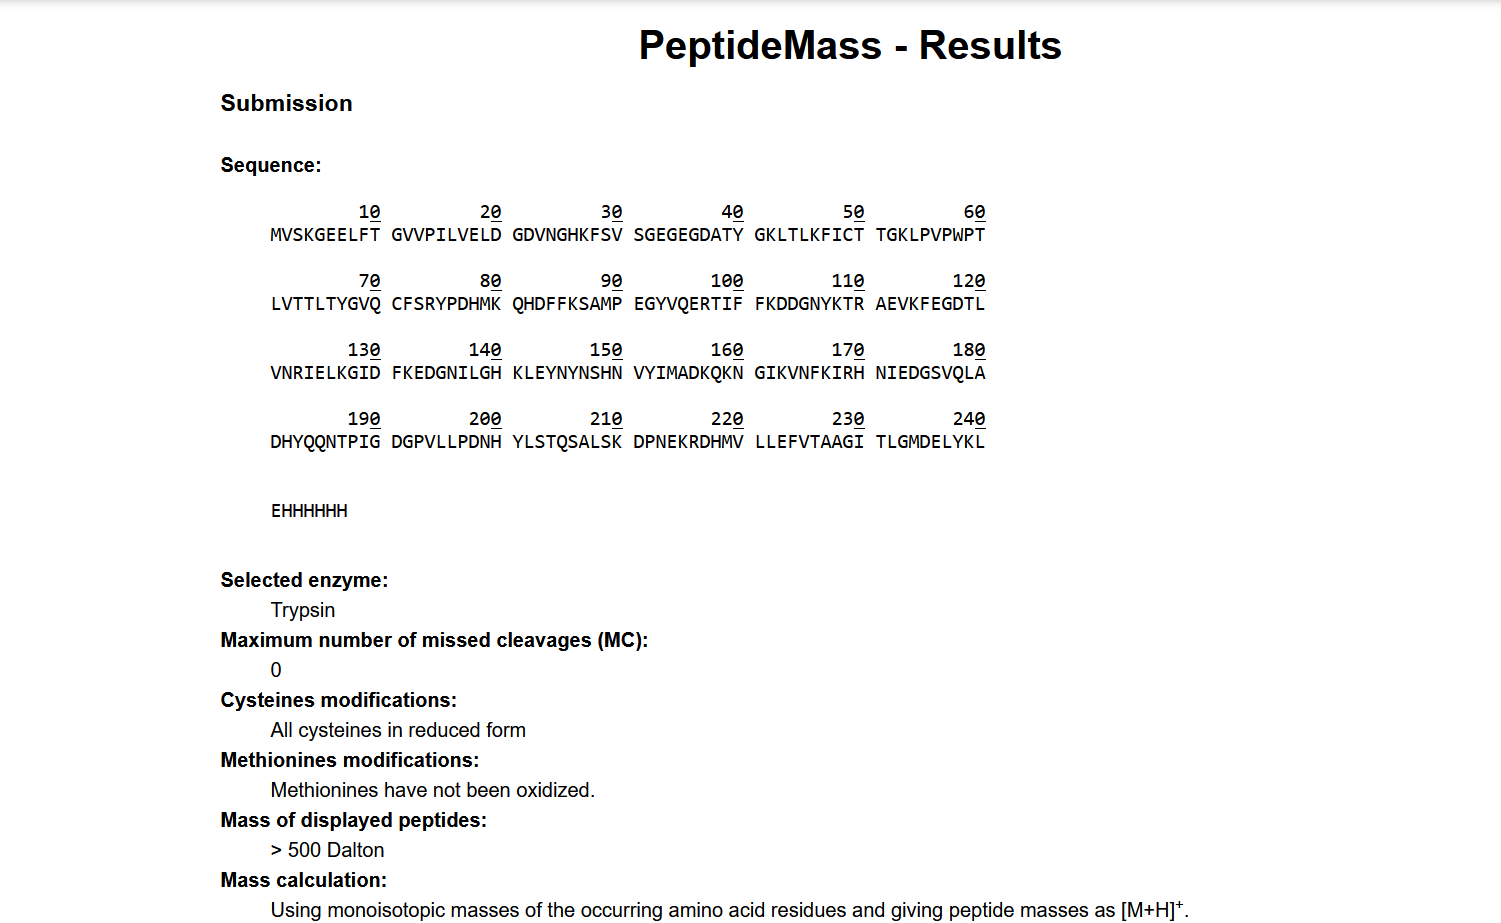
Using the ExPASy PeptideMass tool with trypsin and 0 missed cleavages, 19 peptides were generated under the selected settings (>500 Da displayed peptides).
Based on Figure 5a, I observed approximately 18 chromatographic peaks above 10% relative abundance between 0.5 and 6 minutes in the eGFP peptide map.
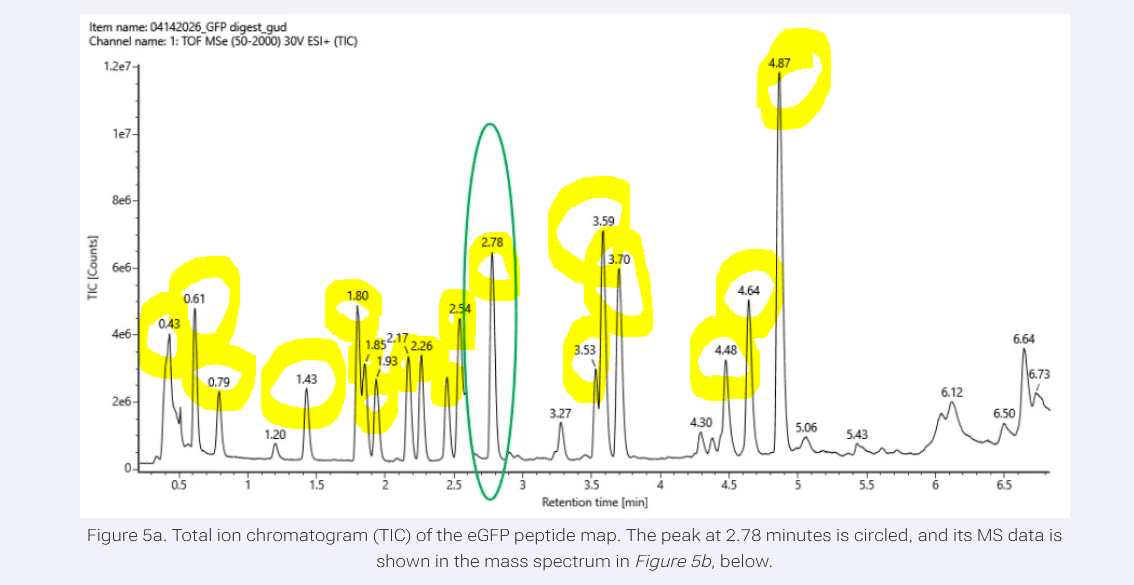
The number of major chromatographic peaks is close to the number of predicted peptides. However, if smaller low-abundance peaks are also counted, the chromatogram appears to contain more peaks than the 19 predicted peptides. This is likely due to background signals, partially overlapping peptides, noise, or additional low-intensity peptide fragments detected in the LC-MS data.
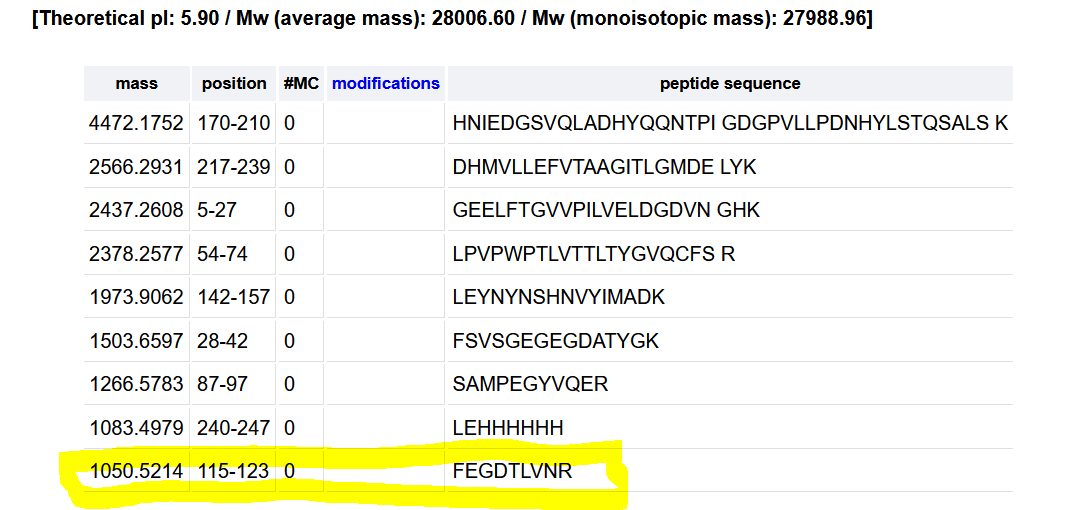
[(525.76712 \times 2) - 1.0073 = 1050.52] Therefore, the singly charged peptide mass was calculated to be approximately 1050.52 Da.
The experimental mass from Figure 5b was approximately 1050.52 Da.
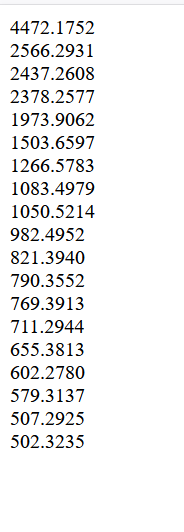
When I compared it with the expected peptide masses from PeptideMass, the closest match was: FEGDTLVNR = 1050.5214 Da So the peptide is: FEGDTLVNR Mass error: (∣1050.5269-1050.5214∣)/1050.5214×10^6=5.2" ppm Mass accuracy/error ≈ 5.2 ppm
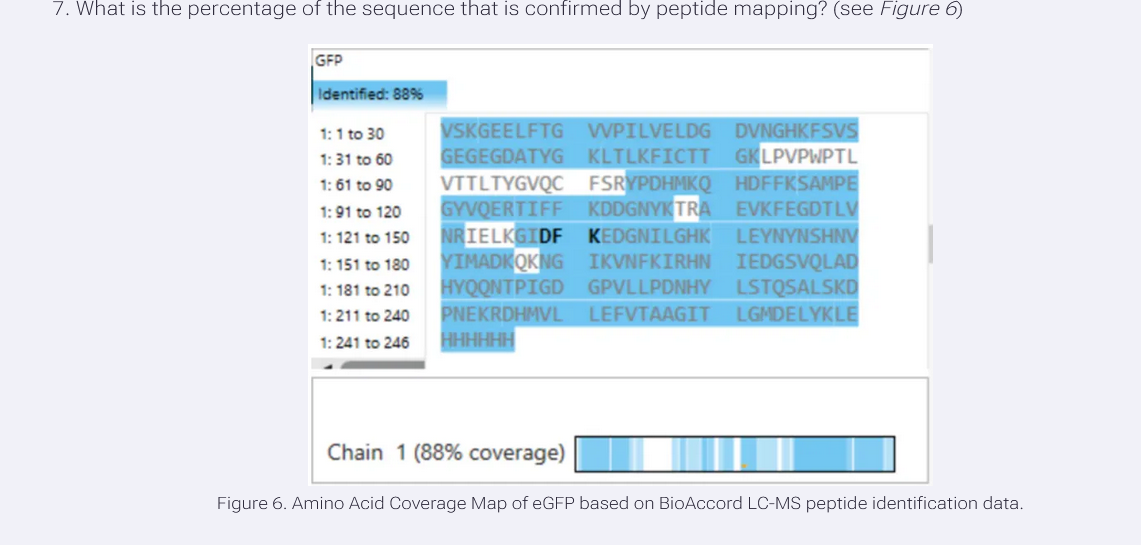
Based on Figure 6, approximately 88% of the eGFP sequence was confirmed by peptide mapping.
Homework: Waters Part IV — Oligomers
I used the given KLH subunit masses and multiplied them by the number of subunits in each oligomer. Since a decamer contains 10 subunits, the didecamer, 3-decamer, and 4-decamer correspond to 20, 30, and 40 subunits.
• 7FU subunit = 340 kDa • 8FU subunit = 400 kDa • 1 MDa = 1000 kDa
7FU Decamer 10 × 340 kDa = 3400 kDa = 3.4 MDa Matches the peak around 3.4 MDa.
8FU Didecamer 20 × 400 kDa = 8000 kDa = 8.0 MDa Matches the peak around 8.33 MDa.
8FU 3-Decamer 30 × 400 kDa = 12000 kDa = 12.0 MDa Matches the peak around 12.67 MDa.
8FU 4-Decamer 40 × 400 kDa = 16000 kDa = 16.0 MDa Expected near 16 MDa on the spectrum.
Homework: Waters Part V — Did I make GFP?
| Protein | Theoretical Molecular Weight (kDa) | Observed/Measured on Intact LC-MS (kDa) | PPM Mass Error |
|---|---|---|---|
| eGFP | 27.9866 | 27.9839 | ~96 |
The observed molecular weight measured from the intact LC-MS analysis was very close to the theoretical molecular weight predicted from the eGFP sequence, suggesting accurate detection of the intact mature eGFP protein.