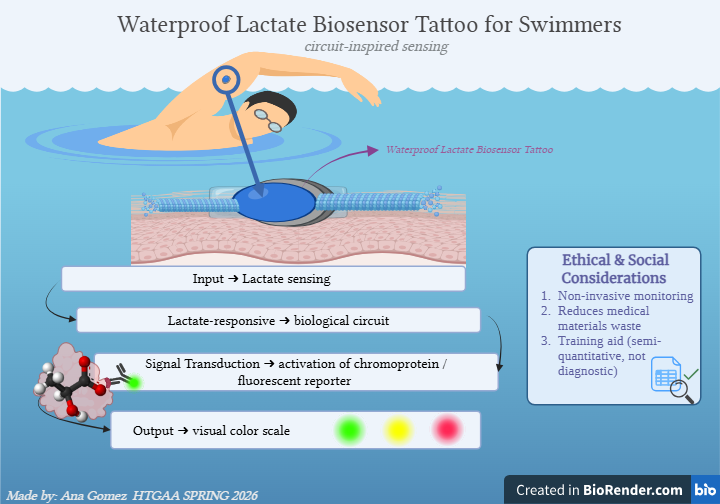
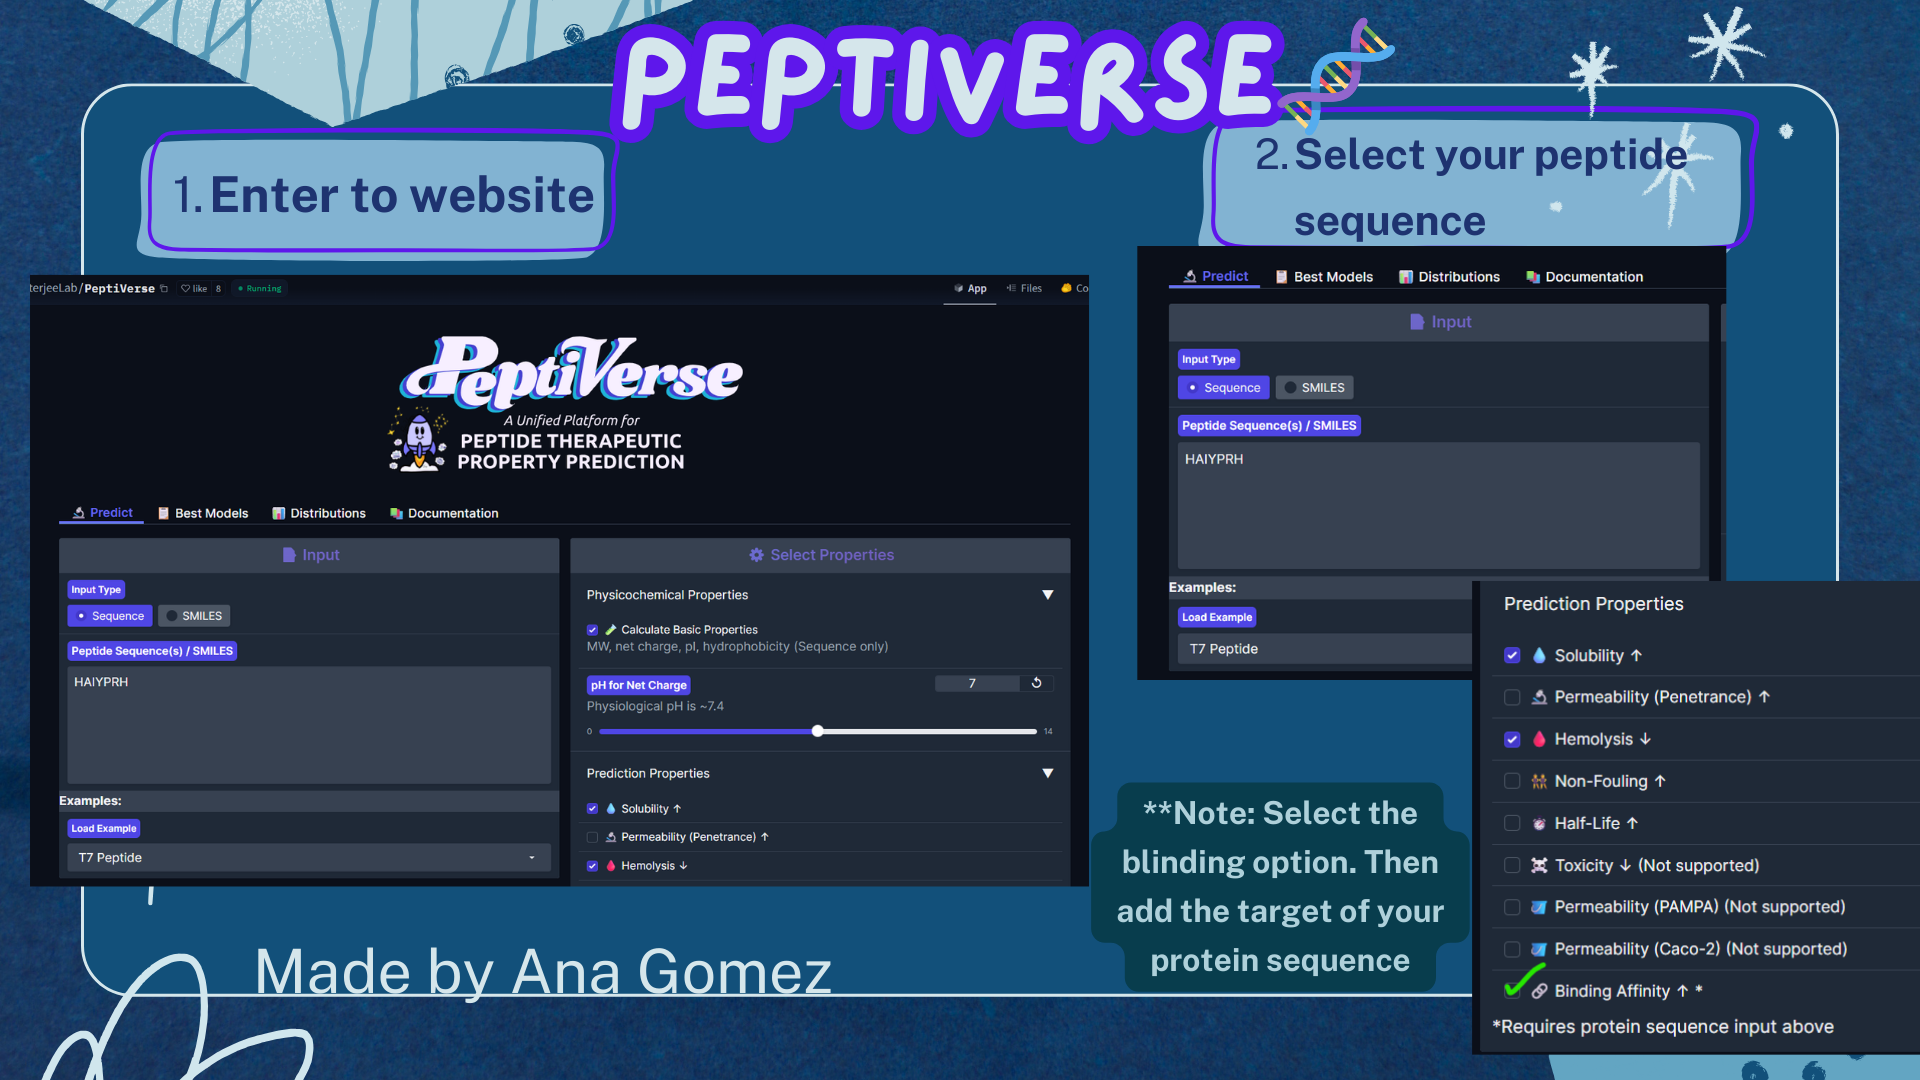
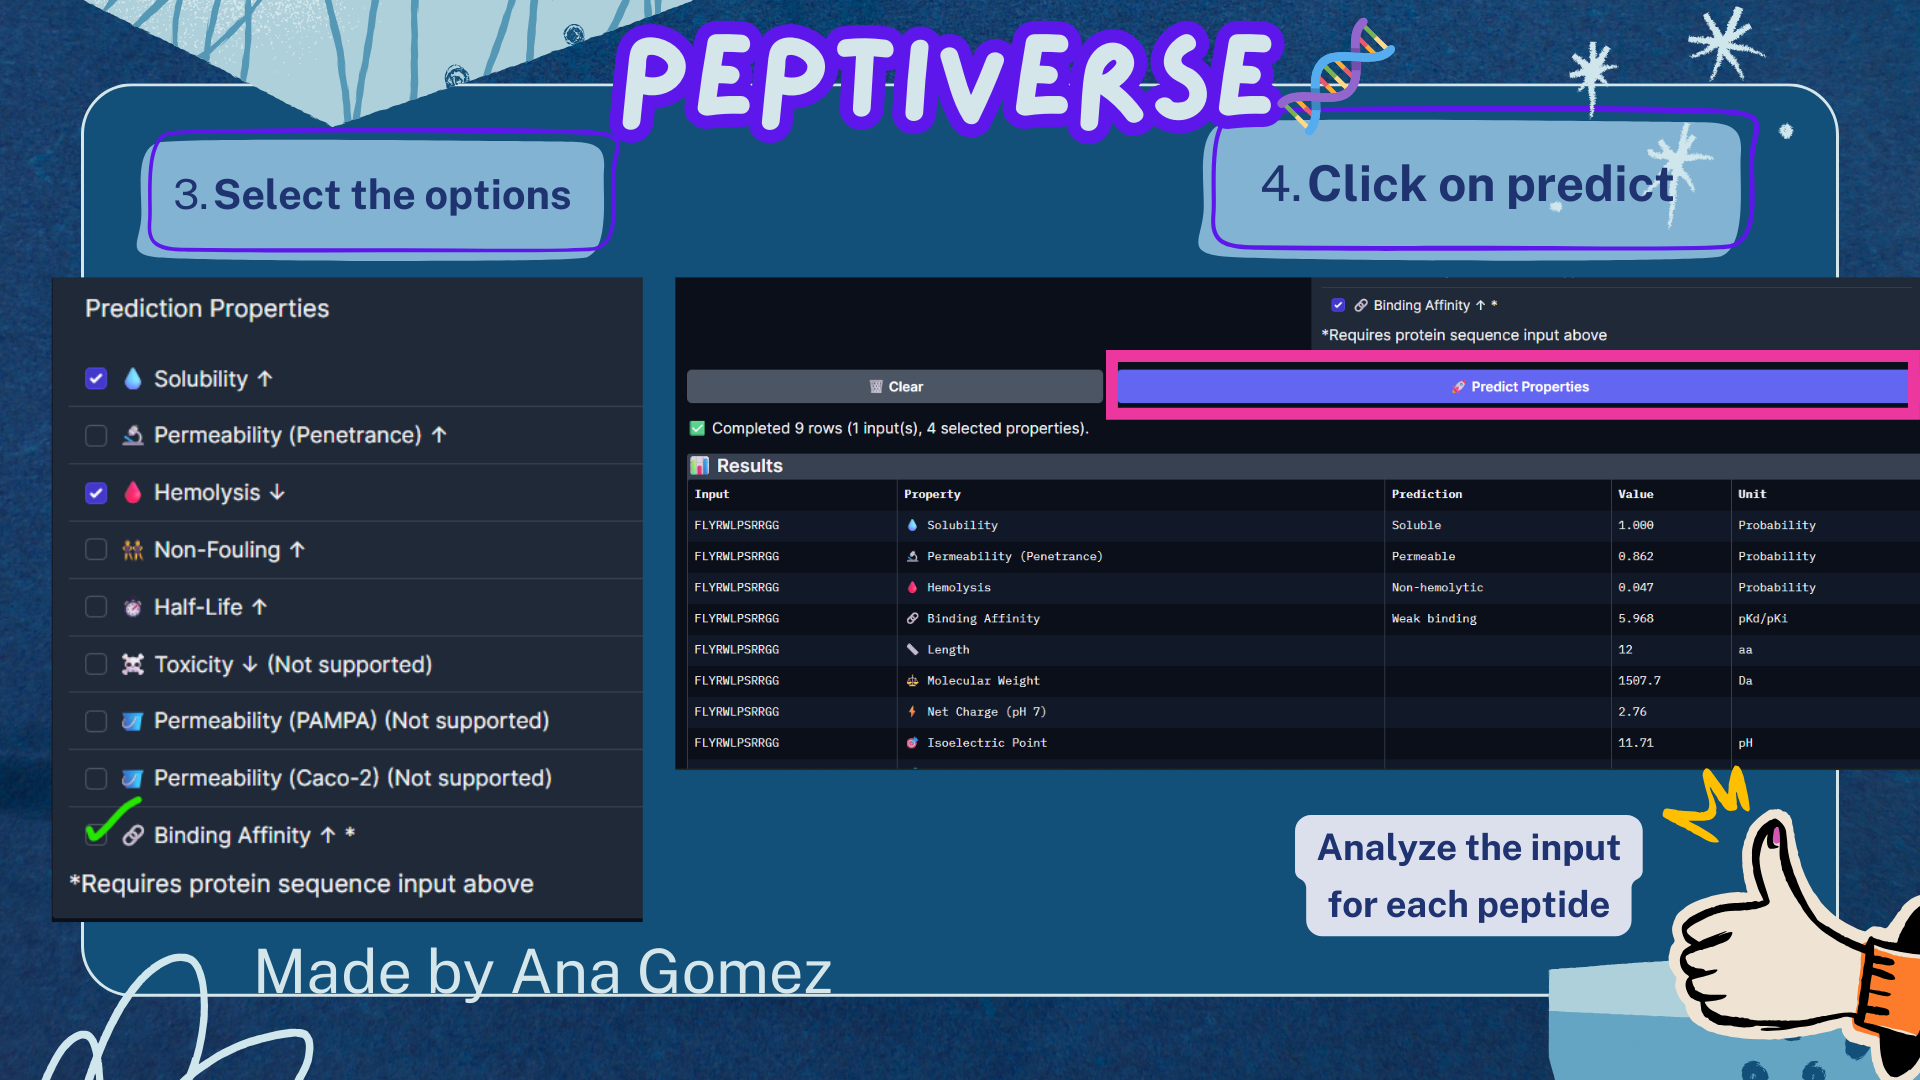
Week 1: Principles & Practices- Class Assignment First, describe a biological engineering application or tool you want to develop and why. This could be inspired by an idea for your HTGAA class project and/or something for which you are already doing in your research, or something you are just curious about. Lactate Biosensor Tattoo for competition swimmers! I propose developing a semi-permanent, waterproof biosensor tattoo that detects lactate levels in athletes during pool training. The system would rely on engineered biological circuits that respond to lactate and trigger a visible fluorescent or colorimetric signal, functioning as a traffic-light-style, semi-quantitative indicator of physiological stress. The idea is connected to course topics such as genetic circuit design and fluorescent protein signaling. Lactate would act as the biological input, while the output would be a color change generated by chromoproteins or fluorescent reporters, similar to the chromophore and genetic circuit. This tool doesn’t pretend to replace clinical blood tests or provide precise measurements. Instead, it will support athletic training by providing real-time visual feedback, reducing invasive blood sampling, and minimizing medical waste, such as needles and collection tubes. This idea is inspired by my personal experience as a competitive swimmer, where lactate monitoring required repeated finger pricks during intense training sessions. I am particularly interested in exploring how biological sensing circuits and fluorescence-based outputs could be adapted to function under demanding conditions such as exercise, pool conditions, and temperature variation. Biology pipeline of the application (circuit-inspired sensing) Swimmer (physiological lactate production):
Prelecture Homework: In preparation for Week 2’s lecture on “DNA Read, Write, and Edit," please review these materials:
Lecture 2 slides as posted below. The associated papers that are referenced in those slides. In addition, answer these questions in each faculty member’s section: Homework Questions from Professor Jacobson:
Nature’s machinery for copying DNA is called polymerase. What is the error rate of polymerase? How does this compare to the length of the human genome. How does biology deal with that discrepancy? The biological machinery of copying DNA (polymerase) has an error rate of approximately 1 mistake per 10⁶ bases during replication when proofreading is active. (slide 8). This error is a variation based on the error rate, from 103 to 108. Compared to the length of the human genome, which is about 3.2 billion base pairs (≈3.2 × 10⁹ bp). This means that even with this high fidelity, thousands of errors could theoretically occur each time a genome is copied. (slide 10).
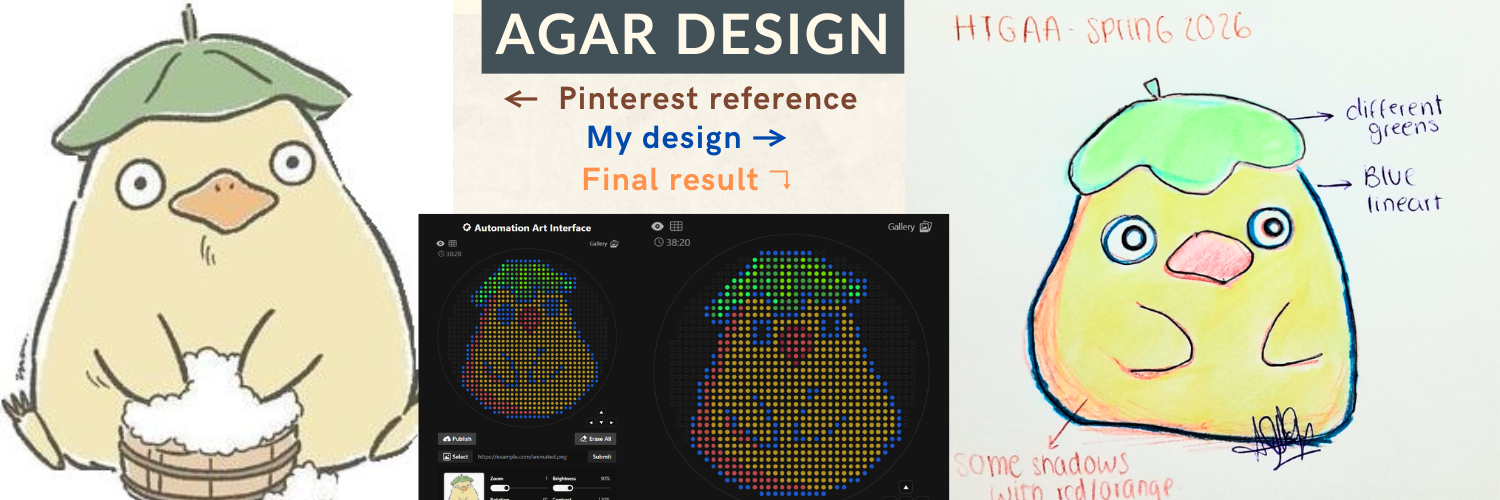
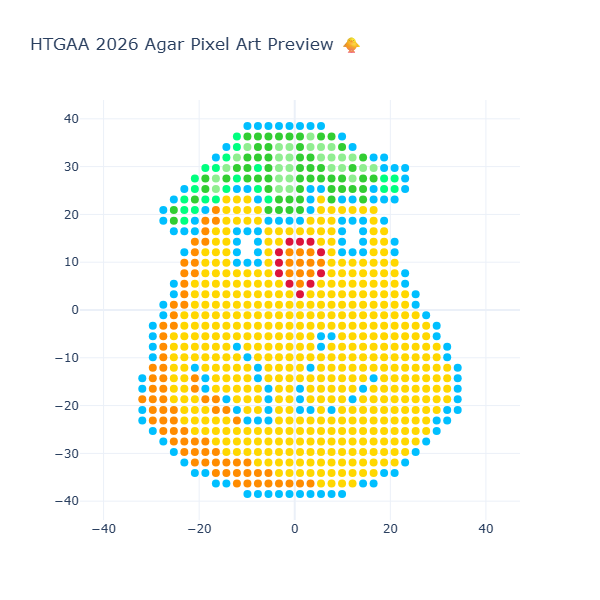
Week 3: Lab Automation Part 1: Phyton Code & Agar Design Documentation: For the first part of the Lab Automation assignment, I worked with Opentrons Python code using Google Colab. During this process, I used ChatGPT primarily as a debugging and learning aid. It helps me resolve execution errors, install missing packages (via pip), and understand how to structure the notebook so the design can be visualized correctly. Because the shared notebook relies on Opentrons hardware-specific functions (such as load_labware), the code was adapted to allow local visualization without a physical robot. My draft version originally included labware definitions intended for real laboratory execution, but these were temporarily removed to enable Plotly-based visualization. If you are interested in reading my code, please enter the following link: https://colab.research.google.com/drive/18Pb0JAgtB5Sv8v3VHhfop3mpF-nUiMp8?usp=drive_link The agar design was inspired by the ducks from Spirited Away (Studio Ghibli), based on my own drawing, combined with online references. The final pixel-art layout was generated using the Opentrons Art Generator and can be viewed here: https://opentrons-art.rcdonovan.com/?id=5s7w0mpt758a7af
Week 4: Protein Design Part I Part A: Conceptual Questions Answering 9 questions:
How many molecules of amino acids do you take with a piece of 500 grams of meat? (on average an amino acid is ~100 Daltons) What we know: a. Meat ~ 20% of protein
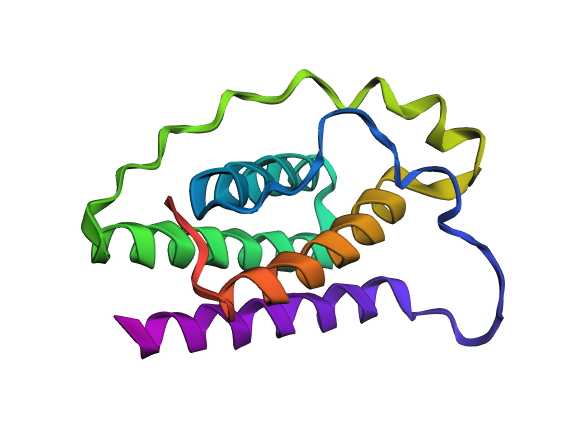
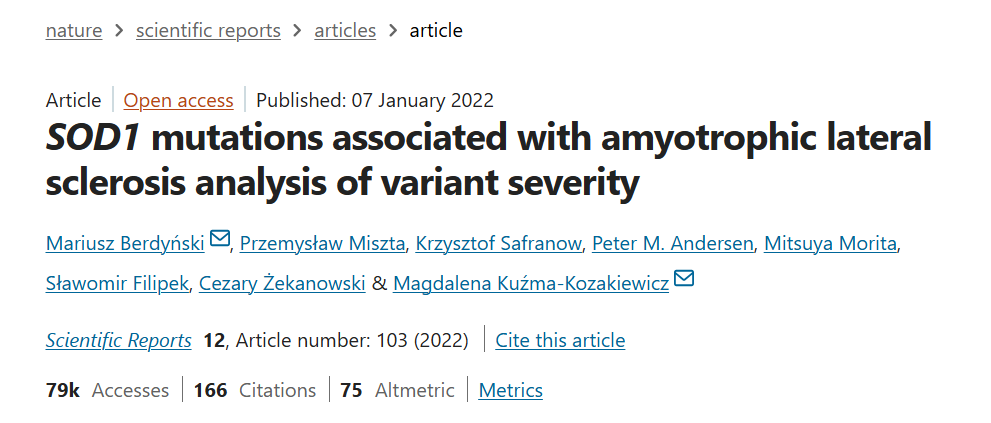
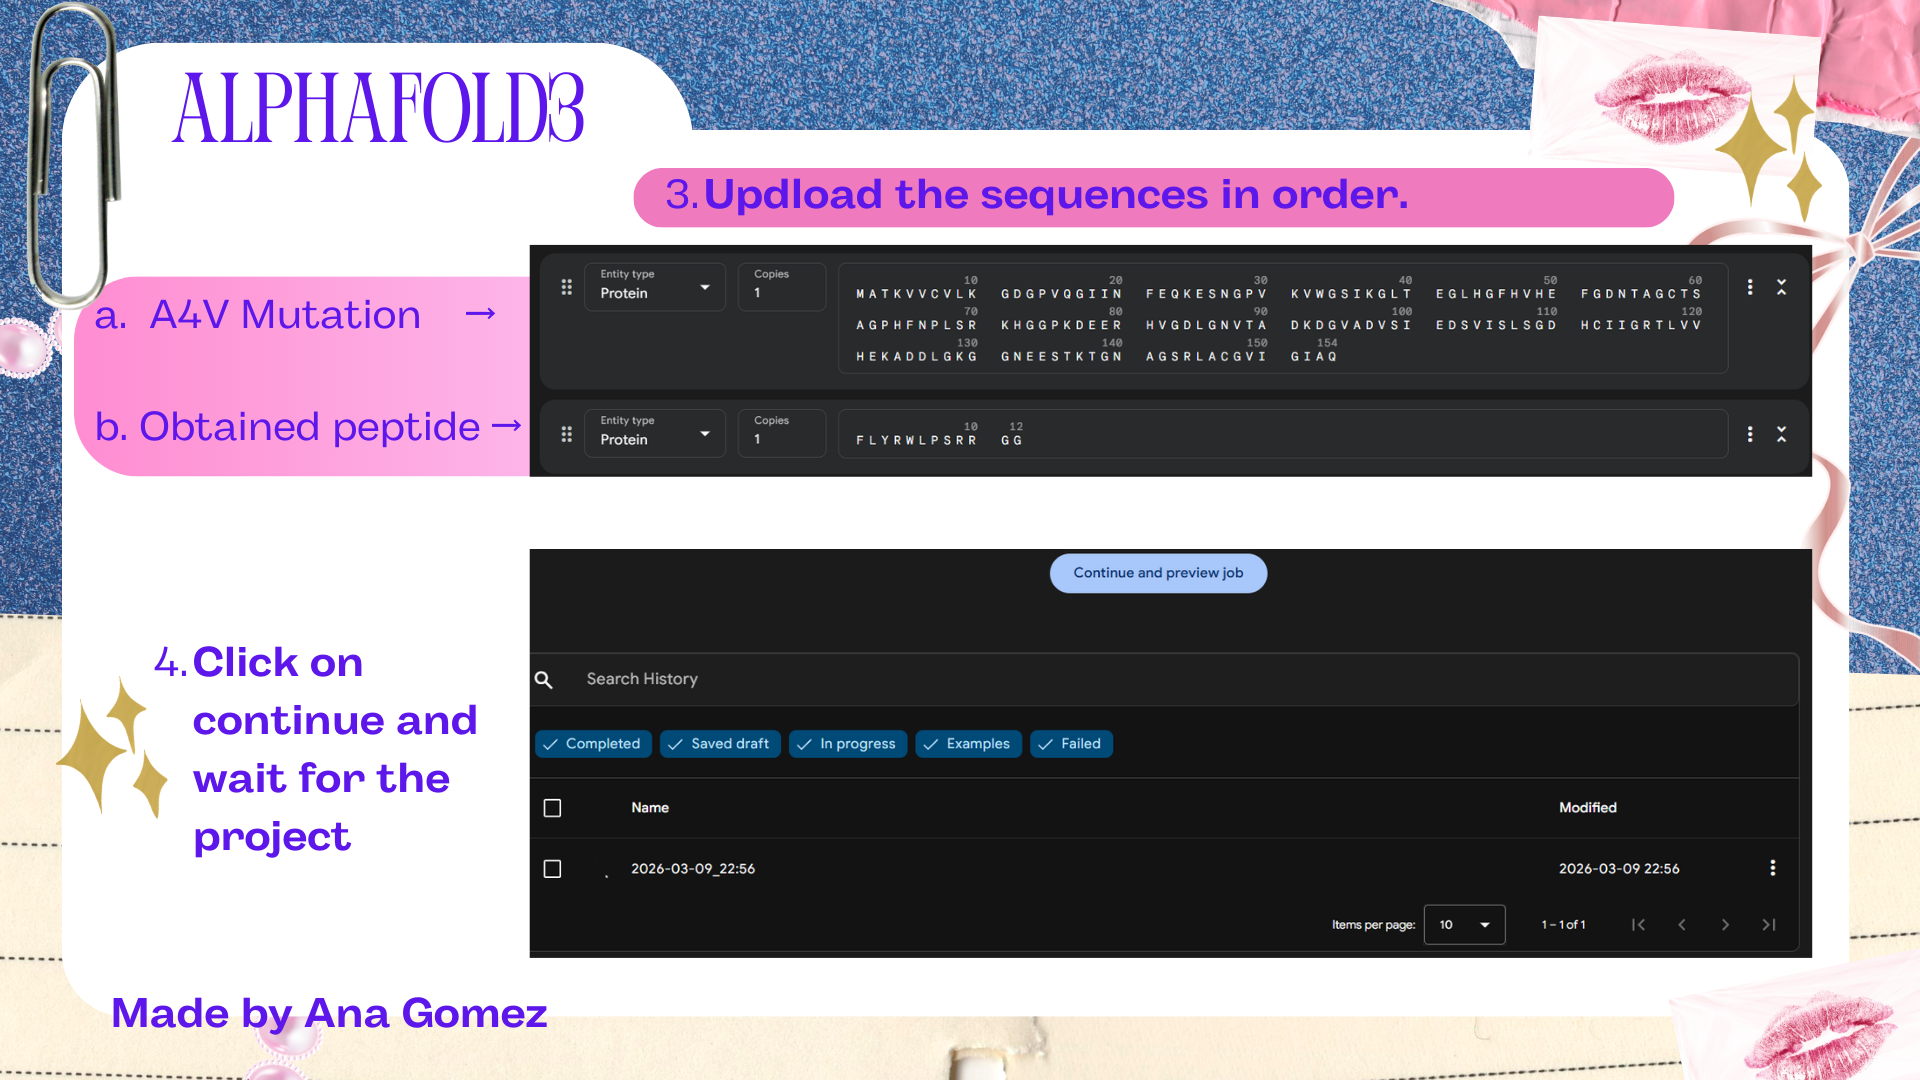
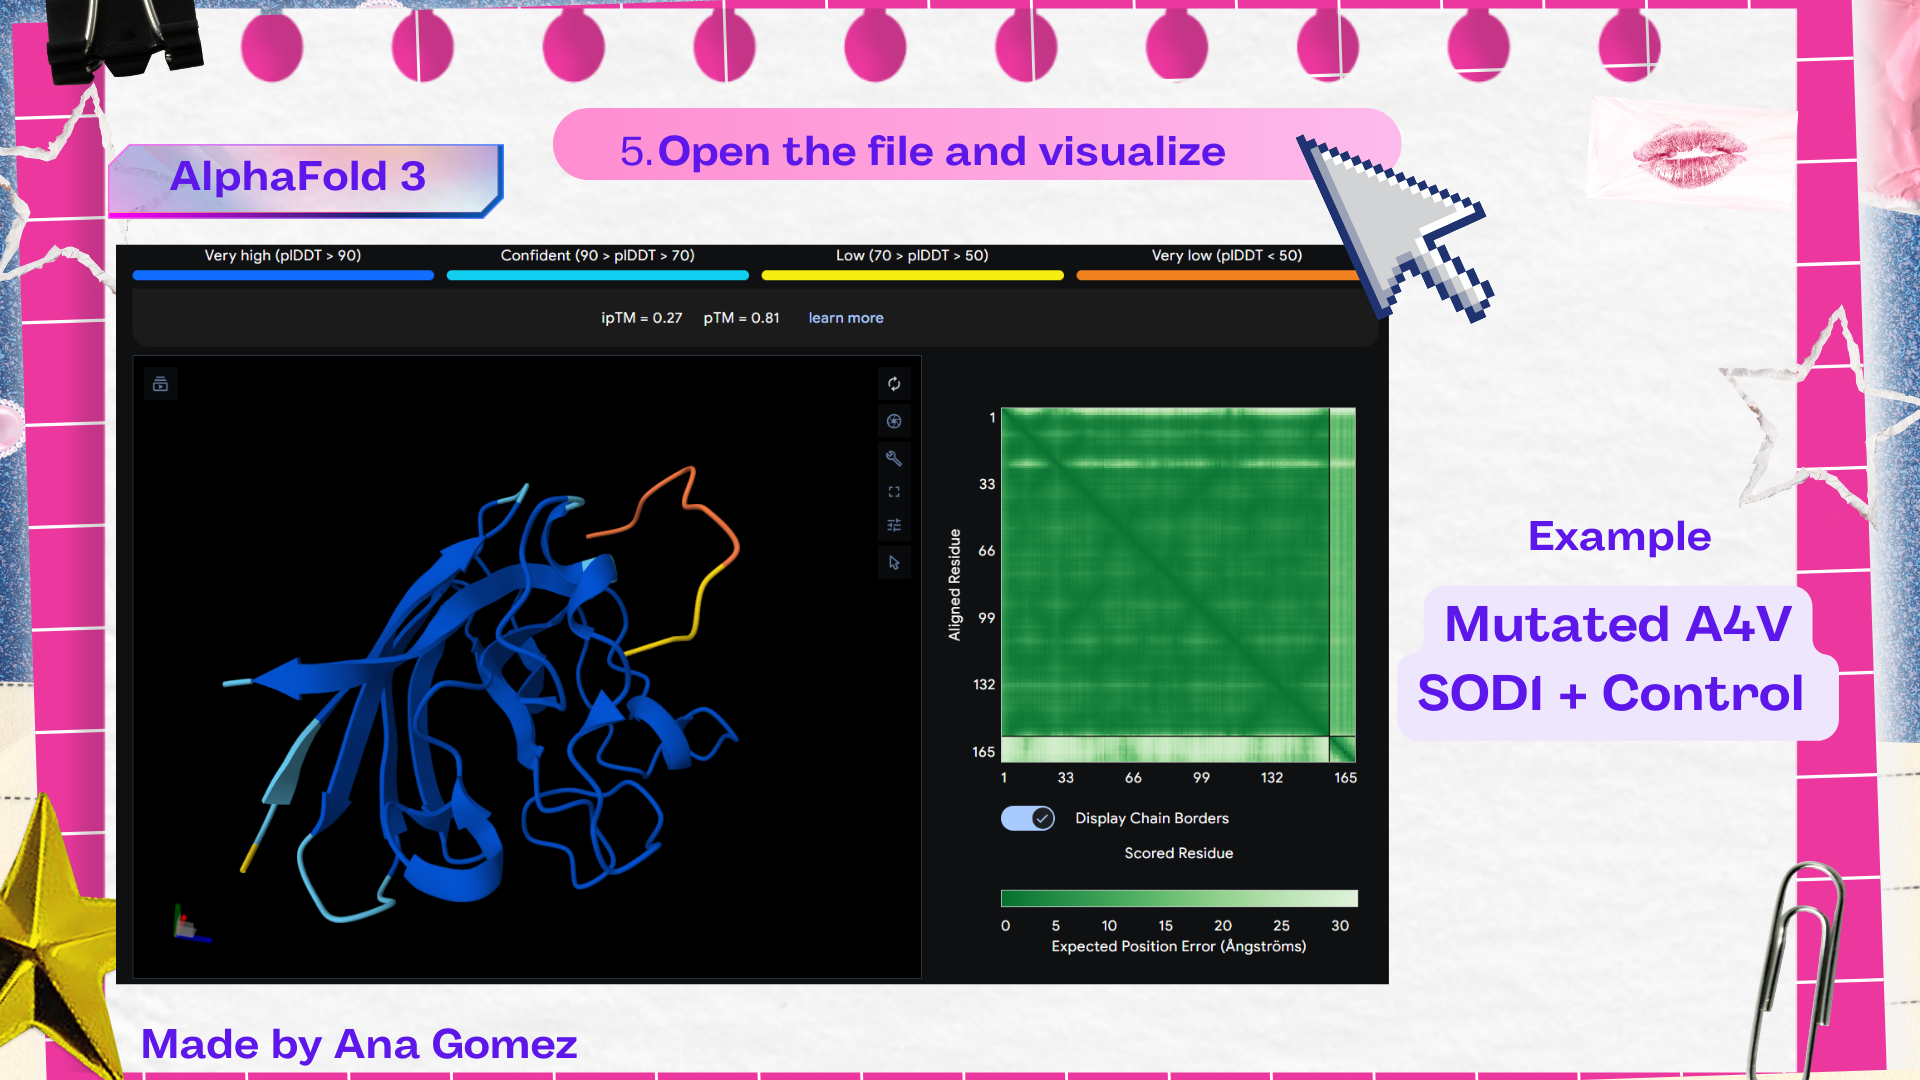
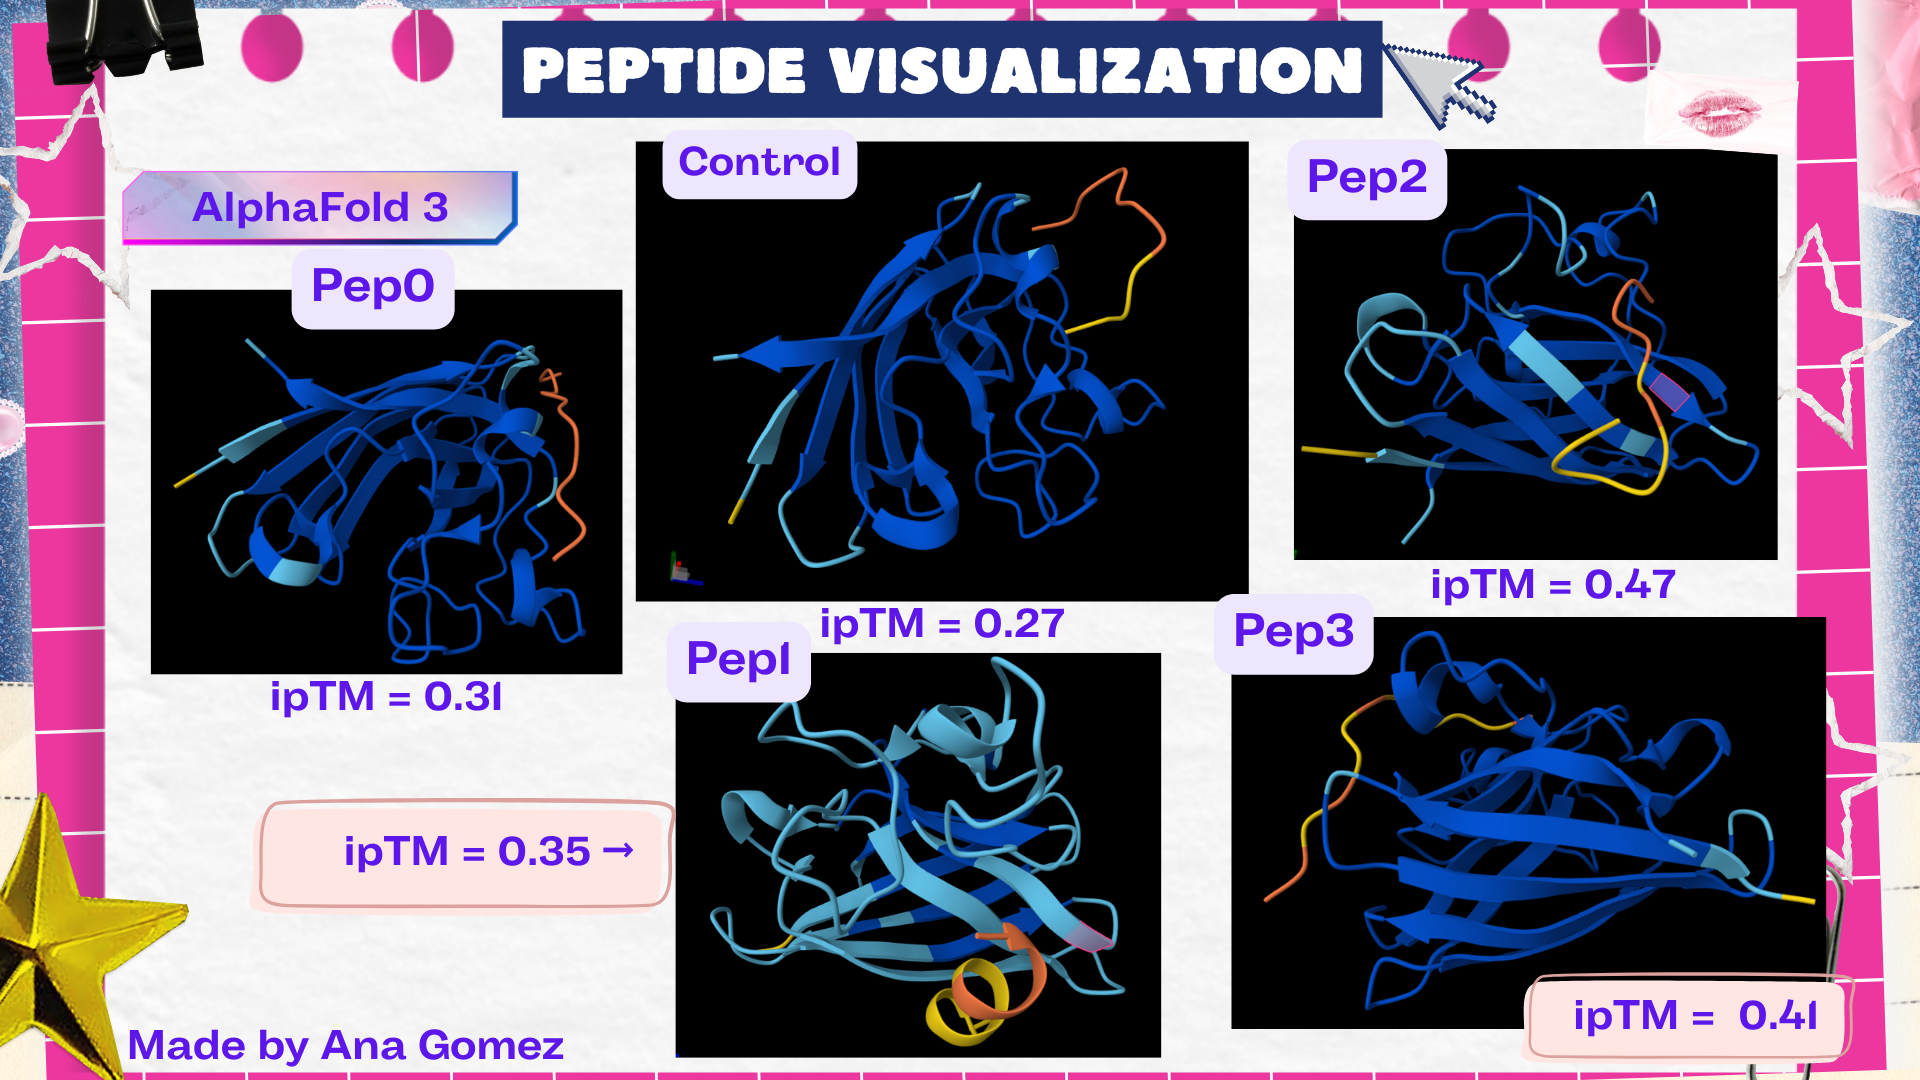
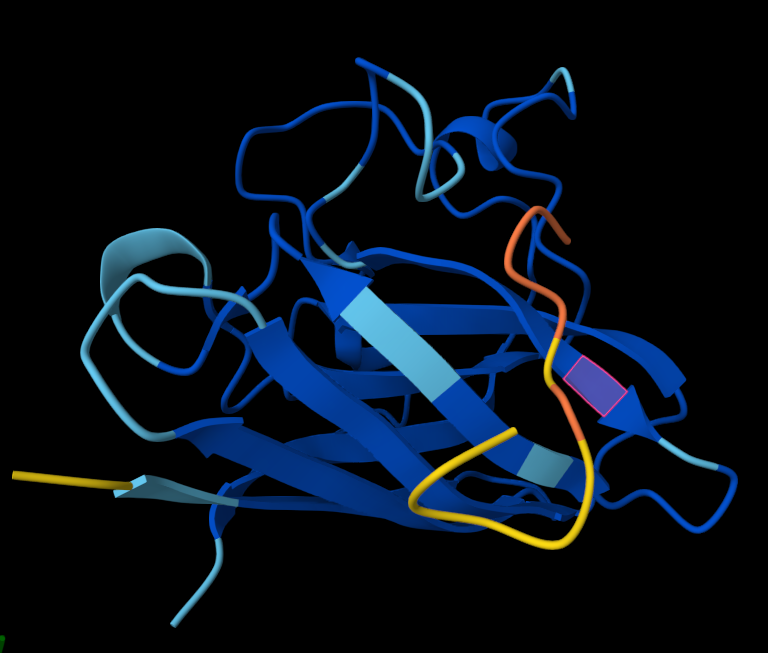
Week 5: Protein Design Part II Part A: SOD1 Binder Peptide Design (From Pranam): What I know about SOD1 and its mutation: (Berdyński et al., 2022) Mutations in SOD1 cause familial Amyotrophic Lateral Sclerosis (ALS) ALS is a heterogeneous, severe neurodegenerative disorder, the hallmark of which is an adult-onset loss of upper and lower motor neurons. It leads to a progressive paresis and atrophy of skeletal muscles, resulting in quadriplegia and fatal respiratory failure. The mutation subtly destabilizes the N-terminus, perturbs folding energetics, and promotes toxic aggregation. Challenge of this week: Design short peptides that bind mutant SOD1 & then decide which ones are worth advancing toward therapy.
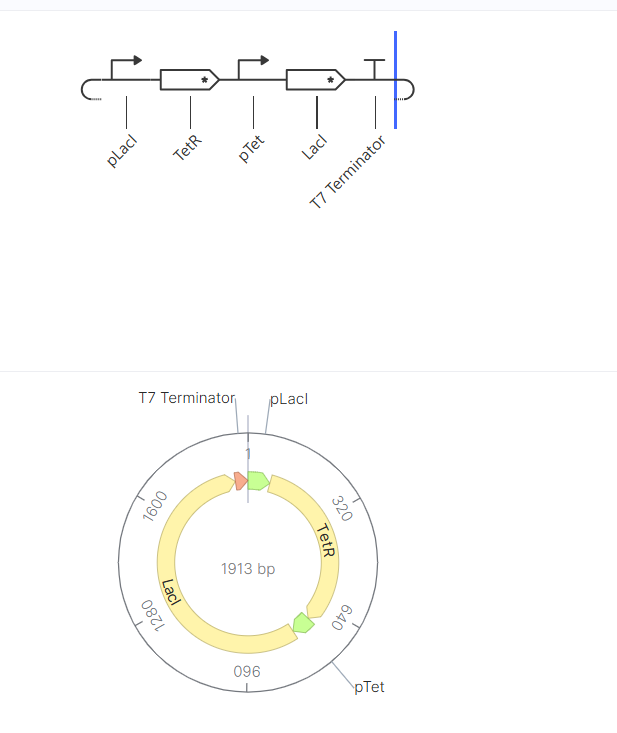
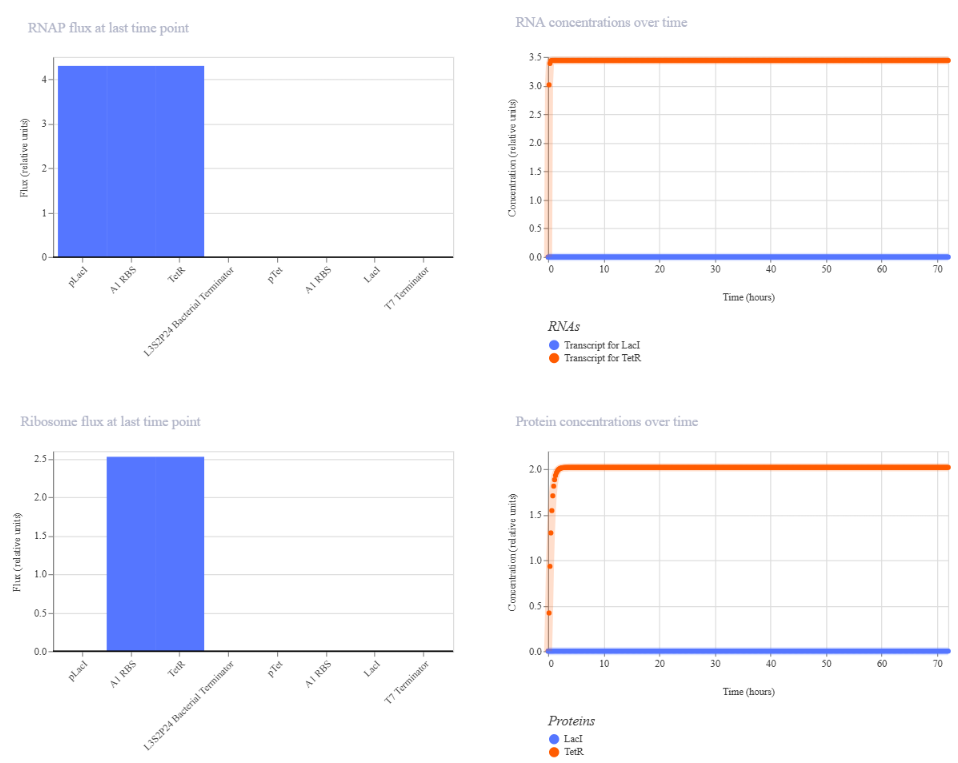
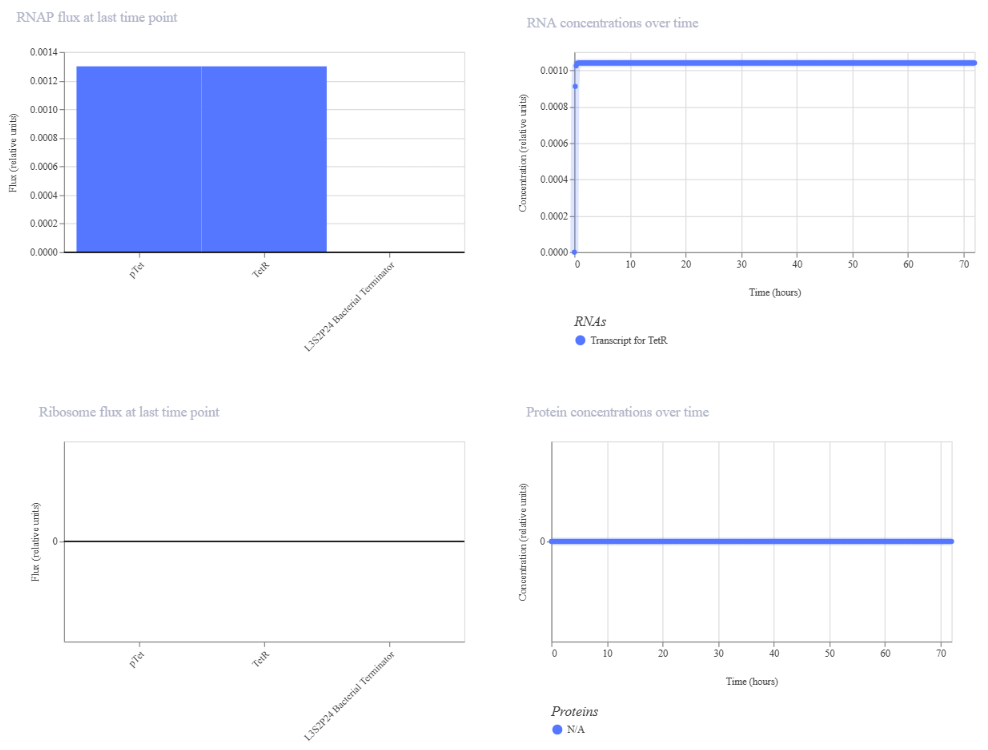
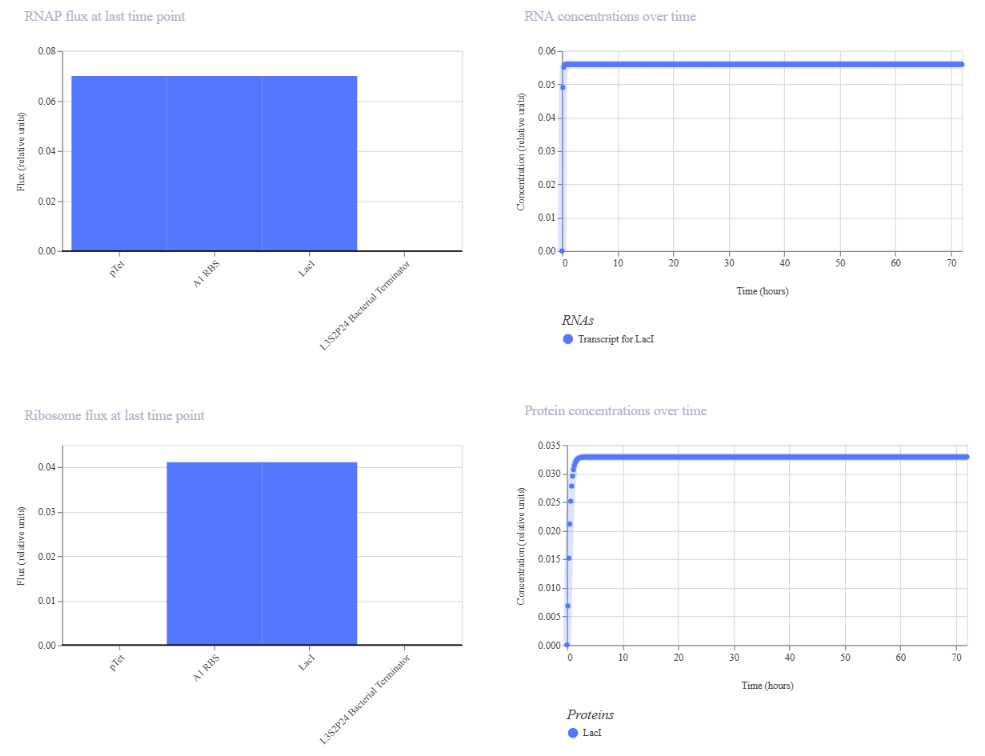
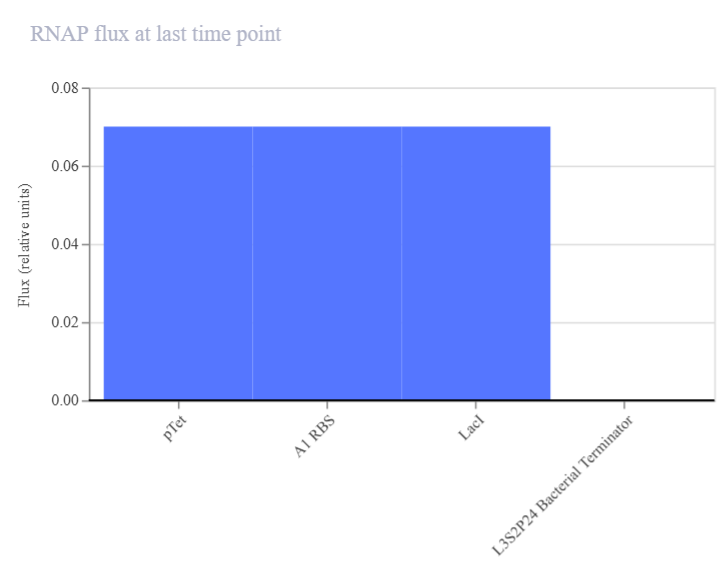
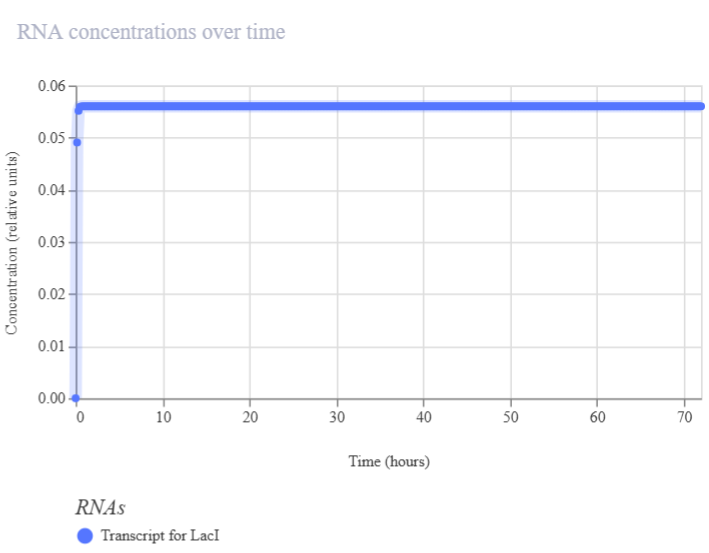
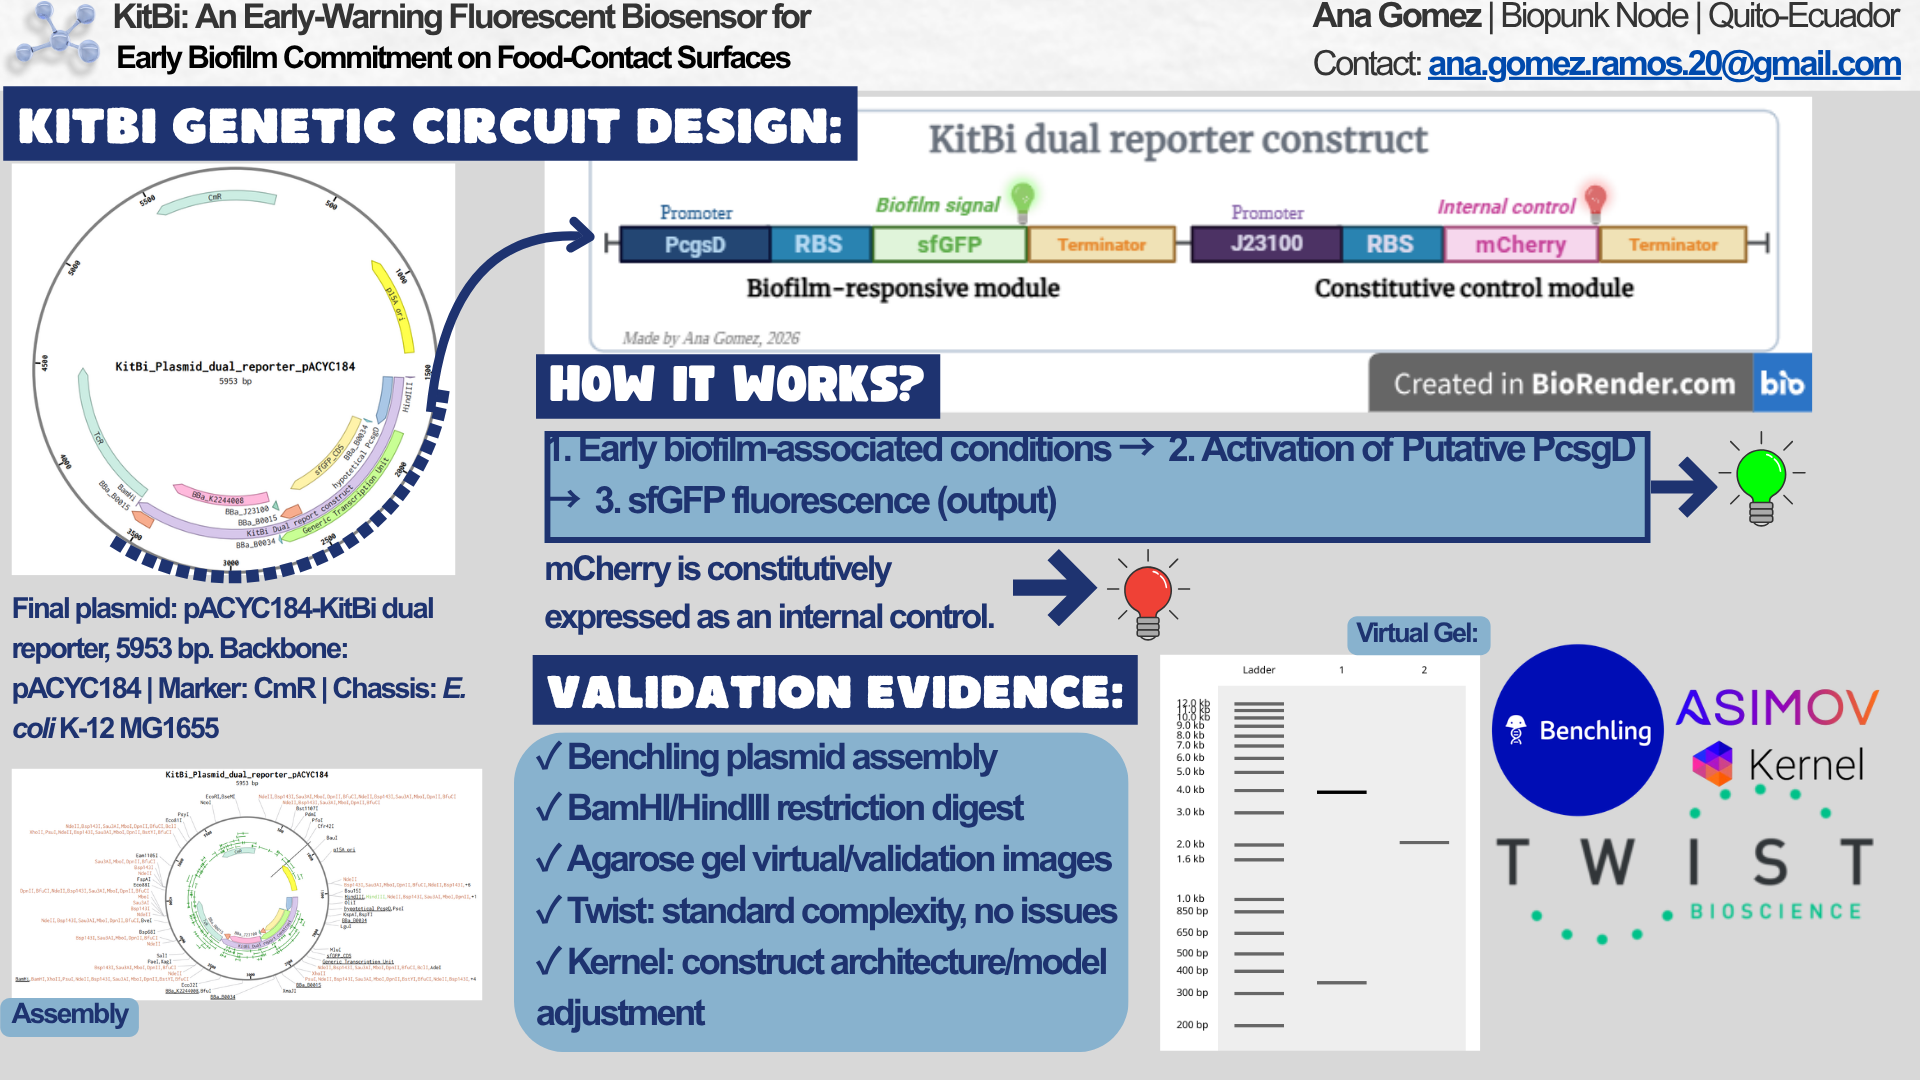
Genetic circuits part I: Assembly Technologies Note Part 1–> At Lab section: week 6
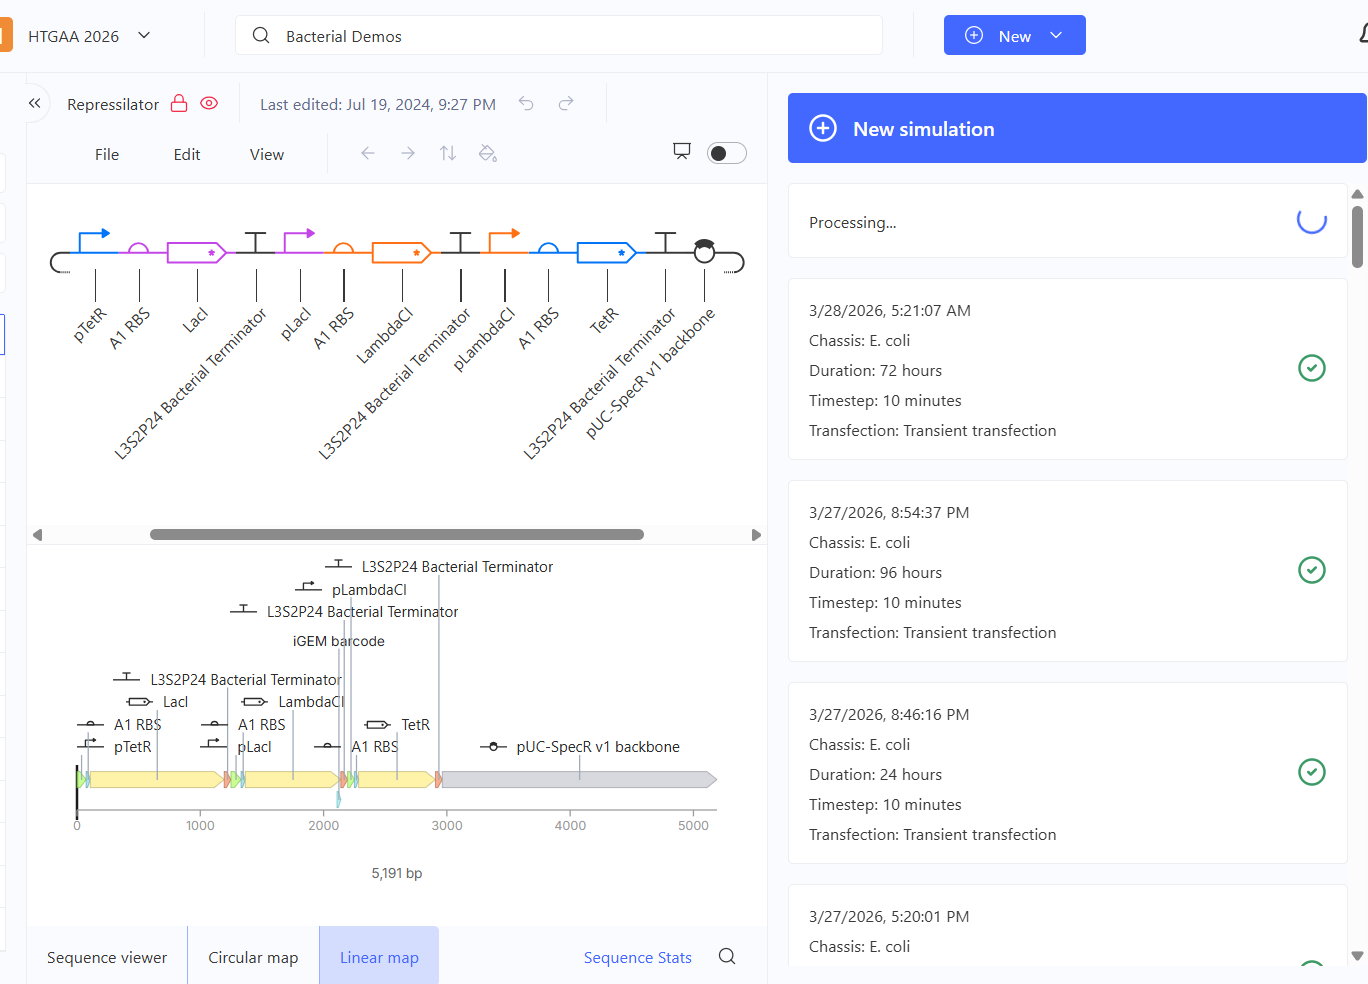
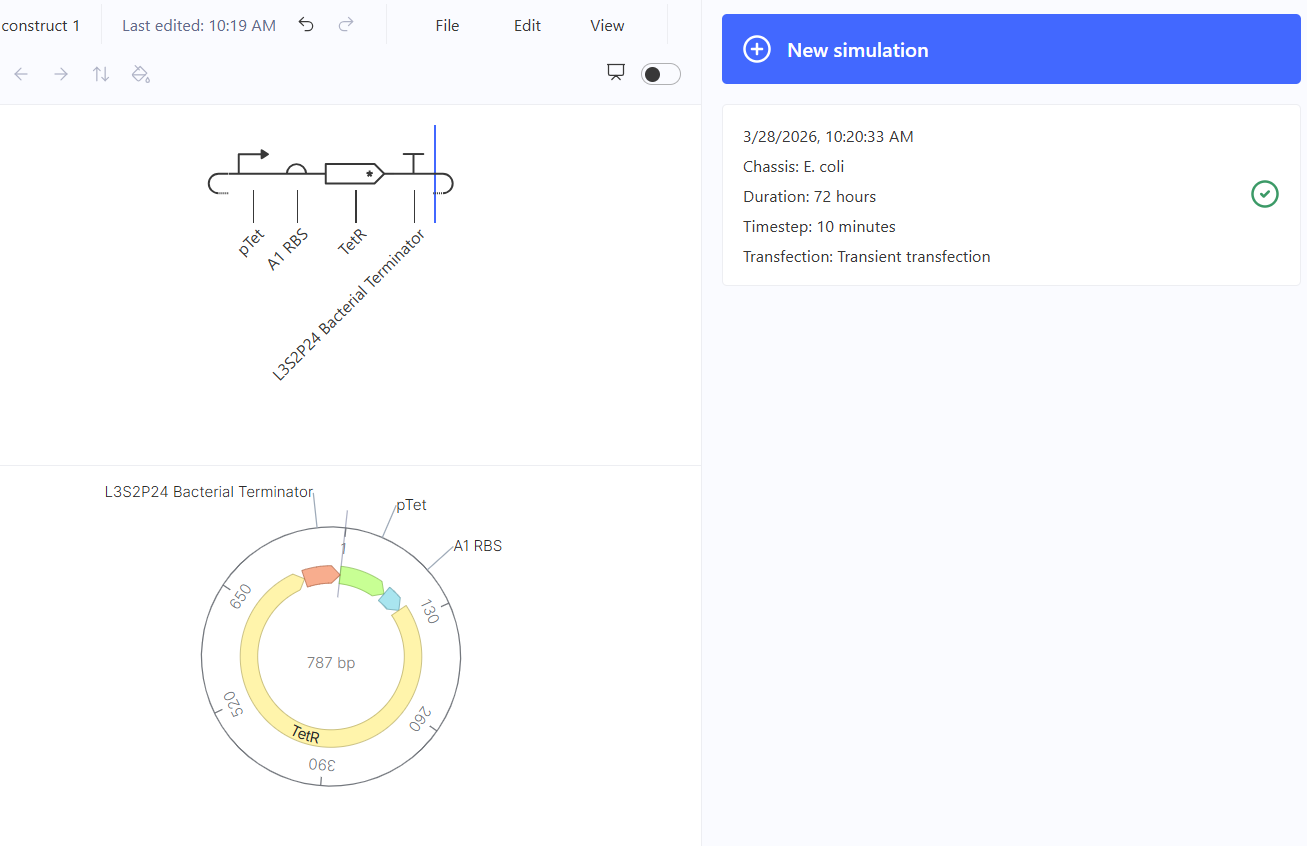
Part 2: Asimov Kernel Based on the exploration of the Bacterial Demos repository, genetic circuits were analyzed and simulated with the use of the Asimov Kernel platform.
Week 7 Part 1: Intracellular Artificial Neural Networks 1. Advantages of IANNs vs traditional genetic circuits Traditional genetic circuits usually behave like Boolean logic systems (ON/OFF), meaning they respond in discrete states (e.g., gene expressed or not). In contrast, IANNs offer several key advantages:
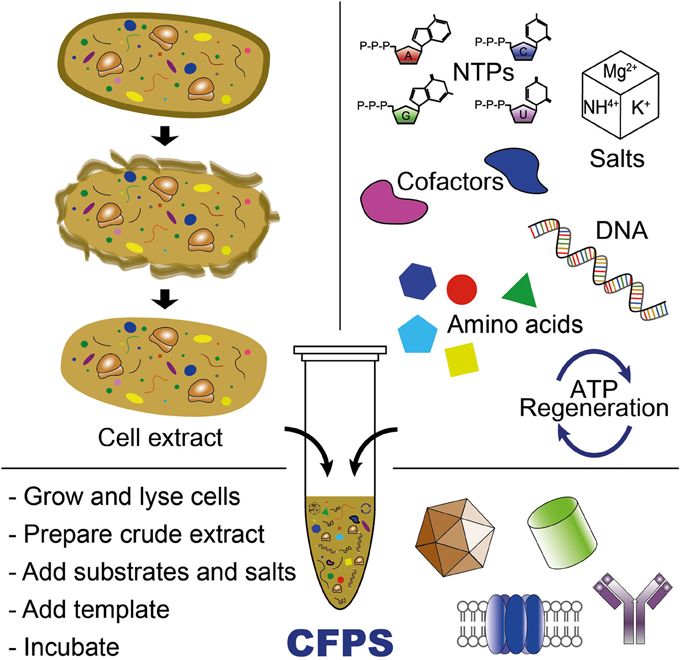
Week 9: Cell-Free systems! Part A: General and Lecturer-Specific Questions General questions: Explain the main advantages of cell-free protein synthesis over traditional in vivo methods, specifically in terms of flexibility and control over experimental variables. Name at least two cases where cell-free expression is more beneficial than cell production. Cell-free protein synthesis (CFPS) offers important advantages over traditional in vivo expression because it provides a more open, flexible, and controllable reaction environment. Since there is no living cell to maintain, the researcher can directly adjust variables such as ionic strength, pH, redox conditions, DNA template concentration, cofactors, chaperones, detergents, lipids, or energy substrates without worrying about cell viability. CFPS is also typically faster, allowing protein production in hours rather than requiring cell growth, transformation, and induction steps over longer periods. In addition, it facilitates rapid prototyping of constructs and reaction conditions (Garenne et al., 2021; Jewett et al., 2008).
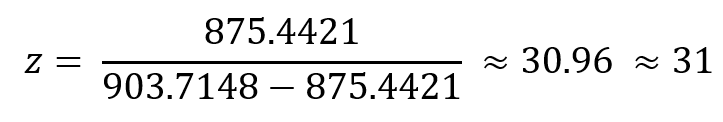
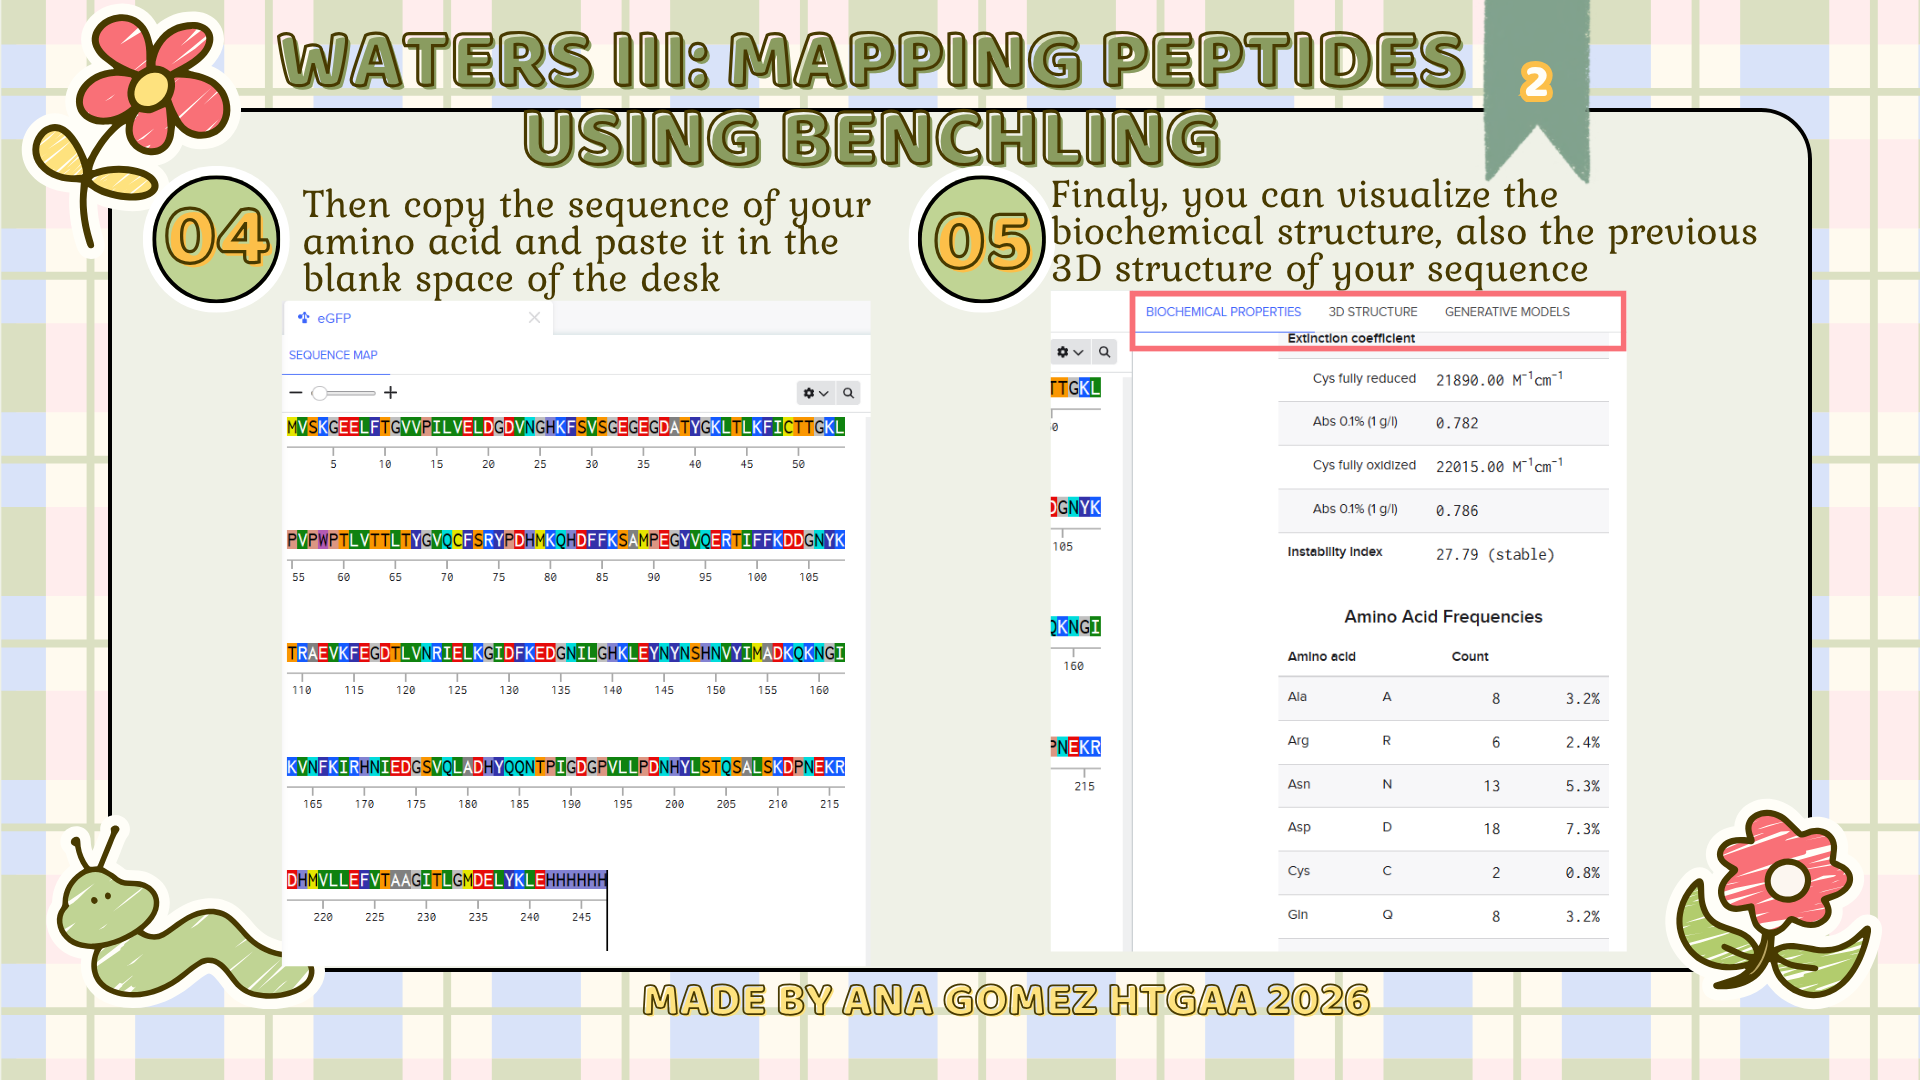
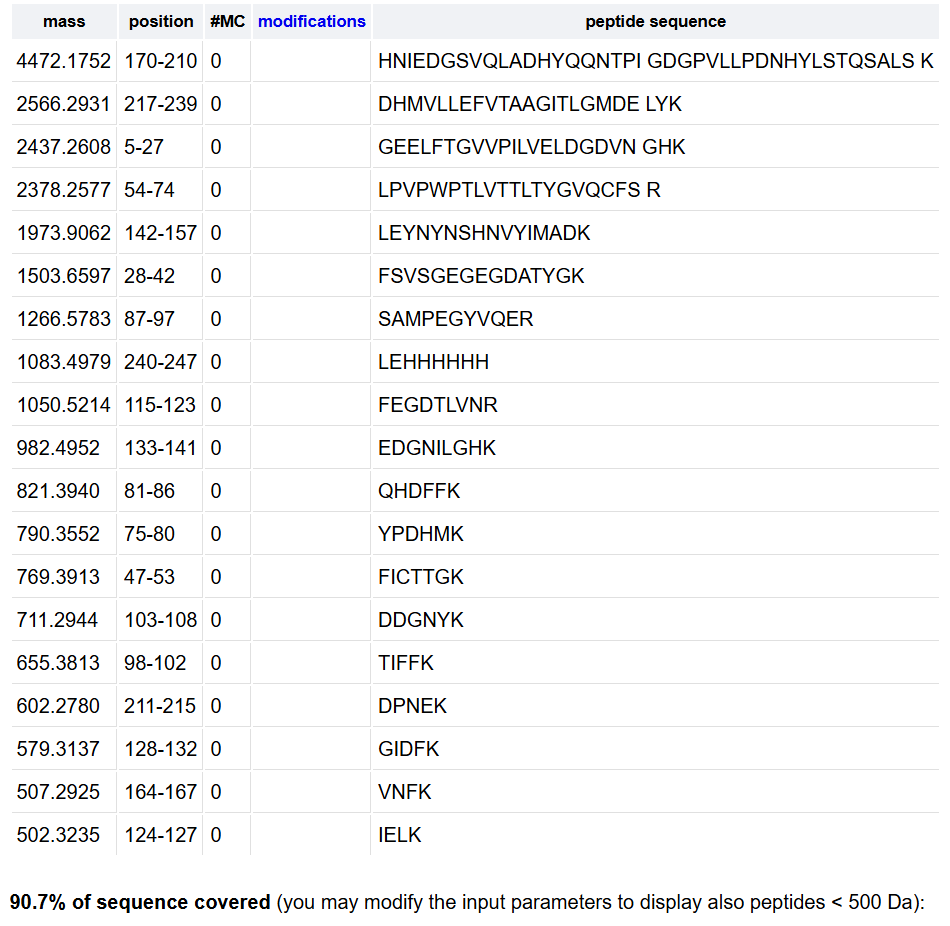
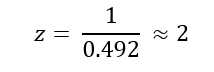
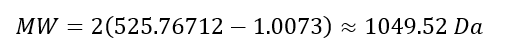
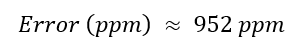
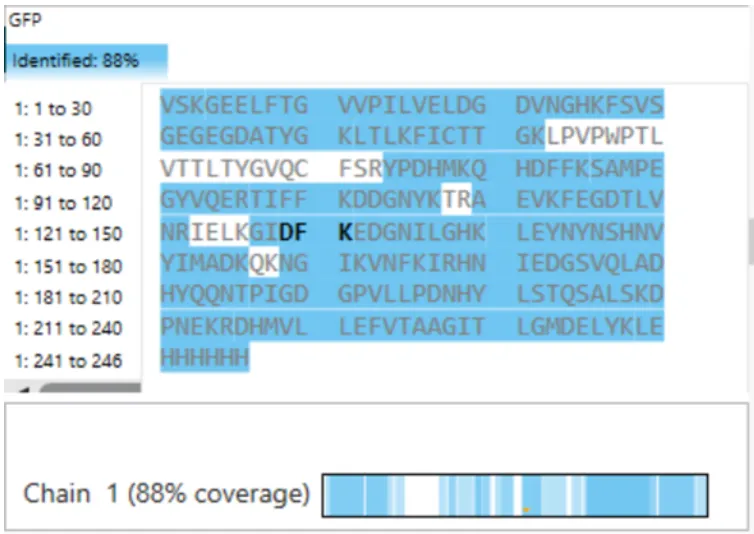
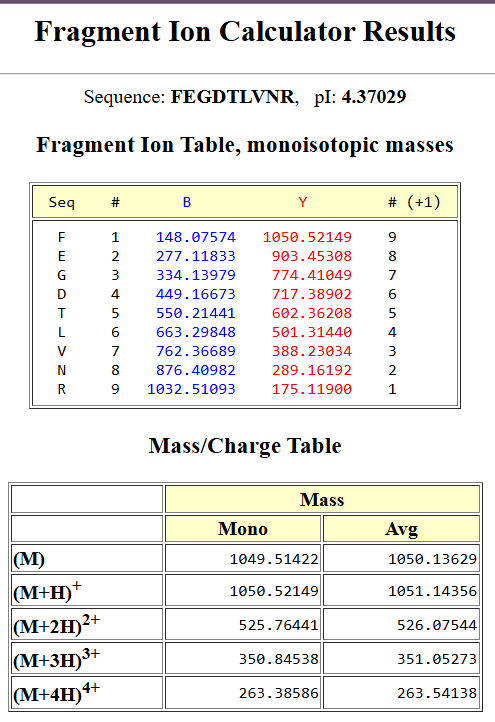
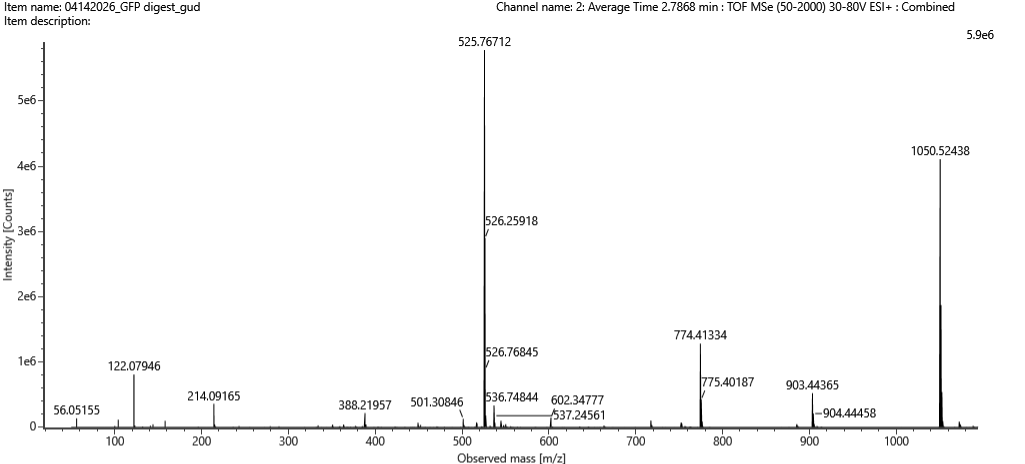
Week 10: Advanced Imaging & Measurement Technology Homework: Waters Part I — Molecular Weight Before calculation, I visited the webpage from Expasy https://web.expasy.org/compute_pi/ and copied the sequence I am working on:
eGFP sequence:
MVSKGEELFTG VVPILVELDG DVNGHKFSVS GEGEGDATYG KLTLKFICTT GKLPVPWPTL VTTLTYGVQC FSRYPDHMKQ HDFFKSAMPE GYVQERTIFF KDDGNYKTRA EVKFEGDTLV NRIELKGIDF KEDGNILGHK LEYNYNSHNV YIMADKQKNG IKVNFKIRHN IEDGSVQLAD HYQQNTPIGD GPVLLPDNHY LSTQSALSKD PNEKRDHMVL LEFVTAAGIT LGMDELYKLE HHHHHH Where it contains at the end His-purification tag with (HHHHH) and a linker (LE) previously.
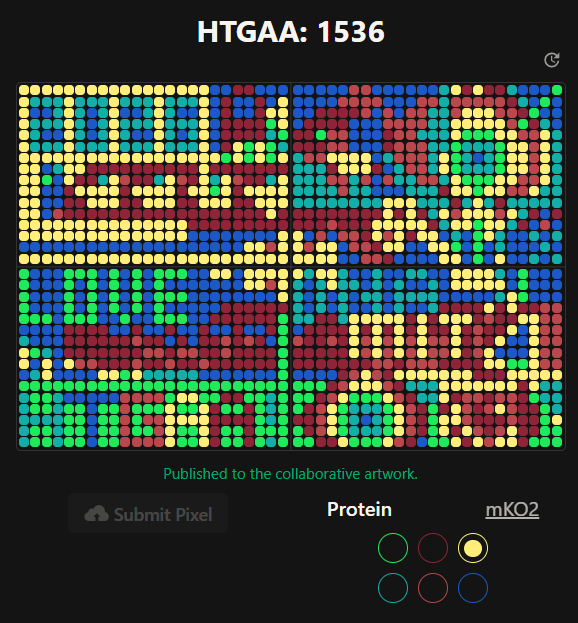
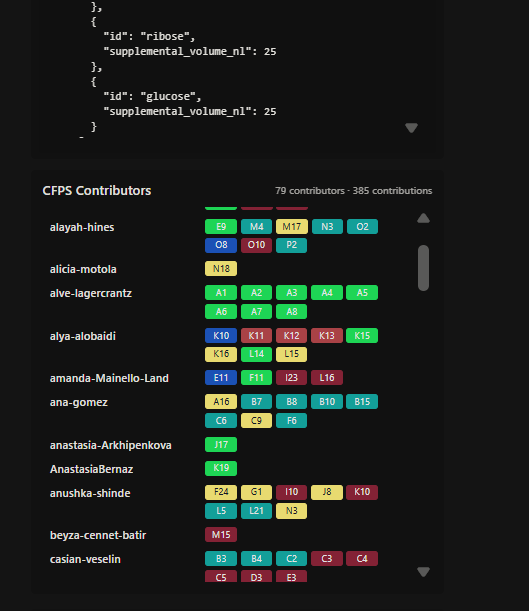
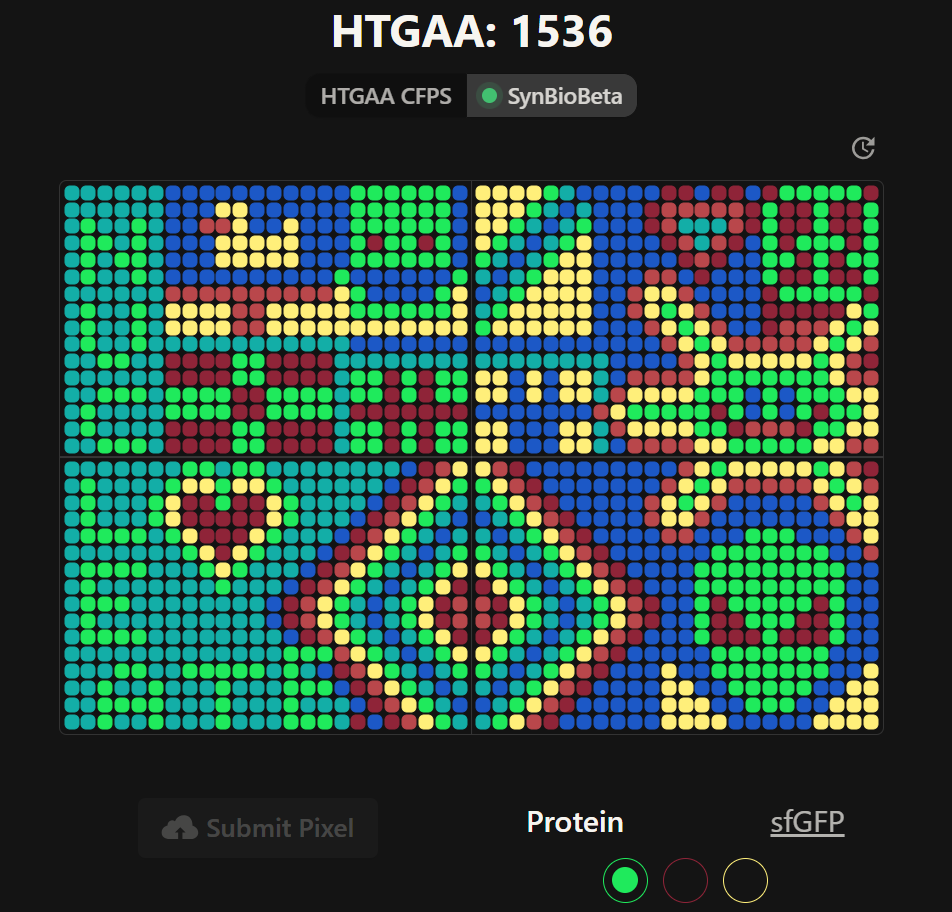
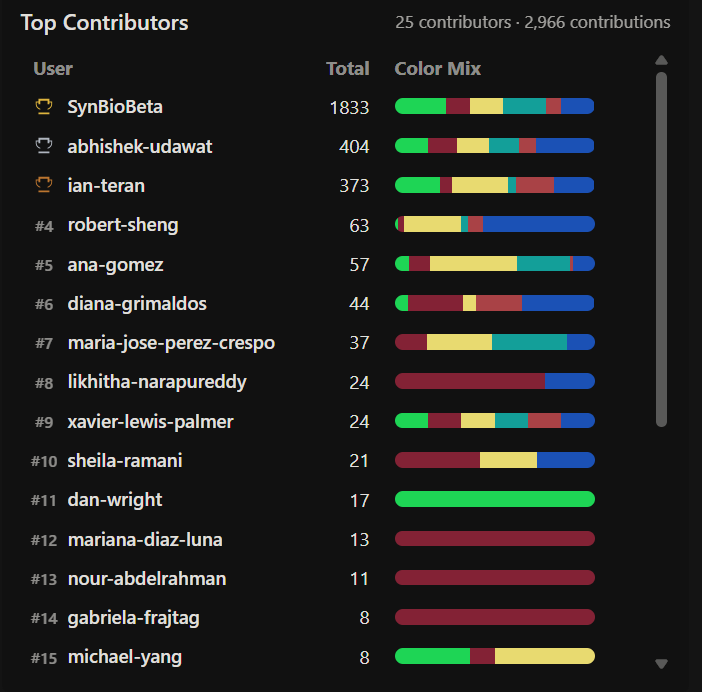
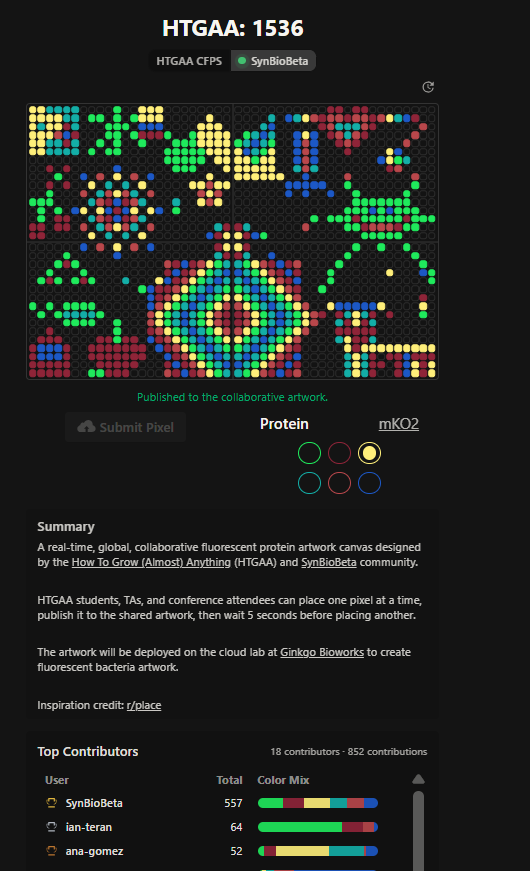
Week 11: Bulding Genomes Part A: The 1,536 Pixel Artwork Canvas | Collective Artwork Pixel Artwork Contributation: I was excited to participate in the HTGAA 2026 collaborative pixel artwork experiment. My main contribution was helping create part of the “2026” design on the left corner of the canvas, as well as contributing to the yellow and cyan giraffe section, the rainbow mandala near the center-bottom region, and a small Ecuadorian flag on the left side of the artwork showed on the Figures 1 and Figure 7. The collaborative work was on: https://rcdonovan.com
Lab Work! For this week, the content is in the Lab section– Click here to read: Week 12 Lab: Bioproduction of Beta-Carotene and Lycopene
Weekly Reflection! I liked understanding better how plasmid assembly actually works in practice, because before this, I only understood the theory behind restriction enzymes and cloning workflows
Bio design living Materials This week covers designing, programming, and fabricating engineered living materials — such as self-healing concretes, adaptive biofilms, and responsive biomaterials — by integrating genetic circuit design, materials science, and bioprocess engineering
Some thoughts about the lecture / Week This week made me realize that AI in biology is not only about predicting proteins or analyzing sequences, but also about understanding how scientists actually work in the lab. Small details like pipetting angle, bubbles, or viscosity can completely change experimental results.
Biofabrication! We wrap up the term looking towards a future of Bio-Design and Bio-Fabrication Some thoughts about the lecture / Last class of the semester (May 5) This final lecture felt less like a normal class and more like a reflection about where synthetic biology is heading in the future. I really liked how they connected biofabrication, AI, cloud labs, bioart, and even internet culture into the same conversation.
Subsections of Homework
Week 1 HW: Principles and Practices
Week 1: Principles & Practices- Class Assignment
First, describe a biological engineering application or tool you want to develop and why. This could be inspired by an idea for your HTGAA class project and/or something for which you are already doing in your research, or something you are just curious about.
Lactate Biosensor Tattoo for competition swimmers!
I propose developing a semi-permanent, waterproof biosensor tattoo that detects lactate levels in athletes during pool training. The system would rely on engineered biological circuits that respond to lactate and trigger a visible fluorescent or colorimetric signal, functioning as a traffic-light-style, semi-quantitative indicator of physiological stress.
The idea is connected to course topics such as genetic circuit design and fluorescent protein signaling. Lactate would act as the biological input, while the output would be a color change generated by chromoproteins or fluorescent reporters, similar to the chromophore and genetic circuit.
This tool doesn’t pretend to replace clinical blood tests or provide precise measurements. Instead, it will support athletic training by providing real-time visual feedback, reducing invasive blood sampling, and minimizing medical waste, such as needles and collection tubes.
This idea is inspired by my personal experience as a competitive swimmer, where lactate monitoring required repeated finger pricks during intense training sessions. I am particularly interested in exploring how biological sensing circuits and fluorescence-based outputs could be adapted to function under demanding conditions such as exercise, pool conditions, and temperature variation.
Biology pipeline of the application (circuit-inspired sensing)
Swimmer (physiological lactate production):
→ Input: Lactate diffusion into the tattoo microenvironment
→ Sensing module: Lactate-responsive biological circuit
→ Signal transduction: Activation of chromoprotein / fluorescent reporter
→ Output: Visual color scale (green/yellow/red)
Next, describe one or more governance/policy goals related to ensuring that this application or tool contributes to an “ethical” future, like ensuring non-malfeasance (preventing harm). Break big goals down into two or more specific sub-goals. Below is one example framework (developed in the context of synthetic genomics) you can choose to use or adapt, or you can develop your own. The example was developed to consider policy goals of ensuring safety and security, alongside other goals, like promoting constructive uses, but you could propose other goals for example, those relating to equity or autonomy.
Governance / Policy Goals:
For the present idea and to ensure that the lactate biosensor tattoo contributes to an ethical and responsible future, I propose the following governance goals:
Goal 1: Protect Athlete Health and Prevent Harm (Non-maleficence)
Sub-goals:
Make sure that biosensor results are clearly communicated as semi-quantitative training indicators, not medical diagnoses (do not replace the traditional lab test).
Prevent misinterpretation by athletes or coaches that could lead to overtraining or injury.
Ensure that biosensor tattoos are biocompatible, with non-toxic materials, and safe.
Required informed consent for younger athletes.
Goal 2: Prevent Environmental and Biological Risks
Sub-goals:
Avoid environmental release of engineered biological components by using encapsulated or cell-free sensing systems.
Ensure biodegradability or safe disposal of tattoo materials.
Follow Ecuadorian biosafety regulations regarding GMOs and synthetic biology applications.
Goal 3: Promote Equitable and Responsible Use
Sub-goals:
Acknowledge that early versions of the biosensor tattoo will likely be expensive and limited to pilot programs or elite training centers.
Explore pathways for future cost reduction through industrial scaling and partnerships with public institutions.
Encourage transparent communication about accessibility limitations during early deployment stages.
This goal particularly recognizes that initial implementations of the technology will likely be costly, requiring regulatory approval and industrial production to become broadly accessible.
Next, describe at least three different potential governance “actions” by considering the four aspects below (Purpose, Design, Assumptions, Risks of Failure & “Success”). Try to outline a mix of actions (e.g. a new requirement/rule, incentive, or technical strategy) pursued by different “actors” (e.g. academic researchers, companies, federal regulators, law enforcement, etc). Draw upon your existing knowledge and a little additional digging, and feel free to use analogies to other domains (e.g. 3D printing, drones, financial systems, etc.)
a. Purpose: What is done now and what changes are you proposing?
b. Design: What is needed to make it “work”? (including the actor(s) involved - who must opt-in, fund, approve, or implement, etc)
c. Assumptions: What could you have wrong (incorrect assumptions, uncertainties)?
d. Risks of Failure & “Success”: How might this fail, including any unintended consequences of the “success” of your proposed actions?
Governance Actions:
Before describing the governance actions, it is important to mention that the project is proposed as a pilot to be tested with competitive swimmers from Concentración Deportiva de Pichincha (Quito, Ecuador). The project is framed within local ethical, legal, and institutional constraints, particularly Ecuador’s restrictive regulations regarding genetically modified organisms (GMOs), and prioritizes athlete safety, non-malfeasance, and responsible innovation.
To guarantee that, the lactate biosensor tattoo contributes to an ethical and socially responsible future. I propose the following governance actions, involving a mix of technical, institutional, and regulatory approaches, and different actors
Action 1: Technical Safety-by-Design for a Non-Invasive Biosensor Tattoo:
Purpose: Currently, lactate monitoring in competitive swimming relies on repeated invasive blood sampling, which generates medical waste and causes discomfort to athletes. This action proposes a semi-quantitative, non-invasive biosensor tattoo as a complementary training tool that reduces harm while not replacing clinical diagnostics.
Design:
The biosensor is designed as a semi-permanent, waterproof tattoo that detects lactate accumulation and translates it into a visual color-scale output (green–yellow–red).
The biological sensing circuit is conceptually inspired by synthetic biology, which signals pathways but does not to release or replicate living organisms in the environment.
Design responsibilities would fall primarily on academic researchers, with oversight from institutional ethics committees and sports medicine professionals.
The visual output (chromoprotein or fluorescent reporter) is intentionally semi-quantitative, reducing the risk of overinterpretation.
Assumptions:
That lactate can be detected reliably through accessible physiological fluids without requiring invasive blood access as sweat.
That fluorescent or chromogenic reporters can remain stable under water exposure, physical stress, and temperature variation.
That athletes and coaches will correctly understand the limitations of the signal.
Risks of Failure & “Success”
Failure could occur if lactate detection is inaccurate or unstable, leading to misleading feedback.
A successful outcome could unintentionally encourage overreliance on the tool, even though it is not clinically precise; it would be a good suggestion on how swimmers manage the lactate during intense training.
To mitigate this, clear labeling and training would be required to frame the tattoo strictly as a training aid, not a diagnostic device.
Action 2: Institutional Oversight and Ethical Use in Sports Contexts
(Actors: Swimming National Federation (FENA), Ministerio del Deporte, etc)
Purpose: Currently, limited governance frameworks are addressing the ethical use of biosensors in athletic training, particularly in developing countries. This action aims to prevent misuse or surveillance of athletes through physiological monitoring technologies, while ensuring the protection of biometric data generated by the biosensor tattoo.
Design:
Implementation would require approval from national sports institutions (Federación Ecuatoriana de Natación, Ministerio del Deporte) and review by local bioethics committees.
Participation by athletes would be voluntary, with informed consent emphasizing data limits and privacy.
Data generated by the biosensor would be locally interpreted and not digitally transmitted, minimizing privacy risks.
Assumptions:
That sports institutions will prioritize athlete wellbeing over performance pressure.
Visual-only feedback reduces the risks of secondary data use or surveillance.
Athletes feel empowered to decline participation without negative consequences.
Risks of Failure & Success
Failure could happen if coaches or institutions pressure athletes to adopt the technology for performance surveillance, or if biosensor results are treated as substitutes for clinical laboratory testing.
Even in “success”, widespread adoption could normalize continuous biometric monitoring, raising concerns about autonomy and consent.
This highlights the need for explicit governance rules limiting use to training and research contexts.
Action 3: Regulatory Alignment with Ecuadorian Bioethics and Biosafety Frameworks(Actors: Ministerio de Salud (MSP), Agencia Nacional de Regulación, Control y Vigilancia Sanitaria (ARCSA), Corte Constitucional del Ecuador (Constitutional Court of Ecuador)- Constitution of 2008)
Purpose: Ecuador maintains strict constitutional and legal constraints on GMOs, and biotechnology advances medical devices. This action aims to ensure that the project remains compliant with national bioethical principles while enabling responsible research innovation.
Design:
The project is framed as a biosensing device, not a GMO deployment.
Any biological components would be designed to be non-replicative, contained, and biodegradable, avoiding environmental release.
Oversight would involve academic institutions, national ethics frameworks (MSP, ARCSA, and Constitution of Ecuador-2008), and alignment with international guidance (WHO biosafety principles).
Assumptions:
That conceptual designs inspired by synthetic biology can be ethically discussed and evaluated at a governance level without requiring immediate deployment of genetically modified organisms (GMOs), particularly when the proposed application relies on non-living or enzyme-based sensing components.
Ecuadorian bioethics and regulatory frameworks can support the development of a highly controlled, small-scale pilot project for a biosensor intended for athletic training, after a long-term rigorous regulatory process, safety validation, and ethical review in coordination with national institutions such as MSP & ARSCA.
Risks of Failure & Success
Regulatory ambiguity could slow or prevent approval even at the pilot level.
Conversely, “success” could provoke future pressure to commercialize without sufficient regulatory adaptation.
This underscores the importance of early governance discussions, even for speculative designs.
Next, score (from 1-3 with, 1 as the best, or n/a) each of your governance actions against your rubric of policy goals. The following is one framework but feel free to make your own:
Last, drawing upon this scoring, describe which governance option, or combination of options, you would prioritize, and why. Outline any trade-offs you considered as well as assumptions and uncertainties. For this, you can choose one or more relevant audiences for your recommendation, which could range from the very local (e.g. to MIT leadership or Cambridge Mayoral Office) to the national (e.g. to President Biden or the head of a Federal Agency) to the international (e.g. to the United Nations Office of the Secretary-General, or the leadership of a multinational firm or industry consortia). These could also be one of the “actor” groups in your matrix.
Prioritized Governance Approach:
Based on the scoring in Table 1, the most effective governance strategy for this project is a combination of Action 1 (Technical Safety-by-Design for a Non-Invasive Biosensor Tattoo) and Action 2 (Institutional Oversight and Ethical Use in Sports Contexts).
Action 1: It’s prioritized because it directly protects athlete health and environmental safety by embedding biocompatibility, containment, and safe disposal into the technical design of the biosensor tattoo. This approach minimizes physical harm and reduces reliance on invasive lactate testing while remaining feasible within the Ecuadorian research context, where early-stage pilot projects must demonstrate safety before scaling.
Action 2: This is prioritized too by addressing ethical risks related to data misuse. Institutional oversight through sports federations and bioethics committees ensures informed consent, limits performance surveillance, and protects athlete autonomy. This is particularly important in elite sports environments, where power imbalances between athletes and institutions may exist.
For action 3 is not that prioritized in the early stage of the project, even though, in the long term, it remains relevant for future scaling once safety, ethical use, and institutional trust are established.
This combined approach is recommended primarily for local sports institutions and research actors in Ecuador, such as the Federación Ecuatoriana de Natación (FENA) and Ministerio del Deporte, balancing innovation with athlete protection under existing bioethical and regulatory frameworks. Also, by the supported international academic collaboration. Key uncertainties include institutional commitment and the long-term performance of the biosensor under real training conditions.
Reflection section.-
Reflecting on what you learned and did in class this week, outline any ethical concerns that arose, especially any that were new to you. Then propose any governance actions you think might be appropriate to address those issues. This should be included on your class page for this week.
This first week made me reflect on how biology is not only a technical field but also deeply connected to ethics, society, and human experience. Although I already had a background in bioethics and biosafety from my undergraduate studies (mostly focused on GMOs, plant biotechnology, and laboratory practices), this class helped me think about ethics in a broader context, especially for emerging technologies such as biosensors, where regulatory frameworks are not always clearly defined, particularly in developed countries like Ecuador.
One concern I realized is that for projects like this, it is sometimes unclear which national institutions should regulate them, especially when they fall between biomedical devices and sports technology. This highlighted the importance of having clear governance pathways and interdisciplinary oversight.
To address this concern, I believe governance actions such as institutional bioethics review, informed consent, and collaboration between sports organizations and academic researchers are essential, especially during early pilot stages. These steps can help ensure that innovation remains centered on wellbeing, responsibility, and trust.
What I also appreciated greatly about this week’s classes was the diversity of student backgrounds. There were not only scientists, but also economists, artists, psychologists, and others. It was inspiring to see how different perspectives came together around biology and innovation, reminding me that responsible science benefits from interdisciplinary thinking.
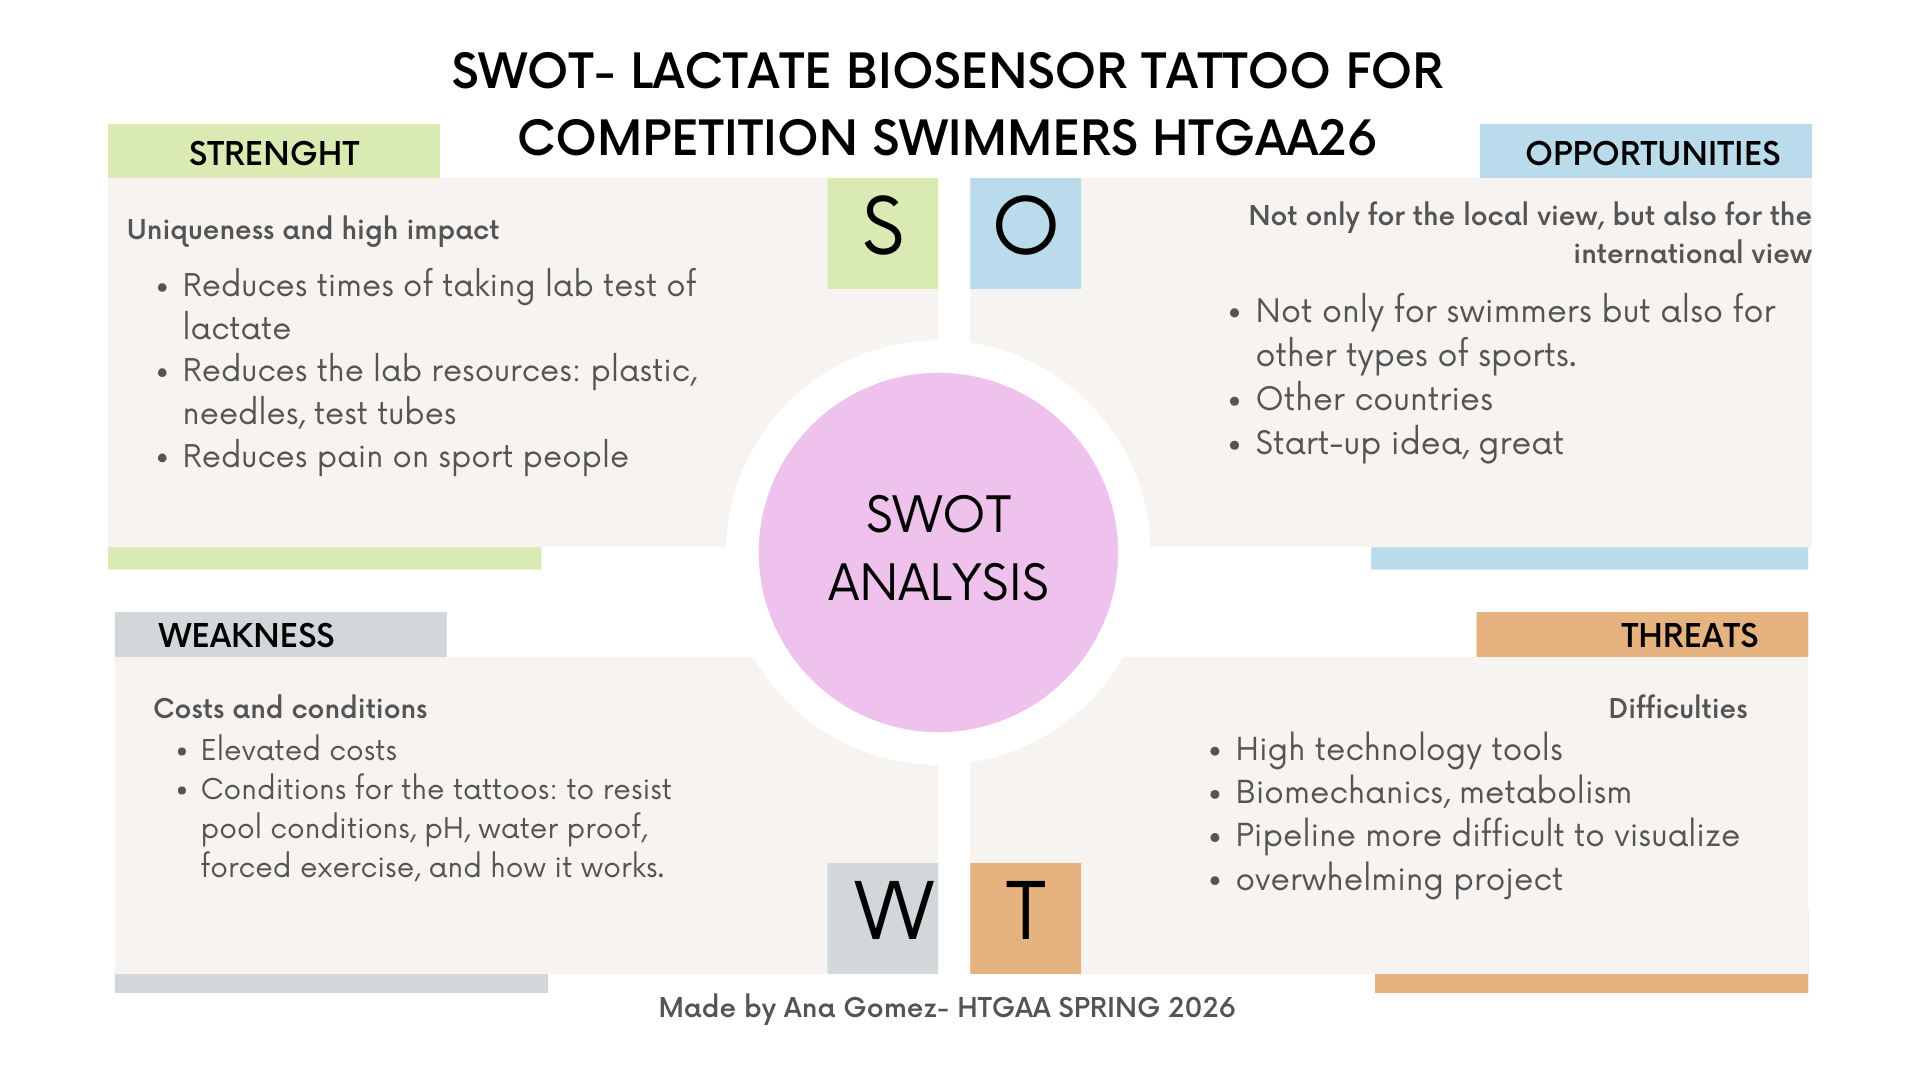
This assignment was challenging for me at first. I began with many ideas and felt overwhelmed thinking about everything that could go wrong. Eventually, I grounded my project in my personal experience as a competitive swimmer and realized that even conceptual ideas can have real-world relevance. One thing that helped me a lot was creating the SWOT analysis, which helped me visualize both the potential and the limitations of my proposal.
Thanks for reading, for pre-lecture part, please read week 2- homework section. For more information, you can access my notion in week 1 homework:
In preparation for Week 2’s lecture on “DNA Read, Write, and Edit," please review these materials:
Lecture 2 slides as posted below.
The associated papers that are referenced in those slides.
In addition, answer these questions in each faculty member’s section:
Homework Questions from Professor Jacobson:
Nature’s machinery for copying DNA is called polymerase. What is the error rate of polymerase? How does this compare to the length of the human genome. How does biology deal with that discrepancy?
The biological machinery of copying DNA (polymerase) has an error rate of approximately 1 mistake per 10⁶ bases during replication when proofreading is active. (slide 8). This error is a variation based on the error rate, from 103 to 108. Compared to the length of the human genome, which is about 3.2 billion base pairs (≈3.2 × 10⁹ bp). This means that even with this high fidelity, thousands of errors could theoretically occur each time a genome is copied. (slide 10).
Biology addresses this discrepancy through multiple layers of error correction, including:
Post-replication mismatch repair systems (such as MutS-based repair). (slide 14)
Polymerase proofreading via 3′–5′ exonuclease activity.
Additional cellular DNA repair pathways.
These mechanisms dramatically reduce the effective mutation rate, allowing organisms to maintain genomic stability despite the enormous size of their genomes.
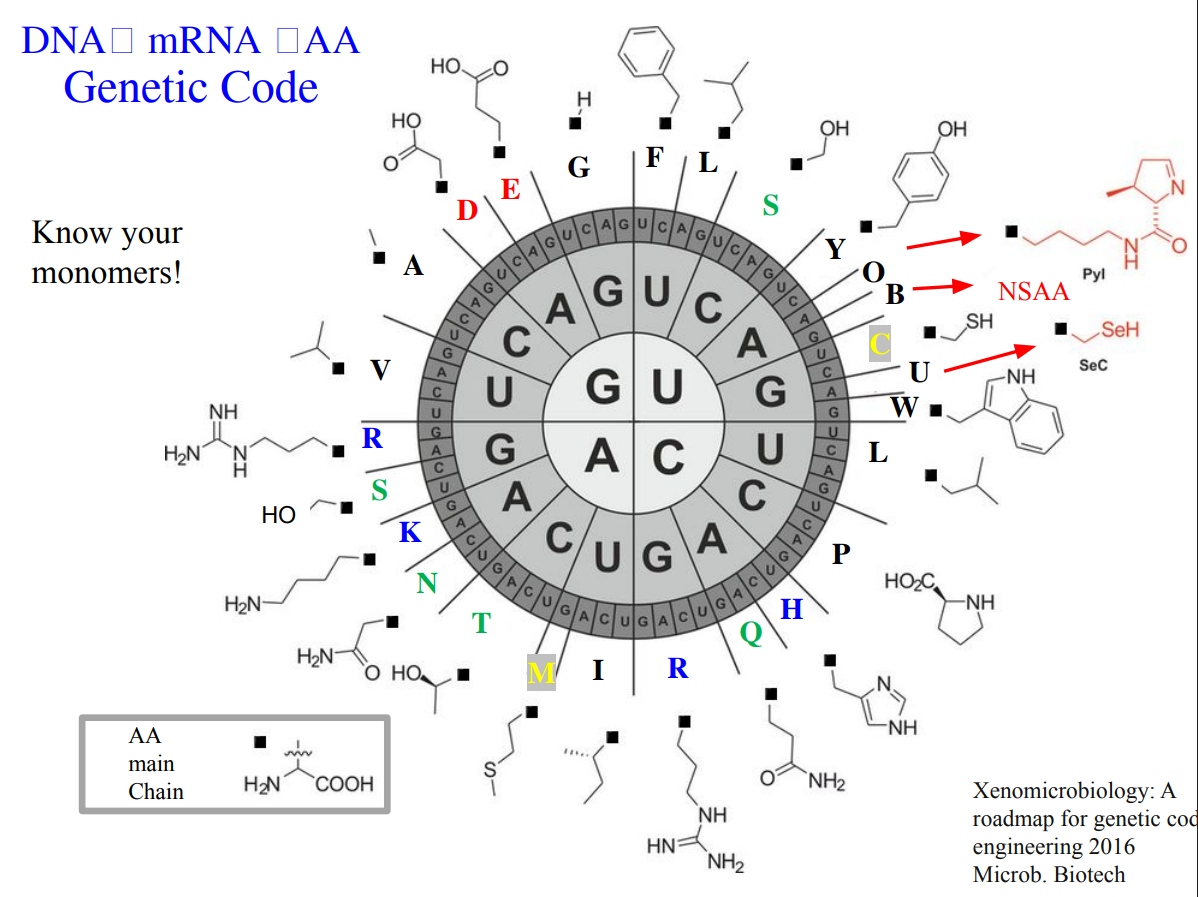
How many different ways are there to code (DNA nucleotide code) for an average human protein? In practice what are some of the reasons that all of these different codes don’t work to code for the protein of interest?
An average human protein requires approximately 1036 base pairs of DNA. (slide 6). It’s because the genetic code is degenerate. The majority of amino acids are encoded by multiple codons, which theoretically encode the same protein. However, in practice, not all of these sequences work well. Some reasons are:
Codon predominance: cells prefer certain codons over others, affecting translation efficiency. (slide 34)
GC content: extreme GC or AT richness can cause instability or poor expression. (slide 39)
Secondary DNA/RNA structures: some sequences fold in ways that interfere with transcription or translation.
These constraints mean that although many DNA sequences could encode the same protein, only a small subset is biologically practical and manufacturable.
Homework Questions from Dr. LeProust:
What’s the most commonly used method for oligo synthesis currently?
The most widely used method today is solid-phase phosphoramidite chemical synthesis, which was originally developed by Caruthers. (slide 10-11). In this approach, nucleotides are added one by one on a solid support through repeated cycles of coupling, capping, oxidation, and deprotection. This is the standard chemistry behind modern automated DNA synthesizers and high-throughput platforms, as reviewed on slides.
Why is it difficult to make oligos longer than 200nt via direct synthesis?
Because each nucleotide addition is imperfect. Even with very high coupling efficiencies, small errors accumulate with every cycle in PCR. As length increases, the fraction of full-length, error-free molecules drops sharply. You also get more truncated products and substitutions, making purification harder and lowering overall yield. Practically, this limits reliable direct synthesis to ~150–200 nucleotides. (slides 36-39)
Why can’t you make a 2000bp gene via direct oligo synthesis?
Because of the numbers of steps, if there is a 2000bp gene, the synthesis will take around 2000 steps. And at that scale, it’s probably to appear more chemical errors, full-length products become extremely rare, and the purity of the product will collapse. (slides 25-29).
To avoid synthesizing long genes directly, the standard strategy is: Use shorter bp (60-200nt) → assemble them enzymatically (PCR or gene assembly) → verify the final gene.
In result, the assembly reduces error and makes long genes.
Homework Question from George Church:
[Using Google & Prof. Church’s slide #4] What are the 10 essential amino acids in all animals and how does this affect your view of the “Lysine Contingency”?
Essential aminoacid in animals
Isoleucine, 2. Leucine, 3. Lysine, 4. Histidine, 5. Methionine, 6. Threonine, 7. Valine, 8. Arginine, 9. Tryptophan, 10. Phenylalanine
Those amino acids are considered essential because animals cannot synthesize them de novo and must obtain them from dietary sources.
Usually, lysine is limited in plant-based diets and many agricultural feeds. So, lysine contingency highlights how biological systems, including humans and livestock, depend heavily on external lysine availability for protein synthesis, growth, and health. Because lysine cannot be synthesized by animals, entire food chains rely on microorganisms and plants capable of producing it.
In conclusion of 3 prelecture activities, those changed my view of genetic coding as not only an informational system but also an ecological dependency network. As well, to understand the limitations and how technology advances for creating solutions and continue researching.
Thanks for reading. For more information, there is my Notion webpage with the homework Notion prelecture week 2
Subsections of Week 2 HW: DNA Read, Write, and Edit
W2: Assignment
Week 2: Dna-read-write-and-edit Assignment
Part 0: Basics of Gel Electrophoresis:
Documentation:
Make sure to document every step of the in-silico and lab experiments. Make sketches, screenshots, notes, drawings… anything that helps you - and others - understand the experiment. Your documentation should help you - and others - to understand the topic. Don’t be afraid to add things that don’t work. Show your failures - and how you overcame them. Your Documentation should be a description of the amazing journey you are on!
Gel electrophoresis is a laboratory technique used to separate biomolecules such as DNA, RNA, or proteins based on their size and electrical charge as they migrate through a porous gel matrix under an electric field.
Smaller molecules move faster through the gel pores, while larger fragments migrate more slowly and tend to remain closer to the wells.
Some applications of the electrophoresis are:
flowchart TD

    C{Electrophoresis Applications}
    C --> D[Clinical diagnostics: Parenting tests]
    C --> E[Forensic investigations]
    C --> F[Transformation and insertions of plasmids]
    C --> G[Genetic Maps: Detecting species]
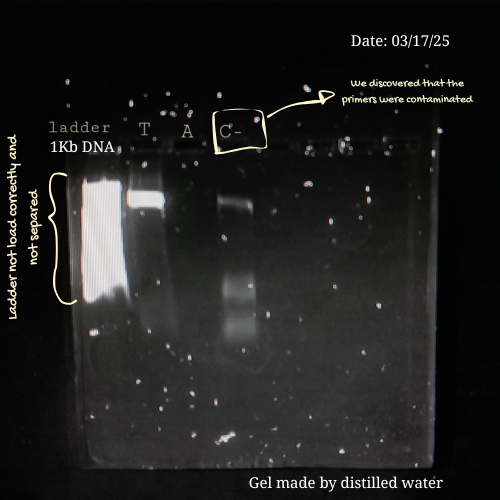
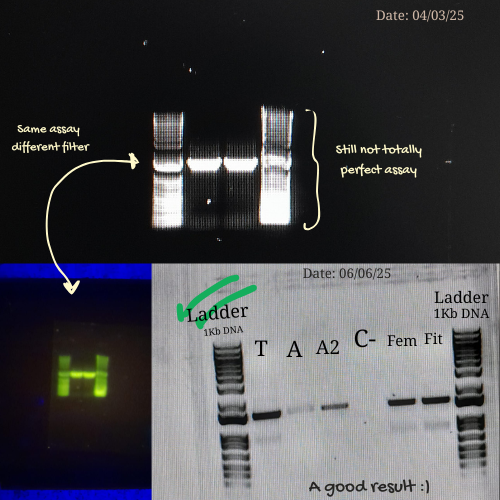
From my own laboratory experience, early electrophoresis runs are rarely perfect. During a previous project involving Lactobacillus strains from commercial probiotics, I had to amplify bacterial DNA using PCR and then verify the products by gel electrophoresis before sequencing. Initially, achieving clear and well-defined bands was challenging.
Some of the mistakes I made in previous assays were:
Applying too much pressure on the gel.
Loading low PCR product on the well.
Leaving the gel running for too long.
Or preparing an agarose gel with distilled water instead of using a buffer 💀
Each of these errors affected band clarity or migration, but they also became valuable learning moments. By the time, I learned to be more careful with gel handling, optimize PCR concentrations, monitor run times, and always prepare gels with the appropriate buffer.
This process reminded me that electrophoresis is not only a technical protocol but also a skill developed through practice, troubleshooting, and patience. Making mistakes and understanding why they happen. This is part of building confidence at the bench and developing experimental intuition.
Here are some pictures comparing my own process of learning how to charge a gel before (top) and after (bottom):
These are my volunteer pictures from my Molecular Biology experiments at the Biomedical Research Center (CENBIO-UTE).
Part 1: Benchling & In-silico Gel Art
Creating Gel Art- in silico using Benchling
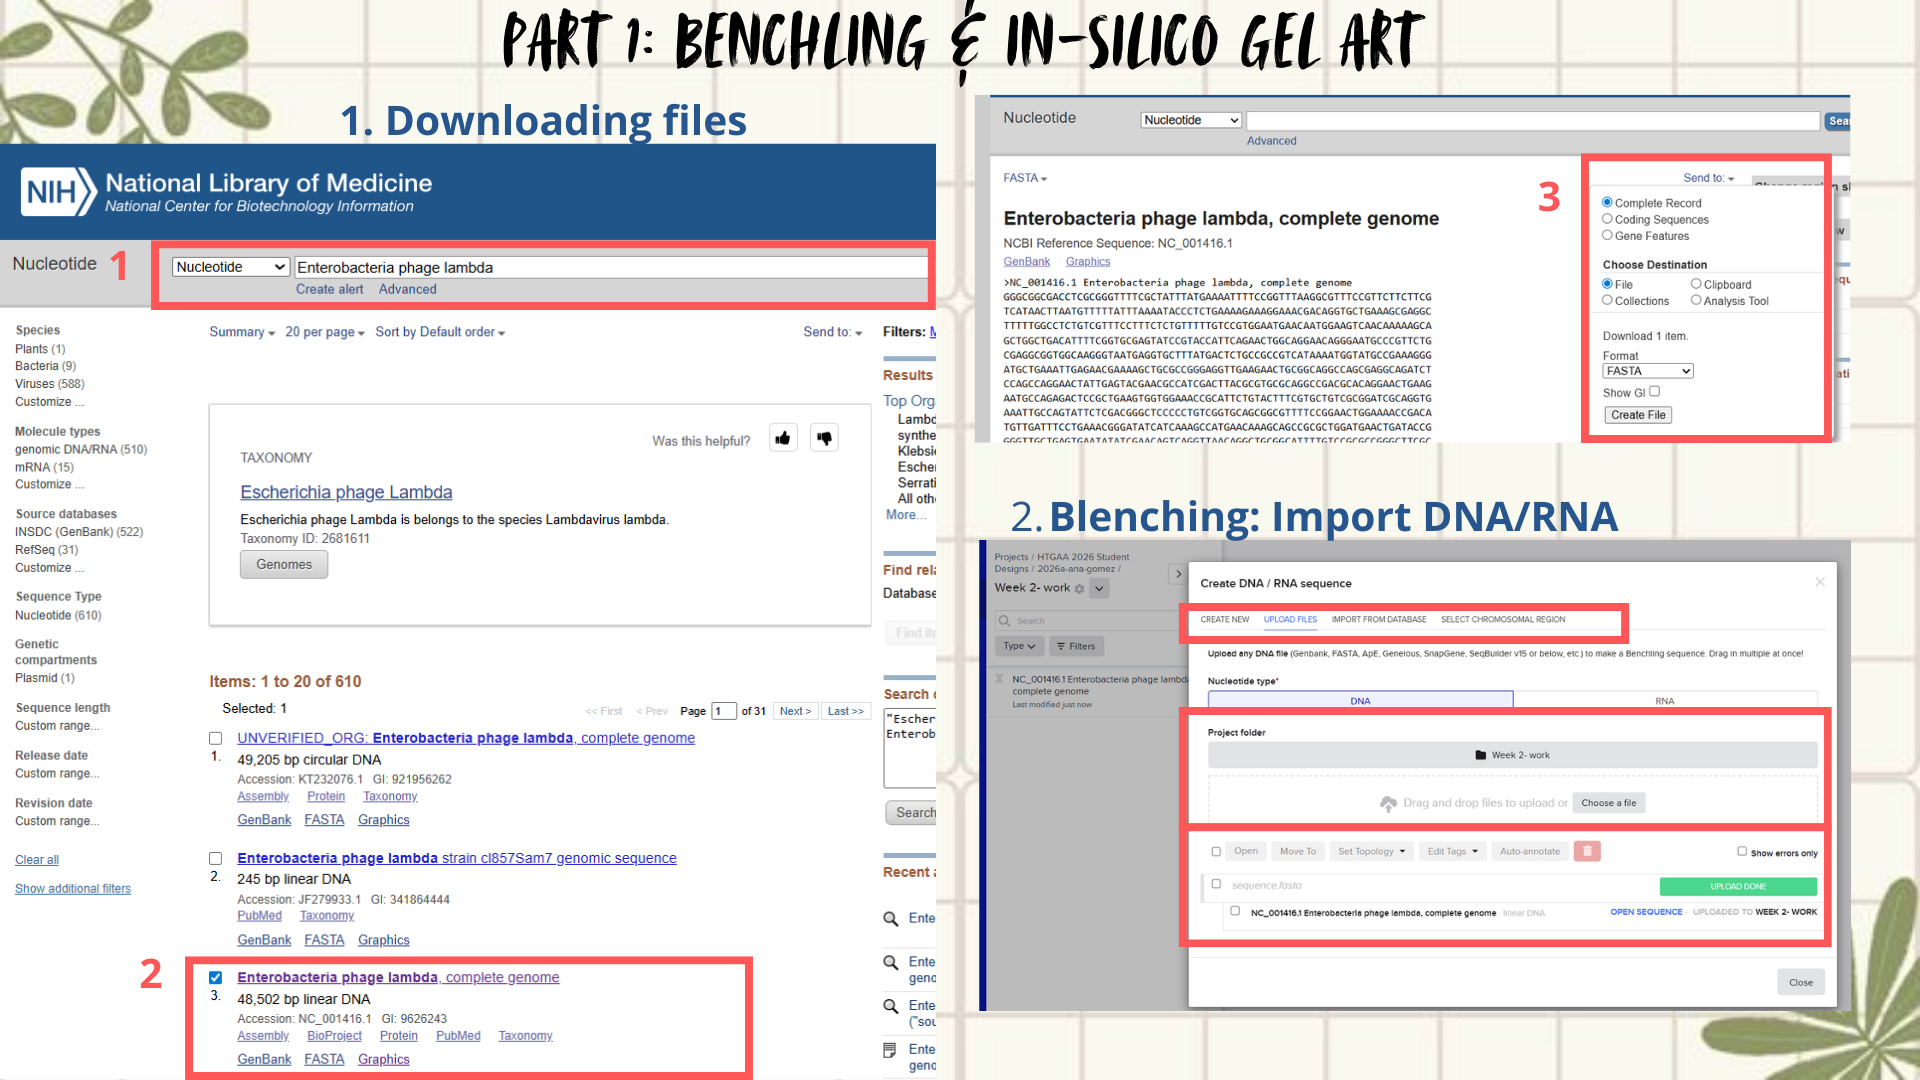
First, I searched for the Lambda phage genome using the NCBI Nucleotide database by entering Enterobacteria phage lambda or directly the accession number NC_001416.1. From the available results, I selected the complete genome sequence and downloaded it in FASTA format. (Figure 1)
Next, the FASTA file was imported into Benchling using the Create DNA/RNA → Upload files option. Once uploaded, the Lambda DNA sequence was opened and visualized in linear map mode. (Figure 2)
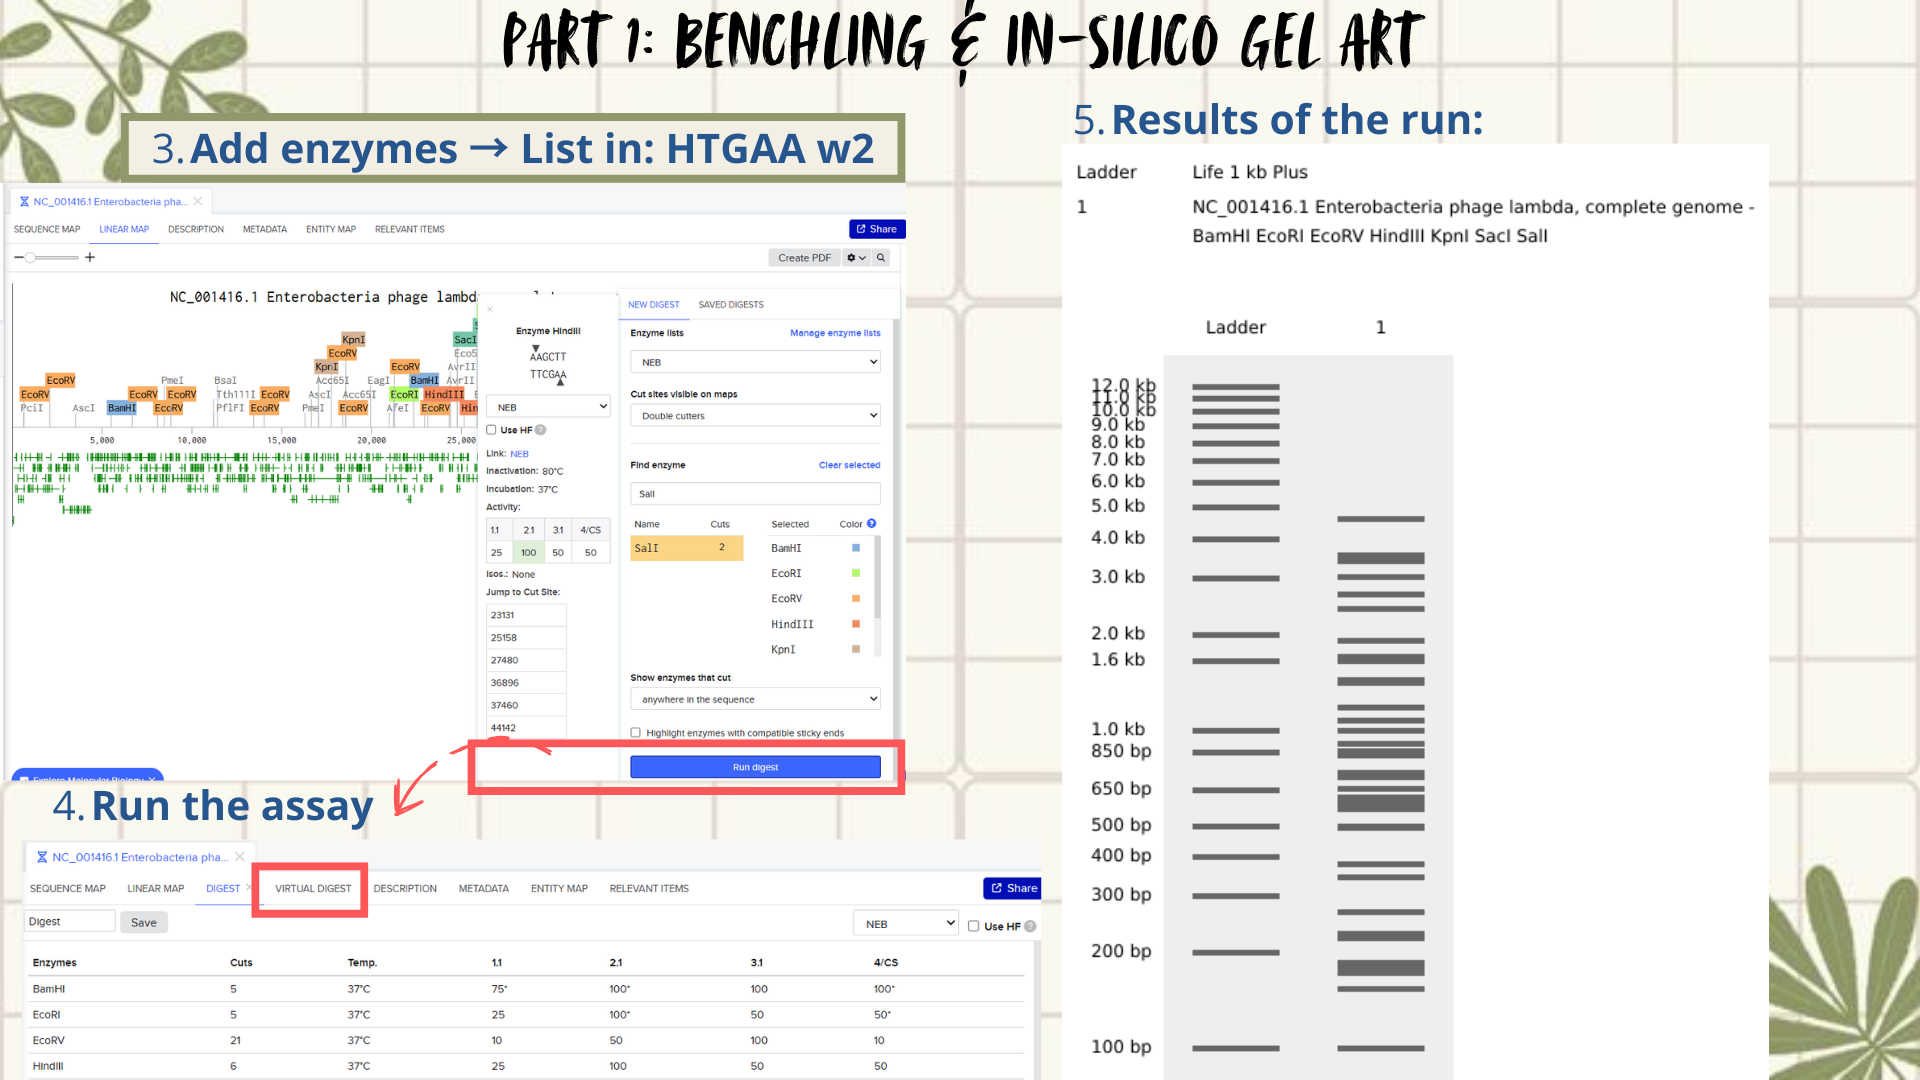
Following the assignment instructions, I used the following restriction enzymes: EcoRI, HindIII, BamHI, KpnI, EcoRV, SacI, and SalI. After selecting the enzymes, a virtual restriction digest was performed using Benchling’s Run Digest tool. This generated simulated fragment patterns that were visualized as in-silico gel electrophoresis bands.
Figure 1: Workflow part 1- image 1
Figure 2: Workflow part 1- image 2
Creative exploration:
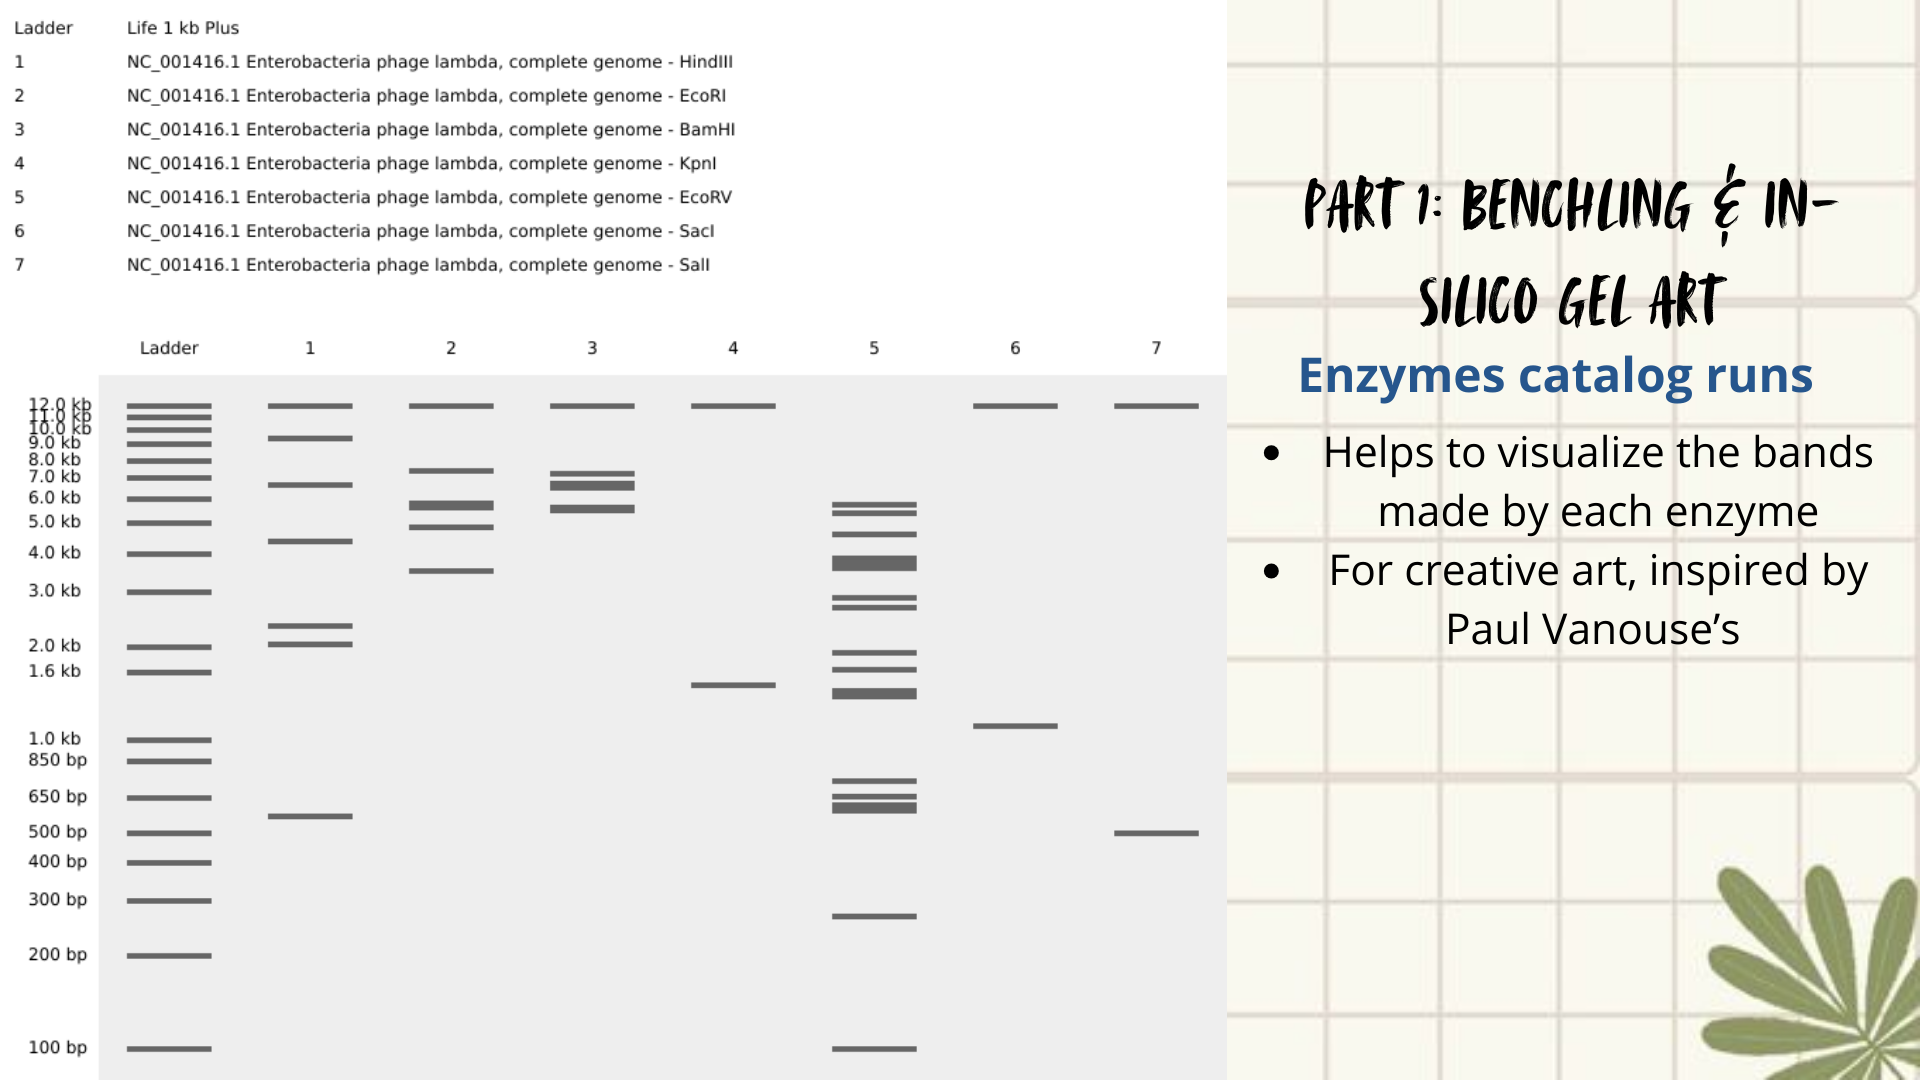
Initial attempts focused on creating typographic shapes, like the letter “A” (for Ana or Anita). But honestly, I got frustrated because the bands didn’t line up the way I expected. Benchling doesn’t “order” the runs like a design tool, so I assumed that it reflects the natural distribution of fragments, so the patterns kept turning into round shapes. Plus, I decided to create an enzyme catalog to visualize it. (Figure 3)
Figure 3: enzyme catalog
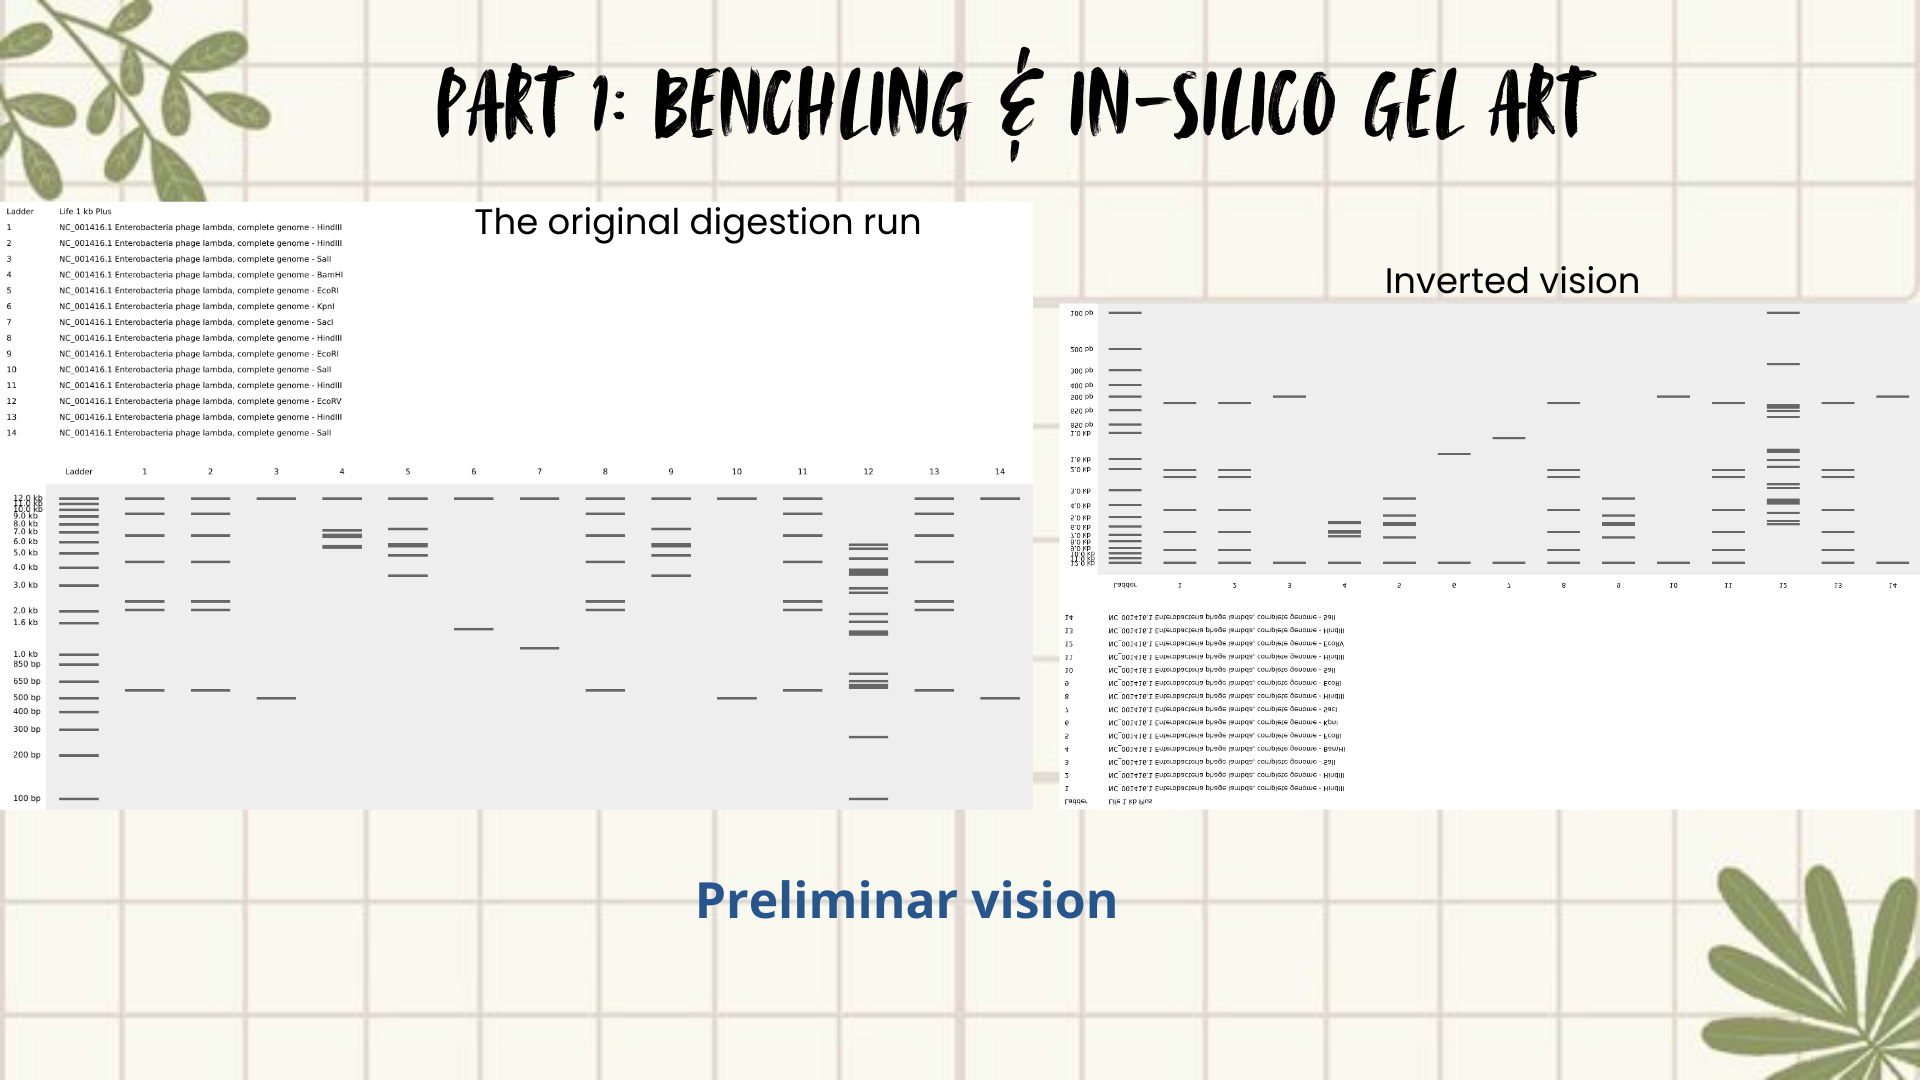
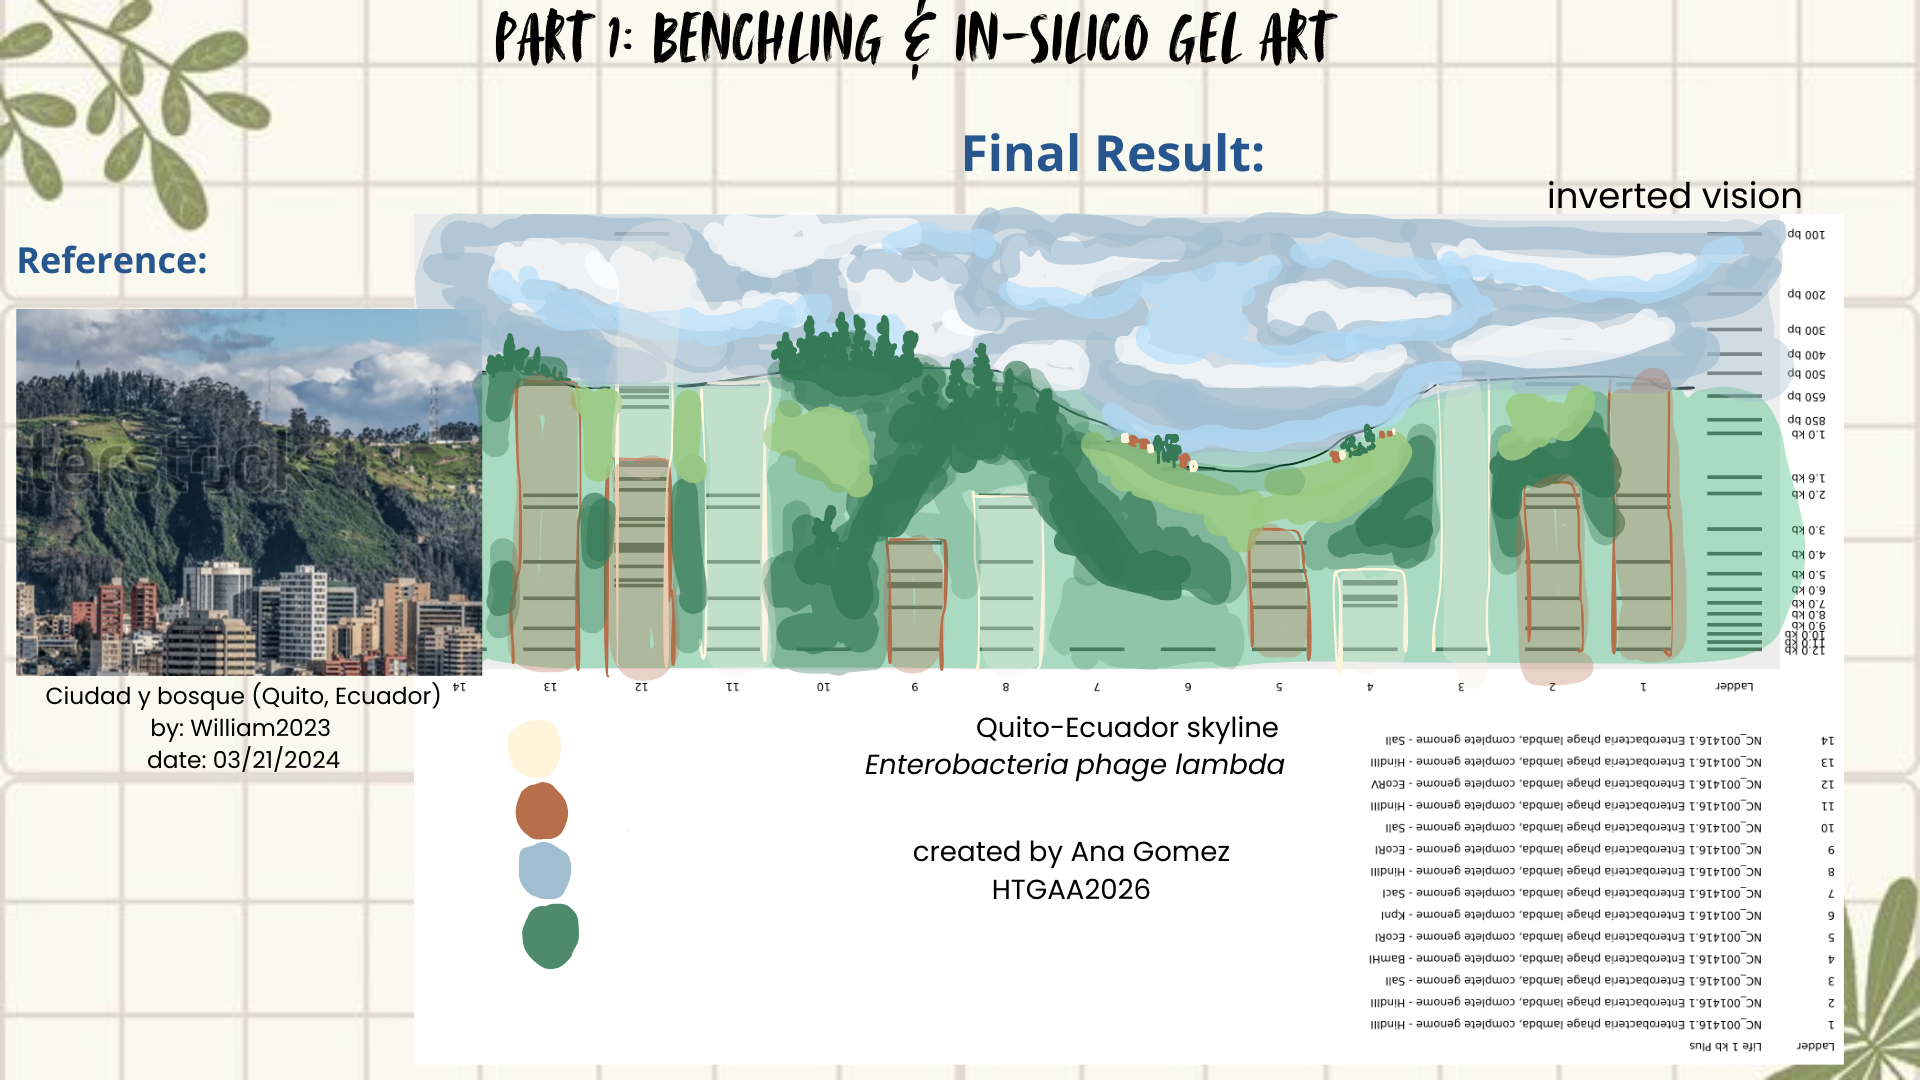
Then I remembered Paul Vanouse’s webpage, where gel images are shown inverted. So, I tried flipping my gel image too, and that small change completely shifted how I saw it. Suddenly, the band pattern looked like a landscape: a skyline that reminded me of Quito, with the Andean forest covering the mountains. (Figures 4 and 5)
The next slides show the Benchling work step-by-step and how I got to this final sketch:
Figure 4: Preliminar design
Figure 5: Final result
Part 2:Gel Art - Restriction Digests and Gel Electrophoresis
Not available since I’m not in a node yet
Part 3: DNA Design Challenge
3.1. Choose your protein: In recitation, we discussed that you will pick a protein for your homework that you find interesting. Which protein have you chosen and why? Using one of the tools described in recitation (NCBI, UniProt, google), obtain the protein sequence for the protein you chose.
I chose L-lactate dehydrogenase (LDH) from Lactobacillus plantarum because it is a key enzyme in lactic acid fermentation, one of the most characteristic metabolic pathways of Lactobacillus. Since I’m interested in probiotics, LDH seems like an important protein to work with for this DNA design challenge.
3.2. Reverse Translate: Protein (amino acid) sequence to DNA (nucleotide) sequence: Using one of the tools discussed in class, NCBI or online tools (google “reverse translation tools”), determine the nucleotide sequence that corresponds to the protein sequence you chose above.
I used an online reverse translation tool Bioinformatic.org to convert the protein sequence into a coding DNA sequence. Because the genetic code is degenerate (multiple codons can encode the same amino acid), the generated sequence represents one possible nucleotide sequence compatible with the selected protein, rather than its original genomic DNA.
3.3. Codon optimization: Once a nucleotide sequence of your protein is determined, you need to codon optimize your sequence. You may, once again, utilize google for a “codon optimization tool”. In your own words, describe why you need to optimize codon usage. Which organism have you chosen to optimize the codon sequence for and why?
For this section, I use the same Blenching to help with the codon optimization. It is important to make this step because different organisms prefer different synonymous codons, even though they encode the same amino acids. Without optimization, heterologous genes may be poorly expressed due to rare codons, inefficient tRNA availability, or unstable mRNA structures. In this case, I select Escherichia coli K-12, since it’s a versatile bacteria, also is recognized as a research model, and specific for Escherichia coli K-12 is useful for detailed information on: enzymes, metabolites, transporters, and metabolic pathways. (Booster, 2024)
3.4. You have a sequence! Now what?: What technologies could be used to produce this protein from your DNA? Describe in your words the DNA sequence can be transcribed and translated into your protein. You may describe either cell-dependent or cell-free methods, or both.
The next step would be to produce the protein through recombinant expression, the optimized gene could be chemically synthesized and cloned into an expression plasmid containing essential regulatory elements such as a promoter, ribosome binding site (RBS), and terminator (for example, using a T7 or lac promoter system).
Once assembled, the plasmid would be introduced into Escherichia coli through transformation. Inside the bacterial cell, the DNA is transcribed into mRNA by RNA polymerase, and the mRNA is translated by ribosomes into a protein. Because the sequence was codon-optimized for E. coli, protein expression efficiency would be improved. Expression can be induced using an inducible promoter, and the resulting protein can later be purified, for example, using affinity chromatography if a His-tag was included in the design (Rosano & Ceccarelli, 2014).
Alternatively, the protein could also be produced using a cell-free expression system, where the DNA (or mRNA) is added directly to a reaction mixture containing ribosomes, enzymes, nucleotides, and amino acids, allowing protein synthesis without living cells. This process can be produced faster and nowadays is used for the construction of genetic circuits (Perez et al., 2016).
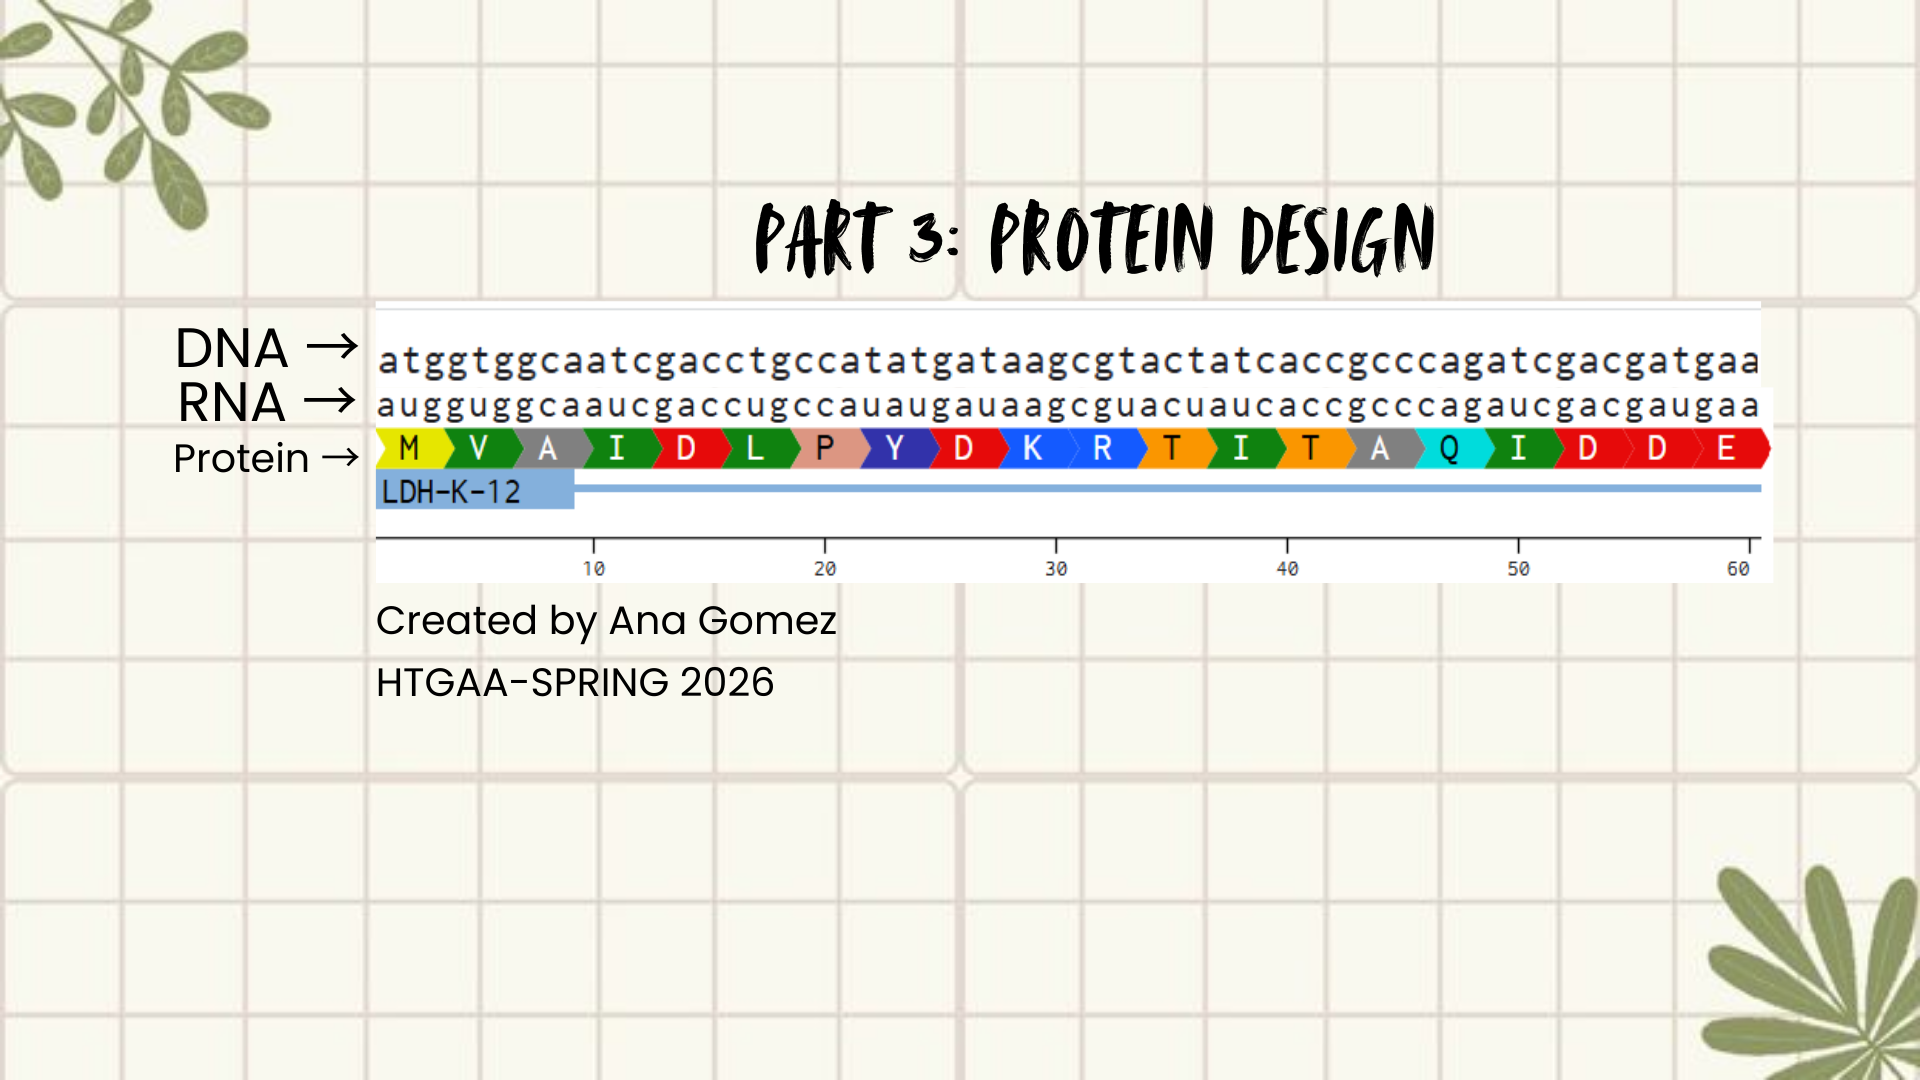
3.5. (Optional) How does it work in nature/biological systems?: Describe how a single gene codes for multiple proteins at the transcriptional level, and try aligning the DNA sequence, the transcribed RNA, and also the resulting translated Protein!!!.
For this alignment, I used the codon-optimized DNA sequence designed for expression in Escherichia coli. Although the original protein comes from Lactiplantibacillus plantarum, the sequence was reverse-translated and optimized to match E. coli codon usage, simulating a synthetic biology workflow.
A short fragment of the optimized DNA was aligned with its transcribed RNA and translated protein to illustrate the central dogma.
DNA: ATGGTGGCAATCGACCTGCCATATGATAAGCGTACTATCACCGCCCAGATCGACGATGAA
RNA: AUGGUGGCAAUCGACCUGCCAUAUGAUAAGCGUACUAUCACCGCCCAGAUCGACGAUGAA
PROTEIN: (show below in the figure)
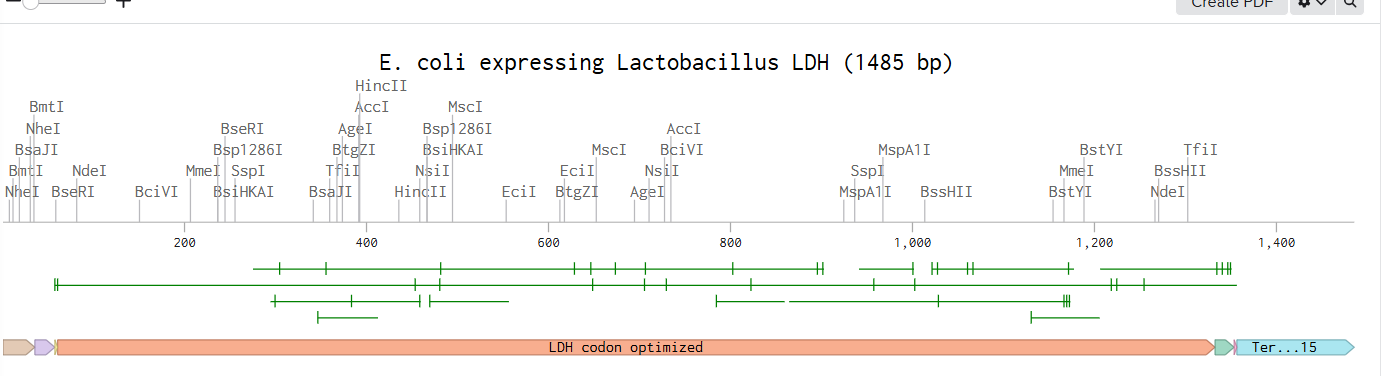
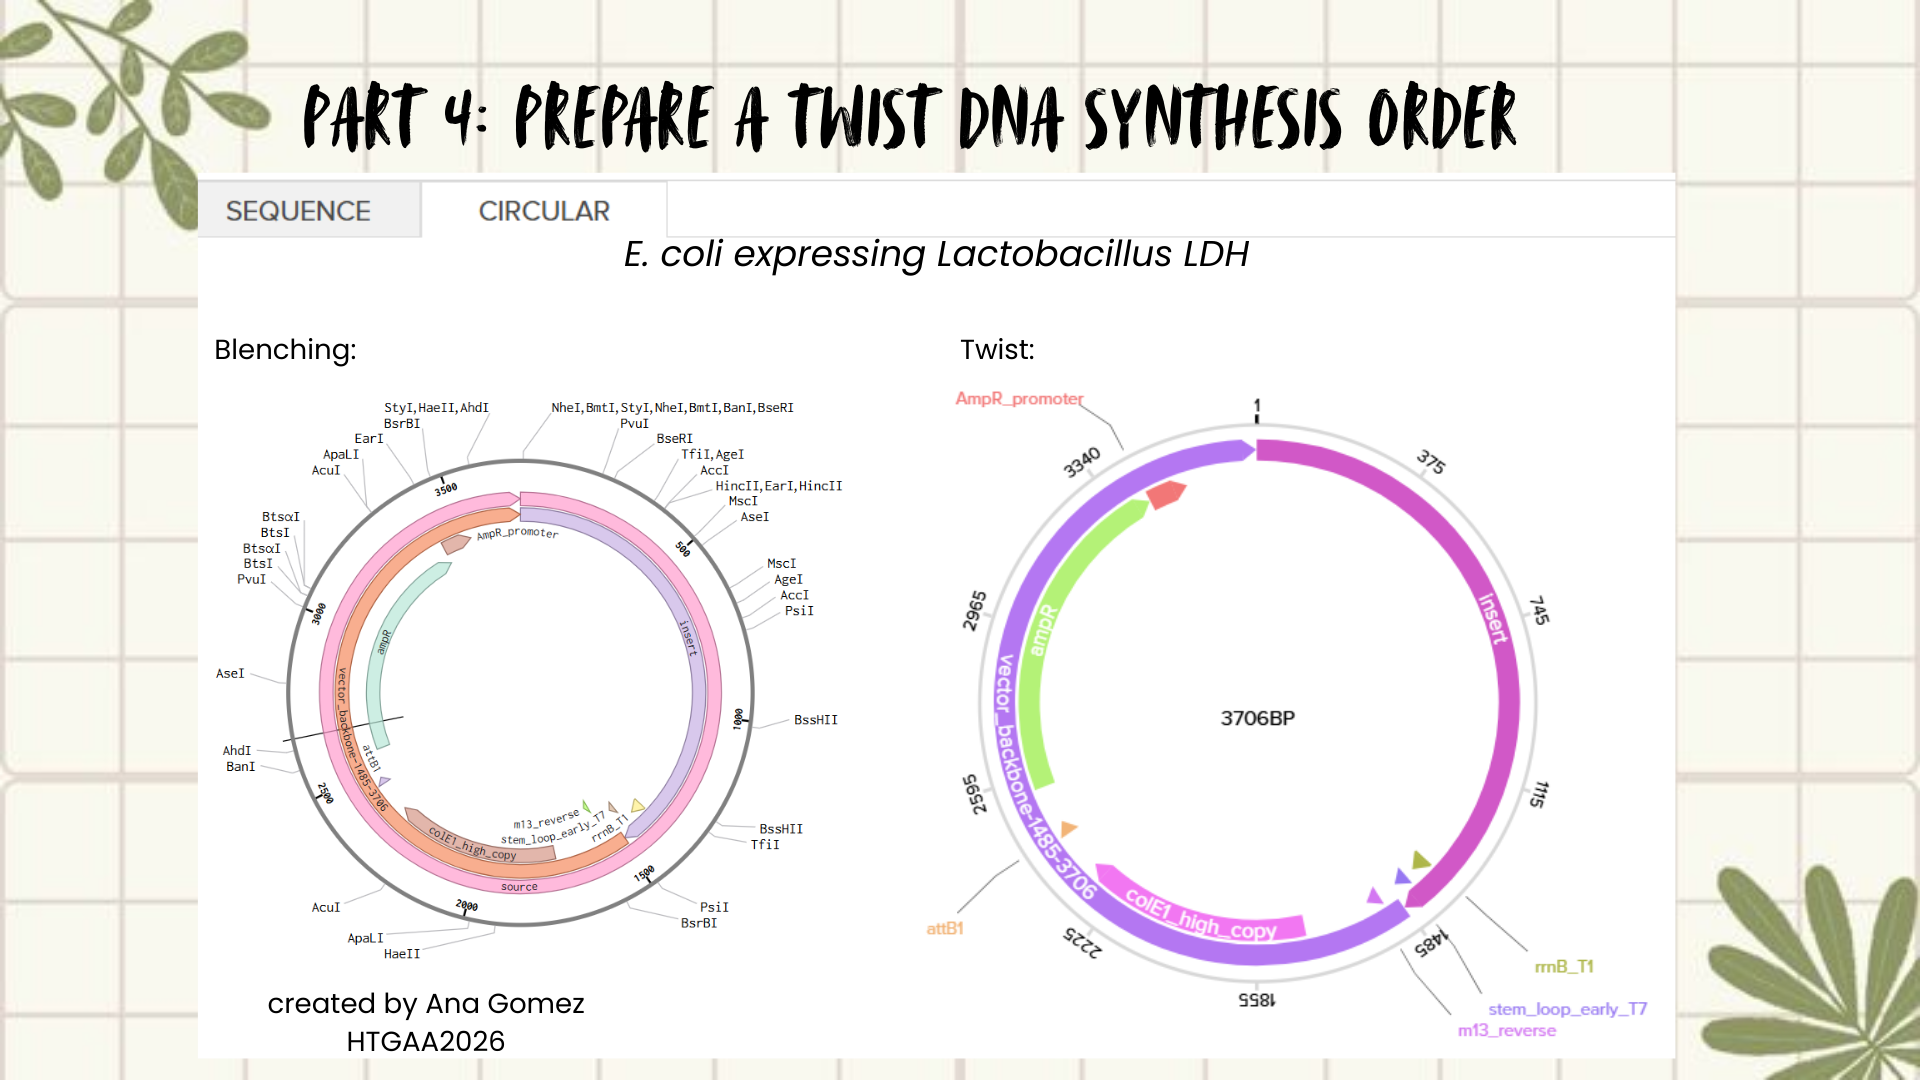
Part 4: Prepare a Twist DNA Synthesis Order
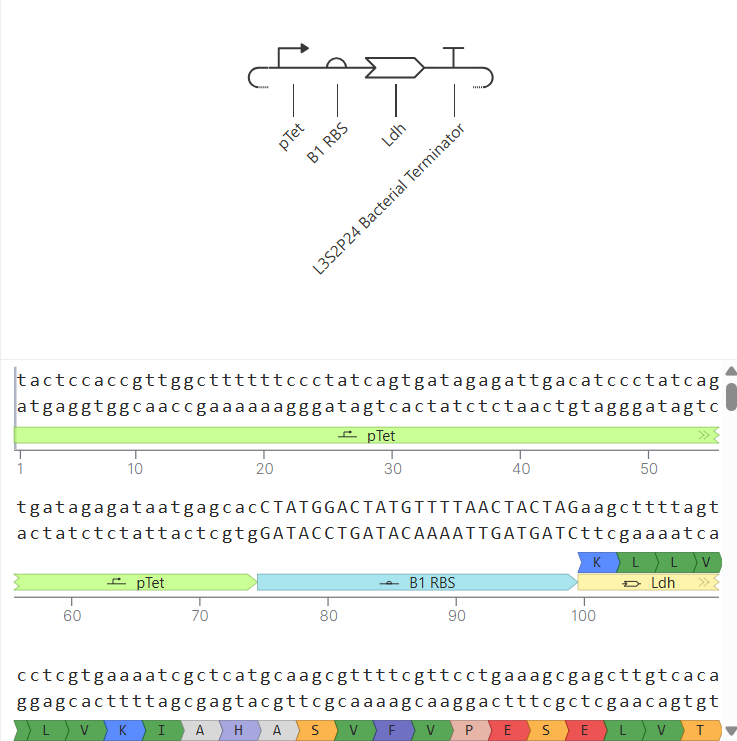
Creating a Plasmid using Blenching and Twist
Following the previous steps, my goal was to design an expression plasmid for Escherichia coli carrying a codon-optimized Lactobacillus lactate dehydrogenase (LDH) gene.
To build the DNA insert (expression cassette), I assembled the following genetic elements in Benchling using a linear DNA topology:
Each component was annotated in Benchling (promoter, RBS, CDS, His-tag, terminator) to clearly define the structure of the expression cassette.
After assembling the sequence, I visualized the construct using the Linear Map tool:
As an extra, here is a link to my Blenching project: Linemap Blenching
Plasmid construction:
The complete expression cassette was exported as a FASTA file and uploaded to Twist Bioscience using the Clonal Genes option.
For the backbone vector, I selected pTwist Amp High Copy, which provides ampicillin resistance and a high-copy origin of replication suitable for protein expression in E. coli.
The resulting plasmid contains the LDH expression cassette inserted into the pTwist vector:
This is the result of transforming E. coli for recombinant LDH production.
Part 5: DNA Read/Write/Edit
5.1 DNA Read:
(i) What DNA would you want to sequence (e.g., read) and why? This could be DNA related to human health (e.g. genes related to disease research), environmental monitoring (e.g., sewage waste water, biodiversity analysis), and beyond (e.g. DNA data storage, biobank).
I would be interested in sequencing Lactobacillus strains involved in probiotic activity, particularly those capable of producing antimicrobial compounds or enzymes such as lactate dehydrogenase (LDH). These bacteria are compatible with human physiology and play important roles in gut health. Additionally, understanding their genetic background could help identify mechanisms related to adhesion and biofilm formation.
Biofilms represent a major challenge in clinical settings, especially on medical devices, where they contribute to persistent infections. Similarly, in the food industry, biofilm formation is associated with contamination and spoilage, posing risks to public health. Sequencing these strains could therefore support both biomedical and industrial applications by enabling the identification of genes involved in antimicrobial activity and biofilm regulation. (Cangui-Panchi et al., 2022; Pang et al., 2023)
In this project, constructing and sequencing a plasmid expressing Lactobacillus LDH in E. coli would allow verification of correct gene insertion, absence of mutations after synthesis or cloning, and confirmation of reading frame integrity. Sequencing would also validate promoter–RBS–CDS junctions and His-tag fusion, ensuring proper protein expression. Such validation is essential for recombinant protein production workflows and quality control in synthetic biology.
(ii) In lecture, a variety of sequencing technologies were mentioned. What technology or technologies would you use to perform sequencing on your DNA and why? Also answer the following questions:
Is your method first-, second- or third-generation or other? How so?
What is your input? How do you prepare your input (e.g. fragmentation, adapter ligation, PCR)? List the essential steps.
What are the essential steps of your chosen sequencing technology, how does it decode the bases of your DNA sample (base calling)?
What is the output of your chosen sequencing technology?
I would use Illumina short-read sequencing (second-generation sequencing).
Here are some reasons that are summarized in the following table
Table 2: Characteristics of Illumina sequencing
Category
Description
Advantages
• High base accuracy (>99.9%) • Cost-effective for plasmids and bacterial constructs • Well-suited for constructs <10 kb
Generation
Second-generation (massively parallel sequencing with amplified fragments).
Input and preparation
1. Plasmid extraction from E. coli 2. DNA fragmentation 3. Adapter ligation 4. Cluster generation on flow cell
Essential sequencing steps
• Sequencing-by-synthesis using fluorescently labeled nucleotides • Base calling is performed by detecting emitted fluorescence during nucleotide incorporation
Output
• FASTQ files containing millions of short reads • Reads assembled against reference plasmid to verify sequence integrity
(Based on Emiyu & Lelisa, 2022; Sanderson et al., 2023)
5.2 DNA Write:
(i) What DNA would you want to synthesize (e.g., write) and why? These could be individual genes, clusters of genes or genetic circuits, whole genomes, and beyond. As described in class thus far, applications could range from therapeutics and drug discovery (e.g., mRNA vaccines and therapies) to novel biomaterials (e.g. structural proteins), to sensors (e.g., genetic circuits for sensing and responding to inflammation, environmental stimuli, etc.), to art (DNA origamis). If possible, include the specific genetic sequence(s) of what you would like to synthesize! You will have the opportunity to actually have Twist synthesize these DNA constructs! 😊
I am interested in synthesizing DNA for two main applications: a genetic biosensor circuit for lactate detection and recombinant enzyme production. First, inspired by my Week 1 project, I would like to design a lactate-responsive genetic circuit that could eventually be integrated into a wearable biosensor (like a temporary tattoo) for competitive swimmers. This biosensor would detect lactate levels, providing an alternative to repetitive blood sampling, reducing pain and laboratory dependency while allowing real-time metabolic monitoring.
Also, for this work, I focused on expressing Lactobacillus LDH in E. coli as a proof-of-concept for recombinant protein production. Building on this, it might be a way to design lactate-responsive genetic circuits for wearable biosensors, such as a temporary tattoo for competitive swimmers.
Additionally, I am also interested in DNA origami as a creative and structural application of DNA synthesis, exploring how programmed DNA folding could be used for nanoscale architectures and bio-art.
(ii) What technology or technologies would you use to perform this DNA synthesis and why? Also answer the following questions:
What are the essential steps of your chosen sequencing methods?
What are the limitations of your sequencing method (if any) in terms of speed, accuracy, scalability?
To synthesize the designed genetic circuits, I would use commercial DNA synthesis platforms such as Twist Bioscience, which allow accurate construction of gene fragments or clonal plasmids from digitally designed sequences.
Process:
In silico design of the genetic circuit (promoter, RBS, coding sequence, reporter).
Codon optimization for E. coli expression.
Chemical or enzymatic DNA synthesis of fragments.
Assembly of fragments using Gibson Assembly or Golden Gate cloning.
Transformation into E. coli for amplification and expression.
Sequence verification using Illumina sequencing.
This approach allows rapid prototyping of biosensor constructs with high sequence fidelity.
Limitations include synthesis length constraints, potential sequence errors in long constructs, and cost when scaling multiple variants. Additionally, DNA origami applications require precise strand design and may be limited by folding efficiency and structural stability.
(based on Hoose et al., 2023)
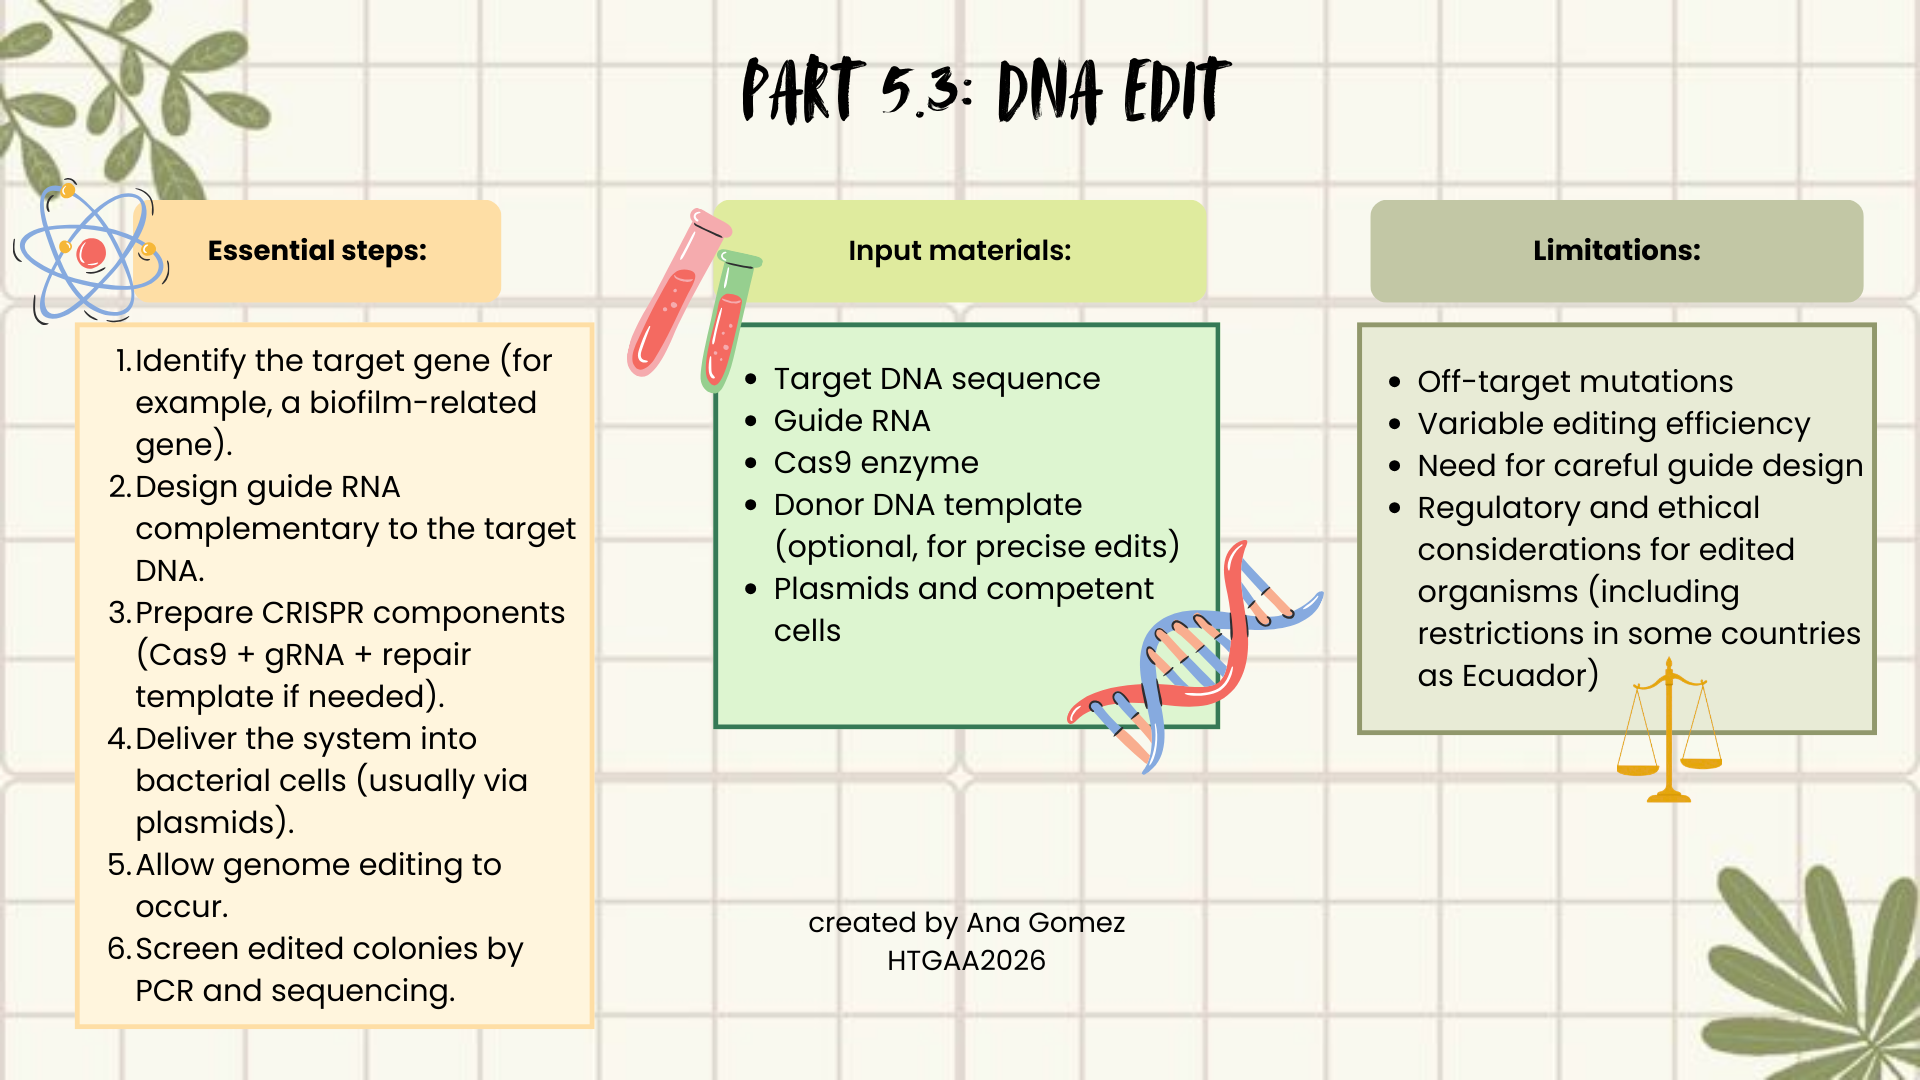
5.3 DNA Edit
(i) What DNA would you want to edit and why? In class, George shared a variety of ways to edit the genes and genomes of humans and other organisms. Such DNA editing technologies have profound implications for human health, development, and even human longevity and human augmentation. DNA editing is also already commonly leveraged for flora and fauna, for example in nature conservation efforts, (animal/plant restoration, de-extinction), or in agriculture (e.g. plant breeding, nitrogen fixation). What kinds of edits might you want to make to DNA (e.g., human genomes and beyond) and why?
As I mentioned before, I would be interested in editing genes related to biofilm formation or antimicrobial production in Lactobacillus strains. Biofilms are a major problem in hospital environments and medical devices, and they also affect food safety. By modifying regulatory genes or metabolic pathways, it could be possible to reduce biofilm formation or enhance antimicrobial compound production. This could contribute to public health, infection prevention, and safer food systems.
Additionally, editing probiotic strains could help improve adhesion to intestinal surfaces or increase beneficial metabolite production, strengthening their therapeutic potential.
(ii) What technology or technologies would you use to perform these DNA edits and why?
Also answer the following questions:
How does your technology of choice edit DNA? What are the essential steps?
What preparation do you need to do (e.g. design steps) and what is the input (e.g. DNA template, enzymes, plasmids, primers, guides, cells) for the editing?
What are the limitations of your editing methods (if any) in terms of efficiency or precision?
I would use CRISPR–Cas9, because it is precise, relatively easy to design, and widely used in bacteria. CRISPR works by using a guide RNA (gRNA) that matches a target DNA sequence. The Cas9 enzyme follows this guide and creates a double-strand break at the selected genomic location. The cell then repairs this break either by non-homologous end joining (NHEJ), which may introduce mutations, or homology-directed repair (HDR), if a repair template is provided, allowing precise edits.
(Diagram)
Weekly reflection:
I enjoyed this homework because it allowed me to combine creativity with molecular biology tools. I liked being able to design gel art and work with DNA sequences. It was surprising to discover that platforms I had previously used for volunteering or simple visualization, such as Benchling, also contain useful functions for enzyme digestion, codon optimization, and plasmid design.
This project also reminded me that not every experiment works perfectly the first time, just like real gel electrophoresis runs. Mistakes, unexpected results, and trial-and-error are part of the learning process. Repeating steps, understanding errors, and refining designs are essential to improve outcomes.
Working with tools like Benchling and Twist helped me realize how accessible synthetic biology has become, and how digital platforms can support creative biological design. This experience helped clarify where future projects could begin: starting from a biological question, translating it into DNA design, and then imagining real applications such as biosensors, antimicrobial systems, or therapeutic constructs.
Thanks for reading!
This webpage is also upload in my personal Notion, if you want to visit it, please click in the next link! :) Notion week 2
Fang, S., Song, X., Cui, L., Bai, J., Lu, H., & Wang, S. (2023). The lactate dehydrogenase gene is involved in the growth and metabolism of Lacticaseibacillus paracasei and the production of fermented milk flavor substances. Frontiers In Microbiology, 14, 1195360. https://doi.org/10.3389/fmicb.2023.1195360
Li, X., Wang, G., Wang, J., Song, X., Xiong, Z., Xia, Y., & Ai, L. (2024). The ldh Gene Plays a Crucial Role in Mediating the Pathogen Control of Lactiplantibacillus plantarum AR113. Foodborne pathogens and disease, 21(9), 578–585. https://doi.org/10.1089/fpd.2024.0028
Perez, J. G., Stark, J. C., & Jewett, M. C. (2016). Cell-Free Synthetic Biology: Engineering Beyond the Cell. Cold Spring Harbor perspectives in biology, 8(12), a023853. https://doi.org/10.1101/cshperspect.a023853
Rosano GL and Ceccarelli EA (2014) Recombinant protein expression in Escherichia coli: advances and challenges. Front. Microbiol. 5:172. doi: https://doi.org/10.3389/fmicb.2014.00172
Part 5:
Aljabali, A. A. A., El-Tanani, M., & Tambuwala, M. M. (2024). Principles of CRISPR-Cas9 technology: Advancements in genome editing and emerging trends in drug delivery. Journal of Drug Delivery Science and Technology, 92(105338), 105338. https://doi.org/10.1016/j.jddst.2024.105338
Cangui-Panchi, S. P., Ñacato-Toapanta, A. L., Enríquez-Martínez, L. J., Reyes, J., Garzon-Chavez, D., & Machado, A. (2022). Biofilm-forming microorganisms causing hospital-acquired infections from intravenous catheter: A systematic review. Current research in microbial sciences, 3, 100175. https://doi.org/10.1016/j.crmicr.2022.100175
Emiyu, K., & Lelisa, K. (2022). Review on illumina sequencing technology. Austin Journal of Veterinary Science & Animal Husbandry, 9(1), 1088-1091. d1wqtxts1xzle7.cloudfront.net
Hoose, A., Vellacott, R., Storch, M., Freemont, P. S., & Ryadnov, M. G. (2023). DNA synthesis technologies to close the gene writing gap. Nature reviews. Chemistry, 7(3), 144–161. https://doi.org/10.1038/s41570-022-00456-9
Pang, X., Hu, X., Du, X., Lv, C., & Yuk, H. G. (2023). Biofilm formation in food processing plants and novel control strategies to combat resistant biofilms: the case of Salmonella spp. Food science and biotechnology, 32(12), 1703–1718. https://doi.org/10.1007/s10068-023-01349-3
Sanderson, H., McCarthy, M. C., Nnajide, C. R., Sparrow, J., Rubin, J. E., Dillon, J. A. R., & White, A. P. (2023). Identification of plasmids in avian-associated Escherichia coli using nanopore and illumina sequencing. BMC genomics, 24(1), 698. https://doi.org/10.1186/s12864-023-09784-6
Resources
A webpage that helped me to visualized flowcharts for markdown was: Online Flowchart
Week 3 HW: Lab Automation
Week 3: Lab Automation
Part 1: Phyton Code & Agar Design
Documentation:
For the first part of the Lab Automation assignment, I worked with Opentrons Python code using Google Colab. During this process, I used ChatGPT primarily as a debugging and learning aid. It helps me resolve execution errors, install missing packages (via pip), and understand how to structure the notebook so the design can be visualized correctly.
Because the shared notebook relies on Opentrons hardware-specific functions (such as load_labware), the code was adapted to allow local visualization without a physical robot. My draft version originally included labware definitions intended for real laboratory execution, but these were temporarily removed to enable Plotly-based visualization.
To make the workflow clearer, the notebook was divided into three logical blocks:
flowchart TD
    A[OpentronsMock Definition] --> B[Main Protocol Code]
    B --> C[Visualization with Plotly]
Block 1: Defines the virtual Opentrons environment and data recording
Block 2: Executes the dispensing logic and color mapping
Block 3: Displays the final agar pixel-art model
1. Opentrons Mock Definition:
This block defines a mock version of the Opentrons protocol (OpentronsMock).
Its purpose is to simulate robot behavior and record dispensing coordinates, enabling visualization without physical hardware. This block also sets up Plotly for graphical rendering.
2. Main Protocol Code:
This is the core of the script, where:
Color sources are assigned
Coordinate points are paired with each fluorescent protein
The virtual pipette iterates through each point set
Dispensing actions are simulated
For visualization purposes, hardware-specific commands (such as load_labware) were removed in this version. The original draft protocol made for real robot execution is documented separately in “draft” inside the code.
3. Visualization:
This final block executes the protocol and renders the design using Plotly. Here, all recorded coordinates are plotted, allowing inspection of:
Spatial accuracy
Color placement
Overall agar pattern
This step is essential to verify that the design prints correctly before transferring it to a real Opentrons workflow. As well, the final result of the visualization is in the next image:
General view:
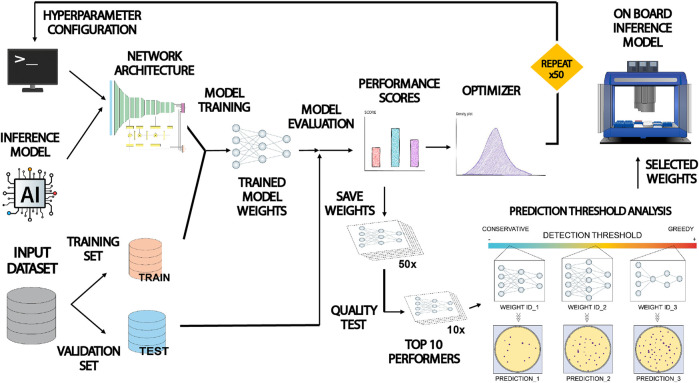
This paper presents COPICK, a technical modification of the open-source Opentrons OT-2 liquid handling robot to automate bacterial colony screening. Colony picking is traditionally a labor-intensive bottleneck in genetic engineering workflows, especially when screening large numbers of variants generated by high-throughput DNA assembly. While commercial colony pickers exist, their high cost limits accessibility for smaller laboratories. COPICK addresses this limitation by integrating image acquisition and artificial intelligence into an affordable OT-2 platform.
The system combines a mounted USB camera with a Detectron2-based panoptic segmentation model to identify bacterial colonies directly from Petri dish images. The inference engine processes raw images, performs pixel- and object-level classification, and maps detected colony coordinates into the physical space of the robot. The OT-2 pipette then autonomously selects colonies based on user-defined criteria such as size, color, or fluorescence intensity. This integration enables on-board automated colony selection without the need for expensive commercial equipment.
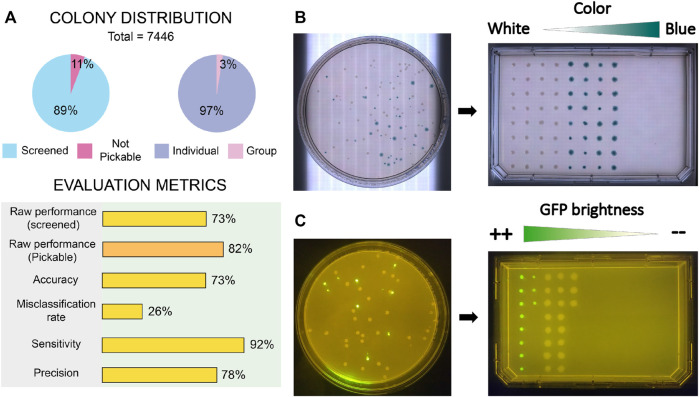
Findings:
Benchmark experiments performed with E. coli and P. putida demonstrated reliable performance across different screening scenarios (raw picking, color-based selection, and fluorescence-based cherry picking).
COPICK achieved a raw performance of 73% over total screened colonies, increasing to 82% when considering only pickable colonies.
The system showed high sensitivity (92%) and acceptable precision (78%), validating its potential as a cost-effective automation tool.
Even if the classification errors existed in the model, the study suggests that performance could further improve using next-generation segmentation models such as SAM.
Why is it a novel application?
I found this paper interesting, with a novel application for biology. First, COPICK reduces human bias and variability in colony selection by replacing manual visual inspection with algorithm-based inference. Also, the integration of AI-driven image segmentation with robotic actuation creates a reproducible, scalable workflow for microbial screening. And this approach democratizes high-throughput synthetic biology by making automated colony picking accessible to smaller laboratories, expanding the reach of biofoundry-style workflows.
Figures:
Figure 3 from (Del Olmo Lianes et al., 2023), It shows the workflow diagram of the paper
Figure 7 (Del Olmo Lianes et al., 2023) shows the results, including the performance metrics that validate the assays.
Part 2.2: Application of Automation in Final Project:
Idea: Automated Screening of Lactate Biosensor Constructs using Cell-Free Systems
This idea comes from my W1 homework, where I propose to create a waterproof lactate biosensor tattoo for competition swimmers. I want to automate the screening of genetic lactate biosensor variants using cell-free protein synthesis (CFPS) in a 96-well plate. This will help with the optimization before proving it in vivo. Automation will be used to:
flowchart TD
    A[Automated Workflow] --> B[Dispense CFPS master mix into 96-well plate]
    B --> C[Add biosensor DNA variants]
    C --> D[Apply lactate gradient 0–20 mM]
    D --> E[Incubate at 37 °C]
    E --> F[Measure fluorescence]
    F --> G[Analyze response curves]
The goal is to identify the most sensitive and dynamic lactate-responsive construct.
Possible pseudocode
Disclaimer: this mini pseudocode was created with IA’s help– ChatGPT 5.2
My ideas for the project are:
Main Idea: waterproof lactate biosensor tattoo for competition swimmers
I propose developing a semi-permanent, waterproof biosensor tattoo that detects lactate levels in athletes during pool training. The system would rely on engineered biological circuits that respond to lactate and trigger a visible fluorescent or colorimetric signal, functioning as a traffic-light-style, semi-quantitative indicator of physiological stress.
The idea is connected to course topics such as genetic circuit design and fluorescent protein signaling. Lactate would act as the biological input, while the output would be a color change generated by chromoproteins or fluorescent reporters, similar to the chromophore and genetic circuit.
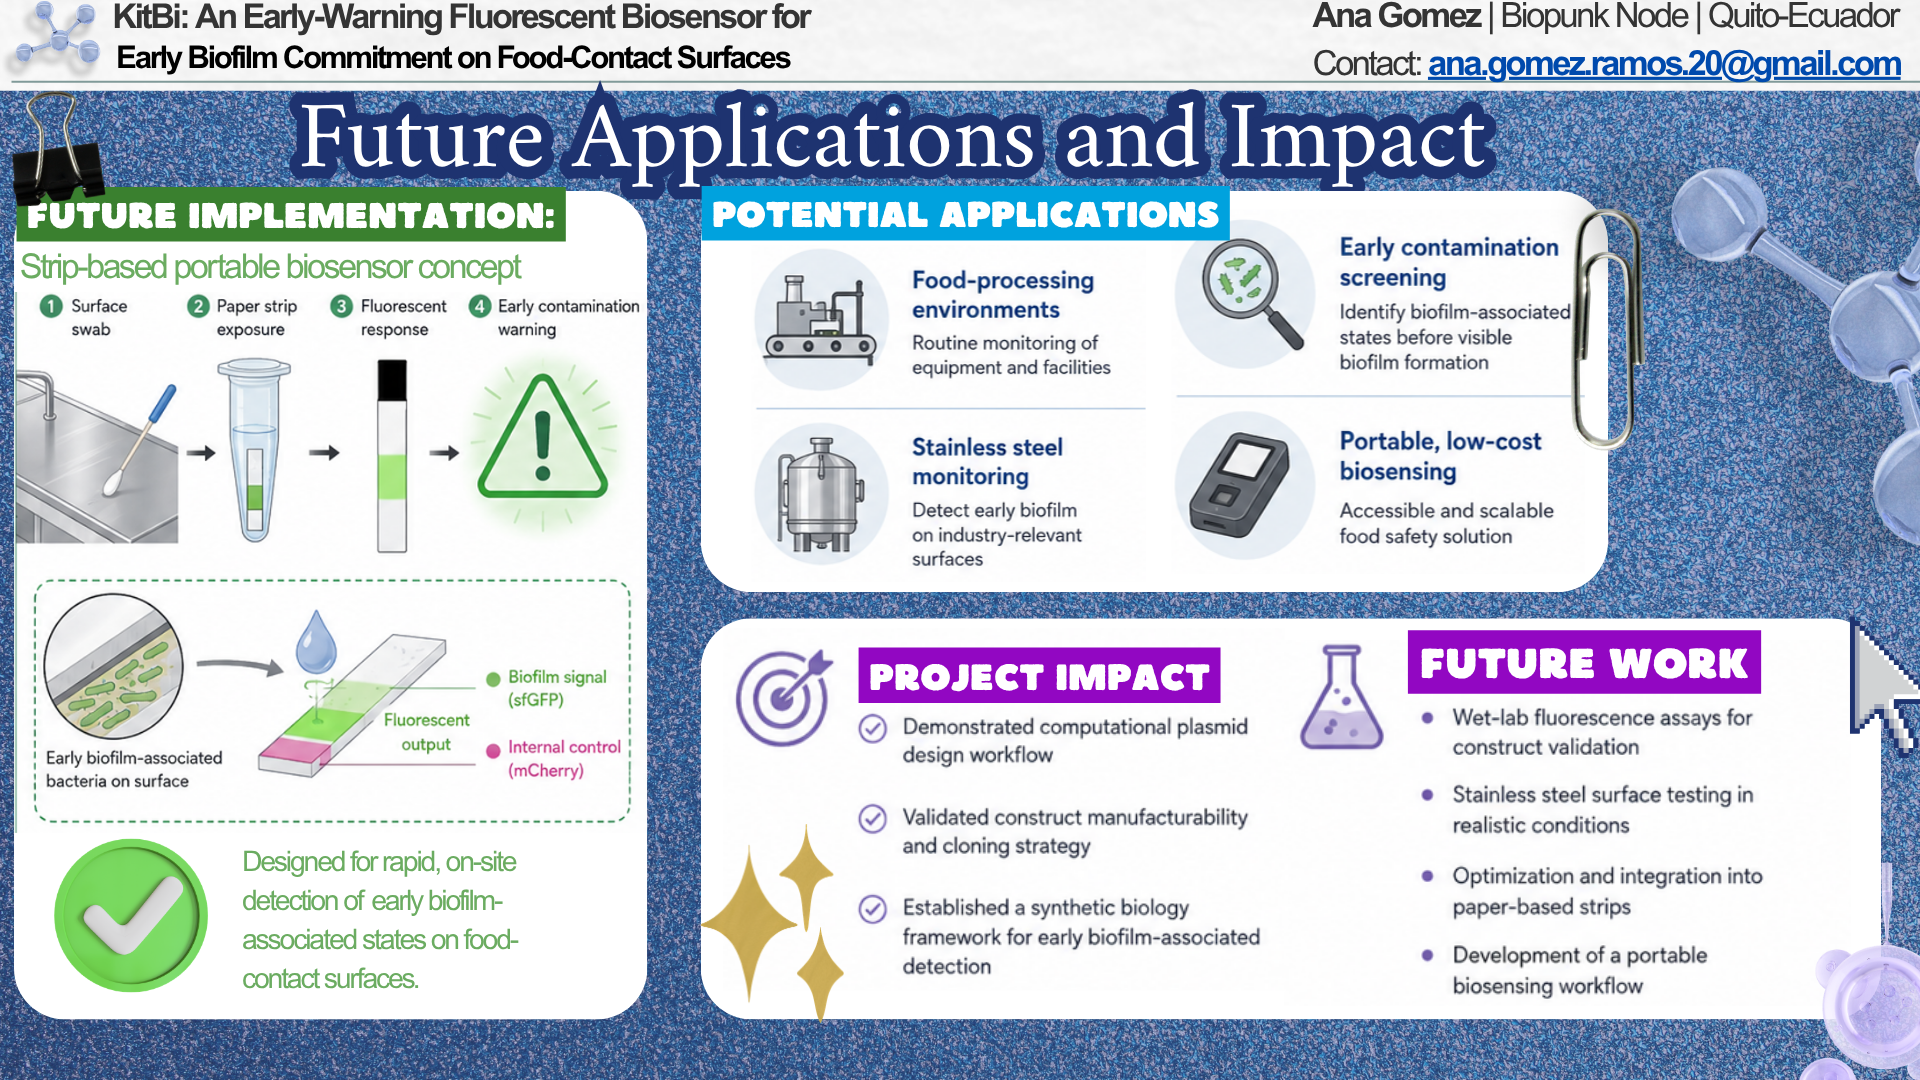
Second idea: based on the toehold switch in biosensors: mRNA of biofilm formation on kitchen elements, the idea is to create a biosensor that detects biofilm formation in kitchen surfaces or utensils before it matures, like a pH paper or a device
Third idea: Creating a Biopatch of Metformin, where the delivery of metformin is better, also targeting Type 2 diabetes patients and patients with gastrointestinal intolerance to oral metformin
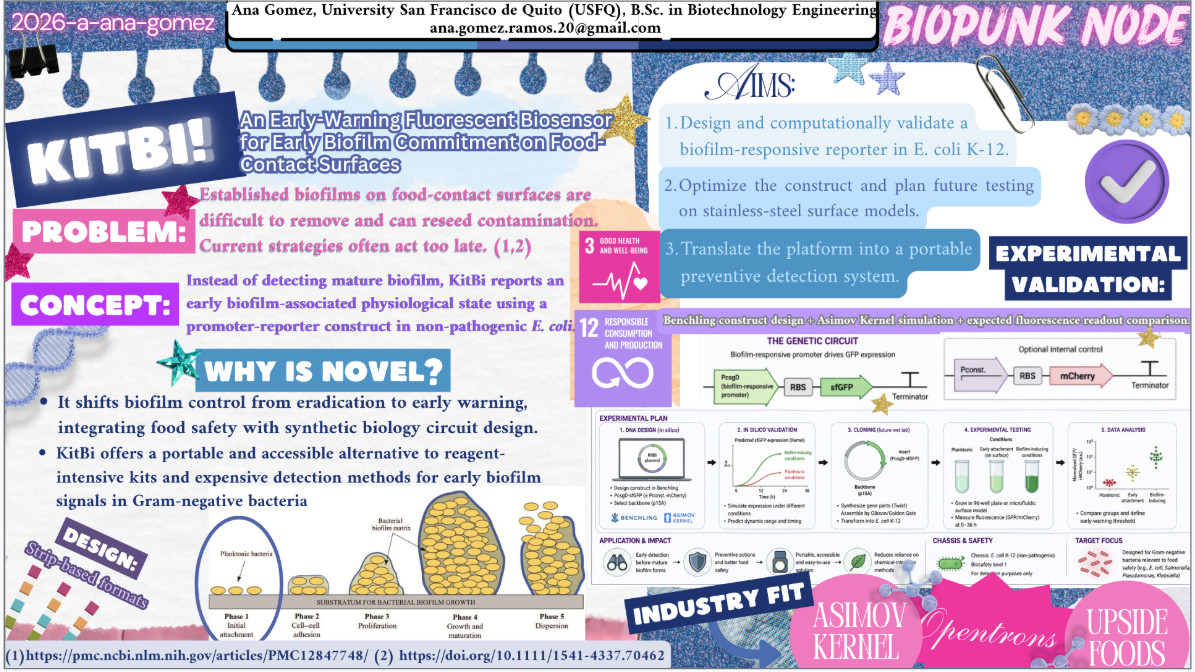
Link for final project slides: Final project slides ideas look for: 2026-a-ana-gomez | or Biopunk (updated!)
Weekly reflection:
This week was especially enjoyable because I got to design agar art in silico, which felt like a creative way to engage with lab automation concepts. While looking for a research paper, I was reminded of a researcher whose work uses algorithms from a different biological angle (using math algorithms to scan spheres that are attached to cells and visualize where the cancer cells are), and that made me realize how many areas of biology could benefit from automation in the future. I also noticed that my project ideas have been changing as I learn more about the course topics, which feels like part of the learning process itself. Overall, this week helped me reflect on how my interests are evolving, and it motivated me to keep exploring new perspectives and projects as I continue in the course.
Part 2:
Del Olmo Lianes, I., Yubero, P., Gómez-Luengo, Á., Nogales, J., & Espeso, D. R. (2023). Technical upgrade of an open-source liquid handler to support bacterial colony screening. Frontiers in bioengineering and biotechnology, 11, 1202836. https://doi.org/10.3389/fbioe.2023.1202836
Ghaffari, R., Yang, D. S., Kim, J., Mansour, A., Wright, J. A., Jr, Model, J. B., Wright, D. E., Rogers, J. A., & Ray, T. R. (2021). State of Sweat: Emerging Wearable Systems for Real-Time, Noninvasive Sweat Sensing and Analytics. ACS sensors, 6(8), 2787–2801. https://doi.org/10.1021/acssensors.1c01133
Jia, W., Bandodkar, A. J., Valdés-Ramírez, G., Windmiller, J. R., Yang, Z., Ramírez, J., Chan, G., & Wang, J. (2013). Electrochemical Tattoo Biosensors for Real-Time Noninvasive Lactate Monitoring in Human Perspiration. Analytical Chemistry, 85(14), 6553-6560. https://doi.org/10.1021/ac401573r
Schmiedeknecht, K., Kaufmann, A., Bauer, S., & Solis, F. V. (2022). L-lactate as an indicator for cellular metabolic status: An easy and cost-effective colorimetric L-lactate assay. PLoS ONE, 17(7), e0271818. https://doi.org/10.1371/journal.pone.0271818
Additional paper
Peñaherrera-Pazmiño, A. B., Isa-Jara, R. F., Hincapié-Arias, E., Gómez, S., Belgorosky, D., Agüero, E. I., Tellado, M., Eiján, A. M., Lerner, B., & Pérez, M. (2024). AQSA—Algorithm for Automatic Quantification of Spheres Derived from Cancer Cells in Microfluidic Devices. Journal of Imaging, 10(11), 295. https://doi.org/10.3390/jimaging10110295
Week 4 HW: Protein Design Part I
Week 4: Protein Design Part I
Part A: Conceptual Questions
Answering 9 questions:
How many molecules of amino acids do you take with a piece of 500 grams of meat? (on average an amino acid is ~100 Daltons)
What we know:
a. Meat ~ 20% of protein
b. 500 g meat = ~100 g of protein
c. Average mass of amino acid = ~100 Da = 100 g/mol
Solution:
Average amino acid mass ≈ 100 g·mol⁻¹
100 g protein ÷ (100 g·mol⁻¹) = 1 mol
Based on Avogadro’s number:
1 mol ≈ 6.02 × 10²³ molecules
In 500 g of meat its approx:
Solution: 6 x 10²³ amino acids
Why do humans eat beef but do not become a cow, eat fish but do not become fish?
Humans do not become what they eat because food is broken down during digestion into basic molecules such as amino acids, sugars, and fatty acids. These components lose their original biological identity and are then reused by the body to build human-specific proteins, tissues, and cells according to our own genetic code. While diet can influence gene expression (epigenetics), it does not change our DNA sequence or transform us into another organism.
Why are there only 20 natural amino acids?
There are only 20 standard amino acids because this set provides an optimal balance between chemical diversity, structural stability, and efficient genetic coding. Once this system evolved, the genetic code became evolutionarily “frozen,” since changes would disrupt existing proteins. These amino acids are sufficient to generate a vast diversity of protein structures and functions.
Can you make other non-natural amino acids? Design some new amino acids.
Yes, non-natural amino acids can be created using chemical synthesis and synthetic biology. Scientists can design amino acids with new side chains to introduce properties such as fluorescence, increased stability, or novel chemical reactivity. Additionally, engineered tRNA–synthetase systems allow cells to incorporate non-natural amino acids into proteins. These approaches expand the chemical diversity of proteins beyond the canonical 20 amino acids. Meat Science Laboratory
Where did amino acids come from before enzymes that make them, and before life started?
Before life existed, amino acids likely formed through abiotic chemical processes. The Miller–Urey experiment showed that simple gases, energy sources such as lightning, and heat could generate amino acids under early Earth conditions. Additionally, amino acids have been found in meteorites such as the Murchison meteorite, suggesting that some building blocks of life may have arrived from space.
If you make an α-helix using D-amino acids, what handedness (right or left) would you expect?
Amino acids are chiral molecules. When an α-helix is formed using D-amino acids, it adopts a left-handed helix, which is the mirror image of the right-handed α-helix formed by L-amino acids.
Why are most molecular helices right-handed?
Most biological helices are right-handed because they are built from L-amino acids. The geometry and steric interactions of L-amino acids favor right-handed helices, as this configuration minimizes steric clashes and is energetically more stable. This bias is a fundamental consequence of molecular chirality in biological systems.
Why do β-sheets tend to aggregate? What is the driving force for β-sheet aggregation?
β-sheets tend to aggregate because their structure is extended and exposes backbone hydrogen-bond donors and acceptors. Unlike α-helices, which are internally stabilized by hydrogen bonds, β-strands can easily form hydrogen bonds with neighboring strands from other molecules.
This makes β-sheets “sticky” in a structural sense. When partially unfolded proteins expose β-prone regions, they can align side by side and form intermolecular hydrogen bonds, creating extended sheet-like assemblies.
The main driving forces are:
a. Hydrogen bonding between peptide backbones
b. Hydrophobic interactions between side chains
c. Minimization of free energy
Aggregation often occurs because forming intermolecular β-sheets lowers the system’s overall free energy compared to exposed, unstable regions.
Why do many amyloid diseases form β-sheets? Can you use amyloid β-sheets as materials?
First, Many amyloid diseases form β-sheets because misfolded proteins often rearrange into highly stable cross-β structures. The β-sheet conformation allows proteins to stack into long fibrils stabilized by repetitive hydrogen bonding.
These fibrils are very stable, resistant to degradation, and tend to accumulate in tissues. Diseases like Alzheimer’s involve amyloid-β peptides that misfold and form β-sheet-rich fibrils.
Second, yes, It could be possible to use amyloid as materials since they are strong structures. Maybe use in nanomaterials or biomaterials. Take this approach from a negative nature that can cause a disease, biology could use it with another point on view.
Part B: Protein Analysis and Visualization
Briefly describe the protein you selected and why you selected it
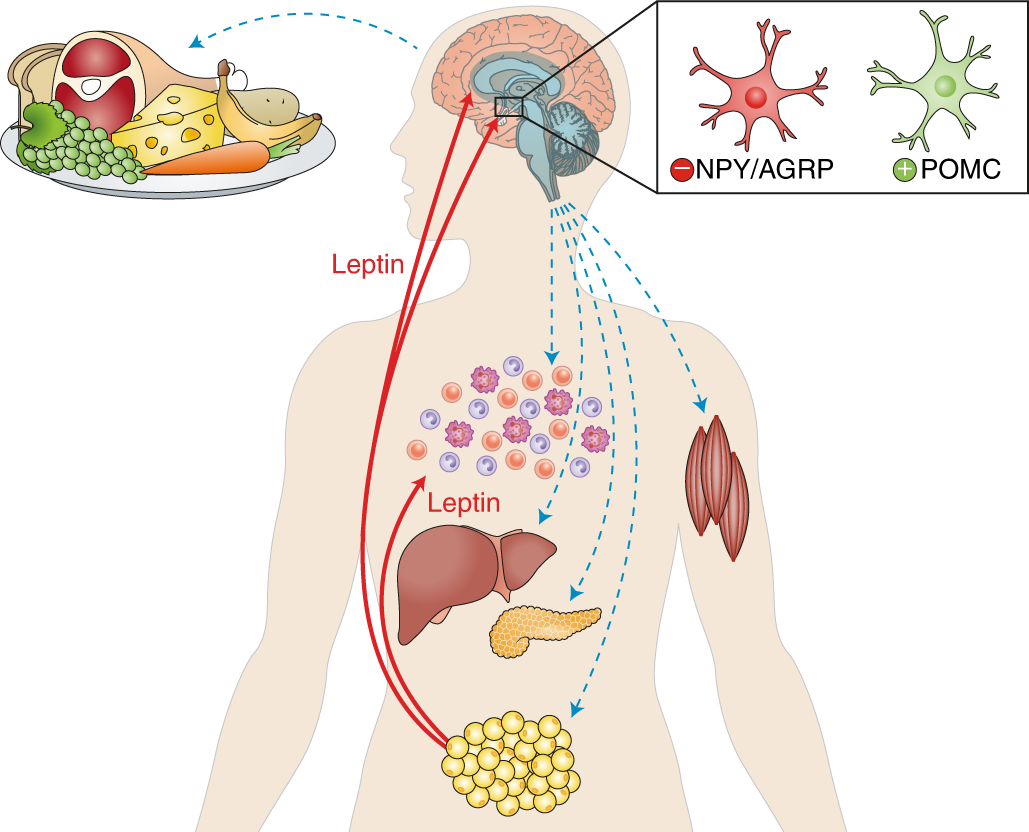
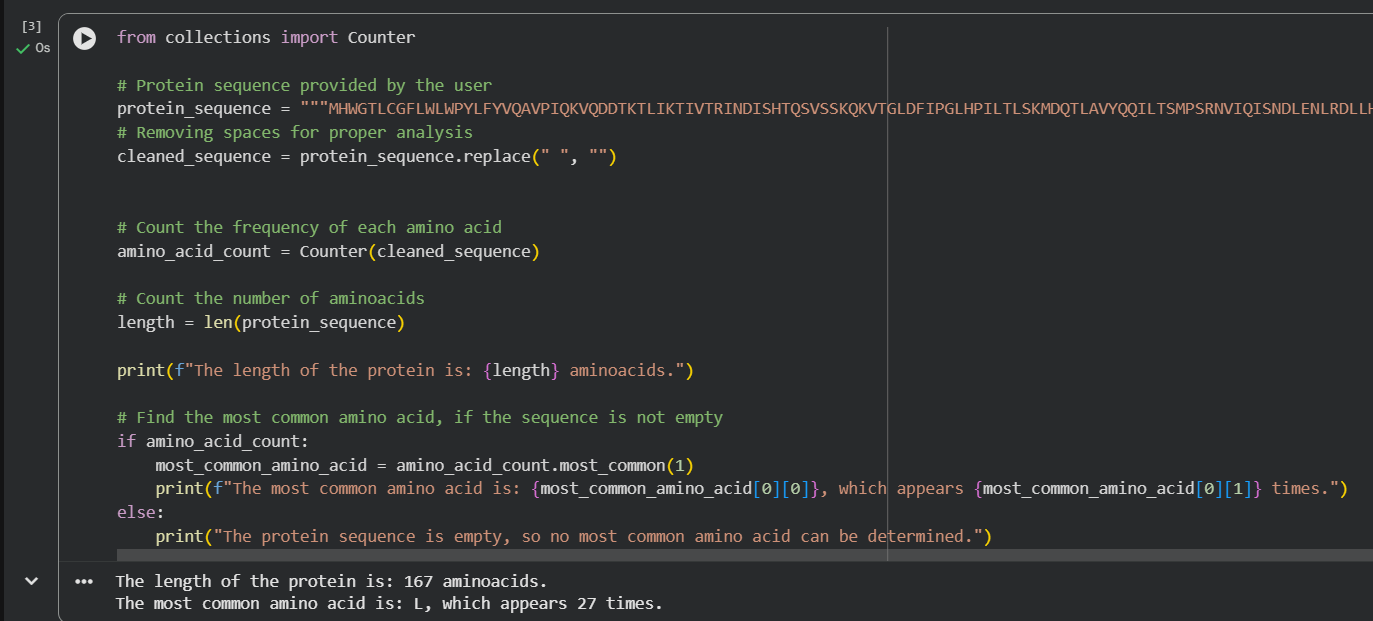
I selected leptin (P41159 · LEP_HUMAN), a hormone that regulates energy balance and satiety in mammals. Leptin is produced mainly by adipose tissue and acts on receptors in the hypothalamus to signal that the body has sufficient energy reserves. I chose this protein because it plays an important role in metabolic regulation and appetite control, and mutations in leptin signaling can lead to severe obesity.
For the length and frequency, the Colab notebook was used:
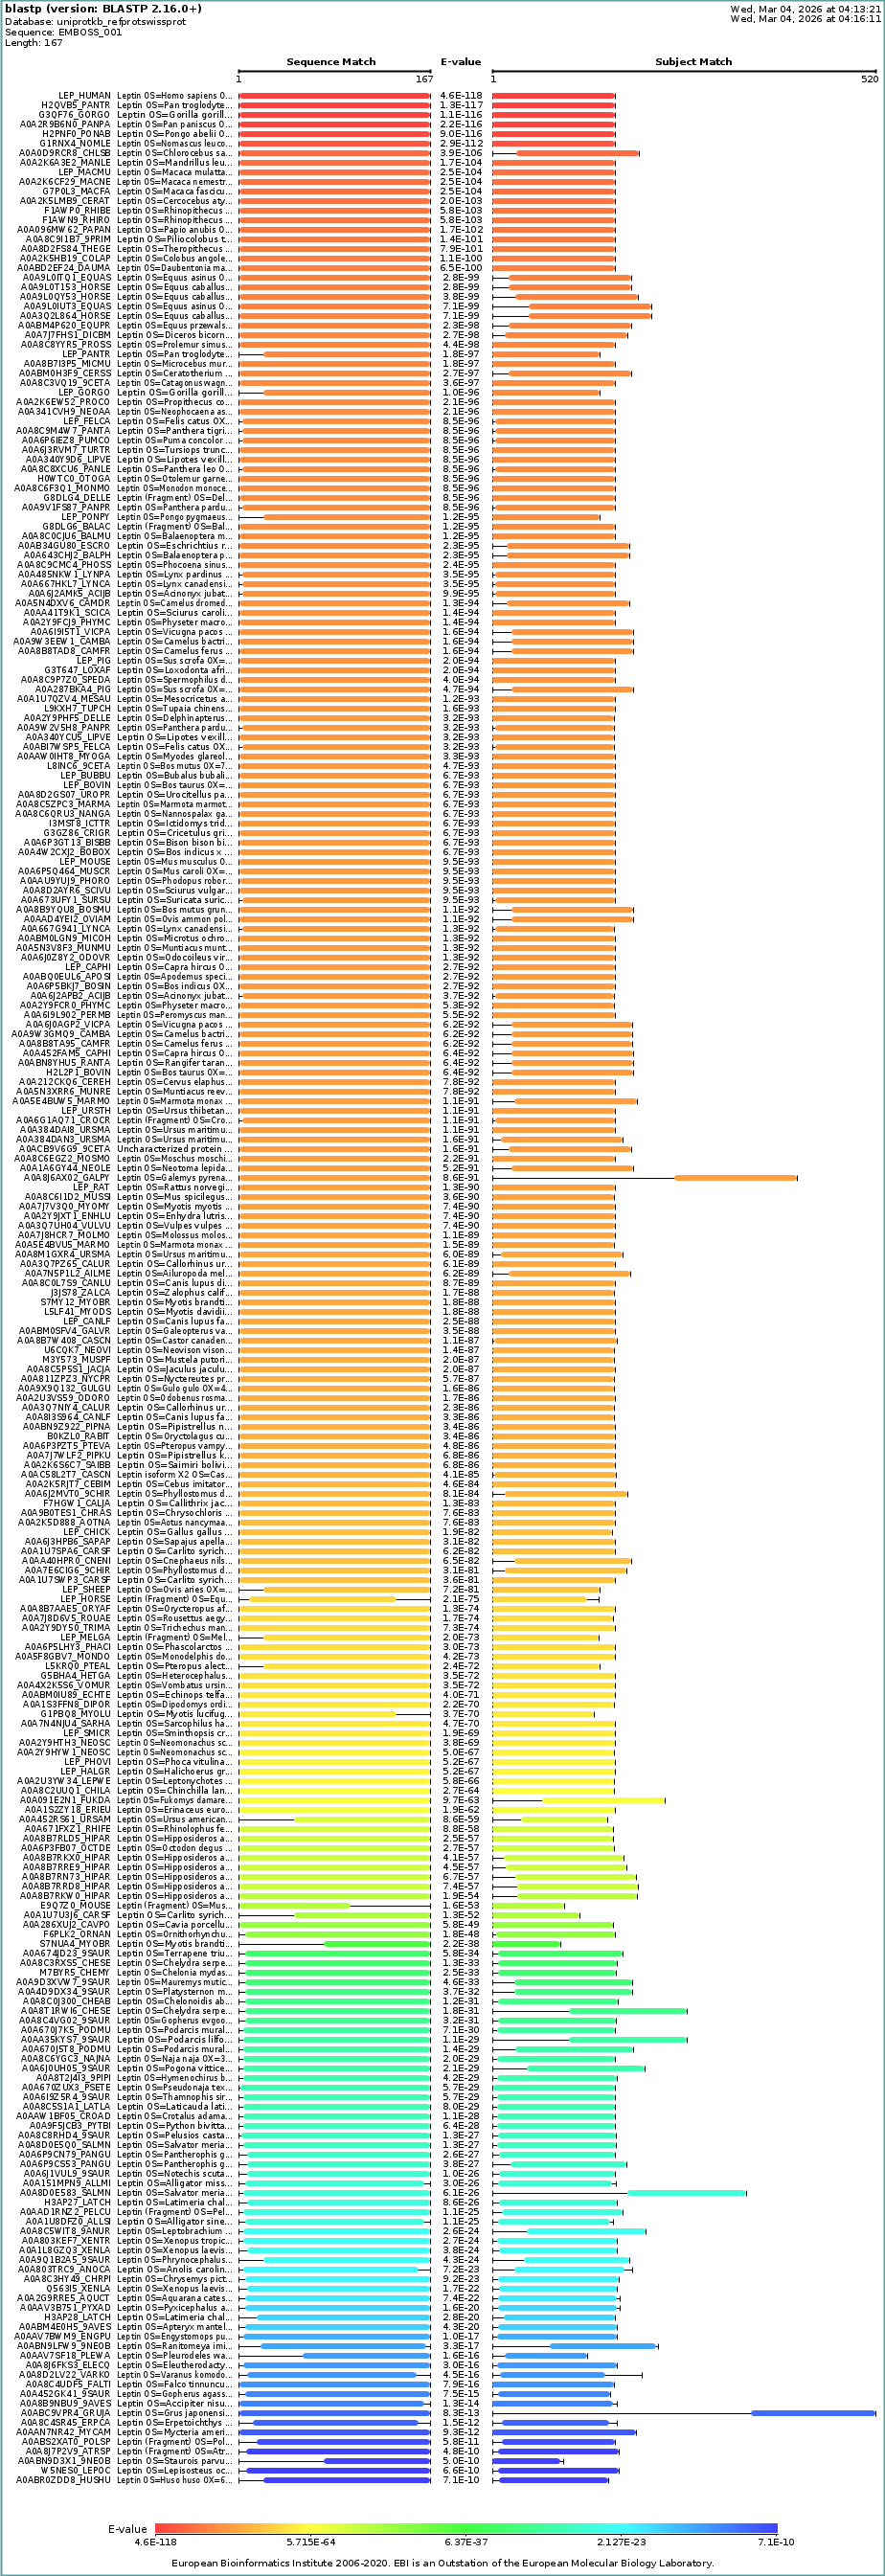
c. Homologs
Description: BLAST search in UniProt reveals many homologous sequences across vertebrates, particularly mammals. The strong similarity and low E-values indicate that leptin is highly conserved across species due to its essential role in metabolic regulation
d. Protein family
Yes. According to UniProt and InterPro, leptin belongs to the leptin protein family and is structurally classified within the four-helix cytokine-like family. These proteins share a characteristic four-helix bundle fold, which is common among signaling molecules such as cytokines and growth factors. Databases such as Pfam (PF02024), InterPro (IPR009079), and PANTHER also classify leptin within this conserved protein family. Unipro family
Identify the structure page of your protein in RCSB:
RCSB Structure Selection (Leptin):
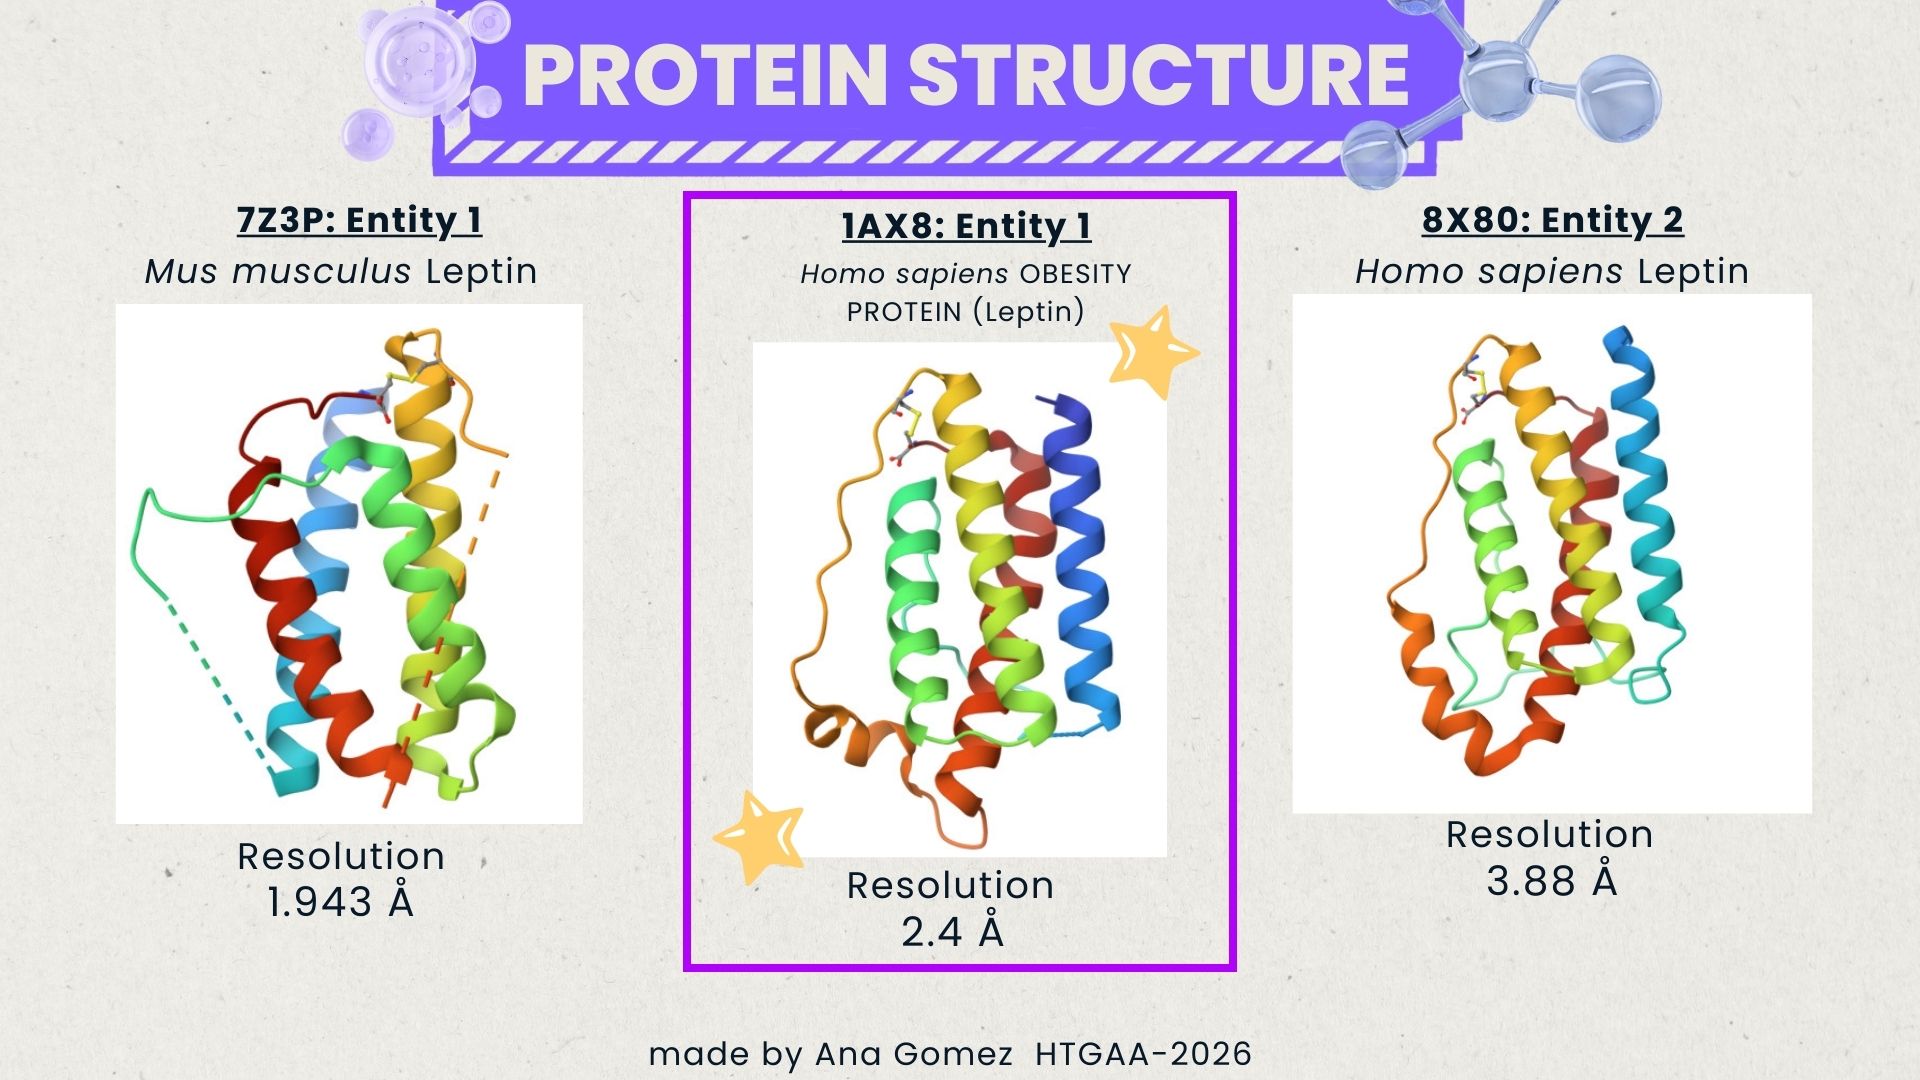
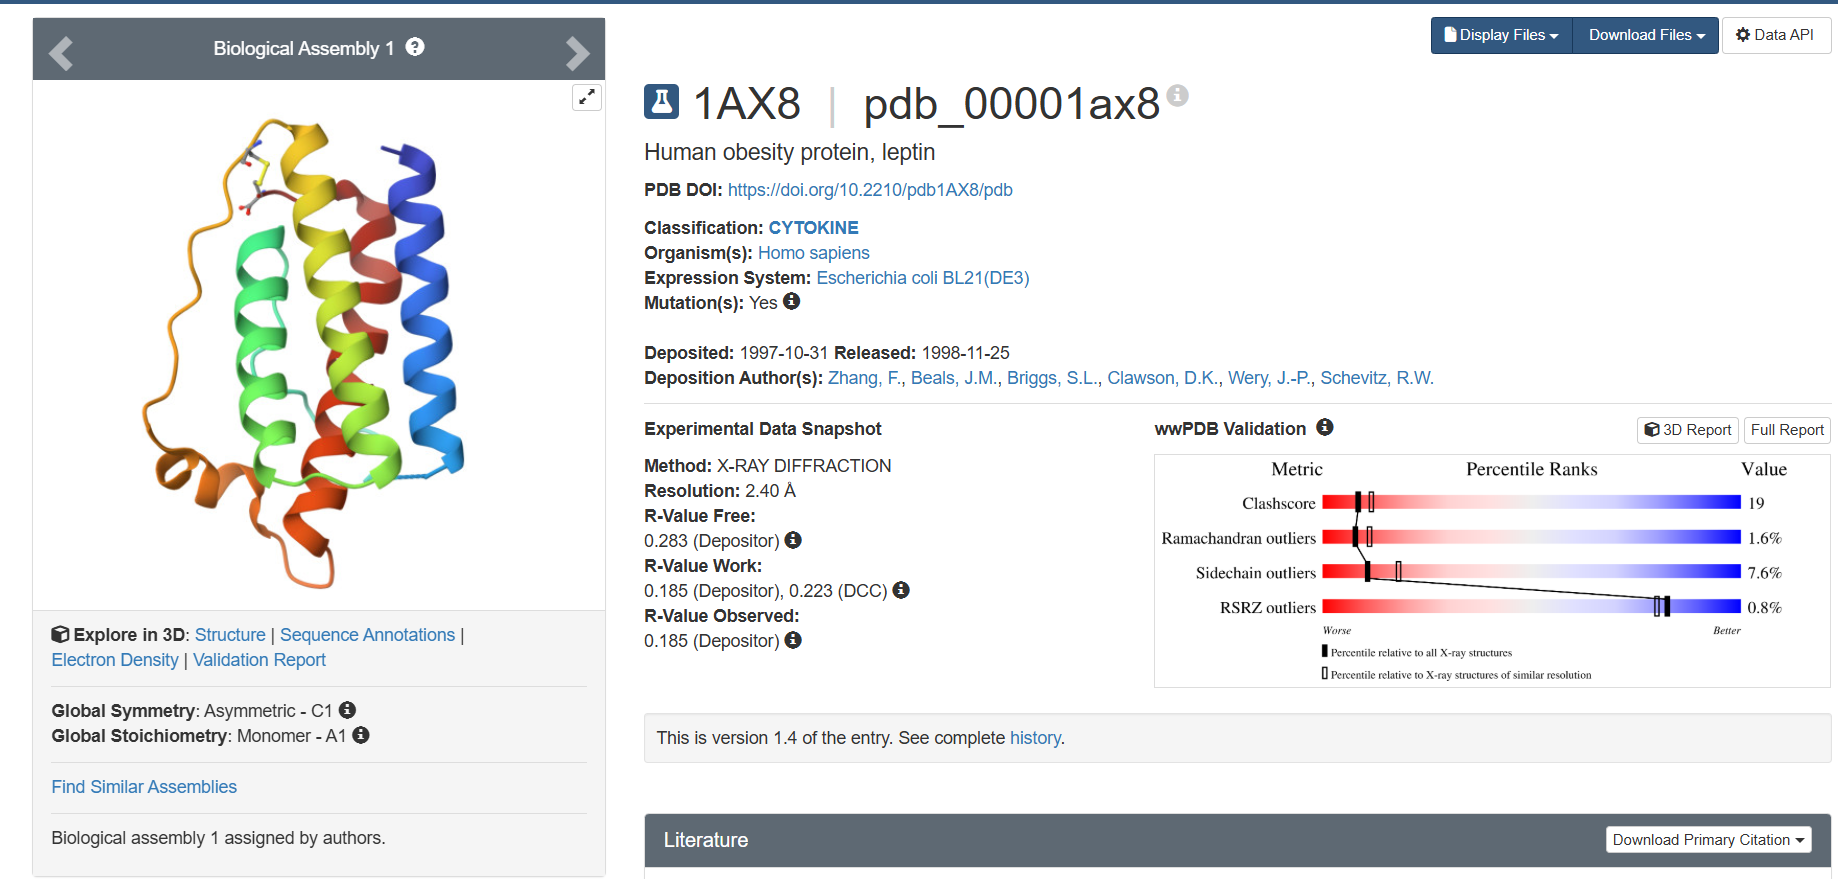
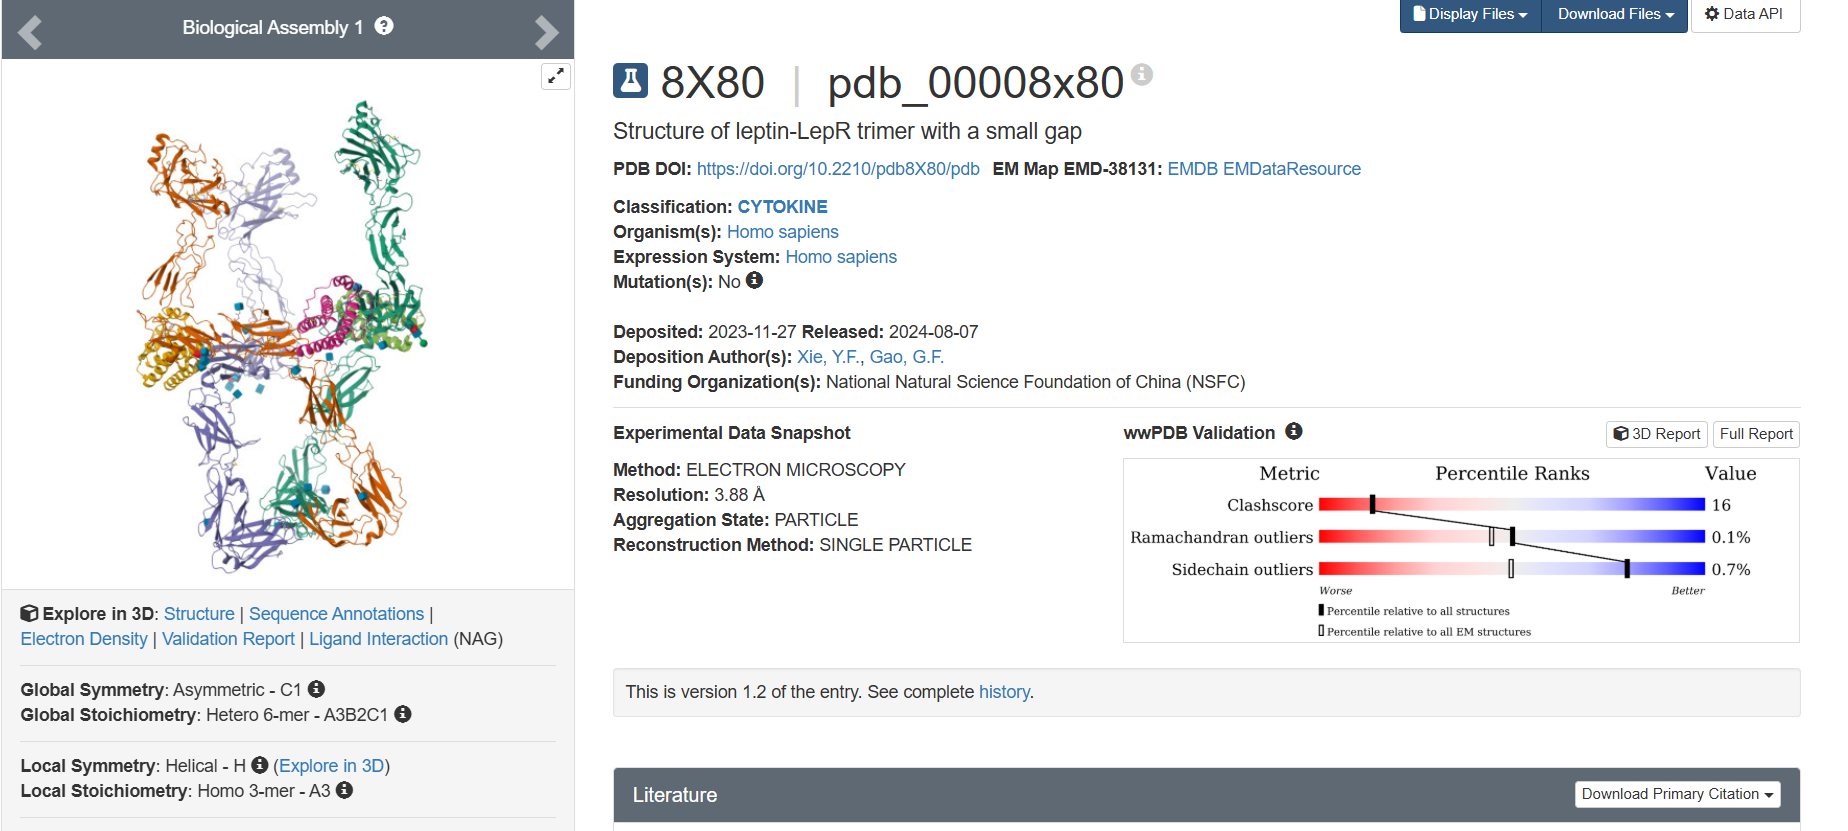
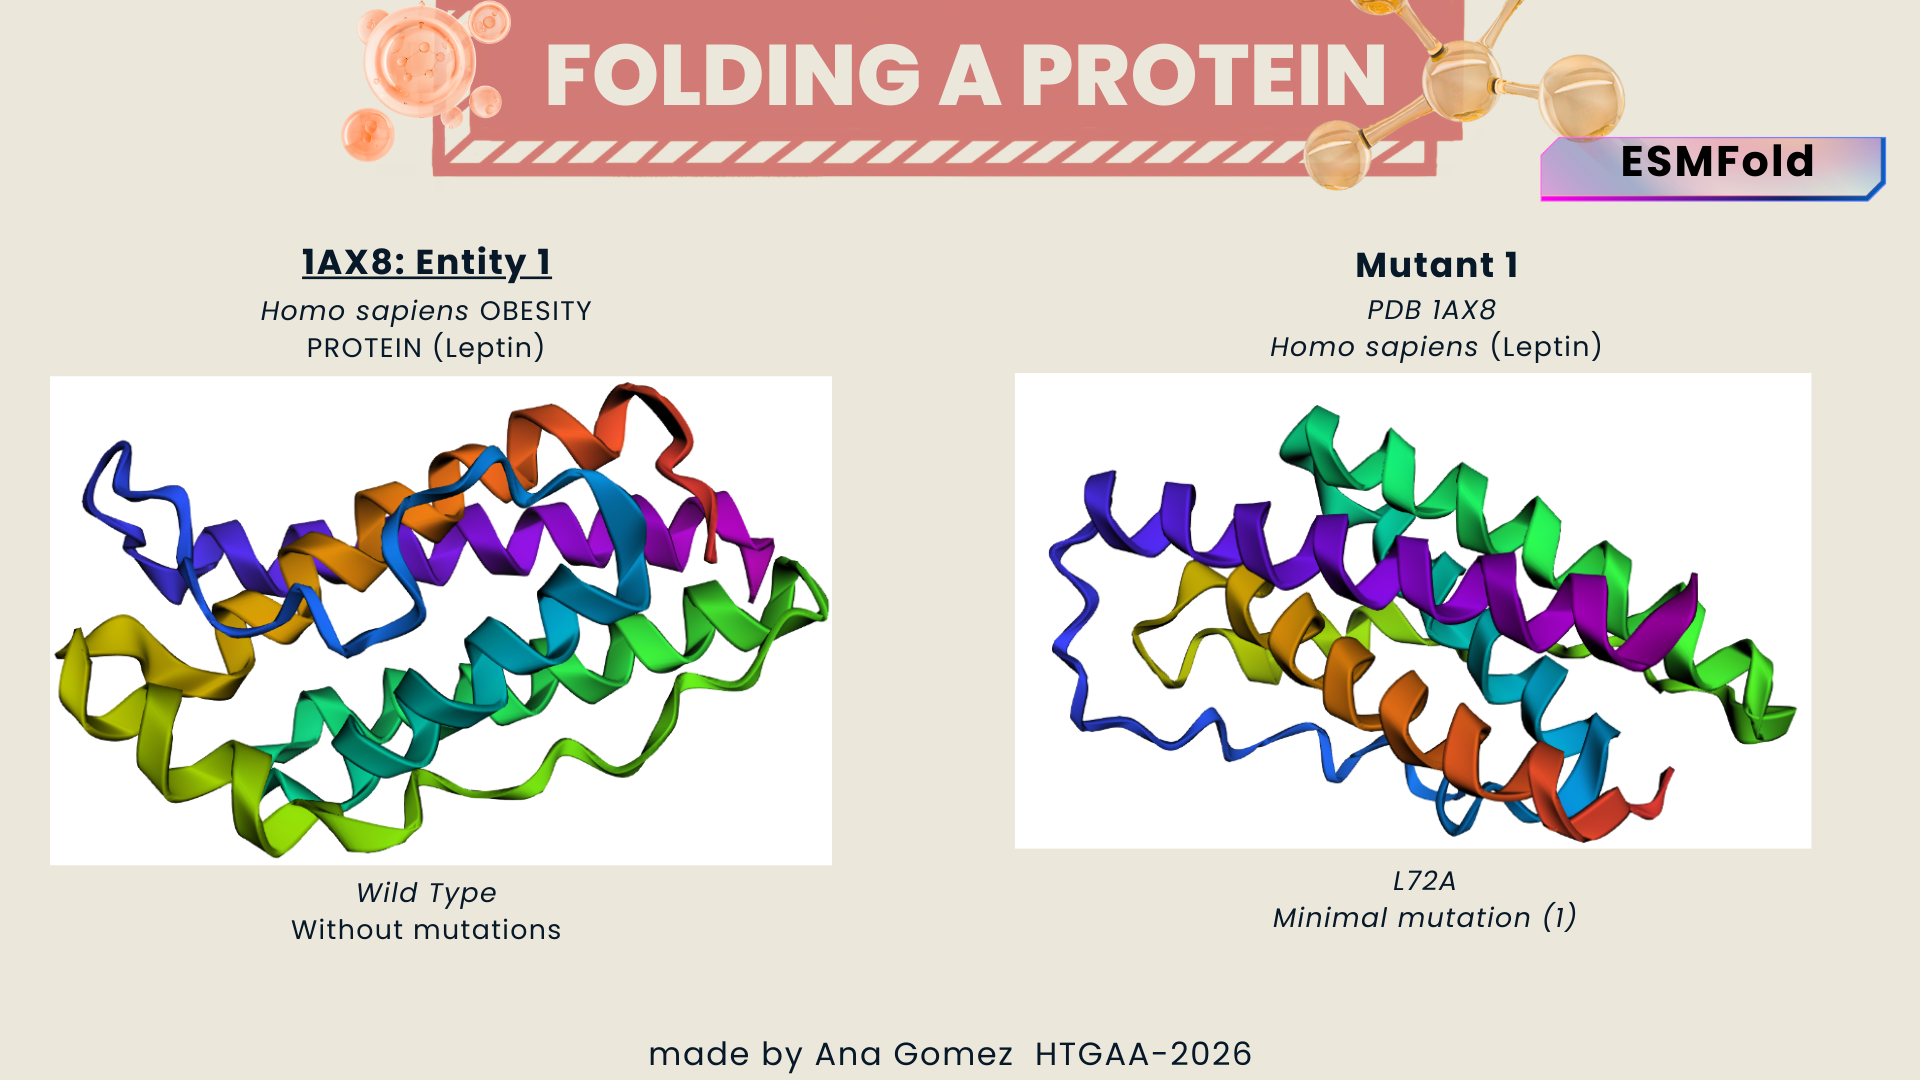
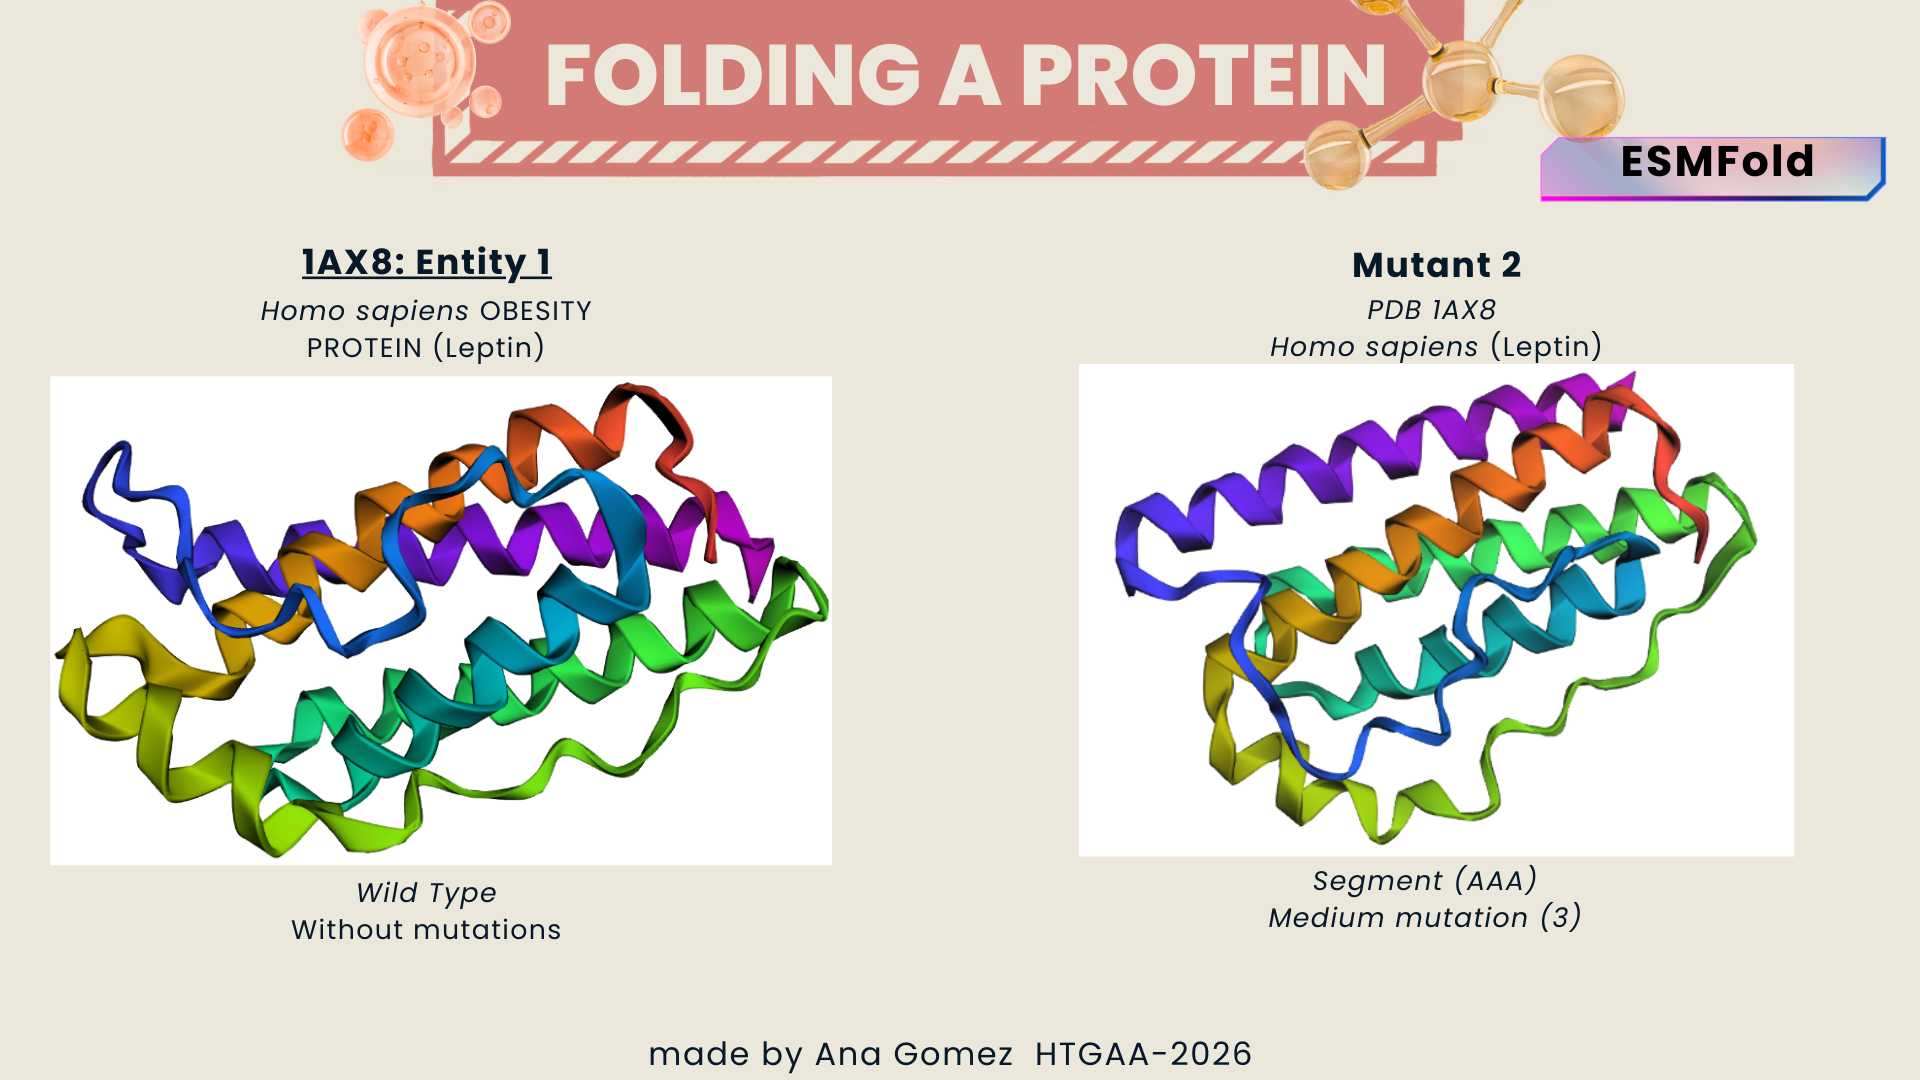
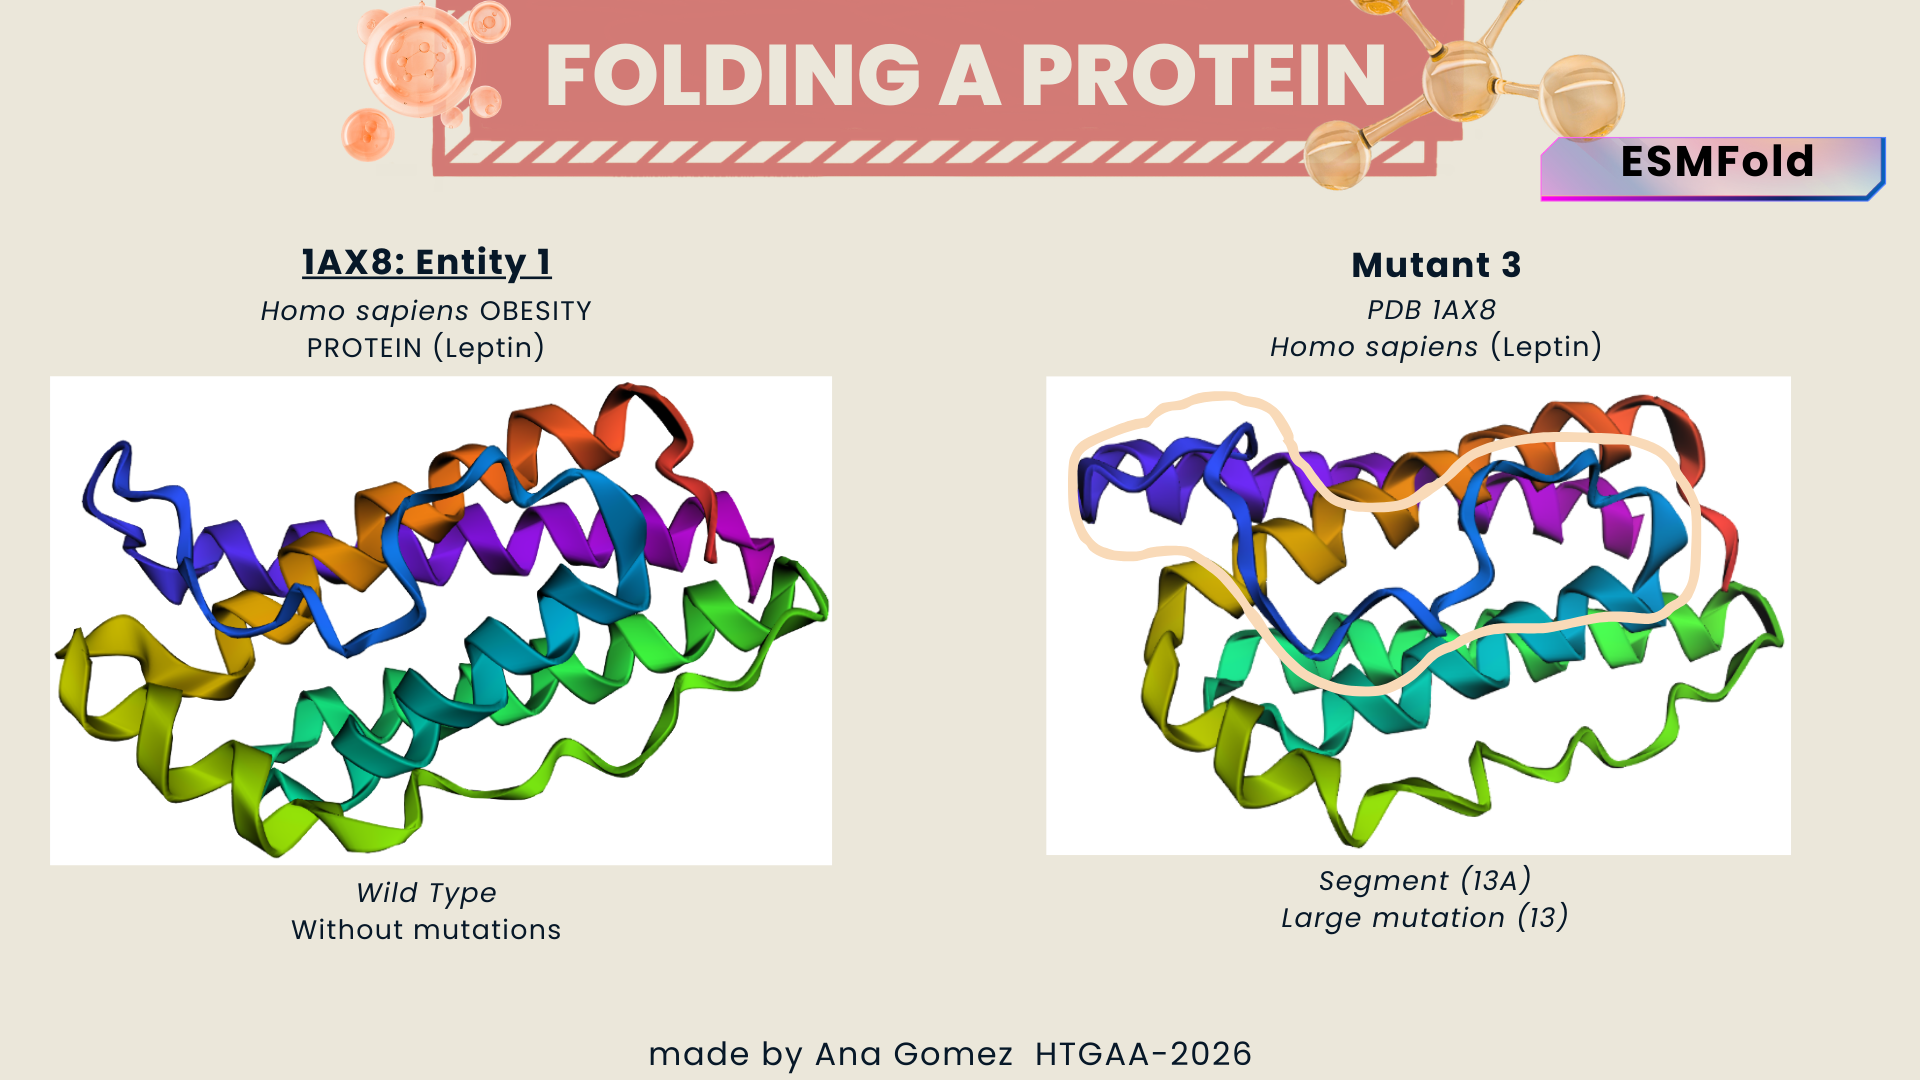
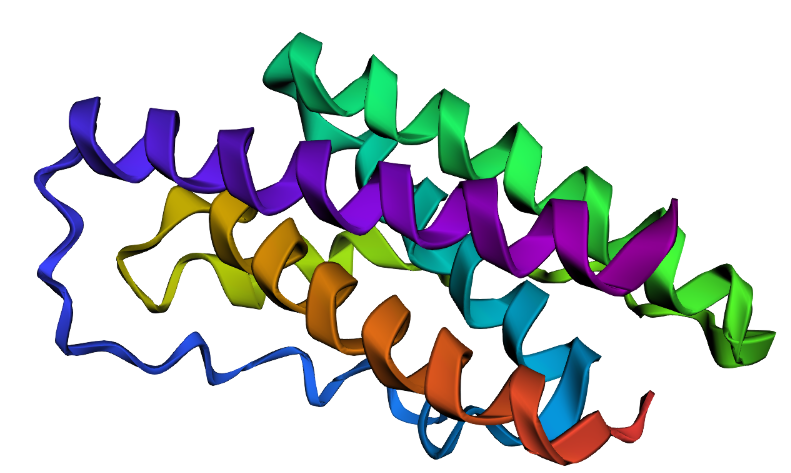
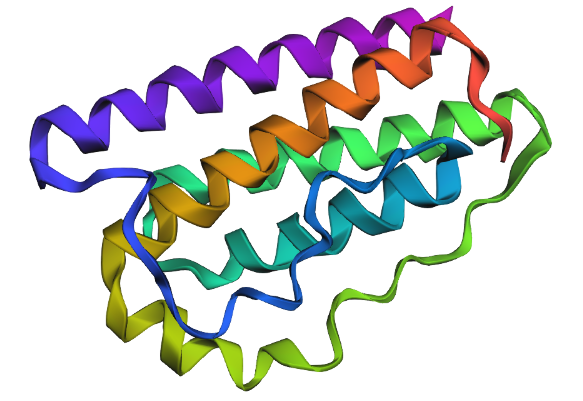
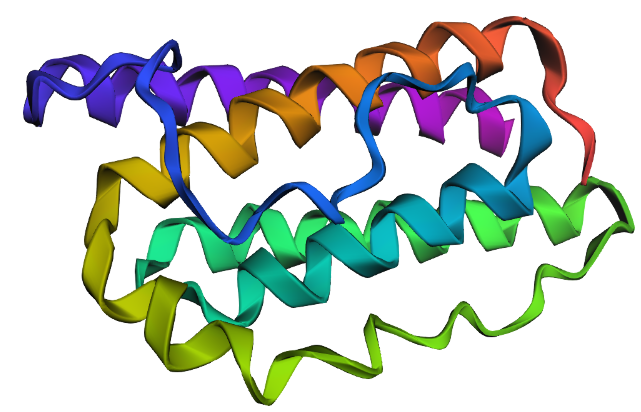
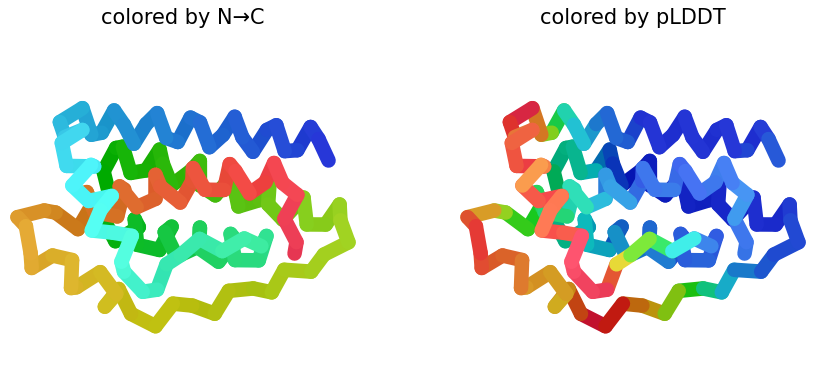
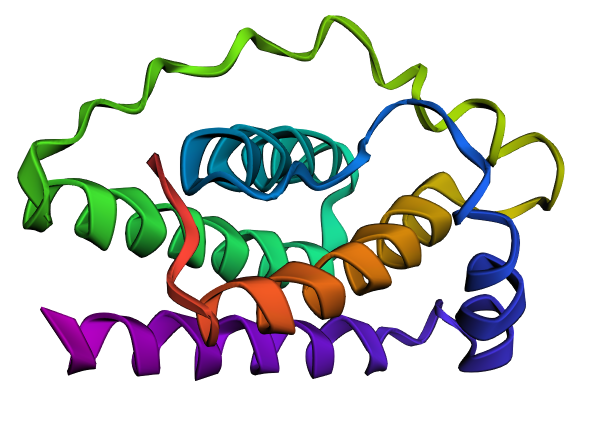
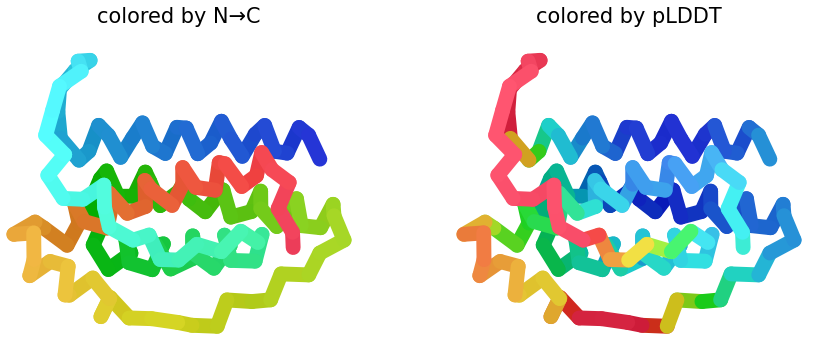
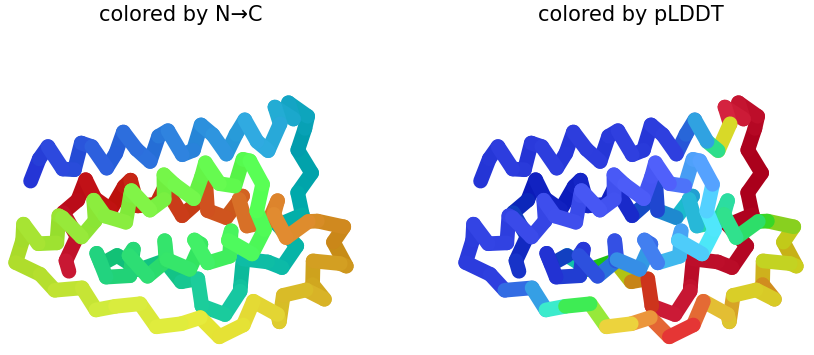
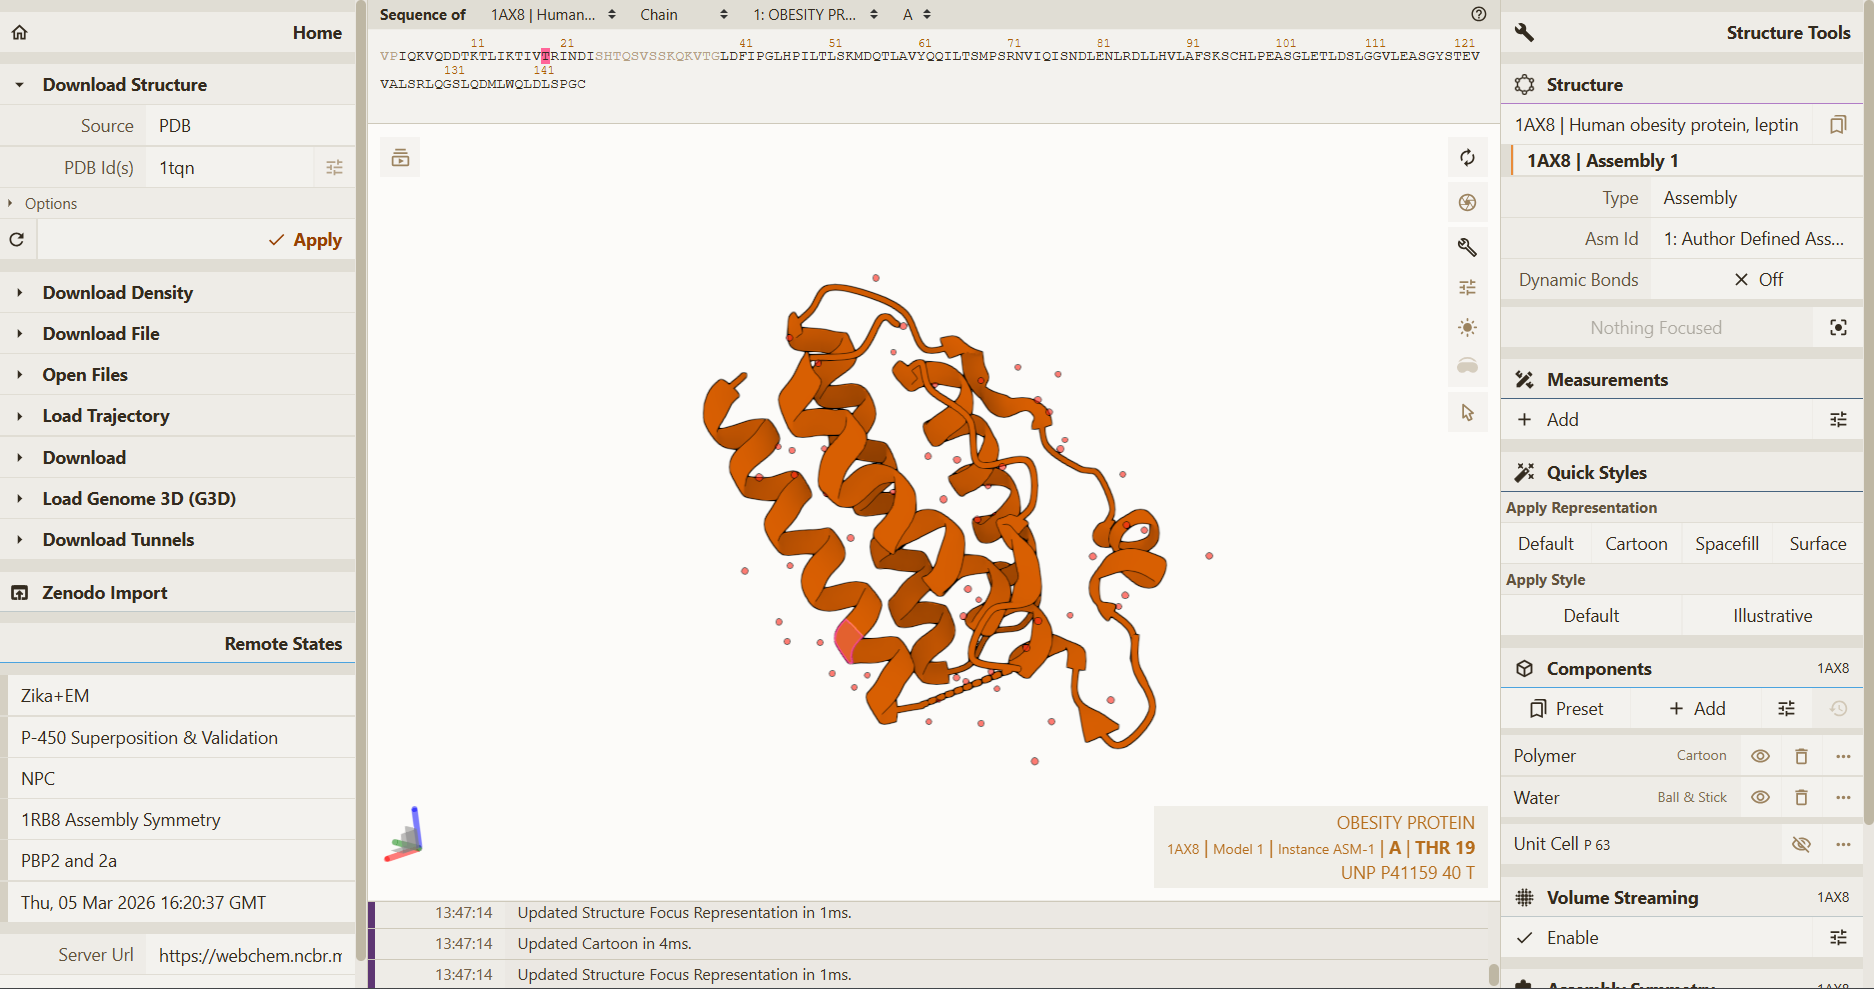
I explored several RCSB PDB entries for leptin. The highest-resolution structure I found was a mouse leptin–receptor fragment complex (PDB 7Z3P, X-ray diffraction, ~1.95 Å). However, because my focus is on human leptin and I wanted a simpler structure for visualization and residue-level analysis, I selected PDB 1AX8 (human leptin), which was solved by X-ray diffraction at 2.4 Å resolution and released on 1998-11-25. Since the resolution is below 2.7 Å, this is considered a good-quality structure for analyzing secondary structure and surface properties.
Additionally, I also looked at recent human leptin–LePR complexes solved by cryo-EM (e.g., 8X80/8X81, ~3.8 Å). These are useful for understanding receptor binding, but their lower resolution makes them less ideal for fine structural details compared to X-ray structures. These observations are showed on the Figure 2.
Fig.2 Structure selection Leptin
Are there any other molecules in the solved structure apart from the protein?
RCSB PDB entries:
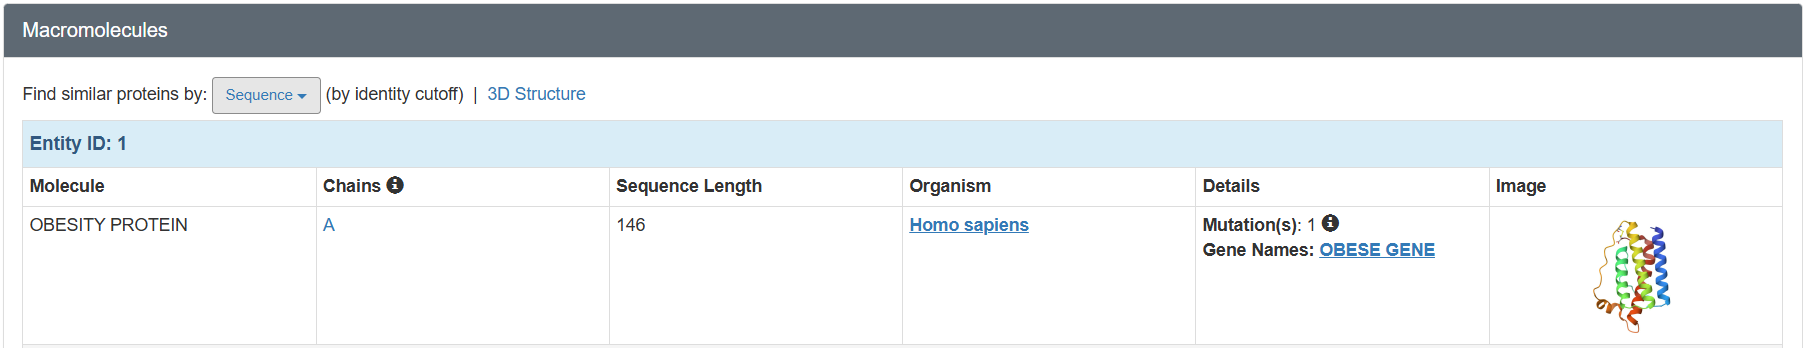
In PDB 1AX8, the structure is mainly the leptin protein chain (monomer). X-ray structures often include crystallographic water molecules and sometimes buffer ions, but there are no major non-protein ligands reported in this entry. DOI: https://doi.org/10.2210/pdb1AX8/pdb
Additionally, I decided to check on the recent entry 8X80, since this entry has Ligand Interaction (NAG)
The leptin is solved as part of a leptin–leptin receptor (LePR) complex, meaning the entry contains additional protein chains besides leptin. The structure also includes glycan components such as NAG (N-acetylglucosamine), commonly associated with protein glycosylation. DOI: https://doi.org/10.2210/pdb8X80/pdb
Extra:
Table 2. Characteristics of PDB 1AX8
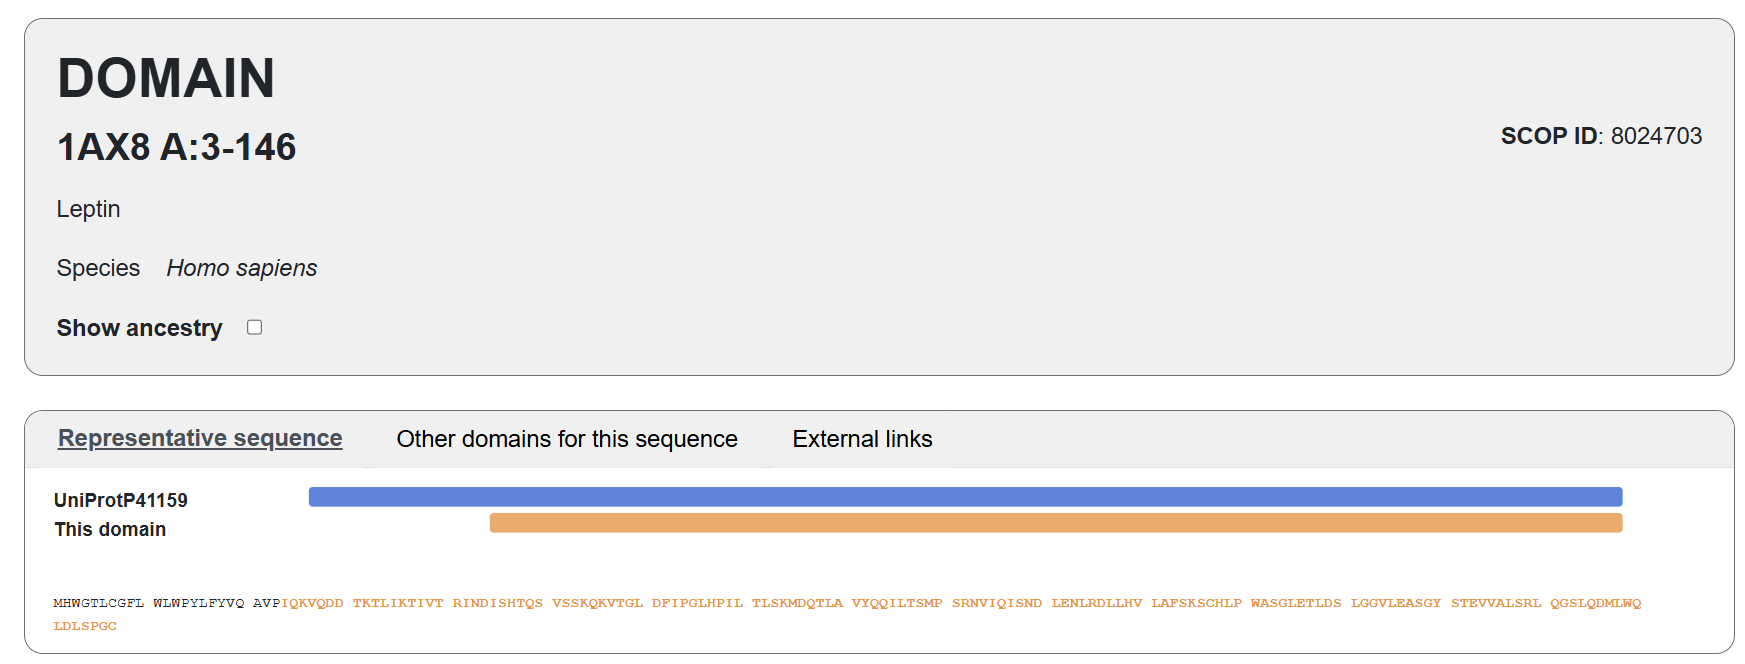
Does your protein belong to any structure classification family?
Leptin belongs to the four-helix bundle cytokine family (a “four-helical cytokine-like core” fold), consistent with its mainly alpha-helical structure.
https://www.rcsb.org/annotations/1AX8. Also, the visualization in SCOP:
Open the structure of your protein in any 3D molecule visualization software:
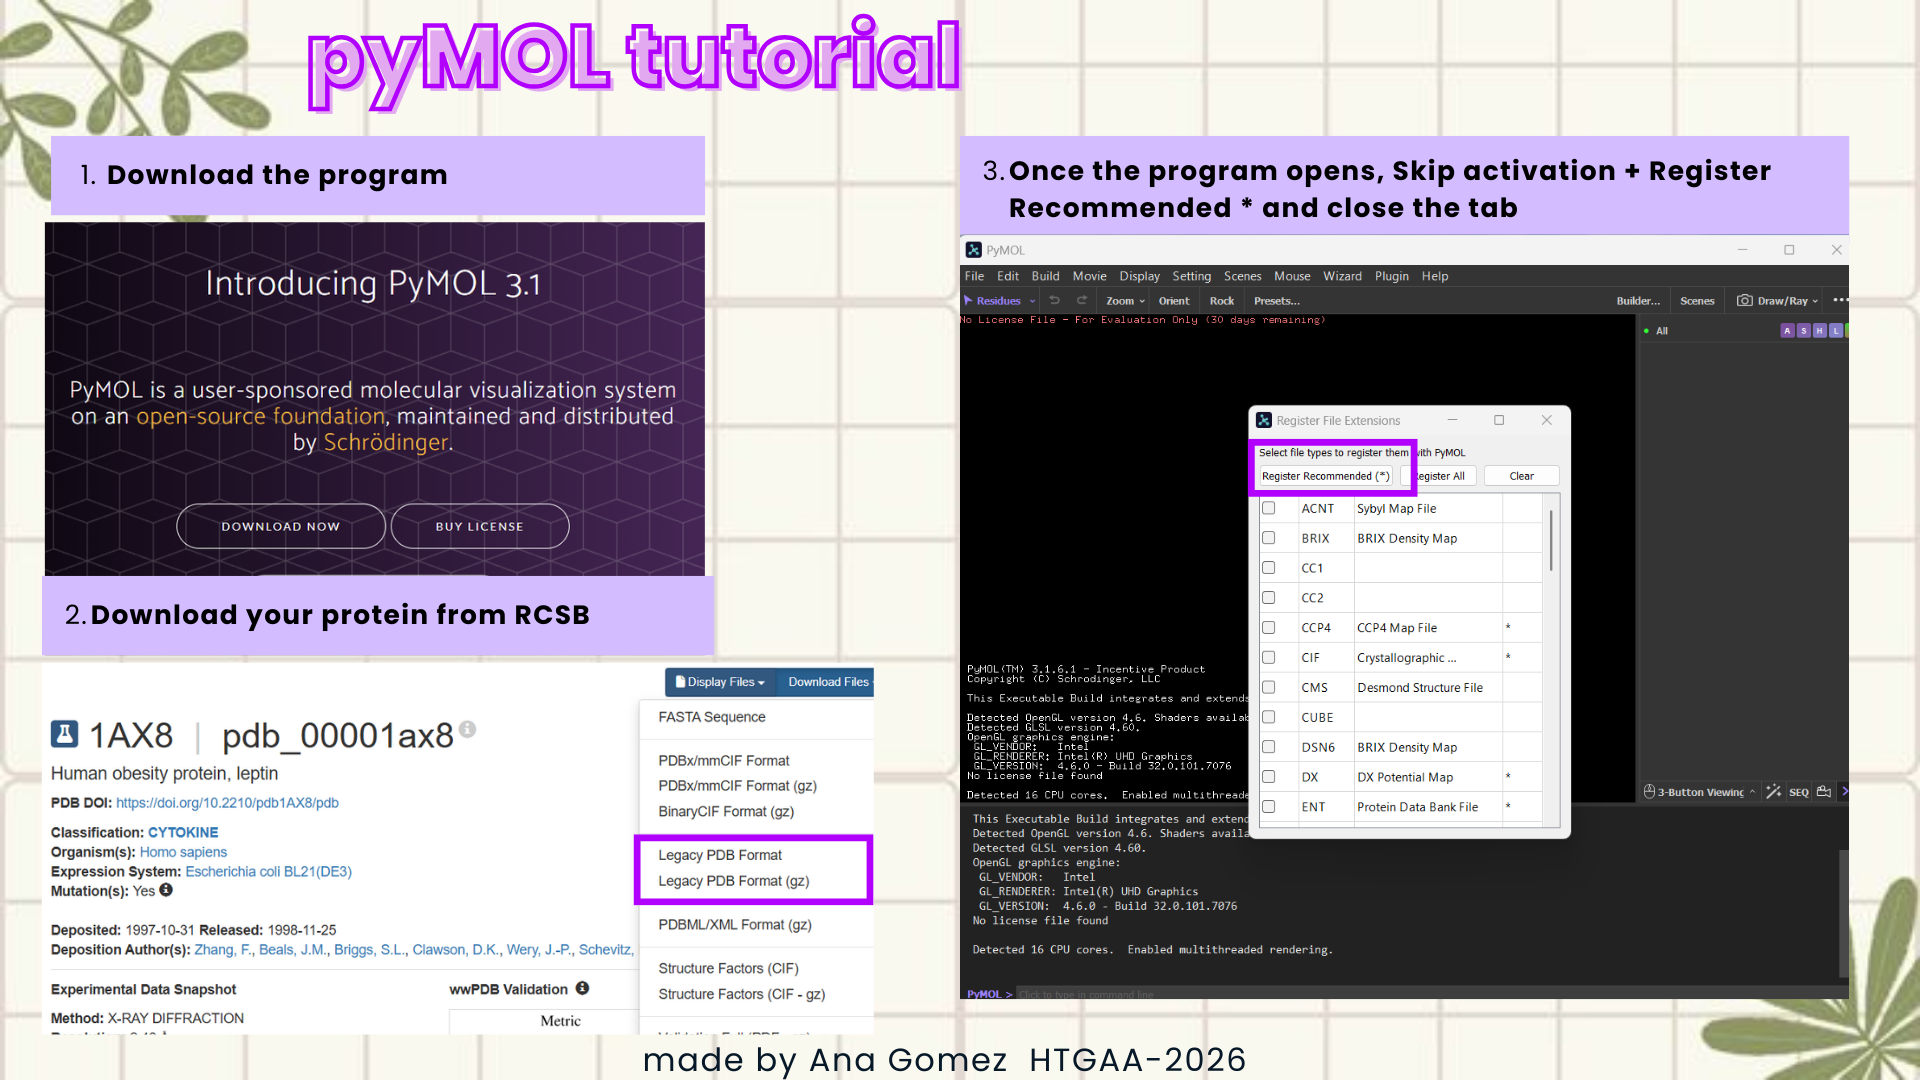
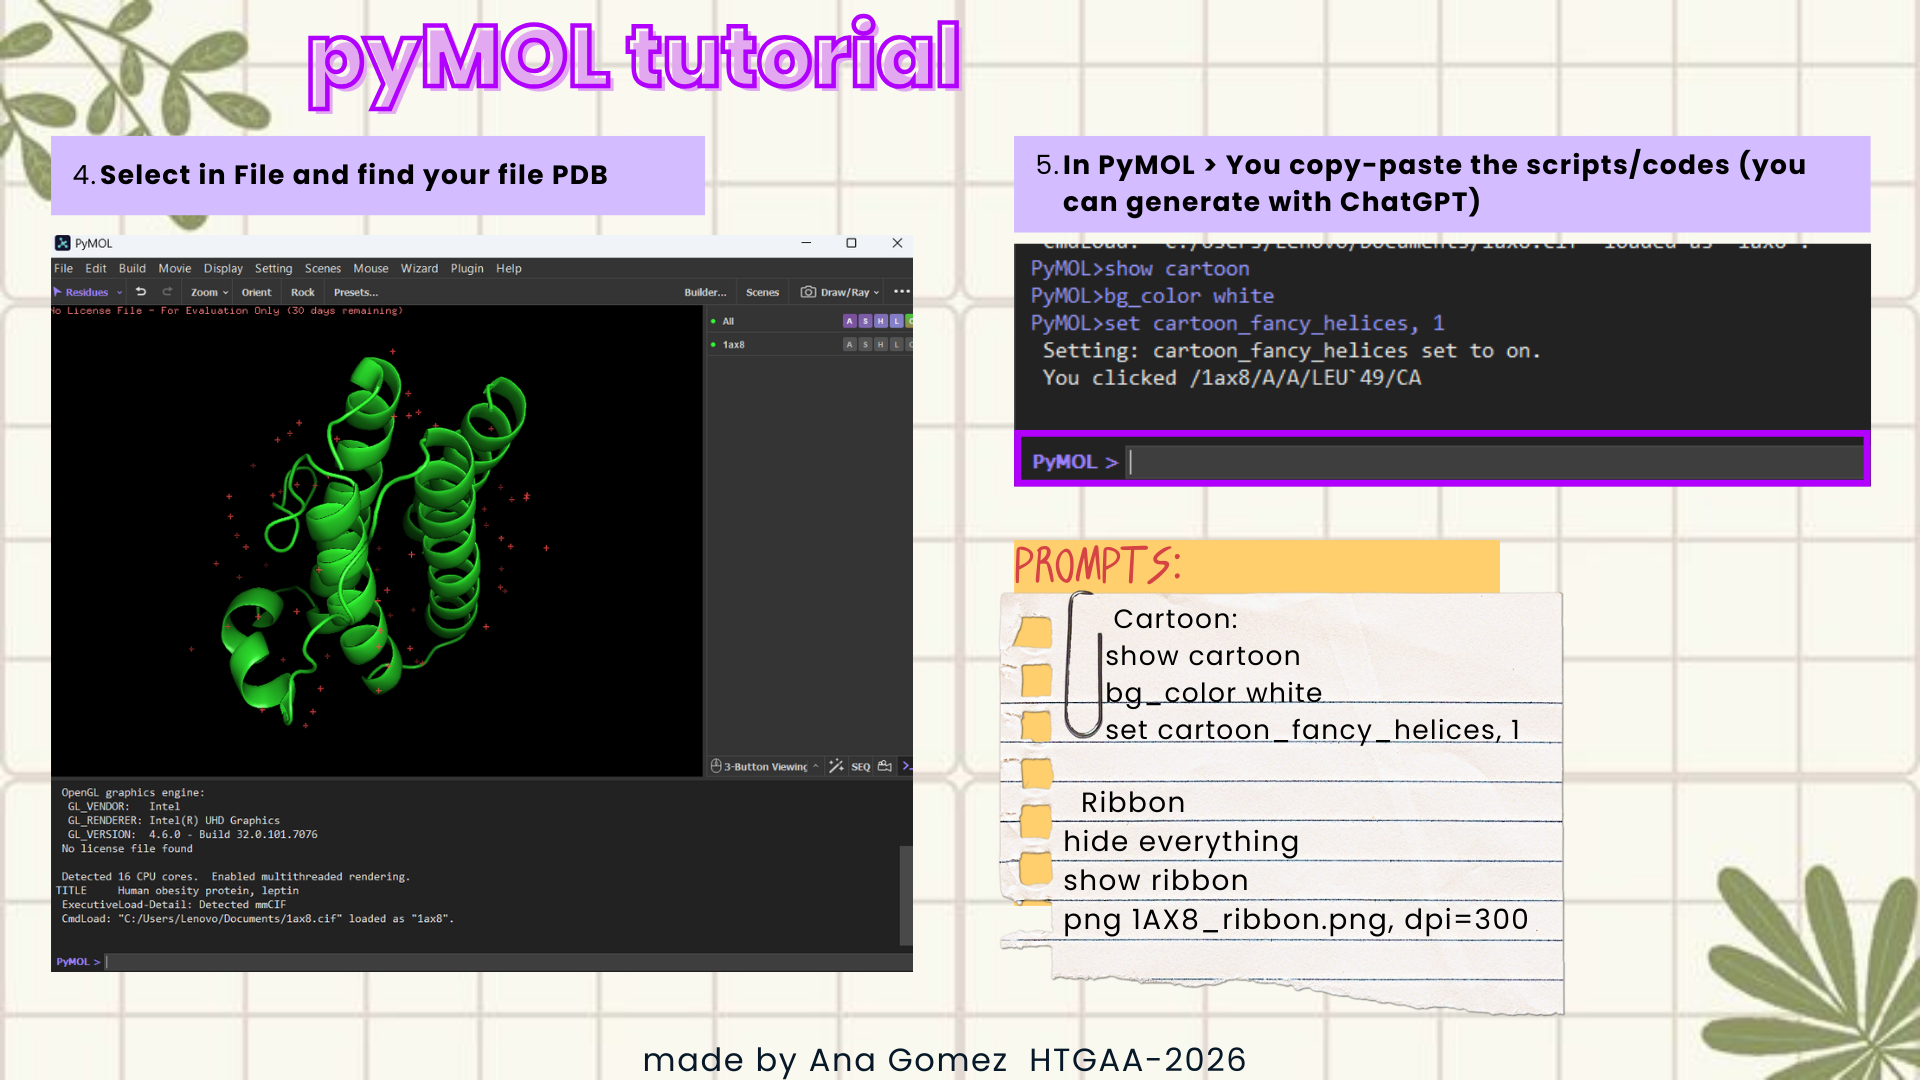
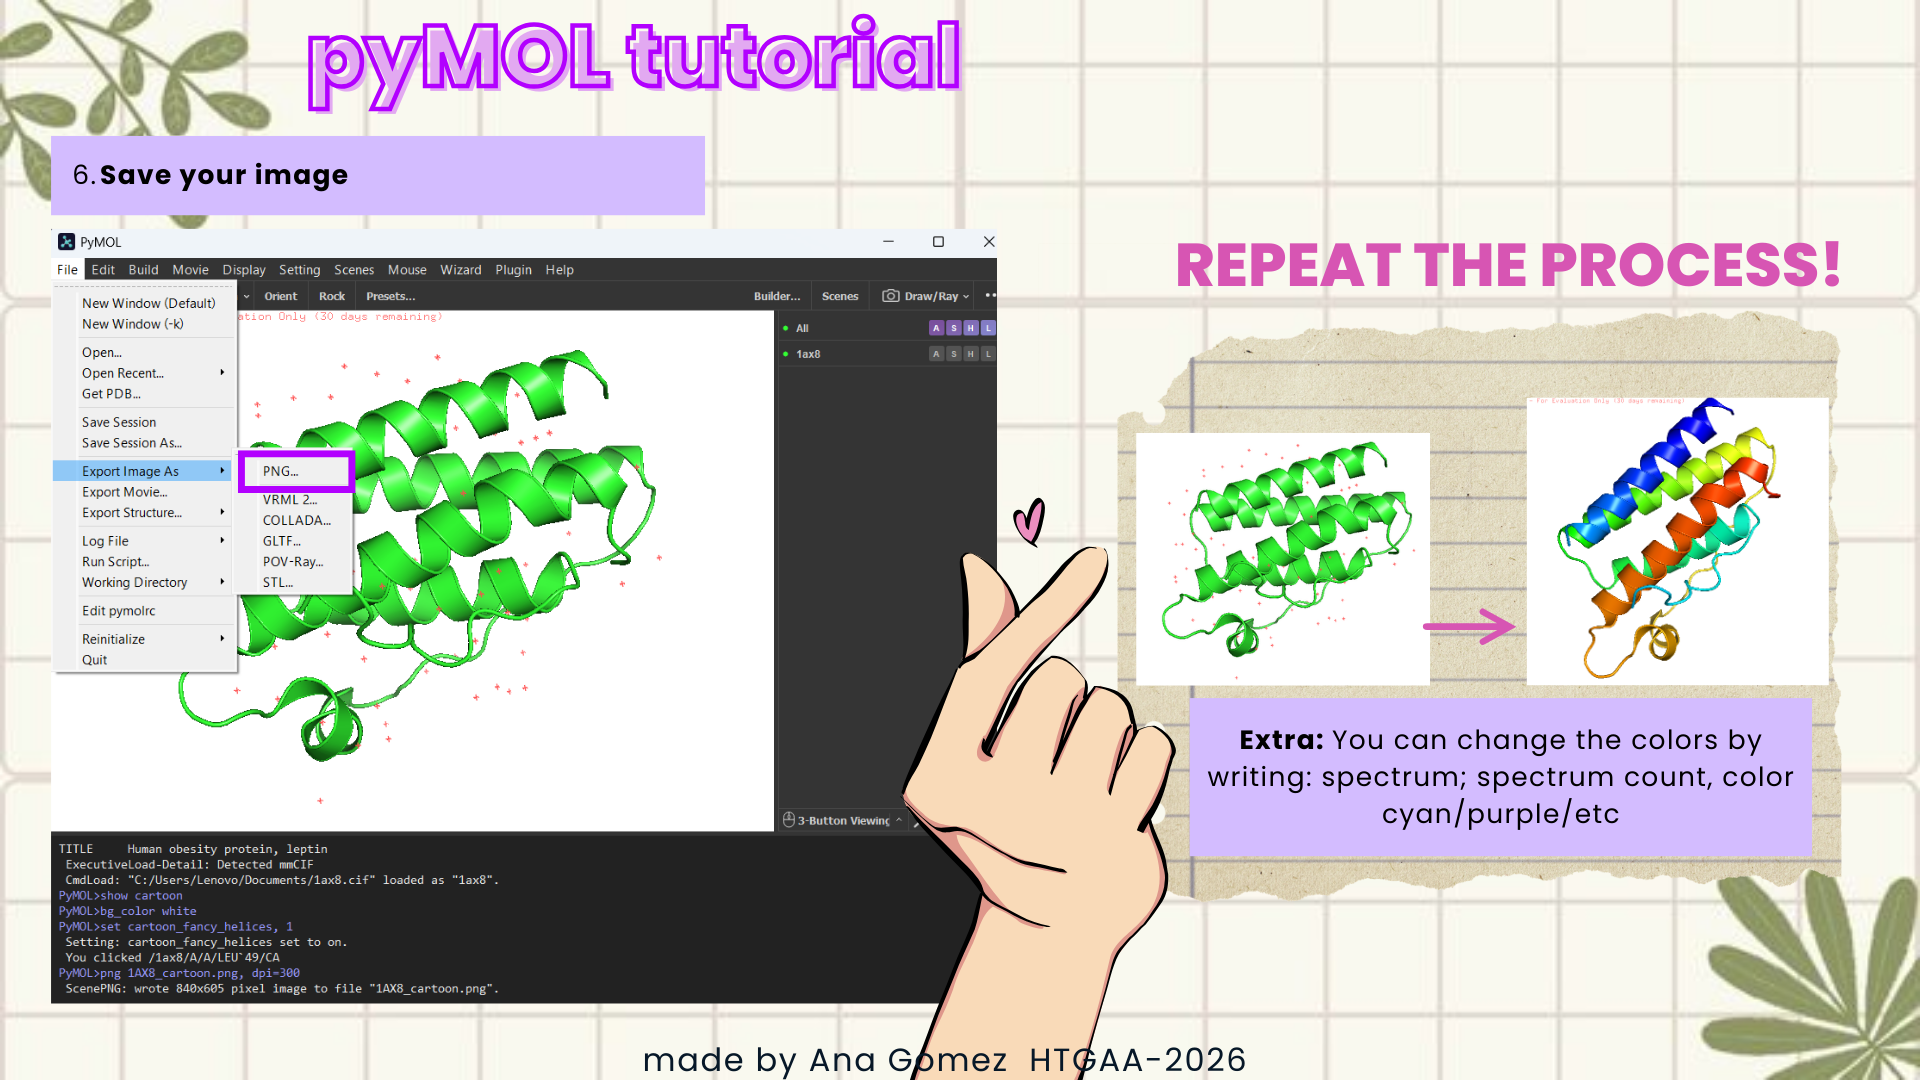
Disclaimer: For the PyMol section, I used ChatGPT 5.2 to help me with the commands.
Documentation:
This is a small visual tutorial that I follow to obtain the graphics for this section. (Click on the images to zoom in!)
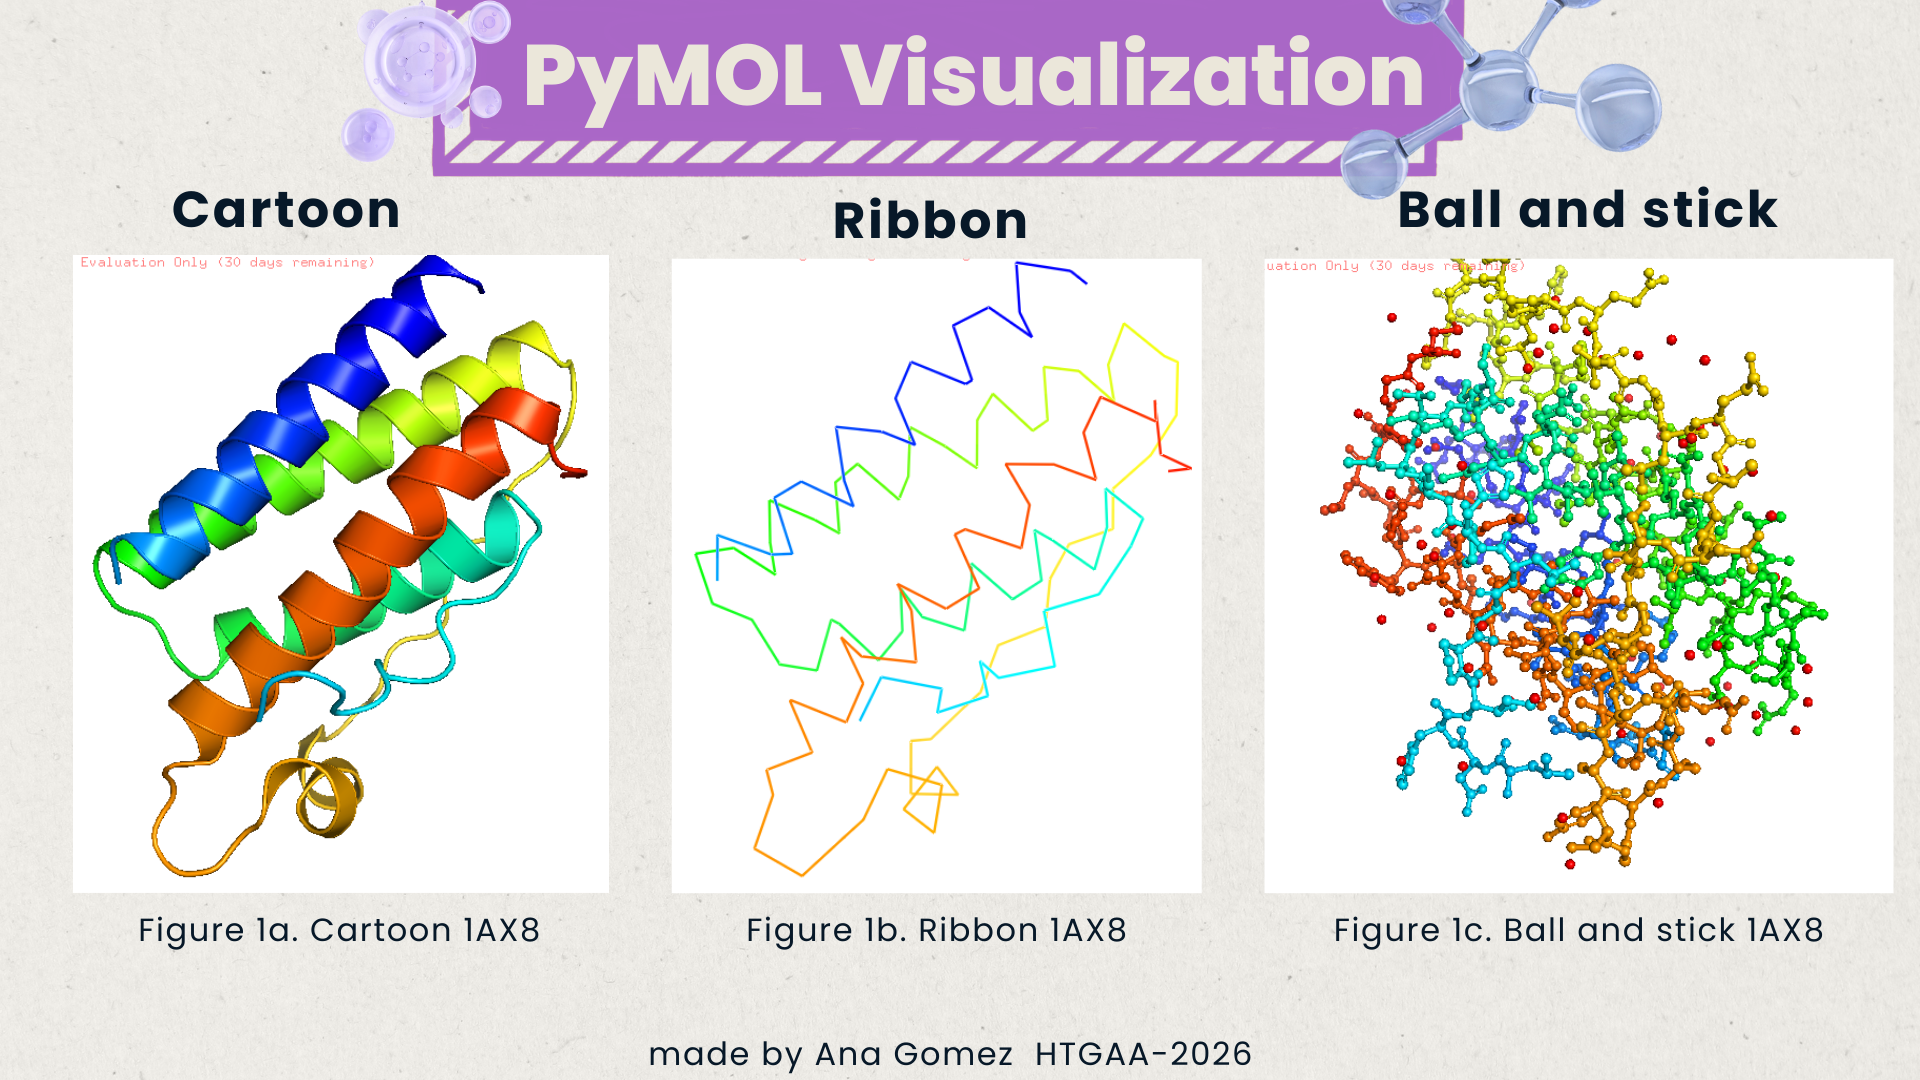
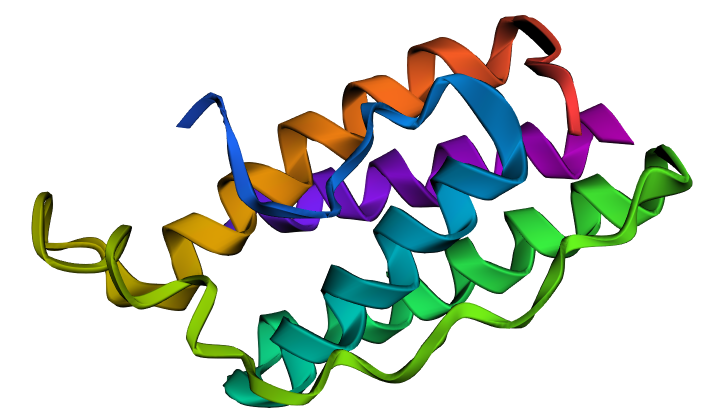
Visualize the protein as “cartoon”, “ribbon”, and “ball and stick”
Color the protein by secondary structure. Does it have more helices or sheets?
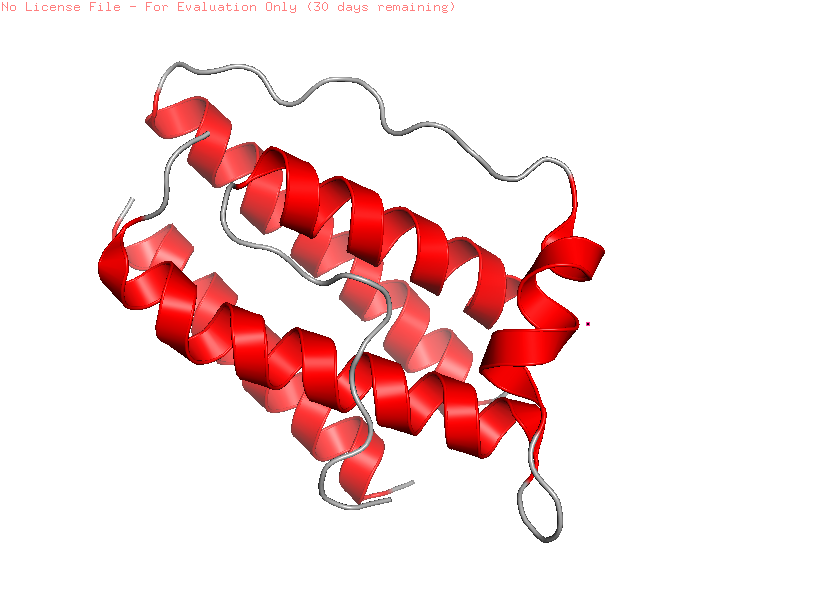
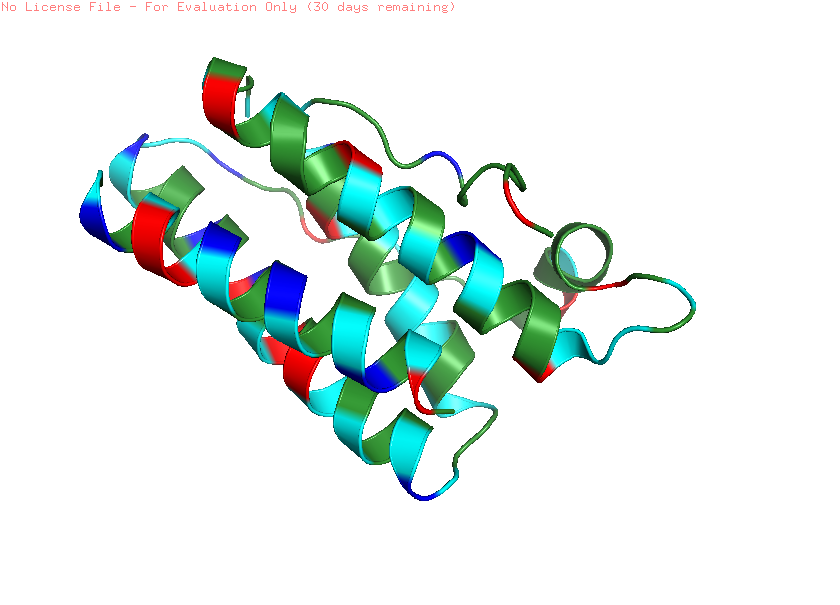
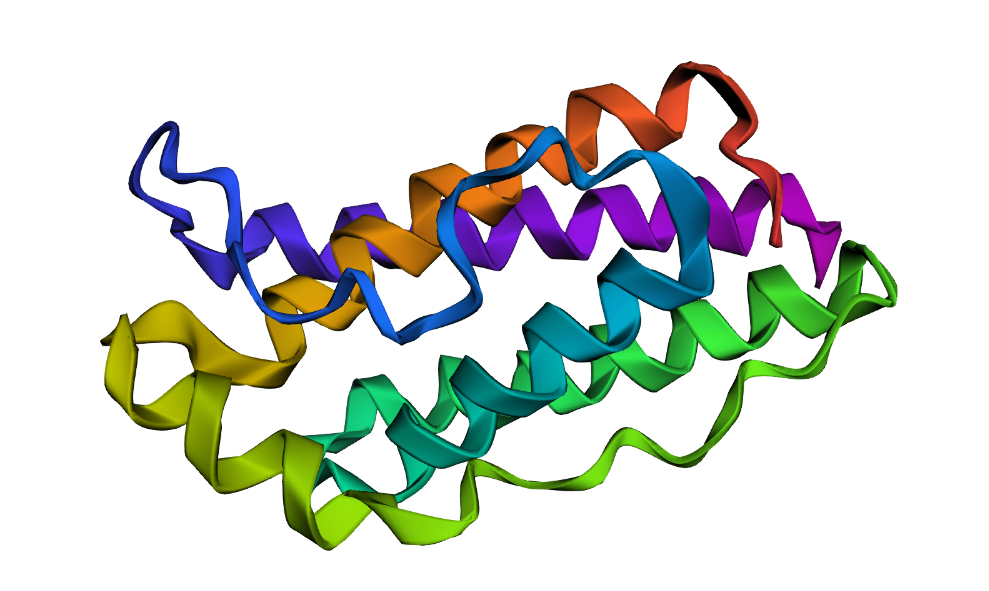
When visualized in PyMOL and colored by secondary structure, leptin is dominated by α-helices with only short loop regions connecting them. Very little or no β-sheet structure is observed. This arrangement is consistent with leptin’s classification as a four-helix bundle cytokine-like protein.
Color the protein by residue type. What can you tell about the distribution of hydrophobic vs hydrophilic residues?
When colored by residue type, hydrophobic residues are mainly located in the interior of the protein, forming a stable core within the helical bundle. In contrast, hydrophilic and charged residues are more frequently found on the protein surface. This distribution is typical for soluble proteins, where the hydrophobic core stabilizes the structure, and the polar residues interact with the aqueous environment or other proteins.
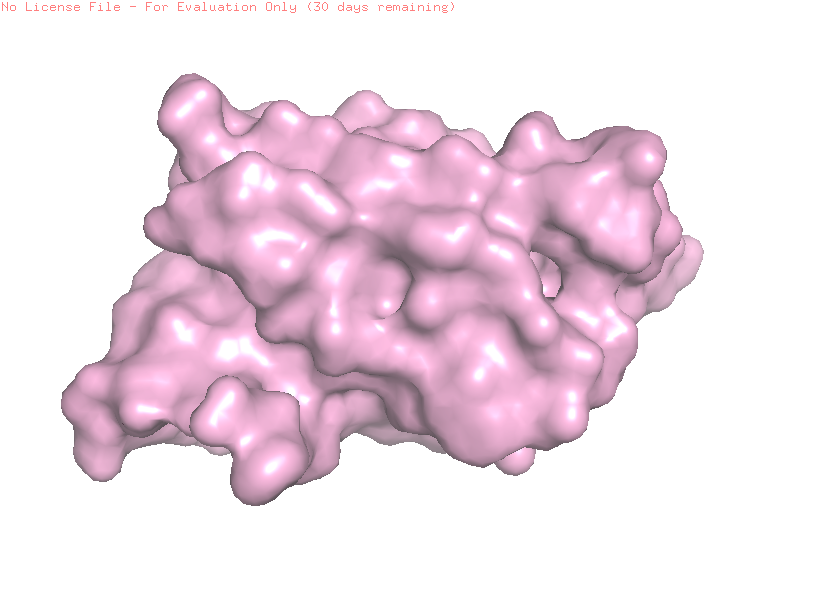
Visualize the surface of the protein. Does it have any “holes” (aka binding pockets)?
When visualizing the protein surface in PyMOL, the structure appears relatively compact and does not show a deep binding pocket typical of enzymatic active sites. Instead, the surface contains shallow grooves and broad interaction regions. This is consistent with leptin’s biological function as a signaling hormone that interacts with the leptin receptor rather than catalyzing a chemical reaction.
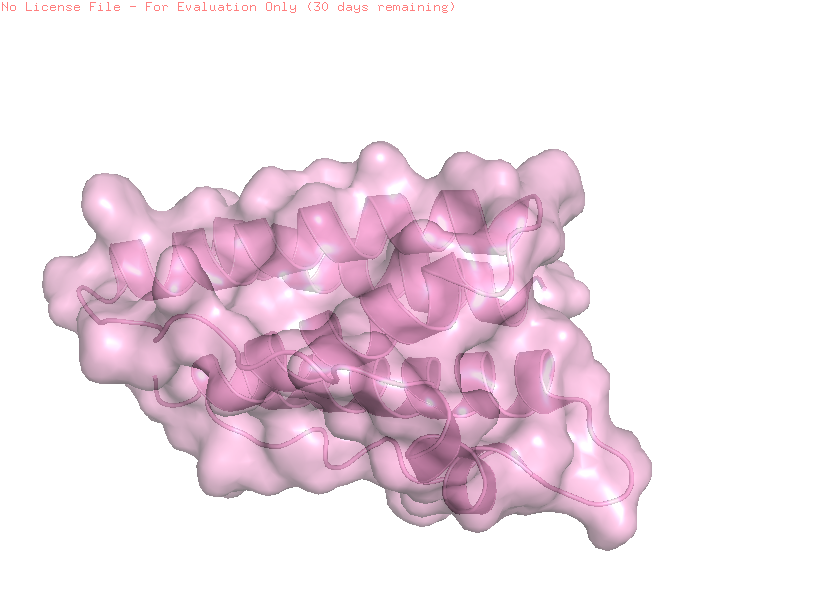
Extra: Surface + cartoon
A combined cartoon and surface representation highlights how the α-helical bundle is packed within the overall volume of the protein. The helices form a compact core that stabilizes the structure, while loop regions extend toward the protein surface. This organization is characteristic of cytokine-like proteins, such as leptin.
Part C: Using ML-Based Protein Design Tools
C1. Protein Language Modeling:
Chosen protein:
I kept the same protein from Part B: human leptin (PDB: 1AX8). I chose to keep it for Part C because it provides a consistent reference sequence and an experimental structure to compare against model predictions.
Sequence used:
>1AX8_1|Chain A|OBESITY PROTEIN, LEPTIN|Homo sapiens (9606) From Fasta file
VPIQKVQDDTKTLIKTIVTRINDISHTQSVSSKQKVTGLDFIPGLHPILTLSKMDQTLAVYQQILTSMPSRNVIQISNDLENLRDLLHVLAFSKSCHLPEASGLETLDSLGGVLEASGYSTEVVALSRLQGSLQDMLWQLDLSPGC
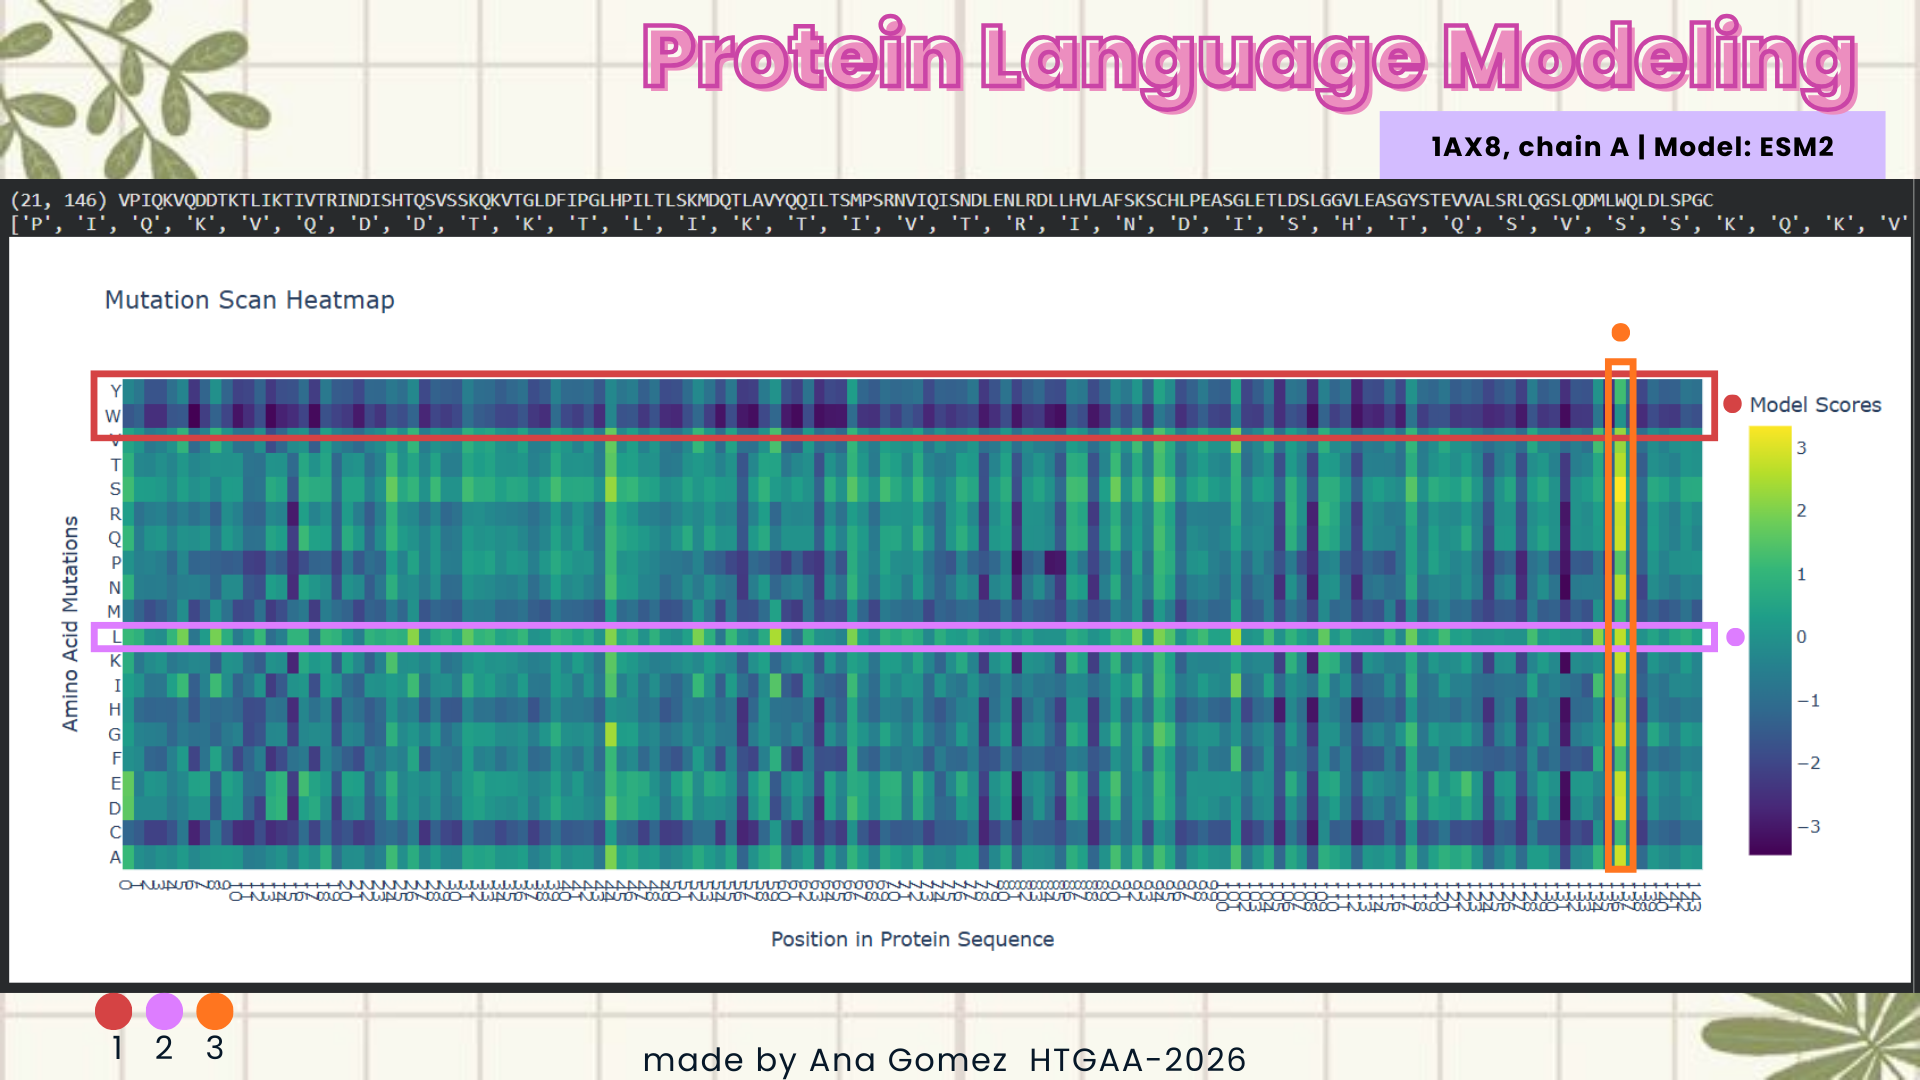
Deep Mutational Scans:
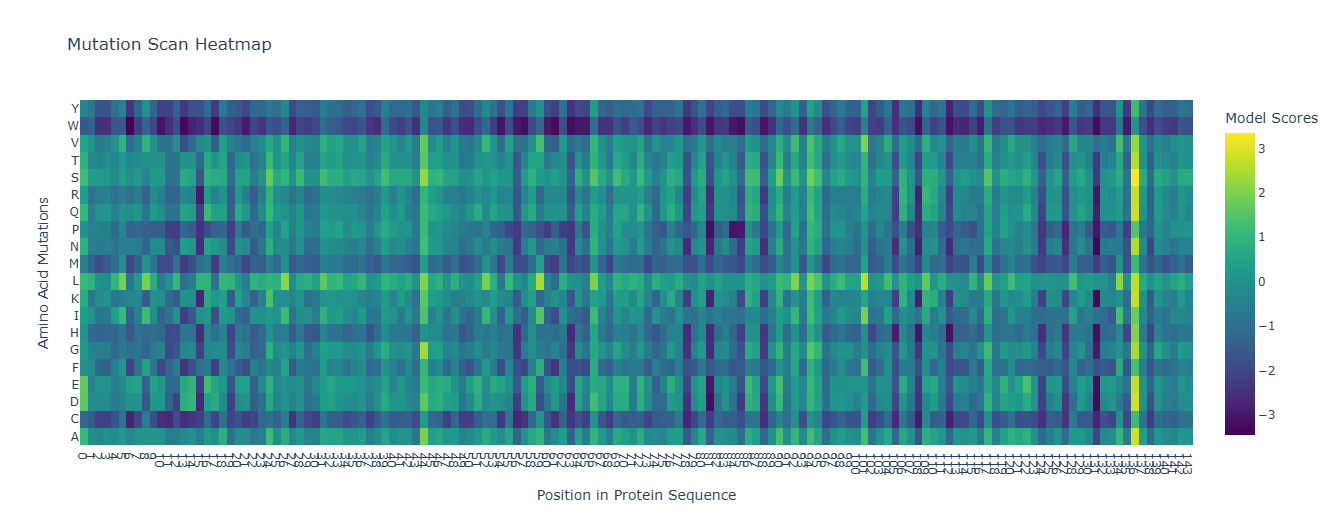
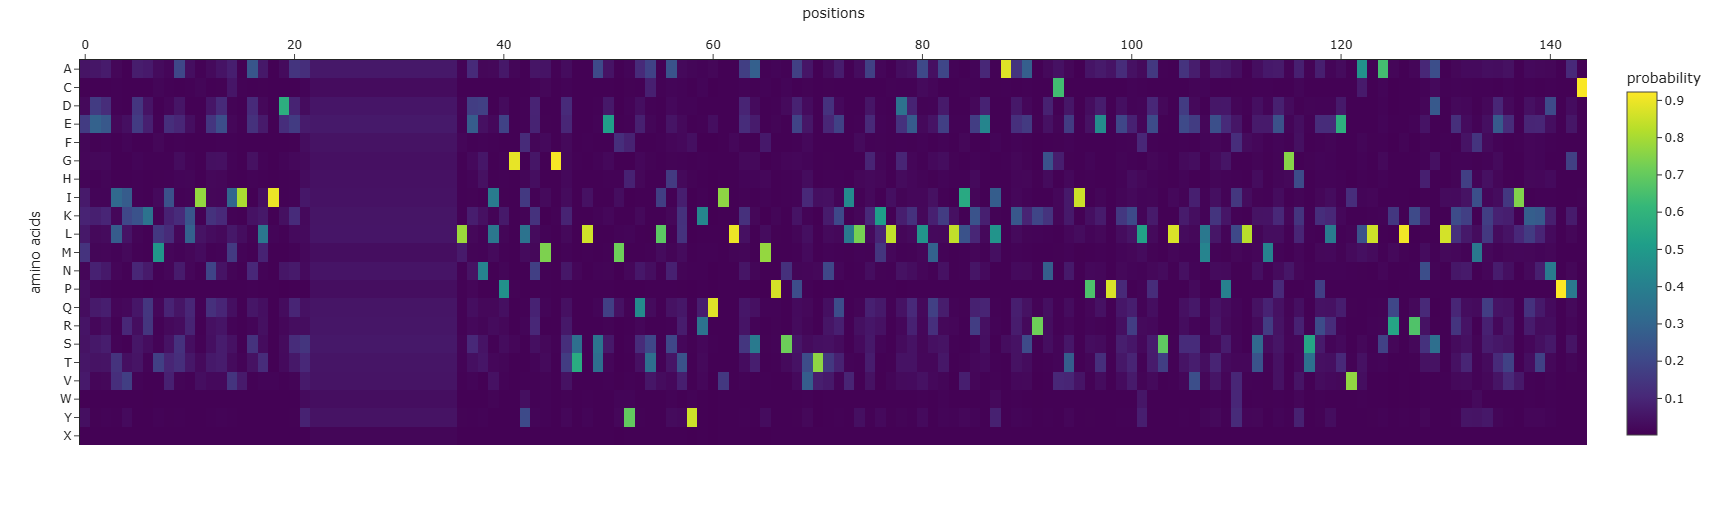
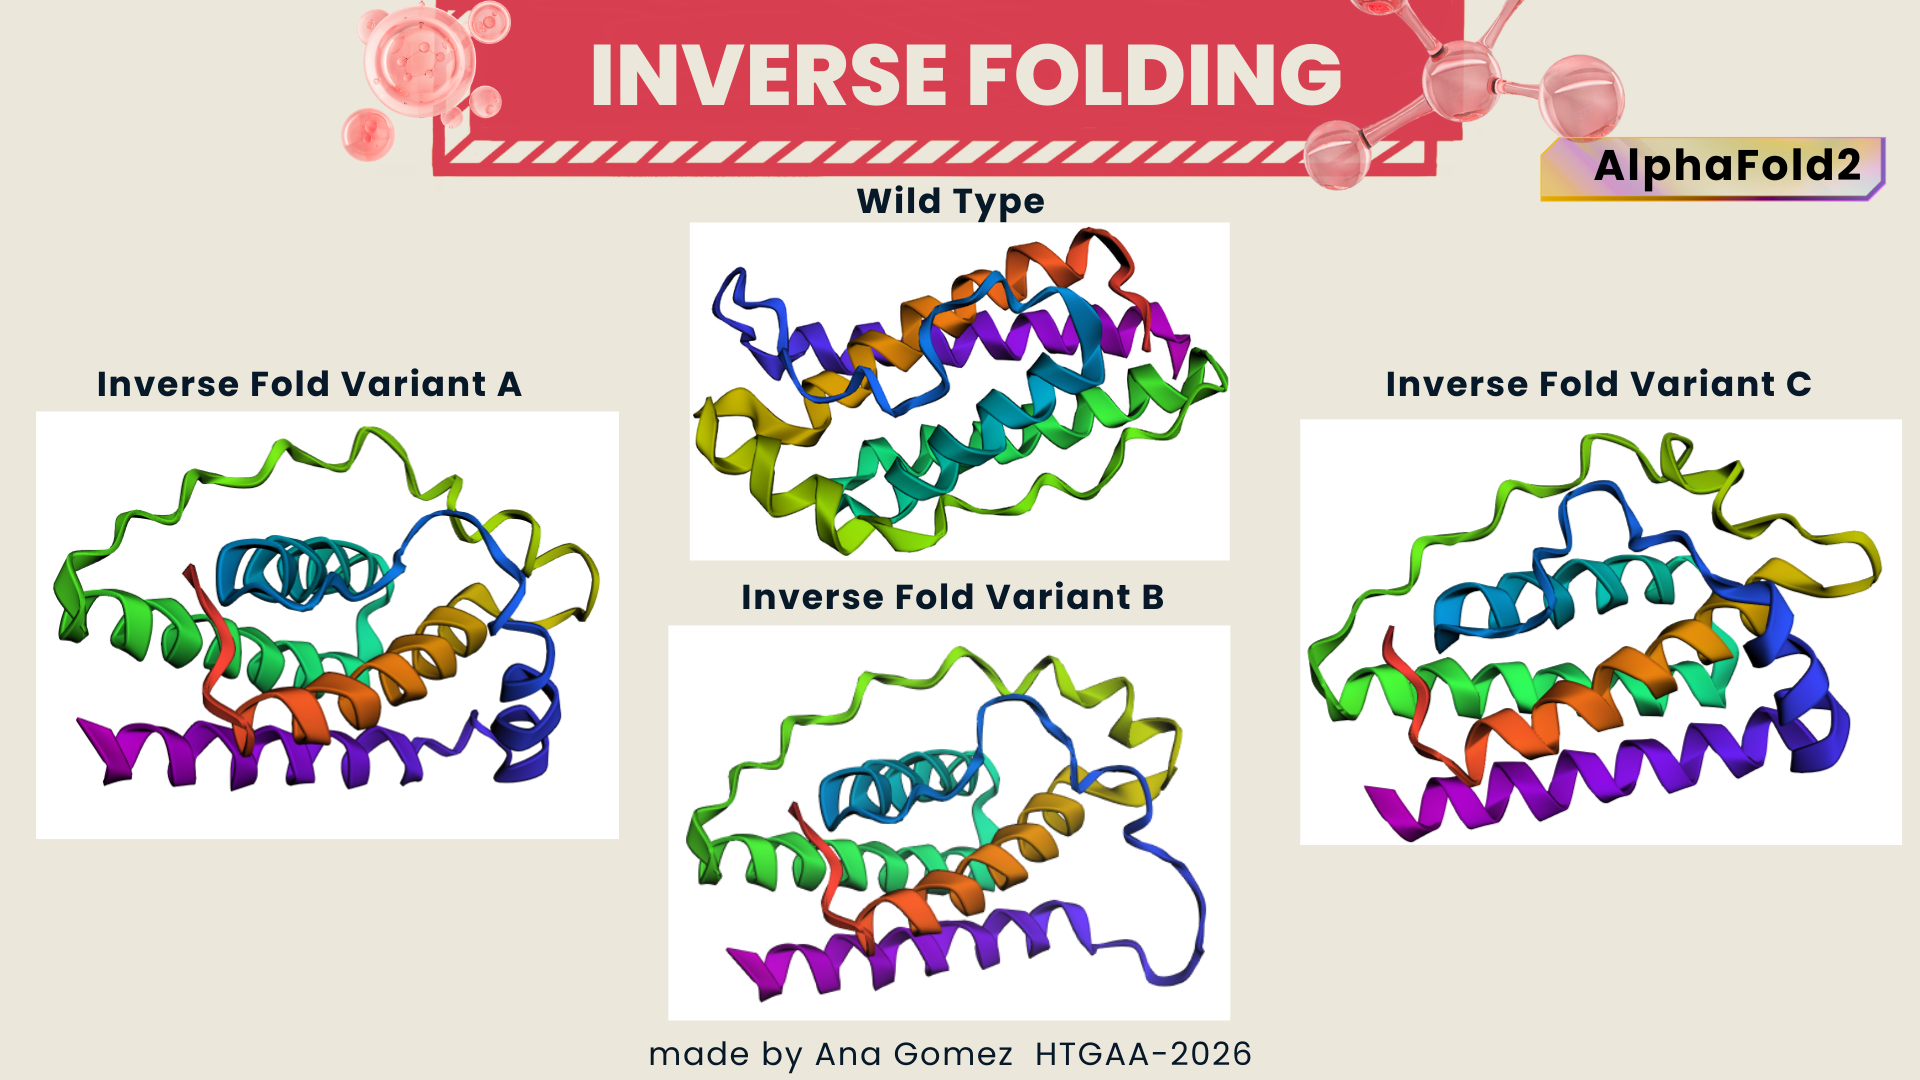
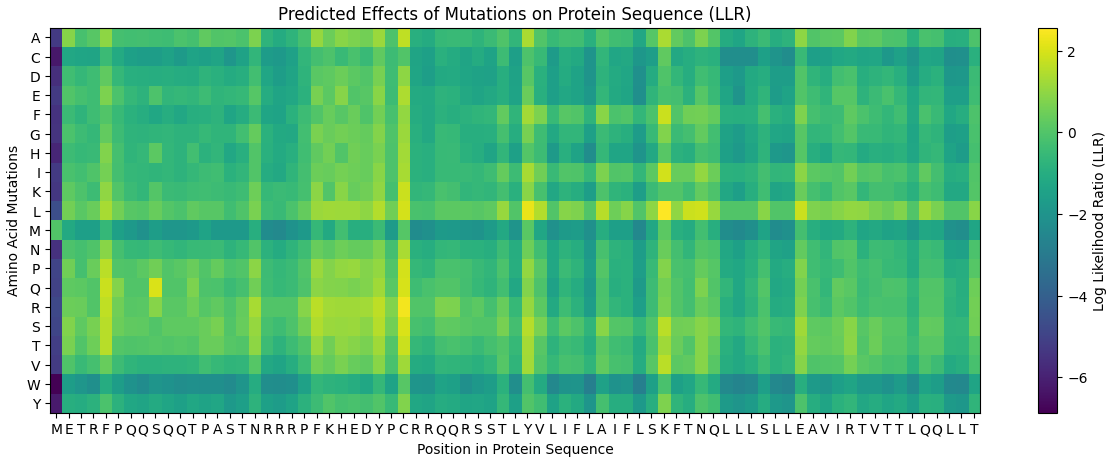
Using the ESM2 protein language model, I generated an unsupervised deep mutational scan of human leptin (PDB: 1AX8, chain A). The heatmap shows the predicted effect of mutating each residue to all other amino acids based on language model likelihood scores.
Mutation Scan Heatmap:
Edit
Raw
Several patterns emerge from the mutational landscape. For the red file, it’s shown that substitutions to bulky aromatic residues such as tryptophan (W) and tyrosine (Y) are frequently associated with strongly negative scores across many positions. This suggests that introducing large aromatic side chains is generally unfavorable, likely because it disrupts the packing of the protein core.
In contrast, substitutions to leucine (L) in the purple line appear more tolerated across multiple positions. This observation is consistent with the four-helix bundle architecture of leptin, where hydrophobic residues such as leucine commonly stabilize α-helical structures.
Additionally, some positions show relatively tolerant mutational profiles, indicating regions where the protein sequence may accommodate substitutions without strongly affecting structural stability.
Bonus — Comparison with Experimental Scans:
When searching for “deep mutational scanning leptin”, I found that there is currently limited experimental data available for leptin itself. However, similar studies have been conducted on related components of the leptin signaling pathway. For instance, deep mutational scanning of the melanocortin-4 receptor (MC4R), which plays a central role in energy homeostasis, has helped identify critical residues involved in receptor activation and signaling. These findings contribute to understanding the molecular basis of obesity-related leptin resistance.
Experimental deep mutational scanning (DMS) studies systematically measure the functional effects of thousands of mutations across a protein. In a recent study, researchers performed a high-resolution DMS of MC4R, evaluating the functional consequences of more than 6,600 single amino acid substitutions across multiple experimental conditions.
Such experimental datasets provide valuable benchmarks for computational models. Protein language models like ESM have been shown to correlate with experimentally measured mutational effects in several proteins, suggesting that sequence-based models can capture important structural and functional constraints within proteins.
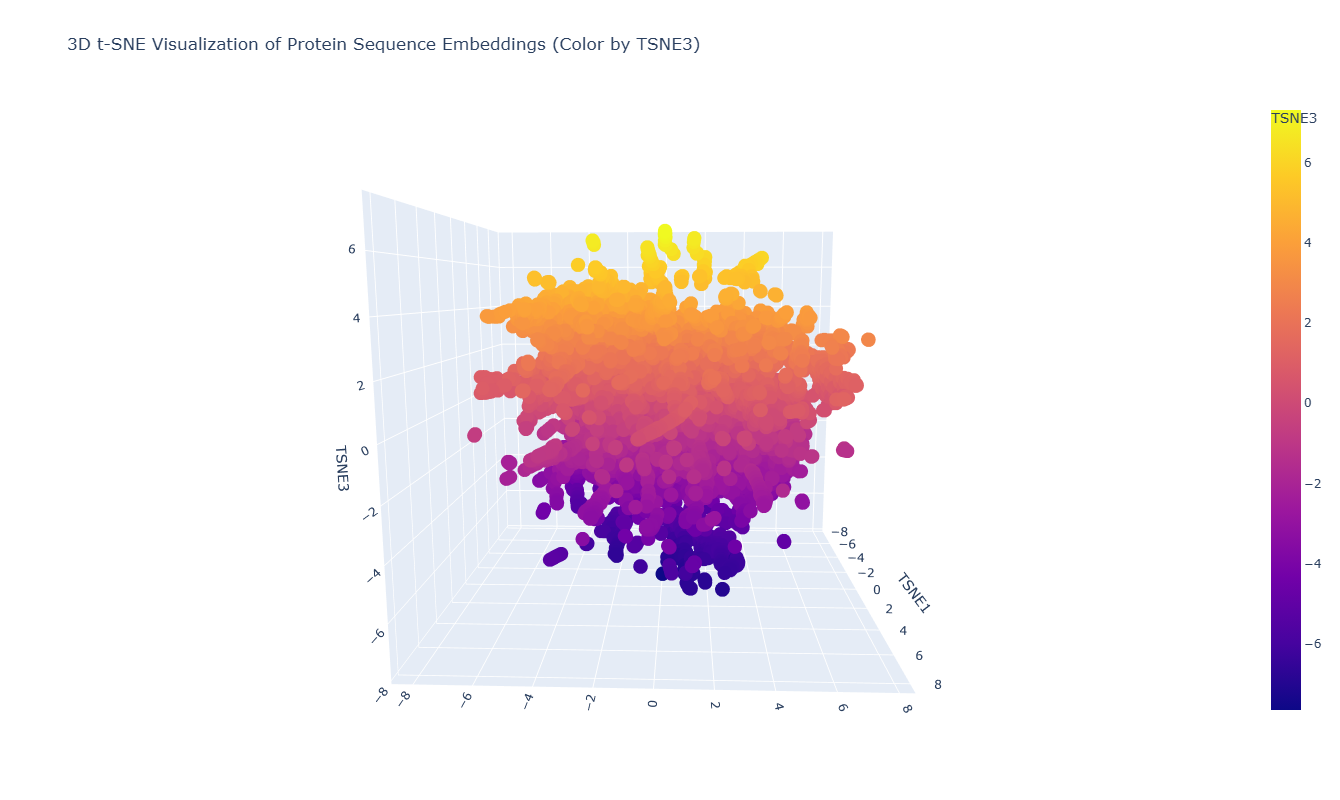
Latent Space Analysis:
To explore the latent space learned by the protein language model, I embedded a dataset of protein sequences using ESM2 and visualized them using a 3D t-SNE projection. In this representation, each point corresponds to a protein sequence, and its position reflects similarity in the embedding space.
As seen in the plot, the leptin sequence is embedded within this distribution and appears near proteins with similar embedding features. This indicates that the model places leptin among sequences that share comparable structural or evolutionary signals, consistent with the ability of protein language models to capture biologically meaningful relationships from sequence alone.
Something important:
Proteins that appear close together in the map are likely to share sequence patterns, structural features, or functional properties captured by the language model. The visualization forms a continuous cloud of points rather than sharply separated clusters, suggesting that the dataset contains proteins with related sequence characteristics. (Lohmann et al., 2024); (Rives et al., 2021)
C2. Protein Folding:
Folding a protein:
For this section, I’m using the ESMFold package and comparing the PDB 1AX8 Leptin with minimal, medium, and large mutations on the sequence, showed on table 3.
A single amino acid substitution did not significantly alter the predicted structure. The overall fold remained stable, suggesting that the protein structure is resilient to minor mutations.
Larger sequence alterations resulted in noticeable structural changes and reduced prediction confidence, suggesting that the native fold depends on conserved sequence regions.
However, the predicted sequence contained 14 positions represented by “X”, indicating positions where the model could not confidently assign a specific amino acid.
These positions likely represent uncertain residues or gaps produced during the inverse folding process.
Sequence Coverage Analysis:
To better understand the reliability of the predicted sequence, a sequence coverage heatmap was generated.
As explained before, the sequence coverage plot represents the number of homologous sequences aligned at each position of the protein during the multiple sequence alignment step.
Regions with higher coverage indicate strong evolutionary support, while regions with lower coverage may represent positions where the model has less information.
The heatmap showed that most of the protein sequence had high coverage, suggesting that the predicted structure is supported by evolutionary information.
However, the region containing the 14 X residues appeared as an uncertain segment, suggesting that the model was unable to confidently assign amino acids at those positions.
Initial Folding Attempt with the 14 Unknown Residues:
Before replacing the unknown residues, the generated sequence was folded to visualize how the model behaves when the uncertain residues remain unresolved.
Wild Type*
inverse folding with X**
Wild type* (1AX8 original sequence) ; Inverse folding with X**: 14X AA
The predicted structure appeared generally similar to the wild-type leptin structure, maintaining the overall helical arrangement. However, the region containing the 14 X residues resulted in a shorter helix and slightly altered local folding, making the predicted structure appear slightly more compact than the wild-type structure (144 WT Amino acids vs. ~130 Amino acids).
Design of Replacement Sequences:
To resolve the unknown residues, three possible sequence replacements were designed.
For this step, I consulted ChatGPT-5.2 to suggest amino acid patterns commonly used in protein design to stabilize or link structural elements.
Three strategies were proposed:
Variant A – Coiled-coil promoting residues
This design uses amino acids commonly found in α-helical coiled-coil motifs, including glutamic acid (E), leucine (L), lysine (K), and glutamine (Q).
Due to GPU limitations in the HTGAA Colab notebook, the structural prediction of the redesigned sequences was performed using the ColabFold AlphaFold2 notebook.
AlphaFold predictions provide three useful structural visualizations:
N → C coloring:
Shows how the protein chain folds along the sequence from N-terminus to C-terminus.
pLDDT coloring:
Shows the confidence of the structural prediction.
Blue: high confidence
Green/yellow: moderate confidence
Red: low confidence or flexible regions
Example: pLDDT and N → C coloring from Variant A:
Sequence Coverage Map:
The sequence coverage plot represents the number of homologous sequences aligned to each residue position during the multiple sequence alignment (MSA) step used by AlphaFold.
Example 1
Example 2
The x-axis represents the amino acid positions along the protein sequence, while the y-axis represents the number of homologous sequences aligned at each position.
The background color gradient indicates the sequence identity between homologous sequences and the query sequence, where:
Purple/blue → regions indicate sequences with high similarity to the query
Orange/red → regions indicate lower sequence identity
The black line represents the coverage depth, showing how many sequences are aligned at each position of the protein. Regions where the black line is higher indicate greater evolutionary support, meaning that many homologous sequences contribute information to the prediction.
Structural Comparison with the Wild Type:
Variant A
Sequence Coverage Map, and pLDDT plots:
1
2
3
1. Sequence Coverage Map: In some regions of the plot, the colored background becomes less continuous or shows gaps. These areas indicate positions where fewer homologous sequences align with the query protein. Such regions may correspond to flexible loops, insertions, or regions with lower evolutionary conservation, which can make structural prediction more uncertain. Also, the black line in this graphic indicates the protein has strong evolutionary support across most positions, suggesting that the structural prediction should be reliable for the majority of the residues.
2 & 3. pLDDT: Shows similar structures that replaces N → C coloring on how the protein presents it. Also, the figure shows half blue predictions, which means a high confidence in that position of the protein
Final structure 3D visualization with Variant A
WT 1AX8
IF Variant A*
*Inverse Folding Variant A
The structure predicted for Variant A maintains the four-helix bundle characteristic of leptin. However, the redesigned region appears to produce a smoother loop and an extended helical region, suggesting that the coiled-coil-like sequence stabilizes the helix architecture.
Variant B
Sequence Coverage Map, and pLDDT plots:
1
2
3
1. Sequence Coverage Map: In this graphic, the plot shows better coverage when the sequence is >60. Compared on previous sequence map, it shows white gaps. Such regions may correspond to flexible loops, insertions, or regions with lower evolutionary conservation, which can make structural prediction more uncertain.
2 & 3. pLDDT: Shows similar structures that replaces N → C coloring on how the protein presents it. Also, the figure shows half blue predictions, which means a high confidence in that position of the protein. In figures 2 & 3, plot 3 shows more confidence because the presence of blue is greater than in plot 2.
Final structure 3D visualization with Variant B
WT 1AX8
IF Variant B*
*Inverse Folding Variant b
Variant B also preserves the four-helix arrangement of the wild-type leptin. However, the glycine-rich linker introduces greater flexibility in the connecting regions, resulting in a less compact and more relaxed structure. As well, the helices remain present but appear less tightly organized.
Variant C
Sequence Coverage Map, and pLDDT plots:
1
2
3
1. Sequence Coverage Map: In this particular sequence map, the coverage shows an abrupt increase after the first residues. This behavior may occur when the alignment database finds fewer homologous sequences matching the N-terminal region, while the rest of the sequence aligns well with known protein families. And this can indicate that the N-terminal region may be less conserved or structurally flexible compared to the core of the protein.
2 & 3. pLDDT: Shows similar structures that replaces N → C coloring on how the protein presents it. Also, the figure shows half blue predictions, which means a high confidence in that position of the protein. In figures 2 & 3, plot 3 shows more confidence because the presence of blue is greater than in plot 2.
Final structure 3D visualization with Variant C
WT 1AX8
IF Variant C*
*Inverse Folding Variant c
Variant C produces a structure that appears more compact and structurally organized than Variant B. The helices are arranged in a way that resembles the wild-type structure more closely, suggesting that the hybrid sequence helps restore structural stability while maintaining some flexibility.
Structural Visualization
Final structure of Inverse-Folding from PDB: 1AX8
Figure 3 Comparison of Inverse Folding structure
Mol Viwer:
As an extra, I tested another software Mol viewer to compare the predicted models with the original structure. The wild-type leptin structure (PDB: 1AX8) was visualized here:
This app could be used to visualize and allow direct comparison between the experimentally determined structure and the redesigned inverse-folded variants.
Recommended lectures: I briefly reviewed some papers for the visualization of Sequency coverage map and pLDDT for AlphaFold, please read “Sources” at the References/sources section of this page.
Part D: Group Brainstorm on Bacteriophage Engineering
For this part, I am working with Cynthia Viera from SynBio USFQ node
Idea inspiration:
We were inspired by the phage reading lecture, especially from the paper: https://doi.org/10.1128/JB.00058-17, which has an interesting approach with bacteriophage MS2 and the dynamics of lysis in Escherichia coli using the protein L.
We will computationally optimize MS2 phage yield by tuning the lysis timing of the MS2-L protein toward an assembly-friendly window. Using BLAST and multiple sequence alignment, we will identify conserved and mutation-tolerant regions, then apply protein language models (ESM) to propose conservative variants. We will screen candidate stability using rapid structure prediction (ESMFold or monomer AlphaFold) and prioritize variants expected to preserve the essential transmembrane lytic features while reducing timing variability. Our goal is to increase total phage titers by improving the balance between virion assembly completion and reliable lysis.
Weekly Reflection:
⭐ This week made me reflect on how the knowledge from my previous biology training helped me interpret some of the results from the protein design tools. Even though the software is new, many of the ideas connect with basic concepts such as protein folding and structure.
⭐ While working on the inverse folding assignment, I noticed that understanding protein design in a single class can be challenging because there are many computational and biological concepts involved.
⭐ I also encountered a limitation with the Colab GPU when trying to continue running inverse folding experiments. Because of this, I explored another tool and used AlphaFold through ColabFold to predict the structures of the redesigned sequences instead of the original ESMFold notebook. This helped me continue the analysis and compare the predicted structures.
⭐ One thing I noticed is that some regions of the predicted proteins show lower confidence scores, which may be expected because the sequence was generated through inverse folding, meaning it does not necessarily follow the canonical evolutionary constraints of the natural protein.
⭐ For Part B of the assignment, I am interested in exploring more tools related to protein research and visualization. I also enjoy creating small tutorials for myself while working with these tools, since it helps me remember the steps and understand the workflow better.
⭐ During the lecture for Week 5 and discussions with classmates, I became interested in the topic of phage therapy. I realized that phages have many applications beyond what we initially read in the papers. (Yeah, I am updating my W4 during W5 cause it was heavy 😅)
❓ A question that came up during a conversation with a classmate was about bacterial resistance to bacteriophages after several generations. This made me curious about what strategies researchers use to avoid this problem, such as phage cocktails or other approaches.
Thanks for reading my assignment! This info is also available at my personal Notion. To check it, please enter here! Notion W4
References & sources
Part A
Doig A. J. (2017). Frozen, but no accident - why the 20 standard amino acids were selected. The FEBS journal, 284(9), 1296–1305. https://doi.org/10.1111/febs.13982
Grishin, D. V., Zhdanov, D. D., Pokrovskaya, M. V., & Sokolov, N. N. (2020). D-amino acids in nature, agriculture and biomedicine. All Life, 13(1), 11–22. https://doi.org/10.1080/21553769.2019.1622596
A. Rives, J. Meier, T. Sercu, S. Goyal, Z. Lin, J. Liu, D. Guo, M. Ott, C.L. Zitnick, J. Ma, & R. Fergus, Biological structure and function emerge from scaling unsupervised learning to 250 million protein sequences, Proc. Natl. Acad. Sci. U.S.A. 118 (15) e2016239118, https://doi.org/10.1073/pnas.2016239118 (2021).
Conor J Howard, Nathan S Abell, Beatriz A Osuna, Eric M Jones, Leon Y Chan, Henry Chan, Dean R Artis, Jonathan B Asfaha, Joshua S Bloom, Aaron R Cooper, Andrew Liao, Eden Mahdavi, Nabil Mohammed, Alan L Su, Giselle A Uribe, Sriram Kosuri, Diane E Dickel, Nathan B Lubock (2025) High-resolution deep mutational scanning of the melanocortin-4 receptor enables target characterization for drug discovery eLife 13:RP104725. https://doi.org/10.7554/eLife.104725.3
Lohmann, F., Allenspach, S., Atz, K., Schiebroek, C. C. G., Hiss, J. A., & Schneider, G. (2024). Protein Binding Site Representation in Latent Space. Molecular Informatics, 44(1), e202400205. https://doi.org/10.1002/minf.202400205
Jannik Adrian Gut, Thomas Lemmin, Dissecting AlphaFold2’s capabilities with limited sequence information, Bioinformatics Advances, Volume 5, Issue 1, 2025, vbae187, https://doi.org/10.1093/bioadv/vbae187Open Access
→ Explains limitations in multiple sequence alignment (MSA).
Liu, J., Neupane, P. & Cheng, J. Boosting AlphaFold protein tertiary structure prediction through MSA engineering and extensive model sampling and ranking in CASP16. Commun Biol 8, 1587 (2025). https://doi.org/10.1038/s42003-025-08960-6Open Access
→ Explains the low coverage on Sequence Coverage Maps
Veit, M., Gadalla, M. R., & Zhang, M. (2022). Using Alphafold2 to Predict the Structure of the Gp5/M Dimer of Porcine Respiratory and Reproductive Syndrome Virus. International Journal of Molecular Sciences, 23(21), 13209. https://doi.org/10.3390/ijms232113209Open Access
→ Explains pLDDT and confidence score
Extras papers:
Bertoline LMF, Lima AN, Krieger JE and Teixeira SK (2023) Before and after AlphaFold2: An overview of protein structure prediction. Front. Bioinform. 3:1120370. doi: 10.3389/fbinf.2023.1120370 https://doi.org/10.3389/fbinf.2023.1120370OPEN ACCESS
David, A., Islam, S., Tankhilevich, E., & Sternberg, M. J. E. (2022). The AlphaFold Database of Protein Structures: A Biologist’s Guide. Journal of molecular biology, 434(2), 167336. https://doi.org/10.1016/j.jmb.2021.167336OPEN ACCESS
After having the sequence modified, we use the Colab notebook:
Important to know that it’s to make sure you select the number 4 of binders in the input, select the length of peptides, and then run it.
Input
Binders and Peptide Length
Table 1.Peptides predicted
Index
Lenght
Binder
Pseudo Perplexity (score)*
0
12
WRYPAVGARWKX
10.660527
1
12
WRYPVAAVELKX
10.027294
2
12
WLYYPAGAAHWX
11.046032
3
12
KRSYVVGVEWGX
17.759518
control**
12
FLYRWLPSRRGG
———
Description: (*) Pseudo perplexity is an adaptation of the perplexity metric used in masked language models. The model masks each amino acid in the peptide one at a time and estimates the probability of correctly recovering it given the surrounding residues and the target protein sequence. Lower value → model assigns a higher probability to the peptide sequence and high confidence. High value → Less confidence model of sequence for the peptide. (**) Control is a known SOD1-binding peptide
Based on the results in Table 1, the candidates are in the top 2 positions. And less confidence with the last position (index 3).
Part 2A: Evaluate Binders with AlphaFold3
To evaluate the generated binders, AlphaFold3 was used to model protein–peptide complexes.
For this section, AlphaFold3 does not accept the placeholder residue “X” that appeared at the terminal position of the peptide sequences generated by PepMLM. To resolve this issue, the terminal X was replaced with glycine (G) before structural modeling. Glycine was selected because it is a small and flexible residue that minimally perturbs peptide structure.
The adjusted peptide sequences used for AlphaFold3 predictions are shown in Table 2.
Table 2.Adjusted peptide sequences used for AlphaFold3 modeling
Index
Length
Binder
Pseudo Perplexity (score)
Pep0
12
WRPYAVGARWKG
10.660527
Pep1
12
WRPYVAAVELKG
10.027294
Pep2
12
WLYYPAGAAHWG
11.046032
Pep3
12
KRSYVVGVEWGG
17.759518
Control
12
FLYRWLPSRRGG
—
Description: (**) The pseudo-perplexity values reported correspond to the original PepMLM outputs before sequence adjustment. The substitution of the terminal placeholder residue (X → G) was performed only to enable compatibility with AlphaFold3 and does not affect the reported generation confidence scores.
Small tutorial AlphaFold3:
Table 3.Results of AlphaFold 3 SOD1 mutated A4V
File
ipTM*
pTM**
Control
0.27
0.81
Pep0
0.31
0.85
Pep1
0.35
0.8
Pep2
0.47
0.82
Pep3
0.41
0.89
Description: [ipTM]* ipTM (interface predicted TM-score) estimates the confidence of the predicted interaction between different chains in a complex. Higher ipTM values suggest a more reliable protein–peptide interface prediction. [pTM]** pTM (predicted TM-score) evaluates the overall confidence in the predicted structure of the entire protein complex. Higher pTM values indicate a more reliable structural model.
Structural interpretation of peptide binding:
Based on the AlphaFold3 models, the peptides appear to interact primarily with exposed surface regions of the SOD1 structure rather than deeply inserting into the protein core. Most peptides localize along the external surface of the β-barrel region, which forms the structural core of SOD1. In several cases the peptides appear surface-bound and loosely associated with the protein, rather than deeply buried within the structure. Some peptides also approach regions near the N-terminal segment, where the A4V mutation occurs, suggesting potential interactions with structurally sensitive areas of the mutant protein.
The ipTM values observed ranged from 0.27 to 0.47, indicating moderate confidence in the predicted protein–peptide interfaces. The control peptide showed the lowest interface score (ipTM = 0.27), while all PepMLM-generated peptides displayed higher ipTM values. Among them, Pep2 produced the highest interface confidence (ipTM = 0.47), followed by Pep3 (0.41). These results suggest that some peptides generated by PepMLM may interact more favorably with mutant SOD1 compared to the known binder, highlighting Pep2 as the most promising candidate for further evaluation.
Key Discoveries
All the generated peptides are superior compared with the control.
Pep2 is the best prediction.
Recommendation I recommend visualizing the extra material at the bottom of this webpage!
Part 3A: Evaluate Properties of Generated Peptides in the PeptiVerse
The PeptiVerse analysis shows that all generated peptides have similar predicted binding affinities, which fall within the weak-binding range (pKd/pKi ≈ 5.7–6.4). Despite the modest affinity predictions, the peptides demonstrate favorable therapeutic properties overall. All candidates show excellent solubility (probability = 1.000) and relatively low hemolysis probabilities, suggesting acceptable safety profiles.
Table 4.Peptiverse Results
Peptide
Predicted binding affinity (pKd/pKi)
Solubility (probability)
Hemolysis (probability)
Net charge (pH 7)
Molecular weight (Da)
Control
5.965 [Weak binding]
1.000
0.047
2.76
1507.7
Pep0
6.152 [Weak binding]
1.000
0.020
2.76
1446.7
Pep1
5.779 [Weak binding]
1.000
0.035
0.76
1388.6
Pep2
5.825 [Weak binding]
1.000
0.046
-0.15
1391.5
Pep3
6.432 [Weak binding]
1.000
0.060
0.76
1336.5
Comparison of structural and therapeutic predictions:
When comparing these predictions with the AlphaFold3 structural results, partial agreement can be observed. The peptide with the highest structural interface confidence, Pep2 (ipTM = 0.47), does not show the strongest predicted affinity in PeptiVerse. Instead, Pep3 displays the highest predicted binding affinity (pKd/pKi = 6.432), although it also presents the highest hemolysis probability among the candidates. Pep0 shows a relatively balanced profile, with moderate predicted affinity, the lowest hemolysis probability (0.020), and strong solubility.
Overall, these results indicate that structural confidence and predicted binding affinity do not perfectly correlate, highlighting the importance of evaluating both structural and therapeutic properties during peptide design.
Peptide selected for further evaluation:
Among the candidates, Pep2 was selected as the peptide to advance for further development. Although its predicted binding affinity is moderate, Pep2 showed the highest ipTM score in AlphaFold3, indicating the strongest predicted interaction with the mutant SOD1 structure. In addition, it maintains excellent solubility and a near-neutral net charge, while its hemolysis probability remains within an acceptable range. This balance between structural interaction and therapeutic properties makes Pep2 the most promising candidate for further optimization and experimental validation.
Small tutorial Peptiverse:
For extra material, I recommend reading the full tables of Peptiverse at: Sources / Extra Material at the bottom of the webpage!
Part 4: Generate Optimized Peptides with moPPIt
Now, move from sampling to controlled design. moPPIt uses Multi-Objective Guided Discrete Flow Matching (MOG-DFM) to steer peptide generation toward specific residues and optimize binding and therapeutic properties simultaneously. Unlike PepMLM, which samples plausible binders conditioned on just the target sequence, moPPIt lets you choose where you want to bind and optimize multiple objectives at once.
Table 5. moPPIt peptide results:
Peptide
Output
Solubility
Hemolysis
Affinity
Motif
mPep1
SKTKKRVFCFQA
0.9575900435447693
0.75
7.43684673309262
0.81748944520095032
mPep2
PAQIKKKSYFCM
0.968536727130413
0.5833333134651184
6.8380064964229443
0.7559059953689575
mPep3
GVTGSDEVKKIQ
0.9665484763681889
0.75
5.413463115692139
0.44647738337516785
mPep4
YKKFKQTEKII
0.978692626500596
0.83333331346551184
6.007977485656738
0.7189149856567383
(*) The coordinates aren’t organized. To check the outputs, please check in the Extra Material.
Compared with the PepMLM-generated peptides, the moPPIt peptides appeared more controlled and more directly optimized for the selected target region. In contrast to PepMLM outputs, the moPPIt peptides did not contain undefined terminal residues such as “X”, making them more readily usable for downstream analysis.
In addition, the moPPIt candidates appeared to show more consistent sequence patterns, with several peptides enriched in charged residues, suggesting stronger optimization toward target interaction and physicochemical constraints.
Clinical Application:
Before advancing these peptides toward clinical studies, they should first be evaluated through additional computational and experimental validation.
Structurally, the peptides should be tested in AlphaFold3 or similar protein–peptide modeling tools to verify whether they bind near the intended A4V-associated region of SOD1.
Their therapeutic properties should then be screened using predictors such as PeptiVerse, including affinity, solubility, hemolysis risk, and net charge.
Promising candidates should next be assessed with molecular dynamics simulations to evaluate complex stability, followed by experimental validation through in vitro binding assays, aggregation inhibition studies, cytotoxicity testing, and peptide stability analysis. These steps would be necessary before any preclinical or translational consideration.
(*) Additionally: For moPPIt, the A4V mutant SOD1 sequence was used as the target protein. A binder length of 12 amino acids was selected, and peptide generation was guided toward residues 1–10 to focus on the N-terminal region containing the A4V-associated site. Affinity, motif, solubility, and hemolysis objectives were enabled to bias the design toward both target binding and therapeutic suitability.
Part C: Final Project: L-Protein Mutants
1. Selected design strategy
I selected Option 1: Mutagenesis, which combines computational mutation scoring with experimental mutational analysis of the MS2 lysis protein. This option was chosen because it provides a practical and interpretable framework for proposing candidate mutations while accounting for the limitations of structure prediction in membrane-associated proteins.
To explore potential beneficial mutations, I used the ESM-based mutation scoring notebook to estimate the tolerance of amino acid substitutions across the MS2 lysis protein sequence.
This sequence contains two main structural regions:
Table 2c.Domain locations of L-protein
Regions
Positions
soluble
1–40
transmembrane
41–75
The soluble N-terminal domain interacts with host factors such as the DnaJ chaperone, while the transmembrane domain mediates membrane insertion and pore formation during lysis. Understanding the location of these domains is important when evaluating mutations, since substitutions may affect different functional aspects of the protein.
For each residue position, the model calculates a log-likelihood ratio (LLR) score that estimates how favorable a substitution is relative to the wild-type amino acid
Higher LLR scores indicate that the substitution is more compatible with the sequence constraints learned by the model
4. Heatmap interpretation
The mutation heatmap illustrates the predicted effects of all possible amino acid substitutions across the sequence.
Warmer colors represent substitutions predicted to be more tolerated (yellow & green).
Cooler colors represent substitutions predicted to be unfavorable (blue & purple).
From this visualization, several mutations with relatively high predicted tolerance were observed in both the soluble and transmembrane regions of the protein.
5. Comparison with experimental mutational data
The computational mutation scores showed partial agreement with experimental mutational data obtained from previously reported MS2 lysis protein mutants.
Some substitutions predicted to be favorable by the language model correspond to mutations that experimentally maintain or improve lysis activity. This suggests that sequence-based protein language models are capable of capturing some functional and evolutionary constraints presented in the MS2 lysis protein.
6. Initial mutation ranking
The first step in the selection process was identifying the top mutations based on their LLR scores.
Table 6c.Raw mutation ranking (Top 10)
Position
WT
Mutation
Score
50
K
L
2.561468
29
C
R
2.395427
39
Y
L
2.241780
29
C
S
2.043150
9
S
Q
2.014325
29
C
Q
1.997049
29
C
P
1.971029
29
C
L
1.960646
50
K
I
1.928801
53
N
L
1.864932
Higher LLR scores indicate substitutions predicted to be more compatible with the sequence context and therefore more likely to be tolerated by the protein.
According to Zhang et al. (2025), the ESM2 score reflects the mutational tolerance of a given residue, where lower scores indicate stronger evolutionary constraints and higher scores suggest that substitutions are more likely to be tolerated.
7. Domain classification of candidate mutations
To better interpret these mutations, their positions were mapped to the structural domains of the protein, as mentioned on part 2.
Table 2c.Domain locations of L-protein
Regions
Positions
soluble
1–40
transmembrane
41–75
Using this classification, the top mutations were separated based on their structural location, as shown in the following Tables 7c1 and Table 7c2.
Table 7c1.Soluble domain candidate mutations
Mutation
Score
C29R
2.395427
Y39L
2.241780
C29S
2.043150
S9Q
2.014325
C29Q
1.997049
C29P
1.971029
C29L
1.960646
Description: Seven of the top mutations occur within the soluble domain, which may influence protein folding or interactions with host factors such as DnaJ.
Description: Three mutations occur within the transmembrane region, which may affect membrane insertion or pore formation during lysis.
8. Final selection of Mutants
From the mutation ranking and domain analysis, five candidate mutants were selected.
Table 8c. Selected L-protein mutants
Name
Mutation
Reason
LAmut1
C29R
Selected due to a high LLR score indicating mutational tolerance. The substitution introduces a positively charged residue that may stabilize interactions in the soluble domain while preserving structural compatibility.
LAmut2
Y39L
High scoring substitution predicted by the ESM2 model. Replacement of tyrosine with leucine maintains hydrophobic character while potentially improving stability in the local structural environment.
LAmut3
K50L
Located in the predicted transmembrane region. Substitution from lysine to leucine increases hydrophobicity, which may improve membrane compatibility and insertion efficiency.
LAmut4
K50I
High LLR score mutation within the membrane segment. Isoleucine is a hydrophobic residue commonly found in membrane helices, suggesting improved structural compatibility.
LAmut5
N53L
Predicted favorable mutation according to the language model. The substitution introduces a hydrophobic residue potentially stabilizing the transmembrane segment.
Description: The naming scheme LAmut refers to a personalized naming convention used for the designed mutants, followed by a number corresponding to the mutation order.
9. Mutation selection criteria
Amino acid substitutions are not random but are strongly influenced by physicochemical properties such as hydrophobicity, charge, and structural compatibility (Weber & Whelan, 2019; James & Lascoux, 2025 ).
Therefore, mutations were selected using three main criteria:
High LLR scores predicted by the ESM2 model
Compatibility with structural domains of the protein
Physicochemical compatibility of amino acid substitutions
Hydrophobic residues are commonly enriched in transmembrane helices, suggesting that substitutions that increase hydrophobicity may enhance membrane insertion and stability. Mutations in the soluble domain may influence folding or interactions with host factors such as DnaJ, while mutations in the transmembrane region may affect membrane insertion and pore formation during bacterial lysis.
10. Conclusion
This project demonstrated how protein language models can be used to guide rational mutation design in viral proteins. Although the computational workflow was initially challenging, understanding the concepts and carefully interpreting the model outputs allowed the identification of promising mutation candidates.
By combining LLR mutation scores, structural domain information, and physicochemical reasoning, it was possible to propose several mutations that may improve the stability or functional robustness of the MS2 lysis protein. This approach highlights how computational tools can support protein engineering and help explore sequence space more efficiently.
Overall, this exercise illustrates how integrating computational predictions with biological reasoning can provide a practical strategy for designing and evaluating potential protein variants.
Part B: BRD4 Drug Discovery Platform Tutorial (Gabriele)
Extra credit (Coming Soon!)
Weekly Reflection:
Testing these different peptide prediction tools was really interesting because each one approaches the problem differently. I noticed that the usefulness of each tool depends a lot on how confident the model is and how interpretable the results are. PeptiVerse was probably the most user-friendly tool, since the interface made it easy to quickly evaluate different peptide properties. In contrast, AlphaFold3 required a bit more effort, but it has a big advantage because it allows us to visualize the interaction between the peptide and the protein, which helps a lot when trying to interpret the structural results
moPPIt was the tool I struggled with the most**.** The inputs were actually straightforward, but the runtime was quite long, and the outputs were harder to interpret compared to the other tools. Waiting for the computation also made the workflow slower compared to PeptiVerse or AlphaFold
Finally, I really appreciate that this class is connected to real research questions, especially in areas like phage therapy and antibiotic resistance. Knowing that our work could potentially contribute to ongoing research efforts or even collaborative publications with MIT researchers makes the assignments feel much more meaningful and motivating
Thanks for reading! This info is also posted in my personal Notion. For more info, enter here! Notion W5
References & Sources:
PART A:
Barman, P., Joshi, S., Sharma, S., Preet, S., Sharma, S., & Saini, A. (2023). Strategic Approaches to Improvise Peptide Drugs as Next Generation Therapeutics. International journal of peptide research and therapeutics, 29(4), 61. https://doi.org/10.1007/s10989-023-10524-3
Berdyński, M., Miszta, P., Safranow, K. et al.SOD1 mutations associated with amyotrophic lateral sclerosis analysis of variant severity. Sci Rep12, 103 (2022). https://doi.org/10.1038/s41598-021-03891-8
Wang, L., Wang, N., Zhang, W. et al. Therapeutic peptides: current applications and future directions. Sig Transduct Target Ther7, 48 (2022). https://doi.org/10.1038/s41392-022-00904-4
PART C:
Claudia C Weber, Simon Whelan, Physicochemical Amino Acid Properties Better Describe Substitution Rates in Large Populations, Molecular Biology and Evolution, Volume 36, Issue 4, April 2019, Pages 679–690, https://doi.org/10.1093/molbev/msz003
James, J. E., & Lascoux, M. (2025). Amino Acid Properties, Substitution Rates, and the Nearly Neutral Theory. Genome biology and evolution, 17(3), evaf025. https://doi.org/10.1093/gbe/evaf025
Zhang Yumeng, Zheng Jared, Zhang Bin (2025) Protein Language Model Identifies Disordered, Conserved Motifs Implicated in Phase Separation eLife 14:RP105309 https://doi.org/10.7554/eLife.105309.2
Sources / Extra Material:
Part 2A
Gallery View of AlphaFold peptides
Description: The order of the images is
“c”= SDO1 (Peptide control)
“P0” = SOD1 (Pep0)
“P1” = SOD1 (Pep1)
“P2” = SOD1 (Pep2)
“P3” = SOD1 (Pep3)
The Predicted Aligned Error (PAE) heatmap (right side) shows the expected positional error between residue pairs in the predicted structure. Darker green regions indicate lower predicted error and therefore higher confidence in the relative positioning of residues. In this model, the protein core displays low error values, suggesting a reliable fold for SOD1, while the peptide region shows slightly higher uncertainty, which is expected for flexible short peptides interacting with protein surfaces.
Gallery of Tables from Peptiverse for Part 3A
Control:
Pep0:
Pep1:
Pep2:
Pep3:
Part 4A: moPPDIt
Outputs:
Week 6 HW: Genetic circuits part I
Genetic circuits part I: Assembly Technologies
Note Part 1–> At Lab section: week 6
Part 2: Asimov Kernel
Based on the exploration of the Bacterial Demos repository, genetic circuits were analyzed and simulated with the use of the Asimov Kernel platform.
The Bacterial Demos repository was explored to understand how synthetic genetic circuits function. Different constructs were simulated using the built-in simulator, which displays protein expression over time. These simulations allow visualization of regulatory interactions such as repression and feedback, and how they influence gene expression dynamics.
Figure 1. Demonstration of Bacterial Demo’s runtime and identification of the components
Creating a construct:
The platform provides an interface to design genetic constructs by combining modular biological parts. The logic of a basic construct follows the structure:
Promoter → Gene → Terminator
Each component plays a specific role in gene expression. The parts used for this example are shown in Table 1.
Table 1.Construct components
Type
Function
Use
pTet
promoter
Initiates transcription; regulated by TetR
A1 RBS
Ribosome binding site
Enables translation of the gene
TetR
Coding sequence
Encodes a repressor protein
L3S2P24
Bacterial Terminator
Stops transcription
(Brophy et al., 2014; Letrari et al., 2026)
As it was shown, this construct consists of a promoter (pTet), a ribosome binding site (RBS), the TetR coding sequence, and a terminator. The promoter initiates transcription, while the RBS enables translation of the TetR protein. The TetR protein represses the pTet promoter, forming a negative feedback loop. This regulatory interaction stabilizes gene expression and prevents overproduction of the protein.
Kernel Tutorial
Additional: To download the file, click here Kernel tutorial
Simulation and results:
Figure 2. Final construct and runtime
To evaluate the behavior of the constructed genetic circuit (787 bp), a simulation was performed under E. coli conditions for 72 hours with a timestep of 10 minutes.
The simulation successfully ran and showed that the construct exhibits negative feedback regulation. In this system, the pTet promoter drives the expression of TetR, while the TetR protein represses the same promoter.
This feedback loop allows the system to regulate its own expression levels, preventing excessive production of the protein and stabilizing the overall behavior of the circuit.
New Constructs
For the following constructions, three different genetic circuit behaviors were designed: a simple expression system, a toggle switch, and a negative feedback loop.
1) Construct A: Simple gene expression system
Construct A was designed as a basic gene expression system. Its purpose was to test whether a promoter, a ribosome-binding site (RBS), and a coding sequence could produce a stable, detectable protein output in the simulator. The use of LacI as the coding sequence allowed clear visualization of both RNA and protein production, making this construct a useful baseline model.
During the initial design, the construct included an LDH sequence. However, after simulation, the results showed protein output as N/A, despite detectable RNA levels. This suggested that either the sequence was not properly recognized by the simulator or that translation was not occurring efficiently.
To address this, the LDH sequence was replaced with LacI, a well-characterized transcriptional repressor from the lac operon in molecular biology. After this correction, the simulation successfully displayed both RNA and protein production, confirming that the construct was functional.
Construct A (LDH)
Construct A (LacI)
Initial LDH construct (no detectable protein)
Corrected LacI construct (protein detected): the results are shown after modifications
2) Construct B: Toggle switch
Construct B was designed to represent a toggle switch, a bistable genetic circuit based on mutual repression between two genes.
In this system, two regulatory proteins (TetR and LacI) repress each other’s expression. This creates a circuit where only one gene remains active while the other is suppressed. The goal of this construct was to demonstrate how gene regulation can produce stable ON/OFF states.
The simulation results showed a TetR-high and LacI-low state, indicating that one branch of the circuit dominated while the other was repressed. This behavior is consistent with the expected functionality of a toggle switch.
Construct B
Results
3) Construct C: Negative feedback loop
Construct C was designed to represent a negative feedback loop, a common regulatory mechanism used to stabilize gene expression.
In this circuit, the promoter pTet drives the expression of TetR, while the TetR protein represses the same promoter. This creates a self-regulating system that prevents excessive protein production.
Similar to Construct A, the initial version of this construct did not show detectable protein (N/A), likely due to issues in translation efficiency or missing regulatory elements. After adjusting the design to include a proper RBS binding configuration, the simulation successfully showed both RNA and protein production.
The final results demonstrate that the circuit achieves controlled expression through autoregulation.
Construct C (Before)
Construct C (After)
The absence of RBS shows the null protein concentration
After corrections (RBS added)
Conclusion:
The design and simulation of these genetic constructs demonstrate how different circuit architectures can control gene expression in bacterial systems.
Construct A illustrates basic gene expression, Construct B demonstrates bistability through mutual repression, and Construct C shows how negative feedback can regulate and stabilize protein production.
Additionally, the comparison between initial and corrected designs highlights the importance of using well-characterized genetic parts and proper translational elements, such as RBS sequences, to achieve functional expression in synthetic biology models.
To review the full implementation and simulations, please visit my Kernel repository:
The four simulation plots represent different stages of gene expression. RNAP flux indicates transcriptional activity, RNA concentration reflects mRNA production over time, ribosome flux represents translation efficiency, and protein concentration shows the final output of the genetic circuit. Together, these plots allow visualization of how genetic regulation occurs from DNA to functional protein.
Table 2.Summary of graphics
Type of graphic
Analysis level
What does it represent?
How to interpret it
Output view
RNAP flux
DNA → RNA
Promoter activity (transcription rate)
High bars: active gene transcription. Low bars: weak or inactive transcription
Bar chart showing transcription strength for each gene (e.g., pTet → LacI). Figure 2A1
Line plot of mRNA levels over time (e.g., LacI transcript). Figure 2A2
Ribosome flux
RNA → Protein
Translation efficiency (RBS performance)
High bars: efficient translation. Low/zero: poor or no translation (possible RBS issue)
Bar chart showing translation rate of each transcript. Figure 2A3
Protein concentration
Protein
Final protein output over time
Increasing curve: active protein production. Stable: equilibrium. Oscillations: regulatory dynamics. 0 or N/A: no protein detected
Line plot of protein levels over time (e.g., LacI protein). Figure 2A4
Figures:
Figure 2A1. RNAP flux (LacI construct A)
Figure 2A2. RNA concentration (LacI construct A)
Figure 2A3. Ribosome flux (LacI construct A)
Figure 2A4. Protein concentration (LacI construct A)
Weekly Reflection:
This week provided a deeper understanding of DNA assembly methods and synthetic biology design through both Benchling and Asimov Kernel tools.
Working with Benchling felt more intuitive, especially when organizing projects within notebooks and visualizing the assembly process step by step. The platform made it easier to understand how different DNA fragments are combined, particularly during Golden Gate and Gibson assembly workflows.
In contrast, the Asimov Kernel focused more on the functional behavior of genetic constructs rather than the assembly process itself. While it was initially less intuitive, it became very powerful for understanding how designed circuits behave dynamically inside a biological system.
One of the most interesting aspects of this week was realizing how genetic constructs function inside a bacterial chassis. From my perspective, a genetic construct can be compared to the engine of a car, while the bacterium represents the entire vehicle :D. This analogy helped me better understand that synthetic biology is not only about assembling DNA sequences, but about designing systems that can perform specific tasks in living organisms.
Update: March 28th, 2026: I got access to the Asimov Kernel platform from my node during this midterm week.
My Notion website that follows the same content as the HTGAA 2026 website: (Week 6 homework)
References & Sources:
Brophy, J. A., & Voigt, C. A. (2014). Principles of genetic circuit design. Nature methods, 11(5), 508–520. https://doi.org/10.1038/nmeth.2926
Letrari S, Faccincani L, Intini S, Ertan I, Varaschin T, Galiazzo F, Costanzo M, D’angelo G, Del Giudice V, Guarnieri L, Martini A, Picchi A, Ravazzolo C, Venturini Degli Esposti N, Zanin C, Trainotti L, De Pittà C, Del Vecchio C, Castagliuolo I and Bellato M (2026) A synthetic biology toolkit for rationally designing genetic circuits in Acinetobacter baumannii. Front. Syst. Biol. 5:1668595. doi: 10.3389/fsysb.2025.1668595
week-07-hw-genetic-circuits-part-II
Week 7
Part 1: Intracellular Artificial Neural Networks
1. Advantages of IANNs vs traditional genetic circuits
Traditional genetic circuits usually behave like Boolean logic systems (ON/OFF), meaning they respond in discrete states (e.g., gene expressed or not). In contrast, IANNs offer several key advantages:
Criteria
Description
Graded responses instead of binary outputs
IANNs can process inputs in a continuous manner (like real neural networks). This allows more nuanced control of gene expression
Integration of multiple inputs simultaneously
Instead of simple AND/OR logic, IANNs can weigh inputs differently (e.g., X1 contributes more than X2)
Higher computational complexity
They can approximate nonlinear functions and make more sophisticated “decisions” inside cells
Scalability
Multilayer architectures allow hierarchical information processing, similar to deep learning
Better noise tolerance
Weighted systems can be more robust to biological variability compared to strict Boolean thresholds
For example, it could be a “Smart infection-detection system,” where the goal is to engineer a cell that detects early-stage infection and produces a therapeutic or reporter signal.
How it would work?
Inputs:
X1: Presence of bacterial quorum sensing molecules (e.g., AHLs)
X2: Host inflammation marker (e.g., ROS levels)
X3: pH changes (acidic microenvironment)
Processing (IANN behavior):
Each input is weighted differently
The network integrates signals:
High AHL + moderate ROS → strong activation
Low AHL + high ROS → weak activation
Uses a threshold function to decide output intensity
Output:
Expression of:
Fluorescent protein (diagnostic)
OR antimicrobial peptide (therapeutic)
There are some limitations in the application process, for example:
Noise in gene expression
Difficult tuning of weights (promoter strength, RBS, degradation rates)
Crosstalk between biological components
Metabolic burden on the host cell
Limited dynamic range compared to electronic systems
Before explaining the Multilayer perceptron (as a conceptual diagram), it’s important to understand how it works for a single-layer perceptron.
Single-layer perceptron:
The diagram represents an intracellular single-layer perceptron where:
Input X1 encodes the Csy4 endoribonuclease, which acts as a negative regulator by cleaving target mRNA.
Input X2 encodes a fluorescent protein, whose expression is regulated at the RNA level by Csy4.
Csy4 functions as a biological weight, modulating the effective expression of the output gene. The final fluorescence output depends on the balance between transcription of the fluorescent protein and post-transcriptional repression by Csy4.
This system mimics a perceptron where:
flowchart TD
    A[Single-layer perceptron] --> B(1: X1 contributes a negative weight)
    B --> C(2: X2 contributes a positive signal) --> c[3: The output is a graded fluorescence response]
Multi-layer perceptron:
A multilayer intracellular perceptron can be constructed by cascading regulatory layers:
In the first layer, inputs (X1 and X2) produce different endoribonucleases (e.g., Csy4 variants) that regulate the expression of a second-layer regulator.
The hidden layer output is another endoribonuclease, which integrates the first-layer signals.
In the second layer, this regulator controls the expression of a fluorescent protein.
This architecture allows hierarchical processing, where intermediate regulators act as hidden nodes, enabling more complex and nonlinear decision-making compared to a single-layer system.
flowchart LR
    subgraph I["Input layer"]
        X1["X1"]
        X2["X2"]
    end

    subgraph L1["Layer 1"]
        A["DNA → Tx/Tl → Csy4-A"]
        B["DNA → Tx/Tl → Csy4-B"]
    end

    subgraph H["Hidden layer"]
        C["Regulated transcript<br/>DNA → Tx/Tl → Csy4-C"]
    end

    subgraph O["Output layer"]
        D["Regulated fluorescent protein mRNA"]
        Y["Fluorescence output"]
    end

    X1 --> A
    X2 --> B
    A -- "RNA cleavage/regulation" --> C
    B -- "RNA cleavage/regulation" --> C
    C -- "RNA cleavage/regulation" --> D
    D --> Y
Disclaimer: For the creation of the Multi-layer perceptron diagram it was used ChatGPT 5.2.
Part 2: Fungal Materials
1. Examples of fungal materials
Fungal materials are formed through the self-assembly of mycelial networks, which bind organic substrates into cohesive and structured biomaterials. These networks enable the formation of diverse materials with applications ranging from packaging to advanced functional systems. As shown in Figure 1, mycelium-based materials can be engineered into different formats depending on their processing and intended use.
Figure 1.Fungal materials and applications table. (Based on Sharma et al., 2026)
Fungal materials offer several advantages, including low production cost, sustainability, and reduced environmental impact. Notably, during their growth phase, fungal systems can contribute to carbon sequestration. However, these benefits are accompanied by important limitations, such as susceptibility to degradation and moisture sensitivity, which can restrict their use in certain applications. These trade-offs are summarized in Table 1, which highlights both the advantages of fungal materials compared to traditional materials and their inherent limitations.
Table 1.Properties, advantages, and limitations of fungal materials compared to traditional materials
Property
Fungal materials (advantage)
Compared to traditional materials
Limitation
Explanation
Sustainability
Biodegradable and low environmental impact
Plastics and synthetic materials are non-biodegradable and polluting
Limited durability
Faster degradation reduces lifespan in long-term applications
Production process
Grown from agricultural waste with low energy input
Susceptible to microbial degradation if not treated
Description: These trade-offs highlight the need for further optimization through material engineering and synthetic biology approaches, particularly to improve mechanical strength, stability, and scalability. Information based on (Alemu et al., 2022; Xia, 2024; Bitting et al., 2022; Parhizi et al., 2025)
2. Genetic engineering in fungi
Fungi represent a promising platform for synthetic biology due to their natural ability to grow as interconnected networks and secrete a wide range of enzymes. These characteristics make them particularly suitable for the development of functional and adaptive biomaterials. Through genetic engineering, fungi can be designed to perform specific tasks that enhance their utility in material science and environmental applications.
Potential applications of engineered fungi include:
Self-healing materials → Fungi that regrow after damage
Bioremediation → Degradation of plastics, hydrocarbons, or toxins
Responsive materials → Materials that change color or fluorescence in response to stimuli
Antimicrobial surfaces → Production of antifungal or antibacterial compounds
In addition, fungi offer several advantages over bacteria for material-based applications. As summarized in Figure 2, fungi are capable of forming multicellular, macroscopic structures through mycelial networks, which enables the development of biomaterials at larger scales. In contrast, bacteria are primarily suited for molecular-level engineering due to their unicellular nature.
Figure 2.Advantage of Fungi vs. Bacteria table. Based on (Li et al., 2024; Pérez-Pazos et al., 2024)
Overall, fungal materials represent a promising platform for sustainable and programmable biomaterials. Their unique ability to grow, self-assemble, and interact dynamically with their environment positions them as a powerful alternative to traditional materials, particularly when combined with synthetic biology strategies.
Part 3: Individual projects!
Final Idea and first draft!
Title:KitBi. An Early-Warning Fluorescent Biosensor for Early Biofilm Commitment on Food-Contact Surfaces
Summary:
KitBi is a synthetic biology early-warning biosensor designed to report early biofilm commitment on food-contact surfaces before mature biofilm establishment. The project uses a promoter associated with biofilm regulation, such as PcsgD, driving sfGFP expression in non-pathogenic E. coli K-12. The goal is to shift from post-formation eradication to earlier risk detection, especially for Gram-negative foodborne contamination contexts relevant to stainless-steel and kitchen surfaces. Initial validation will be performed in silico through DNA design and simulation, with future translation toward portable or cell-free formats.
The first aim of my final project is to design and computationally validate a biofilm-responsive DNA construct in non-pathogenic E. coli that produces a fluorescent signal under early biofilm-inducing conditions relevant to food-contact surfaces, using Benchling for DNA construct design and Asimov Kernel for expression simulation.
Weekly Reflection:
This week felt a bit different because the concepts (IANNs and fungal materials) were interesting, but at first, they didn’t feel very connected to my project.
At the beginning, I honestly struggled with IANNs:
They felt very abstract and kind of far from real applications
The idea of implementing neural networks inside cells sounded cool, but also complicated
I wasn’t sure how to connect that to what I’m doing
But after thinking about it more, I did take away something important:
Biological systems don’t always work in simple ON/OFF logic
They can integrate signals in a more gradual and layered way
That actually relates to how biofilm-related promoters behave
Even if I’m not directly using IANNs in my design, it changed how I think about:
promoter strength
signal integration
and how cells “decide” to activate certain pathways
For fungal materials, I found it way more intuitive and honestly really interesting:
- Fungi can form actual macroscopic structures (not just molecular systems)
- Their mycelium works like a natural network that can bind materials together
- This made me think of biology not just as sensing, but also as material design
🧠 One idea that really stuck with me was:
- Biofilms forming on plastic in marine environments
- These systems include bacteria, fungi, and other organisms
🌿 That got me thinking:
- What if those biofilm-forming organisms could be engineered?
- Instead of just colonizing plastic, they could actually degrade it
It’s still a very early idea, but I liked that perspective:
→ biofilms are not just a problem, they could also be part of the solution
In terms of my project, this week was also important because I finalized my main idea: KitBi, an early-warning biosensor for biofilm formation. I initially struggled with deciding whether my idea was sufficiently innovative or too simple compared to other approaches. However, I realized that focusing on early detection rather than eradication aligns strongly with my background in biofilm research and gives the project a clear and meaningful direction. Choosing a problem that I understand well has made the design process more grounded and feasible.
Overall, this week helped me move from uncertainty to clarity. While some concepts remain challenging, I now feel more confident about my project direction and how it connects to broader themes in synthetic biology, such as sensing, regulation, and the design of living systems for real-world applications.
Thanks for reading it! This information is also in my personal Notion webpage, you can check it in: Notion- Week 7
References & sources:
PART 1
Cai, Y., Wang, Y., & Hu, S. (2025). Synthetic Gene Circuits Enable Sensing in Engineered Living Materials. Biosensors, 15(9), 556. https://doi.org/10.3390/bios15090556
Müller MM, Arndt KM and Hoffmann SA (2025) Genetic circuits in synthetic biology: broadening the toolbox of regulatory devices. Front. Synth. Biol. 3:1548572. https://doi.org/10.3389/fsybi.2025.1548572
Nilsson, A., Peters, J. M., Meimetis, N., Bryson, B., & Lauffenburger, D. A. (2022). Artificial neural networks enable genome-scale simulations of intracellular signaling. Nature communications, 13(1), 3069. https://doi.org/10.1038/s41467-022-30684-y
PART 2
Alemu, D., Tafesse, M., & Mondal, A. K. (2022). Mycelium-Based Composite: The Future Sustainable Biomaterial. International journal of biomaterials, 2022, 8401528. https://doi.org/10.1155/2022/8401528
Bitting, S., Derme, T., Lee, J., Van Mele, T., Dillenburger, B., & Block, P. (2022). Challenges and Opportunities in Scaling up Architectural Applications of Mycelium-Based Materials with Digital Fabrication. Biomimetics (Basel, Switzerland), 7(2), 44. https://doi.org/10.3390/biomimetics7020044
Gantenbein, S., Colucci, E., Käch, J., Trachsel, E., Coulter, F. B., Rühs, P. A., Masania, K., & Studart, A. R. (2022). Three-dimensional Printing of Mycelium Hydrogels into Living Complex Materials. arXiv (Cornell University). https://doi.org/10.48550/arxiv.2203.00976
Li, J., Yang, H., Duan, Y. Y., Sun, X. D., Pang, X. P., & Guo, Z. G. (2024). Fungi contribute more than bacteria to the ecological uniqueness of soil microbial communities in alpine meadows. Global Ecology and Conservation, 55, e03246. https://doi.org/10.1016/j.gecco.2024.e03246
Parhizi, Z., Dearnaley, J., Kauter, K., Mikkelsen, D., Pal, P., Shelley, T., & Burey, P. (2025). The Fungus Among Us: Innovations and Applications of Mycelium-Based Composites. Journal of Fungi, 11(8), 549. https://doi.org/10.3390/jof11080549
Pérez-Pazos, E., Beidler, K. V., Narayanan, A., Beatty, B. H., Maillard, F., Bancos, A., Heckman, K. A., & Kennedy, P. G. (2024). Fungi rather than bacteria drive early mass loss from fungal necromass regardless of particle size. Environmental microbiology reports, 16(3), e13280. https://doi.org/10.1111/1758-2229.13280
Sharma, M., Lim, L., & Kaur, G. (2025). Tailoring structure-property relationships of fungal mycelium for material applications: A process engineering approach for pure mycelium-based biomaterials. New Biotechnology, 91, 156–169. https://doi.org/10.1016/j.nbt.2025.12.006
Explain the main advantages of cell-free protein synthesis over traditional in vivo methods, specifically in terms of flexibility and control over experimental variables. Name at least two cases where cell-free expression is more beneficial than cell production.
Cell-free protein synthesis (CFPS) offers important advantages over traditional in vivo expression because it provides a more open, flexible, and controllable reaction environment. Since there is no living cell to maintain, the researcher can directly adjust variables such as ionic strength, pH, redox conditions, DNA template concentration, cofactors, chaperones, detergents, lipids, or energy substrates without worrying about cell viability. CFPS is also typically faster, allowing protein production in hours rather than requiring cell growth, transformation, and induction steps over longer periods. In addition, it facilitates rapid prototyping of constructs and reaction conditions (Garenne et al., 2021; Jewett et al., 2008).
Another major advantage is that CFPS is particularly useful for proteins that are difficult to express in living cells, such as toxic proteins, membrane proteins, or proteins that require non-standard reaction environments. Because the system is open, reagents can be supplied directly and problematic cellular responses such as toxicity, growth inhibition, or proteolytic stress can be reduced (Garenne et al., 2021; Meyer et al., 2025).
Two cases where cell-free expression is more beneficial than cell-based production are:
Cases
Description
1) Toxic proteins
They may inhibit growth or kill the host cell during in vivo production (Chipman et al., 2025).
2) Membrane proteins
CFPS allows co-translational insertion into detergents, nanodiscs, or liposomes under defined conditions, improving solubility and functional analysis (Meyer et al., 2025).
Describe the main components of a cell-free expression system and explain the role of each component
A cell-free expression system generally includes the following components:
Component:
Description
1) Cell extract or purified transcription–translation machinery
Provides ribosomes, translation factors, tRNAs, aminoacyl-tRNA synthetases, and often metabolic enzymes needed for protein synthesis. In extract-based systems, these components come from lysed cells; in reconstituted systems, they are added as purified factors. (1)
2) DNA or mRNA template
Contains the coding sequence for the target protein and the regulatory elements needed for transcription and/or translation (1).
3) Amino acids
Serve as the building blocks for protein synthesis (1).
4) Nucleotides (ATP, GTP, CTP, UTP)
Required for transcription and for translation-associated energy consumption (1)
5) Energy source and regeneration system
Maintains ATP and GTP availability during the reaction, which is essential because protein synthesis is highly energy demanding (2; 3)
6) Salts and buffer components
Helps to keep suitable ionic strength and pH for enzyme activity and ribosome function, especially magnesium and potassium ions (3)
7) Cofactors and additives
Include chaperones, disulfide-bond helpers, detergents, lipids, nanodiscs, or microsomes depending on the protein being expressed (4; 5)
References 1. (Garenne et al., 2021); 2. (Jewett et al., 2008); 3. (Caschera, 2025); 4. (Harris et al., 2020); 5. (Meyer et al., 2025).
Additionally, a view of a CFPS by the article:
Figure 1.CFPS compounds from (Hong et al., 2014)
Why is energy provision regeneration critical in cell-free systems? Describe a method you could use to ensure continuous ATP supply in your cell-free experiment.
Energy regeneration is critical in CFPS because transcription and translation consume large amounts of ATP and GTP. Without a continuous energy supply, the reaction quickly slows or stops, lowering protein yield. In addition, some simple high-energy substrates can accumulate inorganic phosphate, which chelates magnesium and impairs ribosomal activity, further reducing productivity (Yavad et al., 2025). One way to ensure continuous ATP supply is to use an ATP-regeneration system based on phosphoenolpyruvate (PEP), which donates phosphate groups for ATP resynthesis. Another effective strategy is to use maltodextrin/polyphosphate-based metabolism in crude extracts, which can support longer-lasting and more cost-effective ATP regeneration through endogenous metabolic enzymes (Caschera & Noireaux, 2015; Chen et al., 2019).
Method
Paper
An alternative approach is the use of metabolic energy regeneration systems, such as glucose-based pathways. Anderson et al. (2015) demonstrated that glucose metabolism in eukaryotic cell-free systems enables sustained ATP production through endogenous enzymatic pathways, improving reaction longevity and cost efficiency.
Figure 2. Abstract from: Anderson et al., 2015)
Additionally, recent tools, such as ATP biosensors (Mu et al., 2024), provide insights into the energetic dynamics of biological systems. Although not directly used for ATP regeneration, these biosensors can help optimize cell-free reactions by monitoring ATP availability in real time and guiding adjustments in energy supply strategies.
Figure 3. Abstract from: (Mu et al., 2024)
Compare prokaryotic versus eukaryotic cell-free expression systems. Choose a protein to produce in each system and explain why.
In the following table, a comparison is made between different cell systems and the cell-free expression.
Table 1:Comparison of prokaryotic versus eukaryotic cell-free expression systems
Feature
Prokaryotic Cell-Free System
Eukaryotic Cell-Free System
Example Proteins
Speed, cost & yield
Based on E. coli extracts; generally faster, cheaper, and higher yielding. Ideal for rapid screening and prototyping.
Typically slower, more expensive, and sometimes lower yielding compared to prokaryotic systems.
GFP or bacterial metabolic enzymes (efficient cytosolic expression).
Post-translational modifications (PTMs)
Limited capacity for PTMs; not suitable for complex modifications.
Capable of complex PTMs such as glycosylation and proper disulfide bond formation.
Glycosylated receptor fragments or secreted proteins.
Protein folding & complexity
Best suited for simple, soluble proteins; may struggle with complex folding.
Better suited for complex proteins requiring proper folding machinery.
Eukaryotic enzymes or multi-domain proteins.
Membrane protein expression
Limited ability; often requires artificial additives (detergents, liposomes).
More efficient due to the presence of microsomes and native-like membrane environments.
Description: The table information was based on (Garenne et al., 2021; Jewett et al., 2008; Meyer et al., 2025), and (Fenz et al., 2014) for the eukaryotic field.
How would you design a cell-free experiment to optimize the expression of a membrane protein? Discuss the challenges and how you would address them in your setup.
A rational way to design a cell-free experiment to express a membrane protein would be to optimize both the biochemical reaction conditions and the DNA construct. Based on the VDAC study by Zayni et al. (2021), I would use a prokaryotic cell-free expression system and focus particularly on the region surrounding the translation start site, since the paper showed that expression efficiency was mainly governed by translation initiation and mRNA conformation near the start codon, rather than by differences in transcription. (Zayni et al., 2021)
Steps:
I would first select a plasmid, in this case a plasmid + T7 promoter and a properly positioned Shine-Dalgarno sequence.
Then, I would evaluate the 5’ UTR and the first codons of the translated region. (Based on the paper of Zayni, it demonstrated that these sequence elements strongly influence whether the ribosome can properly dock and initiate translation) (Zayni et al., 2021)
It is important to analyze the accessibility of the ribosome docking site and estimate the ΔEopen of the mRNA around the start codon.
A lower ΔEopen would indicate that the ribosome-binding region is more accessible and therefore more likely to support efficient protein expression.
Optimization
To optimize the construct, I would test the following different design strategies:
Adjusting the spacing between the Shine-Dalgarno sequence and the start codon.
Adding a translation enhancer if native expression is too weak.
If I want to preserve the native amino acid sequence, introducing synonymous mutations (Substitutions; DNA changes that alter a codon’s nucleotide sequence but not the resulting amino acid) (Oelschlaeger, 2024) in the first several codons to reduce the inhibitory mRNA secondary structures without altering the protein itself.
This last strategy in the paper aims to substantially improve VDAC expression while preserving the WT protein sequence.
Main challenges
The main challenges in this setup could be:
Low translation efficiency: Caused by poor ribosome access to the start region.
Non-native N-terminal additions: Enhancers like His-tags or CAT- derived sequences are used.
Persistent low expression of membrane proteins, since these proteins are inherently difficult to produce.
I would address these by first identifying whether the limitation is transcriptional or translational. Since the paper showed that mRNA levels remained similar across poorly and well-expressed constructs, I would prioritize troubleshooting the translation-initiation region rather than assuming transcription is the problem. I would then redesign the coding sequence near the start codon to improve RDS accessibility, ideally using synonymous codon optimization.
Imagine you observe a low yield of your target protein in a cell-free system. Describe three possible reasons for this and suggest a troubleshooting strategy for each.
If I observed a low yield of my target membrane protein in a cell-free system, three possible reasons would be:
Case 1. Poor translation initiation due to inhibitory mRNA secondary structure:
Description:
Troubleshooting strategy:
A major reason for low yield could be that the region around the start codon is too structured, preventing proper ribosome docking. In the VDAC paper, constructs with similar transcription levels still showed very different protein yields, indicating that the bottleneck was translation initiation rather than mRNA production
I would redesign the sequence around the start codon, especially the first several codons of the translated region, to reduce the ΔEopen and improve accessibility of the ribosome docking site. This could be done with synonymous mutations so that the amino acid sequence remains unchanged
Case 2. Suboptimal construct architecture near the 5′UTR and RBS
Description:
Troubleshooting strategy:
Another reason could be an ineffective arrangement of the 5′UTR, Shine–Dalgarno sequence, and initiation codon. The study showed that even small differences in construct design near the start region changed VDAC expression substantially. It also found that the most favorable arrangement involved an optimal RBS-to-start codon spacing, around 11 nucleotides upstream in their model
I would test alternative plasmid designs with improved RBS positioning and compare constructs with or without translation-enhancing elements. If native expression remains poor, I could temporarily use an enhancer-containing construct for screening, then later optimize an enhancer-free native version
Case 3. Inadequate reaction conditions for cell-free synthesis
Description:
Troubleshooting strategy:
A third reason could be that the biochemical environment is not ideal for the system. The paper notes that the E. coli-based cell-free platform depends on appropriate biochemical conditions, including high T7 RNA polymerase activity and sufficient amino acid supply, especially for rapidly degraded amino acids. Even though the authors conclude that the mRNA sequence was more decisive than the biochemical conditions in their study, these conditions still matter for successful expression
I would verify reaction composition, template concentration, incubation time, and amino acid supply, and confirm that the chosen cell-free kit is appropriate for the membrane protein. I would also compare performance across different constructs under the same reaction conditions to distinguish sequence-related effects from reaction-related effects
Additionally:
Figure 4. Abstract from Zayni et al., 2021
This paper does not mainly optimize membrane insertion conditions such as lipid composition or detergents; rather, it shows that for this membrane protein, low expression was strongly linked to mRNA structure and translation initiation, and that in silico sequence optimization can significantly improve yield.
Based on my final individual project, KitBi, I am looking to detect early Gram-negative bacteria biofilms from kitchen surfaces and utensils in an easy, portable, economic, and quick method similar to a pH paper.
Pick a function and describe it.
a. What would your synthetic cell do? What is the input, and what is the output?
My synthetic cell would detect quorum-sensing molecules from Gram-negative bacteria before mature biofilm formation and convert that signal into a visible reporter output.
Input: AHL molecules released by Gram-negative bacteria.
Output: fluorescence or colorimetric signal produced by the synthetic cell. AHLs are a practical early target because they are extracellular signals associated with quorum sensing in Gram-negative bacteria, and quorum sensing is closely tied to virulence and biofilm-related behaviors.
b. Could this function be realized by cell-free Tx/Tl alone, without encapsulation?
Yes, theoretically. There are published cell-free biosensors for quorum-sensing molecules, so detection itself does not strictly require encapsulation. A paper by Wen et al. describes a cell-free biosensor for quorum-sensing biomarkers in infectious disease contexts.
Additionally, talking about the membrane, it gives more of an artificial cell logic, similar to Kate’s example: the vesicle becomes a defined sensing unit, can protect the Tx/Tl mix, and about selective exchange with the environment. Reviews on synthetic cell–living cell communication also support liposome-based systems as useful platforms for chemical communication.
d. Describe the desired outcome of your synthetic cell operation.
In the presence of Gram-negative quorum-sensing signals, the synthetic cell turns on a reporter and gives an early warning that a biofilm-prone bacterial population may be emerging on the surface being tested. This follows the objectives of detecting early and intervening before eradication becomes harder. The review on quorum-sensing molecule detection explicitly frames QS signals as potentially useful early diagnostic indicators.
Design all components that would need to be part of your synthetic cell.
a. What would the membrane be made of?
The membrane will be a phospholipid membrane with cholesterol, for example, POPC + cholesterol. Since this is a standard and defensible artificial-cell style membrane in liposome-based systems. Also, based on Lentini’s example, it used phospholipids plus cholesterol as a simple artificial-cell membrane concept.
b. What would you encapsulate inside? Enzymes, small molecules.
Inside the vesicle, I would encapsulate:
a bacterial cell-free Tx/Tl system
a DNA circuit containing an AHL-responsive transcription factor
a reporter gene such as sfGFP or lacZ
This is realistic because cell-free AHL biosensing has already been demonstrated, and bacterial lysate-based cell-free systems are commonly used for such biosensors
c. Which organism your Tx/Tl system will come from? Is bacterial OK, or do you need a mammalian system for some reason? (hint: for example, if you want to use small molecule modulated promotors, like Tet-ON, you need mammalian)
A bacterial system, ideally E. coli-based, is the most reasonable choice here, because AHL quorum-sensing modules like LuxR/plux are bacterial and do not require a mammalian expression background.
d. How will your synthetic cell communicate with the environment? (hint: are substrates permeable? or do you need to express the membrane channel?)
It will follow the communication logic:
Gram-negative bacteria on a surface release AHLs → AHL diffuses into or across the synthetic cell membrane → AHL binds its regulator inside the vesicle → reporter gene turns on.
a. List all lipids and genes. (bonus: find the specific genes; for example, instead of just saying “small molecule membrane channel” pick the actual gene.)
For my project, I decided to focus on a liposome-based synthetic cell encapsulating an E. coli cell-free expression system and a LuxR-responsive reporter circuit to detect AHL molecules released by Gram-negative bacteria as an early warning of biofilm development.
Lipids:
POPC
Cholesterol
Genes:
luxR
sfGFP under a LuxR-activated promoter such as PluxI
Freeze-dried cell-free systems can be incorporated into all kinds of materials as biological sensors or as inducible enzymes to modify the material itself or the surrounding environment. Choose one application field — Architecture, Textiles/Fashion, or Robotics — and propose an application using cell-free systems that are functionally integrated into the material. Answer each of these key questions for your proposal pitch:
Write a one-sentence summary pitch sentence describing your concept.
A sun-responsive shirt embedded with freeze-dried cell-free systems that activate under UV exposure, and produce a visible color change to reduce heat absorption and signal high solar intensity.
How will the idea work, in more detail? Write 3-4 sentences or more.
The textile would contain microencapsulated, freeze-dried cell-free systems embedded within its fibers that respond to UV radiation. Upon exposure to sunlight, the system becomes activated (for example: heat or humidity) and produces a colorimetric output, where higher UV intensity generates a deep purple pigment, while lower exposure results in a softer pastel tone. This gradient response allows the textile to visually indicate different levels of solar exposure rather than a simple on/off signal. As a result, the material functions both as a real-time UV indicator and as an adaptive aesthetic element in fashion.
What societal challenge or market need will this address?
This system addresses increasing UV exposure and heat stress, especially in regions like Latin America, especially here in Ecuador, where solar radiation is intense due to altitude.
High UV exposure is linked to skin damage and long-term health risks, but people often lack real-time awareness of exposure levels. A responsive textile could act as a personal UV sensor, helping individuals make better decisions about sun protection while also improving comfort and awareness.
How do you envision addressing the limitations of cell-free reactions (e.g., activation with water, stability, one-time use)?
Table 2.Addressing limitations of cell-free systems
Limitation:
Description:
Activation
Designed to activate with sweat or humidity instead of external water addition
Stability
Improved through lyophilization and stabilizers (e.g., trehalose) for long-term storage
One-time use
Implemented as microencapsulated, replaceable patches to allow renewal after activation
Reusability
Use of modular or layered textile design, where only sensing components are replaced
Washing limitations
Cell-free systems are water-sensitive, so patches should be removable before washing
Durability improvement
Protective encapsulation strategies could enhance resistance to moisture and extend usability
Homework question from Ally Huang
Freeze-dried cell-free reactions have great potential in space, where resources are constrained. As described in my talk, the Genes in Space competition challenges students to consider how biotechnology, including cell-free reactions, can be used to solve biological problems encountered in space. While the competition is limited to only high school students, your assignment will be to develop your own mock Genes in Space proposal to practice thinking about biotech applications in space!
For this particular assignment, your proposal is required to incorporate the BioBits® cell-free protein expression system, but you may also use the other tools in the Genes in Space toolkit (the miniPCR® thermal cycler and the P51 Molecular Fluorescence Viewer). For more inspiration, check out https://www.genesinspace.org/ .
1. Provide background information that describes the space biology question or challenge you propose to address. Explain why this topic is significant for humanity, relevant for space exploration, and scientifically interesting. (Maximum 100 words)
Biofilms are a real challenge in spacecraft because microbes can colonize surfaces and water systems, threatening hardware reliability and potentially crew health. NASA documents note that biofilm formation has been observed in ISS systems, including water lines, where it contributed to clogging and pump issues. This is significant for humanity because long-duration missions will require reliable, low-resource methods for monitoring contamination. It is also scientifically interesting because microgravity and spaceflight conditions can alter microbial behavior, including biofilm-related traits.
Figure 5. Microbial Research Guide from Colorado et al., 2021
Figure 6. Conference of 2022 about Redefining Microbiological Risk Mitigation During Spaceflight from Ott, 2022
Link to access the following documents in the Sources section
2. Name the molecular or genetic target that you propose to study. Examples of molecular targets include individual genes and proteins, DNA and RNA sequences, or broader -omics approaches. (Maximum 30 words)
Biofilm- and quorum-sensing-related RNA targets from Gram-negative bacteria, such as luxS, lasI/lasR, or pslA transcripts
3. Describe how your molecular or genetic target relates to the space biology question or challenge your proposal addresses. (Maximum 100 words)
Biofilm formation does not begin as a visible layer; it starts with changes in gene expression and cell-cell signaling. Quorum-sensing and biofilm-associated transcripts can therefore serve as early molecular indicators of biofilm development before major fouling occurs. Detecting these RNA targets would help identify when bacteria are shifting from planktonic growth toward surface-associated communities, which is exactly the stage where intervention is most useful in spacecraft systems with limited maintenance capacity.
4. Clearly state your hypothesis or research goal and explain the reasoning behind it. (Maximum 150 words)
I hypothesize that Gram-negative bacteria exposed to space-relevant stress conditions will show an increased abundance of quorum-sensing or biofilm-associated RNA targets compared with non-biofilm controls, and that these changes can be detected using a compact toolkit that combines miniPCR, BioBits®, and fluorescence readout.
My goal is to develop an early-warning molecular screening strategy for spacecraft biofilm risk. The reasoning is that freeze-dried cell-free systems are portable and low-resource, while the Genes in Space toolkit already includes fluorescence-based tools designed for constrained environments.
If successful, this approach could support routine monitoring of microbial contamination during long-duration missions.
5. Outline your experimental plan - identify the sample(s) you will test in your experiment, including any necessary controls, the type of data or measurements that will be collected, etc. (Maximum 100 words)
I would test RNA extracted from Gram-negative bacterial cultures grown under a biofilm-promoting condition versus planktonic control cultures. miniPCR would amplify cDNA corresponding to selected biofilm-related targets, and BioBits® plus the P51 fluorescence viewer would be used to visualize signal output. Controls would include a no-template negative control and a non-biofilm bacterial condition. Data would consist of fluorescence presence or relative intensity across samples, indicating whether biofilm-associated targets are enriched under spacecraft-relevant stress conditions.
KitBi: An Early-Warning Fluorescent Biosensor for Early Biofilm Commitment on Food-Contact Surfaces
Aims!
Aim 1 — Experimental aim
Design and computationally validate a PcsgD-driven fluorescent reporter construct in non-pathogenic E. coli K-12 to detect early biofilm-inducing physiological states relevant to food-contact surfaces.
Aim 2 — Development aim
Test the reporter under controlled early-attachment conditions using simulated or future experimental comparisons across planktonic, surface-exposed, and stainless-steel-associated growth states, and optimize the system with an internal normalization module or alternative promoters such as PcsgBAC.
Aim 3 — Visionary aim
Translate KitBi into a portable early-warning platform for food-contact surface monitoring, potentially through freeze-dried, paper-based, or cell-free-compatible readouts that support preventive hygiene decisions before mature biofilm establishment.
Final Slide
Weekly reflection:
This week made me realize how universal biofilms are. I initially thought of them mainly in food and clinical contexts, but learning about their presence in space environments really changed my perspective. It was surprising to see that biofilms can form even under microgravity conditions and still represent a risk for systems like water lines and surfaces in spacecraft.
This reinforced the relevance of my project, since early detection is not only important on Earth but also in highly controlled environments like space missions. It made me think that KitBi could have broader applications beyond food safety, especially in settings where prevention is critical and intervention is limited.
Thank you for reading! I updated this entry also on my personal Notion webpage. To check it, please enter here! Notion W9
Caschera, F., & Noireaux, V. (2015). A cost-effective polyphosphate-based metabolism fuels an all E. coli cell-free expression system. Metabolic Engineering, 27, 29-37. https://doi.org/10.1016/j.ymben.2014.10.007
Chen, J., Mitra, R., Zhang, S., Zuo, Z., Lin, L., Zhao, D., Xiang, H., & Han, J. (2019). Unusual Phosphoenolpyruvate (PEP) Synthetase-Like Protein Crucial to Enhancement of Polyhydroxyalkanoate Accumulation in Haloferax mediterranei Revealed by Dissection of PEP-Pyruvate Interconversion Mechanism. Applied and environmental microbiology, 85(19), e00984-19. https://doi.org/10.1128/AEM.00984-19
Chipman, D. M., Woolley, A. C., Chau, D. N., Lance, W. A., Talley, J. P., Green, T. P., Robbins, B. C., & Bundy, B. C. (2025). Cell-Free Protein Synthesis Reactor Formats: A Brief History and Analysis. SynBio, 3(3), 10. https://doi.org/10.3390/synbio303001
Fenz, S. F., Sachse, R., Schmidt, T., & Kubick, S. (2013). Cell-free synthesis of membrane proteins: Tailored cell models out of microsomes. Biochimica Et Biophysica Acta (BBA) - Biomembranes, 1838(5), 1382-1388. https://doi.org/10.1016/j.bbamem.2013.12.009
Harris, N.J., Pellowe, G.A. & Booth, P.J. Cell-free expression tools to study co-translational folding of alpha helical membrane transporters. Sci Rep10, 9125 (2020). https://doi.org/10.1038/s41598-020-66097-4
Jewett, M.C., Calhoun, K.A., Voloshin, A. et al. An integrated cell‐free metabolic platform for protein production and synthetic biology. Mol Syst Biol4, MSB200857 (2008). https://doi.org/10.1038/msb.2008.57
Meyer, C., Arizzi, A., Henson, T. et al. Designer artificial environments for membrane protein synthesis. Nat Commun16, 4363 (2025). https://doi.org/10.1038/s41467-025-59471-1
Oelschlaeger P. (2024). Molecular Mechanisms and the Significance of Synonymous Mutations. Biomolecules, 14(1), 132. https://doi.org/10.3390/biom14010132
Yadav, S., Perkins, A. J. P., Liyanagedera, S. B. W., Bougas, A., & Laohakunakorn, N. (2025). ATP Regeneration from Pyruvate in the PURE System. ACS synthetic biology, 14(1), 247–256. https://doi.org/10.1021/acssynbio.4c00697
Zayni, S., Damiati, S., Moreno-Flores, S., Amman, F., Hofacker, I., Jin, D., & Ehmoser, E. K. (2021). Enhancing the Cell-Free Expression of Native Membrane Proteins by In Silico Optimization of the Coding Sequence-An Experimental Study of the Human Voltage-Dependent Anion Channel. Membranes, 11(10), 741. https://doi.org/10.3390/membranes11100741
Kate Adamala:
Didovyk, A., Tonooka, T., Tsimring, L., & Hasty, J. (2017). Rapid and Scalable Preparation of Bacterial Lysates for Cell-Free Gene Expression. ACS Synthetic Biology, 6(12), 2198-2208. https://doi.org/10.1021/acssynbio.7b00253
Ding, Y., Wu, F., & Tan, C. (2014). Synthetic Biology: A Bridge between Artificial and Natural Cells. Life, 4(4), 1092-1116. https://doi.org/10.3390/life4041092
Galloway, W. R. J. D., Hodgkinson, J. T., Bowden, S. D., Welch, M., & Spring, D. R. (2010). Quorum Sensing in Gram-Negative Bacteria: Small-Molecule Modulation of AHL and AI-2 Quorum Sensing Pathways. Chemical Reviews, 111(1), 28-67. https://doi.org/10.1021/cr100109t
Kumari, A., Pasini, P., Deo, S. K., Flomenhoft, D., Shashidhar, H., & Daunert, S. (2006). Biosensing Systems for the Detection of Bacterial Quorum Signaling Molecules. Analytical Chemistry, 78(22), 7603-7609. https://doi.org/10.1021/ac061421n
Lentini, R., Santero, S., Chizzolini, F. et al. Integrating artificial with natural cells to translate chemical messages that direct E. coli behaviour. Nat Commun5, 4012 (2014). https://doi.org/10.1038/ncomms5012
Miller, C., & Gilmore, J. (2020). Detection of Quorum-Sensing Molecules for Pathogenic Molecules Using Cell-Based and Cell-Free Biosensors. Antibiotics, 9(5), 259. https://doi.org/10.3390/antibiotics9050259
Mukwaya, V., Mann, S. & Dou, H. Chemical communication at the synthetic cell/living cell interface. Commun Chem4, 161 (2021). https://doi.org/10.1038/s42004-021-00597-w
Rampioni, G., D’Angelo, F., Leoni, L., & Stano, P. (2019). Gene-Expressing Liposomes as Synthetic Cells for Molecular Communication Studies. Frontiers in bioengineering and biotechnology, 7, 1. https://doi.org/10.3389/fbioe.2019.00001
Wen, K. Y., Cameron, L., Chappell, J., Jensen, K., Bell, D. J., Kelwick, R., Kopniczky, M., Davies, J. C., Filloux, A., & Freemont, P. S. (2017). A Cell-Free Biosensor for Detecting Quorum Sensing Molecules in P. aeruginosa-Infected Respiratory Samples. ACS Synthetic Biology, 6(12), 2293-2301. https://doi.org/10.1021/acssynbio.7b00219
Peter Nguyen
Lawrynowicz, A., Vuori, S., Palo, E., Winther, M., Lastusaari, M., & Miettunen, K. (2024). Transforming fabrics into UV-sensing wearables: A photochromic hackmanite coating for repeatable detection. Chemical Engineering Journal, 494, 153069. https://doi.org/10.1016/j.cej.2024.153069
Sąsiadek-Andrzejczak, E., & Kozicki, M. (2023). Multi-Color Printed Textiles for Ultraviolet Radiation Measurements, Creative Designing, and Stimuli-Sensitive Garments. Materials, 16(16), 5622. https://doi.org/10.3390/ma16165622
Ally Huang
Flores, P., Luo, J., Mueller, D. W., Muecklich, F., & Zea, L. (2024). Space biofilms - An overview of the morphology of Pseudomonas aeruginosa biofilms grown on silicone and cellulose membranes on board the international space station. Biofilm, 7, 100182. https://doi.org/10.1016/j.bioflm.2024.100182
Jung, J. K., Rasor, B. J., Rybnicky, G. A., Silverman, A. D., Standeven, J., Kuhn, R., Granito, T., Ekas, H. M., Wang, B. M., Karim, A. S., Lucks, J. B., & Jewett, M. C. (2023). At-Home, Cell-Free Synthetic Biology Education Modules for Transcriptional Regulation and Environmental Water Quality Monitoring. ACS synthetic biology, 12(10), 2909–2921. https://doi.org/10.1021/acssynbio.3c00223
Ravichandran, V., Krishnan, B., Tinwala, M., Kumar, A. S., & Jobby, R. (2025). Microbial resilience in space: Biofilms, risks and strategies for space exploration. Life Sciences In Space Research, 47, 1-13. https://doi.org/10.1016/j.lssr.2025.05.004
Vélez Justiniano, Y. A., Goeres, D. M., Sandvik, E. L., Kjellerup, B. V., Sysoeva, T. A., Harris, J. S., Warnat, S., McGlennen, M., Foreman, C. M., Yang, J., Li, W., Cassilly, C. D., Lott, K., & HerrNeckar, L. E. (2023). Mitigation and use of biofilms in space for the benefit of human space exploration. Biofilm, 5, 100102. https://doi.org/10.1016/j.bioflm.2022.100102
SOURCES:
Image PART A:
Hong, S. H., Kwon, Y. C., & Jewett, M. C. (2014). Non-standard amino acid incorporation into proteins using Escherichia coli cell-free protein synthesis. Frontiers in chemistry, 2, 34. https://doi.org/10.3389/fchem.2014.00034
Where it contains at the end His-purification tag with (HHHHH) and a linker (LE) previously.
Then I enter Expasy for the calculation pI/Mw: This allows estimation of the theoretical molecular weight of the protein based on its amino acid sequence, which is later used as a reference to evaluate the accuracy of the experimental mass spectrometry results.
It determined the average Theoretical pI/Mw: 5.90 / 28006.60
Peak selection
Two adjacent charge-state peaks were selected from Figure 1 at 903.7148 and 875.4421 m/z. Using the adjacent charge-state equation,
therefore, the peak at 903.7148 m/z corresponds to charge state 31+ , and the peak at 875.4421 m/z corresponds to 32+.
The molecular weight was then calculated as:
The experimental molecular weight shows strong agreement with the theoretical value obtained from ExPASy (28006.60 Da), indicating high measurement accuracy.
which corresponds to 0.081% error.
Can you observe the charge state for the zoomed-in peak in the mass spectrum for the intact eGFP? If yes, what is it? If not, why not?
Yes, the charge state can be determined from the zoomed-in peak. In the inset, individual isotopic peaks are clearly resolved, and the spacing between them corresponds to approximately 1/z. Since the observed spacing between isotopic peaks is very small, this indicates a relatively high charge state. By measuring the distance between adjacent isotopic peaks, the charge state can be estimated.
However, if the resolution were insufficient, it would not be possible to determine the charge state because the isotopic peaks would overlap and appear as a single broad signal.
Additionally:
For the full calculations, please read the “Source section” at the bottom of the webpage!
Waters Part II — Secondary/Tertiary structure
In this section, it is important to recognize the difference between native and denatured proteins and how this is reflected in the mass spectrum.
Proteins in their native state maintain a compact, folded conformation stabilized by non-covalent interactions such as hydrogen bonds, hydrophobic interactions, and ionic forces. In this state, fewer ionizable sites are exposed to the solvent, resulting in lower protonation during mass spectrometry analysis (1).
In contrast, denatured proteins lose their secondary and tertiary structure due to the influence of solvents, pH, or temperature. This unfolding exposes a greater number of basic residues (such as lysine and arginine), allowing the protein to acquire more charges (1,2).
In mass spectrometry, this difference is reflected in the charge state distribution. Native proteins typically exhibit lower charge states (smaller z values), which results in peaks at higher m/z values. Conversely, denatured proteins display higher charge states due to increased protonation, producing peaks at lower m/z values (1,3).
When comparing the spectra in Figure 2, clear differences can be observed between the denatured and native states of eGFP. The denatured spectrum (top, green) shows a broad distribution of peaks across lower m/z values, indicating a wide range of high charge states due to protein unfolding and increased protonation.
Figure 2.Comparison of native and denatured eGFP mass spectra.
In contrast, the native spectrum (bottom, red) displays fewer and more defined peaks at higher m/z values (~2500–2800), corresponding to lower charge states. This reflects a compact tertiary structure with limited solvent-accessible protonation sites.
These differences demonstrate how protein conformation directly influences charge state distribution in mass spectrometry.
Charge state
The charge state of the peak at approximately 2800 m/z can be estimated using the relationship between molecular weight and m/z. Given that the molecular weight of eGFP is approximately 28,000 Da, the charge state can be approximated as:
Therefore, the peak at ~2800 m/z corresponds to a charge state of approximately 10+.
This is consistent with the native state of the protein, where fewer charges are present due to its compact, folded structure.
Additionally:
For the full calculations, please read the “Source section” at the bottom of the webpage!
Waters Part III — Peptide Mapping - primary structure
For this section, it is important to analyze how trypsin cleaves peptide bonds specifically after lysine (K) and arginine (R) residues, and how this enzymatic digestion generates peptide fragments that can be analyzed by LC-MS.
To determine the number of potential cleavage sites, the eGFP sequence was analyzed using bioinformatics tools such as Benchling.
Trypsin is a proteolytic enzyme that cleaves peptide bonds specifically after lysine (K) and arginine (R) residues. Based on the biochemical properties of the eGFP sequence, the total number of lysine and arginine residues was determined.
The analysis showed:
Lysine (K): 20 residues
Arginine (R): 6 residues
Therefore, the total number of potential cleavage sites is:
20+6=26
This represents the theoretical number of trypsin cleavage sites in the protein.
To further analyze the digestion products, the eGFP sequence was submitted to the ExPASy PeptideMass tool.
To confirm this information, you can access my project at the following link:
I generated the predicted 3D structure of eGFP, which supports its compact folded conformation before digestion, which is consistent with the need for enzymatic cleavage to generate peptide fragments for LC-MS analysis.
Small tutorial of Benchling
Tryptic digestion:
The eGFP sequence was analyzed in the ExPASy PeptideMass tool using the following parameters:
Enzyme: Trypsin
Maximum missed cleavages: 0
Cysteines: reduced form
Methionines: not oxidized
Peptide mass filter: > 500 Da
Mass type: monoisotopic [M+H]+[M+H]+[M+H]^+
Under these conditions, the digestion generated 19 predicted peptides, as shown in Table 1.
The number of predicted peptides (19) is lower than the theoretical number of cleavage sites (26). This difference can be explained by the filtering conditions applied in the PeptideMass tool, particularly the exclusion of peptides with masses below 500 Da, as well as the absence of missed cleavages.
Chromatographic map:
Based on the total ion chromatogram (Figure 5a), approximately 20–25 chromatographic peaks can be observed between 0.5 and 6 minutes when considering peaks above 10% relative abundance:
Figure 5a.chromatomap
This number is slightly higher than the 19 peptides predicted using the PeptideMass tool.
This discrepancy can be explained by many reasons, such as:
Co-elution of peptides
Presence of noise or minor peaks
Multiple charge states of the same peptide
Differences in ionization efficiency
Therefore, the number of chromatographic peaks does not exactly match the number of predicted peptides
Identify the mass-to-charge:
Figure 5bMass spectrum figure
The principal peak indicate a value of 525.76712 m/z. So, the mass-to-charge ratio (m/z) of the peptide shown in Figure 5b is approximately 525.77.
Charge state (z)
The charge state (z) of the peptide was determined by measuring the spacing between isotopic peaks. The difference between adjacent peaks is approximately 0.49 m/z, which corresponds to:
Therefore, the most abundant charge state of the peptide is 2+.
Peptide Mass (singly charged)
The molecular weight of the singly charged peptide was calculated as:
In conclusion, the peptide mapping results confirm the identity of the protein as eGFP, as both the peptide masses and sequence coverage are consistent with the expected theoretical values.
Identify the Peptide:
The calculated peptide mass (~1049.52 Da) closely matches the theoretical peptide mass 1050.52 Da predicted by the PeptideMass tool. This corresponds to the peptide sequence FEGDTLVNR shown in Table 1.
Error (ppm)
The mass error was calculated as:
Coverage
Figure 6Coverage eGFP
The peptide mapping analysis confirmed approximately 88% of the eGFP amino acid sequence, indicating strong agreement between the experimental data and the expected protein sequence.
In conclusion, the peptide mapping results confirm the identity of the protein as eGFP, as both the peptide masses and sequence coverage are consistent with the expected theoretical values.
Bonus Peptide Map Questions
To determine the peptide sequence corresponding to the fragmentation spectrum in Figure 5c, the peptide with the closest theoretical mass to the experimentally observed value in Figure 5b was selected. The peptide FEGDTLVNR (theoretical mass: 1050.52149 Da) was analyzed using the Fragment Ion Calculator with monoisotopic masses, charge state +1, and b/y ion series.
The predicted fragmentation pattern showed strong agreement with the experimental spectrum. Several y-ions matched closely with the observed peaks, including:
y3 ≈ 388.23
(observed ~388.22)
y4 ≈ 501.31
(observed ~501.31)
y5 ≈ 602.36
(observed ~602.35)
y7 ≈ 774.41
(observed ~774.41)
y8 ≈ 903.45
(observed ~903.44)
Additionally, the precursor ion at ~1050.52 Da was also observed. These results confirm that the peptide sequence that best matches the fragmentation spectrum is FEGDTLVNR.
Results of sequence
Figure 5c
Figure 5b
Does the peptide map data make sense?
Yes, the peptide map data are consistent with the protein being the eGFP standard. The experimentally observed peptide masses match the theoretical values predicted from the eGFP sequence, and the fragmentation pattern confirms the identity of specific peptides such as FEGDTLVNR.
Furthermore, the sequence coverage shown in Figure 6 is approximately 88%, indicating that a large portion of the protein sequence was experimentally confirmed. The combination of accurate mass measurements, matching fragmentation patterns, and high sequence coverage strongly supports that the analyzed protein corresponds to eGFP.
For the full calculations, please read the “Source section” at the bottom of the webpage!
Waters Part IV — Oligomers
Charge detection mass spectrometry (CDMS) allows direct mass measurement of large protein assemblies, making it possible to identify the oligomeric states of Keyhole Limpet Hemocyanin (KLH). Based on Table 2, the KLH subunits have the following masses: 7FU = 340 kDa and 8FU = 400 kDa.
Table 2.KLH Subunit Masses
Polypeptide Subunit Name
Subunit Mass (kDa)
7FU
3400
8FU
8000
8FU 3D
12000
8FU 4D
16000
Full calculus at Sources section, page 3
Compared in Figure 7, these species can be identified approximately at the following positions:
Figure 7 KHL spec-mass
7FU Decamer → peak near 3.4 MDa
8FU Didecamer → major peak near 8.3 MDa
8FU 3-Decamer → peak near 12.7 MDa
8FU 4-Decamer → weak signal expected near 16 MDa
These assignments are consistent with the labeled mass positions shown in the KLH CDMS spectrum.
For the full calculations, please read the “Source section” at the bottom of the webpage!
Waters Part V — Did I make GFP?
Based on the intact LC-MS analysis, the theoretical molecular weight of eGFP was 28.0066 kDa, while the experimentally observed molecular weight was 27.9839 kDa. The calculated mass error was approximately 810 ppm, indicating that the measured protein mass is very close to the expected theoretical value.
This strong agreement supports that the analyzed protein corresponds to eGFP.
Molecular weight (kDa)
Value
Theoretical
28.0066
Observed/measured on Intact LC-MS
27.9839
PPM Mass Error
~ 810 ppm
For the full calculations, please read the “Source section” at the bottom of the webpage!
Homework: Individual Final Project
1. What will be measured?
Type
description
sfGFP fluorescence
The primary readout of the biofilm-responsive promoter activity
mCherry
Control
Relative surface-associated growth or late-stage biomass formation
Wet lab: Conceptual comparison with early fluorescence activation
Additionally, I look for simulated expression dynamics, including RNA concentration, protein concentration, and expression flux, using the Asimov Kernel.
2. How will these measurements be performed?
💻 In silico validation:
Asimov Kernel simulations will be used to compare predicted basal versus induced expression states of the construct under biofilm-promoting conditions.
🧬 DNA construct design:
Benchling will be used to design and organize promoter architecture, RBS selection, terminators, and plasmid backbone assembly.
- Fluorescence measurements could be performed using a fluorescence plate reader and fluorescence microscopy under planktonic and surface-associated growth conditions.
- Crystal violet staining may also be used as a comparative late-stage biofilm biomass assay.
🧪 Molecular verification (future phase):
Sanger sequencing could be used to verify the correct assembly and integrity of the promoter–reporter cassette.
3. Technologies and tools
Benchling for DNA construct design and sequence organization.
Asimov Kernel for computational simulation and predicted expression analysis.
Literature databases and biofilm-related resources focused on csgD, curli regulation, quorum sensing, and Gram-negative biofilm formation in E. coli and Salmonella.
Proposed future technologies include fluorescence plate readers, fluorescence microscopy, PCR amplification, Gibson Assembly workflows, and DNA sequencing.
Weekly reflection
During the Waters LC-MS homework, I initially confused some experimental values and mass spectrometry interpretations, especially regarding charge states and ppm calculations
Despite this, I followed the analytical logic step by step and learned how to interpret experimental spectra using the theoretical values and available datasets
This week helped me better understand how computational analysis and experimental data complement each other during protein characterization workflows
I also reinforced my confidence in using bioinformatics tools such as Benchling, ExPASy, and fragmentation analysis platforms to support experimental reasoning
For KitBi, this process reminded me that even proposed in silico biosensor systems require careful interpretation of experimental-like datasets and validation logic
Also, this information is followed by my notion webpage. If you are interested in reading it, please click here! Week10 Homework
References and Sources
Waters Part II:
(1) Kafader, Jared O et al. “Native vs Denatured: An in-depth Investigation of Charge State and Isotope Distributions.” Journal of the American Society for Mass Spectrometry vol. 31,3 (2020): 574-581. doi:10.1021/jasms.9b00040
(2) Masson, Patrick, and Sofya Lushchekina. “Conformational Stability and Denaturation Processes of Proteins Investigated by Electrophoresis under Extreme Conditions.” Molecules (Basel, Switzerland) vol. 27,20 6861. 13 Oct. 2022, doi:10.3390/molecules27206861
(3) Cassou, Catherine A et al. “Electrothermal supercharging in mass spectrometry and tandem mass spectrometry of native proteins.” Analytical chemistry vol. 85,1 (2013): 138-46. doi:10.1021/ac302256d
Sources:
Calculus document
In the following PDF document, the full calculus for the Waters sections
Week 10 calculus: Click here to download the pdf file: Week10 document
Week 11: Bioproduction & Cloud Labs
Week 11: Bulding Genomes
Part A: The 1,536 Pixel Artwork Canvas | Collective Artwork
Pixel Artwork Contributation:
I was excited to participate in the HTGAA 2026 collaborative pixel artwork experiment. My main contribution was helping create part of the “2026” design on the left corner of the canvas, as well as contributing to the yellow and cyan giraffe section, the rainbow mandala near the center-bottom region, and a small Ecuadorian flag on the left side of the artwork showed on the Figures 1 and Figure 7. The collaborative work was on: https://rcdonovan.com
Figure 1. My contributions to the HTGAA 2026 collaborative pixel artwork project. Made on April 19th 2026
Before
After
Figure 2. Comparison between before and after by other global students
One of the things I enjoyed the most about this project was seeing how students from different countries and backgrounds collaborated in real time to build a single large-scale bioart piece together. I especially liked browsing the HTGAA forum and observing how creative and diverse the ideas from other global participants were (Figure 2). Additionally, the timeline visualization created by Ronan using the pixel history tool made the collaborative process feel even more dynamic and memorable (Figure 3).
I also appreciated how this project combined synthetic biology, digital art, and community participation into a shared scientific-artistic experience. It made the course feel more connected globally, even for remote participants and committed listeners! Finally, for the collab of HTGAA 2026 and SynBioBeta, the final image of the global collab image (Figures 6 & 7).
Transition to the reagent collaboration section:
As part of the second collaborative phase of the experiment, I also contributed to preliminary reagent composition planning for the cell-free fluorescent artwork reactions. My contribution focused on testing small variations in ribose and glucose supplementation across multiple wells in order to explore how sustained energy metabolism could affect long-term fluorescence during extended incubation (Figures 4 & 5).
Gallery:
Figure 4
Figure 5
Figure 4. Initial reagent adjustment planning for cell-free fluorescence optimization; Figure 5. Table of contribution ana-gomez
Figure 6. Final collaborative HTGAA 2026 fluorescent artwork. HTGAA 2026 (May 20, 2026). Most recent Art pixel collaboration screenshot
Figure 7. HTGAA 2026 collaborative artwork before the SynBioBeta integration (May 05, 2026). I contributed to the giraffe section on the left corner with the yellow and cyan background, the rainbow mandala near the bottom center, and the small Ecuadorian flag on the left side of the canvas.
Future recommendations: I think it could be improved by providing a larger editable canvas area or allowing teams to reserve small collaborative regions in advance. This could help participants coordinate more complex designs while still maintaining the spontaneous and creative nature of the project. Additionally, one aspect that noticeably improved during the experiment was the pixel placement cooldown time, which was reduced from 30 seconds at the beginning to only 5 seconds later on. This significantly improved the collaborative experience and allowed participants to contribute more efficiently to the evolving artwork.
Part B: Cell-Free Protein Synthesis | Cell-Free Reagents
The optimized 20-hour incubation formulation is a ribose-based cell-free TXTL system designed to sustain long-duration fluorescent protein expression through indirect nucleotide and energy regeneration pathways. The reaction composition can be divided into the following categories: E. coli Lysate, Salts/Buffer, Energy/Nucleotide System, Translation Mix (Amino Acids), Additives, and Backfill.
1. E. coli Lysate
BL21 (DE3) Star Lysate (includes T7 RNA Polymerase)
This lysate contains the endogenous E. coli transcription-translation machinery required for cell-free protein synthesis, including ribosomes, enzymes, tRNAs, metabolic cofactors, and ATP regeneration pathways.
The incorporated T7 RNA polymerase enables strong transcription from T7 promoters commonly used in synthetic biology, although its high transcriptional speed may affect transcription-translation coupling under some reaction conditions.
(Silverman et al., 2020; Zhang et al., 2018)
2. Salt / Buffers
Reactive
Description
References
Potassium Glutamate
Maintains ionic strength and mimics the intracellular E. coli environment, supporting ribosome stability and protein synthesis. It was consistently retained across optimized RFopt TXTL formulations.
(Deredge et al., 2010; Olsen et al., 2026)
HEPES-KOH pH 7.5
Stabilizes pH during long incubations, helping maintain transcription and translation efficiency. HEPES supplementation also improved long-duration RFopt performance.
(Panah et al., 2015; Olsen et al., 2026)
Magnesium Glutamate
Essential for ribosome assembly, RNA stability, and ATP-dependent enzymatic reactions during transcription and translation. It remained a key component in optimized TXTL systems.
(Caschera, 2017; Sun et al., 2023; Olsen et al., 2026)
Potassium phosphate monobasic/dibasic
Supports phosphate balance, buffering capacity, and metabolic stability during TXTL reactions. Phosphate levels also influenced ATP balance in RFopt formulations.
(Anderson et al., 2015; Yadav et al., 2025; Olsen et al., 2026)
3. Energy / Nucleotide System
Reactive
Description
References
Ribose
Supports nucleotide regeneration and sustained transcriptional activity during long-duration TXTL reactions. Ribose supplementation was also associated with improved yields in optimized RFopt formulations.
(Loan et al., 2018; Olsen et al., 2026)
Glucose
Functions as a low-cost non-phosphorylated energy substrate that supports ATP regeneration and prolonged TXTL activity in E. coli lysate systems.
(Anderson et al., 2015; Sato et al., 2024; Olsen et al., 2026)
AMP / CMP / UMP
These nucleotide monophosphates can be recycled into higher-energy nucleotide forms required for RNA synthesis and metabolic maintenance during cell-free protein synthesis.
(Nakagawara et al., 2022)
GMP
Contributes to guanosine nucleotide pools required for transcription and RNA synthesis. Optimized RFopt systems demonstrated that GMP could be partially replaced using guanine and ribose supplementation.
(Ballut et al., 2023; Olsen et al., 2026)
Guanine
Guanine can be converted into GMP and eventually GTP through endogenous nucleotide salvage pathways present in the lysate. Guanine and ribose supplementation successfully replaced GMP in optimized RFopt formulations without major yield reduction.
(Olsen et al., 2026; Wang et al., 2022; Iglesias-Gato et al., 2010)
4. Translation Mix
Reactive
Description
References
17 Amino Acid Mix
Provides most amino acids required for translation, protein synthesis, and fluorescent protein production during TXTL reactions. Amino acid composition and concentration are important for maintaining efficient cell-free expression systems.
(Caschera & Noireaux, 2015; Worst et al., 2016)
Tyrosine
Tyrosine is supplemented separately due to its lower solubility and potential depletion during long-duration TXTL reactions. Separate preparation can improve reagent stability and protein expression efficiency.
(Caschera & Noireaux, 2015; Thornton et al., 2025)
Cysteine
Cysteine is added separately because of its oxidation sensitivity and its role in protein folding and disulfide bond formation. Redox optimization is particularly important for cysteine-rich proteins in cell-free systems.
(Ruiz et al., 2022) (Siddiquee & Kwan, 2021)
5. Additives
Nicotinamide:
Supports redox balance and NAD-related cofactor regeneration pathways involved in metabolic activity during TXTL reactions and cell-free protein synthesis.
(Alegre & Pastore, 2023; Yusri et al., 2025)
6. Backfill
Nuclease Free Water:
Used to adjust reaction volumes while minimizing nucleic acid degradation during TXTL and cell-free expression reactions.
(Waller, 2024; Romantseva et al., 2022)
Useful Resources for Cell-Free Reaction Preparation:
Online buffer calculators can help estimate reagent compositions during cell-free master mix preparation and optimization workflows. One useful example is the AAT Bioquest HEPES buffer preparation calculator.
1-hour optimized PEP-NTP master mix vs. 20-hour NMP-Ribose-Glucose master mix
The 1-hour PEP-NTP system is optimized for rapid and high initial protein expression by directly supplying nucleotide triphosphates and phosphoenolpyruvate (PEP) as an immediate energy source. In contrast, the 20-hour NMP-ribose-glucose system relies on slower metabolic recycling pathways using nucleotide monophosphates, ribose, and glucose, creating a more sustainable and cost-effective platform for prolonged fluorescent protein expression and bioart applications.
Recent studies further demonstrated that optimized RFopt formulations maintained ATP levels for longer periods, reduced phosphate accumulation, and supported a more balanced metabolic environment during extended TXTL reactions. (Olsen et al., 2026)
Bonus Question
How can transcription occur if GMP is not included, but Guanine is?
Transcription can still occur because enzymes present in the E. coli lysate can convert guanine into GMP and eventually GTP through endogenous nucleotide salvage pathways, enabling continued RNA synthesis even without externally supplied GMP. Supporting this concept, Olsen et al. (2026) demonstrated that a combination of guanine and ribose could successfully replace GMP in optimized RFopt formulations without significantly reducing protein yield.
Part C: Planning the Global Experiment | Cell-Free Master Mix Design
For the reagent optimization step, I introduced only minor adjustments to ribose and glucose concentrations while maintaining the remaining core TXTL components unchanged. These reagents were selected because they primarily contribute to energy regeneration and long-term metabolic support in the cell-free system, allowing subtle modulation of fluorescence performance without significantly disrupting transcriptional or translational stability.
In contrast, key components such as magnesium glutamate, potassium glutamate, HEPES buffer, amino acid mixtures, and the E. coli lysate was intentionally preserved at their optimized baseline concentrations due to their essential roles in maintaining ionic balance, pH stability, ribosomal activity, protein synthesis efficiency, and overall reaction robustness. Limiting modifications to energy-associated reagents reduced the risk of compromising fluorescence output or affecting reproducibility across the collaborative cloud-lab experiment.
Figure 10. Master mix composition and reagent adjustment workflow for Q1-C9 expressing mKO2 during the HTGAA 2026 collaborative cell-free experiment.
Reagent Adjustment Strategy
The reagent supplementation strategy focused on testing small variations in ribose and glucose concentrations across selected wells while balancing total reaction volume with nuclease-free water. These modifications were designed to explore how sustained metabolic support and ATP regeneration could influence long-duration fluorescent protein expression during the 36-hour incubation period.
sfGFP is highly robust because it folds efficiently and matures rapidly, making it reliable for cell-free fluorescent readouts.
(Pédelacq et al., 2006; Pharma, 2025; FPbase, 2022)
mRFP1
mRFP1 is useful as a red fluorescent readout, but its brightness and maturation behavior can affect how quickly fluorescence becomes detectable.
(Balleza et al., 2017; FPbase, 2002)
mKO2
mKO2 fluorescence can be influenced by oxygen availability and maturation kinetics, which may affect signal intensity during extended cell-free incubation.
(Kremers et al., 2009; FPbase, 2008)
mTurquoise2
mTurquoise2 is a bright cyan fluorescent protein with high quantum yield, fast maturation, and low acid sensitivity, making it suitable for long-duration fluorescence measurements.
(Goedhart et al., 2012; FPbase, 2021)
mScarlet_I
mScarlet-I is a bright monomeric red fluorescent protein with relatively low pH sensitivity, which may help maintain fluorescence during long TXTL reactions.
(Botman et al., 2019; FPbase, 2016)
Electra2
Electra2 is a blue fluorescent protein derived from Entacmaea quadricolor; as a blue FP, its readout may depend strongly on proper folding, maturation, and spectral separation from green/red fluorescent proteins.
(Papadaki et al., 2022; FPbase, 2022)
Hypothesis
I hypothesize that supplementing reactions expressing mKO2 and mScarlet-I with moderate additional ribose and glucose could improve fluorescence after a 36-hour incubation by sustaining ATP regeneration and prolonged protein synthesis. Since fluorescent protein output depends not only on expression but also on maturation efficiency and reaction stability, maintaining metabolic activity may increase total fluorescent protein accumulation and final fluorescence intensity.
This hypothesis is inspired by RFopt-style reagent optimization approaches, where ribose-containing formulations and balanced metabolic activity supported improved long-duration TXTL performance.
Part D: Build-A-Cloud-Lab | (optional) Bonus Assignment
Figure 11.Automated cell-free fluorescence screening and routing system for TXTL optimization designed using the Ginkgo Nebula cloud-lab simulation tool. The conceptual layout includes sample intake, quality-control analysis, TXTL processing modules, fluorescence analysis, automated routing systems, and distributed storage infrastructure connected through modular transport components.
The cloud-lab layout was conceptually designed as an automated cell-free fluorescence screening and routing system for TXTL optimization. The modular workflow integrates sample intake, quality-control analysis using Lunatic instrumentation, TXTL processing stations, fluorescence analysis modules, automated routing pathways, and distributed storage infrastructure connected through transport components and switching systems.
The additional routing pathway was included to conceptually represent sample reanalysis or rerouting when quality-control parameters or fluorescence outputs fail to meet expected thresholds. This design explores how future cloud laboratories could integrate modular automation, distributed experimentation, and autonomous workflow decision-making into scalable synthetic biology research environments.
Additionally, the following table summarizes the conceptual function of each component used in the cloud-lab workflow design.
Model
Type
Characteristics
References
Nebula
System
Modular robotic biotechnology workflow infrastructure with interconnected units for cloud-lab processing, routing, and distributed storage systems.
(Ginkgo Bioworks, 2026; Bioworks, 2026)
Lunatic
Instrument
Instrument used for DNA/RNA quantification, protein analysis, and absorbance-based quality control measurements.
(Wintermute, 2024; Bioworks, 2026)
RAC-E15 / E16 / E17
Component
Reconfigurable robotic automation carts of different sizes used for modular experimental workflows and transport integration.
(Wintermute, 2024; Ginkgo Bioworks, 2026)
MM-Turn
Component
Modular connection unit used to redirect or rotate transport pathways between workflow modules.
(Wintermute, 2024; Bioworks, 2026)
MM-0.25m / MM-1m
Component
Modular transport/interconnect segments with lengths of 0.25 m and 1 m used to connect workflow stations.
(Wintermute, 2024; Bioworks, 2026)
MM-Switch
Component
Routing and switching module used to redirect samples between alternative workflow pathways.
(Wintermute, 2024; Bioworks, 2026)
Taxi (5-puck)
Component
Automated transport component designed for the movement of multiple samples, plates, or puck-based carriers between workflow stations.
(Wintermute, 2024; Bioworks, 2026)
Some functional interpretations were conceptually inferred from the cloud-lab simulation environment used to generate Figure 11 and may not represent the complete real-world implementation of the Ginkgo RAC infrastructure.
Alegre, G. F. S., & Pastore, G. M. (2023). NAD+ Precursors Nicotinamide Mononucleotide (NMN) and Nicotinamide Riboside (NR): Potential Dietary Contribution to Health. Current nutrition reports, 12(3), 445–464. https://doi.org/10.1007/s13668-023-00475-y
Caschera, F. (2017). Bacterial cell-free expression technology to in vitro systems engineering and optimization. Synthetic and Systems Biotechnology, 2(2), 97–104. https://doi.org/10.1016/j.synbio.2017.07.004
Caschera, F., & Noireaux, V. (2015). Preparation of amino acid mixtures for Cell-Free Expression Systems. BioTechniques, 58(1), 40–43. https://doi.org/10.2144/000114249
Deredge, D. J., Baker, J. T., Datta, K., & Licata, V. J. (2010). The glutamate effect on DNA binding by pol I DNA polymerases: osmotic stress and the effective reversal of salt linkage. Journal of molecular biology, 401(2), 223–238. https://doi.org/10.1016/j.jmb.2010.06.009 [No Open Access]
Iglesias-Gato, D., Martín-Marcos, P., Santos, M. A., Hinnebusch, A. G., & Tamame, M. (2011). Guanine nucleotide pool imbalance impairs multiple steps of protein synthesis and disrupts GCN4 translational control in Saccharomyces cerevisiae. Genetics, 187(1), 105–122. https://doi.org/10.1534/genetics.110.122135
Loan, T. D., Easton, C. J., & Alissandratos, A. (2018). Recombinant cell-lysate-catalysed synthesis of uridine-5′-triphosphate from nucleobase and ribose, and without addition of ATP. New Biotechnology, 49, 104–111. https://doi.org/10.1016/j.nbt.2018.10.002 [No Open Access]
Nakagawara, K., Takeuchi, C., & Ishige, K. (2022). 5’-CMP and 5’-UMP promote myogenic differentiation and mitochondrial biogenesis by activating myogenin and PGC-1α in a mouse myoblast C2C12 cell line. Biochemistry and biophysics reports, 31, 101309. https://doi.org/10.1016/j.bbrep.2022.101309
Olsen, M. L., Copeland, C. E., Sundberg, C. A., Aw, R., Shaver, Z. M., Rao, G., Swartz, J. R., Karim, A. S., & Jewett, M. C. (2026). Design-driven optimization of low-cost reagent formulations for reproducible and high-yielding cell-free gene expression. Nature Communications, 17(1). https://doi.org/10.1038/s41467-026-69605-8
Panah, B. Y., Wochner, A., Roos, T., Funkner, A., Kunze, M., & Ag, C. (2015, 23 diciembre). WO2017109161A1 - Method of rna in vitro transcription using a buffer containing a dicarboxylic acid or tricarboxylic acid or a salt thereof - Google Patents. https://patents.google.com/patent/WO2017109161A1/en
Romantseva, E., Alperovich, N., Ross, D., Lund, S. P., & Strychalski, E. A. (2022). Effects of DNA template preparation on variability in cell-free protein production. Synthetic Biology, 7(1), ysac015. https://doi.org/10.1093/synbio/ysac015
Ruiz, D. G., Sandoval-Perez, A., Rangarajan, A. V., Gunderson, E. L., & Jacobson, M. P. (2022). Cysteine oxidation in proteins: Structure, biophysics, and simulation. Biochemistry, 61(20), 2165–2176. https://doi.org/10.1021/acs.biochem.2c00349
Sato, G., Miyazawa, S., Doi, N., & Fujiwara, K. (2024). Cell-Free Protein Expression by a Reconstituted Transcription-Translation System Energized by Sugar Catabolism. Molecules (Basel, Switzerland), 29(13), 2956. https://doi.org/10.3390/molecules29132956
Siddiquee, R., & Kwan, A. (2021). Cell-free Synthesis of Correctly Folded Proteins with Multiple Disulphide Bonds: Production of Fungal Hydrophobins. BIO-PROTOCOL, 11(10), e4019. https://doi.org/10.21769/bioprotoc.4019
Silverman, A. D., Karim, A. S., & Jewett, M. C. (2020). Cell-free gene expression: an expanded repertoire of applications. Nature reviews. Genetics, 21(3), 151–170. https://doi.org/10.1038/s41576-019-0186-3
Sun, Z. Z., Chiao, A. C., Robertson, D. E., Metzger, L. E., IV, Mansfield, R., Trego, K. S., & Inc, S. (2023). US20200181670A1 - Improved In Vitro Transcription/Translation (TXTL) system and use thereof - Google Patents. https://patents.google.com/patent/US20200181670A1/en
Thornton, E. L., Boyle, J. T., Laohakunakorn, N., & Regan, L. (2025). Cell-Free protein synthesis as a method to rapidly screen Machine Learning-Generated protease variants. ACS Synthetic Biology, 14(5), 1710–1718. https://doi.org/10.1021/acssynbio.5c00062
Wang, H., He, X., Li, Z., Jin, H., Wang, X., & Li, L. (2022). Guanosine primes acute myeloid leukemia for differentiation via guanine nucleotide salvage synthesis. https://pmc.ncbi.nlm.nih.gov/articles/PMC8822274/
Worst, E. G., Exner, M. P., De Simone, A., Schenkelberger, M., Noireaux, V., Budisa, N., & Ott, A. (2016). Residue-specific Incorporation of Noncanonical Amino Acids into Model Proteins Using an Escherichia coli Cell-free Transcription-translation System. Journal of Visualized Experiments, 114. https://doi.org/10.3791/54273
Yadav, S., Perkins, A. J. P., Liyanagedera, S. B. W., Bougas, A., & Laohakunakorn, N. (2025). ATP Regeneration from Pyruvate in the PURE System. ACS synthetic biology, 14(1), 247–256. https://doi.org/10.1021/acssynbio.4c00697
Yusri, K., Jose, S., Vermeulen, K. S., Tan, T. C. M., & Sorrentino, V. (2025). The role of NAD+ metabolism and its modulation of mitochondria in aging and disease. Npj Metabolic Health And Disease, 3(1), 26. https://doi.org/10.1038/s44324-025-00067-0
Zhang, Y., Huang, Q., Deng, Z., Xu, Y., & Liu, T. (2018). Enhancing the efficiency of cell-free protein synthesis system by systematic titration of transcription and translation components. Biochemical Engineering Journal, 138, 47-53. https://doi.org/10.1016/j.bej.2018.07.001 [No Open Access]
Part C:
Balleza, E., Kim, J. M., & Cluzel, P. (2018). Systematic characterization of maturation time of fluorescent proteins in living cells. Nature methods, 15(1), 47–51. https://doi.org/10.1038/nmeth.4509
Botman, D., De Groot, D. H., Schmidt, P., Goedhart, J., & Teusink, B. (2019). In vivo characterisation of fluorescent proteins in budding yeast. Scientific Reports, 9(1), 2234. https://doi.org/10.1038/s41598-019-38913-z
Goedhart, J., Von Stetten, D., Noirclerc-Savoye, M., Lelimousin, M., Joosen, L., Hink, M. A., Van Weeren, L., Gadella, T. W., & Royant, A. (2012). Structure-guided evolution of cyan fluorescent proteins towards a quantum yield of 93%. Nature Communications, 3(1), 751. https://doi.org/10.1038/ncomms1738
Kremers, G., Hazelwood, K. L., Murphy, C. S., Davidson, M. W., & Piston, D. W. (2009). Photoconversion in orange and red fluorescent proteins. Nature Methods, 6(5), 355–358. https://doi.org/10.1038/nmeth.1319
Papadaki, S., Wang, X., Wang, Y., Zhang, H., Jia, S., Liu, S., Yang, M., Zhang, D., Jia, J., Köster, R. W., Namikawa, K., & Piatkevich, K. D. (2022). Dual-expression system for blue fluorescent protein optimization. Scientific Reports, 12(1), 10190. https://doi.org/10.1038/s41598-022-13214-0
Pédelacq, J. D., Cabantous, S., Tran, T., Terwilliger, T. C., & Waldo, G. S. (2006). Engineering and characterization of a superfolder green fluorescent protein. Nature biotechnology, 24(1), 79–88. https://doi.org/10.1038/nbt1172
I liked understanding better how plasmid assembly actually works in practice, because before this, I only understood the theory behind restriction enzymes and cloning workflows
Something interesting was realizing how important backbone selection is, especially checking that restriction enzymes do not cut inside important regions like the ori or antibiotic resistance marker
I also learned that metabolic engineering is not only about expressing one gene, but about balancing pathways, precursor availability, and cellular stress
Designing the crtY construct in Benchling reminded me a lot of the workflow I used previously for KitBi, so it was nice to feel more confident with synthetic biology tools this time
The virtual digestion and assembly steps helped me understand restriction cloning much better, especially how compatible sticky ends are used to insert DNA fragments into plasmid backbones
Thanks for reading! Also, you can check the same info at my Notion webpage: Week12Notion
Week 13: AI, SynBio, and Scaling Health Innovation (ARPA-H)
Bio design living Materials
This week covers designing, programming, and fabricating engineered living materials — such as self-healing concretes, adaptive biofilms, and responsive biomaterials — by integrating genetic circuit design, materials science, and bioprocess engineering
Some thoughts about the lecture / Week
This week made me realize that AI in biology is not only about predicting proteins or analyzing sequences, but also about understanding how scientists actually work in the lab. Small details like pipetting angle, bubbles, or viscosity can completely change experimental results.
One thing I found interesting was the idea of “sensorized laboratories,” where cameras and computer vision systems record experiments from multiple perspectives. It showed how future AI models may learn directly from real laboratory behavior rather than only from published papers.
I also learned that scientific publications usually report only successful methods, while failed experiments and troubleshooting are rarely documented. This creates limitations for training AI systems because models do not learn the real-world mistakes scientists encounter.
The lecture highlighted how standardization and automation could improve reproducibility in biology and healthcare innovation, especially during emergencies like COVID-19 testing and vaccine distribution.
I liked the idea of “gamifying science” through leaderboards and collaborative optimization. It made science feel more interactive and community-driven, while also encouraging better experimental practices and shared learning.
Final Project:
This week, I was adjusting some of my DNA design for a biosensor. The progress was a bit chaotic in making the proper documentation, but I made it. Next week, it’s going to be the slides of the final presentation and some thoughts I had after presenting my idea on an international field! Thanks for reading!
Week 14: Bio Design & Bio Fabrication
Biofabrication!
We wrap up the term looking towards a future of Bio-Design and Bio-Fabrication
Some thoughts about the lecture / Last class of the semester (May 5)
This final lecture felt less like a normal class and more like a reflection about where synthetic biology is heading in the future. I really liked how they connected biofabrication, AI, cloud labs, bioart, and even internet culture into the same conversation.
One of my favorite moments was when David mentioned the live bioart/bio-pixel projects from the community. It made the course feel collaborative and creative instead of only technical, especially because many ideas emerged independently at the same time across different people.
Christina Agapakis’ talk was probably one of the most memorable lectures for me. I liked her perspective that “real engineering” in biology may not actually exist in the strict linear way people imagine. Biology is messy, iterative, and unpredictable, and trying to force it into a perfectly controlled engineering model may actually limit innovation.
I also found it interesting how she connected synthetic biology with historical scientific ideas from different decades and researchers. It helped me understand that synthetic biology did not suddenly appear recently, but rather evolved from many previous attempts to apply engineering principles to living systems.
I honestly loved the way Christina used memes, TikTok references, and examples like Nara Smith to explain scientific ideas. It made the lecture feel modern, relatable, and connected to current internet culture without becoming cringe or overly formal. I think it shows that science communication can still feel authentic to newer generations.
Michael Chen’s presentation about microfluidics, protein prototyping, and AI-enabled antibody discovery showed how rapidly biotechnology workflows are scaling. It was interesting to see how automation and synthetic biology are becoming more integrated with real-world therapeutic development and industrial applications.
Overall, this last week made me feel that the future of biotechnology will probably combine biology, engineering, computation, design, communication, and creativity altogether instead of treating them as separate fields.
Some screenshot moments!
Final Reflections — HTGAA 2026 !!
During my undergraduate thesis on biofilm eradication using green and traditional silver nanoparticles, I constantly questioned the long-term implications of antimicrobial materials and whether compounds like silver could truly be considered harmless for human health and the environment.
Those questions slowly evolved into curiosity about prevention, sensing systems, and synthetic biology approaches beyond traditional wet lab experimentation. HTGAA allowed me to explore those ideas creatively and computationally, while realizing that biotechnology does not always need to begin inside a fully equipped laboratory.
Figure 1. Final HTGAA Spring 2026 community session and project presentations (May 13th).
Science beyond disciplines
One of the most impactful aspects of this course was the diversity of perspectives within the community. I met people from architecture, neuroscience, psychology, design, engineering, and many other backgrounds.
Seeing so many disciplines interact through biology changed the way I perceive science itself. It reminded me that biotechnology is not isolated from art, communication, ethics, design, or society; instead, it connects all of them.
Presenting KitBi!!!
Presenting my final project was both exciting and intimidating because it was deeply connected to my own academic background and previous research experiences with biofilms.
Even though I knew I was prepared, I still felt nervous about presenting an idea that was personally meaningful to me. However, the experience ended up being incredibly rewarding.
I loved realizing that I could communicate science confidently from my own home, in another language, and still connect with people through my ideas. The language barrier was never truly an obstacle; I think curiosity and passion for science were stronger.
Beyond the technical skills, HTGAA reminded me that science is collaborative, creative, and deeply human.
Learning alongside students from institutions such as MIT and Harvard was inspiring, but it also reminded me that passion, curiosity, and creativity exist everywhere. Including the students and researchers I met during my undergraduate studies in Ecuador.
This course expanded not only my scientific perspective but also my confidence in my ability to participate in global scientific conversations.