Week 4 HW: Protein Design Part I
Week 4: Protein Design Part I

Part A: Conceptual Questions
Answering 9 questions:
- How many molecules of amino acids do you take with a piece of 500 grams of meat? (on average an amino acid is ~100 Daltons)
What we know: a. Meat ~ 20% of protein
b. 500 g meat = ~100 g of protein
c. Average mass of amino acid = ~100 Da = 100 g/mol
Solution:
Average amino acid mass ≈ 100 g·mol⁻¹
100 g protein ÷ (100 g·mol⁻¹) = 1 mol
Based on Avogadro’s number:
1 mol ≈ 6.02 × 10²³ molecules
In 500 g of meat its approx:
Solution: 6 x 10²³ amino acids
- Why do humans eat beef but do not become a cow, eat fish but do not become fish?
Humans do not become what they eat because food is broken down during digestion into basic molecules such as amino acids, sugars, and fatty acids. These components lose their original biological identity and are then reused by the body to build human-specific proteins, tissues, and cells according to our own genetic code. While diet can influence gene expression (epigenetics), it does not change our DNA sequence or transform us into another organism.
- Why are there only 20 natural amino acids?
There are only 20 standard amino acids because this set provides an optimal balance between chemical diversity, structural stability, and efficient genetic coding. Once this system evolved, the genetic code became evolutionarily “frozen,” since changes would disrupt existing proteins. These amino acids are sufficient to generate a vast diversity of protein structures and functions.
Here is an interesting paper related to the topic: Frozen, but no accident - why the 20 standard amino acids were selected
- Can you make other non-natural amino acids? Design some new amino acids.
Yes, non-natural amino acids can be created using chemical synthesis and synthetic biology. Scientists can design amino acids with new side chains to introduce properties such as fluorescence, increased stability, or novel chemical reactivity. Additionally, engineered tRNA–synthetase systems allow cells to incorporate non-natural amino acids into proteins. These approaches expand the chemical diversity of proteins beyond the canonical 20 amino acids. Meat Science Laboratory
- Where did amino acids come from before enzymes that make them, and before life started?
Before life existed, amino acids likely formed through abiotic chemical processes. The Miller–Urey experiment showed that simple gases, energy sources such as lightning, and heat could generate amino acids under early Earth conditions. Additionally, amino acids have been found in meteorites such as the Murchison meteorite, suggesting that some building blocks of life may have arrived from space.
- If you make an α-helix using D-amino acids, what handedness (right or left) would you expect?
Amino acids are chiral molecules. When an α-helix is formed using D-amino acids, it adopts a left-handed helix, which is the mirror image of the right-handed α-helix formed by L-amino acids.
- Why are most molecular helices right-handed?
Most biological helices are right-handed because they are built from L-amino acids. The geometry and steric interactions of L-amino acids favor right-handed helices, as this configuration minimizes steric clashes and is energetically more stable. This bias is a fundamental consequence of molecular chirality in biological systems.
- Why do β-sheets tend to aggregate? What is the driving force for β-sheet aggregation?
β-sheets tend to aggregate because their structure is extended and exposes backbone hydrogen-bond donors and acceptors. Unlike α-helices, which are internally stabilized by hydrogen bonds, β-strands can easily form hydrogen bonds with neighboring strands from other molecules.
This makes β-sheets “sticky” in a structural sense. When partially unfolded proteins expose β-prone regions, they can align side by side and form intermolecular hydrogen bonds, creating extended sheet-like assemblies.
The main driving forces are:
a. Hydrogen bonding between peptide backbones
b. Hydrophobic interactions between side chains
c. Minimization of free energy
Aggregation often occurs because forming intermolecular β-sheets lowers the system’s overall free energy compared to exposed, unstable regions.
- Why do many amyloid diseases form β-sheets? Can you use amyloid β-sheets as materials?
First, Many amyloid diseases form β-sheets because misfolded proteins often rearrange into highly stable cross-β structures. The β-sheet conformation allows proteins to stack into long fibrils stabilized by repetitive hydrogen bonding.
These fibrils are very stable, resistant to degradation, and tend to accumulate in tissues. Diseases like Alzheimer’s involve amyloid-β peptides that misfold and form β-sheet-rich fibrils.
Second, yes, It could be possible to use amyloid as materials since they are strong structures. Maybe use in nanomaterials or biomaterials. Take this approach from a negative nature that can cause a disease, biology could use it with another point on view.

Part B: Protein Analysis and Visualization
Briefly describe the protein you selected and why you selected it
I selected leptin (P41159 · LEP_HUMAN), a hormone that regulates energy balance and satiety in mammals. Leptin is produced mainly by adipose tissue and acts on receptors in the hypothalamus to signal that the body has sufficient energy reserves. I chose this protein because it plays an important role in metabolic regulation and appetite control, and mutations in leptin signaling can lead to severe obesity.
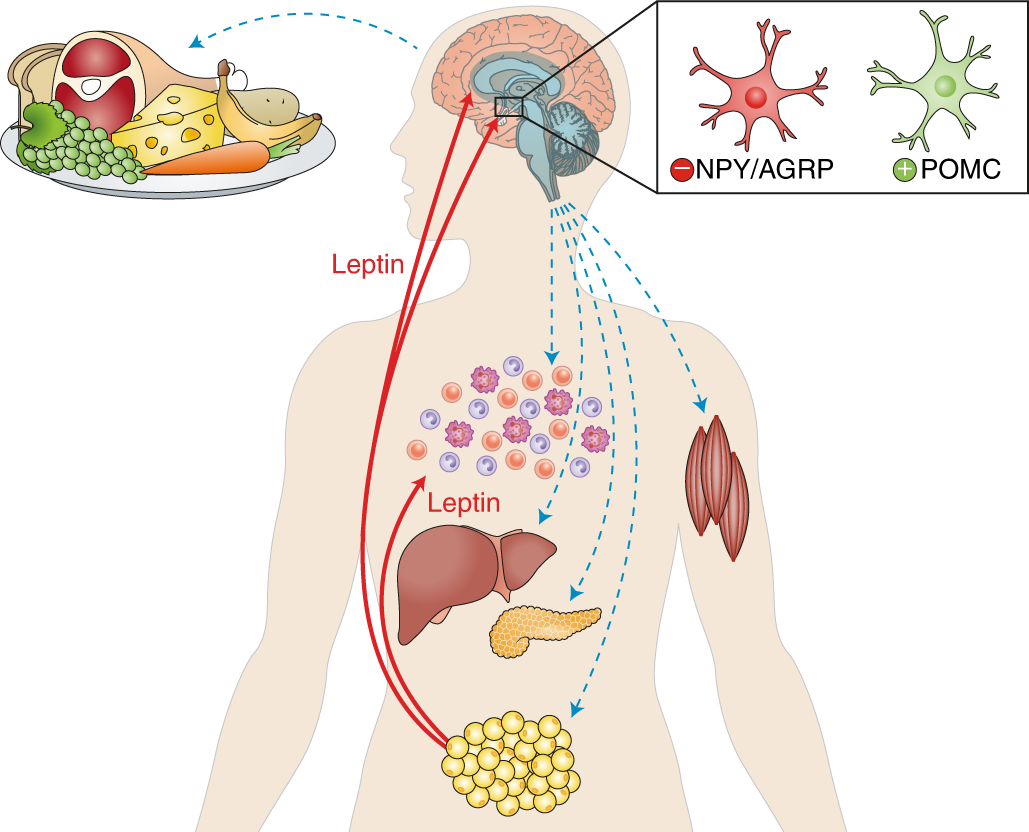
Fig.1 Leptin and the endocrine control of energy balance
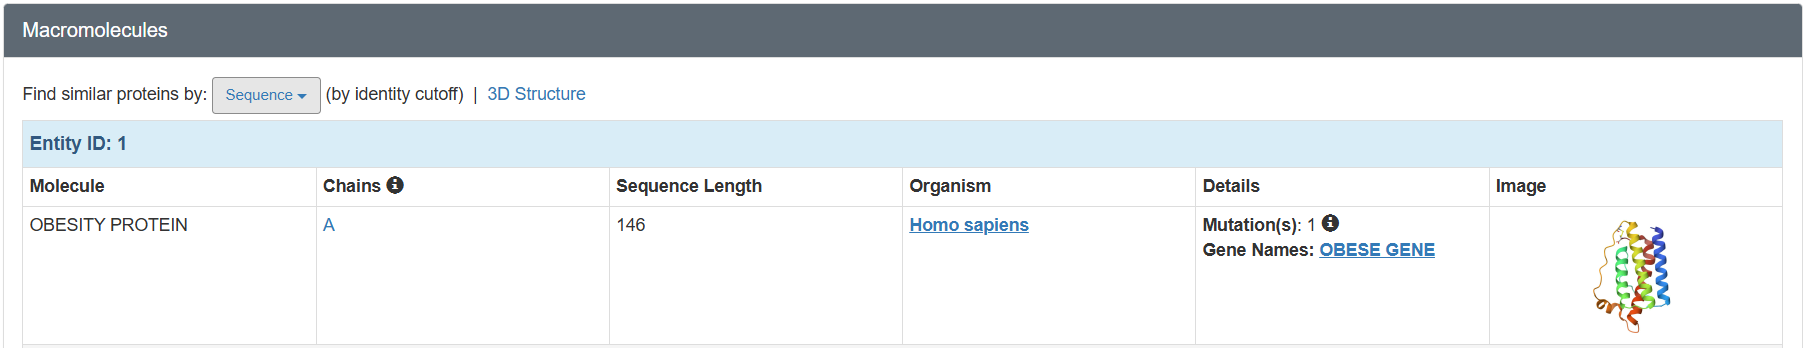
Identify the amino acid sequence of your protein:
a. Amino Acid sequence:
Leptin Uniprot sequence: P41159 · LEP_HUMAN
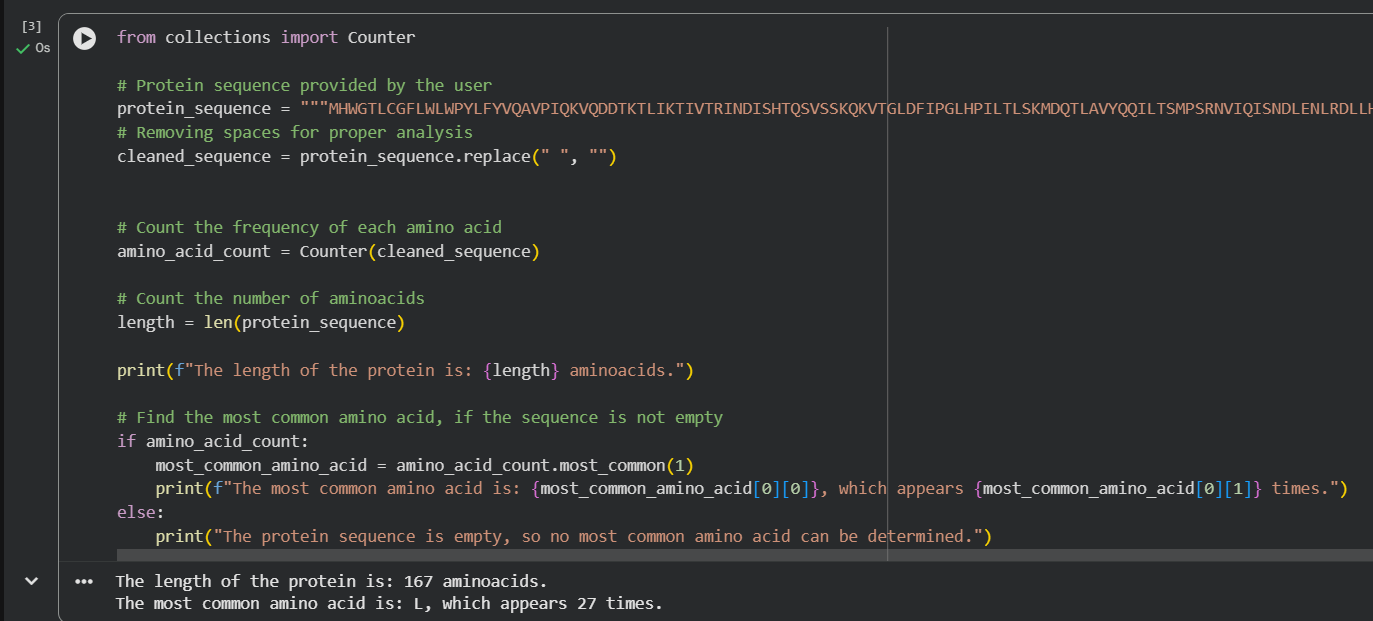
b. Lenght & Frequency
Table 1. CHARACTERISTICS OF LEPTIN
| Lenght | Frequent AA* | Frequency |
|---|---|---|
| 167 | Protein L | 27 times |
*AA = Amino acid
For the length and frequency, the Colab notebook was used:
c. Homologs
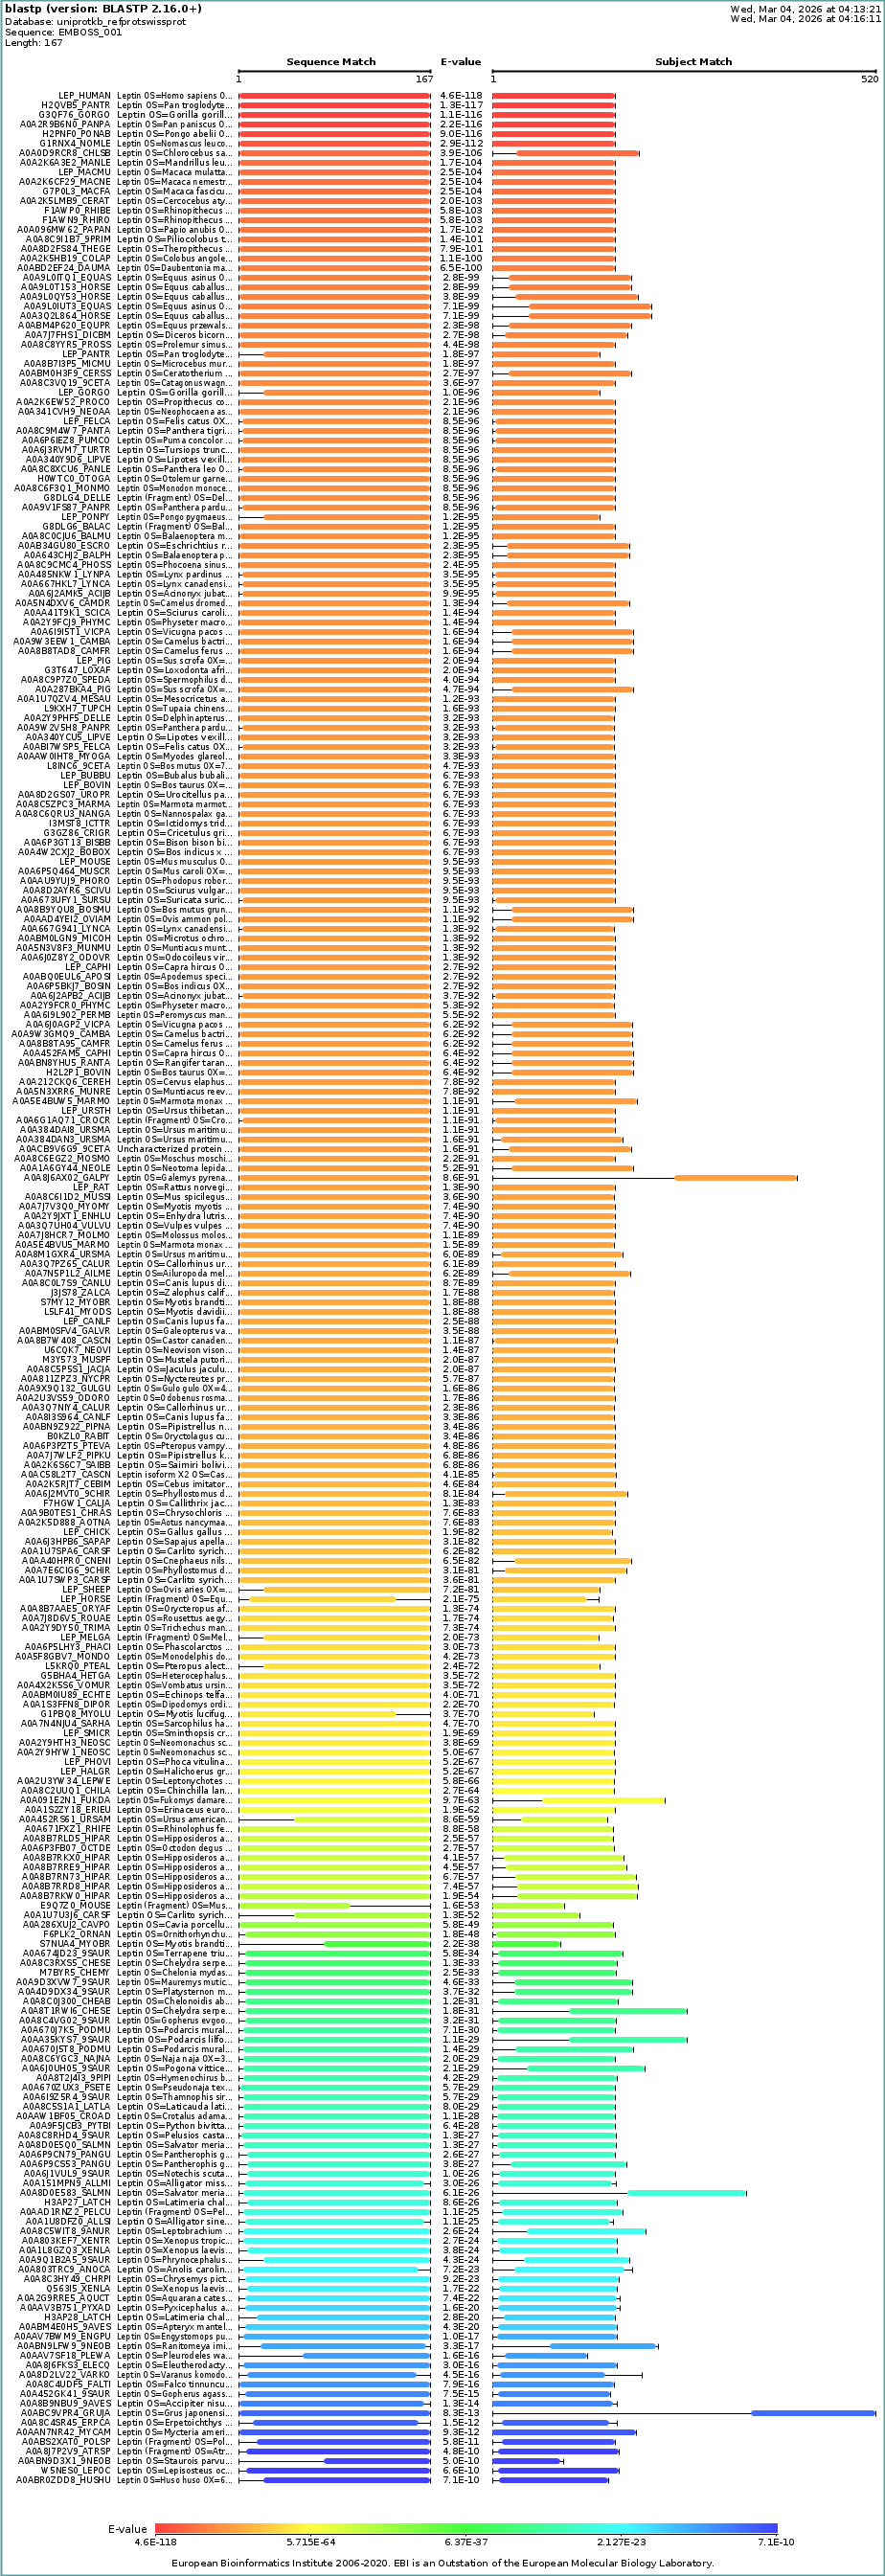 Description: BLAST search in UniProt reveals many homologous sequences across vertebrates, particularly mammals. The strong similarity and low E-values indicate that leptin is highly conserved across species due to its essential role in metabolic regulation
d. Protein family
Yes. According to UniProt and InterPro, leptin belongs to the leptin protein family and is structurally classified within the four-helix cytokine-like family. These proteins share a characteristic four-helix bundle fold, which is common among signaling molecules such as cytokines and growth factors. Databases such as Pfam (PF02024), InterPro (IPR009079), and PANTHER also classify leptin within this conserved protein family. Unipro family
Identify the structure page of your protein in RCSB:
RCSB Structure Selection (Leptin):
I explored several RCSB PDB entries for leptin. The highest-resolution structure I found was a mouse leptin–receptor fragment complex (PDB 7Z3P, X-ray diffraction, ~1.95 Å). However, because my focus is on human leptin and I wanted a simpler structure for visualization and residue-level analysis, I selected PDB 1AX8 (human leptin), which was solved by X-ray diffraction at 2.4 Å resolution and released on 1998-11-25. Since the resolution is below 2.7 Å, this is considered a good-quality structure for analyzing secondary structure and surface properties.
Additionally, I also looked at recent human leptin–LePR complexes solved by cryo-EM (e.g., 8X80/8X81, ~3.8 Å). These are useful for understanding receptor binding, but their lower resolution makes them less ideal for fine structural details compared to X-ray structures. These observations are showed on the Figure 2.
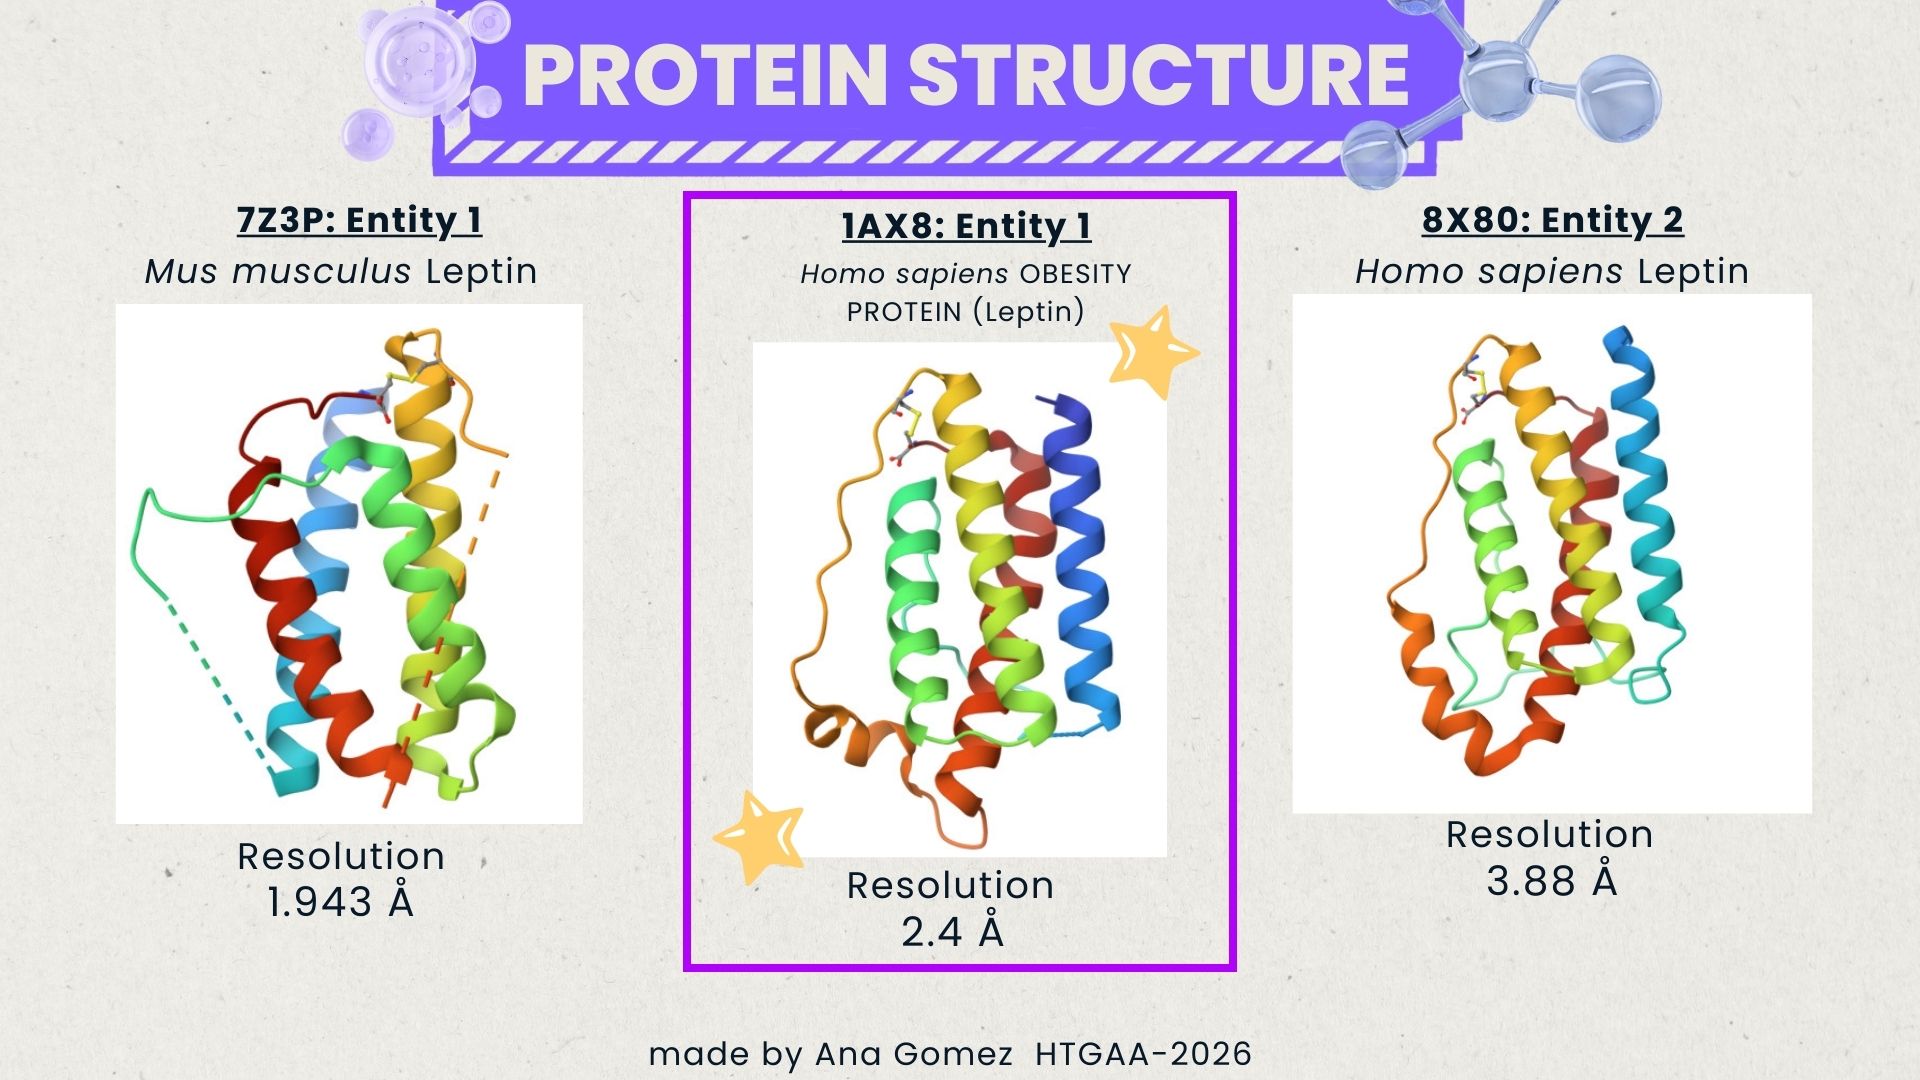
Fig.2 Structure selection Leptin
Are there any other molecules in the solved structure apart from the protein?
RCSB PDB entries:
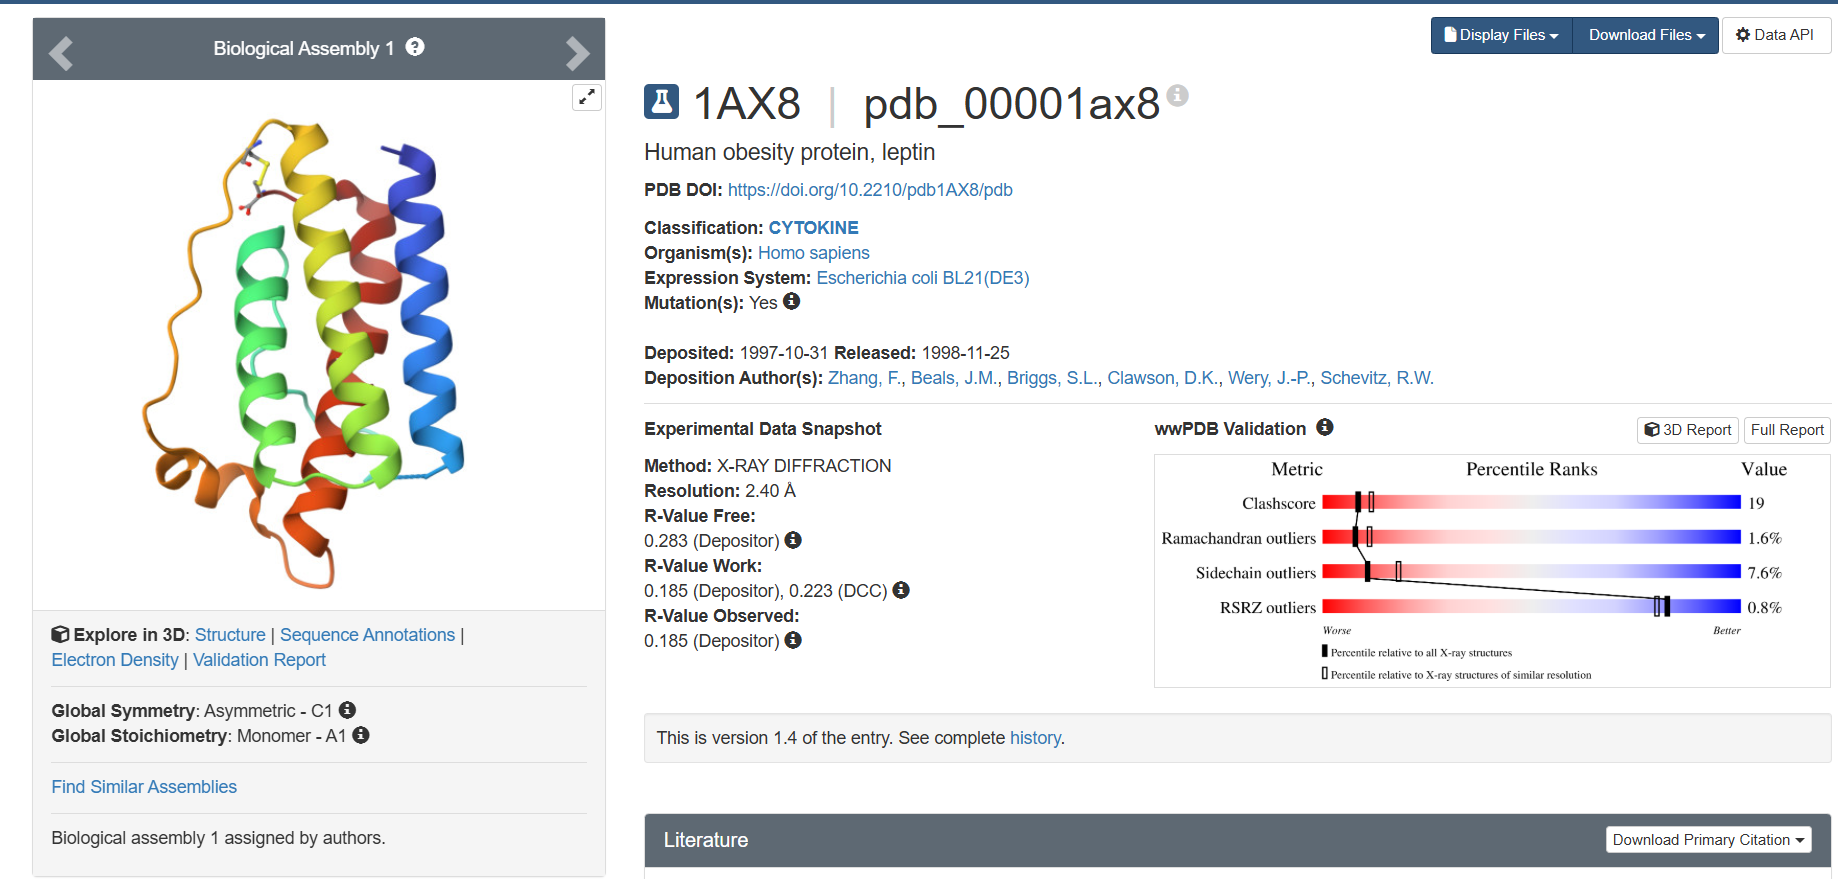
In PDB 1AX8, the structure is mainly the leptin protein chain (monomer). X-ray structures often include crystallographic water molecules and sometimes buffer ions, but there are no major non-protein ligands reported in this entry. DOI: https://doi.org/10.2210/pdb1AX8/pdb
Additionally, I decided to check on the recent entry 8X80, since this entry has Ligand Interaction (NAG)
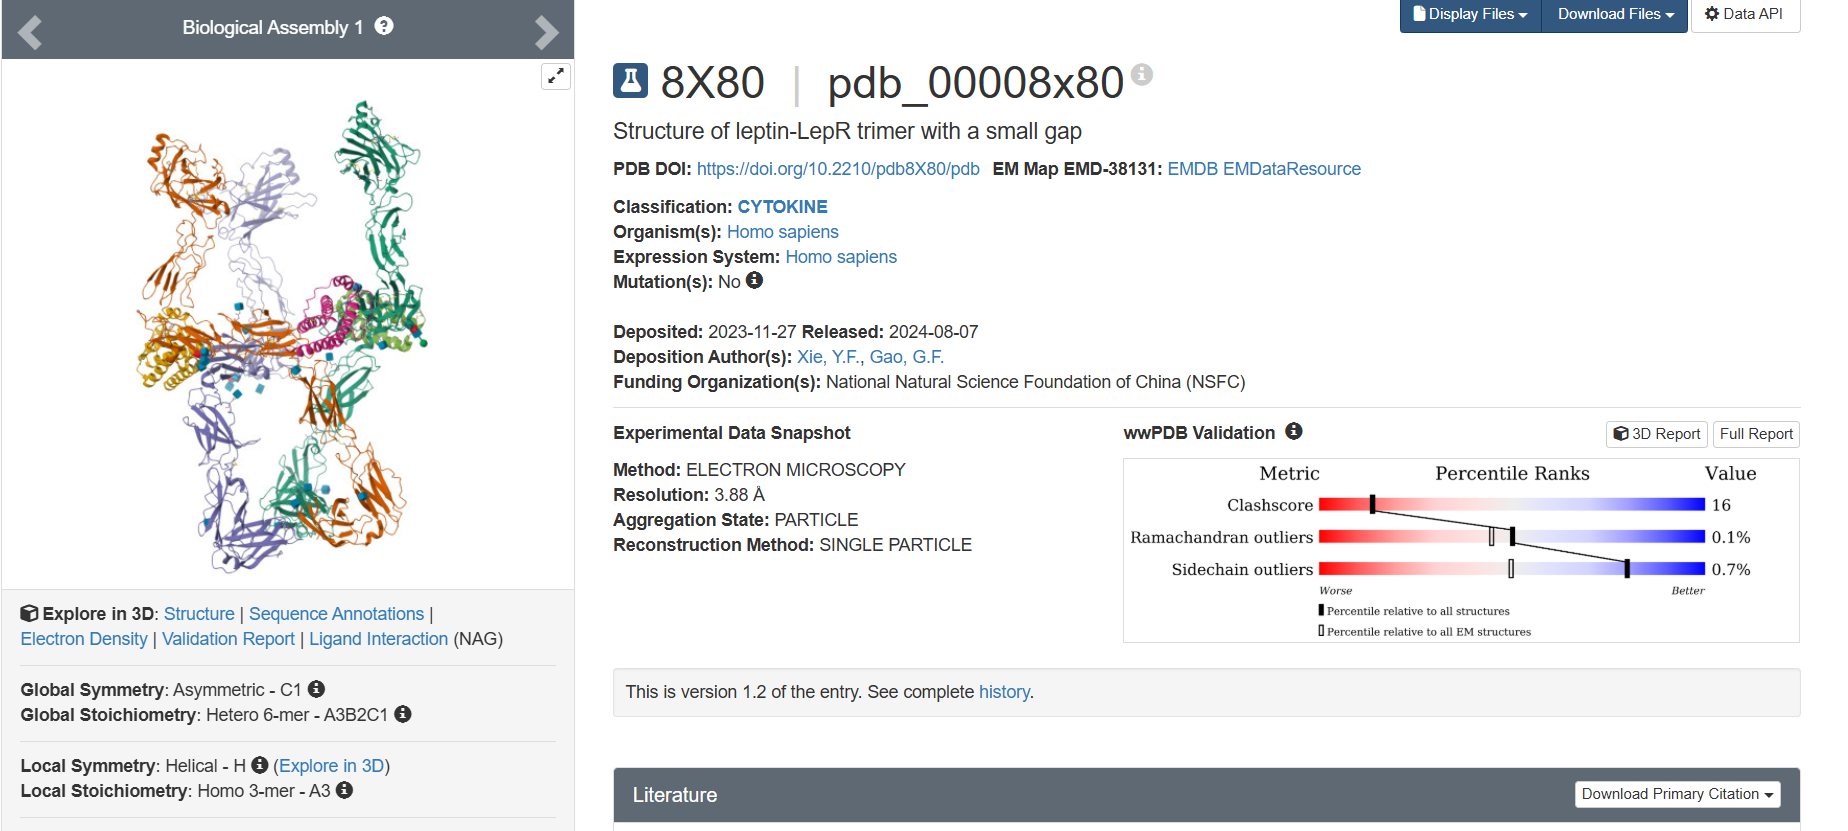
The leptin is solved as part of a leptin–leptin receptor (LePR) complex, meaning the entry contains additional protein chains besides leptin. The structure also includes glycan components such as NAG (N-acetylglucosamine), commonly associated with protein glycosylation. DOI: https://doi.org/10.2210/pdb8X80/pdb
Extra:
Table 2. Characteristics of PDB 1AX8
Does your protein belong to any structure classification family?
Leptin belongs to the four-helix bundle cytokine family (a “four-helical cytokine-like core” fold), consistent with its mainly alpha-helical structure. https://www.rcsb.org/annotations/1AX8. Also, the visualization in SCOP:
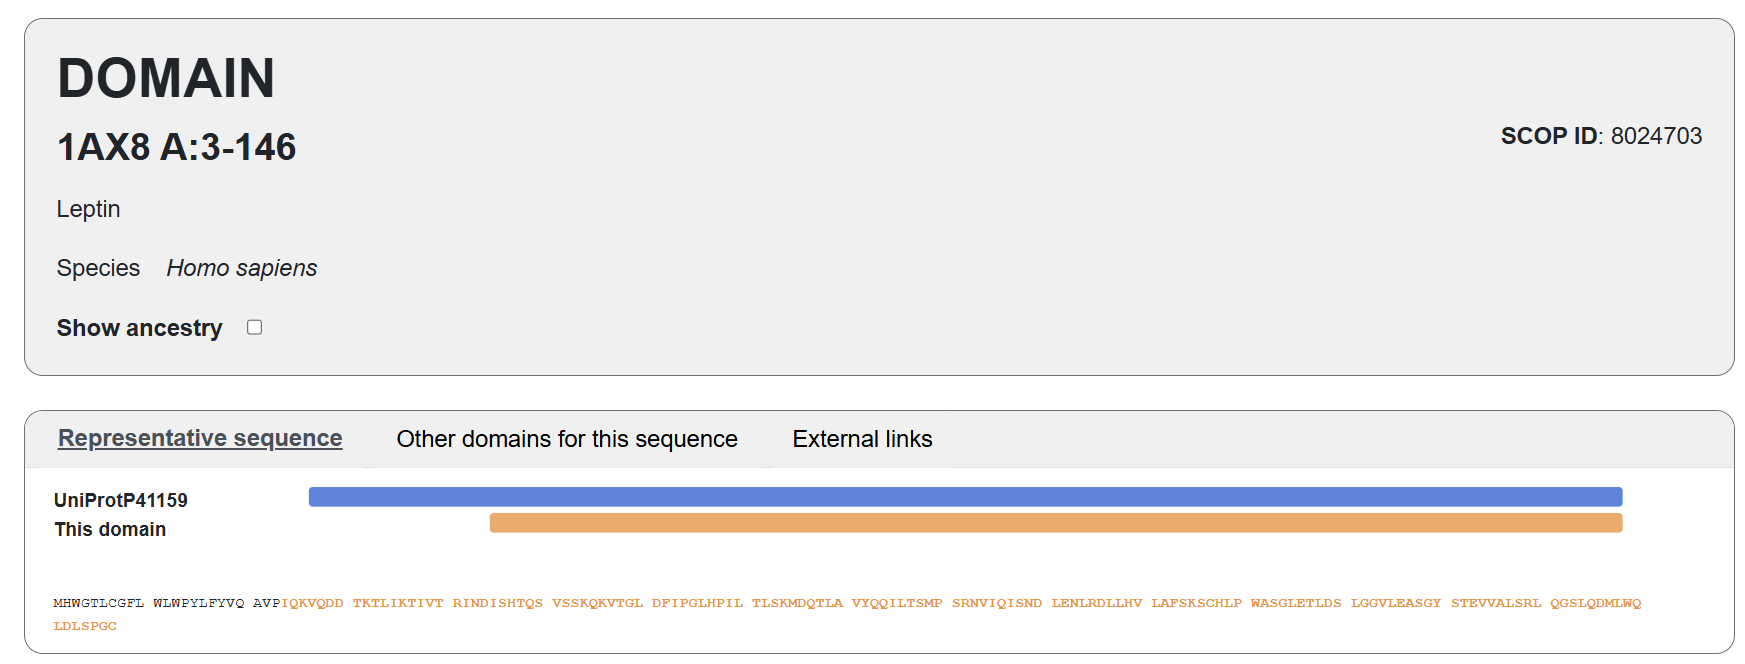
Domain PDB 1AX8 sequence:
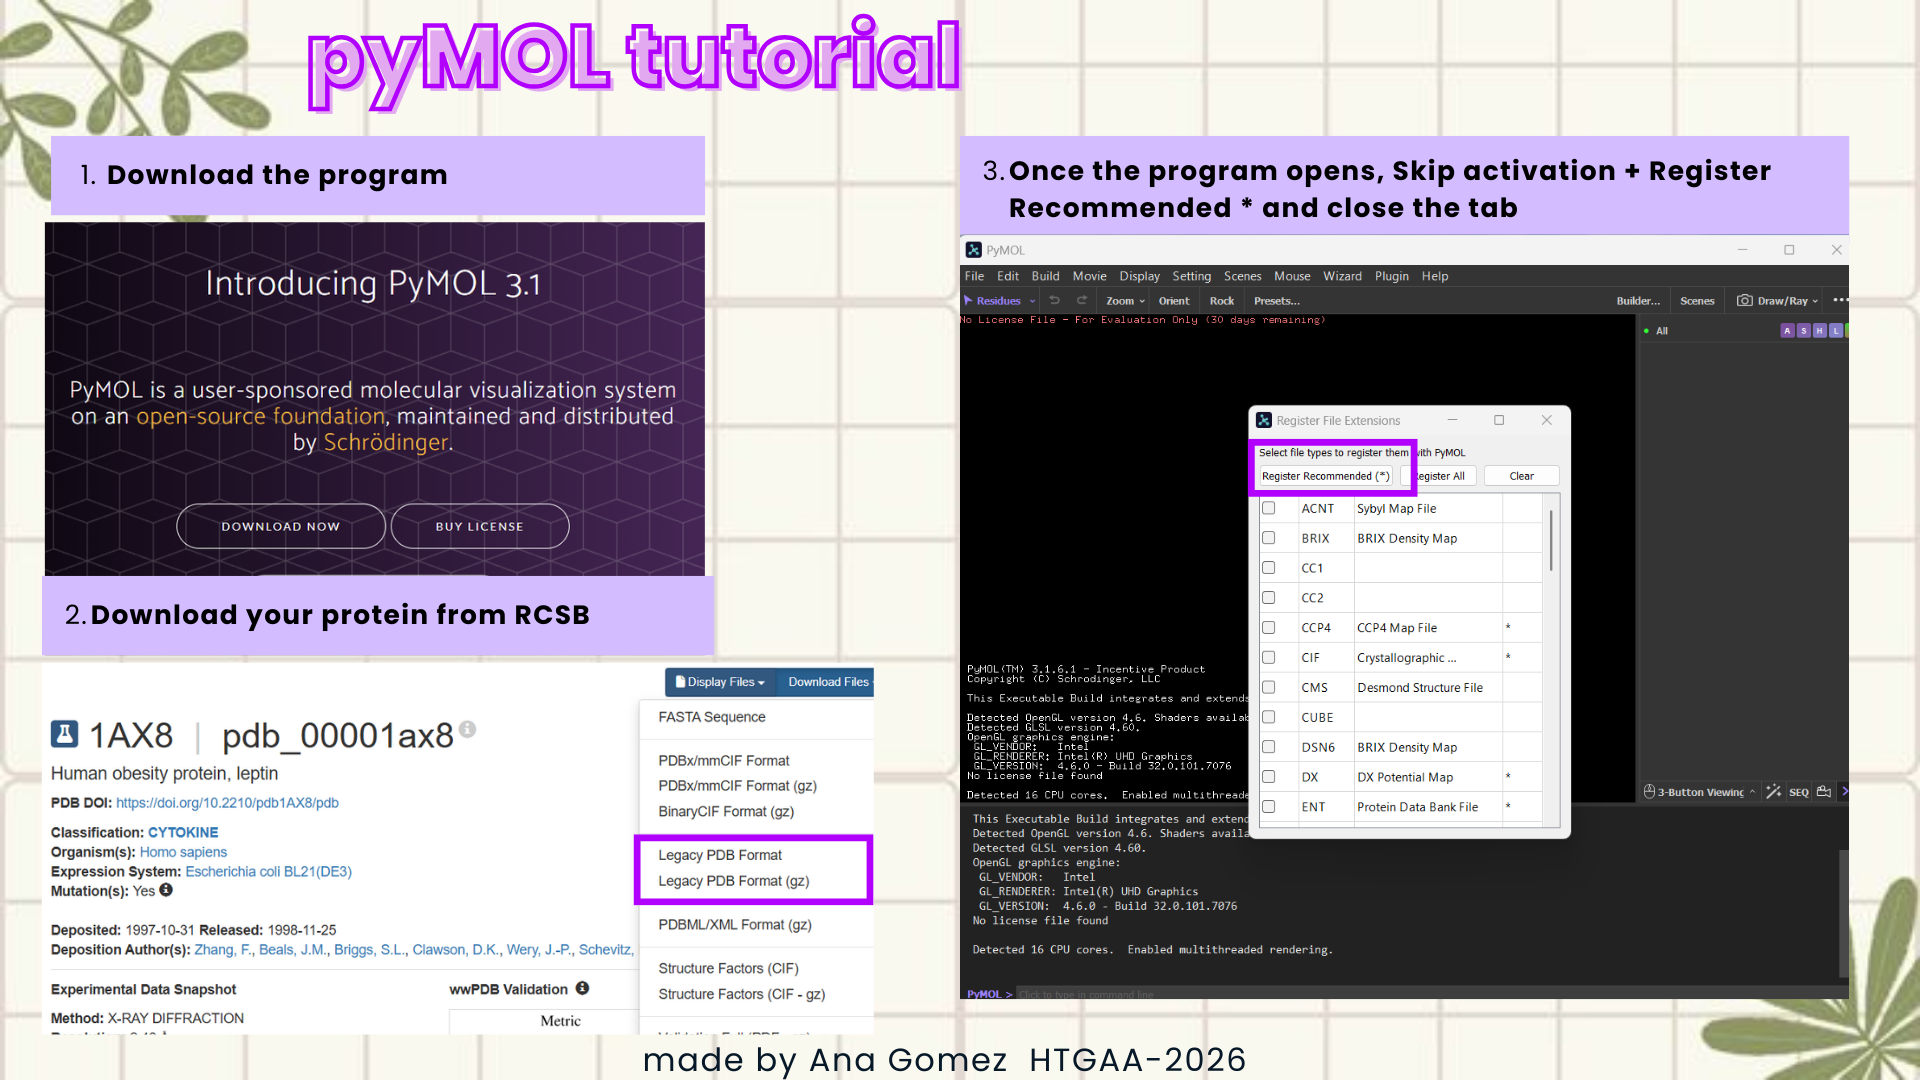
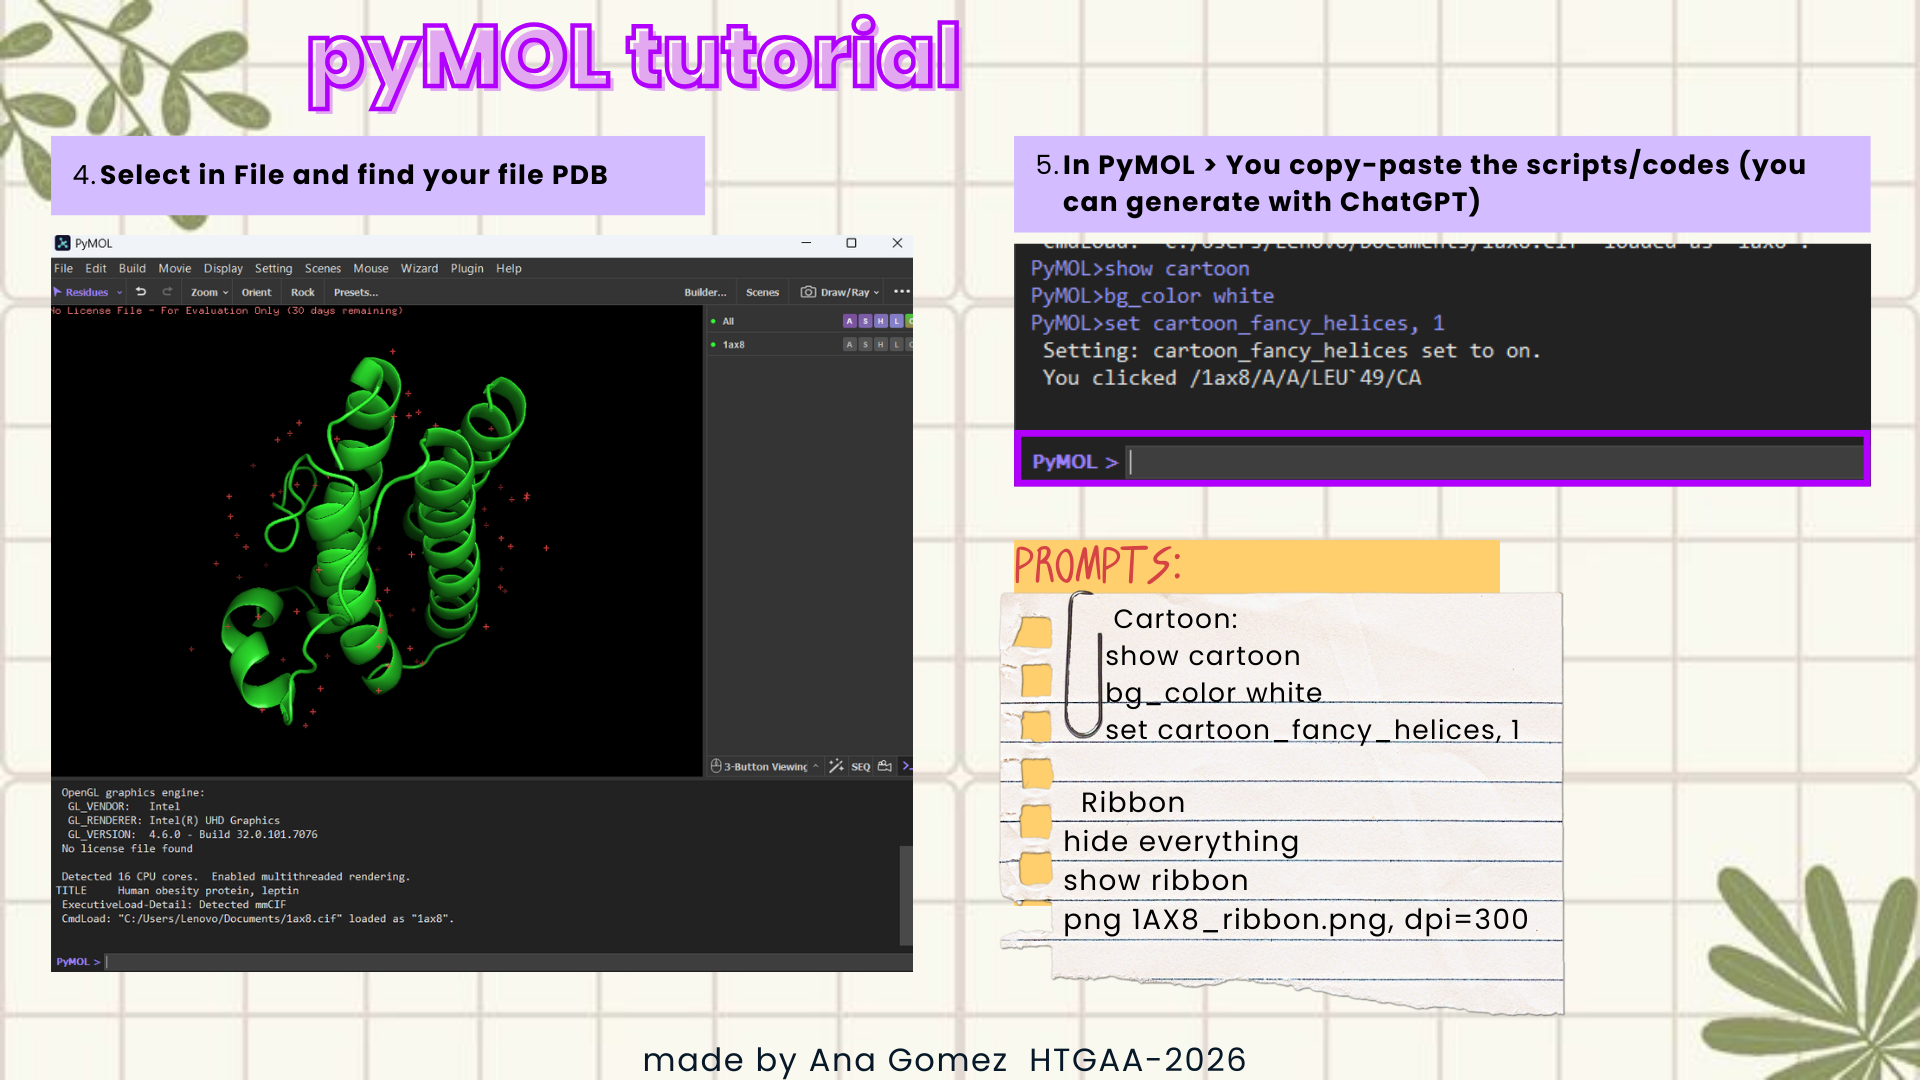
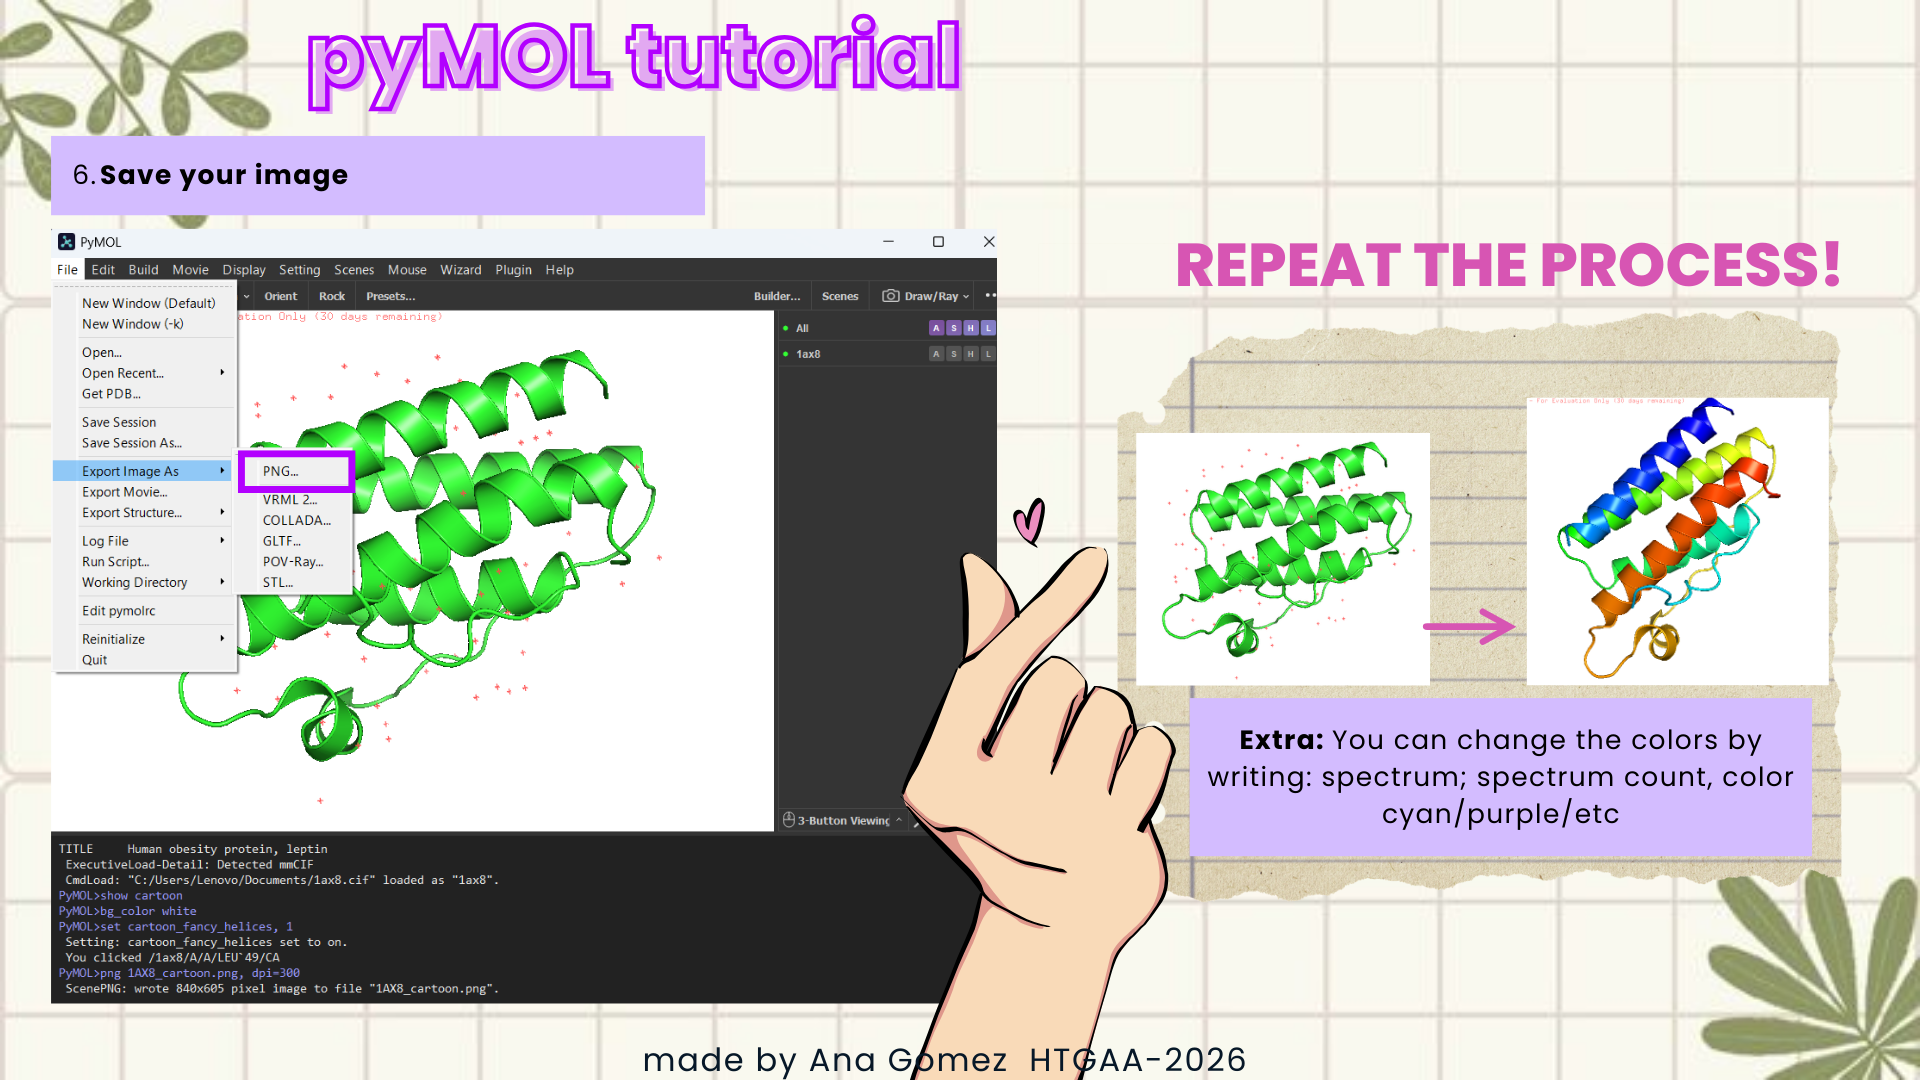
Open the structure of your protein in any 3D molecule visualization software:
Disclaimer: For the PyMol section, I used ChatGPT 5.2 to help me with the commands.
Documentation:
This is a small visual tutorial that I follow to obtain the graphics for this section. (Click on the images to zoom in!)
| 
| 
|
Visualize the protein as “cartoon”, “ribbon”, and “ball and stick”
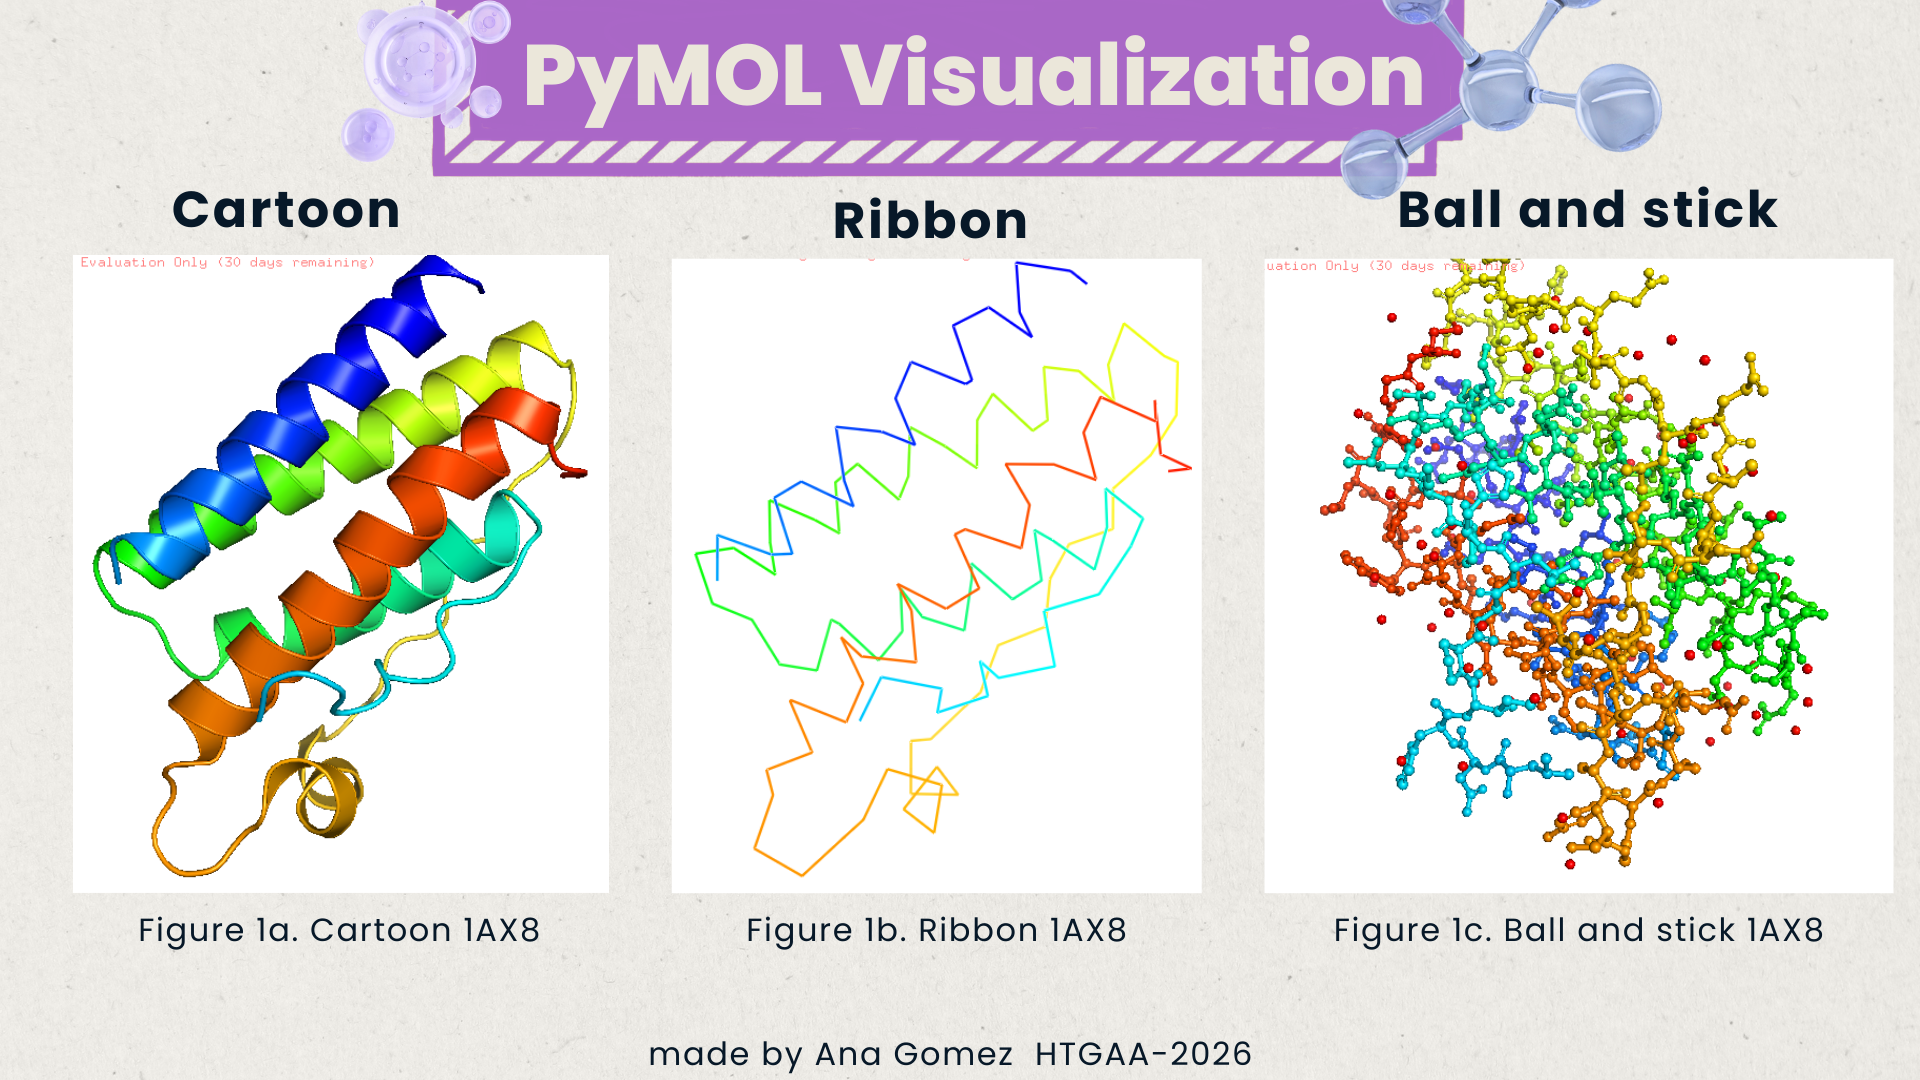
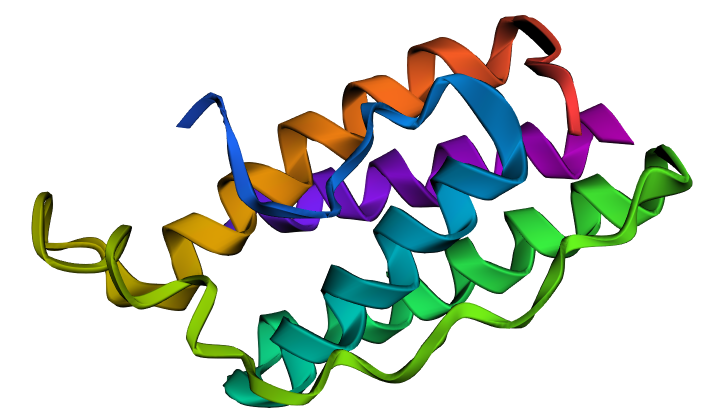
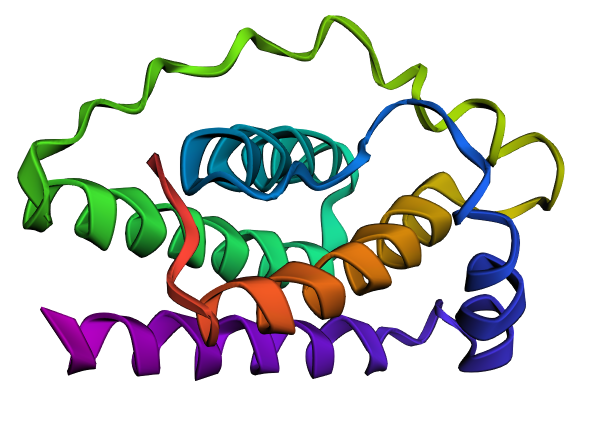
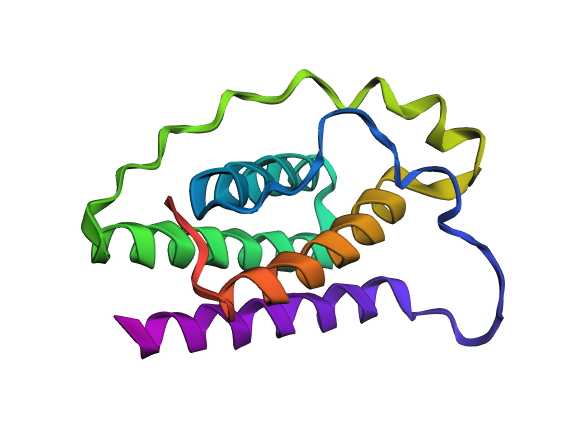
Color the protein by secondary structure. Does it have more helices or sheets?
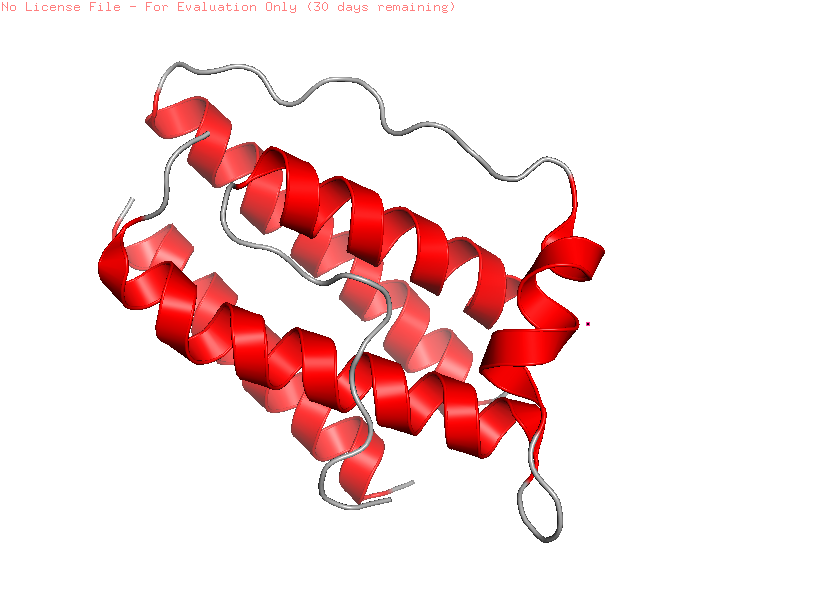
When visualized in PyMOL and colored by secondary structure, leptin is dominated by α-helices with only short loop regions connecting them. Very little or no β-sheet structure is observed. This arrangement is consistent with leptin’s classification as a four-helix bundle cytokine-like protein.
Color the protein by residue type. What can you tell about the distribution of hydrophobic vs hydrophilic residues?
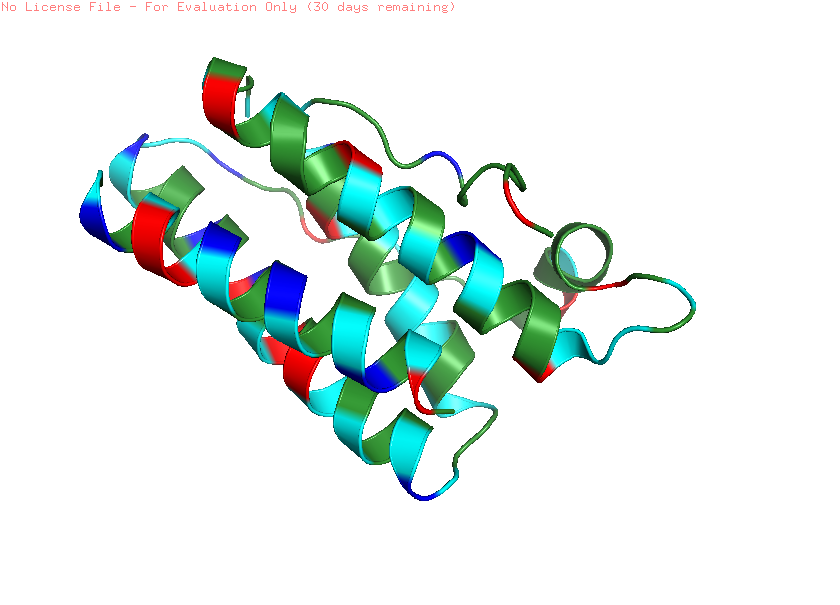
Note: green: hydrophobic (ALA, VAL, LEU, ILE); cyan: polar; Red: acids (negative); Blue: basic (positive)
Output PyMOL:
When colored by residue type, hydrophobic residues are mainly located in the interior of the protein, forming a stable core within the helical bundle. In contrast, hydrophilic and charged residues are more frequently found on the protein surface. This distribution is typical for soluble proteins, where the hydrophobic core stabilizes the structure, and the polar residues interact with the aqueous environment or other proteins.
Visualize the surface of the protein. Does it have any “holes” (aka binding pockets)?
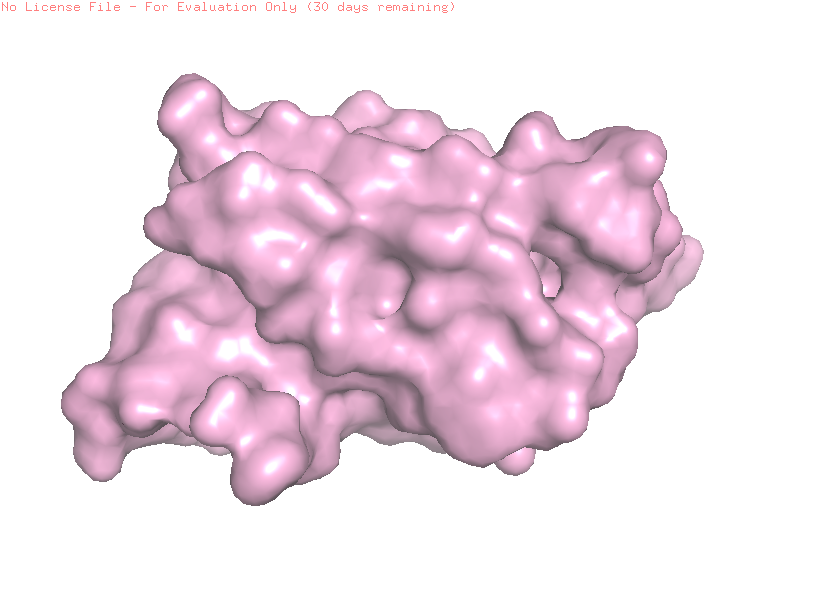
When visualizing the protein surface in PyMOL, the structure appears relatively compact and does not show a deep binding pocket typical of enzymatic active sites. Instead, the surface contains shallow grooves and broad interaction regions. This is consistent with leptin’s biological function as a signaling hormone that interacts with the leptin receptor rather than catalyzing a chemical reaction.
Extra: Surface + cartoon
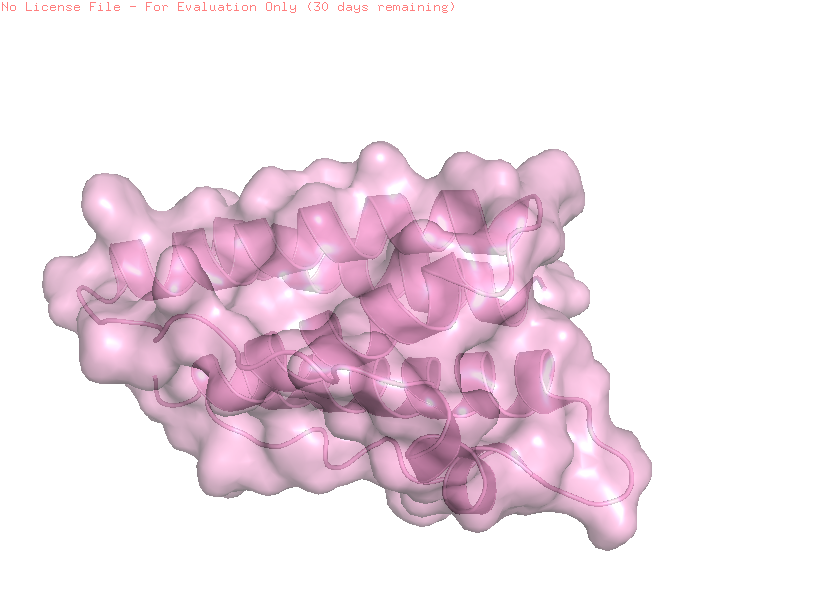
A combined cartoon and surface representation highlights how the α-helical bundle is packed within the overall volume of the protein. The helices form a compact core that stabilizes the structure, while loop regions extend toward the protein surface. This organization is characteristic of cytokine-like proteins, such as leptin.
Part C: Using ML-Based Protein Design Tools
C1. Protein Language Modeling:
Chosen protein:
I kept the same protein from Part B: human leptin (PDB: 1AX8). I chose to keep it for Part C because it provides a consistent reference sequence and an experimental structure to compare against model predictions.
Sequence used:
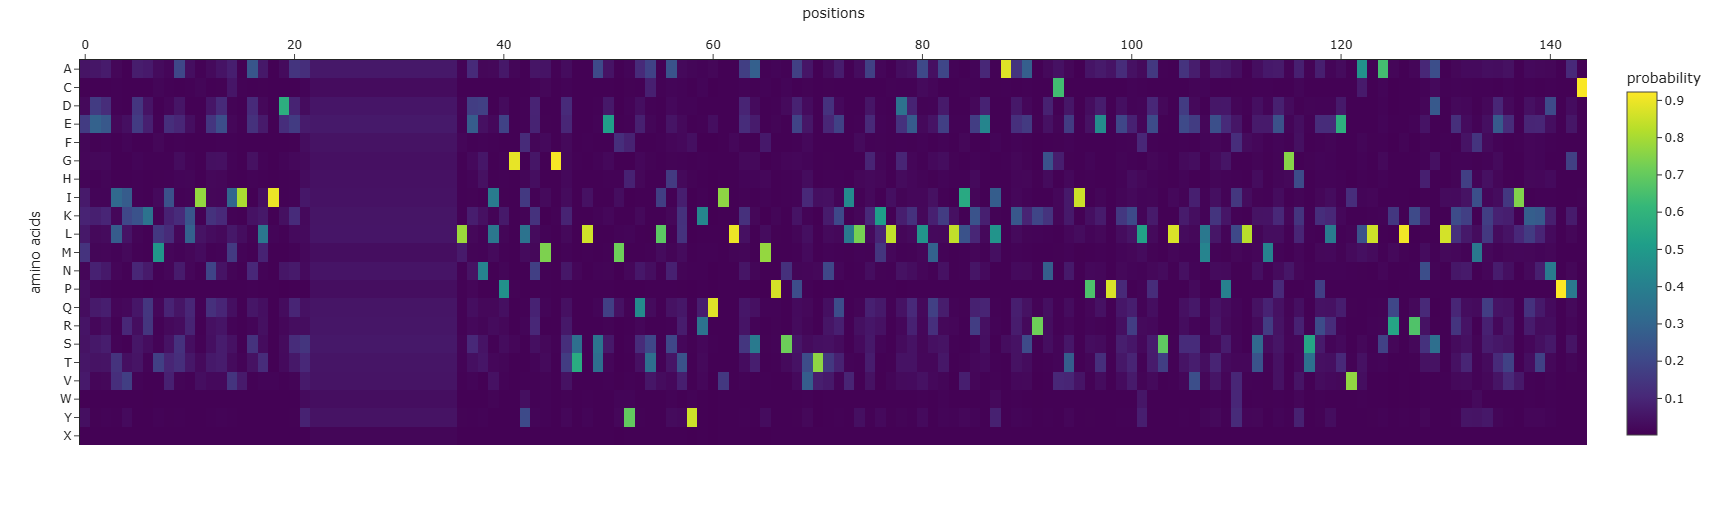
Deep Mutational Scans:
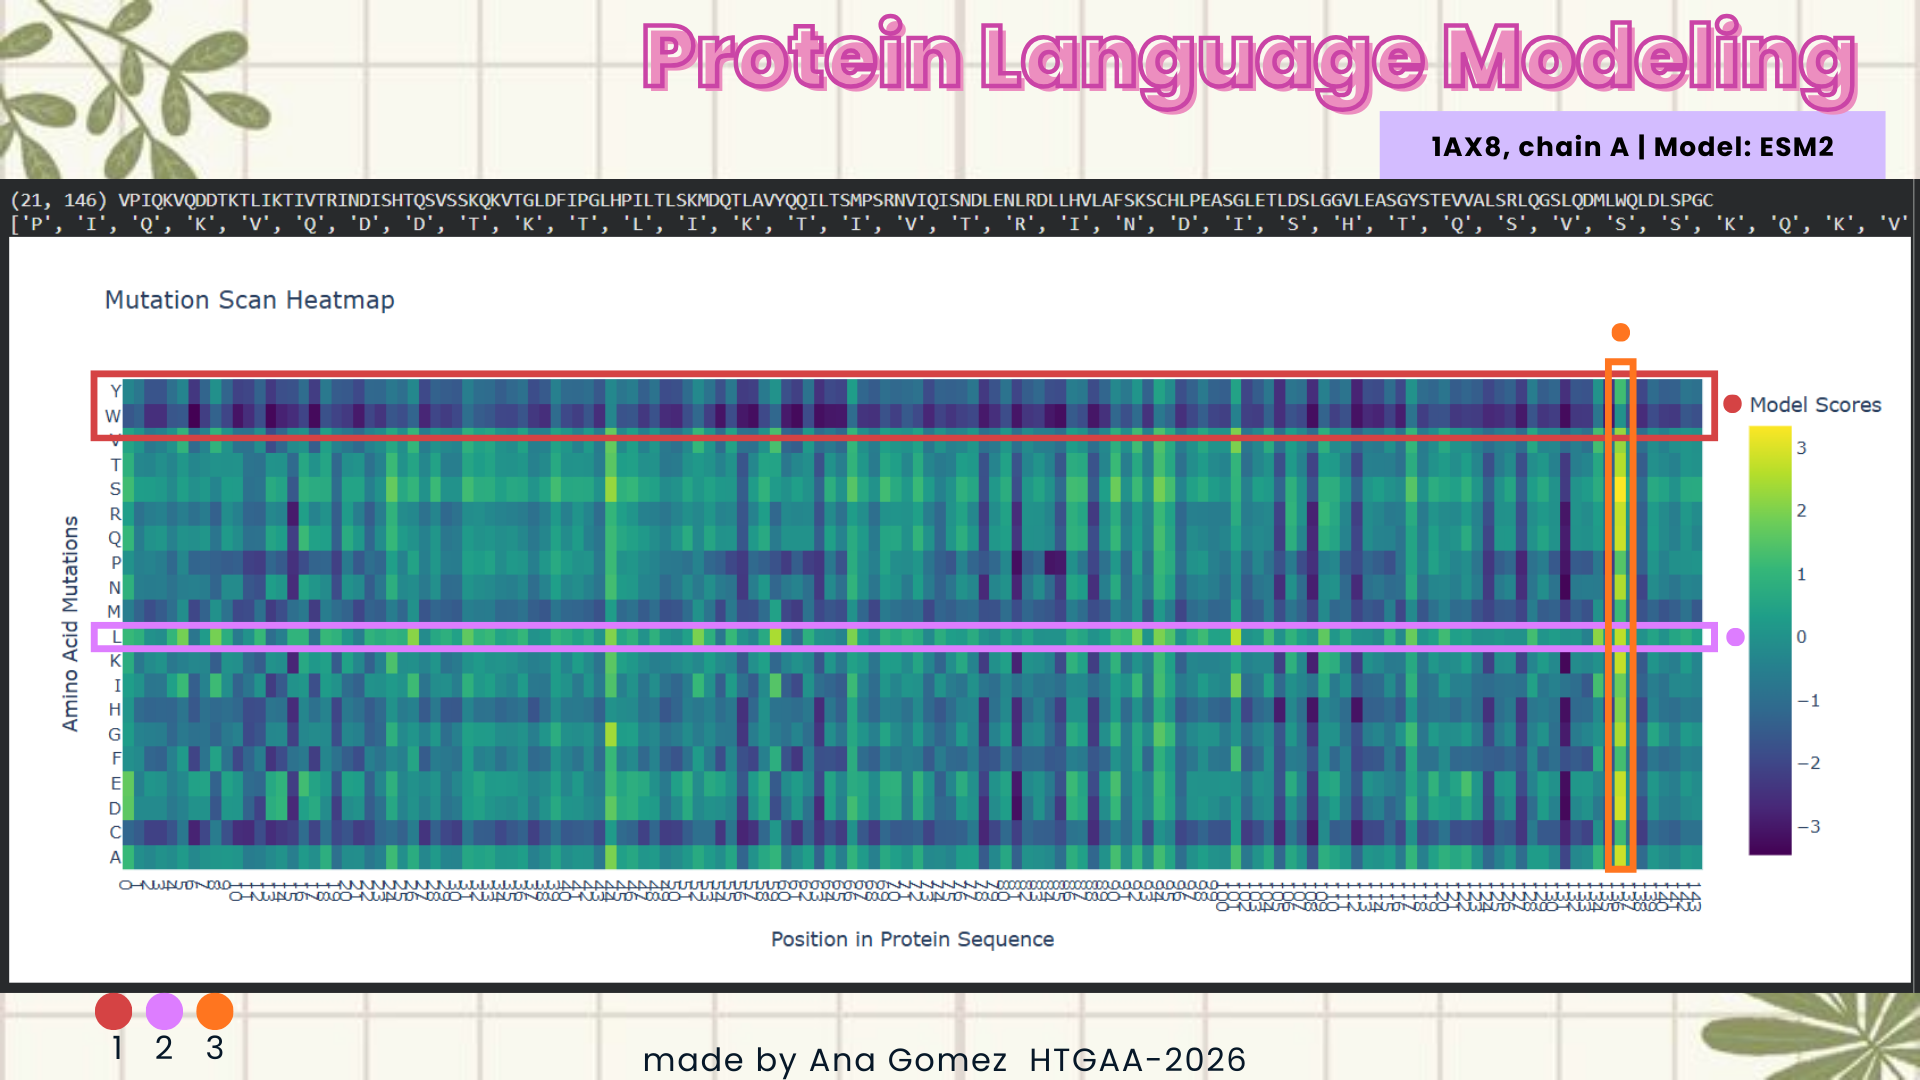
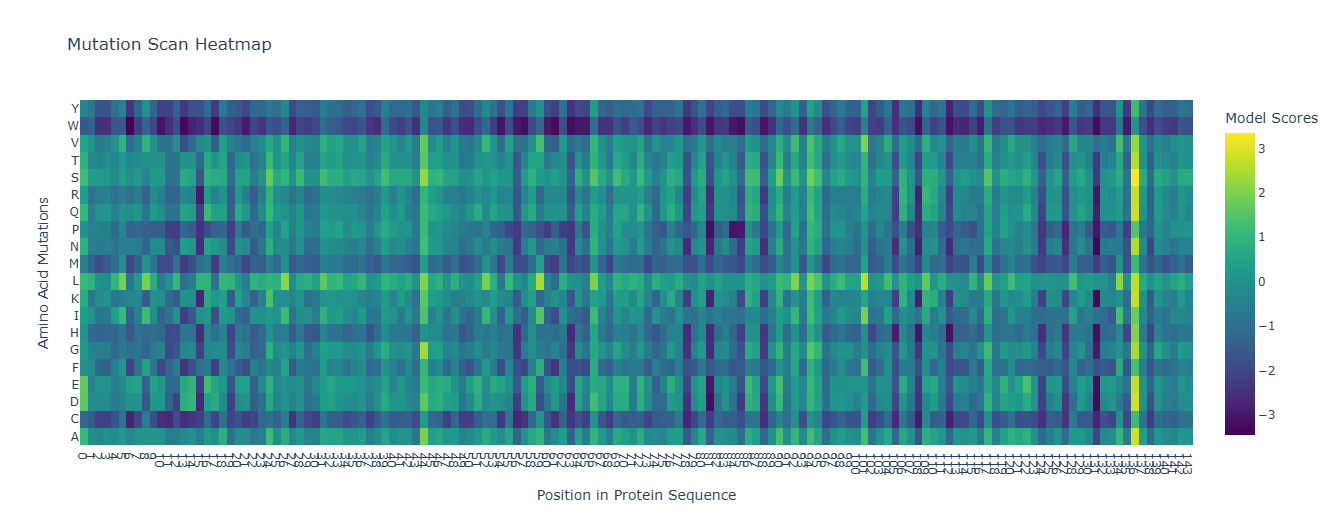
- Using the ESM2 protein language model, I generated an unsupervised deep mutational scan of human leptin (PDB: 1AX8, chain A). The heatmap shows the predicted effect of mutating each residue to all other amino acids based on language model likelihood scores.
Mutation Scan Heatmap:
| Edit | Raw |
|---|---|
| 
|
Several patterns emerge from the mutational landscape. For the red file, it’s shown that substitutions to bulky aromatic residues such as tryptophan (W) and tyrosine (Y) are frequently associated with strongly negative scores across many positions. This suggests that introducing large aromatic side chains is generally unfavorable, likely because it disrupts the packing of the protein core.
In contrast, substitutions to leucine (L) in the purple line appear more tolerated across multiple positions. This observation is consistent with the four-helix bundle architecture of leptin, where hydrophobic residues such as leucine commonly stabilize α-helical structures.
Additionally, some positions show relatively tolerant mutational profiles, indicating regions where the protein sequence may accommodate substitutions without strongly affecting structural stability.
Bonus — Comparison with Experimental Scans:
- When searching for “deep mutational scanning leptin”, I found that there is currently limited experimental data available for leptin itself. However, similar studies have been conducted on related components of the leptin signaling pathway. For instance, deep mutational scanning of the melanocortin-4 receptor (MC4R), which plays a central role in energy homeostasis, has helped identify critical residues involved in receptor activation and signaling. These findings contribute to understanding the molecular basis of obesity-related leptin resistance.
| (Howard et al., 2025, eLife: High-resolution deep mutational scanning of the melanocortin-4 receptor enables target characterization for drug discovery ) |
Experimental deep mutational scanning (DMS) studies systematically measure the functional effects of thousands of mutations across a protein. In a recent study, researchers performed a high-resolution DMS of MC4R, evaluating the functional consequences of more than 6,600 single amino acid substitutions across multiple experimental conditions.
Such experimental datasets provide valuable benchmarks for computational models. Protein language models like ESM have been shown to correlate with experimentally measured mutational effects in several proteins, suggesting that sequence-based models can capture important structural and functional constraints within proteins.
Latent Space Analysis:
To explore the latent space learned by the protein language model, I embedded a dataset of protein sequences using ESM2 and visualized them using a 3D t-SNE projection. In this representation, each point corresponds to a protein sequence, and its position reflects similarity in the embedding space.
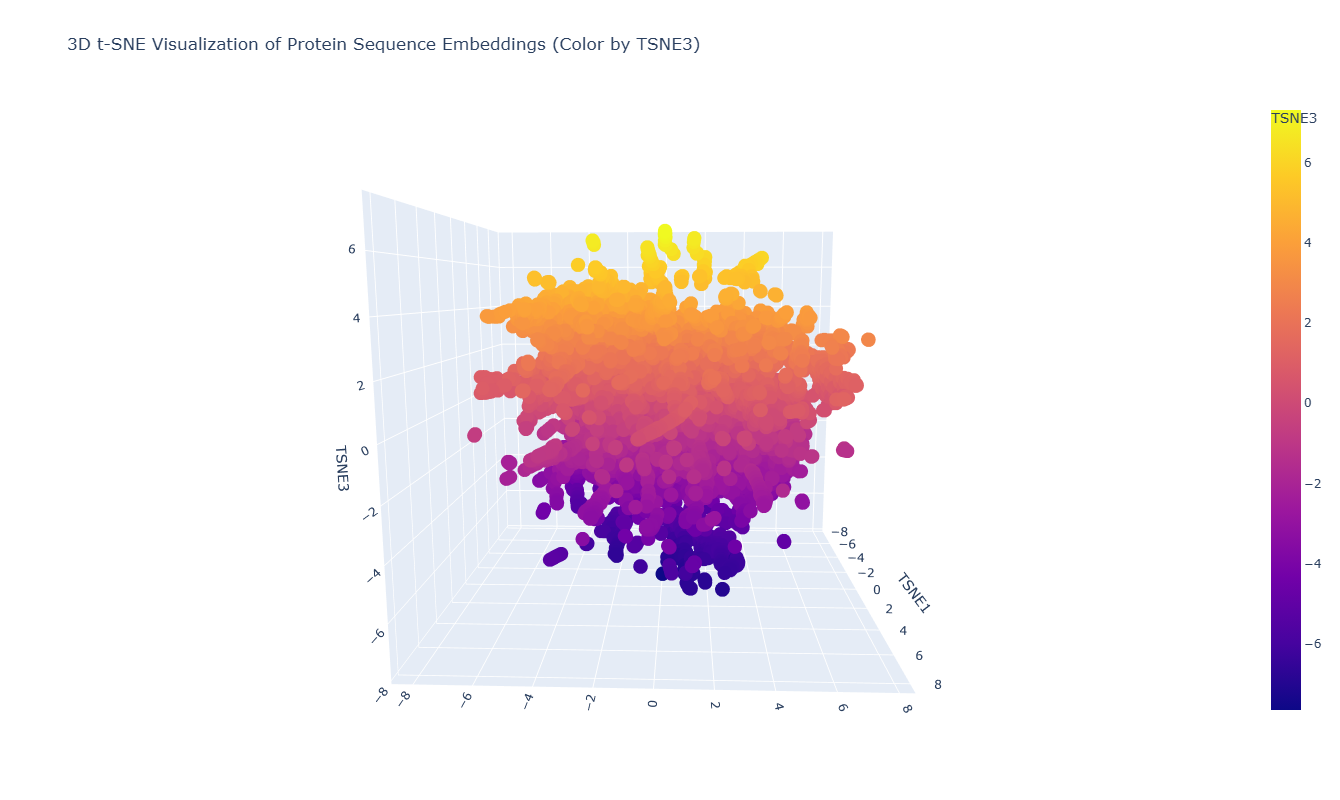
As seen in the plot, the leptin sequence is embedded within this distribution and appears near proteins with similar embedding features. This indicates that the model places leptin among sequences that share comparable structural or evolutionary signals, consistent with the ability of protein language models to capture biologically meaningful relationships from sequence alone.
Something important:
Proteins that appear close together in the map are likely to share sequence patterns, structural features, or functional properties captured by the language model. The visualization forms a continuous cloud of points rather than sharply separated clusters, suggesting that the dataset contains proteins with related sequence characteristics. (Lohmann et al., 2024); (Rives et al., 2021)
C2. Protein Folding:
Folding a protein:
For this section, I’m using the ESMFold package and comparing the PDB 1AX8 Leptin with minimal, medium, and large mutations on the sequence, showed on table 3.
1AX8 Sequence:
- Wild type vs. Mutant 1
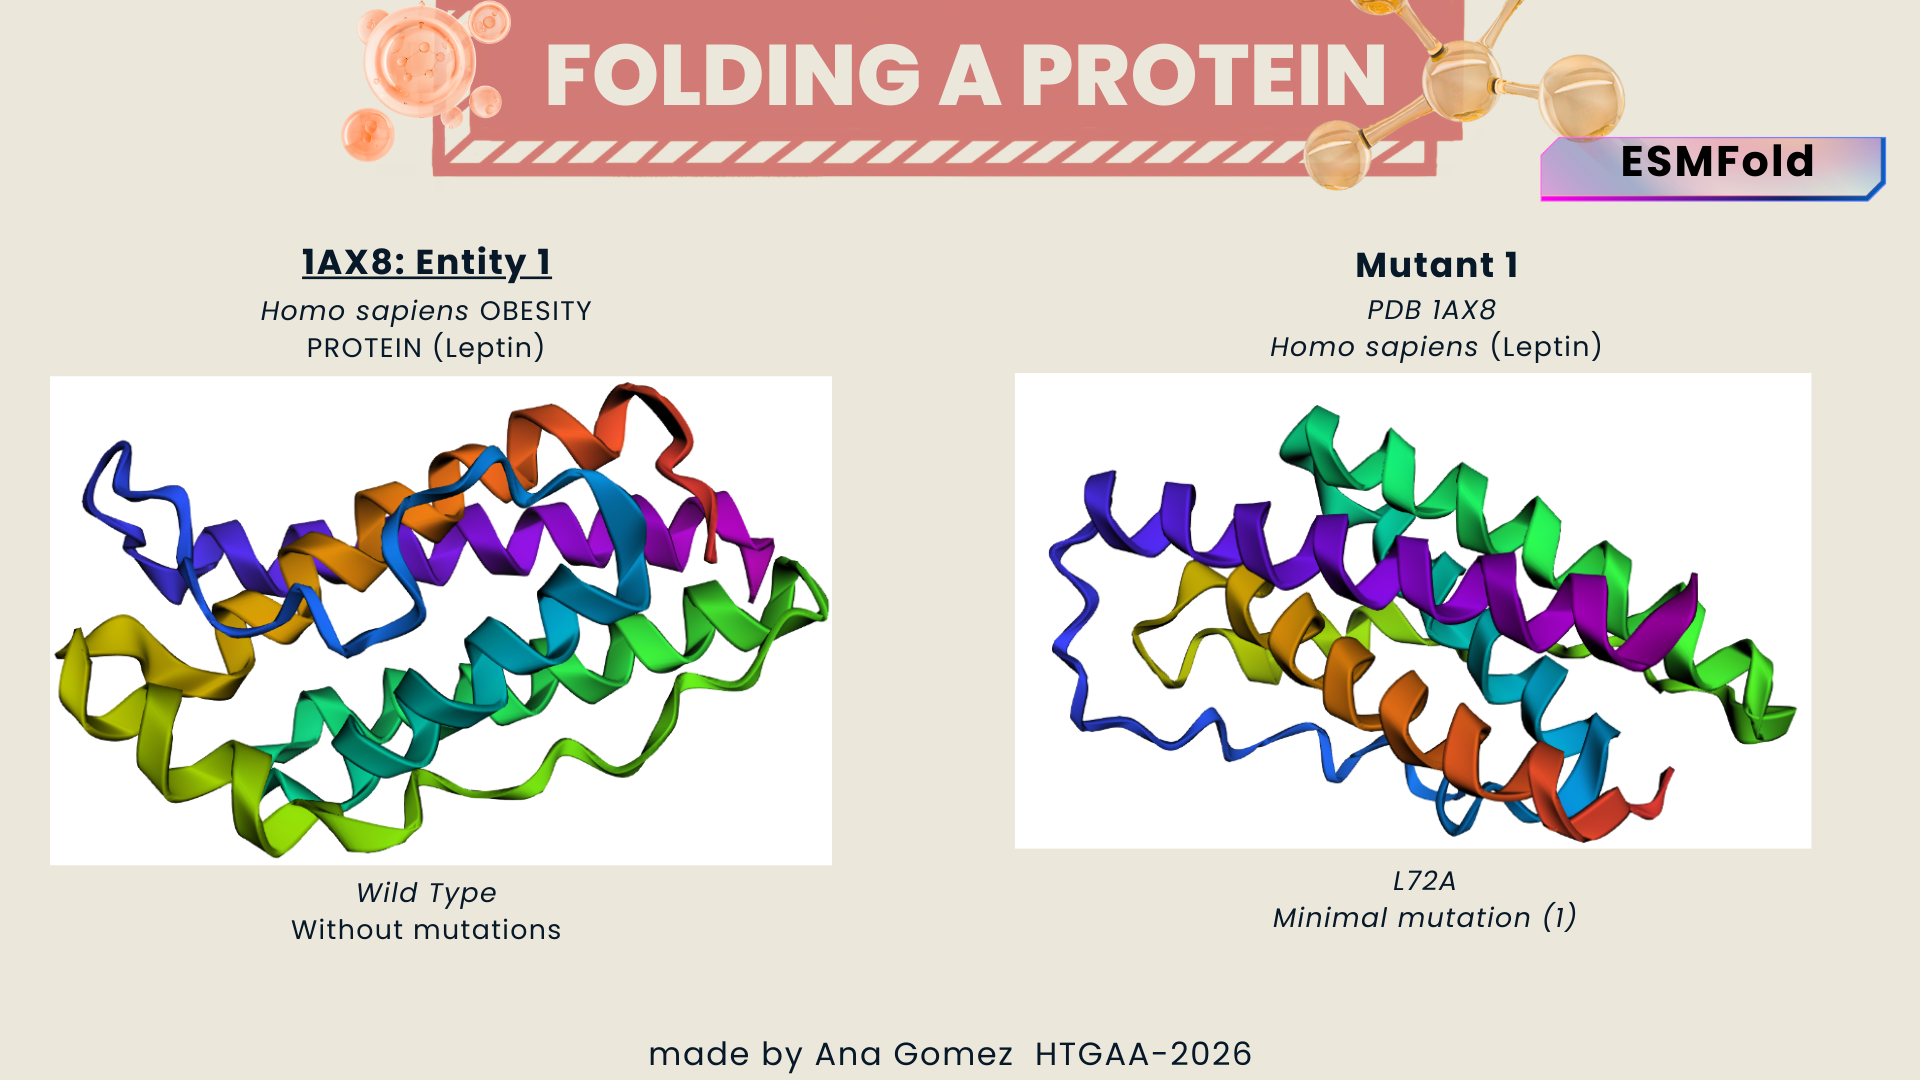
Figure a: Minimal change (Leucine -> Alanina)
A single amino acid substitution did not significantly alter the predicted structure. The overall fold remained stable, suggesting that the protein structure is resilient to minor mutations.
(Input code:)
- Wild Type vs. Mutant 2
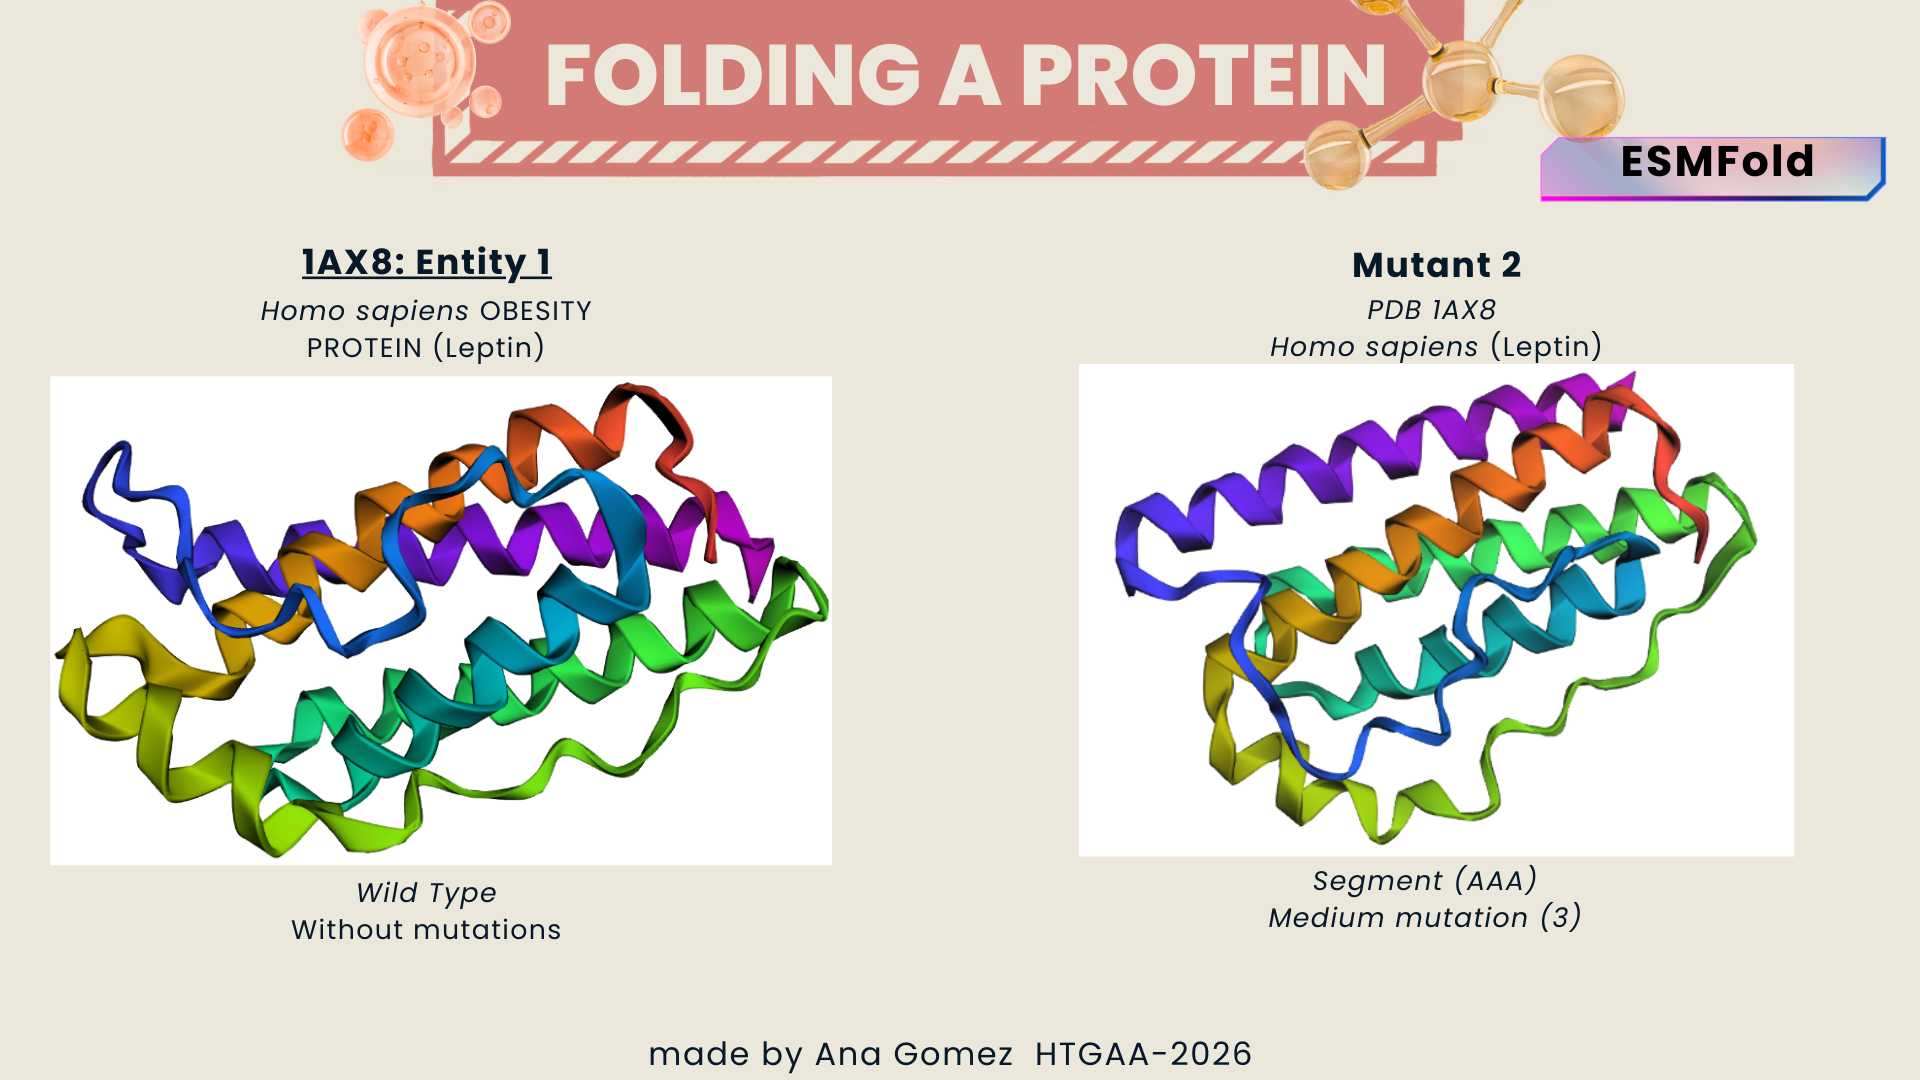
Figure b: Medium change (segment)
A triple amino acid substitution from: QDMLWQLDL to QDMLAAADL. It doesn’t reveal a big visual change.
(Input code:)
- Wild type vs. Mutant 3
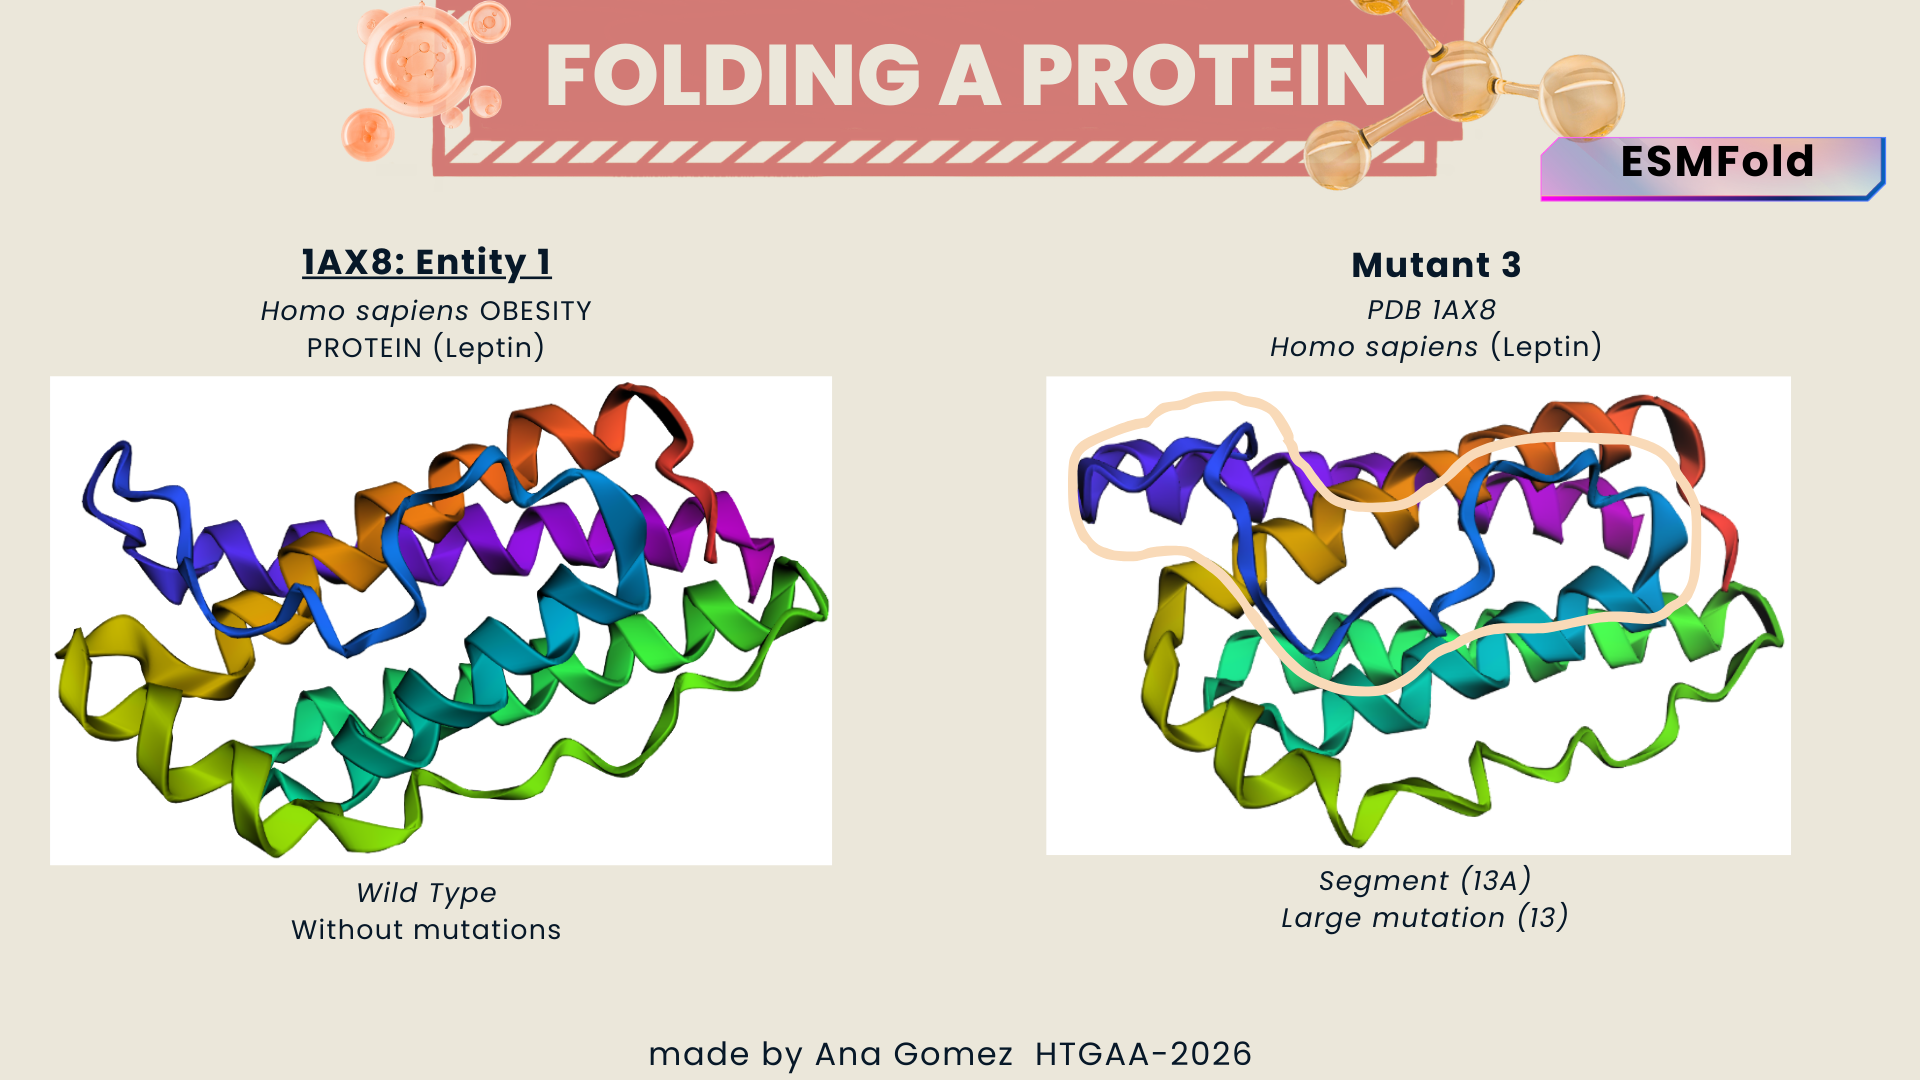
Figure c: large change (large segment)
Larger sequence alterations resulted in noticeable structural changes and reduced prediction confidence, suggesting that the native fold depends on conserved sequence regions.
From: QGSLQDMLWQLDL to AAAAAAAAAAAAA
(Input code:)
Table 3: ESMFold Mutations
| Test | Mutation | Structural change |
|---|---|---|
| WT* | none | no changes |
| Mut1 | 1 AA* | minimal change |
| Mut2 | 3 AA* | medium change |
| Mut3 | 13 AA* | large change |
| Visualization | ||
| — | — | — |
| Mut1 | Mut2 | Mut3 |
| 
| 
|
- WT*= Wild type/original sequence
- AA*= Amino acid
C3. Protein Generation:
Inverse Folding of Leptin (1AX8):
For the inverse folding experiment, the leptin structure (PDB: 1AX8) was used as the template structure in the HTGAA Colab notebook.
The inverse folding model generated the following amino acid sequence:
Generated sequence:
However, the predicted sequence contained 14 positions represented by “X”, indicating positions where the model could not confidently assign a specific amino acid.
These positions likely represent uncertain residues or gaps produced during the inverse folding process.
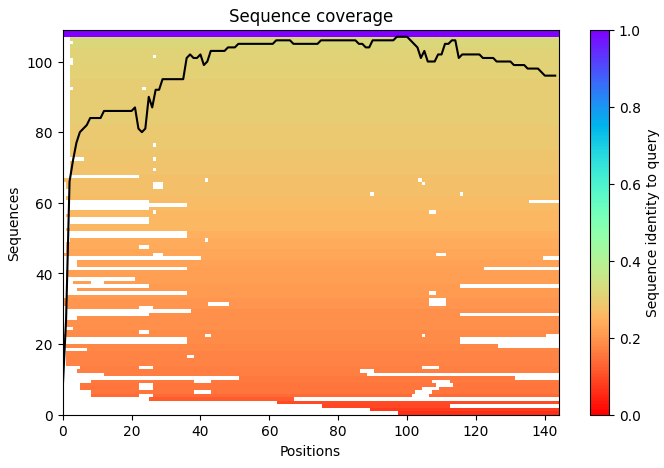
Sequence Coverage Analysis:
To better understand the reliability of the predicted sequence, a sequence coverage heatmap was generated.
As explained before, the sequence coverage plot represents the number of homologous sequences aligned at each position of the protein during the multiple sequence alignment step.
Regions with higher coverage indicate strong evolutionary support, while regions with lower coverage may represent positions where the model has less information.
The heatmap showed that most of the protein sequence had high coverage, suggesting that the predicted structure is supported by evolutionary information.
However, the region containing the 14 X residues appeared as an uncertain segment, suggesting that the model was unable to confidently assign amino acids at those positions.
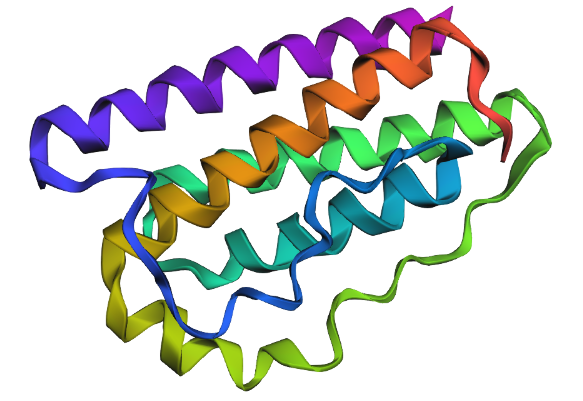
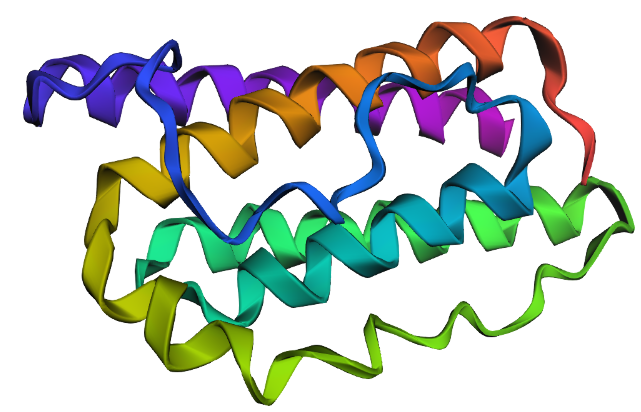
Initial Folding Attempt with the 14 Unknown Residues:
Before replacing the unknown residues, the generated sequence was folded to visualize how the model behaves when the uncertain residues remain unresolved.
| Wild Type* | inverse folding with X** |
|---|---|
| 
|
Wild type* (1AX8 original sequence) ; Inverse folding with X**: 14X AA
The predicted structure appeared generally similar to the wild-type leptin structure, maintaining the overall helical arrangement. However, the region containing the 14 X residues resulted in a shorter helix and slightly altered local folding, making the predicted structure appear slightly more compact than the wild-type structure (144 WT Amino acids vs. ~130 Amino acids).
Design of Replacement Sequences:
To resolve the unknown residues, three possible sequence replacements were designed.
For this step, I consulted ChatGPT-5.2 to suggest amino acid patterns commonly used in protein design to stabilize or link structural elements.
Three strategies were proposed:
Variant A – Coiled-coil promoting residues
This design uses amino acids commonly found in α-helical coiled-coil motifs, including glutamic acid (E), leucine (L), lysine (K), and glutamine (Q).
Replacement sequence:
EELKQQLLEELKQQ
Final sequence:
- This design aims to promote α-helix formation and structural stability.
Variant B – Flexible linker
This variant uses glycine-rich residues to create a flexible linker region.
Replacement sequence:
GGGSGGGSGGGSGG
Final sequence:
- Glycine-rich linkers are often used to provide flexibility between structural domains.
Variant C – Hybrid design
This sequence combines features of the previous two strategies, using helix-favoring residues while maintaining moderate flexibility.
Replacement sequence:
LEEKQKLEELEKQL
Final sequence:
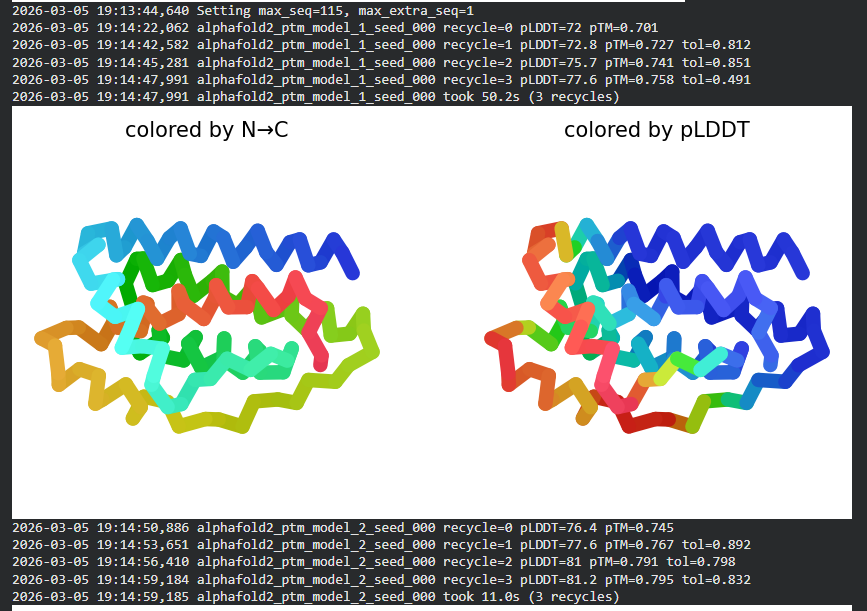
Structure Prediction of the Variants:
Due to GPU limitations in the HTGAA Colab notebook, the structural prediction of the redesigned sequences was performed using the ColabFold AlphaFold2 notebook.
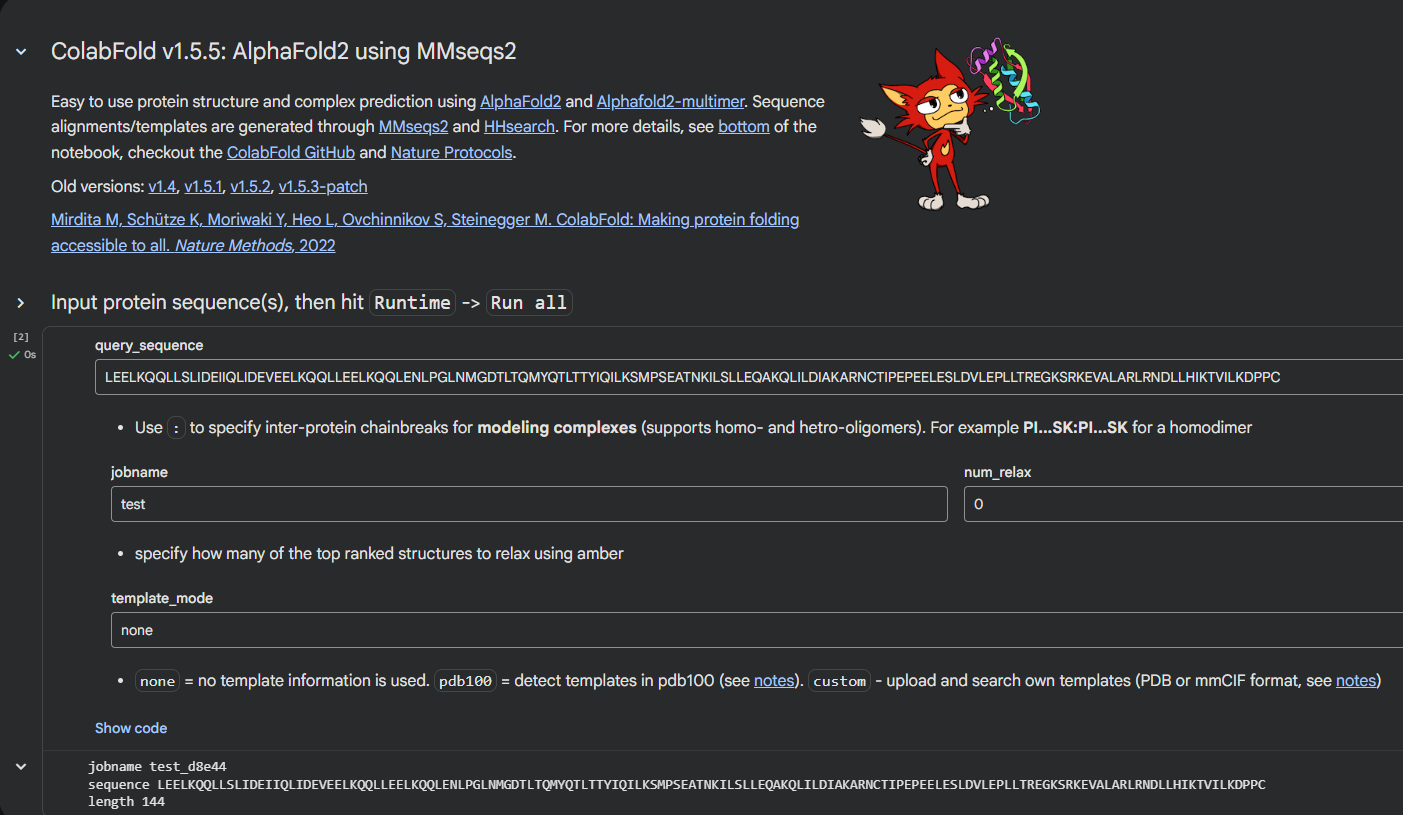
| AlphaFold Colab Notebook https://colab.research.google.com/github/sokrypton/ColabFold/blob/main/AlphaFold2.ipynb |
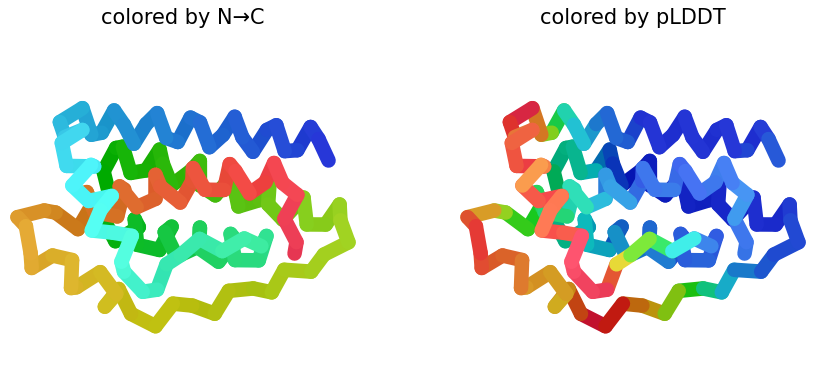
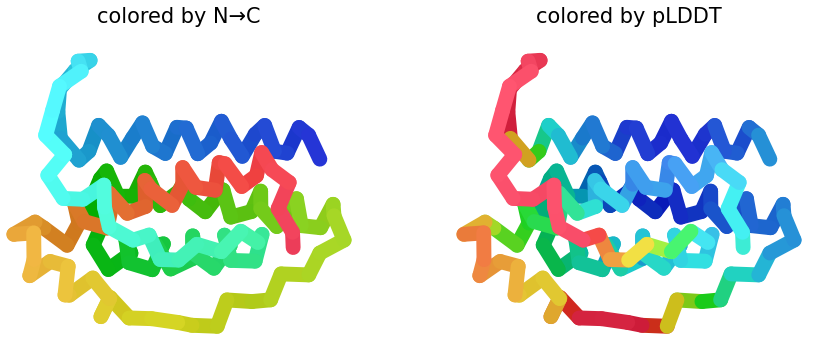
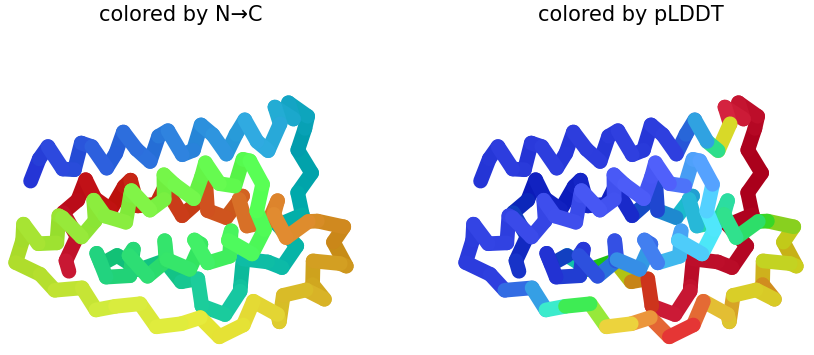
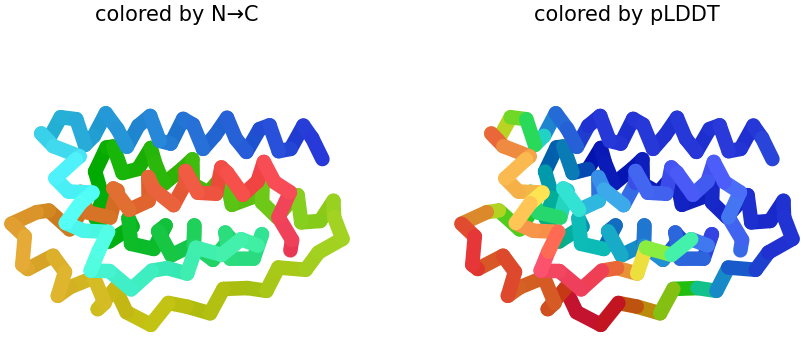
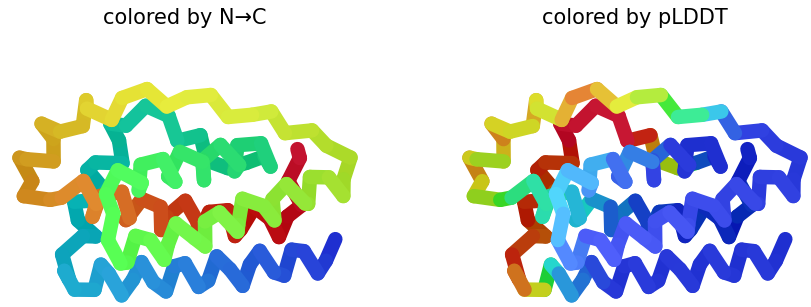
AlphaFold predictions provide three useful structural visualizations:
- N → C coloring:
Shows how the protein chain folds along the sequence from N-terminus to C-terminus.
- pLDDT coloring:
Shows the confidence of the structural prediction.
Blue: high confidence
Green/yellow: moderate confidence
Red: low confidence or flexible regions
Example: pLDDT and N → C coloring from Variant A:
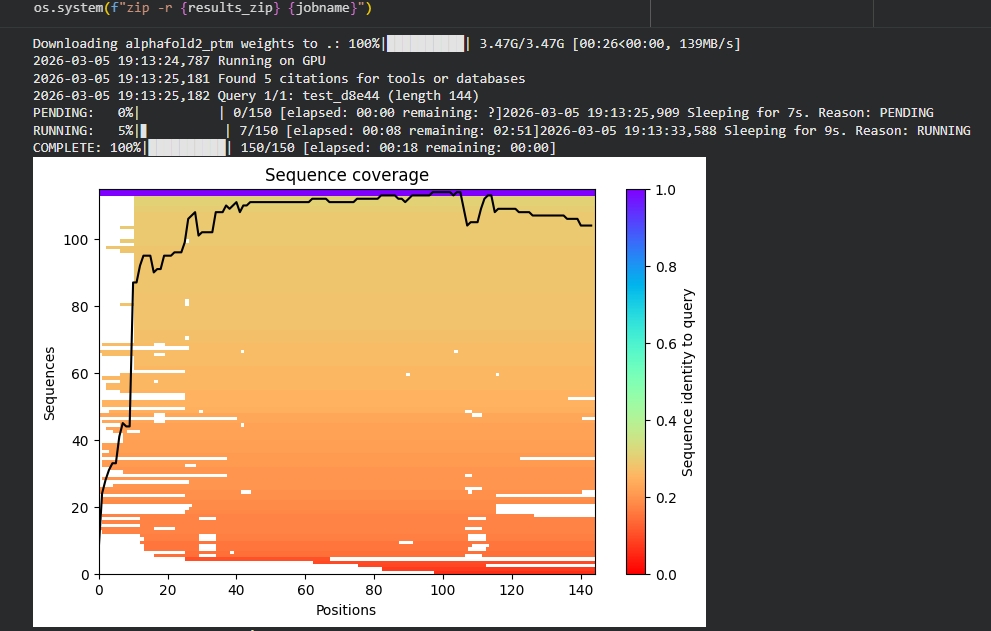
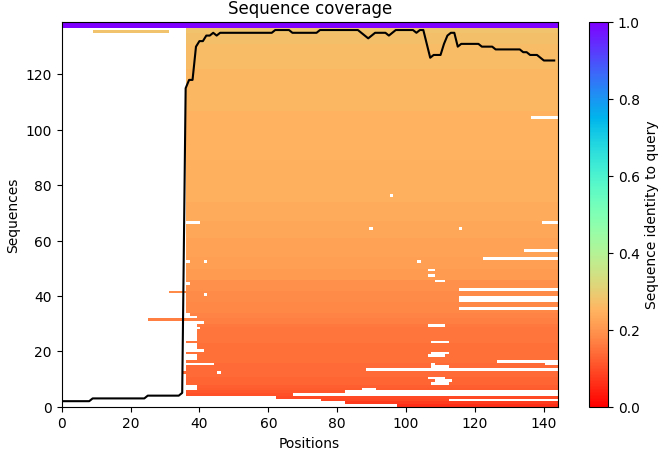
- Sequence Coverage Map:
The sequence coverage plot represents the number of homologous sequences aligned to each residue position during the multiple sequence alignment (MSA) step used by AlphaFold.
| Example 1 | Example 2 |
|---|---|
| 
|
The x-axis represents the amino acid positions along the protein sequence, while the y-axis represents the number of homologous sequences aligned at each position.
The background color gradient indicates the sequence identity between homologous sequences and the query sequence, where:
Purple/blue → regions indicate sequences with high similarity to the query
Orange/red → regions indicate lower sequence identity
The black line represents the coverage depth, showing how many sequences are aligned at each position of the protein. Regions where the black line is higher indicate greater evolutionary support, meaning that many homologous sequences contribute information to the prediction.
Structural Comparison with the Wild Type:
Variant A
Sequence Coverage Map, and pLDDT plots:
| 1 | 2 | 3 |
|---|---|---|
|
|
| 
|
1. Sequence Coverage Map: In some regions of the plot, the colored background becomes less continuous or shows gaps. These areas indicate positions where fewer homologous sequences align with the query protein. Such regions may correspond to flexible loops, insertions, or regions with lower evolutionary conservation, which can make structural prediction more uncertain. Also, the black line in this graphic indicates the protein has strong evolutionary support across most positions, suggesting that the structural prediction should be reliable for the majority of the residues.
2 & 3. pLDDT: Shows similar structures that replaces N → C coloring on how the protein presents it. Also, the figure shows half blue predictions, which means a high confidence in that position of the protein
Final structure 3D visualization with Variant A
| WT 1AX8 | IF Variant A* |
|---|---|
|
| 
|
*Inverse Folding Variant A
The structure predicted for Variant A maintains the four-helix bundle characteristic of leptin. However, the redesigned region appears to produce a smoother loop and an extended helical region, suggesting that the coiled-coil-like sequence stabilizes the helix architecture.
Variant B
Sequence Coverage Map, and pLDDT plots:
| 1 | 2 | 3 |
|---|---|---|
|
| 
| 
|
1. Sequence Coverage Map: In this graphic, the plot shows better coverage when the sequence is >60. Compared on previous sequence map, it shows white gaps. Such regions may correspond to flexible loops, insertions, or regions with lower evolutionary conservation, which can make structural prediction more uncertain.
2 & 3. pLDDT: Shows similar structures that replaces N → C coloring on how the protein presents it. Also, the figure shows half blue predictions, which means a high confidence in that position of the protein. In figures 2 & 3, plot 3 shows more confidence because the presence of blue is greater than in plot 2.
Final structure 3D visualization with Variant B
| WT 1AX8 | IF Variant B* |
|---|---|
|
| 
|
*Inverse Folding Variant b
Variant B also preserves the four-helix arrangement of the wild-type leptin. However, the glycine-rich linker introduces greater flexibility in the connecting regions, resulting in a less compact and more relaxed structure. As well, the helices remain present but appear less tightly organized.
Variant C
Sequence Coverage Map, and pLDDT plots:
| 1 | 2 | 3 |
|---|---|---|
| 
| 
|
1. Sequence Coverage Map: In this particular sequence map, the coverage shows an abrupt increase after the first residues. This behavior may occur when the alignment database finds fewer homologous sequences matching the N-terminal region, while the rest of the sequence aligns well with known protein families. And this can indicate that the N-terminal region may be less conserved or structurally flexible compared to the core of the protein.
2 & 3. pLDDT: Shows similar structures that replaces N → C coloring on how the protein presents it. Also, the figure shows half blue predictions, which means a high confidence in that position of the protein. In figures 2 & 3, plot 3 shows more confidence because the presence of blue is greater than in plot 2.
Final structure 3D visualization with Variant C
| WT 1AX8 | IF Variant C* |
|---|---|
|
|
|
*Inverse Folding Variant c
Variant C produces a structure that appears more compact and structurally organized than Variant B. The helices are arranged in a way that resembles the wild-type structure more closely, suggesting that the hybrid sequence helps restore structural stability while maintaining some flexibility.
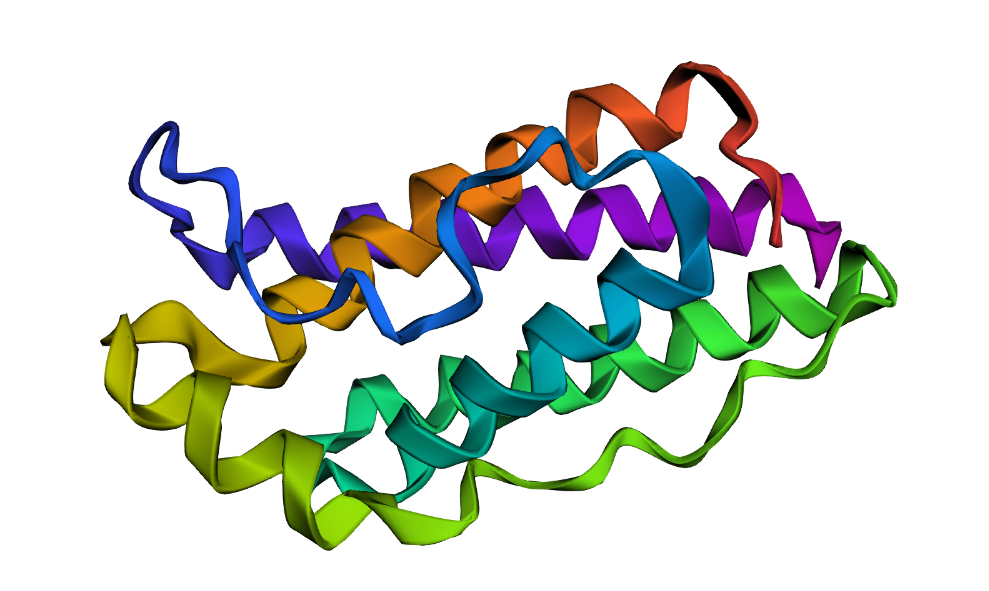
Structural Visualization
Final structure of Inverse-Folding from PDB: 1AX8
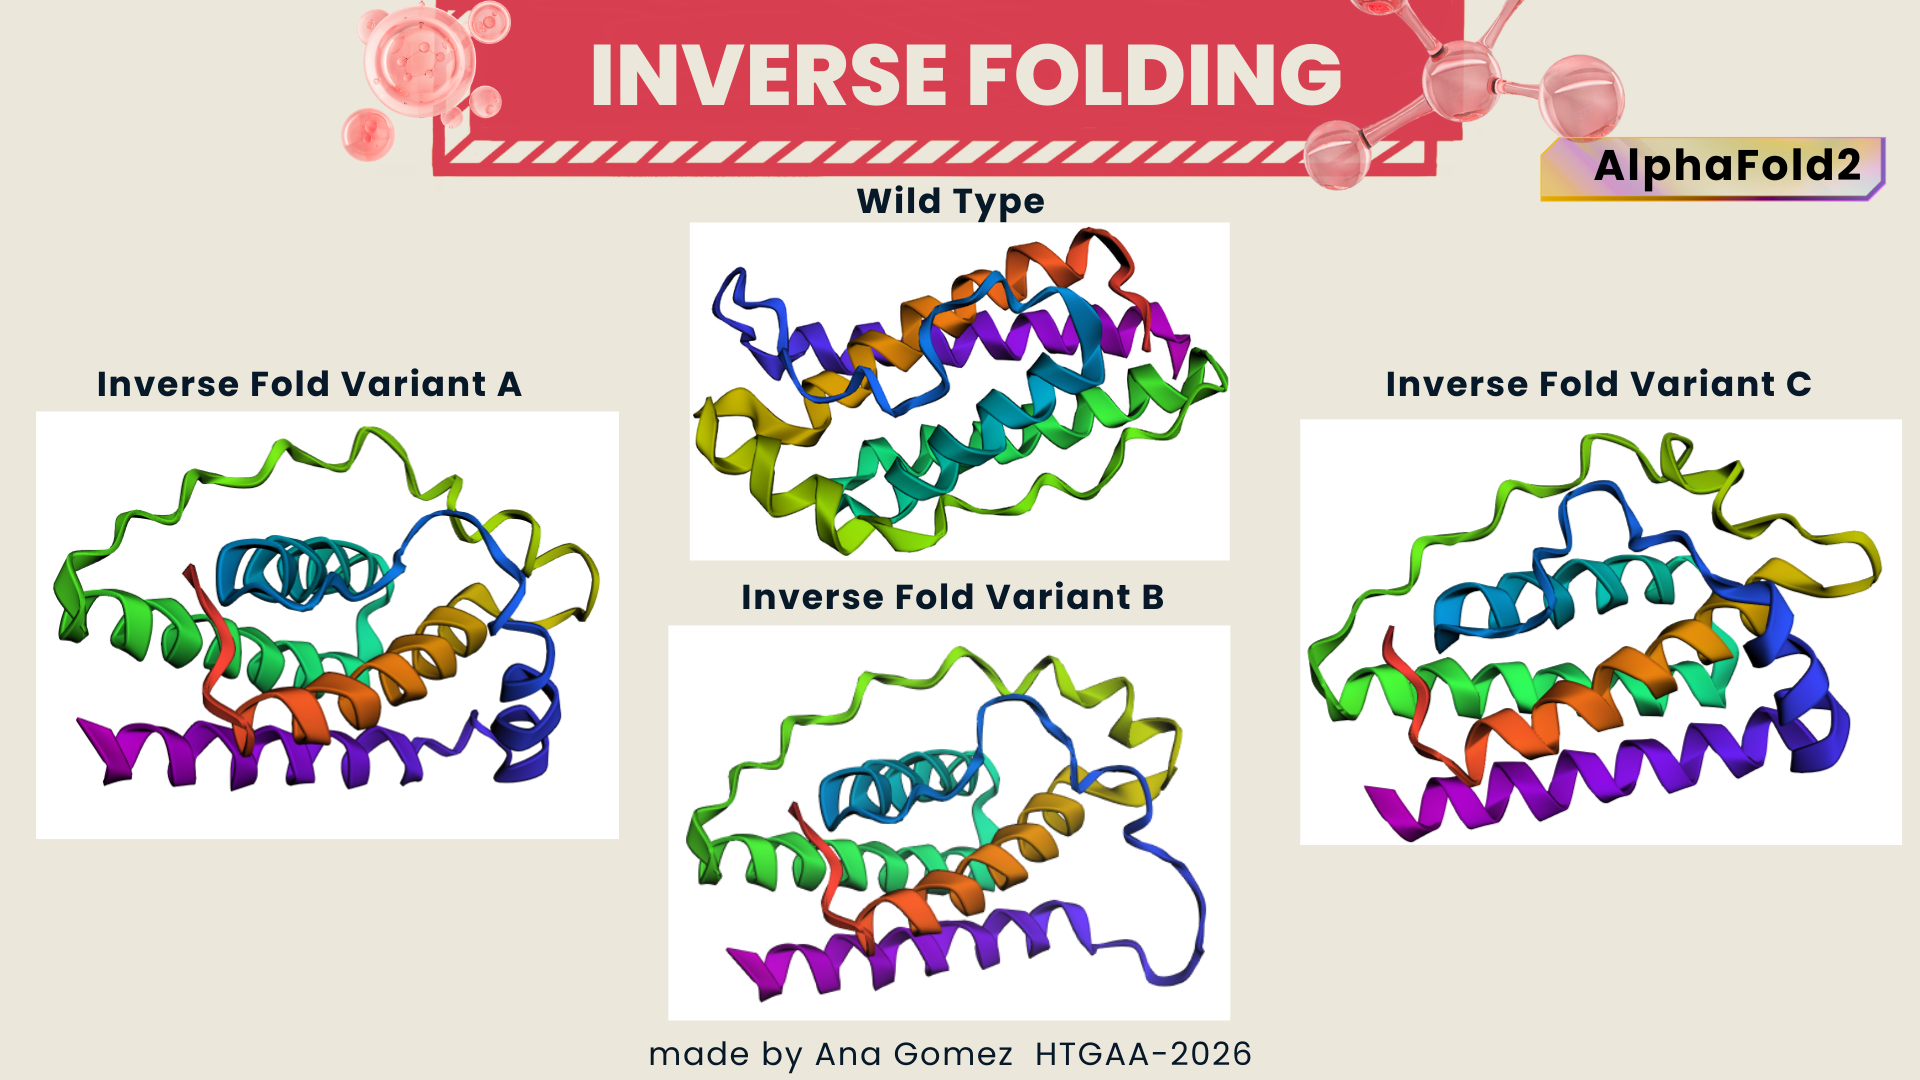
Figure 3 Comparison of Inverse Folding structure
Mol Viwer:
As an extra, I tested another software Mol viewer to compare the predicted models with the original structure. The wild-type leptin structure (PDB: 1AX8) was visualized here:
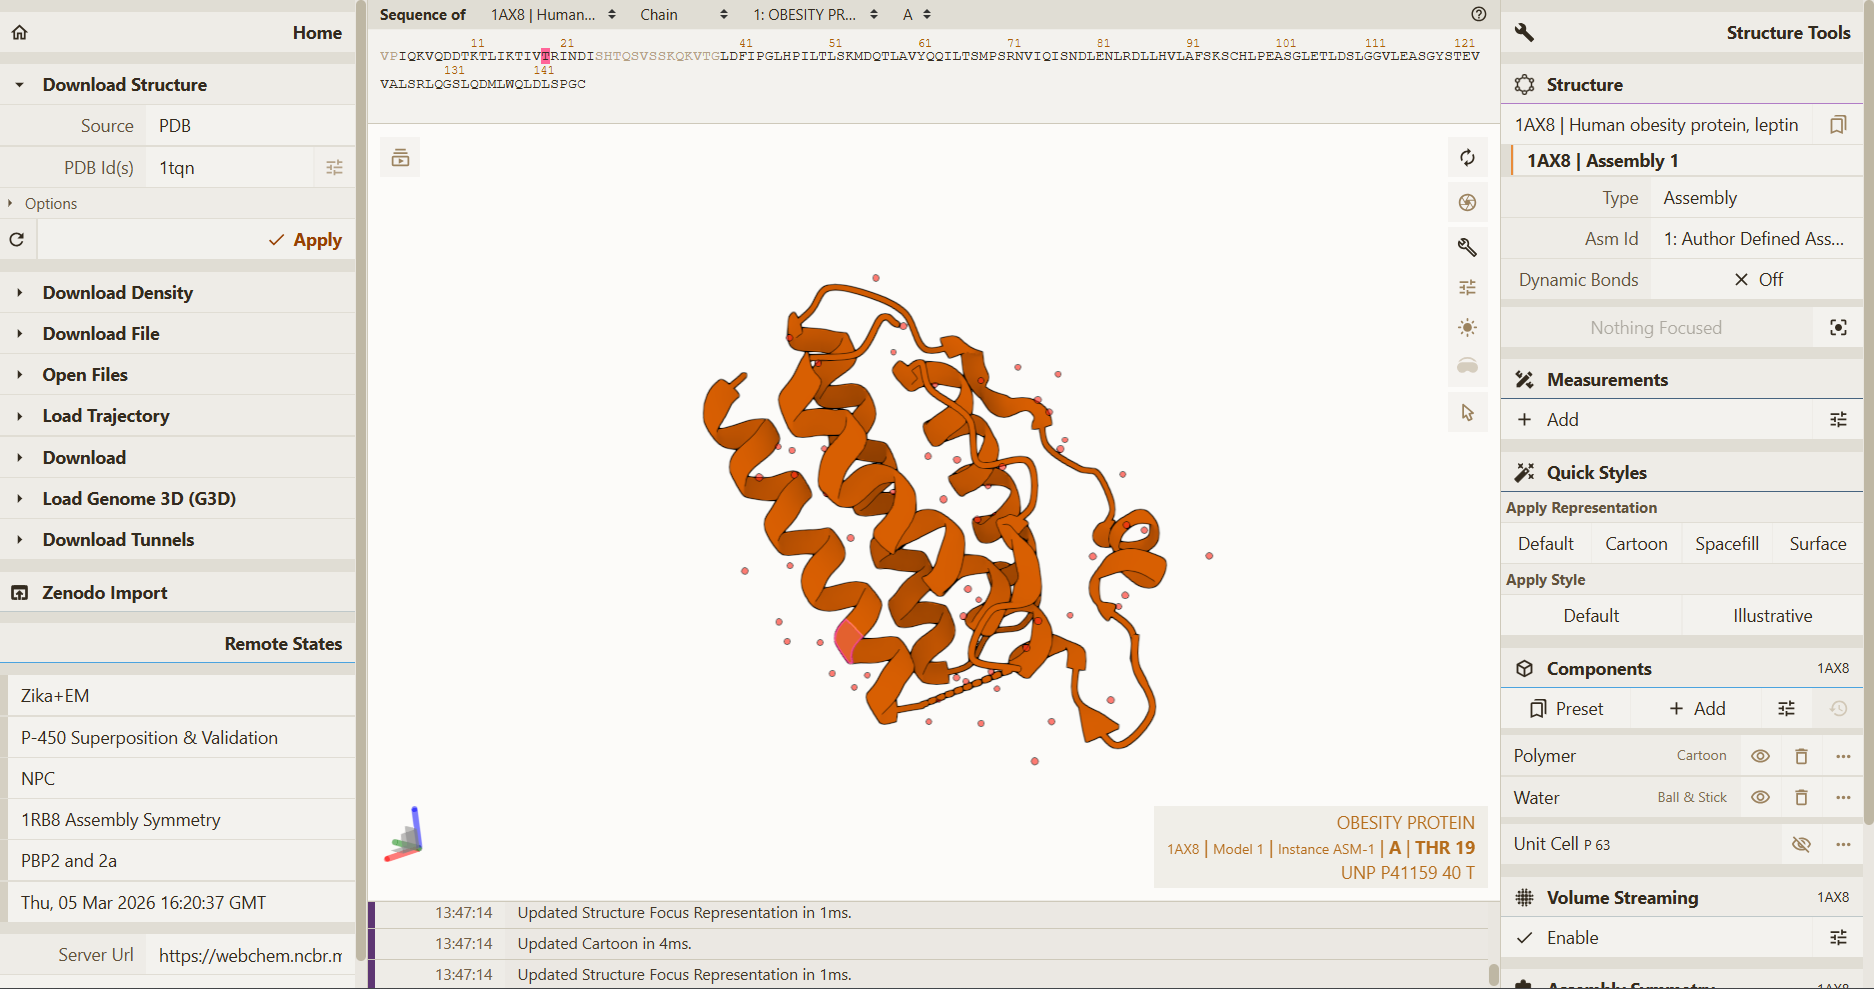
This app could be used to visualize and allow direct comparison between the experimentally determined structure and the redesigned inverse-folded variants.
Recommended lectures: I briefly reviewed some papers for the visualization of Sequency coverage map and pLDDT for AlphaFold, please read “Sources” at the References/sources section of this page.

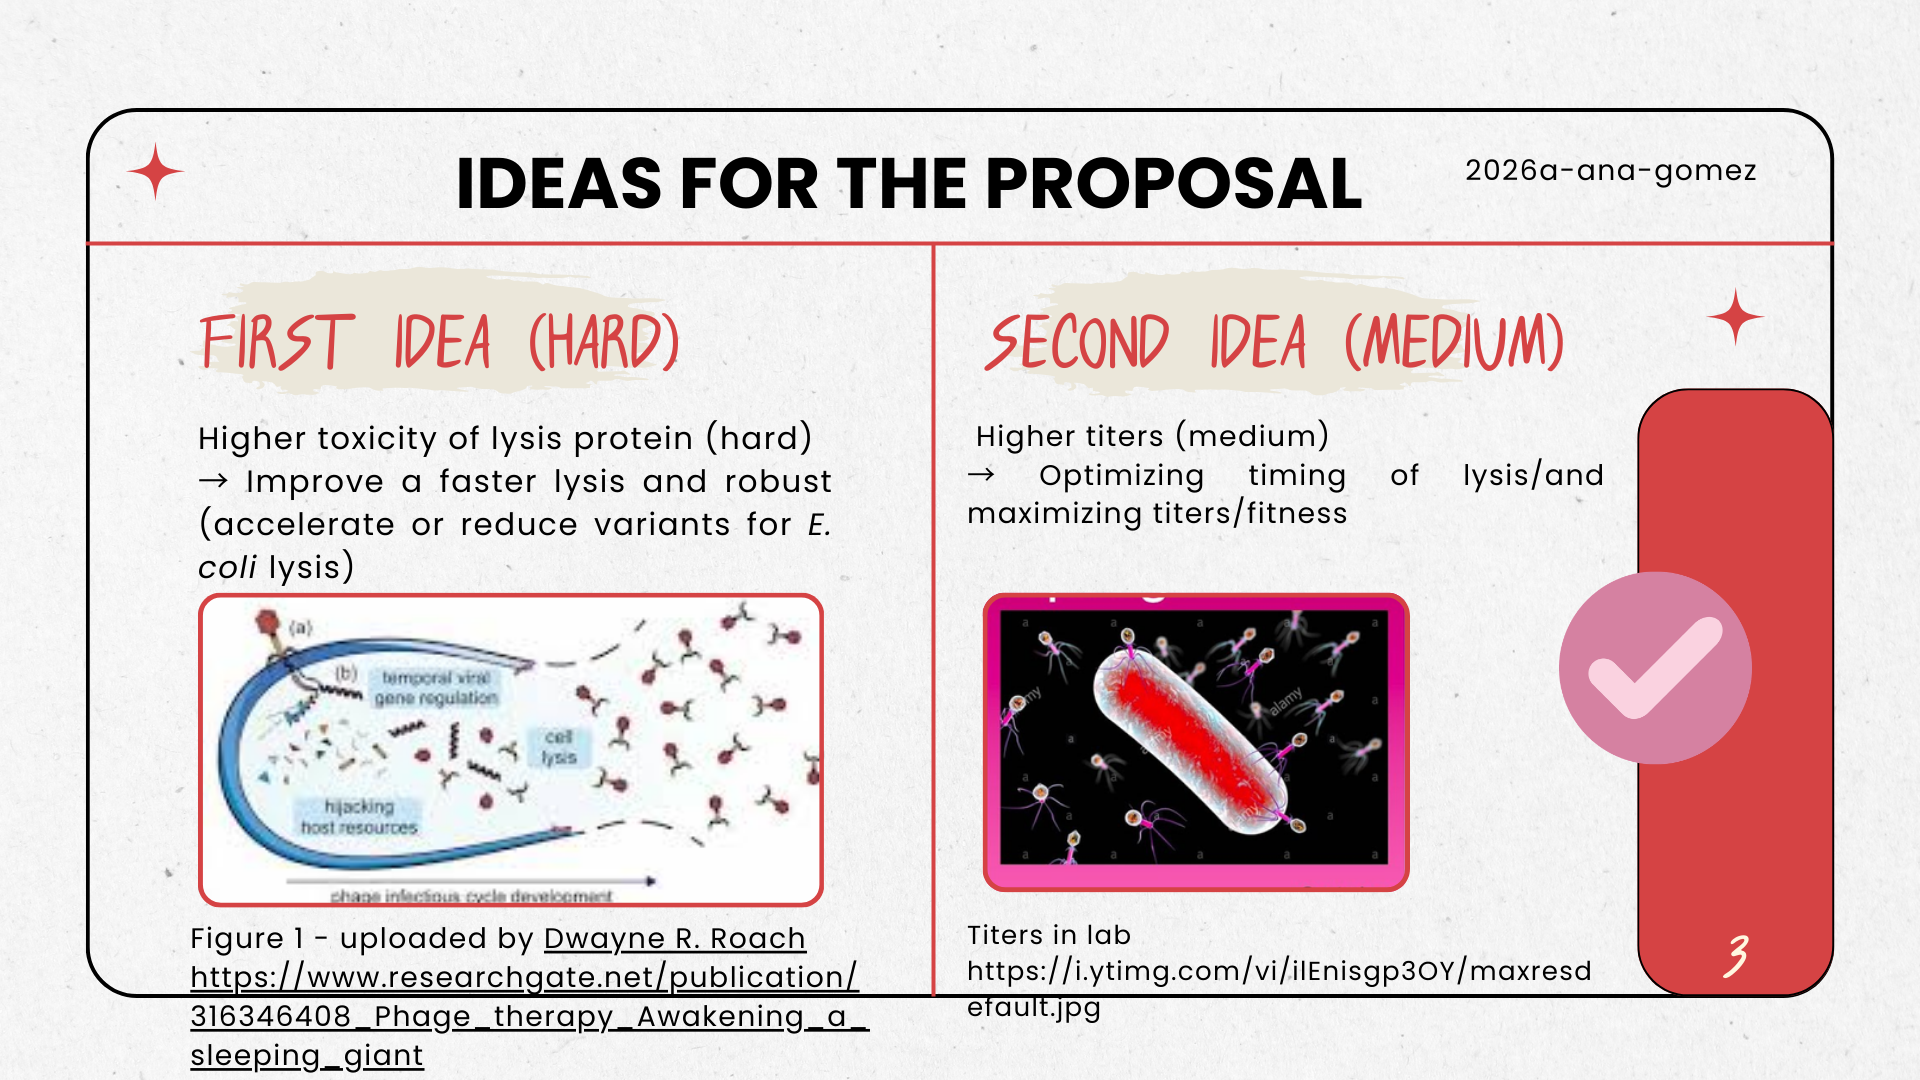
Part D: Group Brainstorm on Bacteriophage Engineering
For this part, I am working with Cynthia Viera from SynBio USFQ node
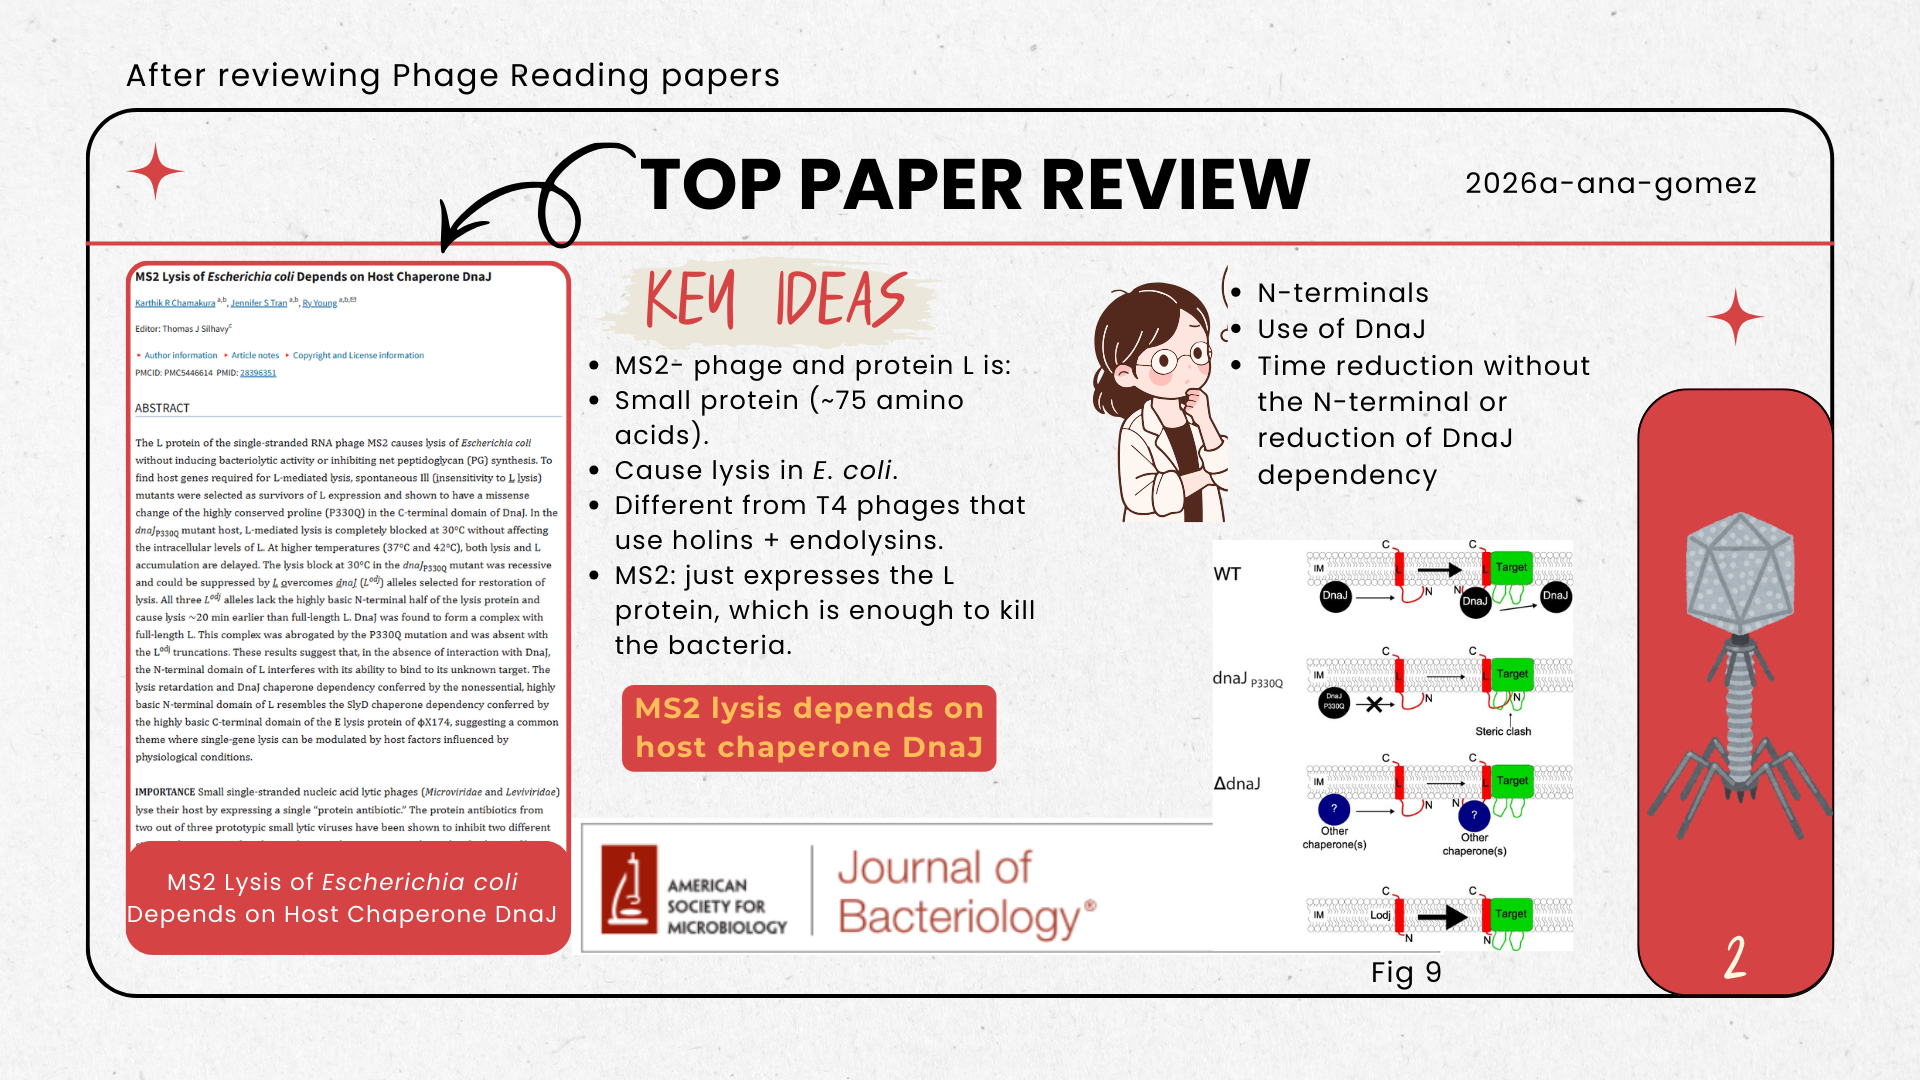
Idea inspiration:
- We were inspired by the phage reading lecture, especially from the paper: https://doi.org/10.1128/JB.00058-17, which has an interesting approach with bacteriophage MS2 and the dynamics of lysis in Escherichia coli using the protein L.

| 
| 
|
Proposal: Click here to download the pdf file: Proposalw4brainstorm
Short Plan:
We will computationally optimize MS2 phage yield by tuning the lysis timing of the MS2-L protein toward an assembly-friendly window. Using BLAST and multiple sequence alignment, we will identify conserved and mutation-tolerant regions, then apply protein language models (ESM) to propose conservative variants. We will screen candidate stability using rapid structure prediction (ESMFold or monomer AlphaFold) and prioritize variants expected to preserve the essential transmembrane lytic features while reducing timing variability. Our goal is to increase total phage titers by improving the balance between virion assembly completion and reliable lysis.

Weekly Reflection:
⭐ This week made me reflect on how the knowledge from my previous biology training helped me interpret some of the results from the protein design tools. Even though the software is new, many of the ideas connect with basic concepts such as protein folding and structure.
⭐ While working on the inverse folding assignment, I noticed that understanding protein design in a single class can be challenging because there are many computational and biological concepts involved.
⭐ I also encountered a limitation with the Colab GPU when trying to continue running inverse folding experiments. Because of this, I explored another tool and used AlphaFold through ColabFold to predict the structures of the redesigned sequences instead of the original ESMFold notebook. This helped me continue the analysis and compare the predicted structures.
⭐ One thing I noticed is that some regions of the predicted proteins show lower confidence scores, which may be expected because the sequence was generated through inverse folding, meaning it does not necessarily follow the canonical evolutionary constraints of the natural protein.
⭐ For Part B of the assignment, I am interested in exploring more tools related to protein research and visualization. I also enjoy creating small tutorials for myself while working with these tools, since it helps me remember the steps and understand the workflow better.
⭐ During the lecture for Week 5 and discussions with classmates, I became interested in the topic of phage therapy. I realized that phages have many applications beyond what we initially read in the papers. (Yeah, I am updating my W4 during W5 cause it was heavy 😅)
❓ A question that came up during a conversation with a classmate was about bacterial resistance to bacteriophages after several generations. This made me curious about what strategies researchers use to avoid this problem, such as phage cocktails or other approaches.
Thanks for reading my assignment! This info is also available at my personal Notion. To check it, please enter here! Notion W4
References & sources
Part A
Doig A. J. (2017). Frozen, but no accident - why the 20 standard amino acids were selected. The FEBS journal, 284(9), 1296–1305. https://doi.org/10.1111/febs.13982
Gutiérrez-Preciado, A., Romero, H. & Peimbert, M. (2010) An Evolutionary Perspective on Amino Acids. Nature Education 3(9):29 https://www.nature.com/scitable/topicpage/an-evolutionary-perspective-on-amino-acids-14568445/#:~:text=In%201953%2C%20Miller%20and%20Urey,emerge%20from%20biosynthetic%20enzymatic%20reactions.
Grishin, D. V., Zhdanov, D. D., Pokrovskaya, M. V., & Sokolov, N. N. (2020). D-amino acids in nature, agriculture and biomedicine. All Life, 13(1), 11–22. https://doi.org/10.1080/21553769.2019.1622596
University of Illinois. (2026). Meat Science Laboratory | Animal Sciences | Illinois. https://ansc.illinois.edu/about/facilities/meat-science-laboratory
University of Utah. (2026). Nutrition & the Epigenome. https://learn.genetics.utah.edu/content/epigenetics/nutrition/
Part B
Friedman, J.M. Leptin and the endocrine control of energy balance. Nat Metab 1, 754–764 (2019). https://doi.org/10.1038/s42255-019-0095-y
Part C
A. Rives, J. Meier, T. Sercu, S. Goyal, Z. Lin, J. Liu, D. Guo, M. Ott, C.L. Zitnick, J. Ma, & R. Fergus, Biological structure and function emerge from scaling unsupervised learning to 250 million protein sequences, Proc. Natl. Acad. Sci. U.S.A. 118 (15) e2016239118, https://doi.org/10.1073/pnas.2016239118 (2021).
Conor J Howard, Nathan S Abell, Beatriz A Osuna, Eric M Jones, Leon Y Chan, Henry Chan, Dean R Artis, Jonathan B Asfaha, Joshua S Bloom, Aaron R Cooper, Andrew Liao, Eden Mahdavi, Nabil Mohammed, Alan L Su, Giselle A Uribe, Sriram Kosuri, Diane E Dickel, Nathan B Lubock (2025) High-resolution deep mutational scanning of the melanocortin-4 receptor enables target characterization for drug discovery eLife 13:RP104725. https://doi.org/10.7554/eLife.104725.3
Lohmann, F., Allenspach, S., Atz, K., Schiebroek, C. C. G., Hiss, J. A., & Schneider, G. (2024). Protein Binding Site Representation in Latent Space. Molecular Informatics, 44(1), e202400205. https://doi.org/10.1002/minf.202400205
Sources:
Part A:
Biochemistry book- Avogadro’s number: https://ecampusontario.pressbooks.pub/enhancedchemistry/chapter/molecular-mass/
Part C3. AlphaFold recommended lectures:
Jannik Adrian Gut, Thomas Lemmin, Dissecting AlphaFold2’s capabilities with limited sequence information, Bioinformatics Advances, Volume 5, Issue 1, 2025, vbae187, https://doi.org/10.1093/bioadv/vbae187 Open Access
→ Explains limitations in multiple sequence alignment (MSA).
Liu, J., Neupane, P. & Cheng, J. Boosting AlphaFold protein tertiary structure prediction through MSA engineering and extensive model sampling and ranking in CASP16. Commun Biol 8, 1587 (2025). https://doi.org/10.1038/s42003-025-08960-6 Open Access
→ Explains the low coverage on Sequence Coverage Maps
Veit, M., Gadalla, M. R., & Zhang, M. (2022). Using Alphafold2 to Predict the Structure of the Gp5/M Dimer of Porcine Respiratory and Reproductive Syndrome Virus. International Journal of Molecular Sciences, 23(21), 13209. https://doi.org/10.3390/ijms232113209 Open Access
→ Explains pLDDT and confidence score
Extras papers:
Bertoline LMF, Lima AN, Krieger JE and Teixeira SK (2023) Before and after AlphaFold2: An overview of protein structure prediction. Front. Bioinform. 3:1120370. doi: 10.3389/fbinf.2023.1120370 https://doi.org/10.3389/fbinf.2023.1120370 OPEN ACCESS
David, A., Islam, S., Tankhilevich, E., & Sternberg, M. J. E. (2022). The AlphaFold Database of Protein Structures: A Biologist’s Guide. Journal of molecular biology, 434(2), 167336. https://doi.org/10.1016/j.jmb.2021.167336 OPEN ACCESS