Week 6 HW: Genetic circuits part I
Genetic circuits part I: Assembly Technologies

Note Part 1–> At Lab section: week 6
Part 2: Asimov Kernel
Based on the exploration of the Bacterial Demos repository, genetic circuits were analyzed and simulated with the use of the Asimov Kernel platform.
The Bacterial Demos repository was explored to understand how synthetic genetic circuits function. Different constructs were simulated using the built-in simulator, which displays protein expression over time. These simulations allow visualization of regulatory interactions such as repression and feedback, and how they influence gene expression dynamics.
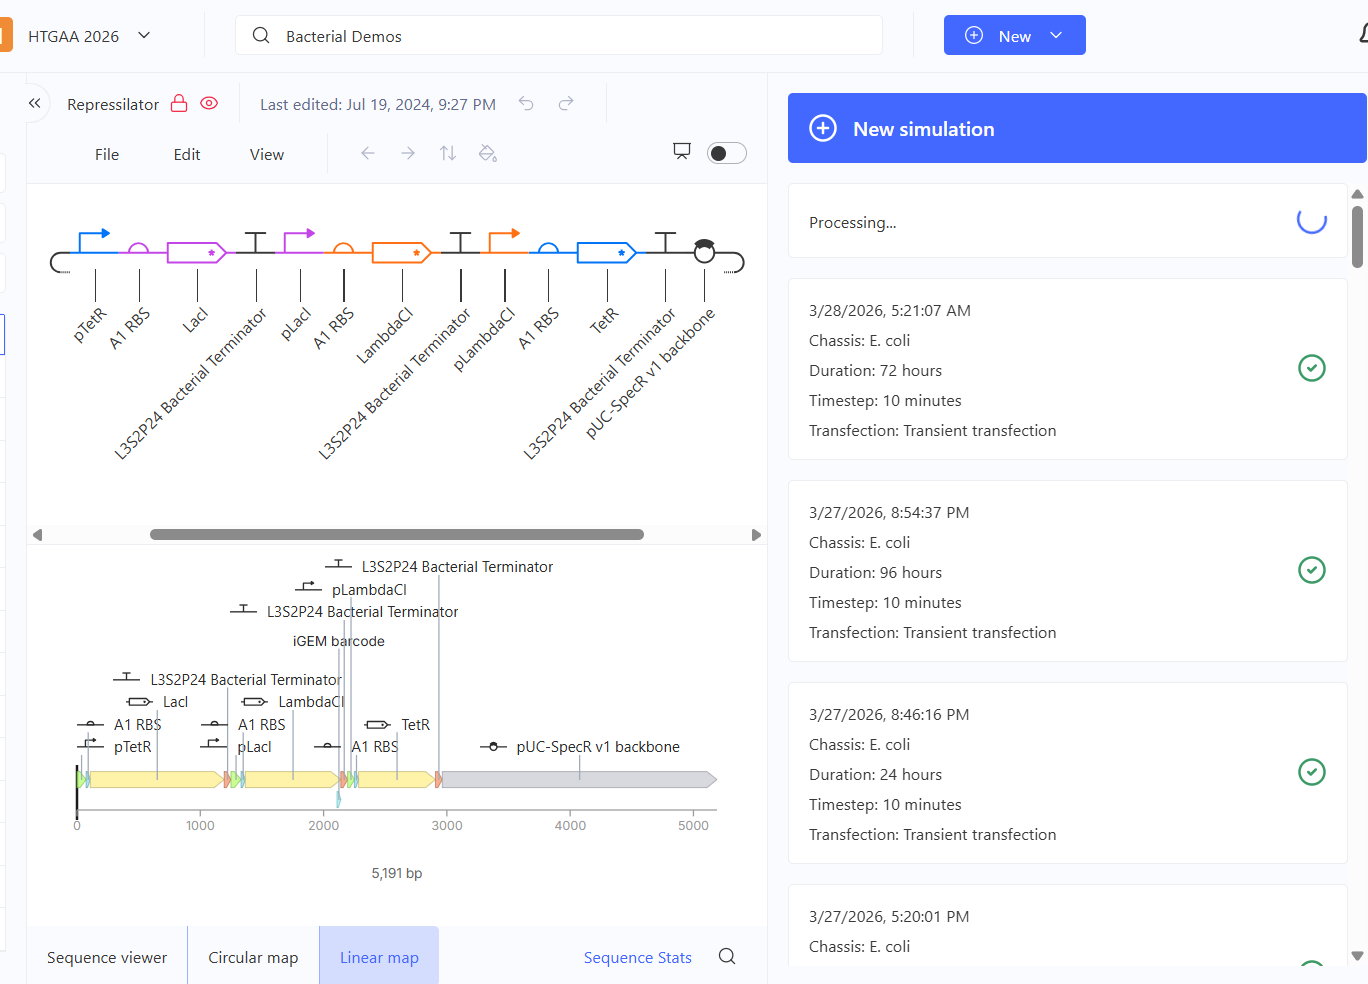
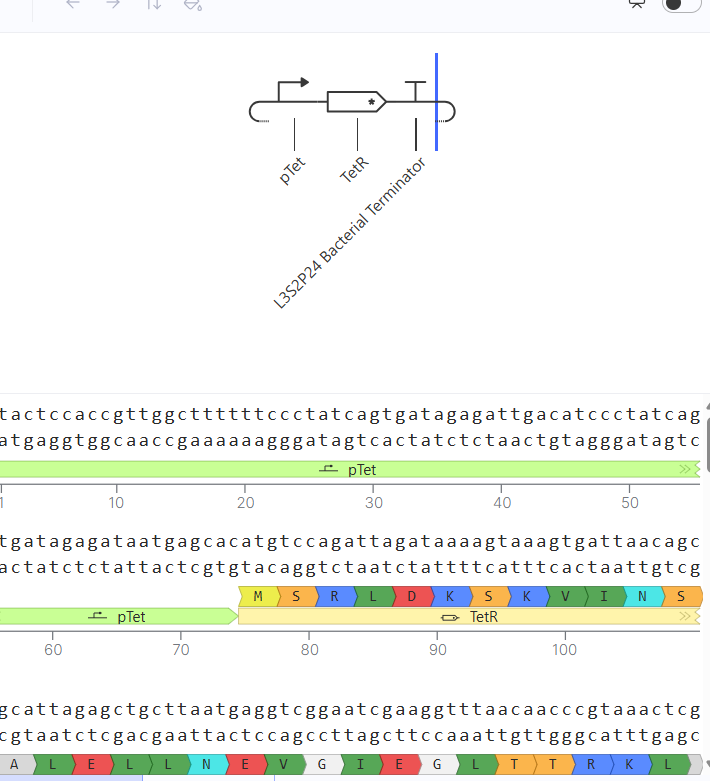
Figure 1. Demonstration of Bacterial Demo’s runtime and identification of the components
Creating a construct:
The platform provides an interface to design genetic constructs by combining modular biological parts. The logic of a basic construct follows the structure:
Promoter → Gene → Terminator
Each component plays a specific role in gene expression. The parts used for this example are shown in Table 1.
Table 1. Construct components
| Type | Function | Use |
|---|---|---|
| pTet | promoter | Initiates transcription; regulated by TetR |
| A1 RBS | Ribosome binding site | Enables translation of the gene |
| TetR | Coding sequence | Encodes a repressor protein |
| L3S2P24 | Bacterial Terminator | Stops transcription |
(Brophy et al., 2014; Letrari et al., 2026)
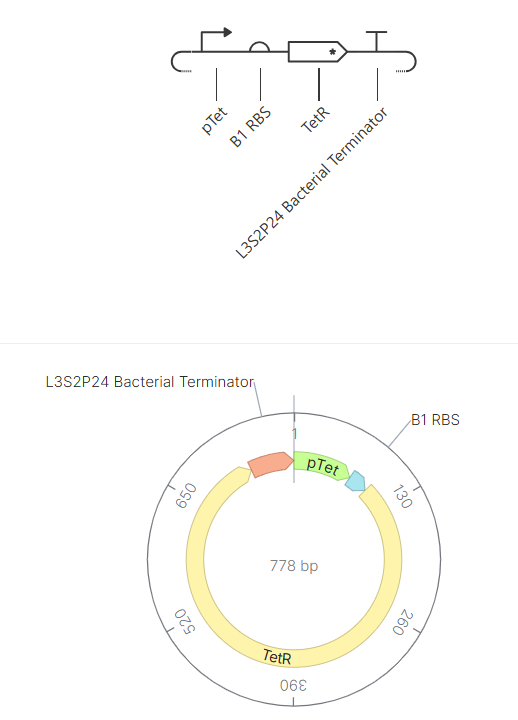
As it was shown, this construct consists of a promoter (pTet), a ribosome binding site (RBS), the TetR coding sequence, and a terminator. The promoter initiates transcription, while the RBS enables translation of the TetR protein. The TetR protein represses the pTet promoter, forming a negative feedback loop. This regulatory interaction stabilizes gene expression and prevents overproduction of the protein.
- Kernel Tutorial
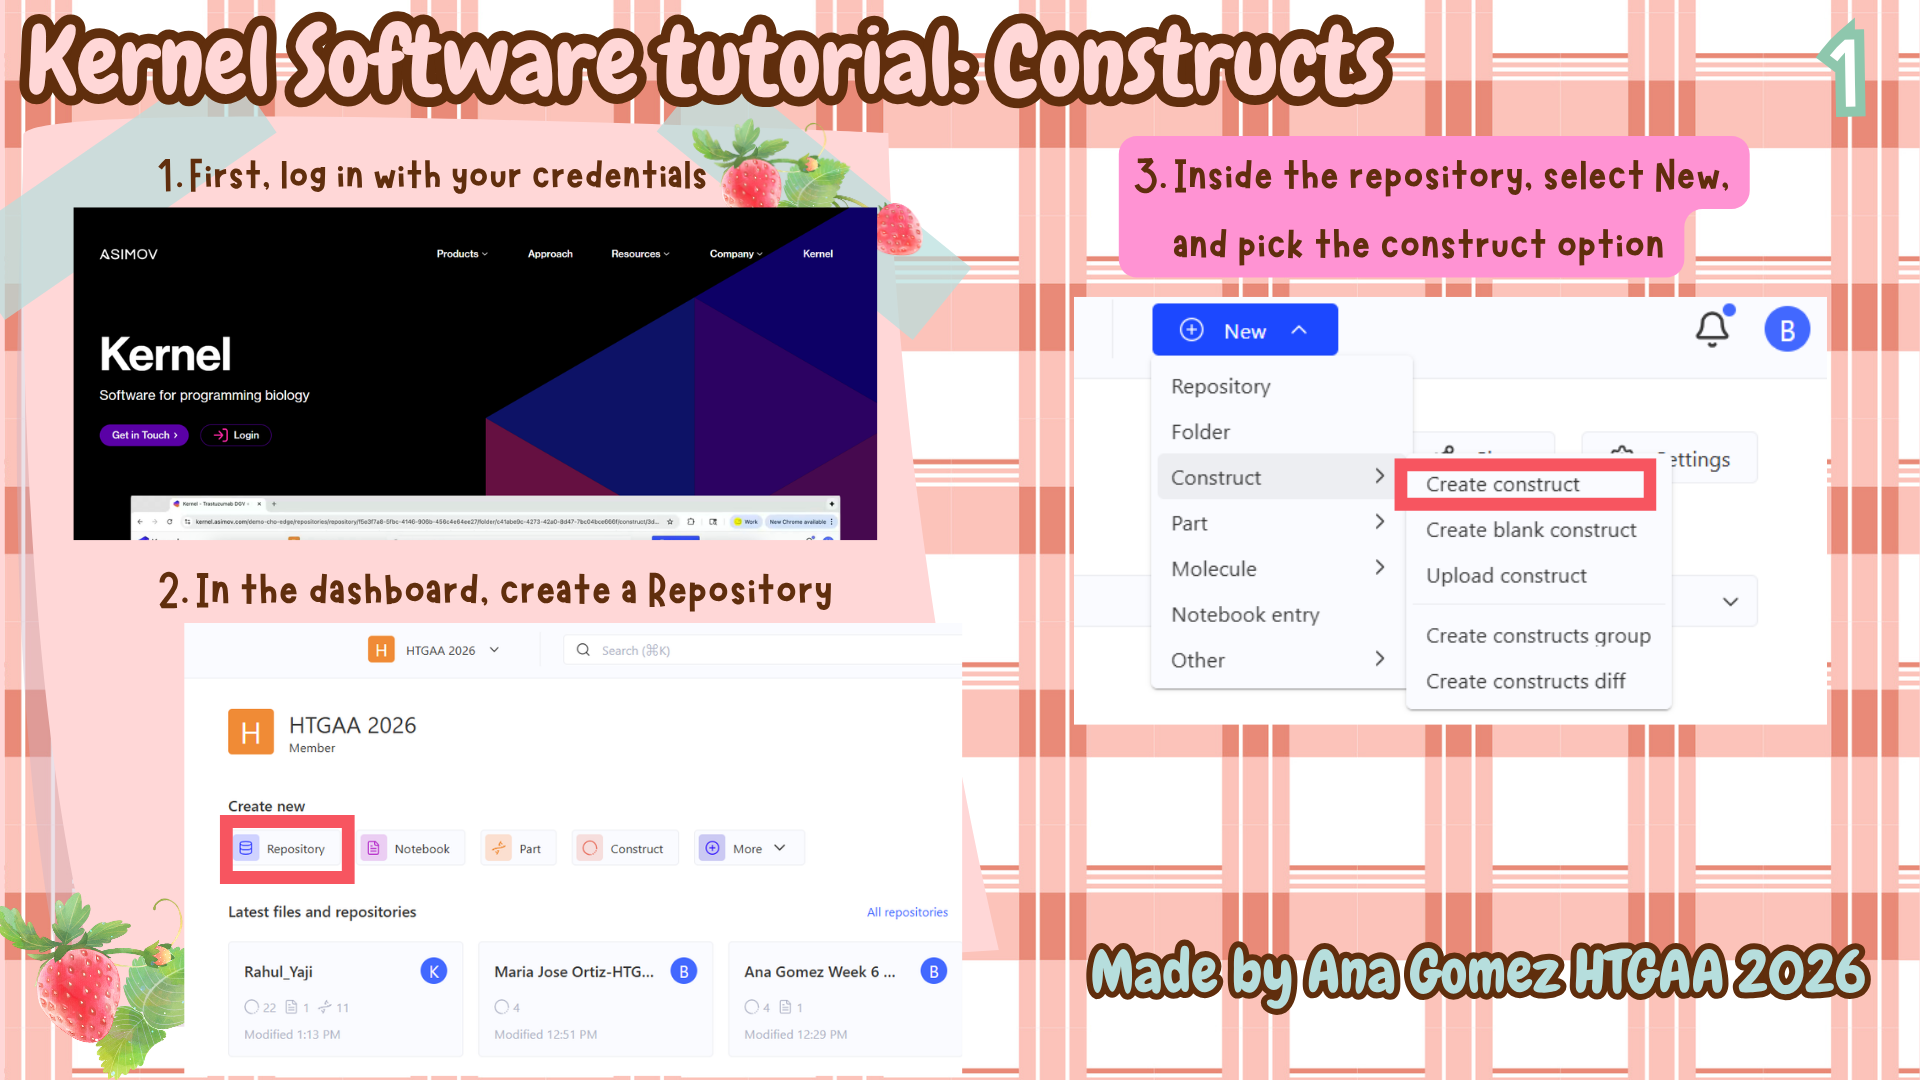
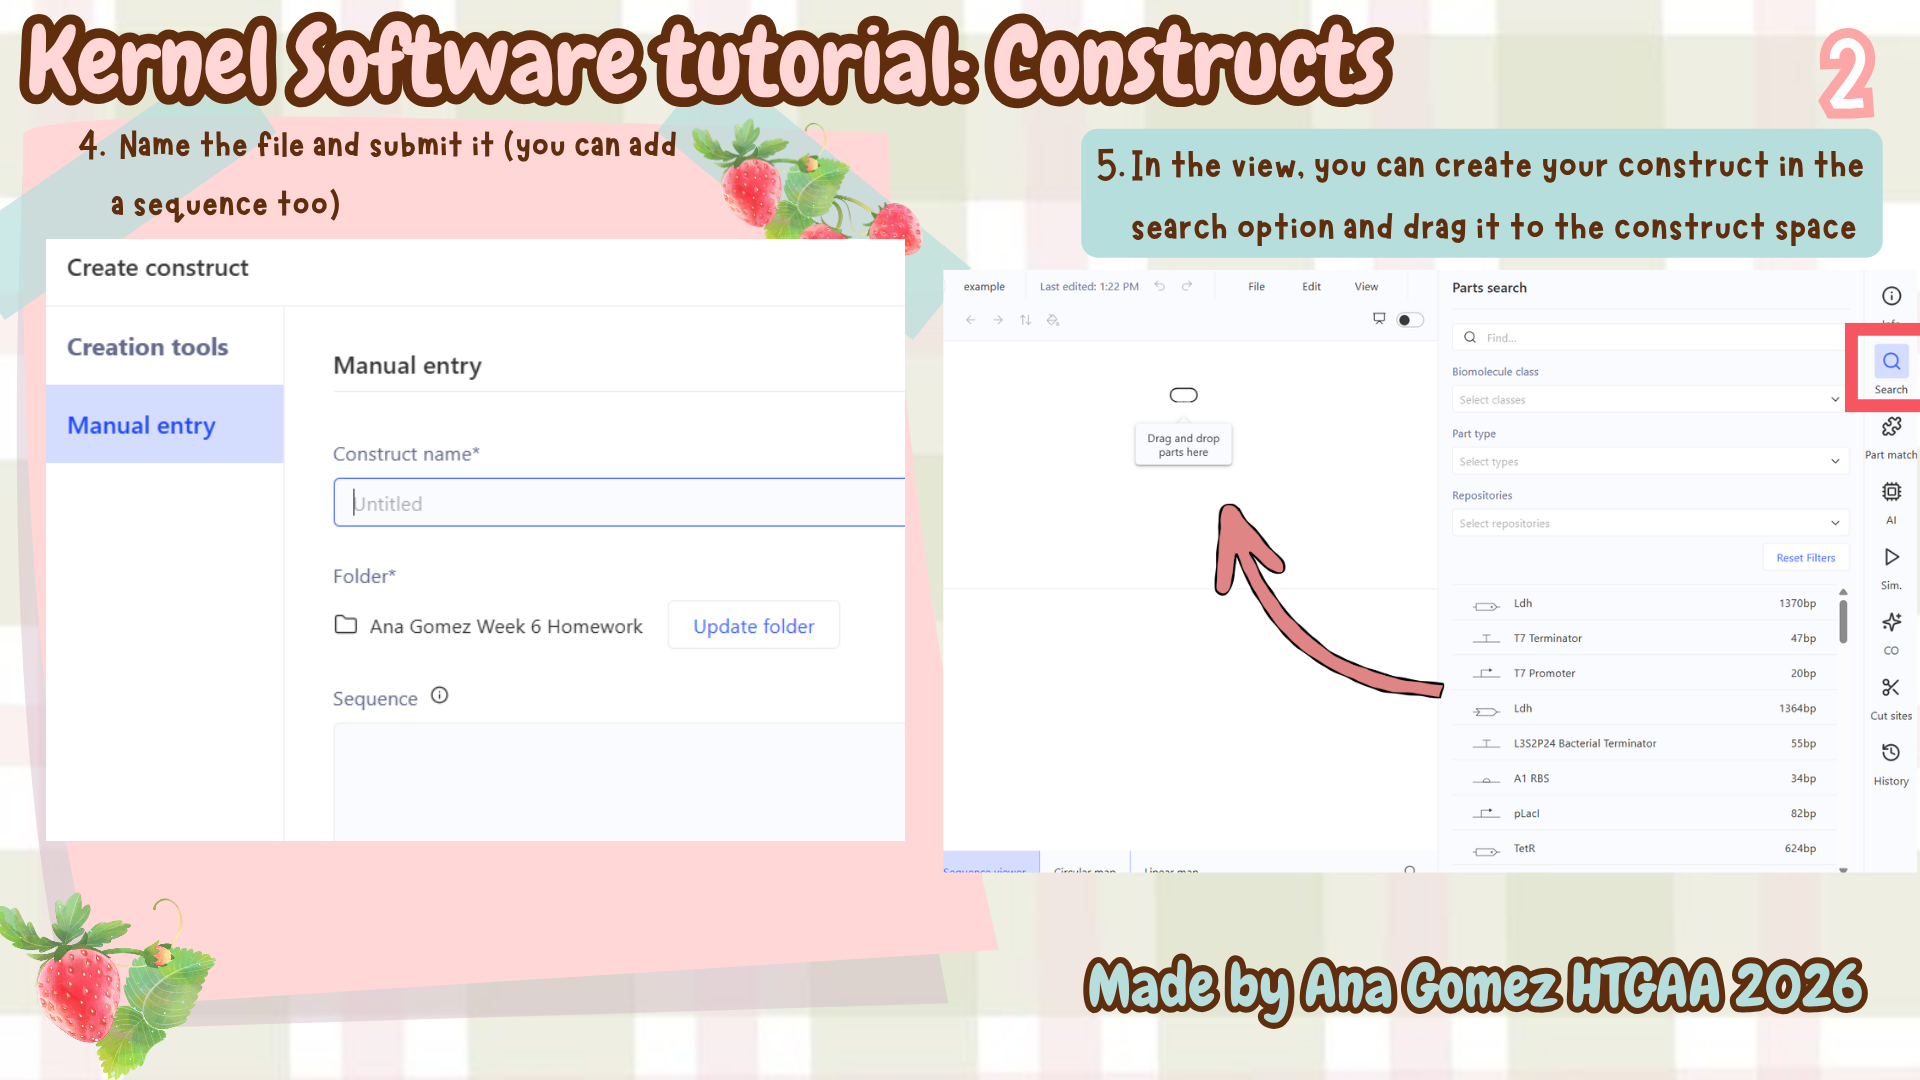
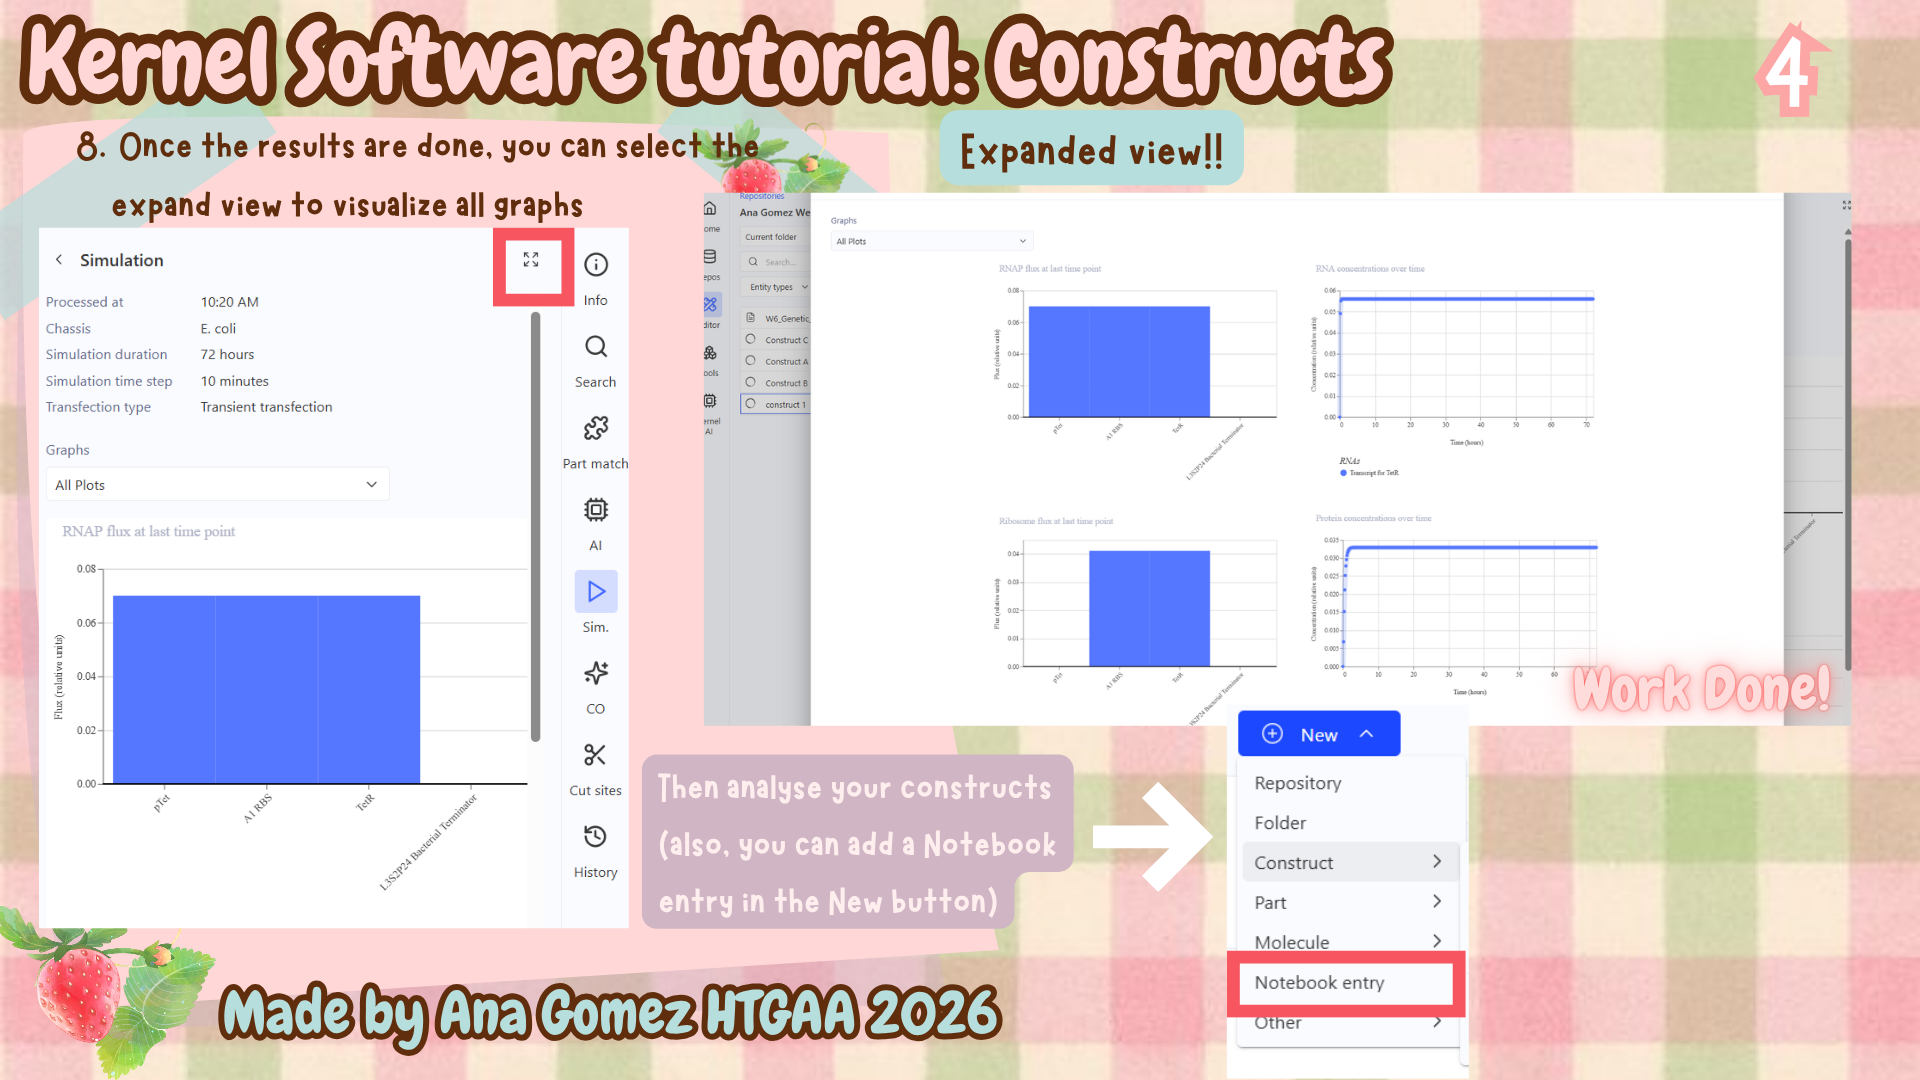
Additional: To download the file, click here Kernel tutorial
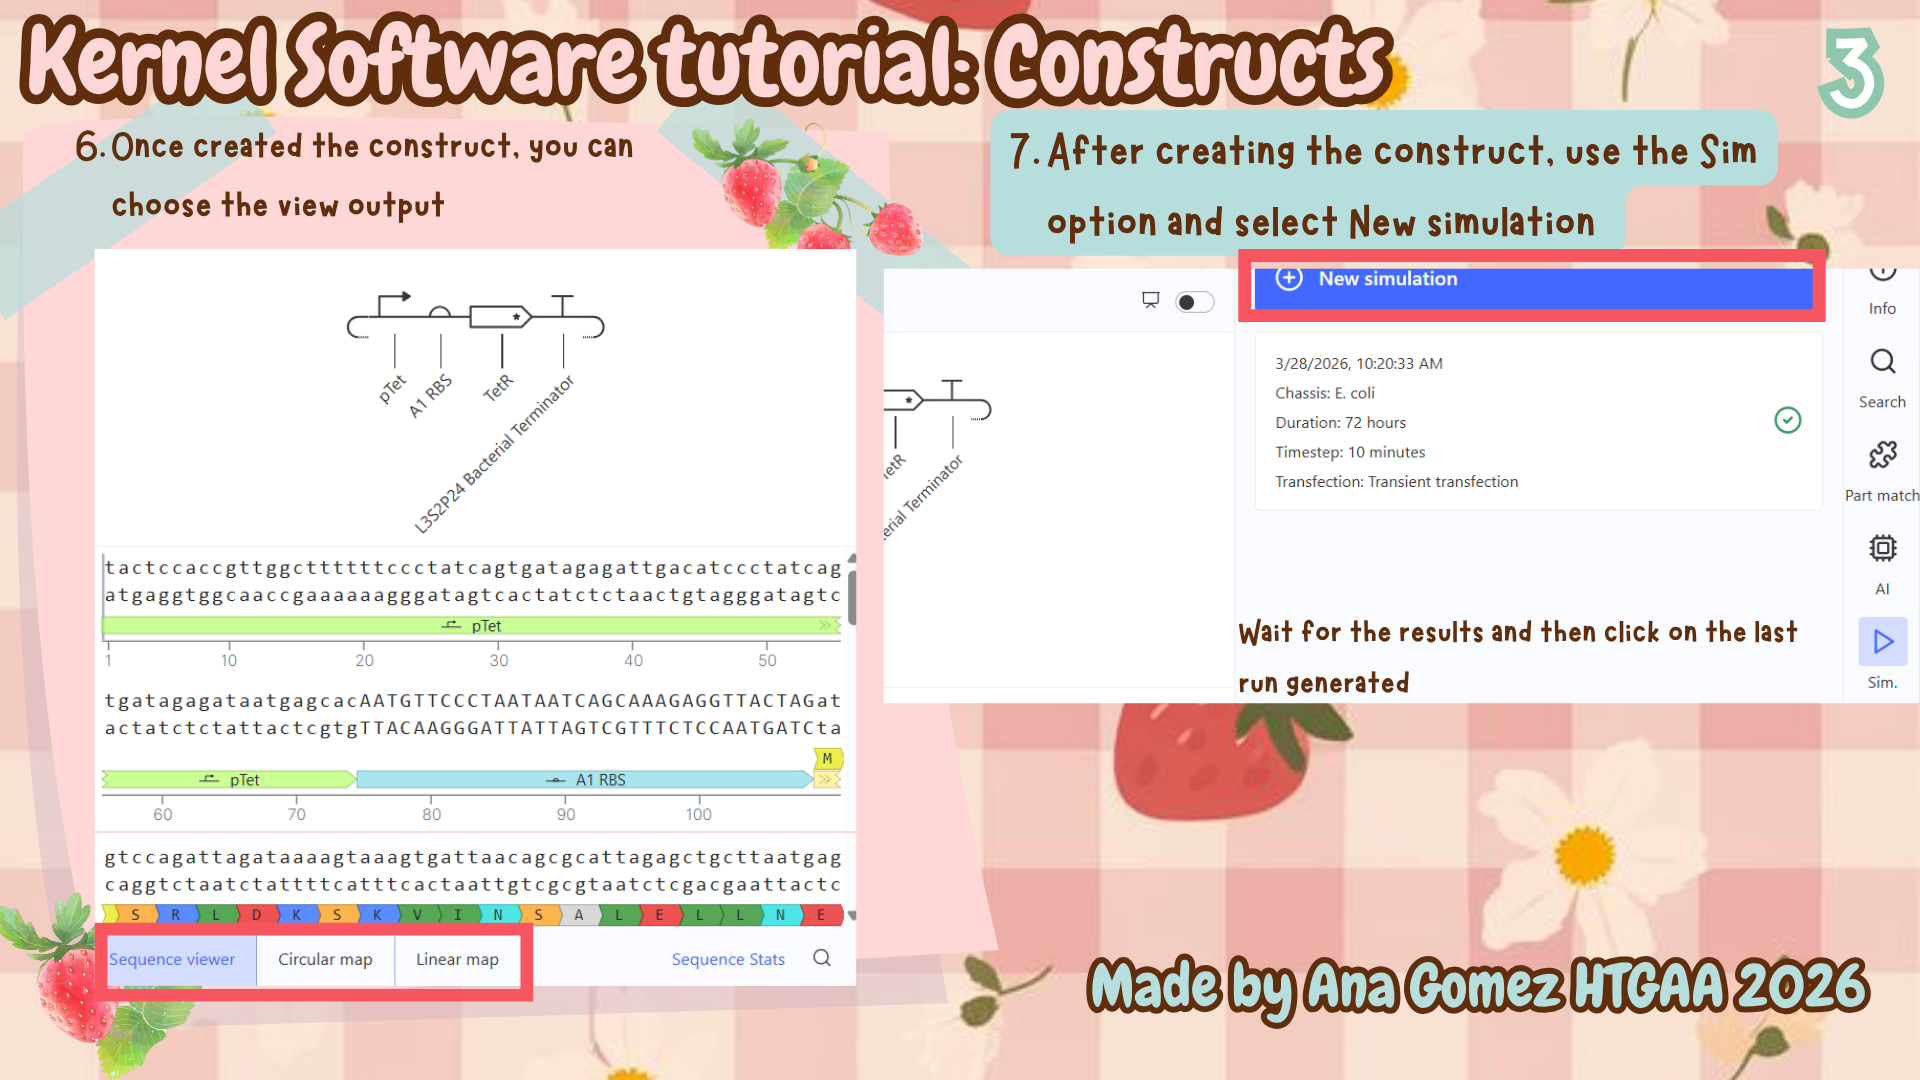
Simulation and results:
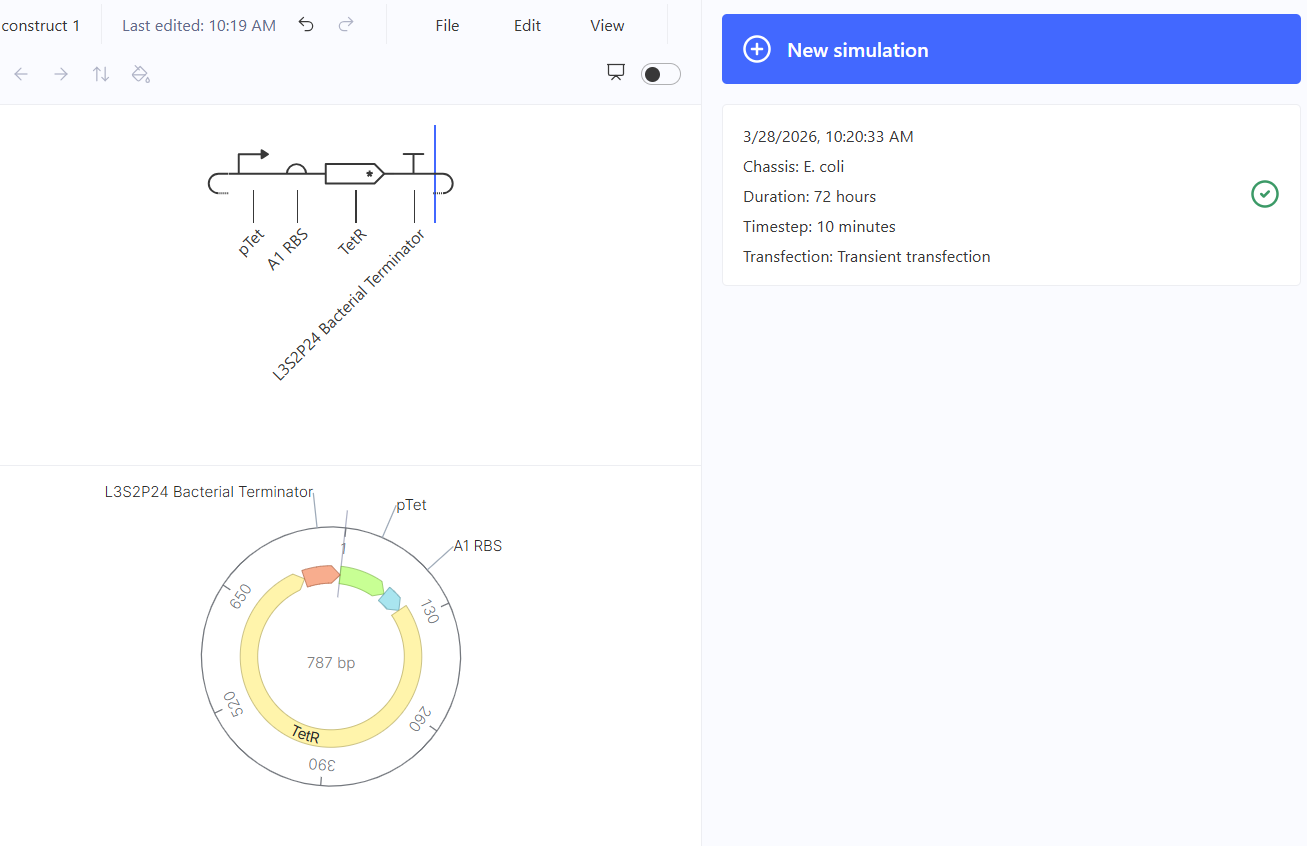
Figure 2. Final construct and runtime
To evaluate the behavior of the constructed genetic circuit (787 bp), a simulation was performed under E. coli conditions for 72 hours with a timestep of 10 minutes.
The simulation successfully ran and showed that the construct exhibits negative feedback regulation. In this system, the pTet promoter drives the expression of TetR, while the TetR protein represses the same promoter.
This feedback loop allows the system to regulate its own expression levels, preventing excessive production of the protein and stabilizing the overall behavior of the circuit.
New Constructs
For the following constructions, three different genetic circuit behaviors were designed: a simple expression system, a toggle switch, and a negative feedback loop.
1) Construct A: Simple gene expression system
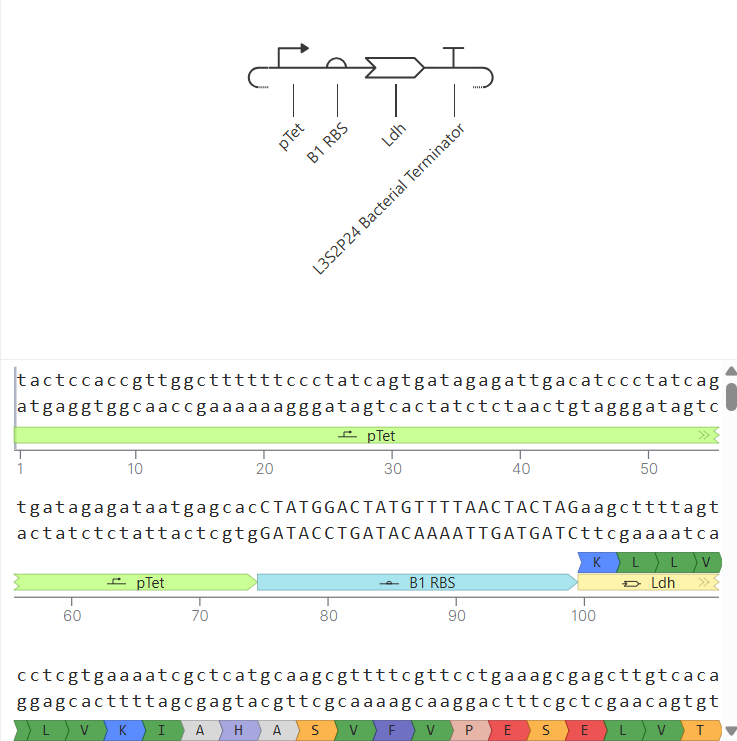
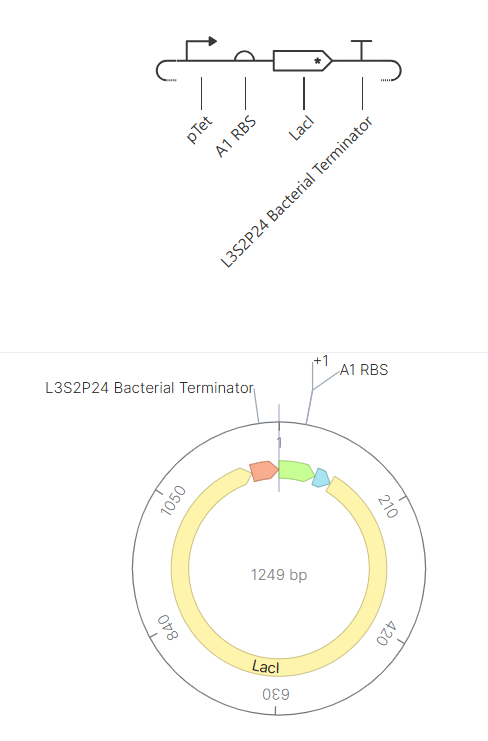
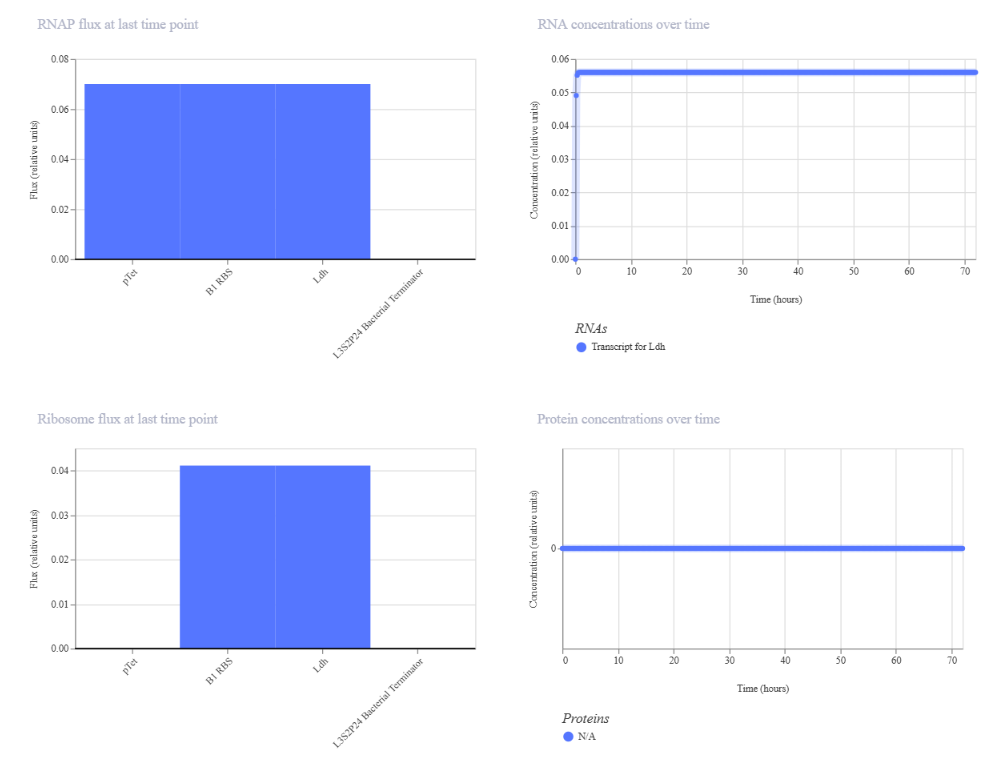
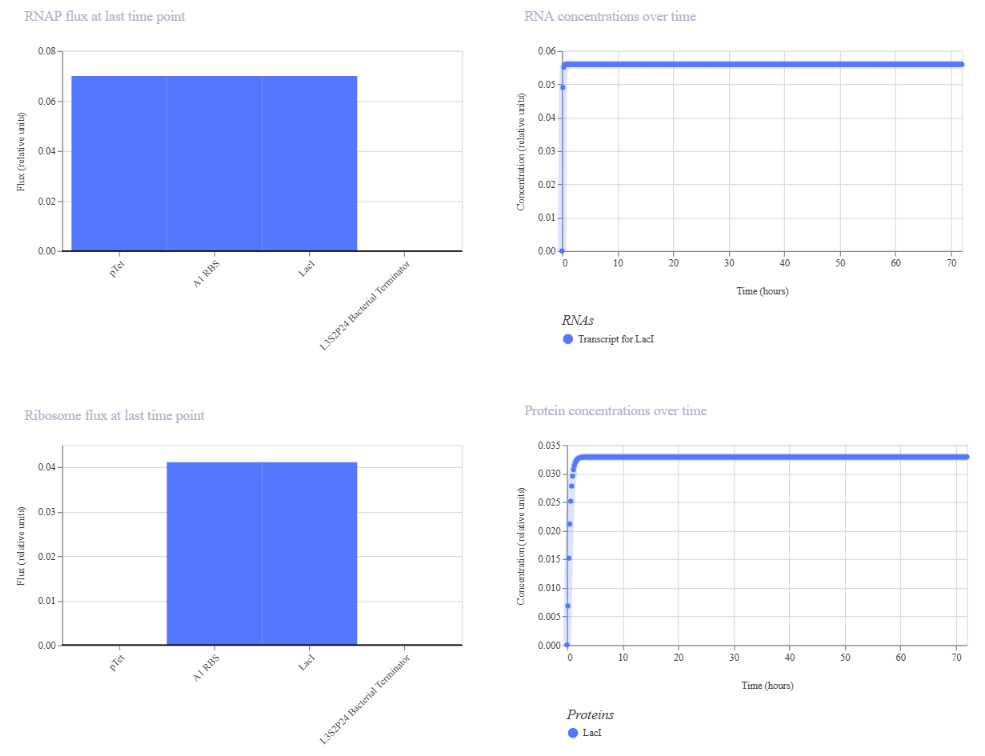
Construct A was designed as a basic gene expression system. Its purpose was to test whether a promoter, a ribosome-binding site (RBS), and a coding sequence could produce a stable, detectable protein output in the simulator. The use of LacI as the coding sequence allowed clear visualization of both RNA and protein production, making this construct a useful baseline model.
During the initial design, the construct included an LDH sequence. However, after simulation, the results showed protein output as N/A, despite detectable RNA levels. This suggested that either the sequence was not properly recognized by the simulator or that translation was not occurring efficiently.
To address this, the LDH sequence was replaced with LacI, a well-characterized transcriptional repressor from the lac operon in molecular biology. After this correction, the simulation successfully displayed both RNA and protein production, confirming that the construct was functional.
| Construct A (LDH) | Construct A (LacI) |
|---|---|
| 
|
| 
|
| Initial LDH construct (no detectable protein) | Corrected LacI construct (protein detected): the results are shown after modifications |
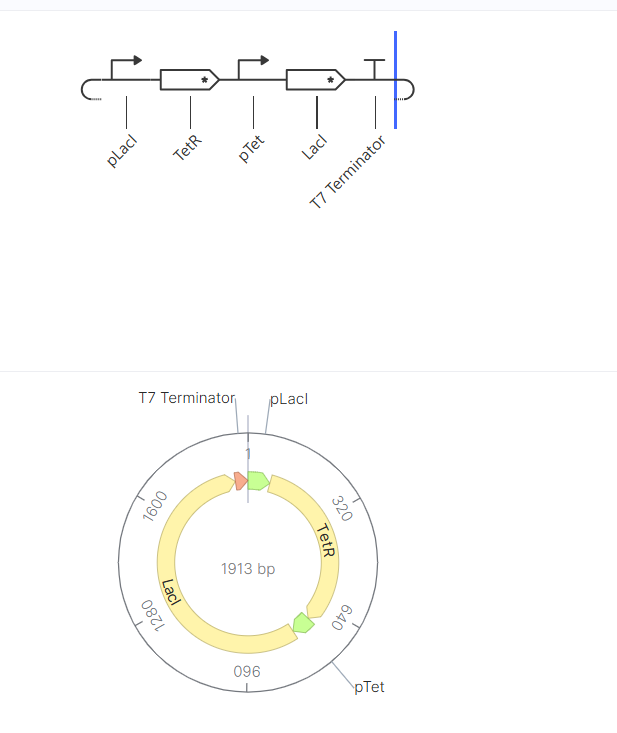
2) Construct B: Toggle switch
Construct B was designed to represent a toggle switch, a bistable genetic circuit based on mutual repression between two genes.
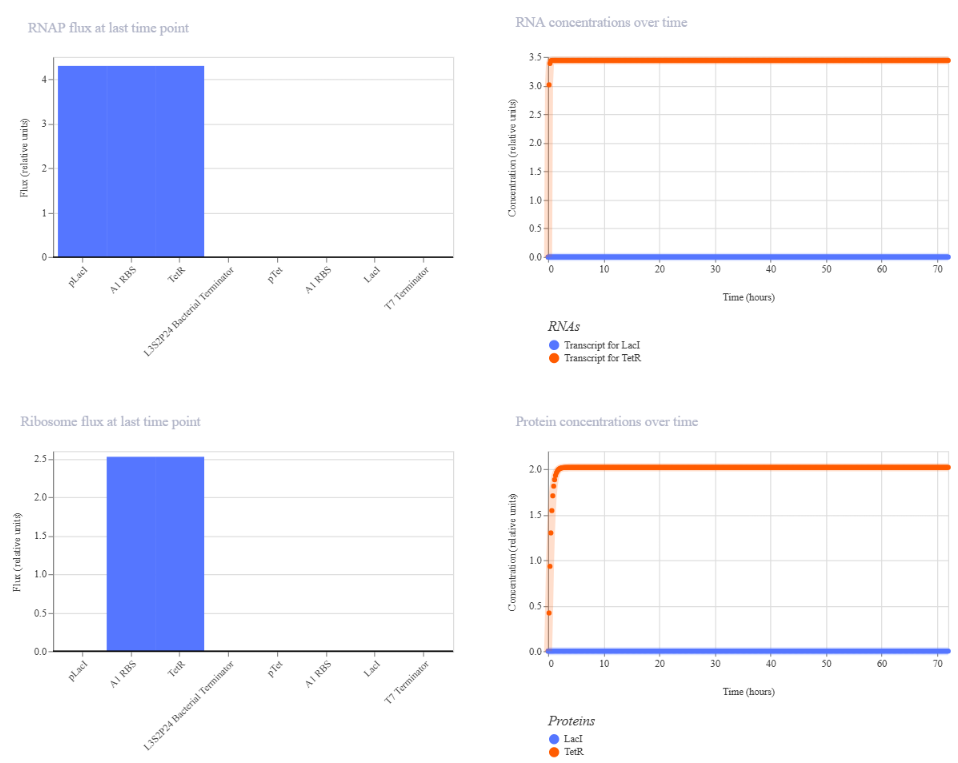
In this system, two regulatory proteins (TetR and LacI) repress each other’s expression. This creates a circuit where only one gene remains active while the other is suppressed. The goal of this construct was to demonstrate how gene regulation can produce stable ON/OFF states.
The simulation results showed a TetR-high and LacI-low state, indicating that one branch of the circuit dominated while the other was repressed. This behavior is consistent with the expected functionality of a toggle switch.
| Construct B | Results |
|---|---|
| 
|
3) Construct C: Negative feedback loop
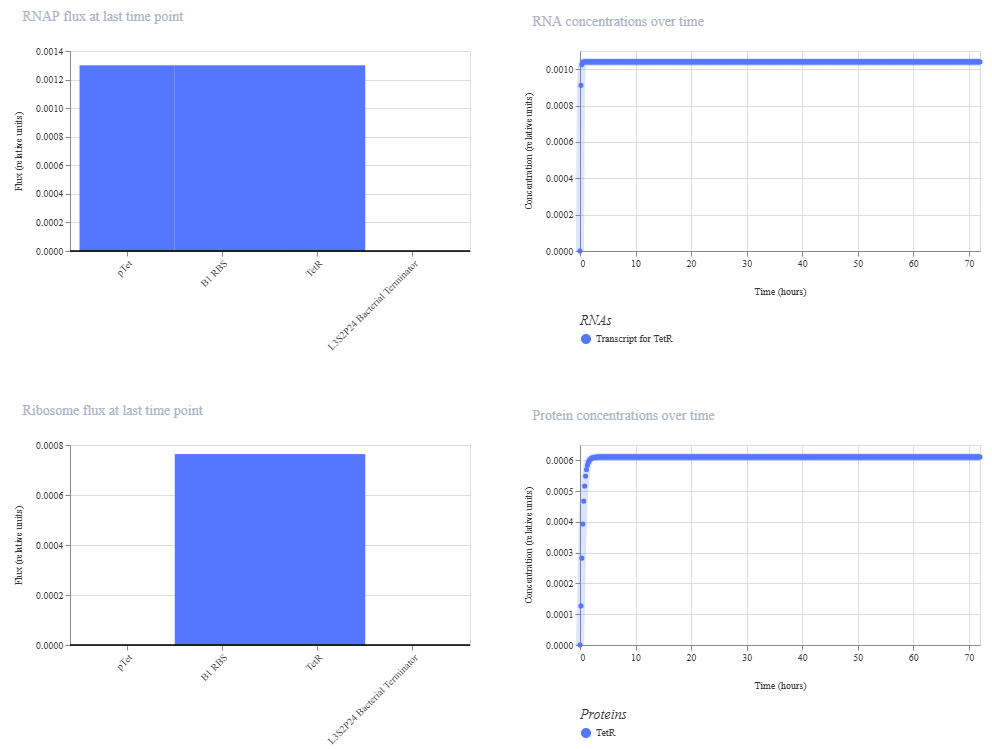
Construct C was designed to represent a negative feedback loop, a common regulatory mechanism used to stabilize gene expression.
In this circuit, the promoter pTet drives the expression of TetR, while the TetR protein represses the same promoter. This creates a self-regulating system that prevents excessive protein production.
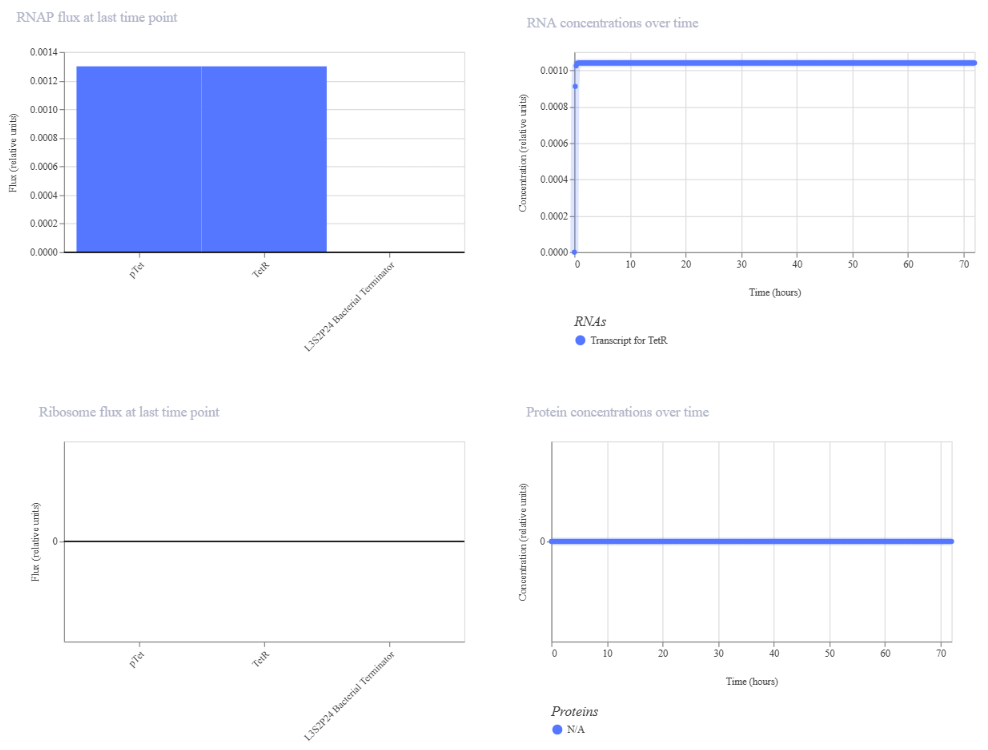
Similar to Construct A, the initial version of this construct did not show detectable protein (N/A), likely due to issues in translation efficiency or missing regulatory elements. After adjusting the design to include a proper RBS binding configuration, the simulation successfully showed both RNA and protein production.
The final results demonstrate that the circuit achieves controlled expression through autoregulation.
| Construct C (Before) | Construct C (After) |
|---|---|
| 
|
| 
|
| The absence of RBS shows the null protein concentration | After corrections (RBS added) |
Conclusion:
The design and simulation of these genetic constructs demonstrate how different circuit architectures can control gene expression in bacterial systems.
Construct A illustrates basic gene expression, Construct B demonstrates bistability through mutual repression, and Construct C shows how negative feedback can regulate and stabilize protein production.
Additionally, the comparison between initial and corrected designs highlights the importance of using well-characterized genetic parts and proper translational elements, such as RBS sequences, to achieve functional expression in synthetic biology models.
To review the full implementation and simulations, please visit my Kernel repository:
Kernel project W6 Ana Gomez Homework | link: https://kernel.asimov.com/htgaa-2026/repositories/repository/440a19d2-933b-4a1a-a9de-b8c505109adb
Extra:
Interpretation of the graphics:
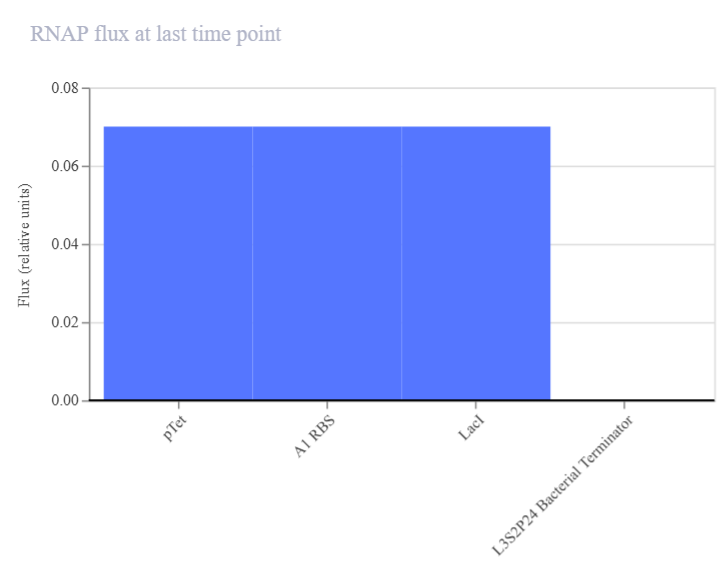
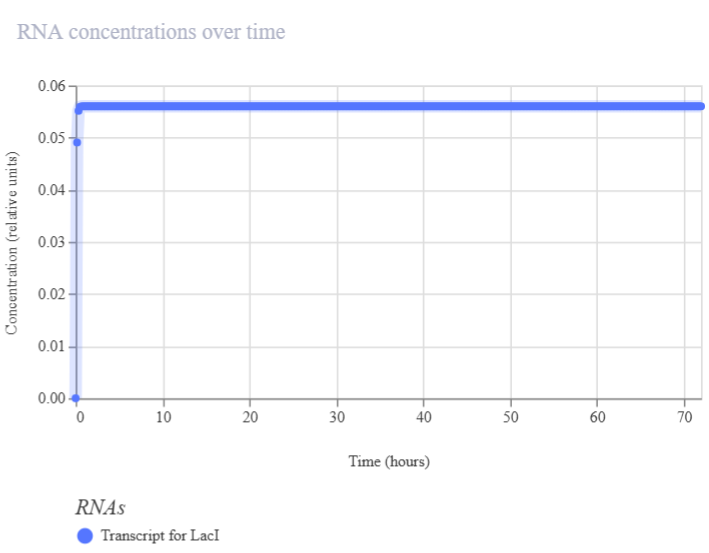
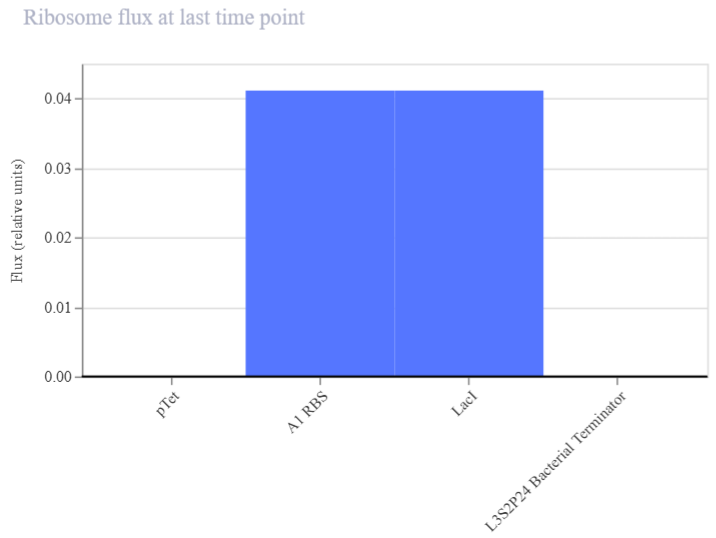
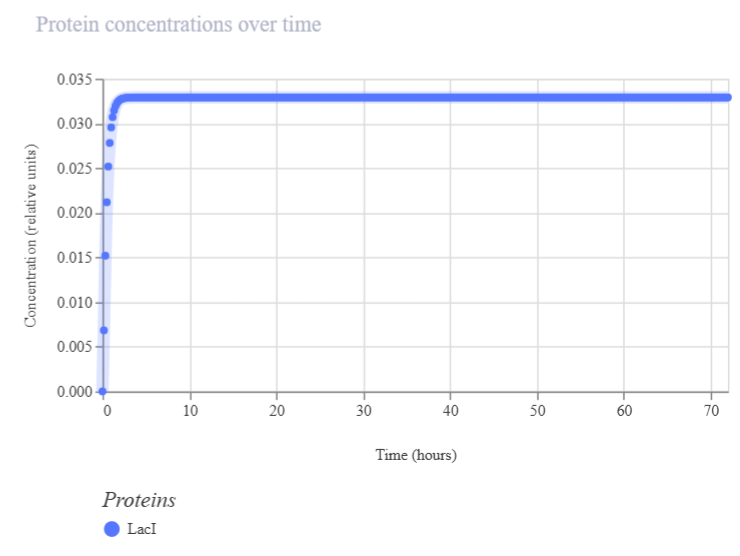
The four simulation plots represent different stages of gene expression. RNAP flux indicates transcriptional activity, RNA concentration reflects mRNA production over time, ribosome flux represents translation efficiency, and protein concentration shows the final output of the genetic circuit. Together, these plots allow visualization of how genetic regulation occurs from DNA to functional protein.
Table 2. Summary of graphics
| Type of graphic | Analysis level | What does it represent? | How to interpret it | Output view |
|---|---|---|---|---|
| RNAP flux | DNA → RNA | Promoter activity (transcription rate) | High bars: active gene transcription. Low bars: weak or inactive transcription | Bar chart showing transcription strength for each gene (e.g., pTet → LacI). Figure 2A1 |
| RNA concentration | RNA | mRNA production over time | Increasing curve: gene activation. Stable curve: steady-state expression. Low/flat: repression or degradation | Line plot of mRNA levels over time (e.g., LacI transcript). Figure 2A2 |
| Ribosome flux | RNA → Protein | Translation efficiency (RBS performance) | High bars: efficient translation. Low/zero: poor or no translation (possible RBS issue) | Bar chart showing translation rate of each transcript. Figure 2A3 |
| Protein concentration | Protein | Final protein output over time | Increasing curve: active protein production. Stable: equilibrium. Oscillations: regulatory dynamics. 0 or N/A: no protein detected | Line plot of protein levels over time (e.g., LacI protein). Figure 2A4 |
Figures:
| 
|
|---|---|
| Figure 2A1. RNAP flux (LacI construct A) | Figure 2A2. RNA concentration (LacI construct A) |
| 
|
|---|---|
| Figure 2A3. Ribosome flux (LacI construct A) | Figure 2A4. Protein concentration (LacI construct A) |

Weekly Reflection:
This week provided a deeper understanding of DNA assembly methods and synthetic biology design through both Benchling and Asimov Kernel tools.
Working with Benchling felt more intuitive, especially when organizing projects within notebooks and visualizing the assembly process step by step. The platform made it easier to understand how different DNA fragments are combined, particularly during Golden Gate and Gibson assembly workflows.
In contrast, the Asimov Kernel focused more on the functional behavior of genetic constructs rather than the assembly process itself. While it was initially less intuitive, it became very powerful for understanding how designed circuits behave dynamically inside a biological system.
One of the most interesting aspects of this week was realizing how genetic constructs function inside a bacterial chassis. From my perspective, a genetic construct can be compared to the engine of a car, while the bacterium represents the entire vehicle :D. This analogy helped me better understand that synthetic biology is not only about assembling DNA sequences, but about designing systems that can perform specific tasks in living organisms.
Update: March 28th, 2026: I got access to the Asimov Kernel platform from my node during this midterm week.
My Notion website that follows the same content as the HTGAA 2026 website: (Week 6 homework)
References & Sources:
Brophy, J. A., & Voigt, C. A. (2014). Principles of genetic circuit design. Nature methods, 11(5), 508–520. https://doi.org/10.1038/nmeth.2926
Letrari S, Faccincani L, Intini S, Ertan I, Varaschin T, Galiazzo F, Costanzo M, D’angelo G, Del Giudice V, Guarnieri L, Martini A, Picchi A, Ravazzolo C, Venturini Degli Esposti N, Zanin C, Trainotti L, De Pittà C, Del Vecchio C, Castagliuolo I and Bellato M (2026) A synthetic biology toolkit for rationally designing genetic circuits in Acinetobacter baumannii. Front. Syst. Biol. 5:1668595. doi: 10.3389/fsysb.2025.1668595