Week 10: Imaging and measurement

Week 10: Advanced Imaging & Measurement Technology
Homework: Waters Part I — Molecular Weight
Before calculation, I visited the webpage from Expasy https://web.expasy.org/compute_pi/ and copied the sequence I am working on:
eGFP sequence:
Where it contains at the end His-purification tag with (HHHHH) and a linker (LE) previously.
Then I enter Expasy for the calculation pI/Mw: This allows estimation of the theoretical molecular weight of the protein based on its amino acid sequence, which is later used as a reference to evaluate the accuracy of the experimental mass spectrometry results.
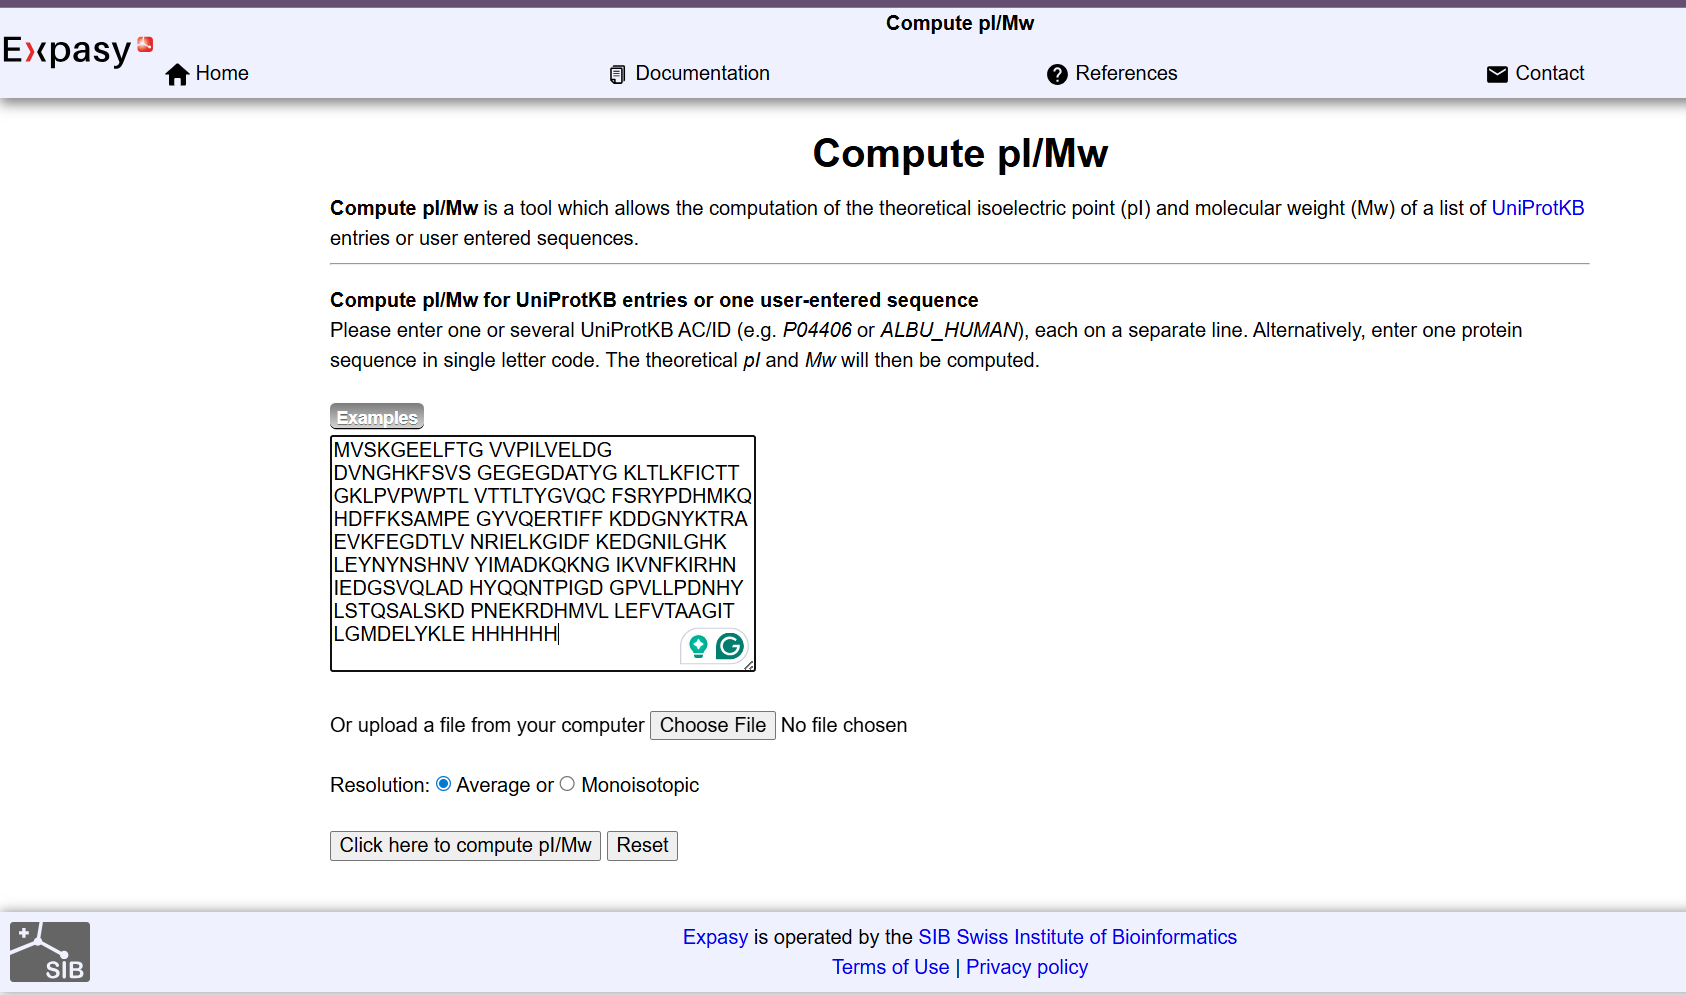
| It determined the average Theoretical pI/Mw: 5.90 / 28006.60 |
Peak selection
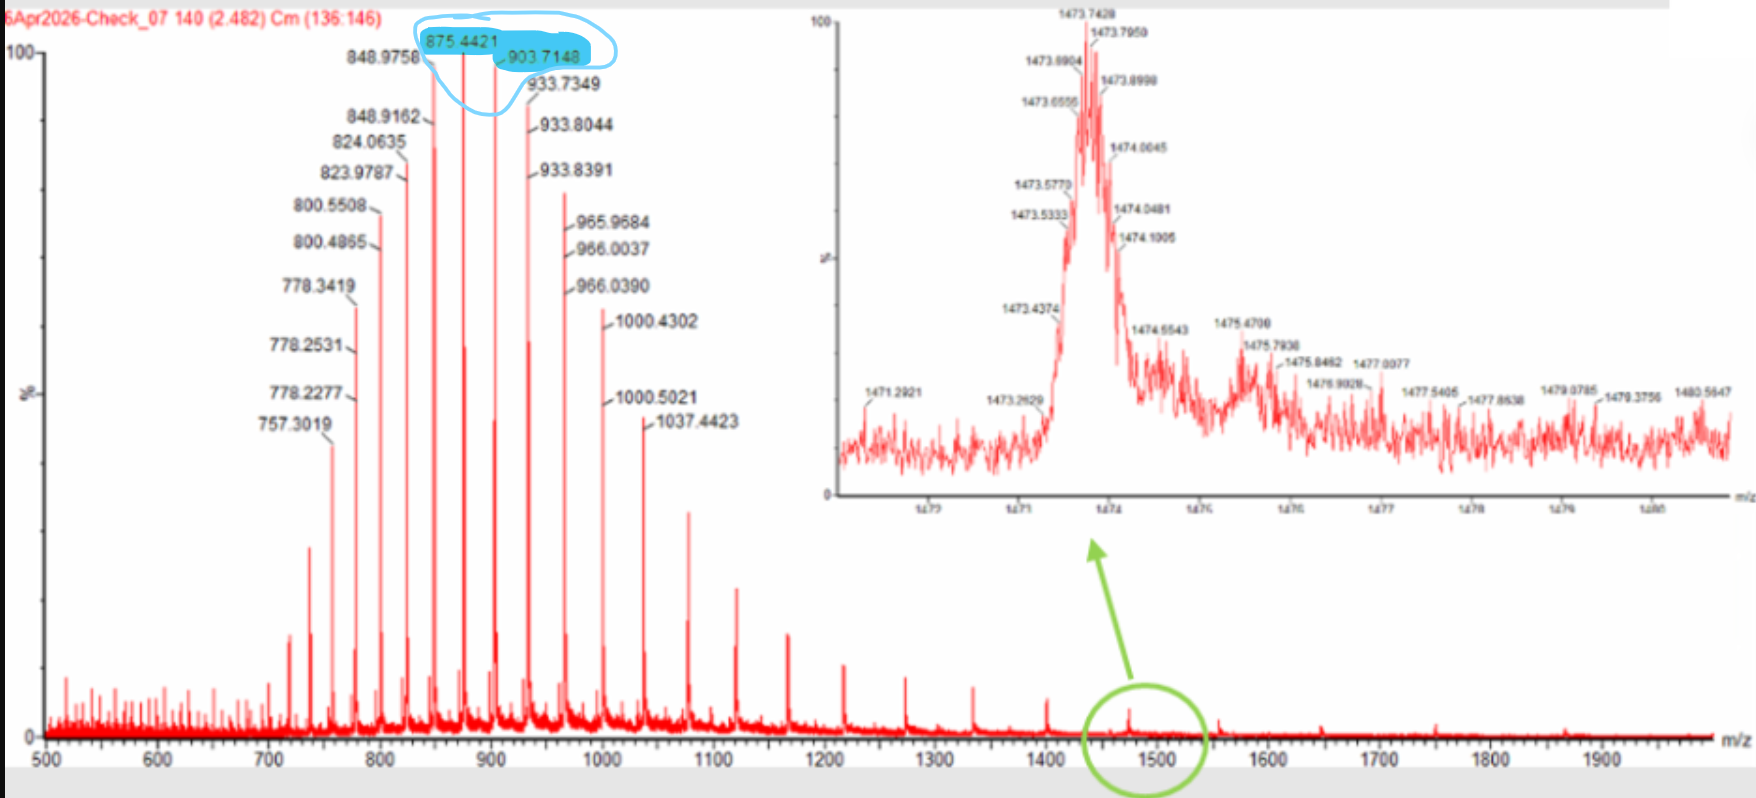
Two adjacent charge-state peaks were selected from Figure 1 at 903.7148 and 875.4421 m/z. Using the adjacent charge-state equation,
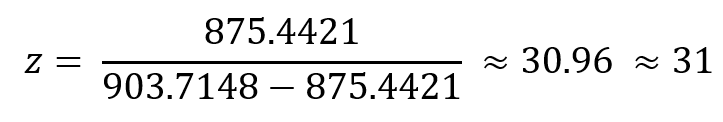
therefore, the peak at 903.7148 m/z corresponds to charge state 31+ , and the peak at 875.4421 m/z corresponds to 32+.
The molecular weight was then calculated as:

The experimental molecular weight shows strong agreement with the theoretical value obtained from ExPASy (28006.60 Da), indicating high measurement accuracy.
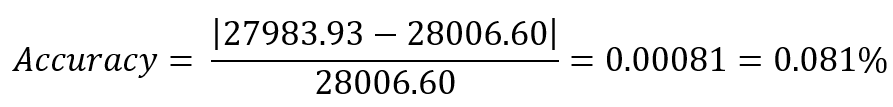
which corresponds to 0.081% error.
- Can you observe the charge state for the zoomed-in peak in the mass spectrum for the intact eGFP? If yes, what is it? If not, why not?
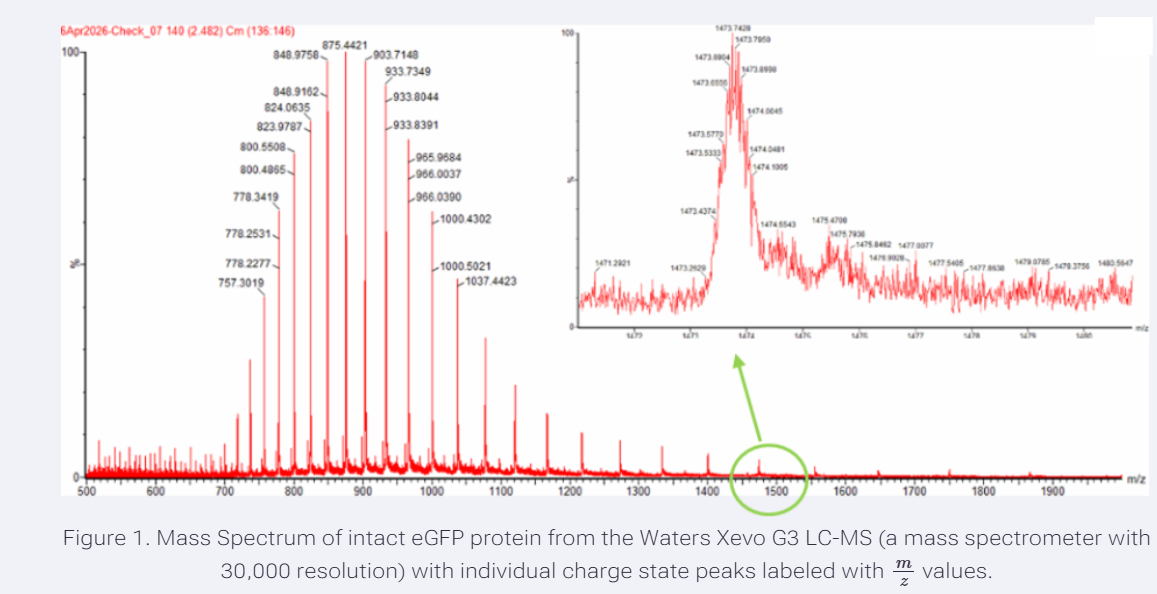
Yes, the charge state can be determined from the zoomed-in peak. In the inset, individual isotopic peaks are clearly resolved, and the spacing between them corresponds to approximately 1/z. Since the observed spacing between isotopic peaks is very small, this indicates a relatively high charge state. By measuring the distance between adjacent isotopic peaks, the charge state can be estimated.
However, if the resolution were insufficient, it would not be possible to determine the charge state because the isotopic peaks would overlap and appear as a single broad signal.
Additionally:
For the full calculations, please read the “Source section” at the bottom of the webpage!
Waters Part II — Secondary/Tertiary structure
In this section, it is important to recognize the difference between native and denatured proteins and how this is reflected in the mass spectrum.
Proteins in their native state maintain a compact, folded conformation stabilized by non-covalent interactions such as hydrogen bonds, hydrophobic interactions, and ionic forces. In this state, fewer ionizable sites are exposed to the solvent, resulting in lower protonation during mass spectrometry analysis (1).
In contrast, denatured proteins lose their secondary and tertiary structure due to the influence of solvents, pH, or temperature. This unfolding exposes a greater number of basic residues (such as lysine and arginine), allowing the protein to acquire more charges (1,2).
In mass spectrometry, this difference is reflected in the charge state distribution. Native proteins typically exhibit lower charge states (smaller z values), which results in peaks at higher m/z values. Conversely, denatured proteins display higher charge states due to increased protonation, producing peaks at lower m/z values (1,3).
When comparing the spectra in Figure 2, clear differences can be observed between the denatured and native states of eGFP. The denatured spectrum (top, green) shows a broad distribution of peaks across lower m/z values, indicating a wide range of high charge states due to protein unfolding and increased protonation.
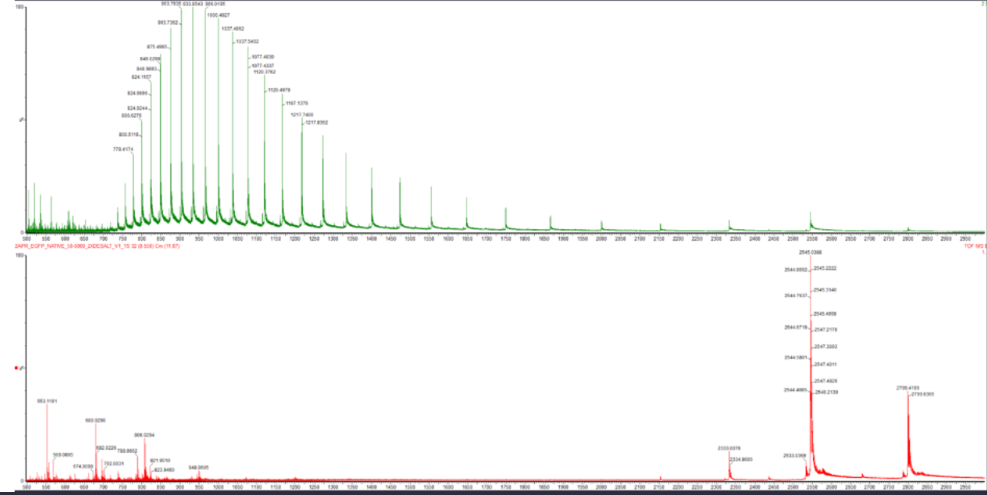
Figure 2. Comparison of native and denatured eGFP mass spectra.
In contrast, the native spectrum (bottom, red) displays fewer and more defined peaks at higher m/z values (~2500–2800), corresponding to lower charge states. This reflects a compact tertiary structure with limited solvent-accessible protonation sites.
These differences demonstrate how protein conformation directly influences charge state distribution in mass spectrometry.
Charge state
The charge state of the peak at approximately 2800 m/z can be estimated using the relationship between molecular weight and m/z. Given that the molecular weight of eGFP is approximately 28,000 Da, the charge state can be approximated as:
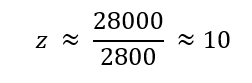
Therefore, the peak at ~2800 m/z corresponds to a charge state of approximately 10+.
This is consistent with the native state of the protein, where fewer charges are present due to its compact, folded structure.
Additionally:
For the full calculations, please read the “Source section” at the bottom of the webpage!
Waters Part III — Peptide Mapping - primary structure
For this section, it is important to analyze how trypsin cleaves peptide bonds specifically after lysine (K) and arginine (R) residues, and how this enzymatic digestion generates peptide fragments that can be analyzed by LC-MS.
To determine the number of potential cleavage sites, the eGFP sequence was analyzed using bioinformatics tools such as Benchling.
eGFP sequence used:
Trypsin is a proteolytic enzyme that cleaves peptide bonds specifically after lysine (K) and arginine (R) residues. Based on the biochemical properties of the eGFP sequence, the total number of lysine and arginine residues was determined.
The analysis showed:
- Lysine (K): 20 residues
- Arginine (R): 6 residues
Therefore, the total number of potential cleavage sites is:
20+6=26
This represents the theoretical number of trypsin cleavage sites in the protein.
To further analyze the digestion products, the eGFP sequence was submitted to the ExPASy PeptideMass tool.
To confirm this information, you can access my project at the following link:
https://benchling.com/s/prtn-i41DsFukKaO5GLwSuXy8?m=slm-e83NNgDkVxkJlWC2oKg6
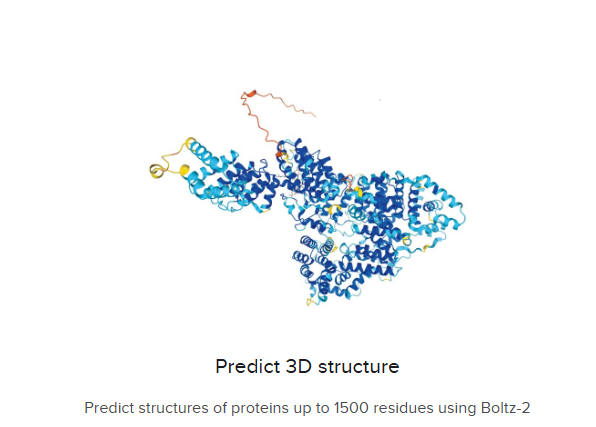
Additionally:
I generated the predicted 3D structure of eGFP, which supports its compact folded conformation before digestion, which is consistent with the need for enzymatic cleavage to generate peptide fragments for LC-MS analysis.
Small tutorial of Benchling

| 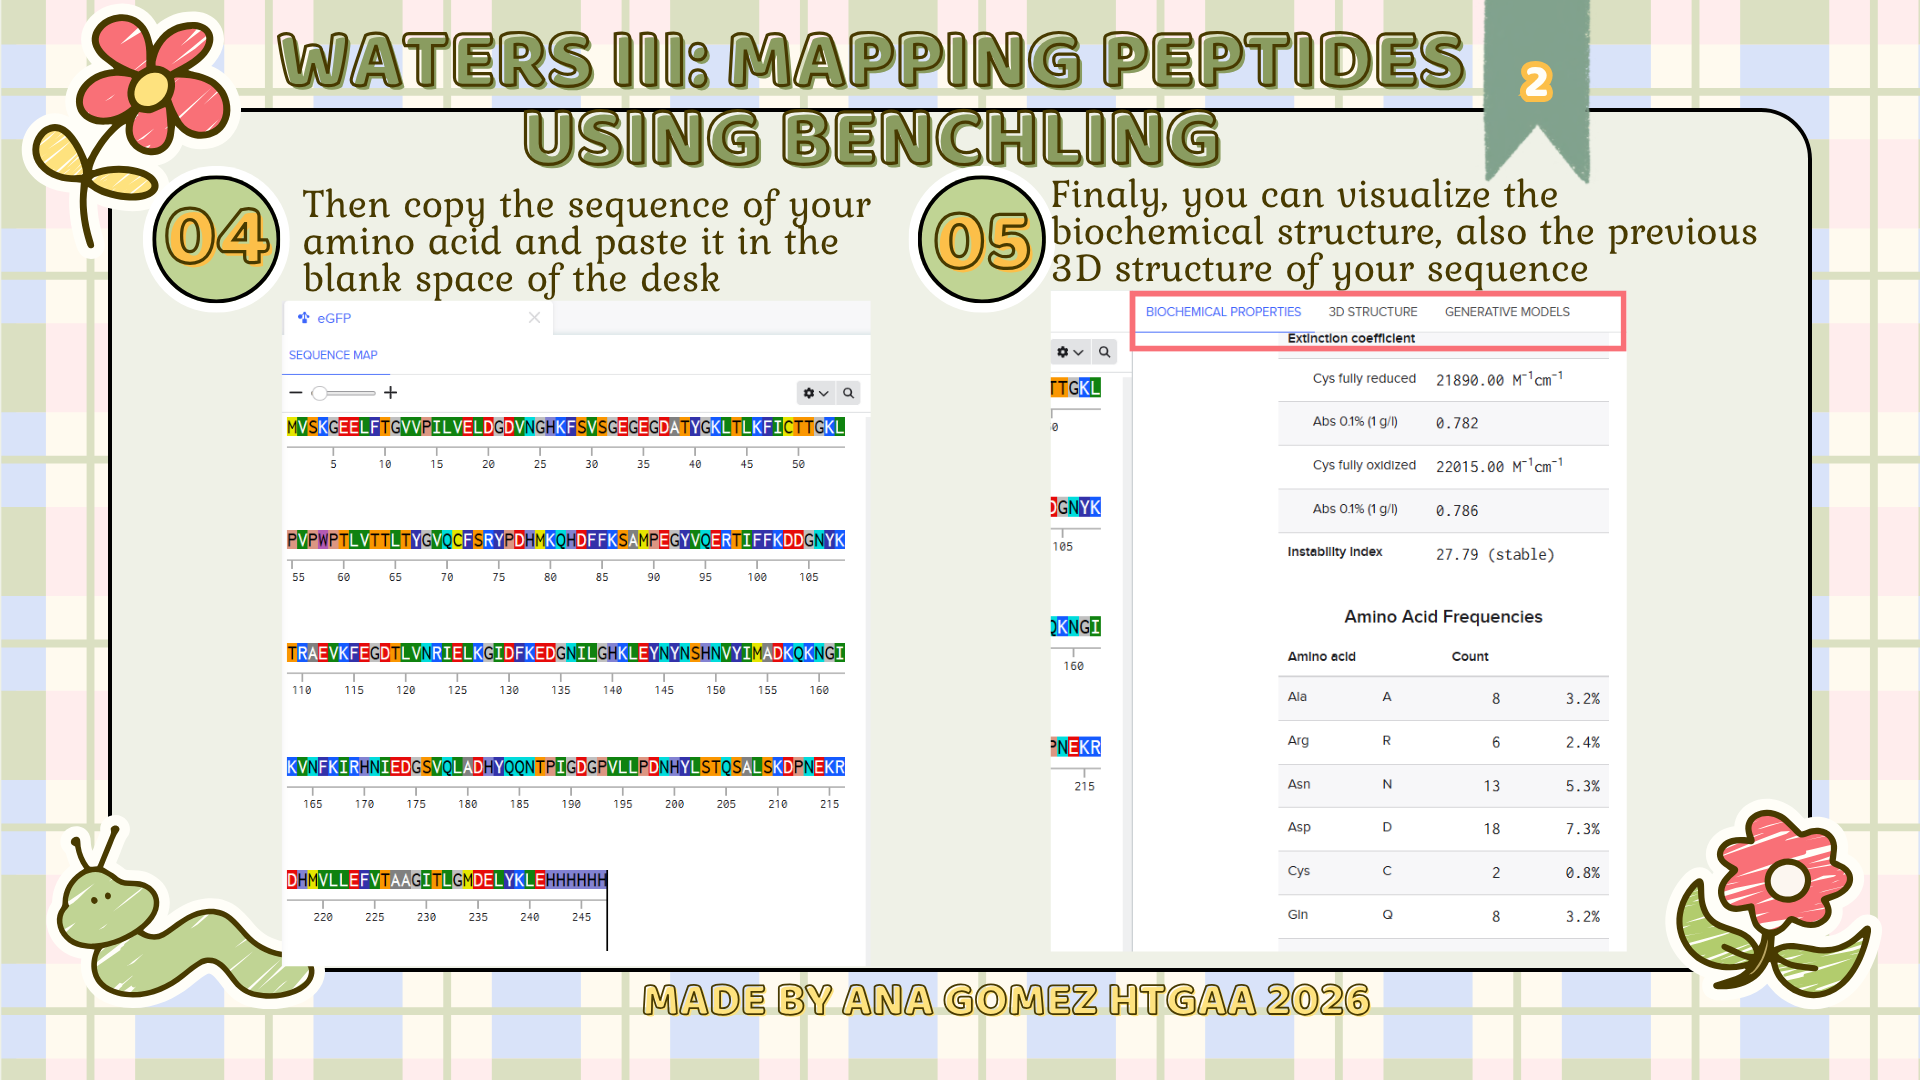
|
Tryptic digestion:
The eGFP sequence was analyzed in the ExPASy PeptideMass tool using the following parameters:
- Enzyme: Trypsin
- Maximum missed cleavages: 0
- Cysteines: reduced form
- Methionines: not oxidized
- Peptide mass filter: > 500 Da
- Mass type: monoisotopic [M+H]+[M+H]+[M+H]^+
Under these conditions, the digestion generated 19 predicted peptides, as shown in Table 1.
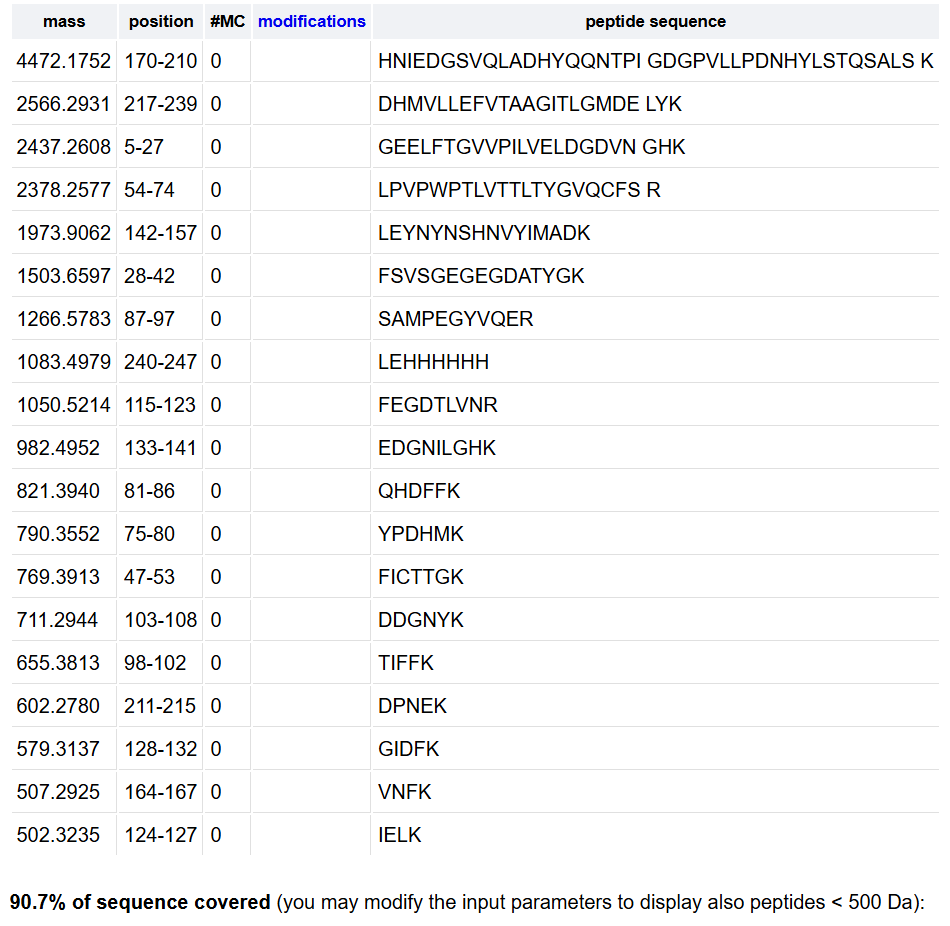
The number of predicted peptides (19) is lower than the theoretical number of cleavage sites (26). This difference can be explained by the filtering conditions applied in the PeptideMass tool, particularly the exclusion of peptides with masses below 500 Da, as well as the absence of missed cleavages.
Chromatographic map:
Based on the total ion chromatogram (Figure 5a), approximately 20–25 chromatographic peaks can be observed between 0.5 and 6 minutes when considering peaks above 10% relative abundance:
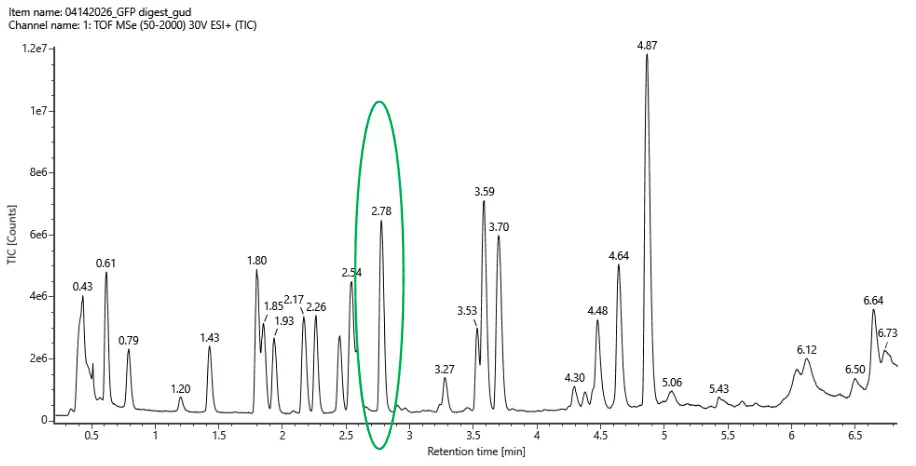
Figure 5a. chromatomap
This number is slightly higher than the 19 peptides predicted using the PeptideMass tool.
This discrepancy can be explained by many reasons, such as:
- Co-elution of peptides
- Presence of noise or minor peaks
- Multiple charge states of the same peptide
- Differences in ionization efficiency
Therefore, the number of chromatographic peaks does not exactly match the number of predicted peptides
Identify the mass-to-charge:
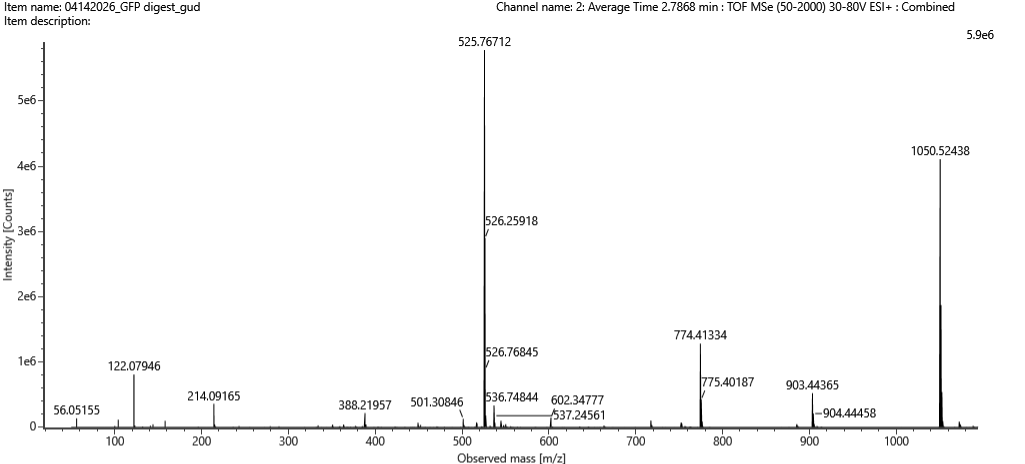
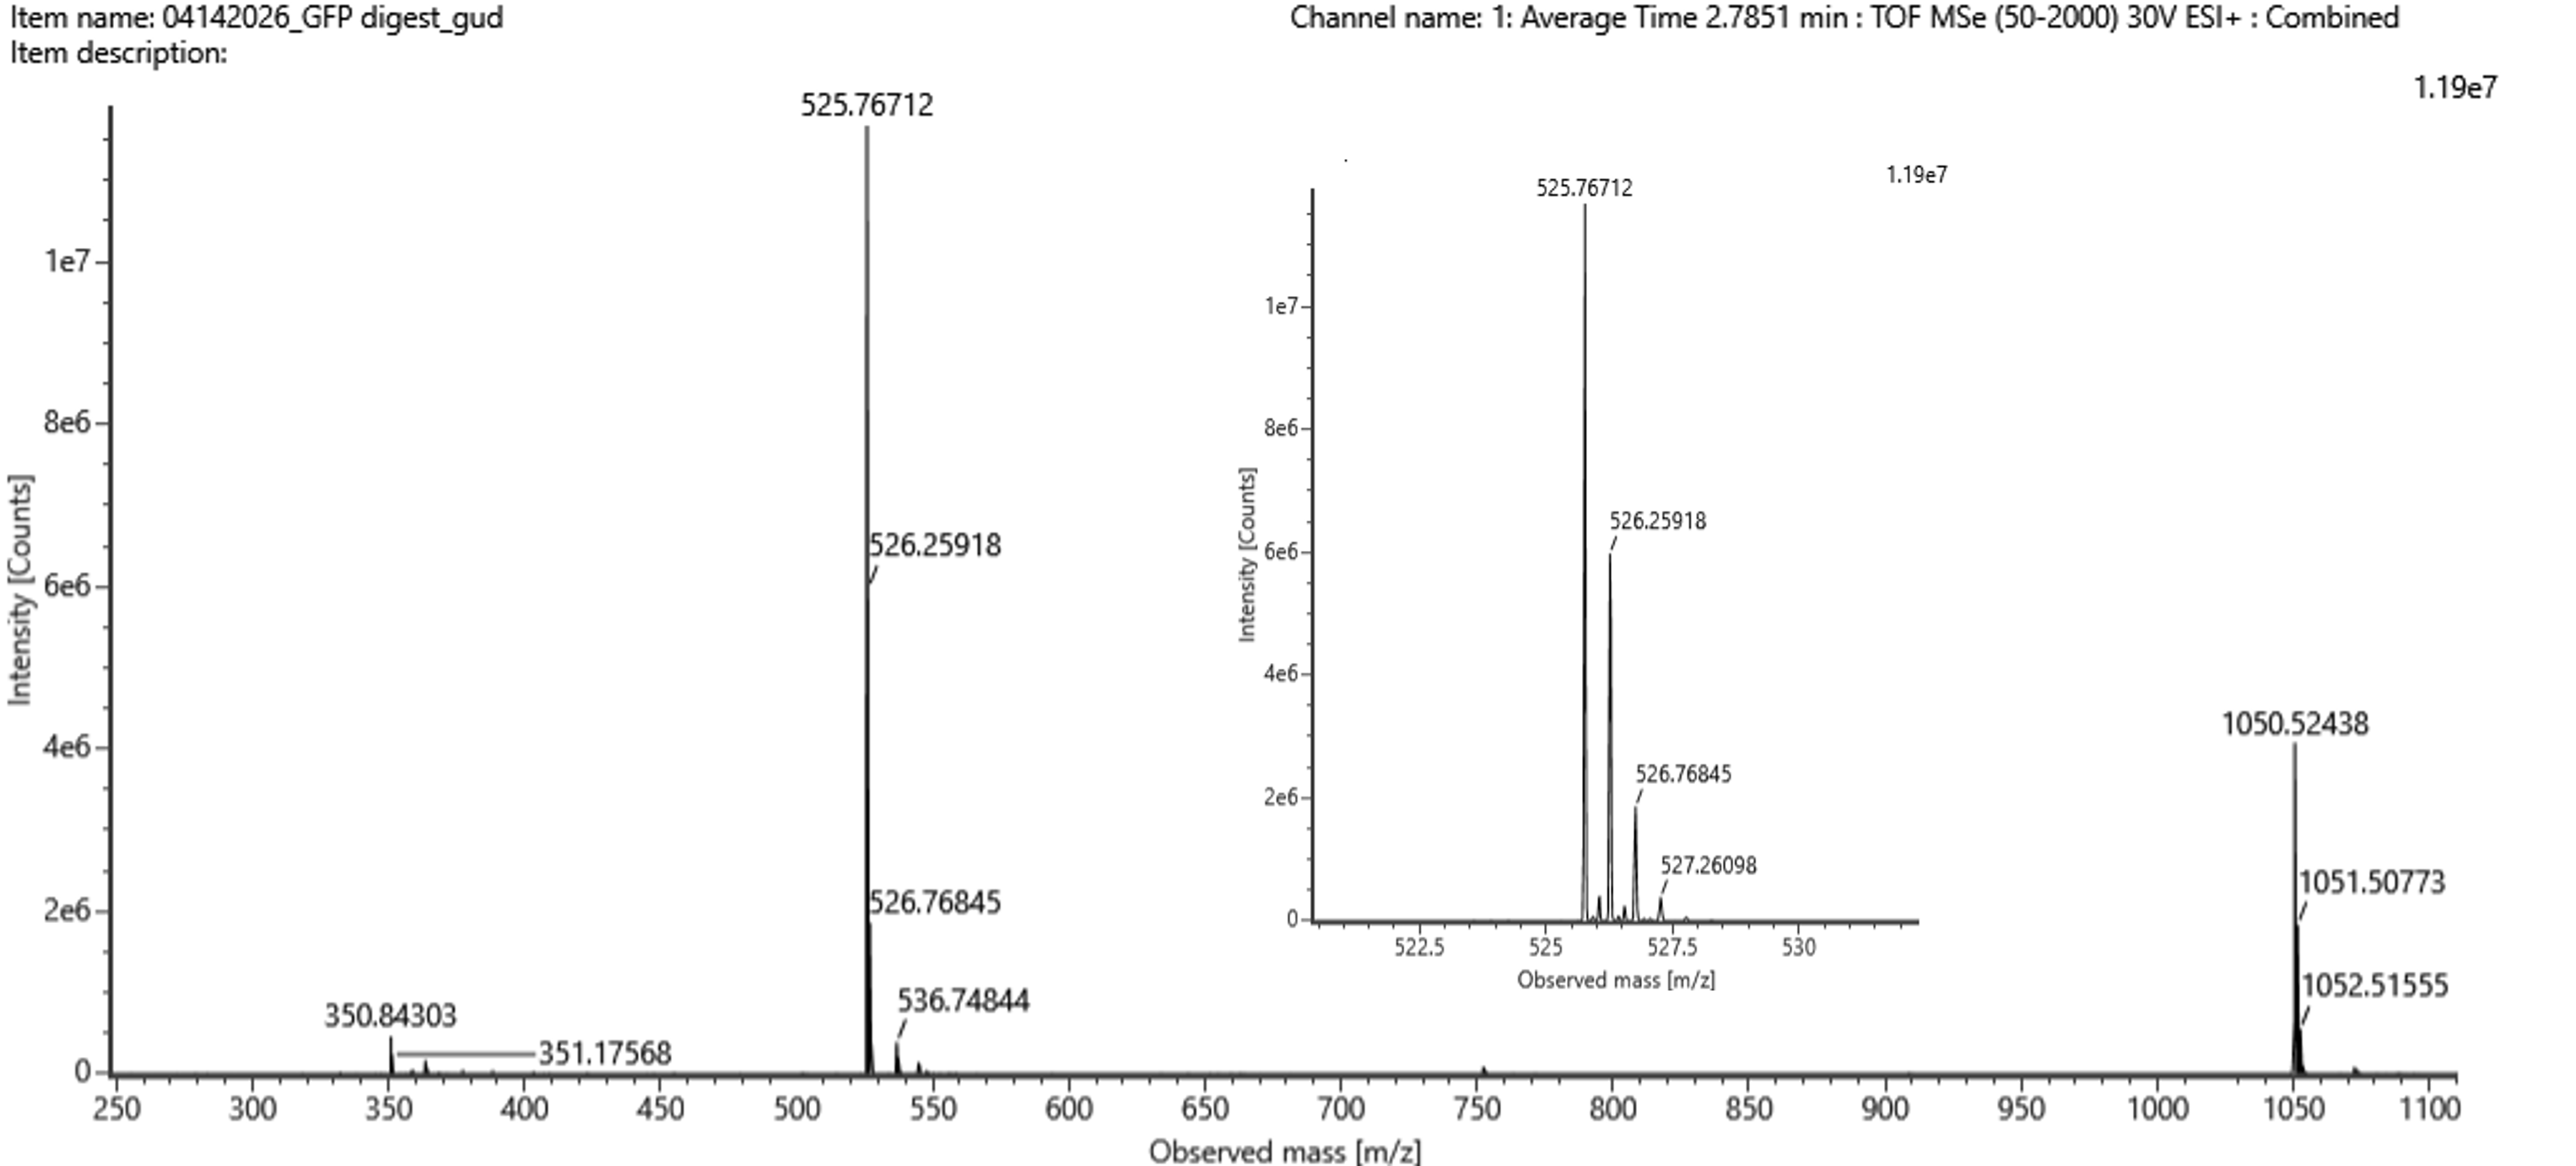 Figure 5b Mass spectrum figure
 | The principal peak indicate a value of 525.76712 m/z. So, the mass-to-charge ratio (m/z) of the peptide shown in Figure 5b is approximately 525.77. |
Charge state (z)
The charge state (z) of the peptide was determined by measuring the spacing between isotopic peaks. The difference between adjacent peaks is approximately 0.49 m/z, which corresponds to:
Therefore, the most abundant charge state of the peptide is 2+.
Peptide Mass (singly charged)
The molecular weight of the singly charged peptide was calculated as:
 In conclusion, the peptide mapping results confirm the identity of the protein as eGFP, as both the peptide masses and sequence coverage are consistent with the expected theoretical values.
Identify the Peptide:
The calculated peptide mass (~1049.52 Da) closely matches the theoretical peptide mass 1050.52 Da predicted by the PeptideMass tool. This corresponds to the peptide sequence FEGDTLVNR shown in Table 1.
Error (ppm) The mass error was calculated as:
Coverage
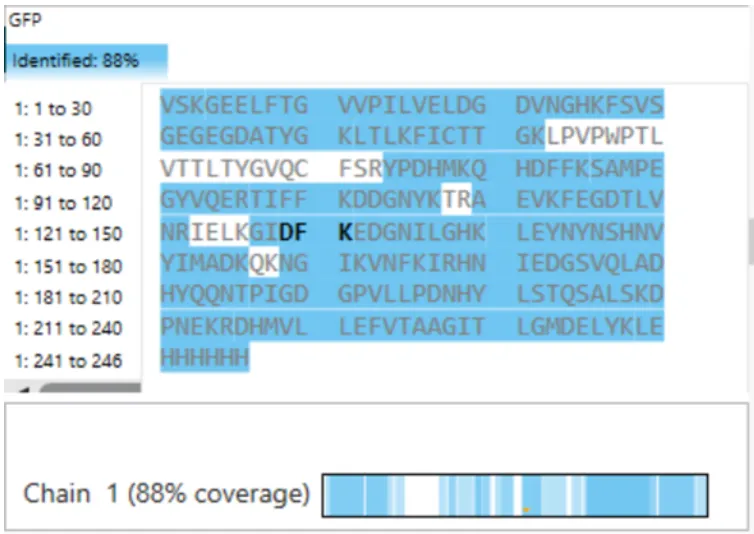 Figure 6 Coverage eGFP
 | The peptide mapping analysis confirmed approximately 88% of the eGFP amino acid sequence, indicating strong agreement between the experimental data and the expected protein sequence. |
In conclusion, the peptide mapping results confirm the identity of the protein as eGFP, as both the peptide masses and sequence coverage are consistent with the expected theoretical values.
Bonus Peptide Map Questions
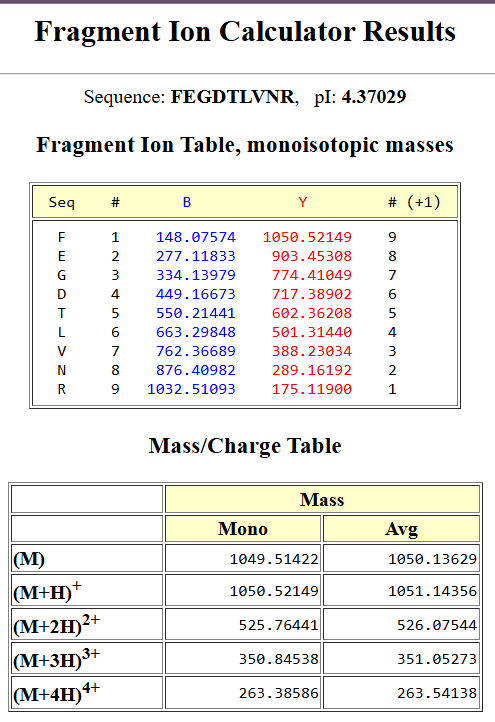
| To determine the peptide sequence corresponding to the fragmentation spectrum in Figure 5c, the peptide with the closest theoretical mass to the experimentally observed value in Figure 5b was selected. The peptide FEGDTLVNR (theoretical mass: 1050.52149 Da) was analyzed using the Fragment Ion Calculator with monoisotopic masses, charge state +1, and b/y ion series. | 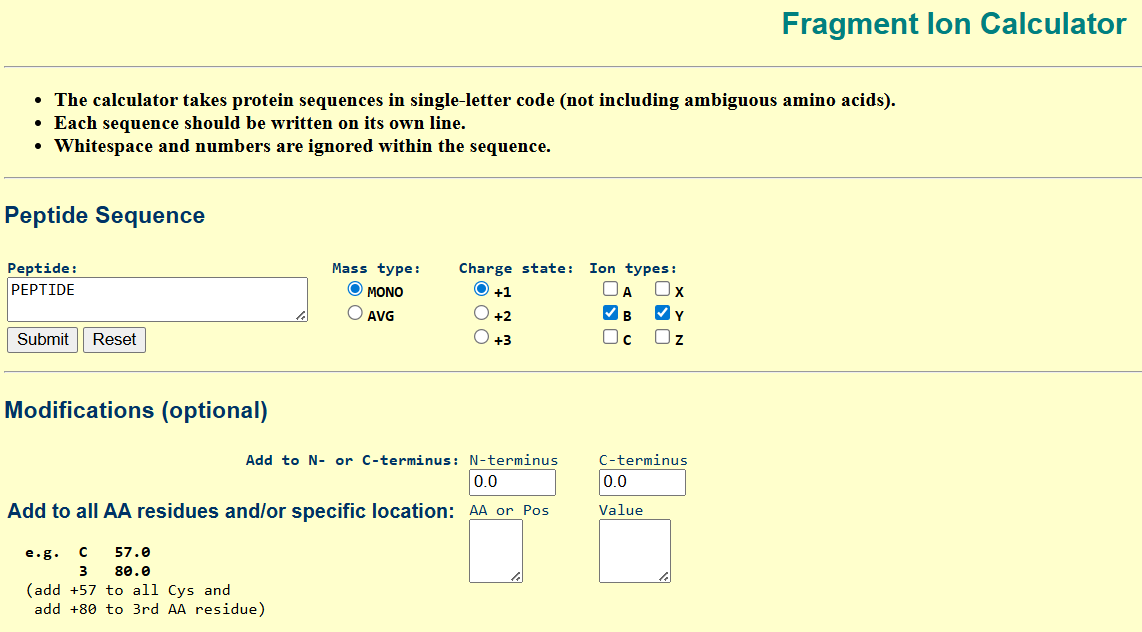 Proteomics Toolkit: https://db.systemsbiology.net/proteomicsToolkit/FragIonServlet.html
 |
The predicted fragmentation pattern showed strong agreement with the experimental spectrum. Several y-ions matched closely with the observed peaks, including:
| y3 ≈ 388.23 | (observed ~388.22) |
| y4 ≈ 501.31 | (observed ~501.31) |
| y5 ≈ 602.36 | (observed ~602.35) |
| y7 ≈ 774.41 | (observed ~774.41) |
| y8 ≈ 903.45 | (observed ~903.44) |
Additionally, the precursor ion at ~1050.52 Da was also observed. These results confirm that the peptide sequence that best matches the fragmentation spectrum is FEGDTLVNR.
| Results of sequence | Figure 5c | Figure 5b |
|---|---|---|
| 
|
|
Does the peptide map data make sense?
Yes, the peptide map data are consistent with the protein being the eGFP standard. The experimentally observed peptide masses match the theoretical values predicted from the eGFP sequence, and the fragmentation pattern confirms the identity of specific peptides such as FEGDTLVNR.
Furthermore, the sequence coverage shown in Figure 6 is approximately 88%, indicating that a large portion of the protein sequence was experimentally confirmed. The combination of accurate mass measurements, matching fragmentation patterns, and high sequence coverage strongly supports that the analyzed protein corresponds to eGFP.
For the full calculations, please read the “Source section” at the bottom of the webpage!
Waters Part IV — Oligomers
Charge detection mass spectrometry (CDMS) allows direct mass measurement of large protein assemblies, making it possible to identify the oligomeric states of Keyhole Limpet Hemocyanin (KLH). Based on Table 2, the KLH subunits have the following masses: 7FU = 340 kDa and 8FU = 400 kDa.
Table 2. KLH Subunit Masses
| Polypeptide Subunit Name | Subunit Mass (kDa) |
|---|---|
| 7FU | 3400 |
| 8FU | 8000 |
| 8FU 3D | 12000 |
| 8FU 4D | 16000 |
Full calculus at Sources section, page 3
Compared in Figure 7, these species can be identified approximately at the following positions:
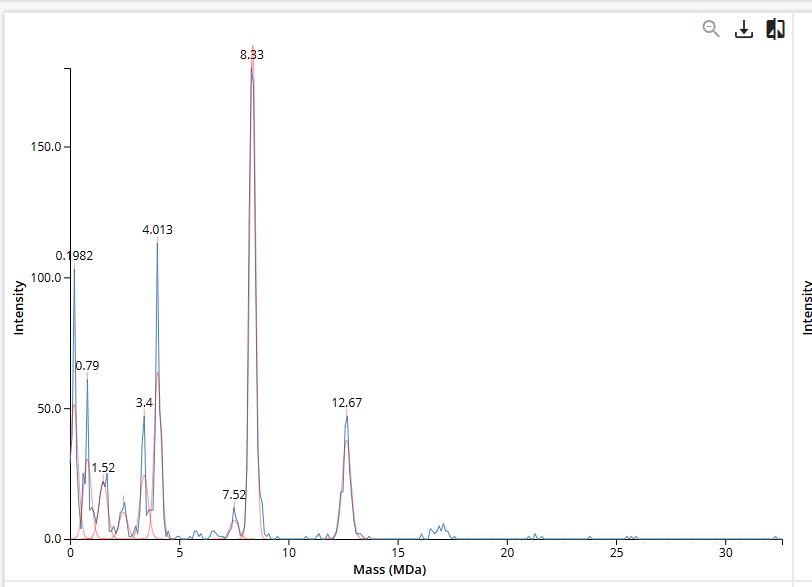
Figure 7 KHL spec-mass
- 7FU Decamer → peak near 3.4 MDa
- 8FU Didecamer → major peak near 8.3 MDa
- 8FU 3-Decamer → peak near 12.7 MDa
- 8FU 4-Decamer → weak signal expected near 16 MDa
These assignments are consistent with the labeled mass positions shown in the KLH CDMS spectrum.
For the full calculations, please read the “Source section” at the bottom of the webpage!
Waters Part V — Did I make GFP?
Based on the intact LC-MS analysis, the theoretical molecular weight of eGFP was 28.0066 kDa, while the experimentally observed molecular weight was 27.9839 kDa. The calculated mass error was approximately 810 ppm, indicating that the measured protein mass is very close to the expected theoretical value.
This strong agreement supports that the analyzed protein corresponds to eGFP.
| Molecular weight (kDa) | Value |
|---|---|
| Theoretical | 28.0066 |
| Observed/measured on Intact LC-MS | 27.9839 |
| PPM Mass Error | ~ 810 ppm |
For the full calculations, please read the “Source section” at the bottom of the webpage!

Homework: Individual Final Project
1. What will be measured?
| Type | description |
|---|---|
| sfGFP fluorescence | The primary readout of the biofilm-responsive promoter activity |
| mCherry | Control |
| Relative surface-associated growth or late-stage biomass formation | Wet lab: Conceptual comparison with early fluorescence activation |
Additionally, I look for simulated expression dynamics, including RNA concentration, protein concentration, and expression flux, using the Asimov Kernel.
2. How will these measurements be performed?
Asimov Kernel simulations will be used to compare predicted basal versus induced expression states of the construct under biofilm-promoting conditions.
Benchling will be used to design and organize promoter architecture, RBS selection, terminators, and plasmid backbone assembly.
- Fluorescence measurements could be performed using a fluorescence plate reader and fluorescence microscopy under planktonic and surface-associated growth conditions. - Crystal violet staining may also be used as a comparative late-stage biofilm biomass assay.
Sanger sequencing could be used to verify the correct assembly and integrity of the promoter–reporter cassette.
3. Technologies and tools
Benchling for DNA construct design and sequence organization.
Asimov Kernel for computational simulation and predicted expression analysis.
Literature databases and biofilm-related resources focused on csgD, curli regulation, quorum sensing, and Gram-negative biofilm formation in E. coli and Salmonella.
Proposed future technologies include fluorescence plate readers, fluorescence microscopy, PCR amplification, Gibson Assembly workflows, and DNA sequencing.

Weekly reflection
During the Waters LC-MS homework, I initially confused some experimental values and mass spectrometry interpretations, especially regarding charge states and ppm calculations
Despite this, I followed the analytical logic step by step and learned how to interpret experimental spectra using the theoretical values and available datasets
This week helped me better understand how computational analysis and experimental data complement each other during protein characterization workflows
I also reinforced my confidence in using bioinformatics tools such as Benchling, ExPASy, and fragmentation analysis platforms to support experimental reasoning
For KitBi, this process reminded me that even proposed in silico biosensor systems require careful interpretation of experimental-like datasets and validation logic
Also, this information is followed by my notion webpage. If you are interested in reading it, please click here! Week10 Homework

References and Sources
Waters Part II:
(1) Kafader, Jared O et al. “Native vs Denatured: An in-depth Investigation of Charge State and Isotope Distributions.” Journal of the American Society for Mass Spectrometry vol. 31,3 (2020): 574-581. doi:10.1021/jasms.9b00040
(2) Masson, Patrick, and Sofya Lushchekina. “Conformational Stability and Denaturation Processes of Proteins Investigated by Electrophoresis under Extreme Conditions.” Molecules (Basel, Switzerland) vol. 27,20 6861. 13 Oct. 2022, doi:10.3390/molecules27206861
(3) Cassou, Catherine A et al. “Electrothermal supercharging in mass spectrometry and tandem mass spectrometry of native proteins.” Analytical chemistry vol. 85,1 (2013): 138-46. doi:10.1021/ac302256d
Sources:
Calculus document
In the following PDF document, the full calculus for the Waters sections
Week 10 calculus: Click here to download the pdf file: Week10 document