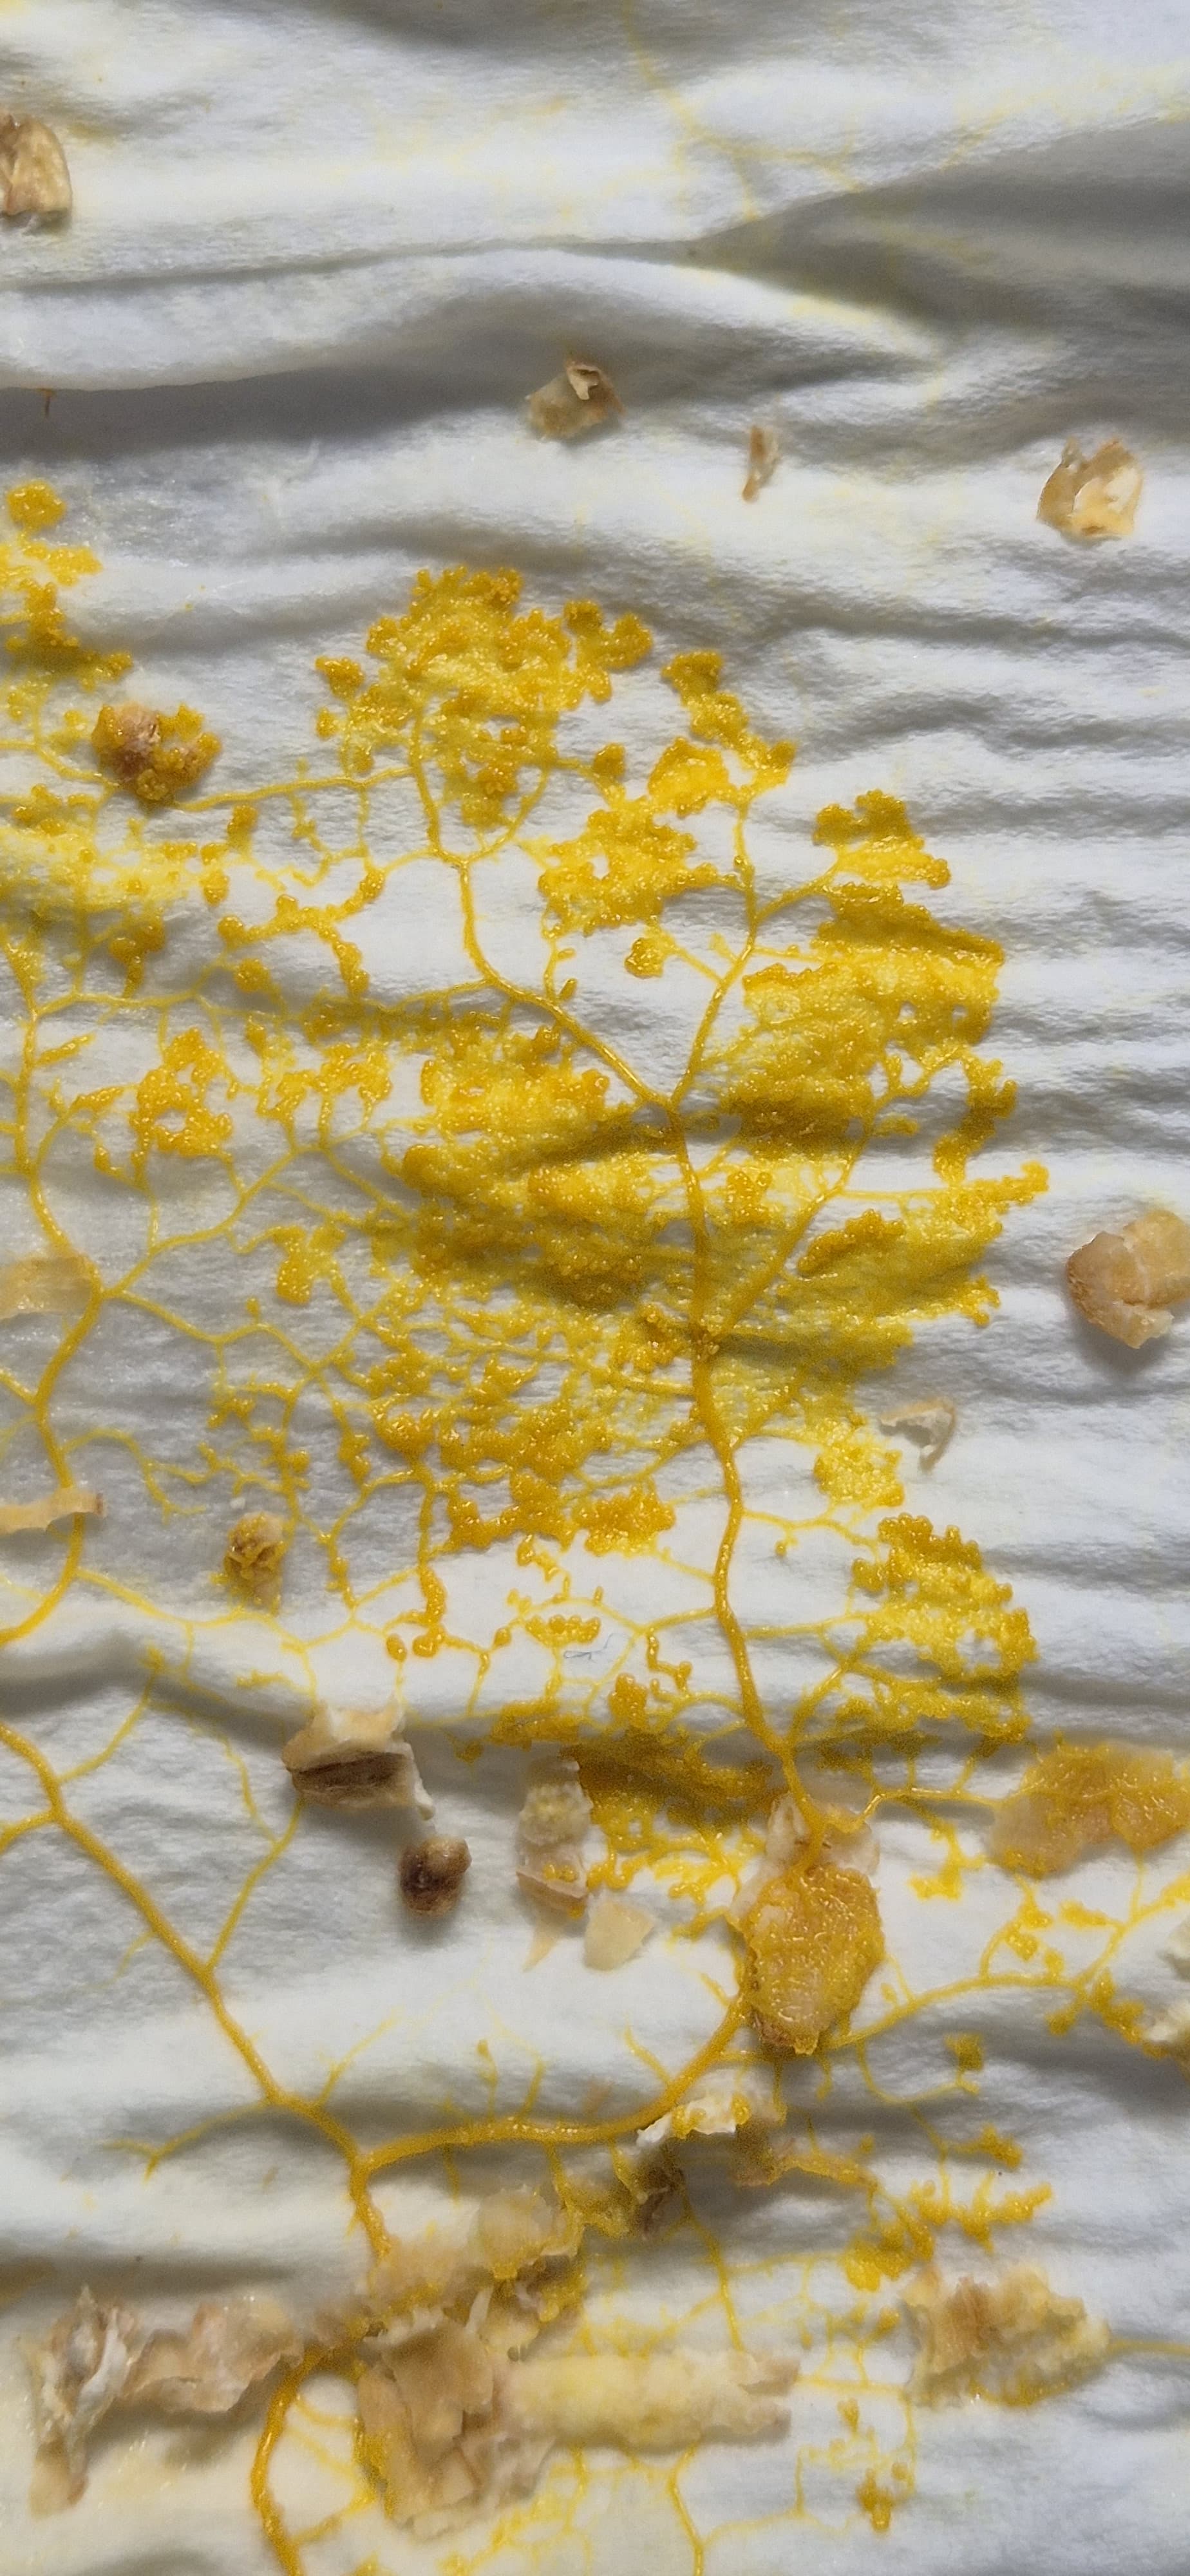
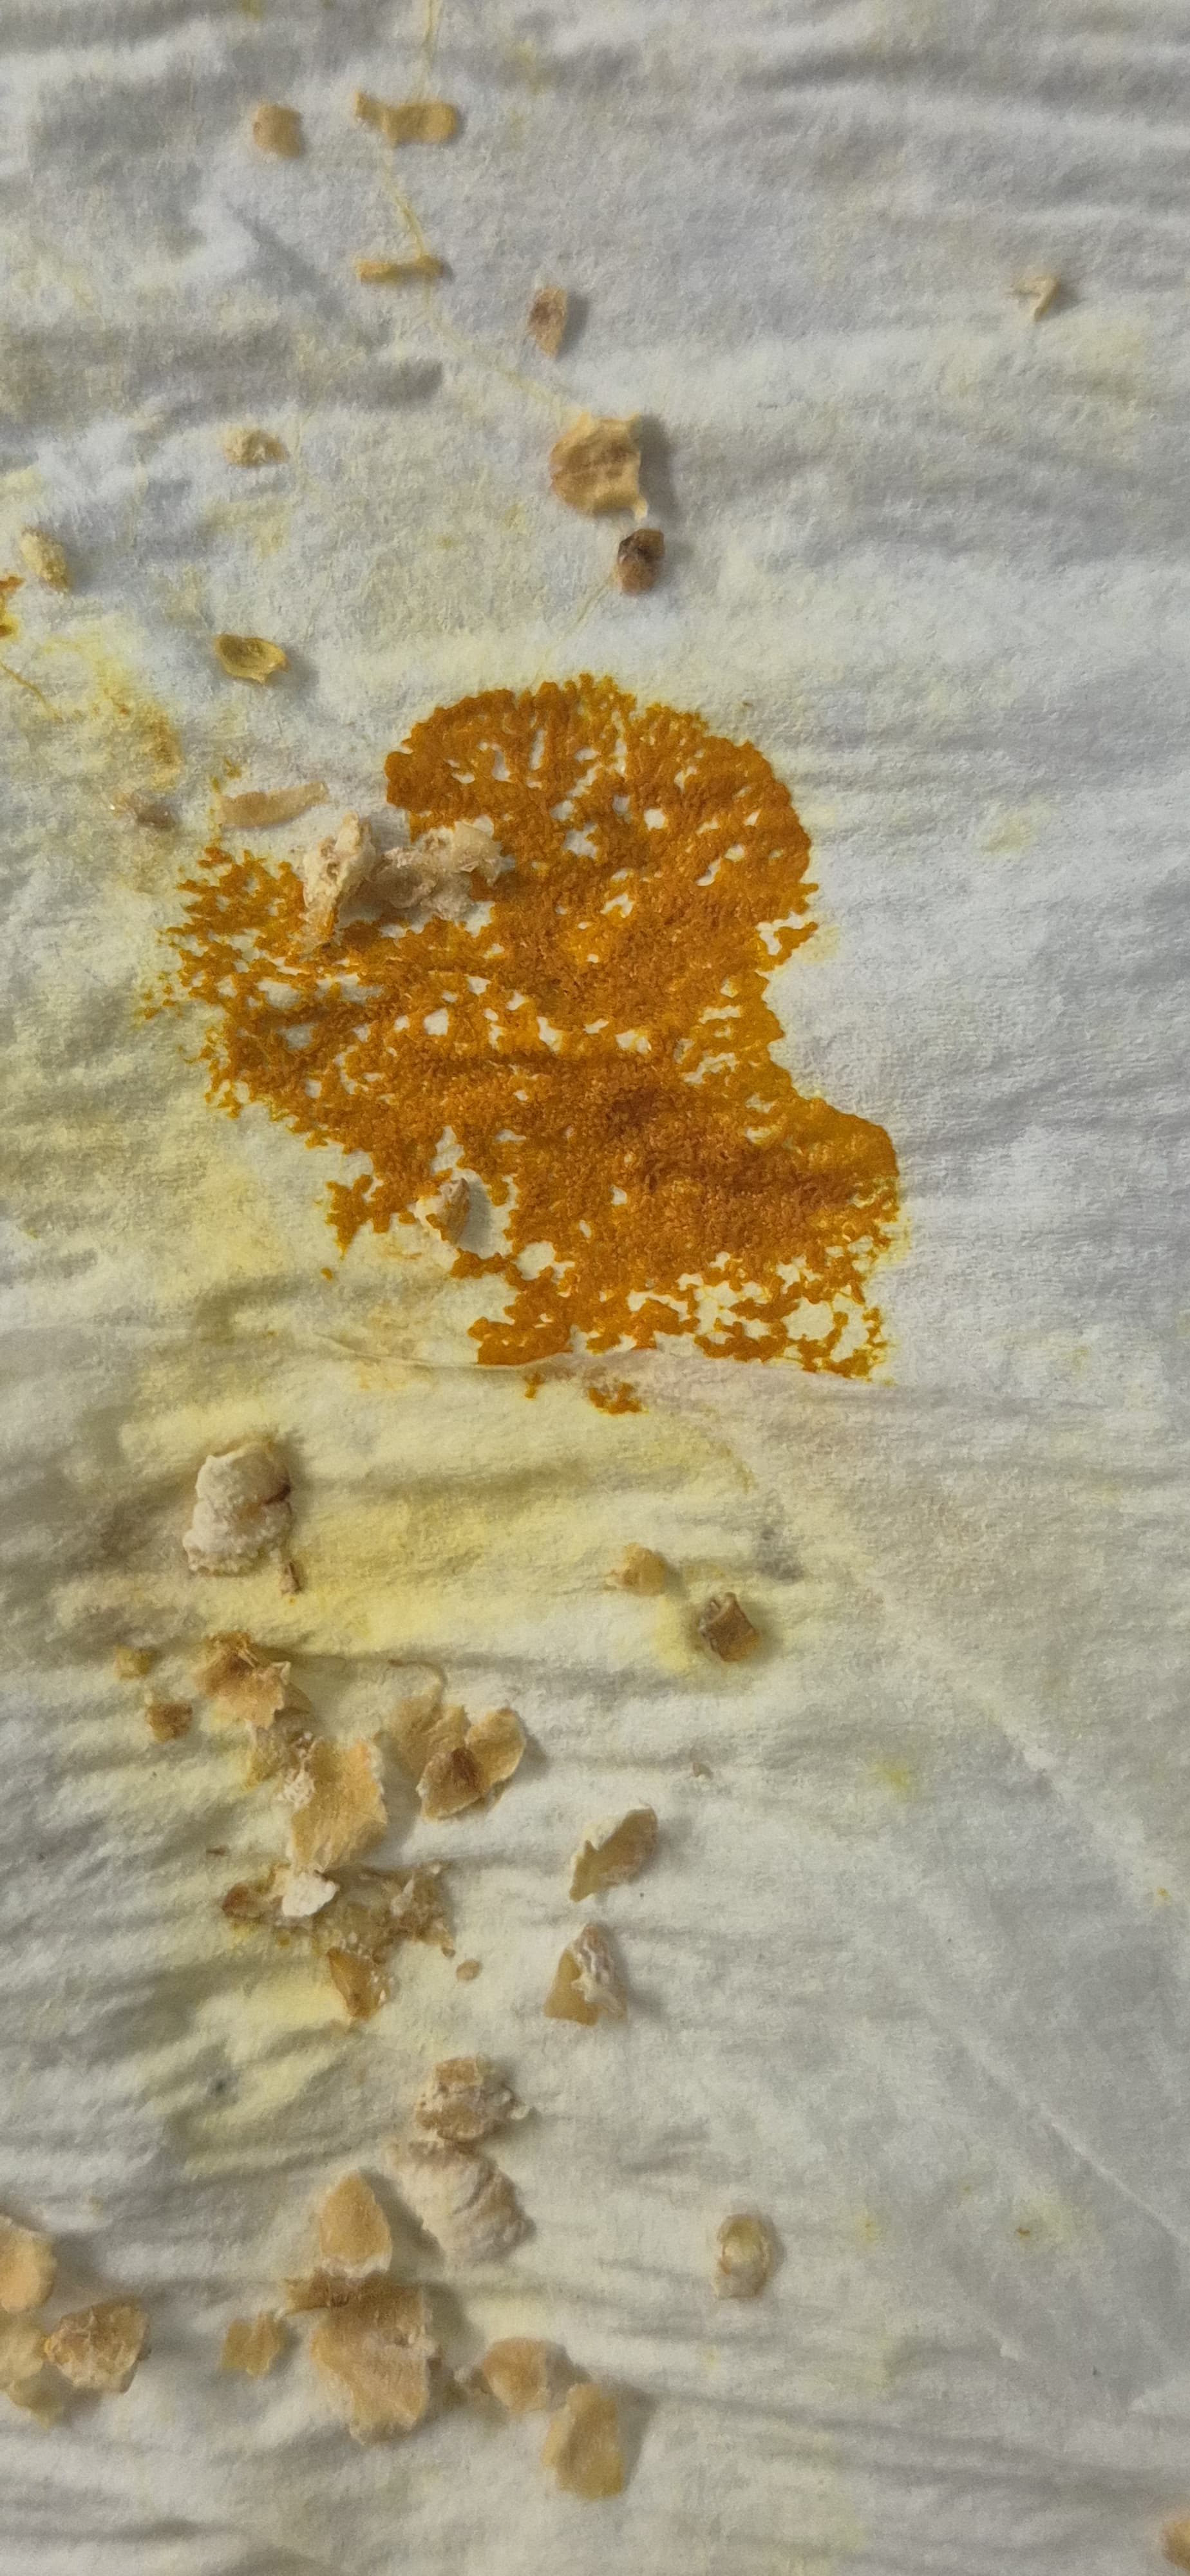
1.Biological engineering tool/application I am trying to develop a dyeing method for fabrics and surfaces by using Physarum Polycephalum, or the slime mould as an activator. The aim is to let the slime mould create one-of-one designs by growing on the surface, letting a level of unpredictabiity of growth control the outcome. Slime moulds are very good at creating pathways while expanding in search of optimum survival conditons. During this travel, they tend to leave behind residual pigment, usually yellow in colour. After drying it looks something like this. In this bioengineered application, physarum polycephalum expresses a pigment forming enzyme(tyrosinase/laccase-type oxidase) that catalyzes the oxidation of benign phenolic or cathechol precursors into reactive quinones that polymerize into and insoluble melanin-like pigment.
Part A: Pixel Artwork Canvas | Collective Artwork This was great fun and I kept open multiple tabs and in incognito to quickly fill up boxes (Thanks Georg for the trick!) and somehow managed having parts of my work in the final artwork. For reference I started making the ducks in the first quadrant and someone decided to take it ahead and keep them till the end :)
Part A: Questions by Shuguang Zhang How many molecules of amino acids do you take with a piece of 500 grams of meat? 500g divided by 100 Da gives you about 3 × 10²⁴ molecules. So there are roughly 3 trillion trillion amino acids in a single serving of meat.
Human SOD1 sequence MATKAVCVLKGDGPVQGIINFEQKESNGPVKVWGSIKGLTEGLHGFHVHEFGDNTAGCTSAGPHFNPLSRKHGGPKDEERHVGDLGNVTADKDGVADVSIEDSVISLSGDHCIIGRTLVVHEKADDLGKGGNEESTKTGNAGSRLACGVIGIAQ
After adding A4V mutation MATKVVCVLKGDGPVQGIINFEQKESNGPVKVWGSIKGLTEGLHGFHVHEFGDNTAGCTSAGPHFNPLSRKHGGPKDEERHVGDLGNVTADKDGVADVSIEDSVISLSGDHCIIGRTLVVHEKADDLGKGGNEESTKTGNAGSRLACGVIGIAQ
Therefore, produced peptides:
index Binder Pseudo Perplexity 1 WLYVVAAVRWKX 23.320599604199636 2 WRYVAAAAAHKE 8.96053025308908 3 WLYVPAGLALWX 13.021677157633269 4 WLYYVVAVAHKX 15.430388570774006 5 FLYRWLPSRRGG 11.545571242285833 ##Part 2: Evaluating Binders with alpha fold3
The alpha fold results for some reason are not loading for me, despite multiple attempst and troubleshooting. Hence the results were analyzed with the help of Claude using PAE matrices
peptide 1 ipTM 0.38 The PAE matrix shows a uniformly mid-green inter-chain strip with no distinct dark patch, indicating no preferred binding site and the peptide appears to be floating without specific engagement.
What are some components in the Phusion High-Fidelity PCR Master Mix and what is their purpose? Phusion High-Fidelity PCR Master Mix contains most of the key ingredients needed for PCR, except the template DNA and primers. It is designed to make DNA amplification more accurate and easier to set up.
Some of the main components are:
Part1: Intracellular Artificial Neural Networks What advantages do IANNs have over traditional genetic circuits, whose input/output behaviors are Boolean functions? Traditional genetic circuits treat inputs as binary. This works for simple logic but breaks down when you need nuanced, graded decisions based on multiple continuous signals. Biology itself is almost never binary; cells exist on spectrums of gene expression and signalling intensity. IANNs overcome this by operating in the analog domain. An IANN computes a weighted sum of all inputs and applies a nonlinear activation function, exactly like an artificial neuron. The same molecular parts can be reused to implement completely different decision boundaries just by changing the weights, without engineering new biological parts from scratch. IANNs can also be stacked into multiple layers, enabling hierarchical computation that is completely impossible with single-layer Boolean circuits.
General Questions 1. Explain the main advantages of cell-free protein synthesis over traditional in vivo methods, specifically in terms of flexibility and control over experimental variables. Name at least two cases where cell-free expression is more beneficial than cell production. Cell-free protein synthesis gives you a level of control over the reaction environment that you simply cannot get when working inside a living cell. Because there’s no cell membrane, you can directly add or remove components, adjust concentrations in real time, and introduce molecules that would be toxic to a living cell without worrying about killing your chassis. You also get direct access to the product without needing to lyse cells or purify through layers of cellular debris.
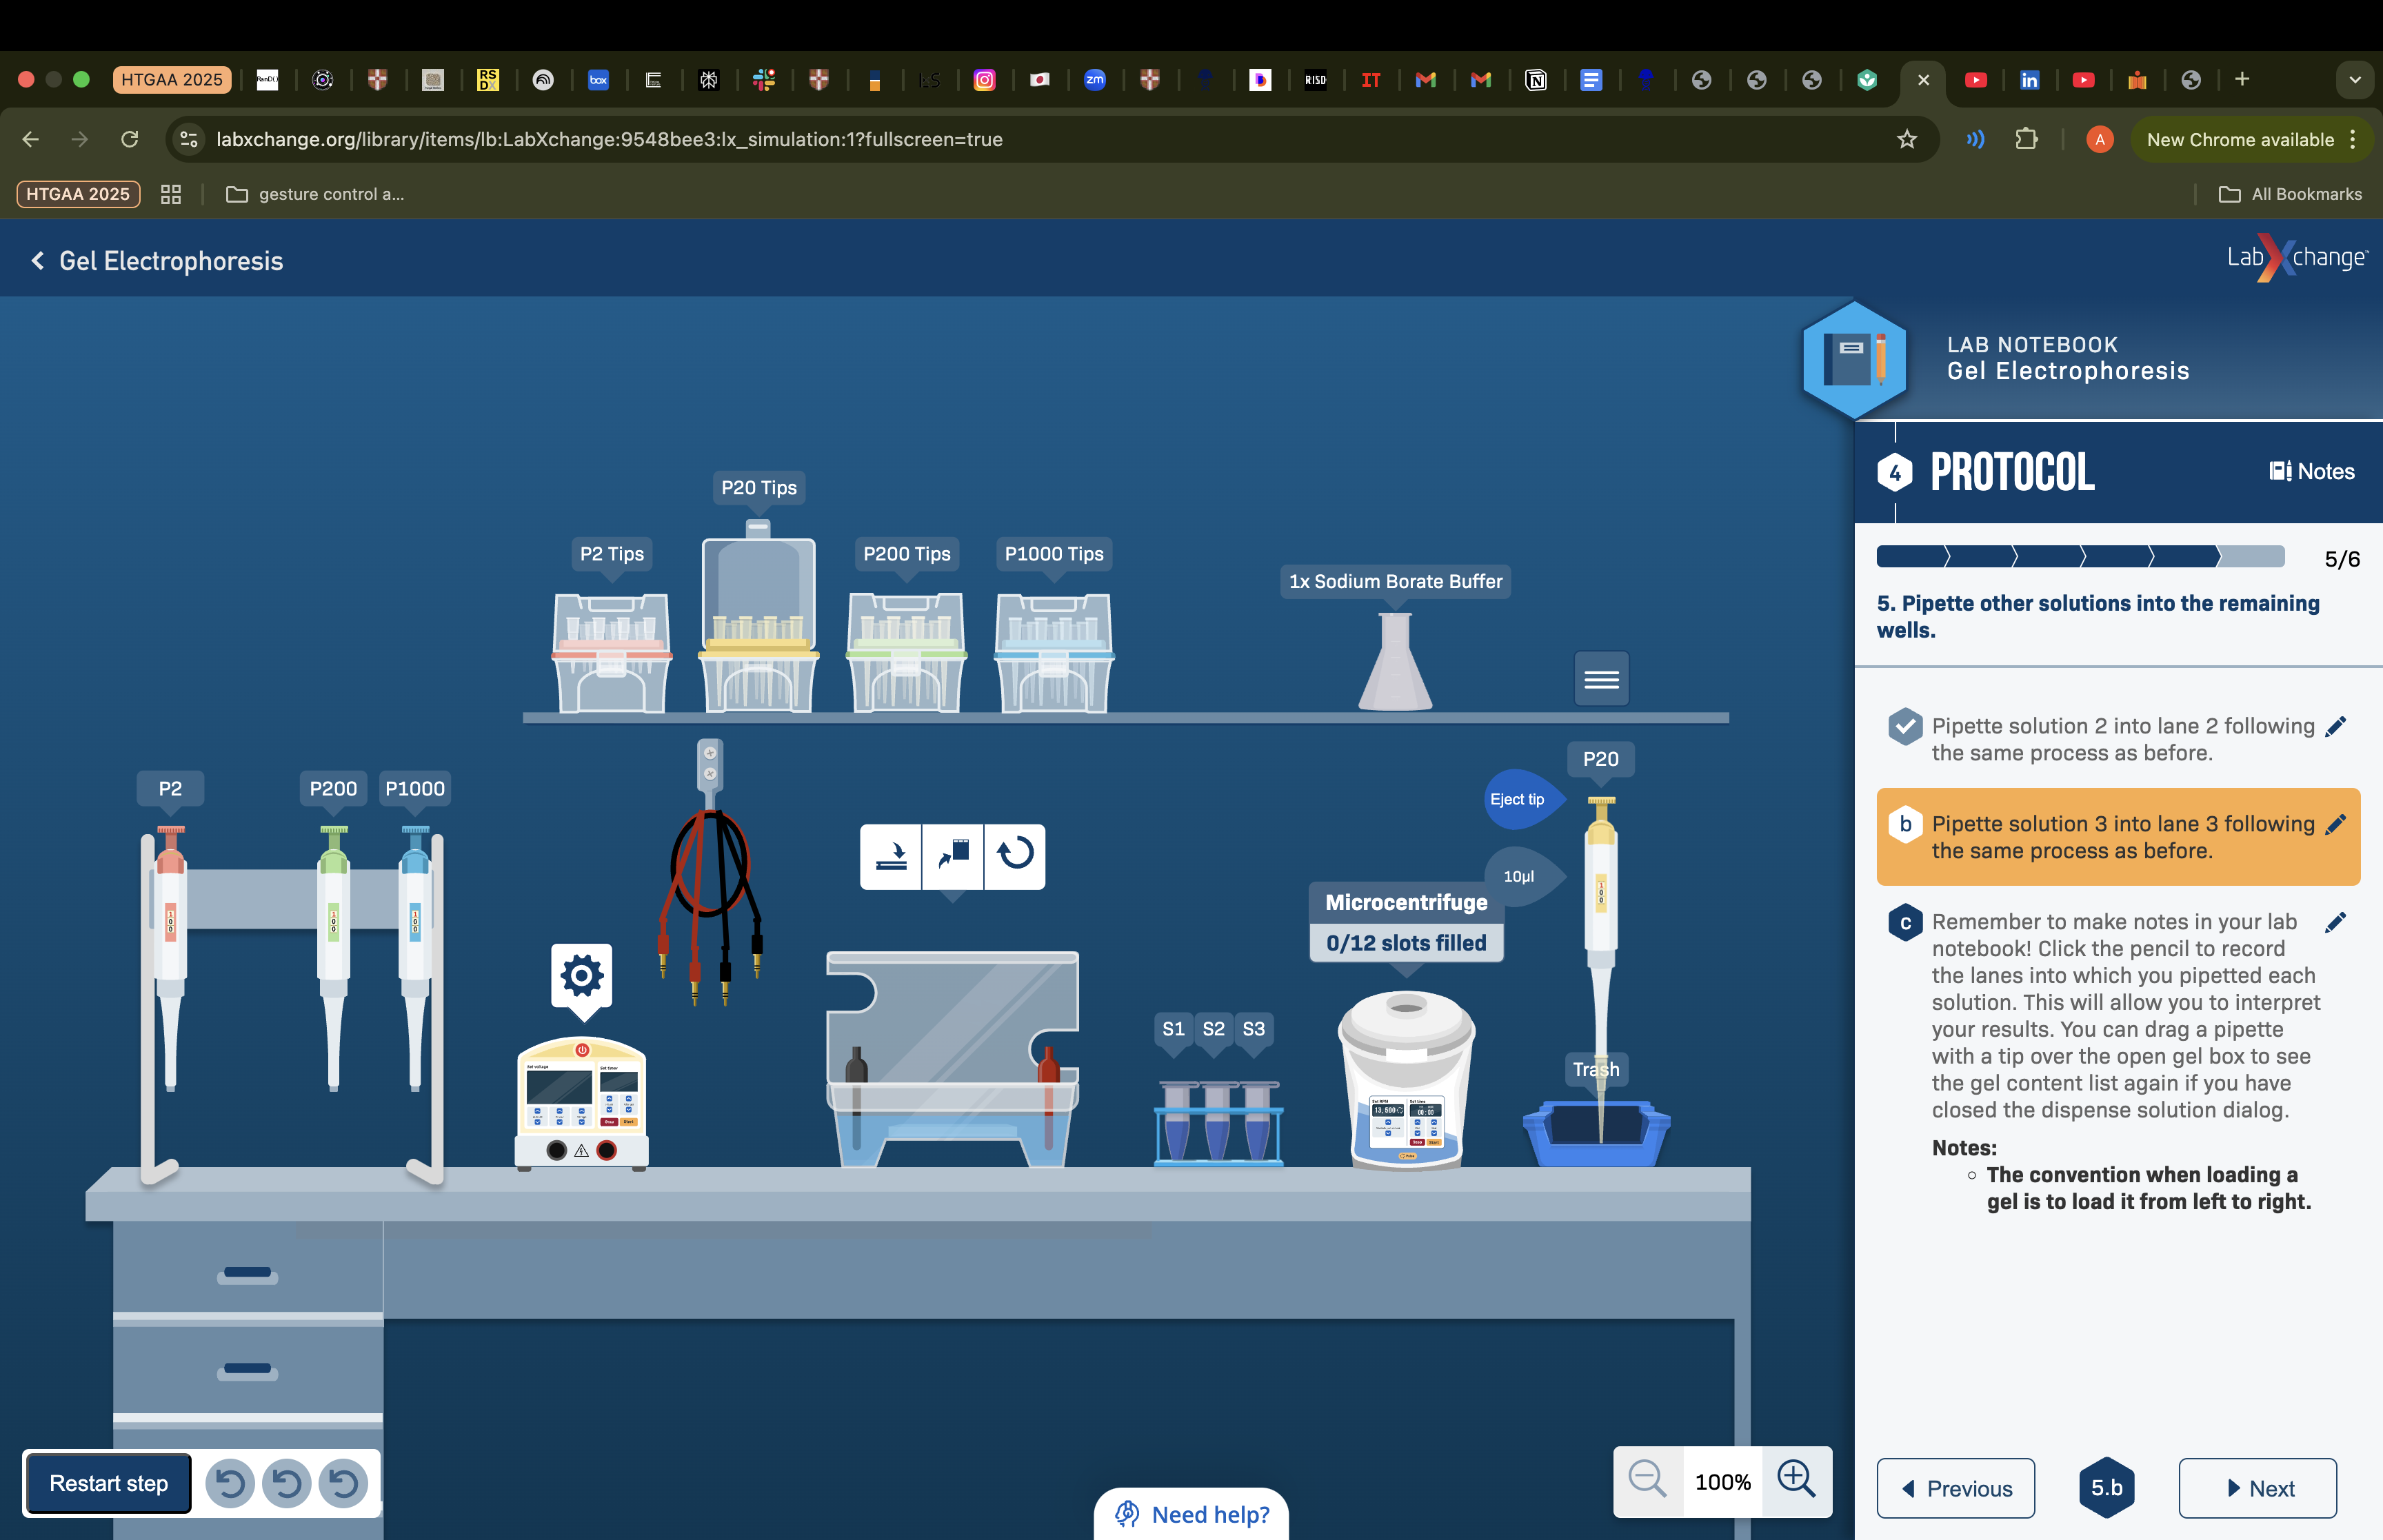
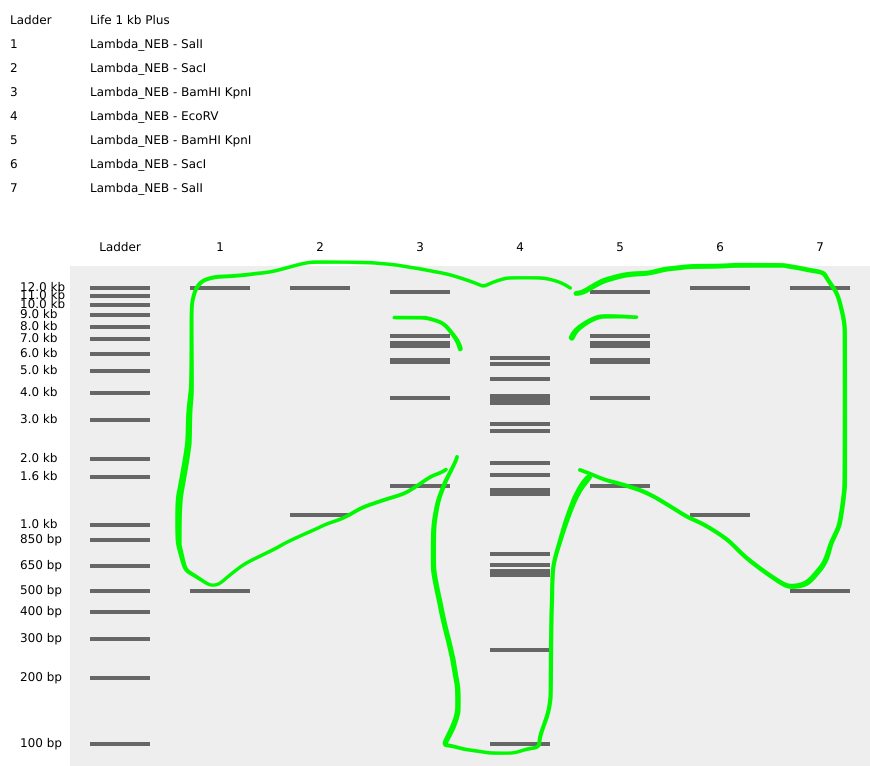
Part 1: Gel Electrophoresis Due to no access to equipment and space for gel electrophoresis I simulated the same to understand the process on https://www.labxchange.org/library/items/lb:LabXchange:9548bee3:lx_simulation:1?fullscreen=true
Workflow: Design plasmid DNA with protein of interest → Transform bacteria with plasmid DNA → Get many copies of plasmid DNA → Introduction of plasmid DNA to cells
Final Project: Measurements Tthe primary measurable output is indigoidine production by engineered Ganoderma lucidum in response to mechanical and other stress conditions. The key measurement aspects are:
Indigoidine quantification — The most direct readout of bpsA expression and BpsA enzyme activity is the blue pigment indigoidine, which has a peak absorbance at 590 nm. I will use the Spark Plate Reader to measure absorbance at 590 nm across all stress conditions (mechanical compression, osmotic, heat, no-stress control) in 384-well format, with a standard curve of purified indigoidine (0–100 µM) to convert absorbance to concentration. This gives a quantitative measure of promoter activity under each stress condition and is the primary success metric for Aim 1. 2. Construct integration verification — Colony PCR + gel electrophoresis After PEG-mediated transformation of G. lucidum, I will use colony PCR with one primer outside the leu2 homology arm (genomic) and one inside bpsA to confirm correct genomic integration. The expected band is ~800 bp. Gel electrophoresis on a 1.5% agarose gel with ethidium bromide staining will visualize the PCR product.
Subsections of Homework
Week 1 HW: Principles and Practices
1.Biological engineering tool/application
I am trying to develop a dyeing method for fabrics and surfaces by using Physarum Polycephalum, or the slime mould as an activator. The aim is to let the slime mould create one-of-one designs by growing on the surface, letting a level of unpredictabiity of growth control the outcome. Slime moulds are very good at creating pathways while expanding in search of optimum survival conditons. During this travel, they tend to leave behind residual pigment, usually yellow in colour. After drying it looks something like this.
In this bioengineered application, physarum polycephalum expresses a pigment forming enzyme(tyrosinase/laccase-type oxidase) that catalyzes the oxidation of benign phenolic or cathechol precursors into reactive quinones that polymerize into and insoluble melanin-like pigment.
The target surface/fabric is to be first coated with a reservoir layer (mild binder+humectant) that is stable and non-coloured when dry. As the plasmodium (active foraging stage of slime mould), it leaves back a hydrateed, anionic extracellular slime film (acidic polysaccharide rich) that locally rehydrates the layer and provides a high water, ionically active environment for the reaction to take place. Enzyme delivered at the surface via organism converts the reservoir layer into pigment only with the trail’s footprint, and the newly formed polymer precipitates in place. The slime’s polyanionic matrix and the binder layer together act as immobilizing scaffold, physically and electrostatically retainining the pigment on fibres so the organism still moves while the dyed path remains as a persistent spatial record of its presence.
2.Next, describe one or more governance/policy goals related to ensuring that this application or tool contributes to an “ethical” future, like ensuring non-malfeasance (preventing harm). Break big goals down into two or more specific sub-goals. Below is one example framework (developed in the context of synthetic genomics) you can choose to use or adapt, or you can develop your own. The example was developed to consider policy goals of ensuring safety and security, alongside other goals, like promoting constructive uses, but you could propose other goals for example, those relating to equity or autonomy.
2.Safety + Non-malfeasance
Exposure:
Ensuring rigourous quality tests ensuring the engineered organism/pigment polymer/enzyme does not create risks like allergens/irritation, sensitizers, or use unsafe binders/precursors with result in volatile+unpredicatble by-products.
Developing narrow function envelope for the to curb new emergent pathways that may produce undocumented results.
Create a timeline documenting the processes that have been enacted and by which actors. Ensure “program changes” cannot be done by end-users (e.g., no easy swapping of genetic payloads or addition of external DNA to redirect production).
Containment and handling:
Developing systems that prevent accidental spread/mishandling of the GMO from the process of R&D to Distribution to end-of -life. (Develop clear handling protocols, containment during demonstrations and training, maintaining workspaces etc.)
Ensuring design features that reduce aerosolization/smearing (sealed edges, protective breathable membranes, simple decontamination steps for handlers).
Making failure modes public will also ensure the same errors are not repeated
Environmental safety:
Ensuring all the agents used in the process especially the GMO go through assess,,emt of whether it can sporulate in local environments and accordingly come up with stronger safeguarding.
Assessing toxicity levels for precursors and binders to avoid accumulative compounds post end-of-life. Ensuring biological activity is terminated before disposal and the waste is integrated with local waste stream systems.
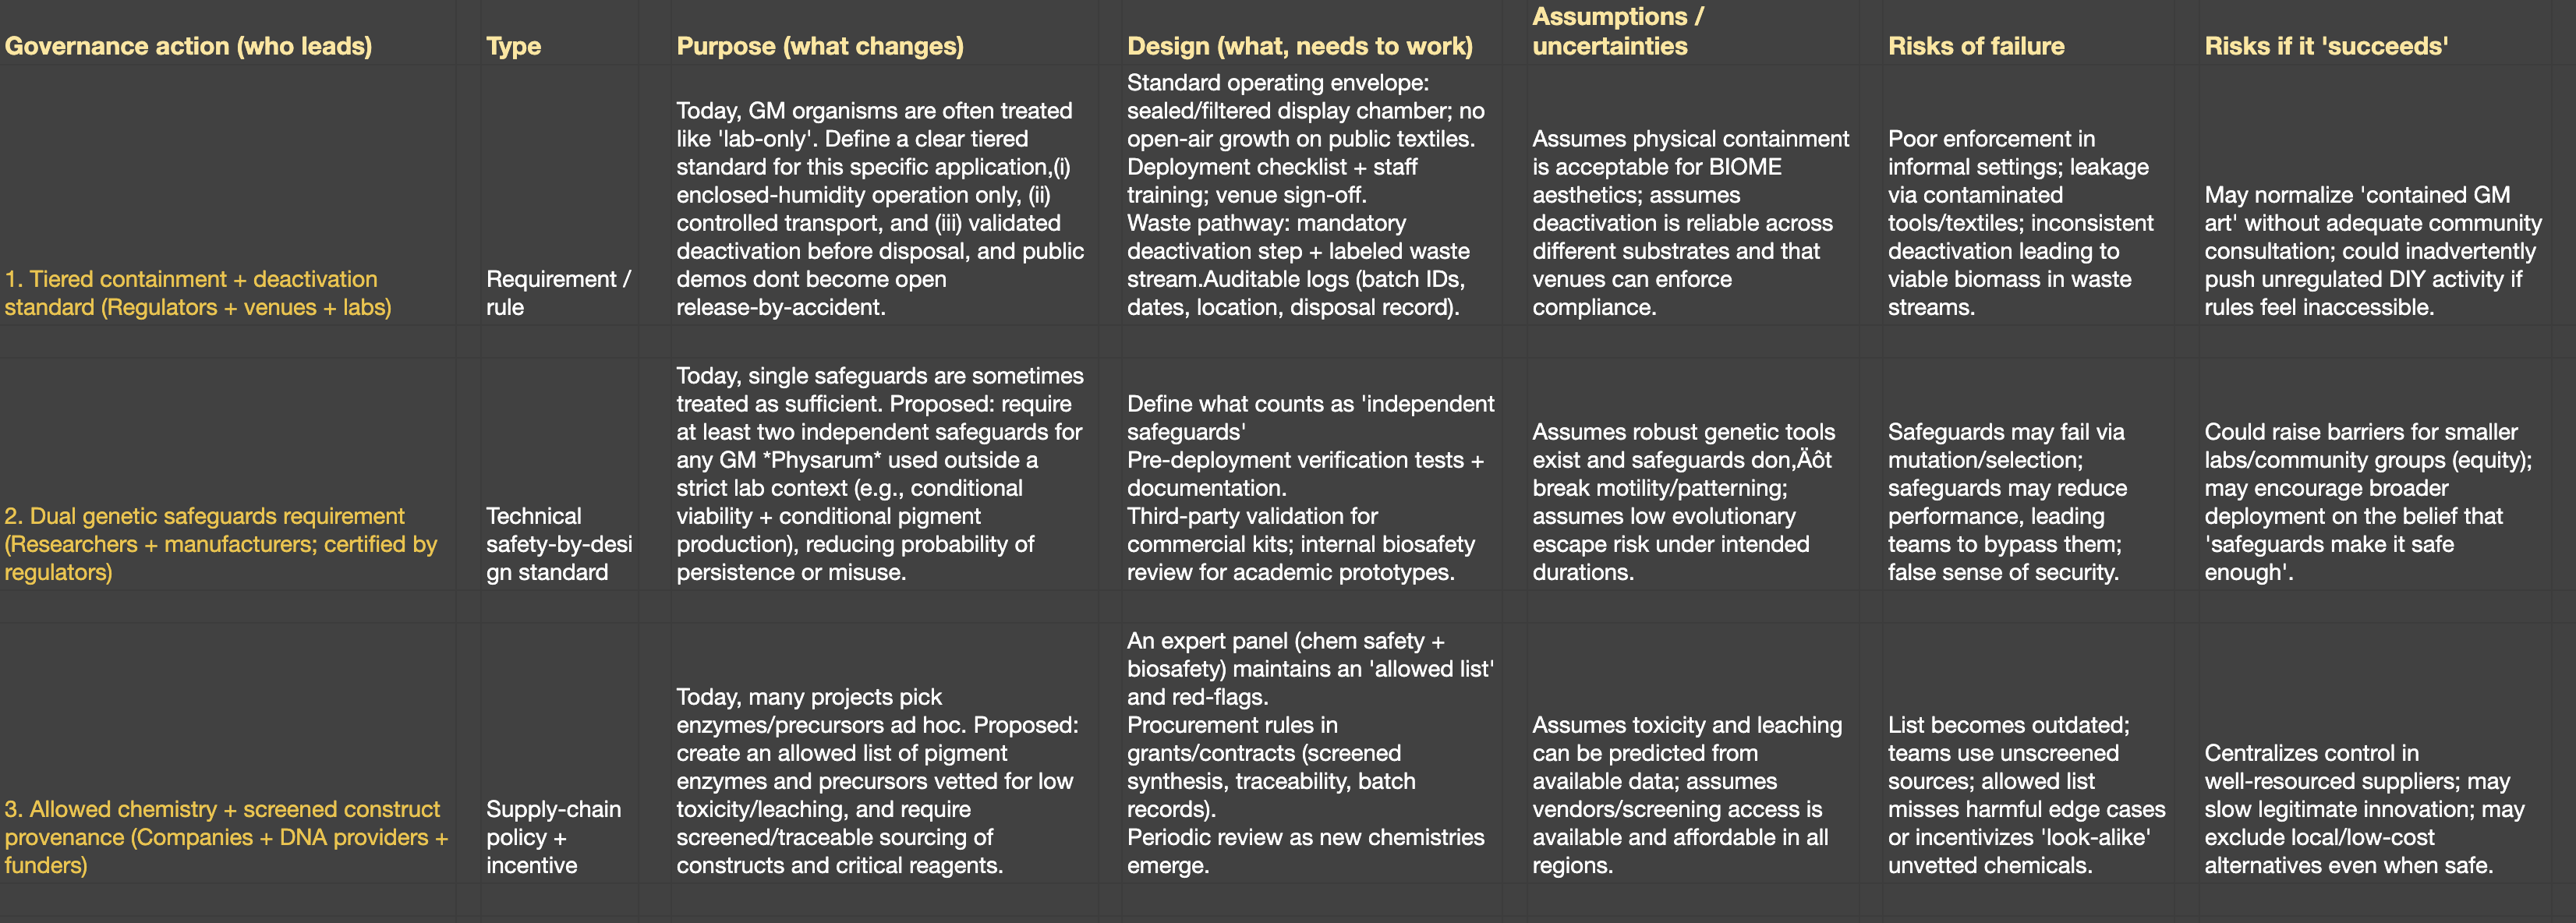
3.Governance actions
Tiered Containment + Targeted Efficacy Testing
Purpose: Currently, GMO-based products face generic biosafety review not tailored to organisms that move and leave residues. This option proposes a tiered, risk-scaled containment framework specific to motile GMOs used in consumer applications — with physical, biological, and procedural containment requirements scaling with risk level.
Design: Requires engagement from regulatory actors (EPA, FDA, or equivalent national agencies), academic researchers to define risk tiers, and manufacturers to implement. Needs standardized testing protocols for motility, residue toxicity, and allergenicity before market entry.
Assumptions: Assumes regulators can distinguish between organisms by risk profile and that motility is a meaningful risk differentiator. Also assumes adequate testing infrastructure exists at the manufacturer level.
Risks of Failure & “Success”: If tiers are drawn too broadly, low-risk applications face unnecessary delays. If too narrowly, high-risk ones slip through. “Success” could standardize a framework that inadvertently excludes small-scale or community lab innovators due to compliance costs.
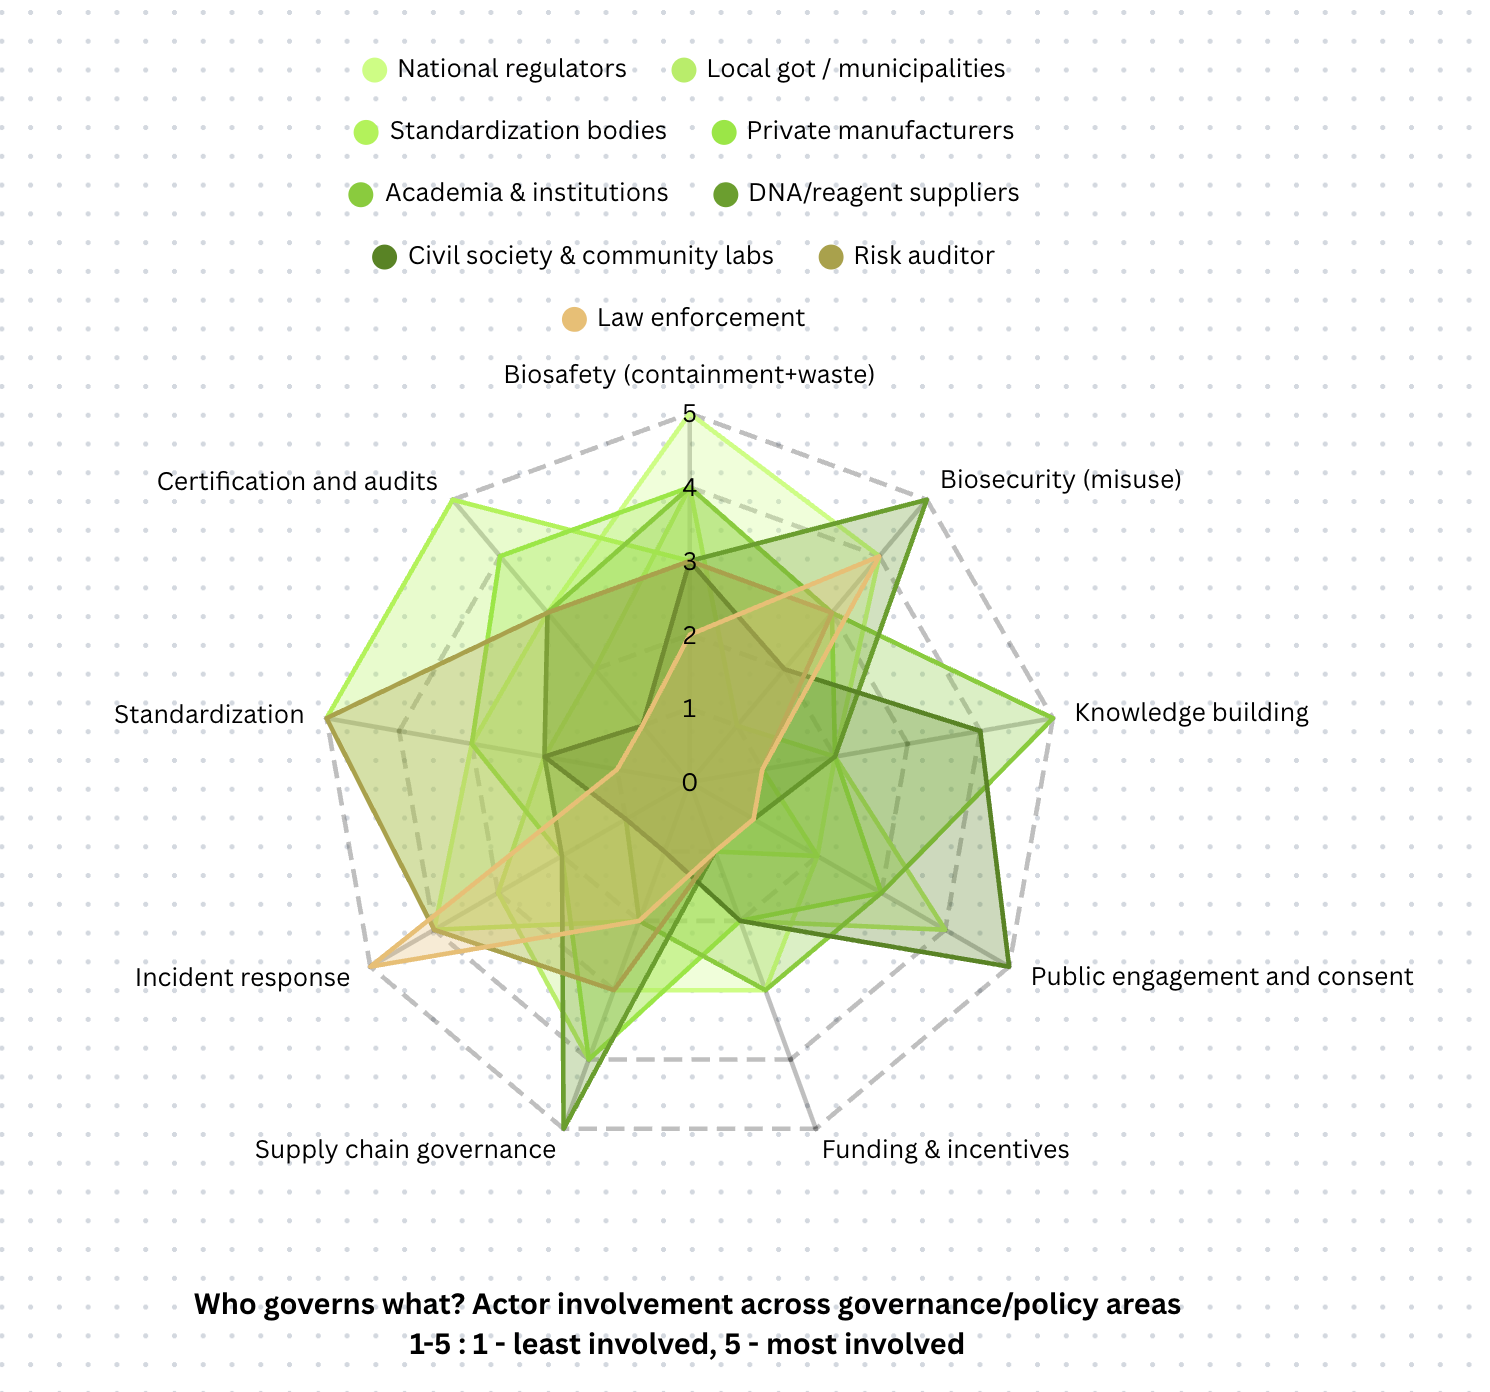
A radial graph to show the level of involvement of different actors in enforcing policies
5. Ideal combination
My choice of policies is to combine Dual safeguard and screening of developed application + Standardizing end-of-life management
Choosing option 1 would reduce the scope of innovation, but Option 2 that ensures thourough assessment of the modified product whcih enables it to be replicated and scaled widely. It also mitigates concerns like pathogenic propogation risks, mutations in local environments, and/or any unintended consequences since a standardized model of development will be certified and followed.
Standardization of post-use processes also ensures responsible disposal of the product again, applied to the same scale.
Answers to questions from Professor Jacobson
DNA Polymerase has an inherent error rate of 1 in (10^{5}) to (10^{6}) bases. Human genome’s size is (\approx 3\times 10^{9}) base pairs. If replication is 100 percent efficient 0 errors would occur. With mistakes at (10^{-5}) rate it would result in 30,000 to 50,000 errors. Due to post replication mismatch error the final error rate in human cells is reduced to less than 10 mutations per genome per replication. To deal with this, enzymes ((\delta ) and (\epsilon )) check each nucleotide as they go, removing mispaired bases instantly, increasing accuracy 100-fold. After replication fork passes special repair proeins scan newly synthesized DNA for mismatches that slipped past the proofreading step and throughout the cell cycle other mechanisms like base excision repair nucleotide excision repair fixes spontaneous damage that could possibly cause a failure.
An average human protein (~450-500 amino acids) can be coded by different DNA sequences, potentially exceeding (10^{100}) possibilities, due to the genetic code’s degeneracy (61 codons for 20 amino acids). The reasons for failure to produce functional proteins are due to cases of improper protein folding, premature stop codons, incorrect splicing etc.
Answers to questions from Dr.LeProust
The mist used method currently is solid-phase phosphoramidite chemistry.
It is difficult due to exponential accumulation of minor chemical errors and significant drops in overall yield.
It is again not possible due to the limitations of the phosphoramidite chemistry. While it is possible to make them assembling shorter, multiple, purified and error checked oligonucleotides of around 50-100 bases long, attempting to make it in one go may result in extremely low yields, high error rates, inability to purify long correct and single stranded molecule.
Answers to quesitons from Prof. George Church
The 10 essential amino acids are lysine, methionine, tryptophan, threonine, valine, isoleucine, leucine, arginine, histidine and phenylalanine. 10 amino acids I think lysine contingency is not a failsafe biocontainment strategy, it is available in food. It is a good way to look at what started as an example from fiction, to understanding biocontainment in real -life scenarios. What will happen if a synthetic organism is released in the wild, or how will it evolve as natural forces act upon it.
Ethical Reflections from Week 1
One concern that emerged from this week’s lecture is the ambiguity around who bears responsibility when a biological system behaves unexpectedly at scale — particularly with organisms like Physarum polycephalum that are not traditionally considered “engineered” yet are being modified for commercial purposes. The Lysine Contingency discussion highlighted how biocontainment strategies that seem robust in theory may be insufficient in natural environments with abundant nutrient availability.
Week 11 HW: Bioproduction and Cloud Labs
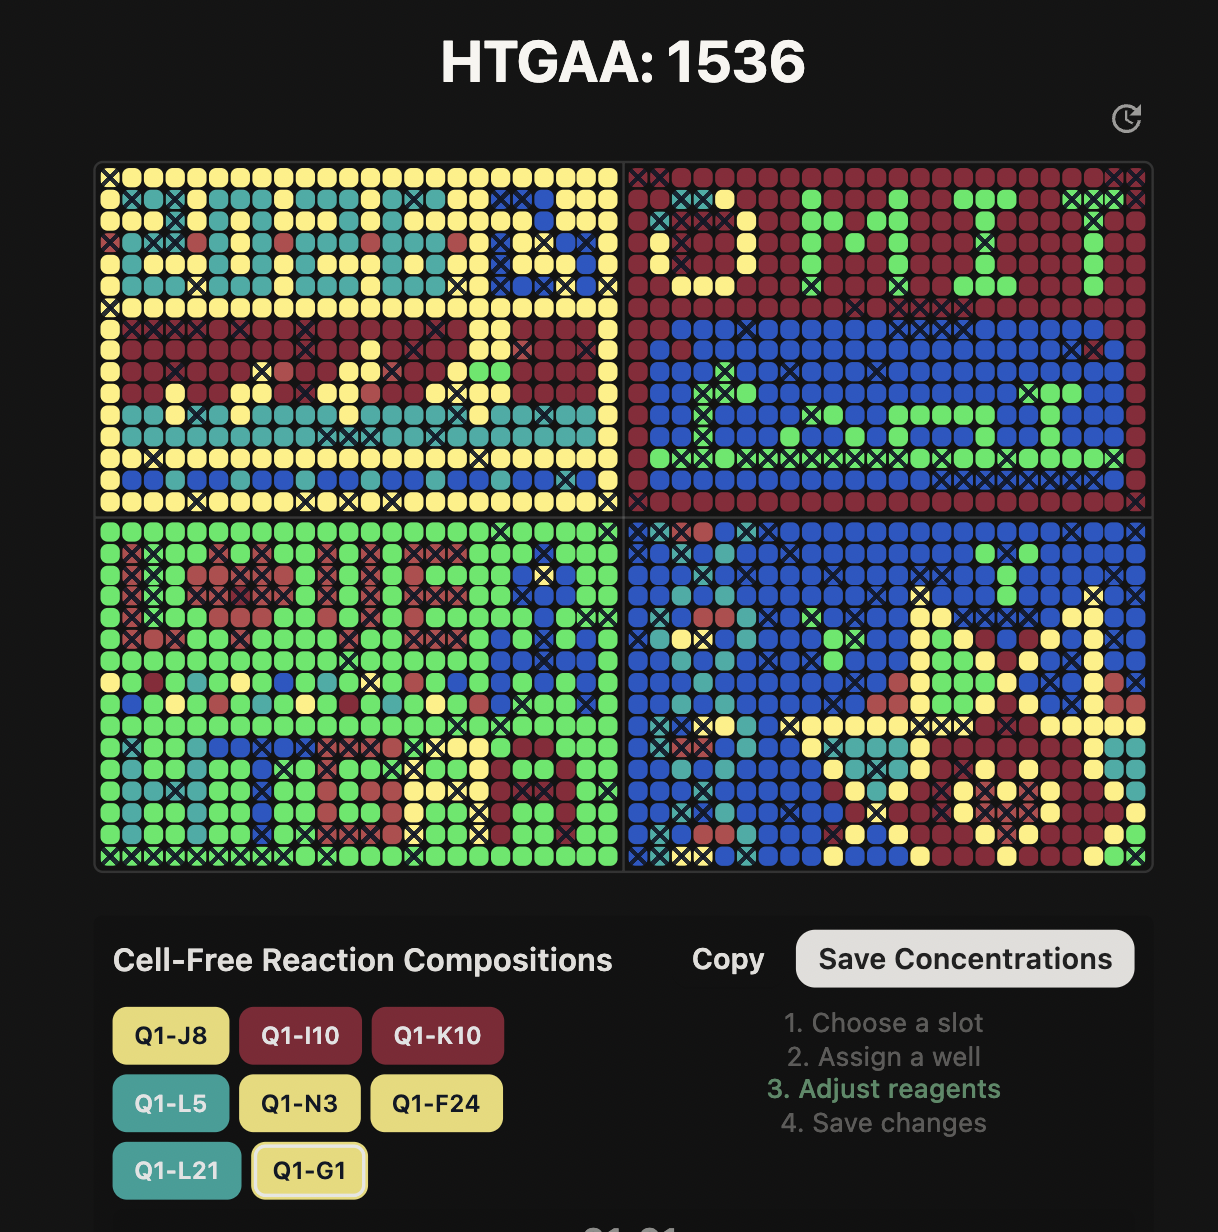
Part A: Pixel Artwork Canvas | Collective Artwork
This was great fun and I kept open multiple tabs and in incognito to quickly fill up boxes (Thanks Georg for the trick!) and somehow managed having parts of my work in the final artwork. For reference I started making the ducks in the first quadrant and someone decided to take it ahead and keep them till the end :)
I ended up being #26 on the leaderboard too!
Something for the next year could be maybe a real-time display of who is hovering around and editing the board (something similar to when you can see where people are on google slides). But this also was super fun!
Part B: Cell-Free Protein Synthesis | Cell-Free Reagents
Referencing the cell-free protein synthesis reaction composition (the middle box outlined in yellow on the image above, also listed below), provide a 1-2 sentence description of what each component’s role is in the cell-free reaction.
BL21 (DE3) Star Lysate (includes T7 RNA Polymerase) provides the complete transcription and translation machinery (ribosomes, tRNAs, elongation factors, chaperones), with the DE3 strain supplying T7 RNA Polymerase to transcribe plasmid DNA under a T7 promoter into translatable mRNA.
Salts/Buffer
Potassium Glutamate (312.6 mM): The dominant monovalent salt that stabilizes ribosomes and mimics the ionic environment of the cytoplasm, supporting efficient translation.
HEPES-KOH pH 7.5 (45.00 mM): Maintains the reaction at a stable, physiologically relevant pH throughout the 20-hour incubation, preventing enzymatic inactivation from pH drift.
Magnesium Glutamate (7.0 mM): Supplies Mg²⁺, an essential cofactor for ribosome integrity, nucleotide stabilization, and polymerase activity.
Potassium Phosphate 1.6:1 dibasic:monobasic (5.6 mM) & monobasic:dibasic (5.6 mM): This paired phosphate buffer system provides additional pH buffering and inorganic phosphate to support nucleotide regeneration and energy metabolism over the extended reaction time.
Energy / Nucleotide System
Ribose (77.4 mM): The central energy and nucleotide precursor in this NMP-Ribose system; cellular enzymes in the lysate use ribose to regenerate nucleotides and sustain energy metabolism across the full 20-hour reaction, enabling sustainable protein production.
Glucose (6.9 mM): Supplements ribose as a carbon/energy source, feeding glycolytic and metabolic pathways in the lysate to help regenerate ATP and maintain energy charge.
AMP (600.00 µM) & UMP (400.00 µM) & CMP (400.00 µM): These nucleoside monophosphates are the building blocks phosphorylated by lysate kinases into their triphosphate forms (ATP, UTP, CTP) for use in transcription; notably AMP is supplied at the highest concentration reflecting ATP’s dominant role in energy currency and transcription.
GMP (0.00 µM): Notably absent/zero in this formulation, suggesting that guanosine nucleotides are instead derived entirely from the guanine base supplied separately via salvage pathways.
Guanine (200 µM): A free nucleobase that is salvaged by lysate enzymes and converted to GMP and ultimately GTP, supplying the guanosine nucleotides needed for transcription initiation and ribosome function without adding GMP directly.
Translation Mix (Amino Acids)
17 Amino Acid Mix (4.10 mM): Provides the majority of the 20 standard amino acids as substrates for ribosomal peptide bond formation during translation.
Tyrosine pH 12 (4.10 mM): Tyrosine’s poor solubility at neutral pH requires it to be dissolved at pH 12 and added separately to ensure it is present at sufficient concentration without crashing out of solution.
Cysteine (4.00 mM): Added separately due to its chemical instability and oxidation sensitivity; its concentration is also independently tunable for proteins requiring precise redox conditions or disulfide bonds.
Nicotinamide (3.10 mM): A NAD⁺ precursor that replenishes the lysate’s nicotinamide cofactor pool, sustaining the redox reactions and energy regeneration enzymes that keep the reaction productive over the full 20-hour incubation.
Nuclease-Free Water: Brings the master mix to its final working volume without introducing RNases or DNases that would degrade the mRNA template or DNA plasmid, which would be particularly damaging over a long 20-hour reaction.
Describe the main differences between the 1-hour optimized PEP-NTP master mix and the 20-hour NMP-Ribose-Glucose master mix.
The most fundamental difference between the two formulations lies in their energy and nucleotide supply strategy. The 1-hour PEP/NTP system provides nucleotides in their fully phosphorylated triphosphate forms (ATP, GTP, CTP, UTP) along with phosphoenolpyruvate (PEP-Mono) and Maltodextrin 17 as immediate high-energy phosphate donors for rapid, front-loaded transcription and translation, whereas the 20-hour NMP-Ribose system supplies nucleotides as monophosphates (AMP, CMP, UMP) and relies on ribose and glucose as metabolic precursors that are gradually processed by lysate enzymes to regenerate energy over a sustained period. The 1-hour formulation also includes several additives like Spermidine, DMSO, cAMP, NAD, and Folinic Acid that work together to boost immediate transcriptional and translational efficiency, where for example spermidine stabilizes nucleic acids, cAMP activates metabolic pathways, and folinic acid supports one-carbon metabolism, while the 20-hour formulation simplifies this and relies solely on Nicotinamide to maintain redox cofactor pools throughout the longer reaction. There are also notable differences in salt concentrations between the two, with the 1-hour mix using slightly higher Potassium Glutamate (330.47 mM vs. 312.6 mM) and more HEPES (80 mM vs. 45 mM), which likely reflects optimization for a short burst of high activity rather than the more stable ionic environment needed to keep enzymes functional across a full 20-hour incubation.
Part C: Planning the Global Experiment | Cell-Free Master Mix Design
Given the 6 fluorescent proteins we used for our collaborative painting, identify and explain at least one biophysical or functional property of each protein that affects expression or readout in cell-free systems.
Here are the key biophysical or functional properties for each of the six fluorescent proteins used in the collaborative painting:
1. sfGFP (Superfolder GFP)
sfGFP was specifically engineered with folding and solubility-enhancing mutations that allow it to fold robustly even when fused to poorly folded polypeptides, and it shows increased thermal stability and superior resistance to chemical denaturants compared to conventional GFPs. In a cell-free context, this makes sfGFP a highly reliable reporter since its robust folding characteristics mean it can mature efficiently even in the relatively unstructured, open environment of a lysate-based reaction.
2. mRFP1
mRFP1 is reported to be a somewhat slowly-maturing monomer, though it still matures more than 10 times faster than its tetrameric predecessor DsRed, with lower extinction coefficient, quantum yield, and photostability as tradeoffs. In a cell-free system, its relatively slow maturation and reduced brightness compared to newer RFPs means that significant incubation time is needed before a strong red fluorescence signal can be detected, which is particularly relevant when interpreting endpoint reads of a short reaction.
3. mKO2 (monomeric Kusabira-Orange 2)
mKO2 is a mutant of mKO1 that was specifically engineered to feature rapid maturation while maintaining the brilliance and pH stability of the parent Kusabira-Orange protein. However, it does exhibit moderate acid sensitivity, which is worth considering in cell-free systems where pH can drift during extended incubation, potentially quenching the orange fluorescence signal over time.
4. mTurquoise2
mTurquoise2’s maturation kinetics are complex and cannot be captured by a single exponential, and in vivo characterization placed it among the slowest-maturing cyan fluorescent proteins tested, requiring a two-step maturation model. Despite this slow maturation being a potential limitation for short cell-free reactions, mTurquoise2 compensates with an exceptionally high quantum yield of 0.93, making it one of the brightest cyan fluorescent proteins available and capable of providing strong signal even at low expression levels.
5. mScarlet-I
The single amino acid substitution T74I in mScarlet-I results in a marked acceleration of maturation compared to the parent mScarlet, though at the cost of a moderate decrease in quantum yield (0.54) and fluorescence lifetime (3.1 ns), both of which still remain higher than those of all previously engineered bright mRFPs. This faster maturation makes mScarlet-I particularly well suited for cell-free reactions, as the red fluorescence signal accumulates more quickly and can be reliably detected within the timeframe of the incubation.
6. Electra2
Electra2 is a blue fluorescent protein derived from mRuby3 (itself derived from the sea anemone Entacmaea quadricolor), and intracellular brightness measurements showed it to be over 2-fold brighter than mTagBFP2. However, like other eqFP611-derived proteins, aggregate formation is a known property of Electra2 across multiple organisms and expression contexts, which in a cell-free system could reduce the effective soluble fluorescent protein concentration and lead to an underestimation of actual expression yield if aggregates are not accounted for during fluorescence readout.
Create a hypothesis for how adjusting one or more reagents in the cell-free mastermix could improve a specific biophysical or functional property you identified above, in order to maximize fluorescence over a 36-hour incubation.
mScarlet-I — Exhibits oxygen-dependent chromophore maturation, meaning that as molecular oxygen is progressively depleted over a long incubation, late-translated mScarlet-I molecules may fail to fully mature and remain non-fluorescent despite being successfully synthesized.
As mScarlet-I chromophore maturation requires molecular oxygen and is sensitive to reducing conditions, one solution could be increasing nicotinamide to sustain the NAD⁺/NADH redox balance over the full 36-hour window, while simultaneously reducing cysteine concentration to prevent excess reducing equivalents from competing with the oxidation step required for chromophore cyclization.
In order to validate and optimize this hypothesis, the following experimental set could be performed:
Sample 1 — Control
Nicotinamide: 3.10 mM
Cysteine: 4.00 mM
Sample 2 — Increased nicotinamide only
Nicotinamide: 6.00 mM
Cysteine: 4.00 mM
Sample 3 — Reduced cysteine only
Nicotinamide: 3.10 mM
Cysteine: 2.00 mM
Sample 4 — Combined nicotinamide increase and cysteine reduction
Nicotinamide: 6.00 mM
Cysteine: 2.00 mM
The second phase of this lab will be to define the precise reagent concentrations for your cell-free experiment.
For this experiment, 8 wells were designed across two fluorescent protein hypotheses, both building on the 20-hour NMP-Ribose master mix preset as a baseline.
The first set of 4 wells targets mScarlet-I, which requires molecular oxygen for chromophore maturation and is sensitive to reducing conditions over extended incubations. The hypothesis is that increasing nicotinamide concentration will sustain the NAD⁺/NADH redox balance across the full 36-hour reaction, supporting the oxidative environment needed for late-translated mScarlet-I molecules to fully mature. Wells J8 (control, 3.125 mM), I10 (4.500 mM), K10 (6.000 mM), and L5 (8.000 mM) form a nicotinamide gradient to identify the optimal concentration for maximizing red fluorescence endpoint readout.
The second set of 4 wells targets mKO2, which exhibits pH sensitivity that can cause fluorescence loss as the reaction environment acidifies over time. The hypothesis is that strengthening the buffer system will maintain pH 7.5 throughout the 36-hour incubation, preserving mKO2 fluorescence intensity. Wells N3 (control), F24 (HEPES 60 mM), L21 (HEPES 75 mM), and G1 (HEPES 60 mM + potassium phosphate dibasic/monobasic both at 7.500 mM) test increasing buffer capacity both through HEPES alone and in combination with elevated phosphate support.
The metadata was then submitted to opentrons google form
Post-Lab Questions
1. Published Paper Using Lab Automation
Wierenga, R. P., et al. (2022). “Opentrons OT-2 as a low-cost liquid handling solution for automated cell culture and high-throughput biological experiments.” PLOS ONE. This paper demonstrated that the Opentrons OT-2 could be used to automate cell culture media exchanges, serial dilutions, and compound screening workflows that would otherwise require constant manual intervention. The authors showed that the robot could reliably perform these tasks with reproducibility comparable to manual pipetting, while significantly reducing hands-on time and human error — enabling experiments at a scale that would be impractical to run manually.
The key insight for my work is that automation is not just about speed — it is about spatial precision and reproducibility of deposition, which is directly relevant to creating consistent bio-dyed patterns across fabric surfaces.
2. Automation Plan for Final Project
My final project involves using Physarum polycephalum to create one-of-one dyed patterns on fabric surfaces by letting the organism grow and leave behind a pigment trail. While the organism’s path is inherently unpredictable (which is the artistic intent), the setup conditions need to be precisely controlled and reproducible for the biology to work consistently.
I would use the Opentrons OT-2 to automate the preparation stage of the experiment:
Automated workflow (pseudocode):
Load reservoir plate with:
Well A1: humectant/binder coating solution
Well A2: phenolic precursor substrate solution
Well A3: growth medium for Physarum inoculation
For each fabric sample (n=6, arranged in a 6-well plate):
aspirate(50 µL, reservoir[“A1”])
dispense evenly across well surface to coat fabric
wait(120 seconds) # allow coating to partially dry
For each well:
aspirate(20 µL, reservoir[“A2”])
dispense(well) # add precursor substrate on top of binder
Manual step: inoculate each well with Physarum plasmodium
at defined starting position
Automated imaging at fixed intervals (external camera trigger)
to document trail growth over 24-48 hours
This setup ensures the binder and substrate layers are applied at consistent volumes and uniformly across the fabric surface — two variables that strongly affect whether the pigment precipitates cleanly along the slime trail. Inconsistent coating thickness in manual application was identified as a likely source of variability in early experiments.
A 3D-printed fabric holder sized to sit inside a standard 6-well plate would allow the fabric swatches to be held flat during robotic dispensing.
Final Project Ideas
I submitted 1–3 slides to the Committed Listeners final project slide deck with the following ideas:
Physarum Polycephalum Bio-Dyeing — Engineering Physarum polycephalum to express a pigment-forming enzyme (tyrosinase/laccase) that reacts with a pre-coated fabric substrate to leave a permanent dyed trail as the organism forages across the surface. The goal is one-of-one textile art driven by biological growth behavior.
Slime Mould as a Living Sensor — Using the foraging behaviour of Physarum as a readout for environmental conditions (humidity gradients, chemical attractants/repellents) by encoding the gradient as a spatial pattern of growth, readable as a visual output on a surface.
Working with mycelium to make heat sensititve products — Designing a Ganordermma lucidum to express colour on heat stress and utilizing it to make a heat sensitive jacket. Exploring interaction with living materials through reactivity.
Week 4 HW: Protein Design Part 1
Part A: Questions by Shuguang Zhang
How many molecules of amino acids do you take with a piece of 500 grams of meat?
500g divided by 100 Da gives you about 3 × 10²⁴ molecules. So there are roughly 3 trillion trillion amino acids in a single serving of meat.
Why do humans eat beef but do not become a cow, eat fish but do not become fish?
Digestion breaks everything down to bare amino acids first. The original protein blueprint is completely destroyed. Then our ribosomes rebuild new proteins using our own genetic code, not the cow’s or the fish’s.
Why are there only 20 natural amino acids?
It is probably just a frozen evolutionary accident. Early life found 20 that worked well enough and the genetic code hardwired them in. At that point there is no going back without breaking every living thing on the planet.
Can you make other non-natural amino acids? Design some new amino acids.
You just swap out the side chain for something chemically stable. For example you can put a fluorine where the methyl group is in alanine and get fluoroalanine which is more hydrophobic and harder to degrade. You can add an azide group for click chemistry. You can even shift to beta amino acids by inserting an extra carbon in the backbone which makes them resistant to proteases.
Where did amino acids come from before enzymes that make them, and before life started?
They formed abiotically. The Miller-Urey experiment showed that just mixing early atmospheric gases with lightning produces amino acids spontaneously. They also show up on meteorites, glycine has been found in carbonaceous chondrites. No enzymes needed at all.
If you make an α-helix using D-amino acids, what handedness (right or left) would you expect?
It would be left-handed. Normal L-amino acids form right-handed helices because of their backbone dihedral angle preferences. Mirror the chirality and you mirror the helix.
Can you discover additional helices in proteins?
We already know the 3-10 helix and the pi helix exist beyond the standard alpha helix. With cryo-EM resolution improving and AlphaFold predictions getting better, there are likely more unusual helical conformations hiding in membrane proteins and intrinsically disordered regions.
Why are most molecular helices right-handed?
Because life uses L-amino acids, and L-amino acids have backbone angles that naturally favor a right-handed turn. It traces all the way back to whichever chirality got selected early in evolution and then just stuck.
Why do β-sheets tend to aggregate?
What is the driving force for β-sheet aggregation?
Edge strands have exposed hydrogen bond donors and acceptors sitting there unsatisfied. They are basically sticky edges looking for a partner. The driving force is intermolecular hydrogen bonding combined with hydrophobic burial, and water gets released in the process which makes it entropically favorable too.
Why do many amyloid diseases form β-sheets?
Can you use amyloid β-sheets as materials?
When proteins misfold under stress they expose hydrophobic patches that seed beta sheet stacking. Once that nucleus forms it is thermodynamically very stable so more protein keeps piling on. As for materials, amyloid fibers are actually incredibly strong, comparable to silk, and they are self-assembling and tunable. People are already engineering them into scaffolds, nanowires, and hydrogels.
Part B: Protein Analysis and Visualization
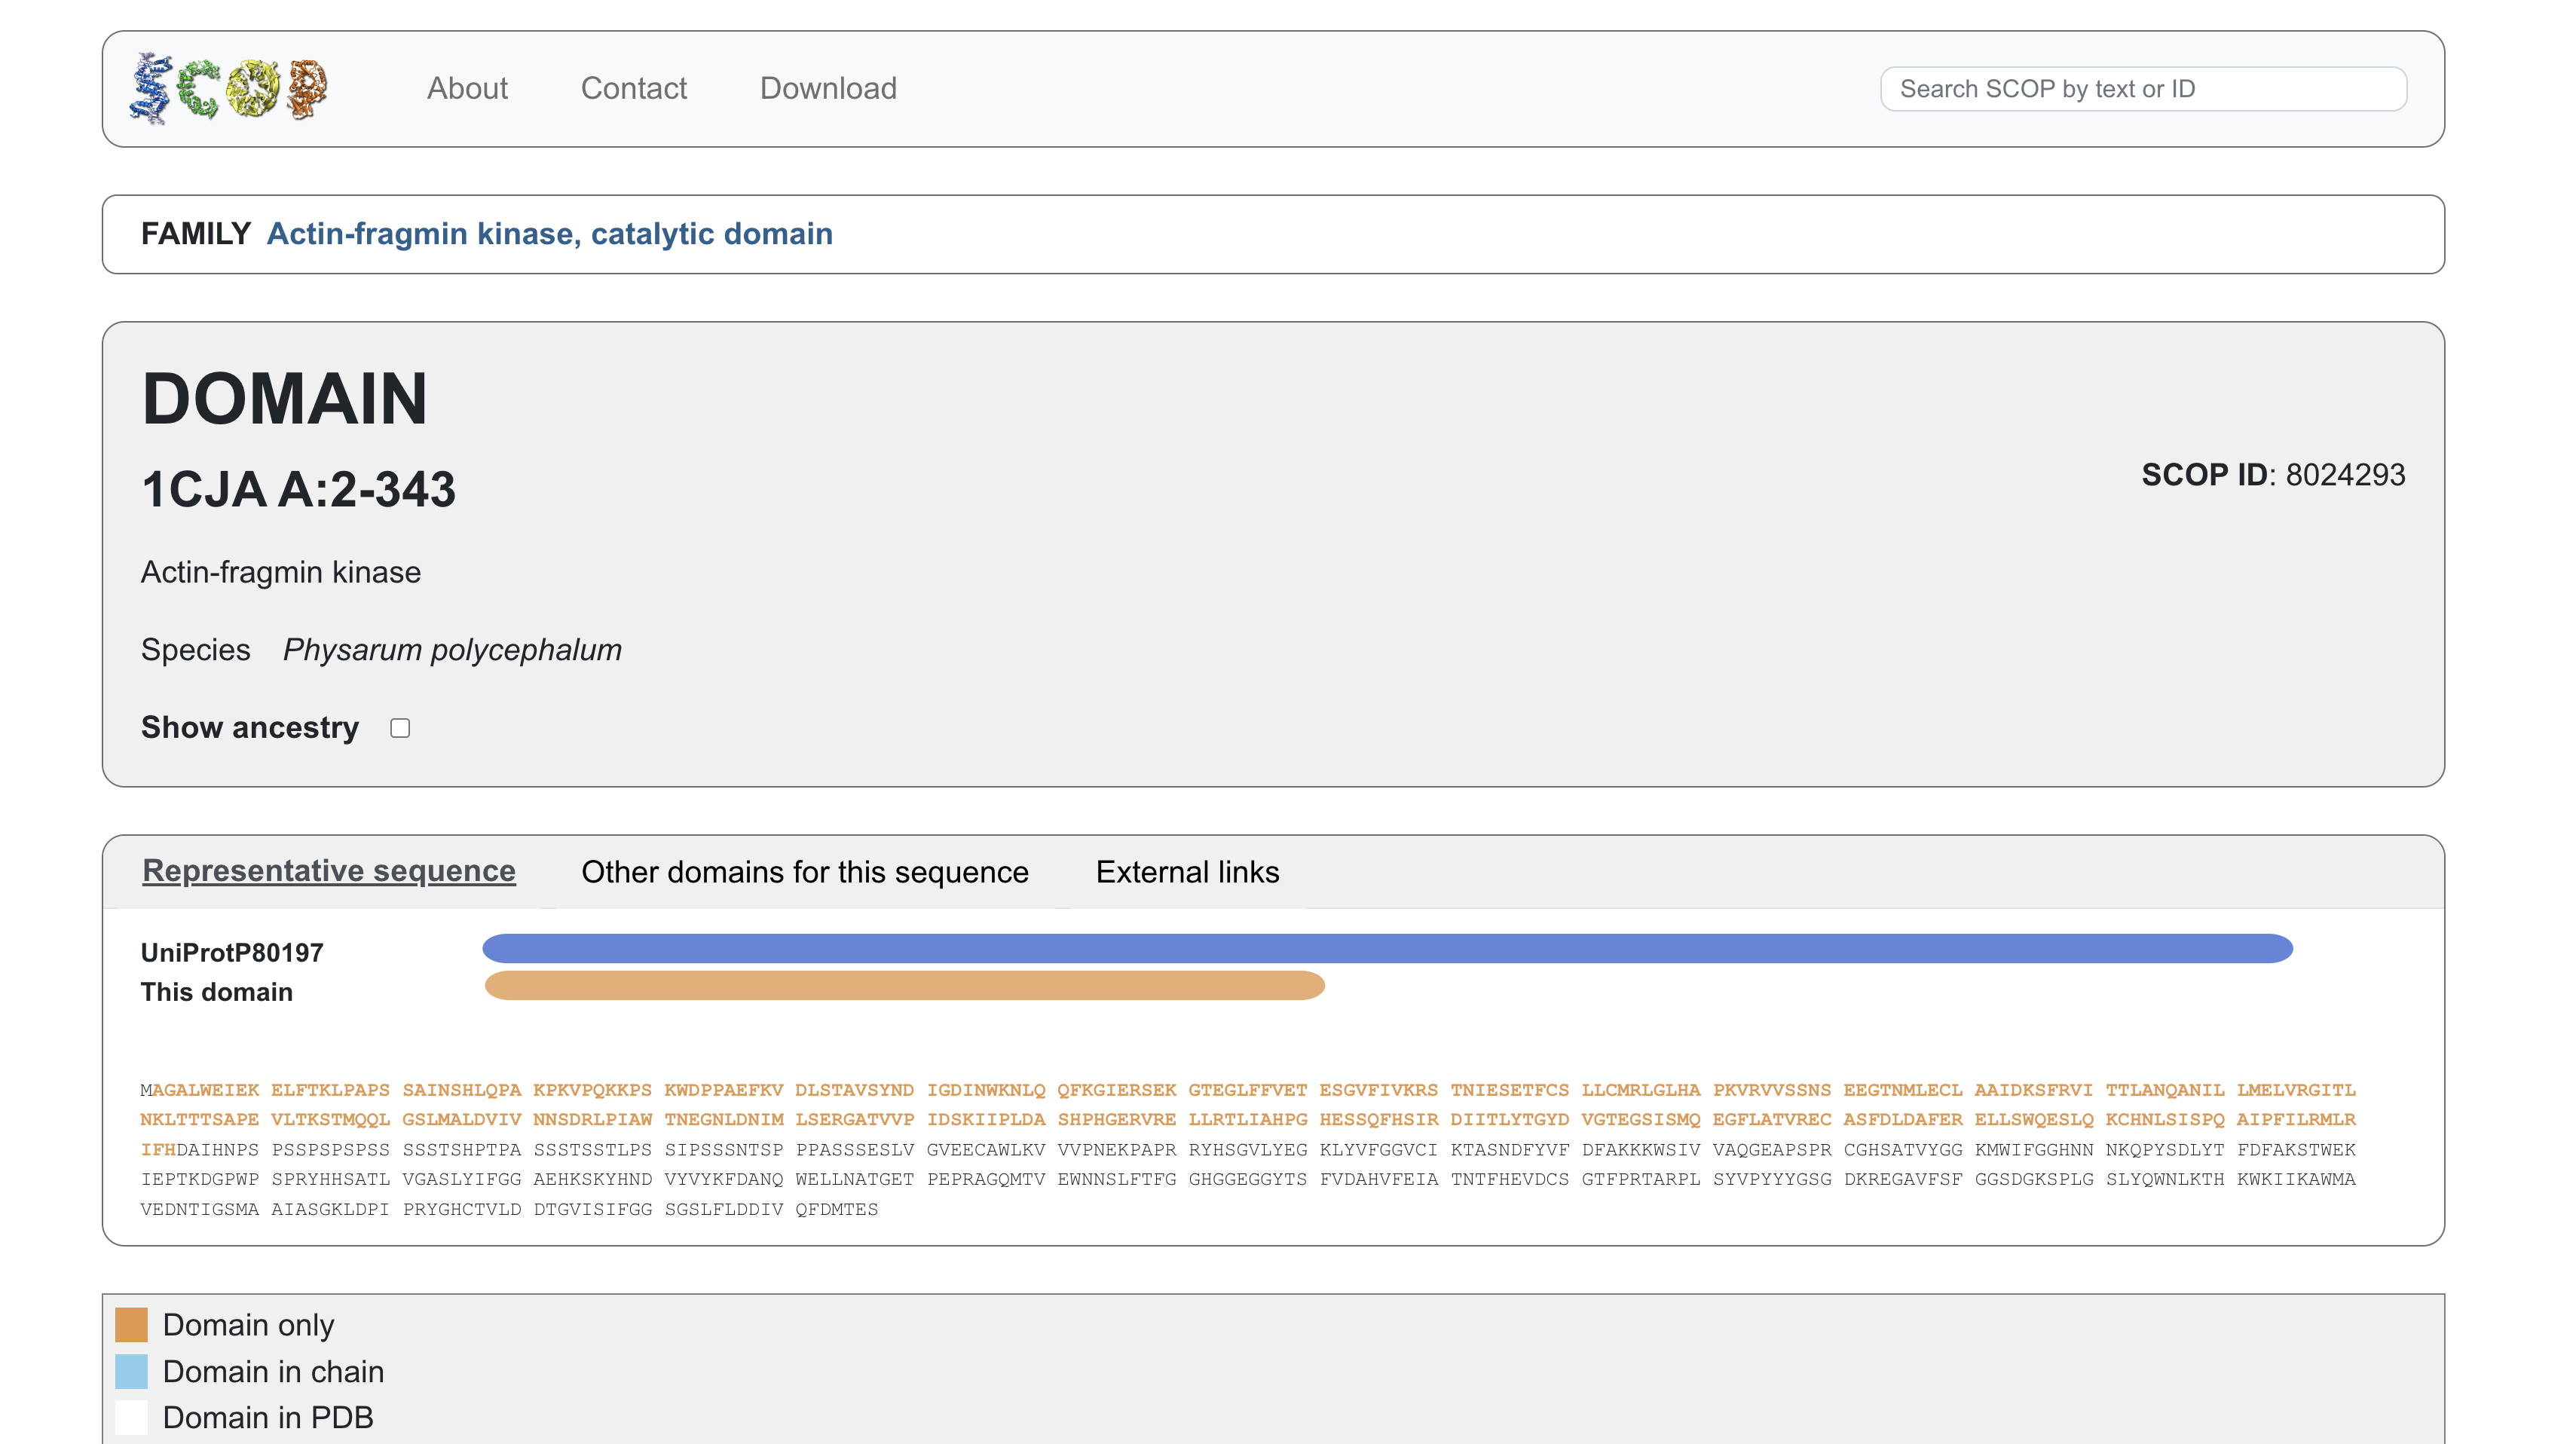
1. Briefly describe the protein you selected and why you selected it.
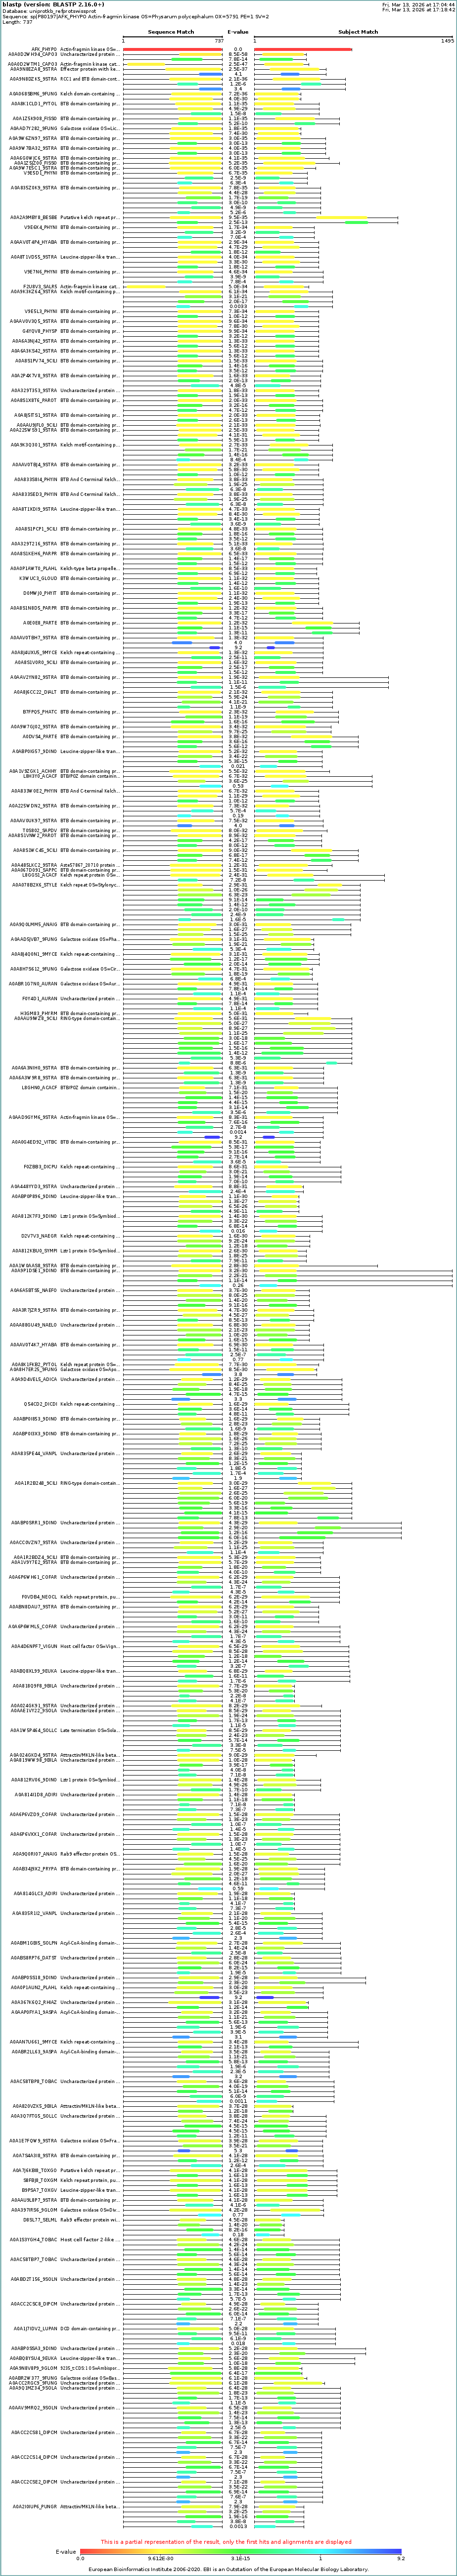
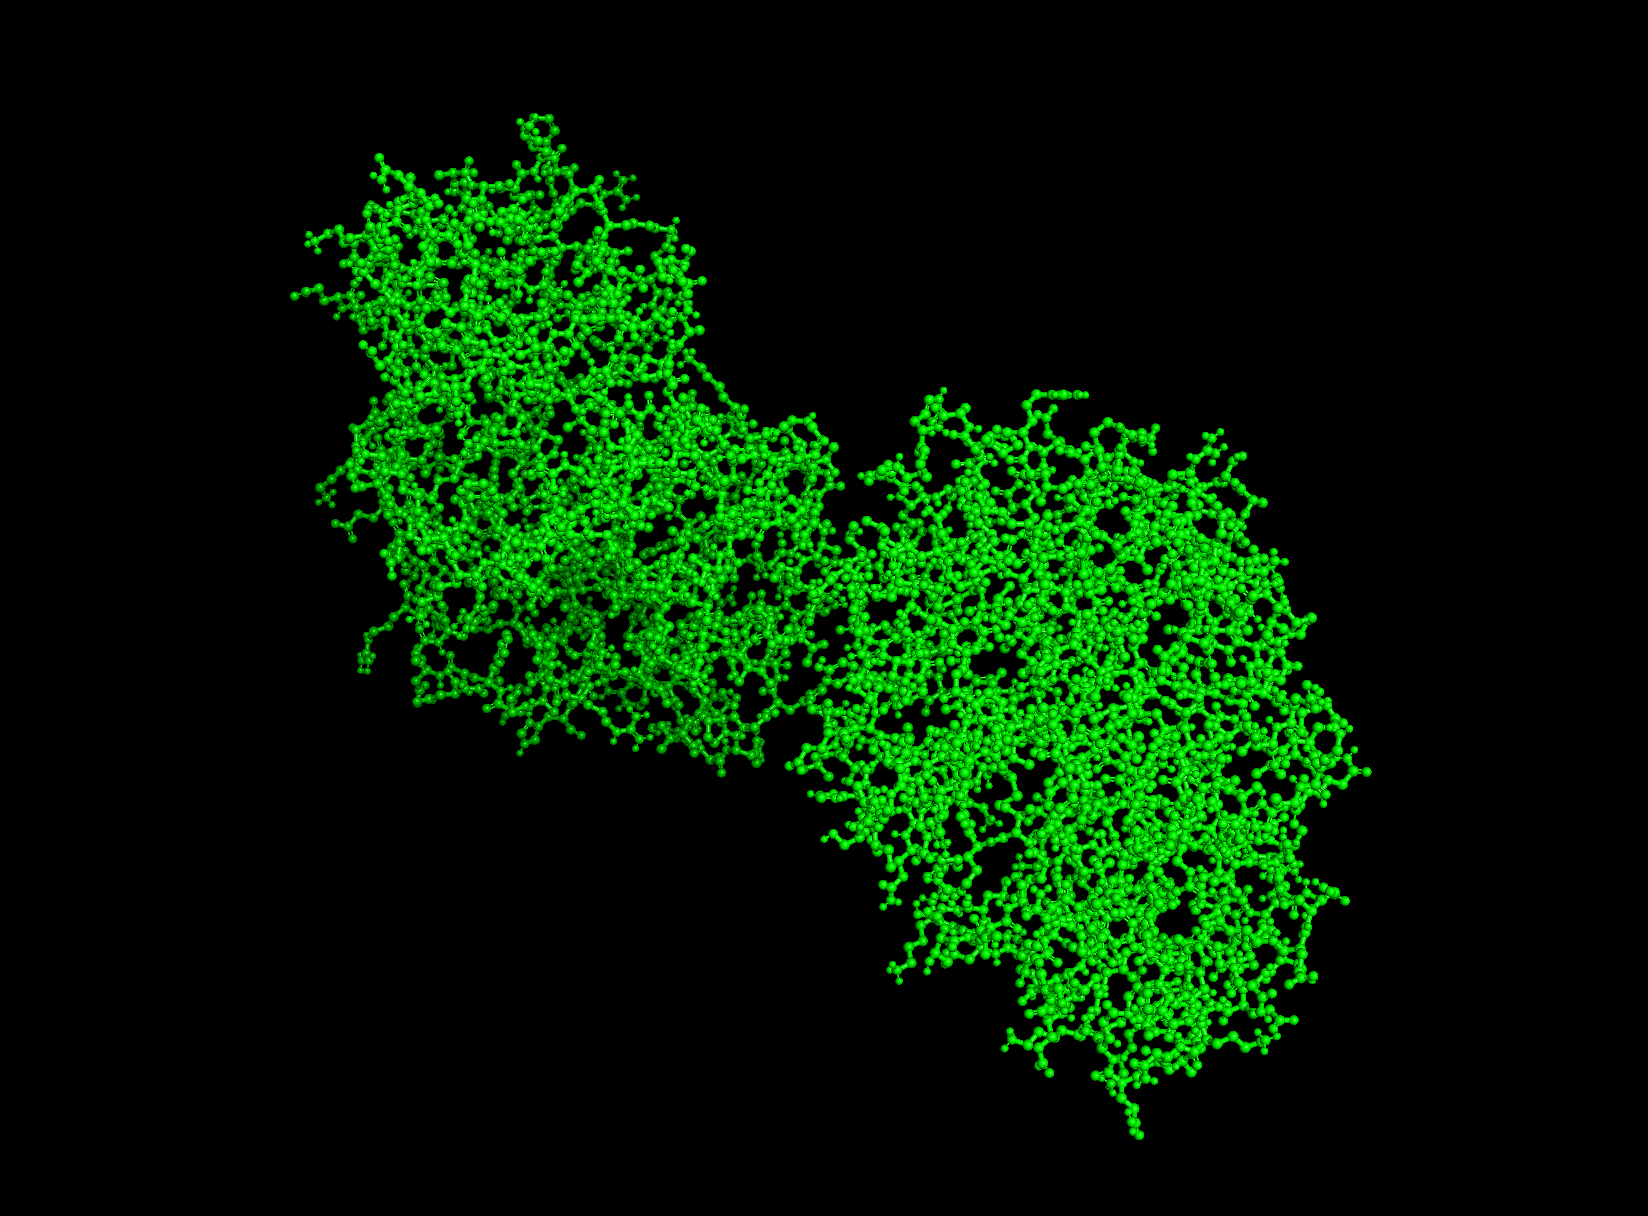
In the plasmodium of Physarum polycephalum, the F-actin capping activity of the actin-fragmin complex is regulated by phosphorylation of actin, mediated by a novel type of protein kinase with no sequence homology to eukaryotic-type protein kinases.
This protein sits at the heart of what makes Physarum behavior fascinating. The oscillatory protoplasmic streaming that drives Physarum’s decision-making and network formation depends on rapid, rhythmic reorganization of the actin cytoskeleton. AFK is the molecular switch that controls it by phosphorylating actin, it determines whether actin filaments are being capped and severed (disrupting the cytoskeleton) or allowed to grow (driving streaming). Studying this kinase is therefore studying the molecular basis of Physarum’s behavioral intelligence.
The signalling pathway results in phosphorylation of actin, and stage-dependent phosphorylation of actin is associated with morphological alterations and reorganization of the actin cytoskeleton.
2. Identify the amino acid sequence of your protein.
The protein sequence has a total length of 737 amino acids. The most frequent amino acid is Serine (S) with 84 occurrences (11.40%), followed by Leucine (L) with 58 occurrences (7.87%), and Glycine (G) with 56 occurrences (7.60%). The least frequent is Cysteine (C) with 10 occurrences (1.36%).
Protein family
AFK belongs to the eukaryotic protein kinase (ePK) superfamily structurally, but functionally it is classified as the founding member of a unique actin kinase family. It is structurally related to the phosphoinositide kinase superfamily rather than classical Ser/Thr kinases, placing it in an unusual evolutionary position.
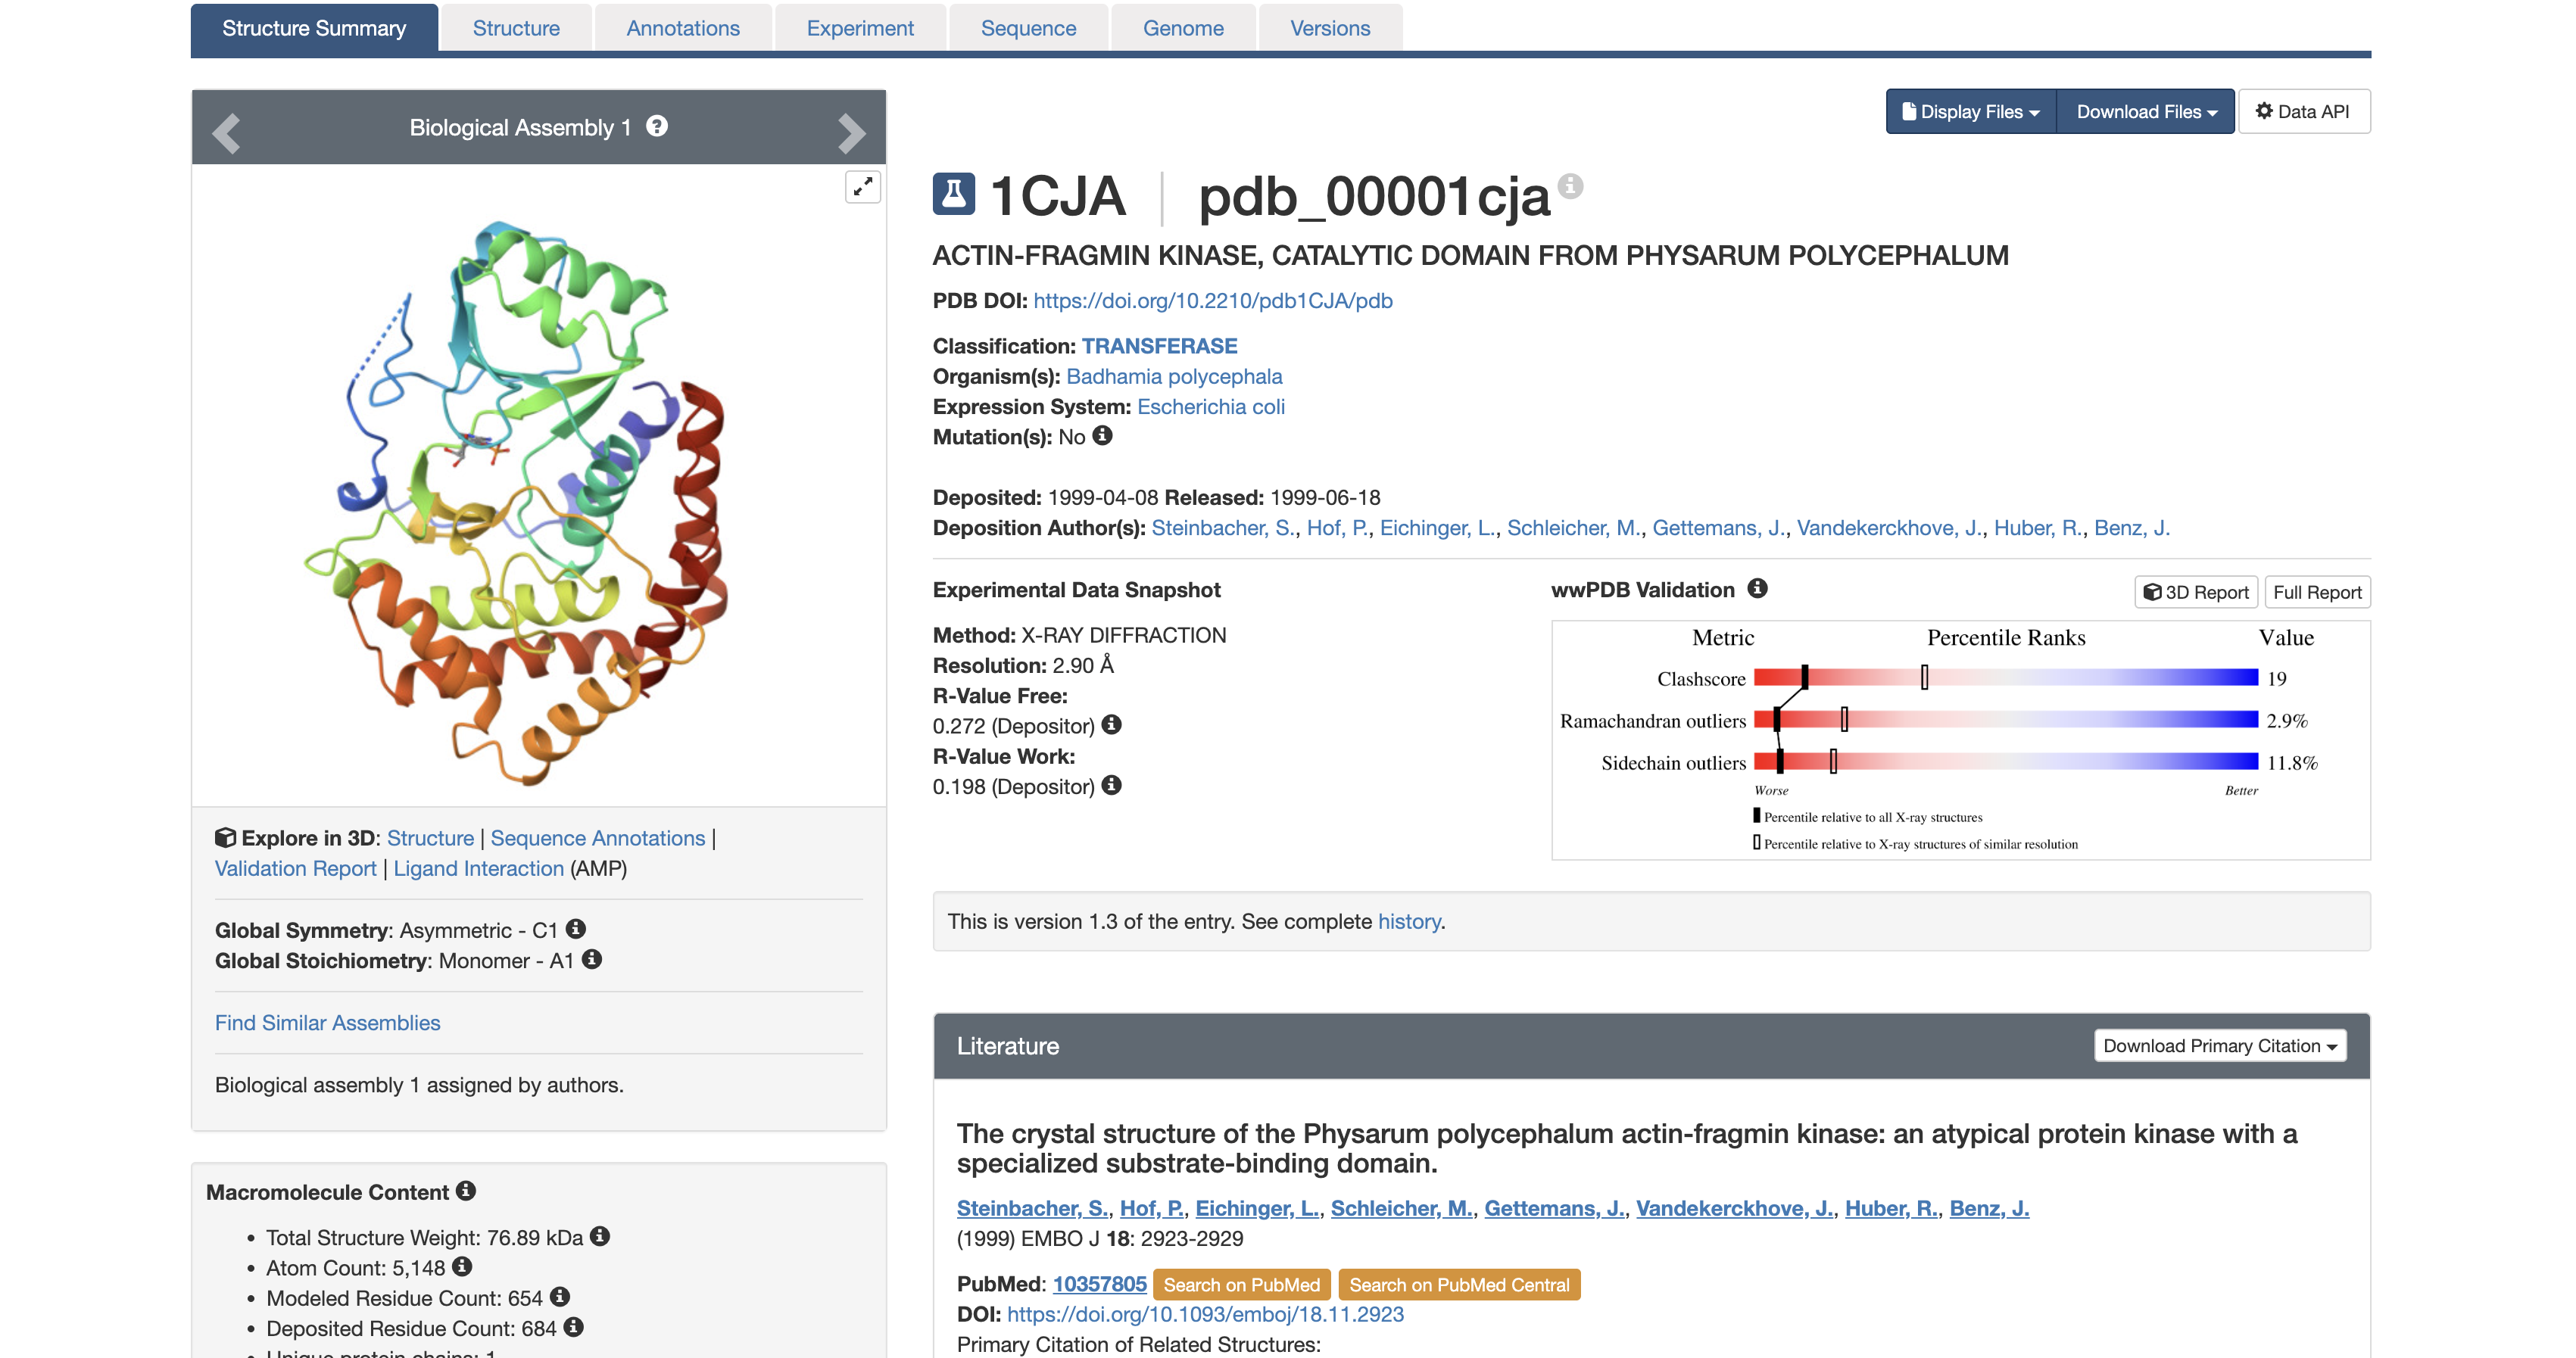
3. Identify structure page of your protein
It was solved in 1999. At 2.9 Å, you can reliably identify the backbone fold, secondary structure elements, and the position of the AMP ligand, but side-chain details are slightly less precise than higher-resolution structures.
The structure contains the protein (actin-fragmin kinase) and adenosine monophosphate (AMP).
AMP is not a random co-crystal contaminant. AMP occupies the ATP binding pocket of the kinase. This tells you precisely where the nucleotide binding site is and how the kinase is oriented to receive ATP before phosphorylating actin. In the context of Physarum behavior, this pocket is a potential target for disrupting the actin phosphorylation cycle to study what happens to streaming oscillations when AFK is inhibited.
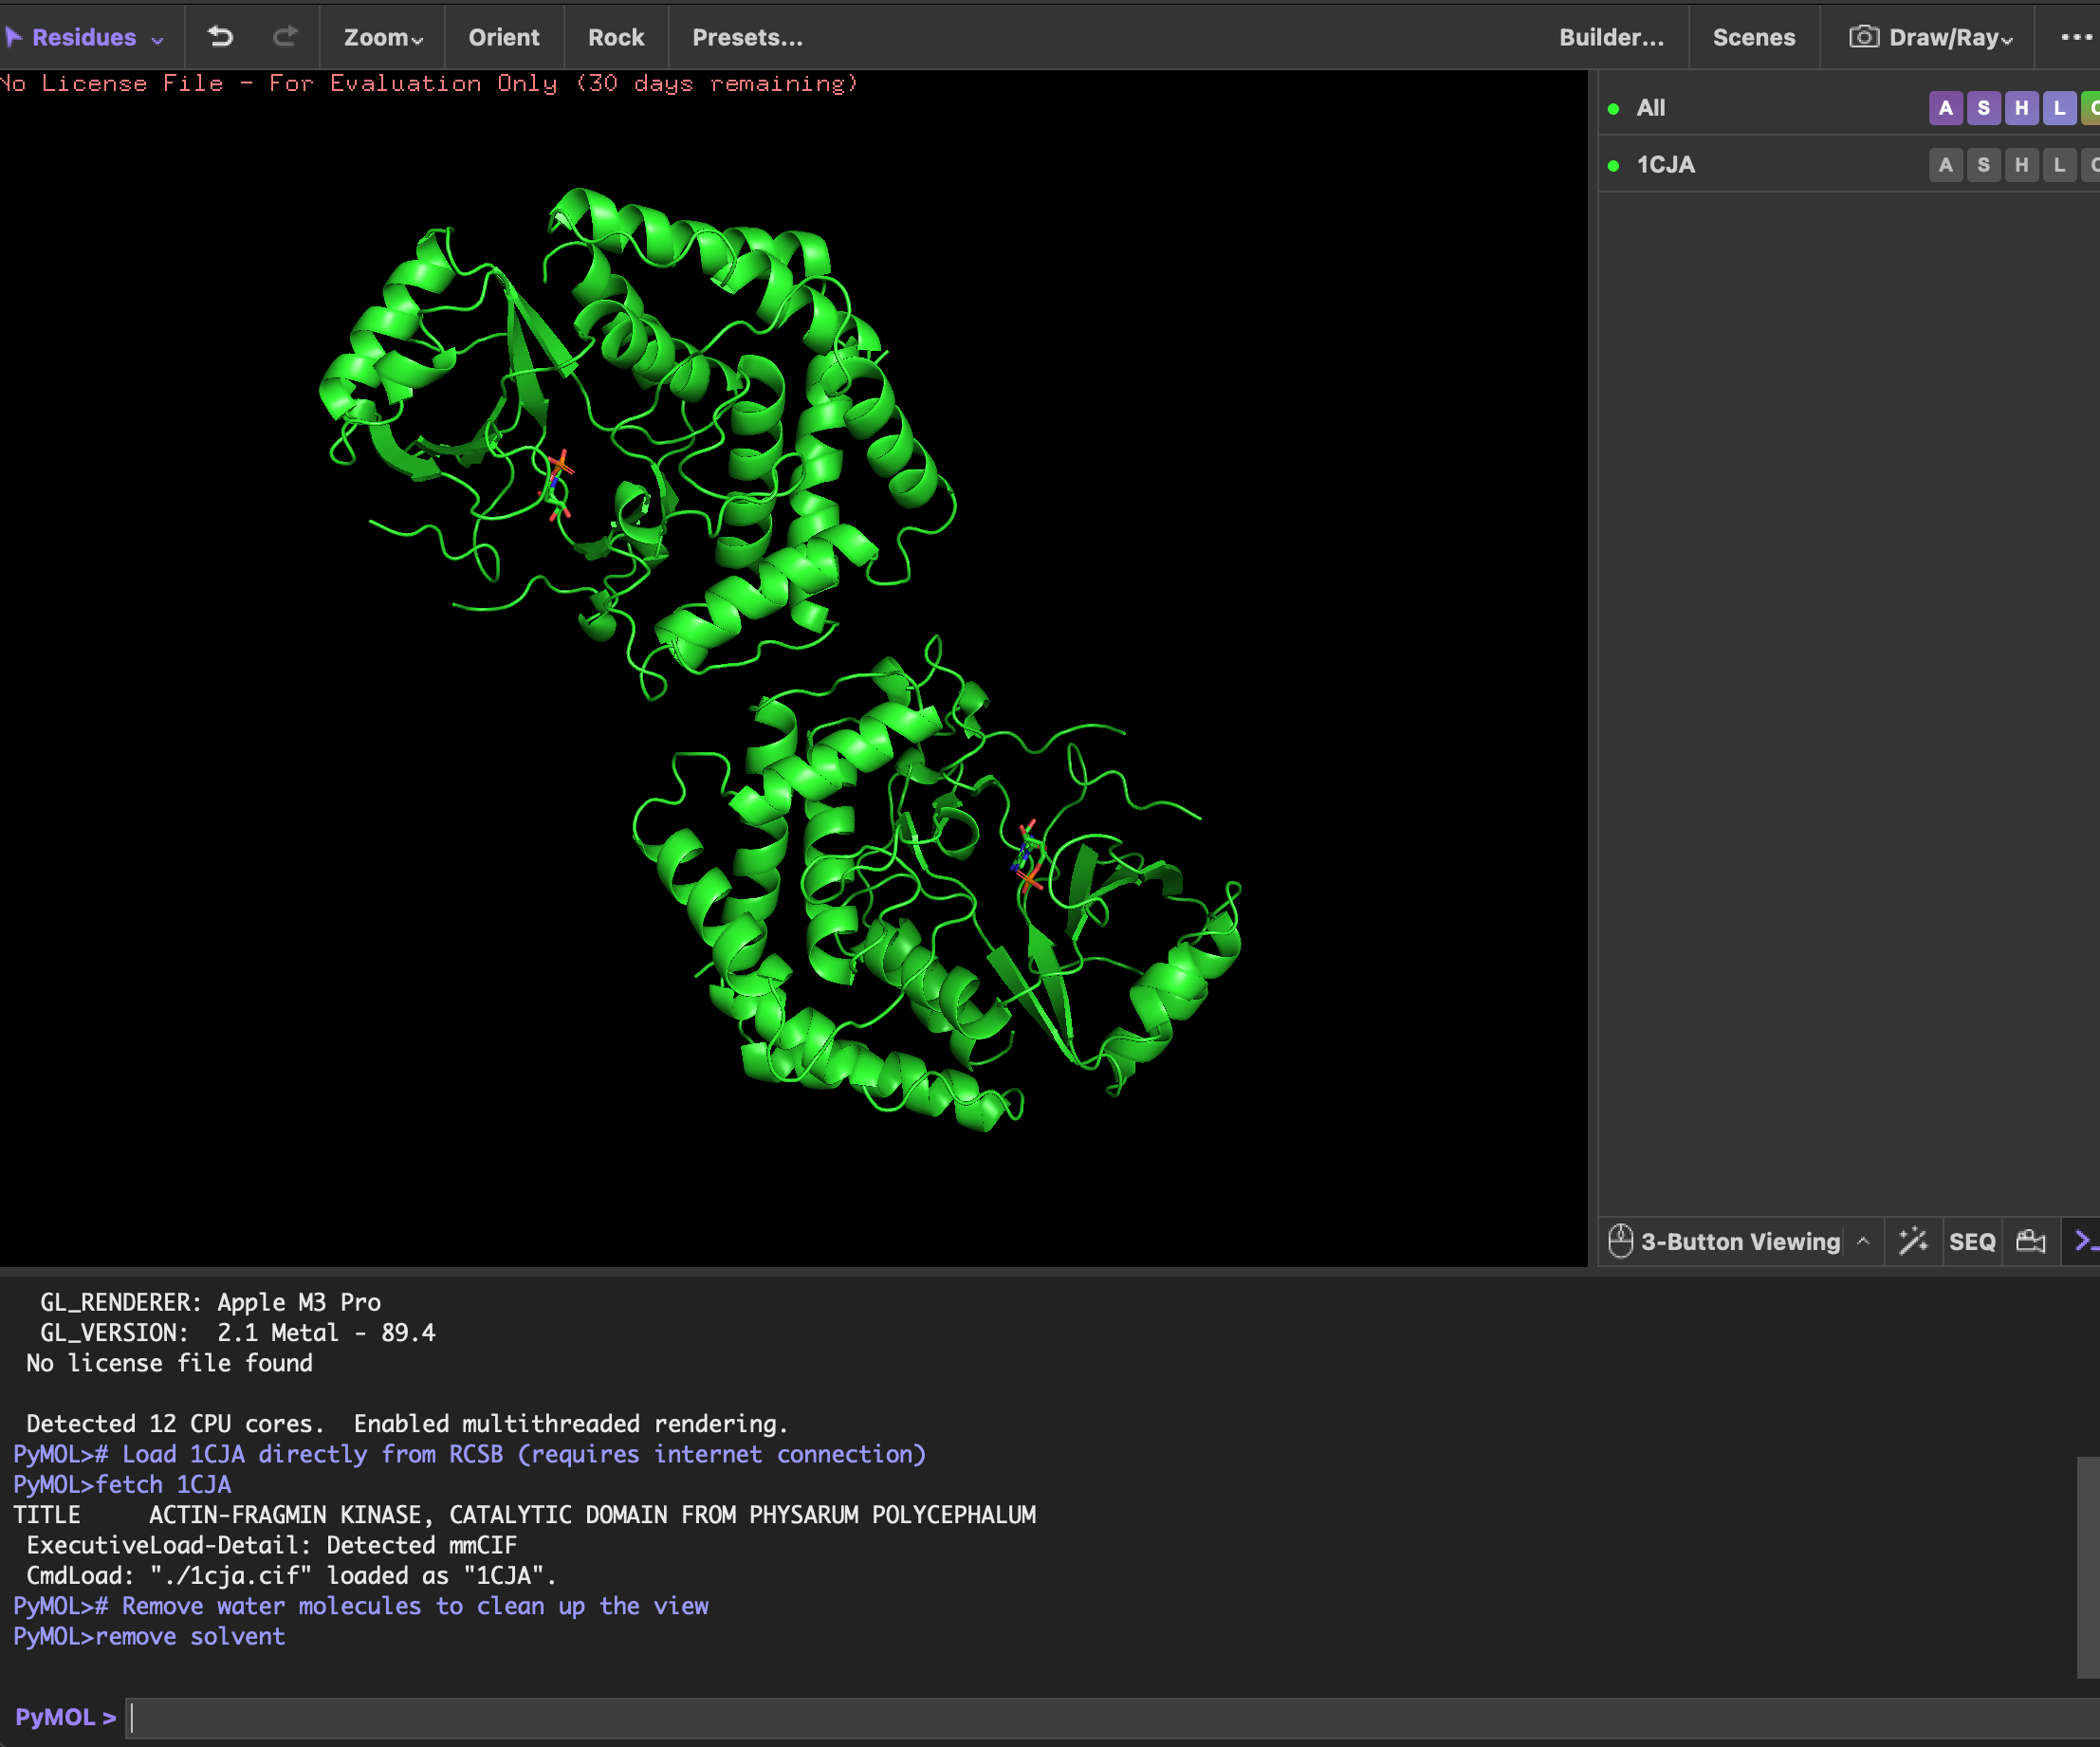
4. Open the structure of your protein in any 3D molecule visualization software
P.S. There are double protein structures in the screenshots accidentally.
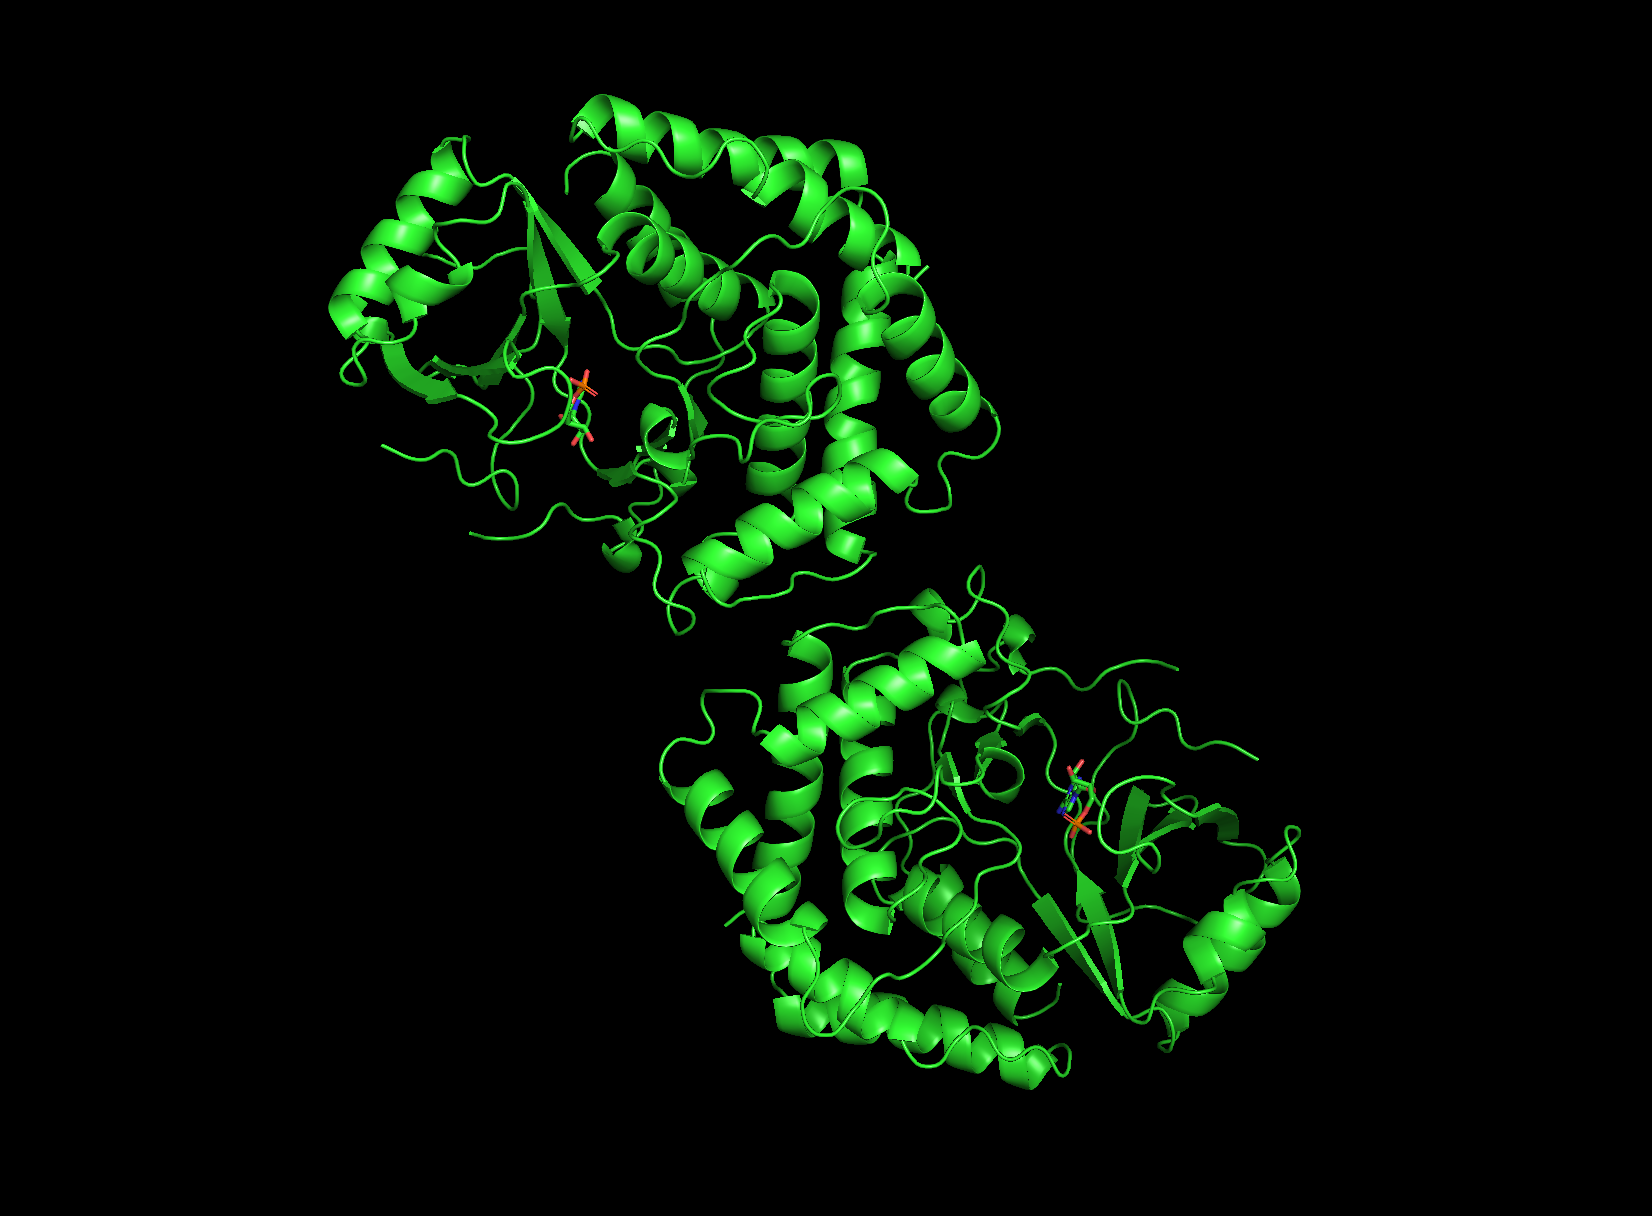
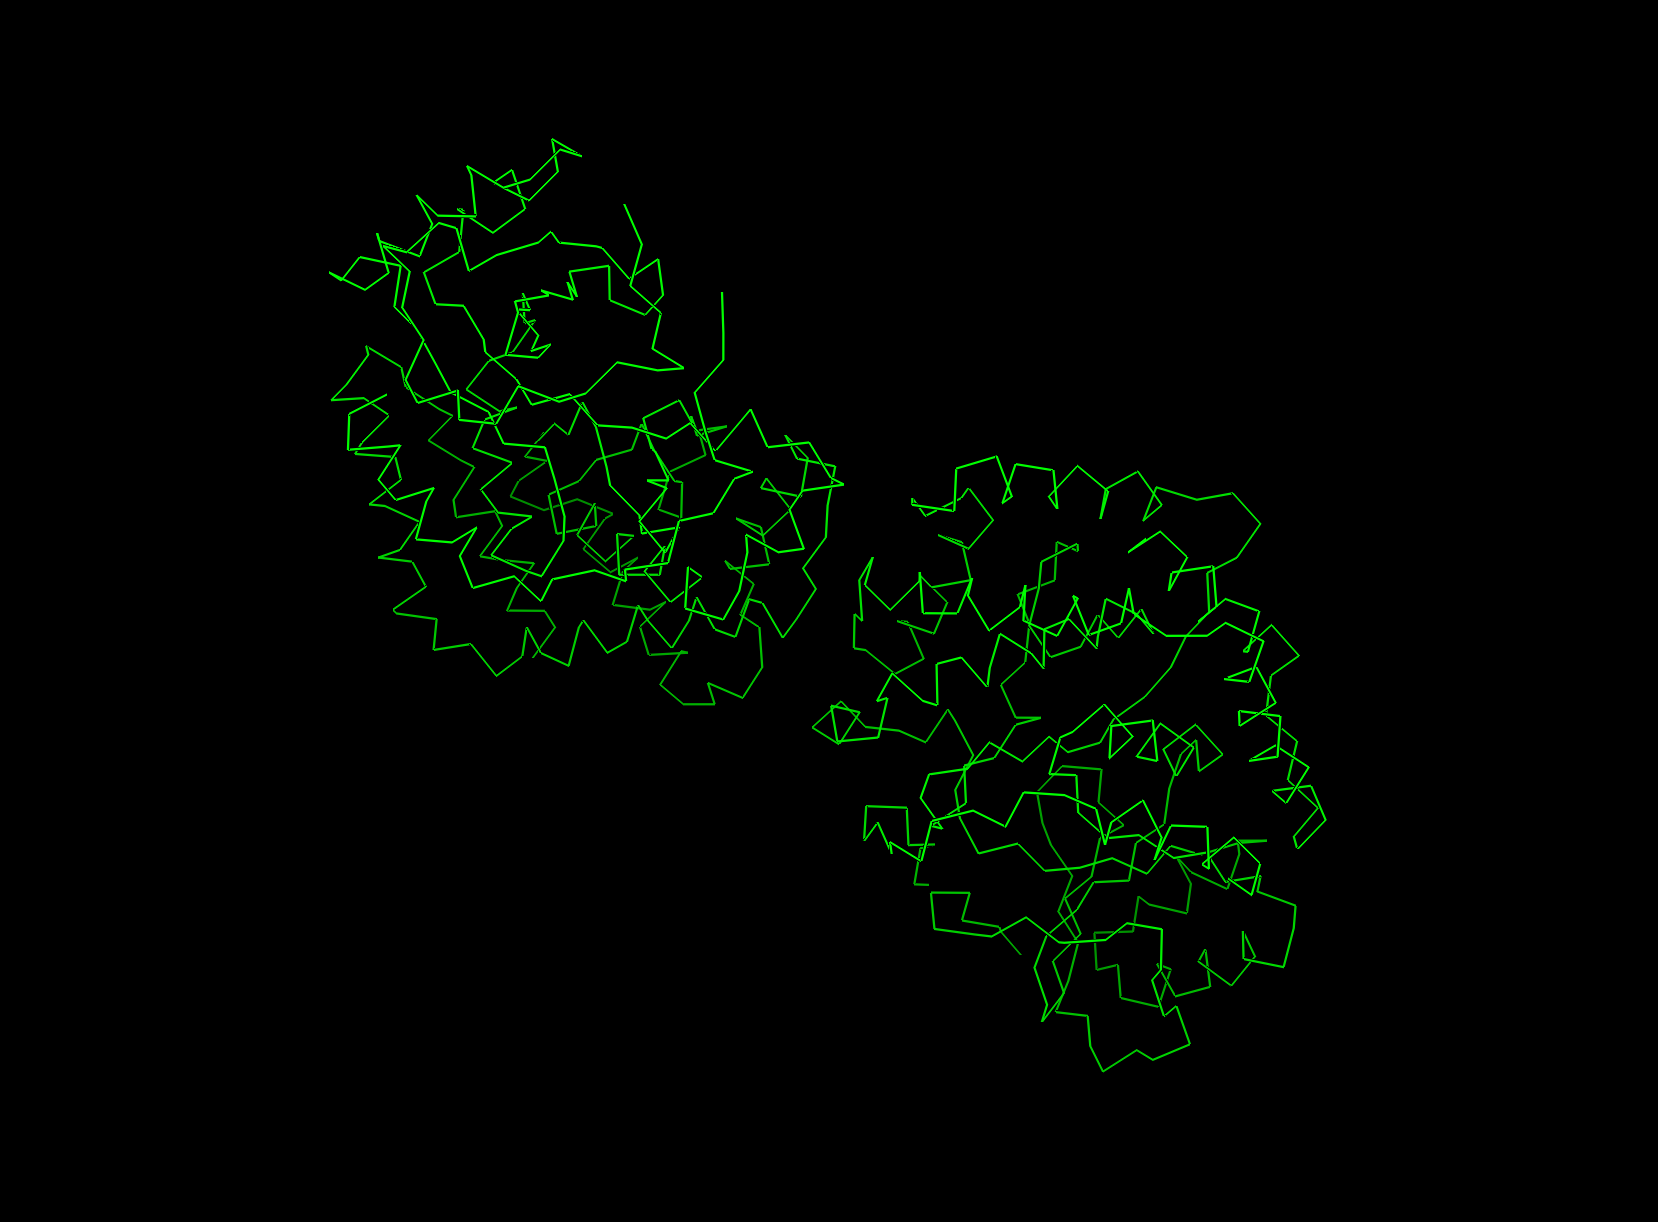
visualizing as ‘cartoon’, ‘ribbon’ and ‘ball and stick’
cartoon view
ribbon view
ball and stick
Looking at the structure image, the catalytic module spans about 160 residues, with the nucleotide binding site and catalytic machinery tucked into the cleft between the two lobes. According to PubMed, there is a pretty balanced mix of alpha helices and beta sheets, which is exactly what you expect from this bilobal kinase fold.
The protein surface is a sea of blue hydrophilic residues, which is what allows it to stay dissolved in the crowded cytoplasm of the cell.
In contrast, the protein core is packed with orange hydrophobic residues. These are tucked away from water, creating the internal glue that keeps the entire structure stable and folded correctly. In the AMP binding pocket the hydrophobic patches grip the adenine ring of the nucleotide, while polar residues reach out to coordinate the phosphate groups.
This mapping is really the key to Physarum biology. Since the kinase has to dock onto actin filaments, that unique flat substrate recognition domain is covered in hydrophilic patches specifically designed to recognize and stick to actin’s surface chemistry.
First, there’s the ATP/AMP binding pocket, a deep cleft that’s carved right between the N-terminal and C-terminal lobes. Since you can clearly see the yellow AMP ligand tucked inside, it’s obviously the biggest “hole” on the surface and the best place for drug targeting. Second, check out the flat substrate recognition domain. Unlike most kinases that have a narrow groove, AFK uses a remarkably flat, broad surface to dock with the large actin substrate. This unique structural flatness is a huge defining trait for this enzyme.
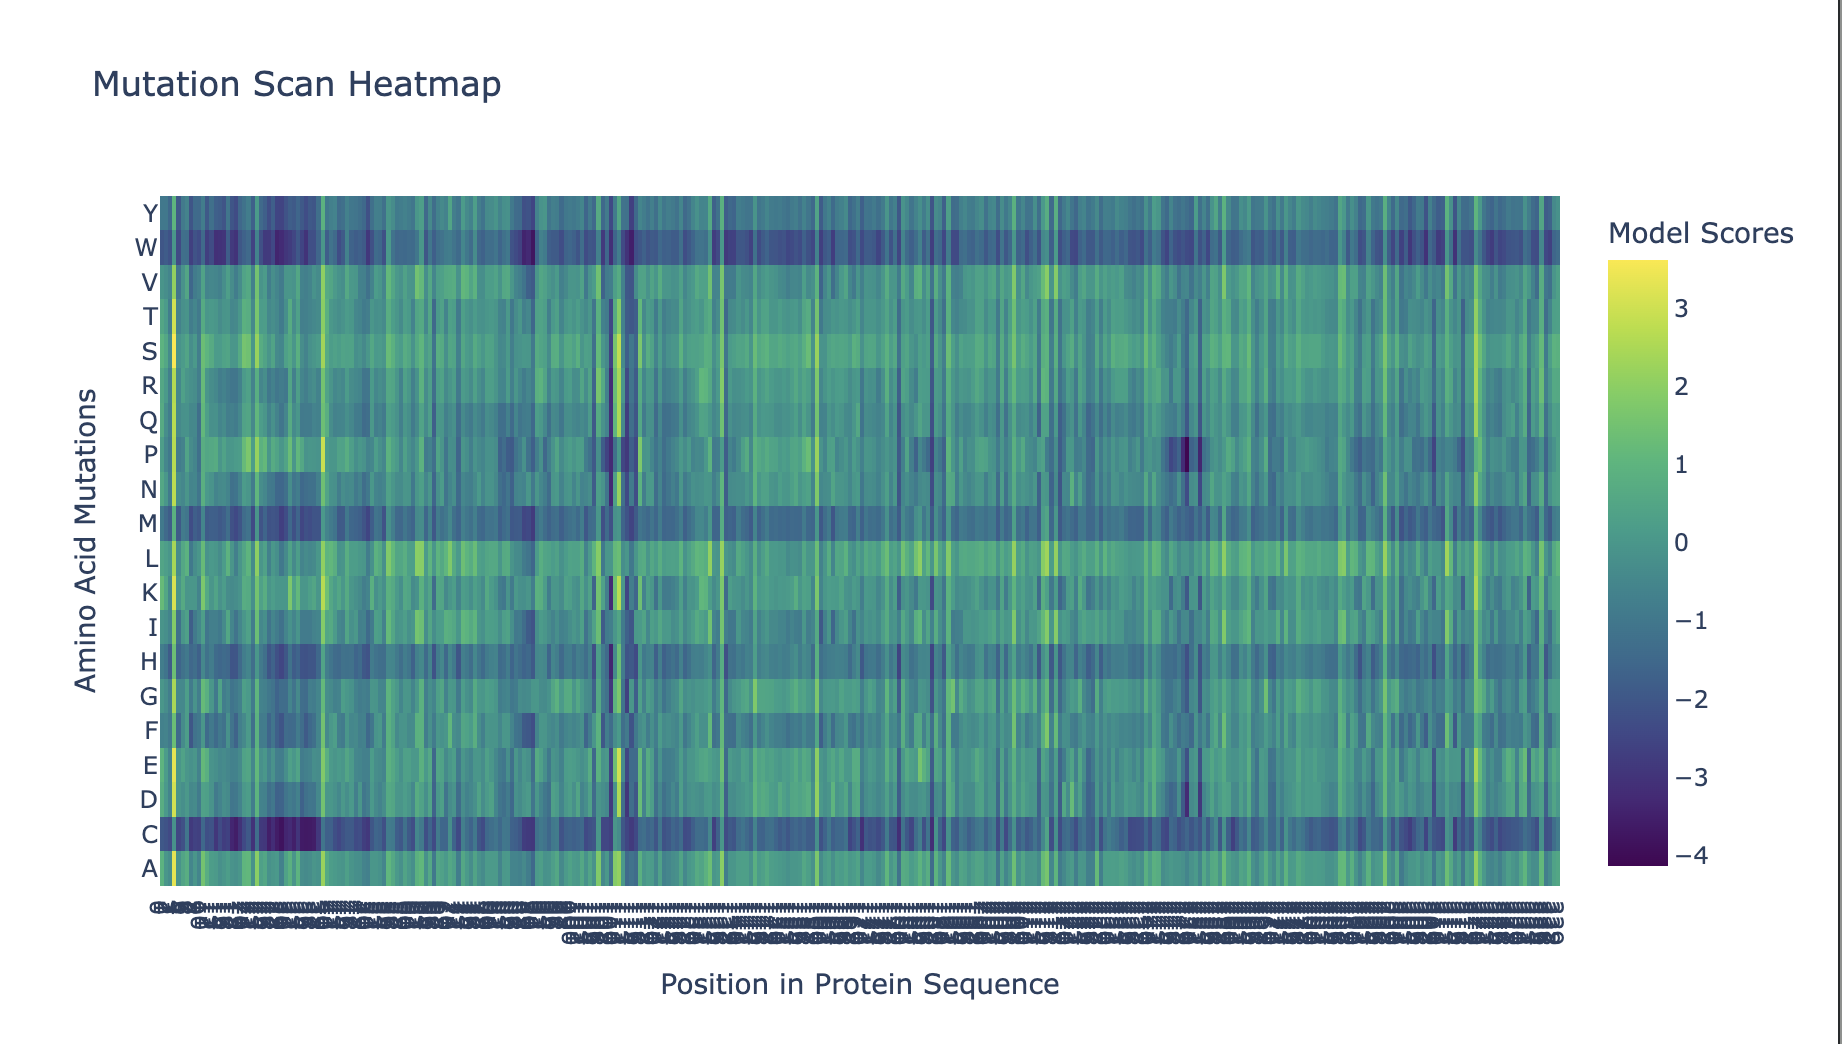
C1. Protein Language Modelling
Position 109 (Asp/D) shows the strongest conservation signal in the mutational scan — nearly all substitutions receive strongly negative log-likelihood scores. This is consistent with this residue being the catalytic base in the kinase active site, directly involved in phosphotransfer to actin’s Thr202. Even conservative mutations (D→E) are penalized, suggesting the precise geometry of this aspartate is essential.
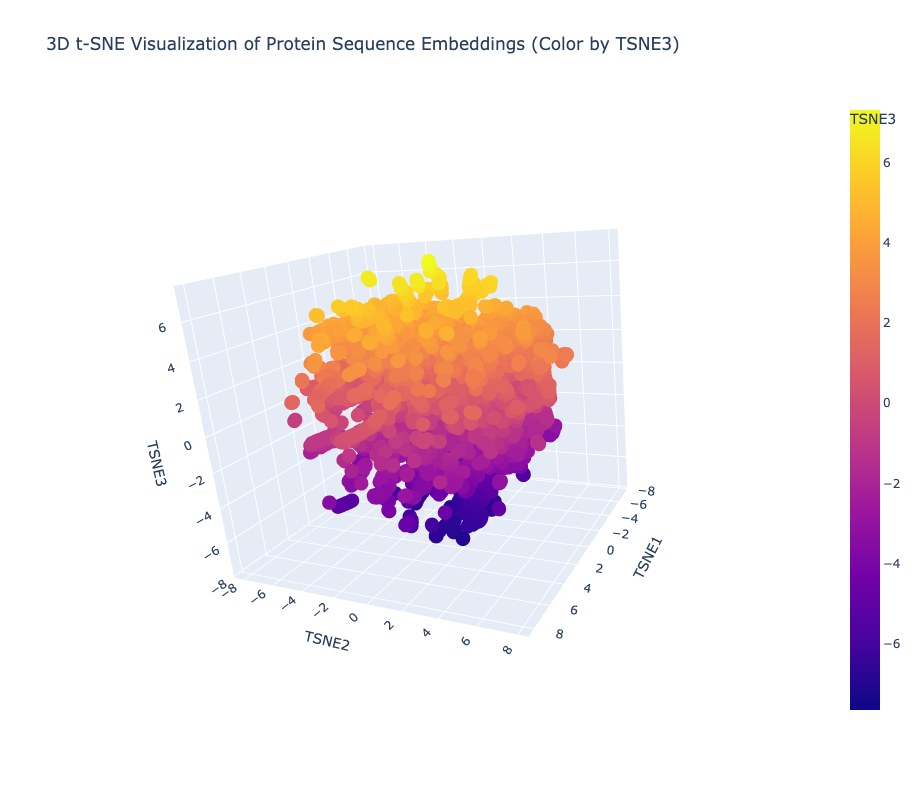
Yes, the t-SNE map forms meaningful neighborhoods where evolutionarily related proteins cluster tightly together, confirming that ESM2 has successfully learned to group biologically similar sequences into shared regions of the latent space.
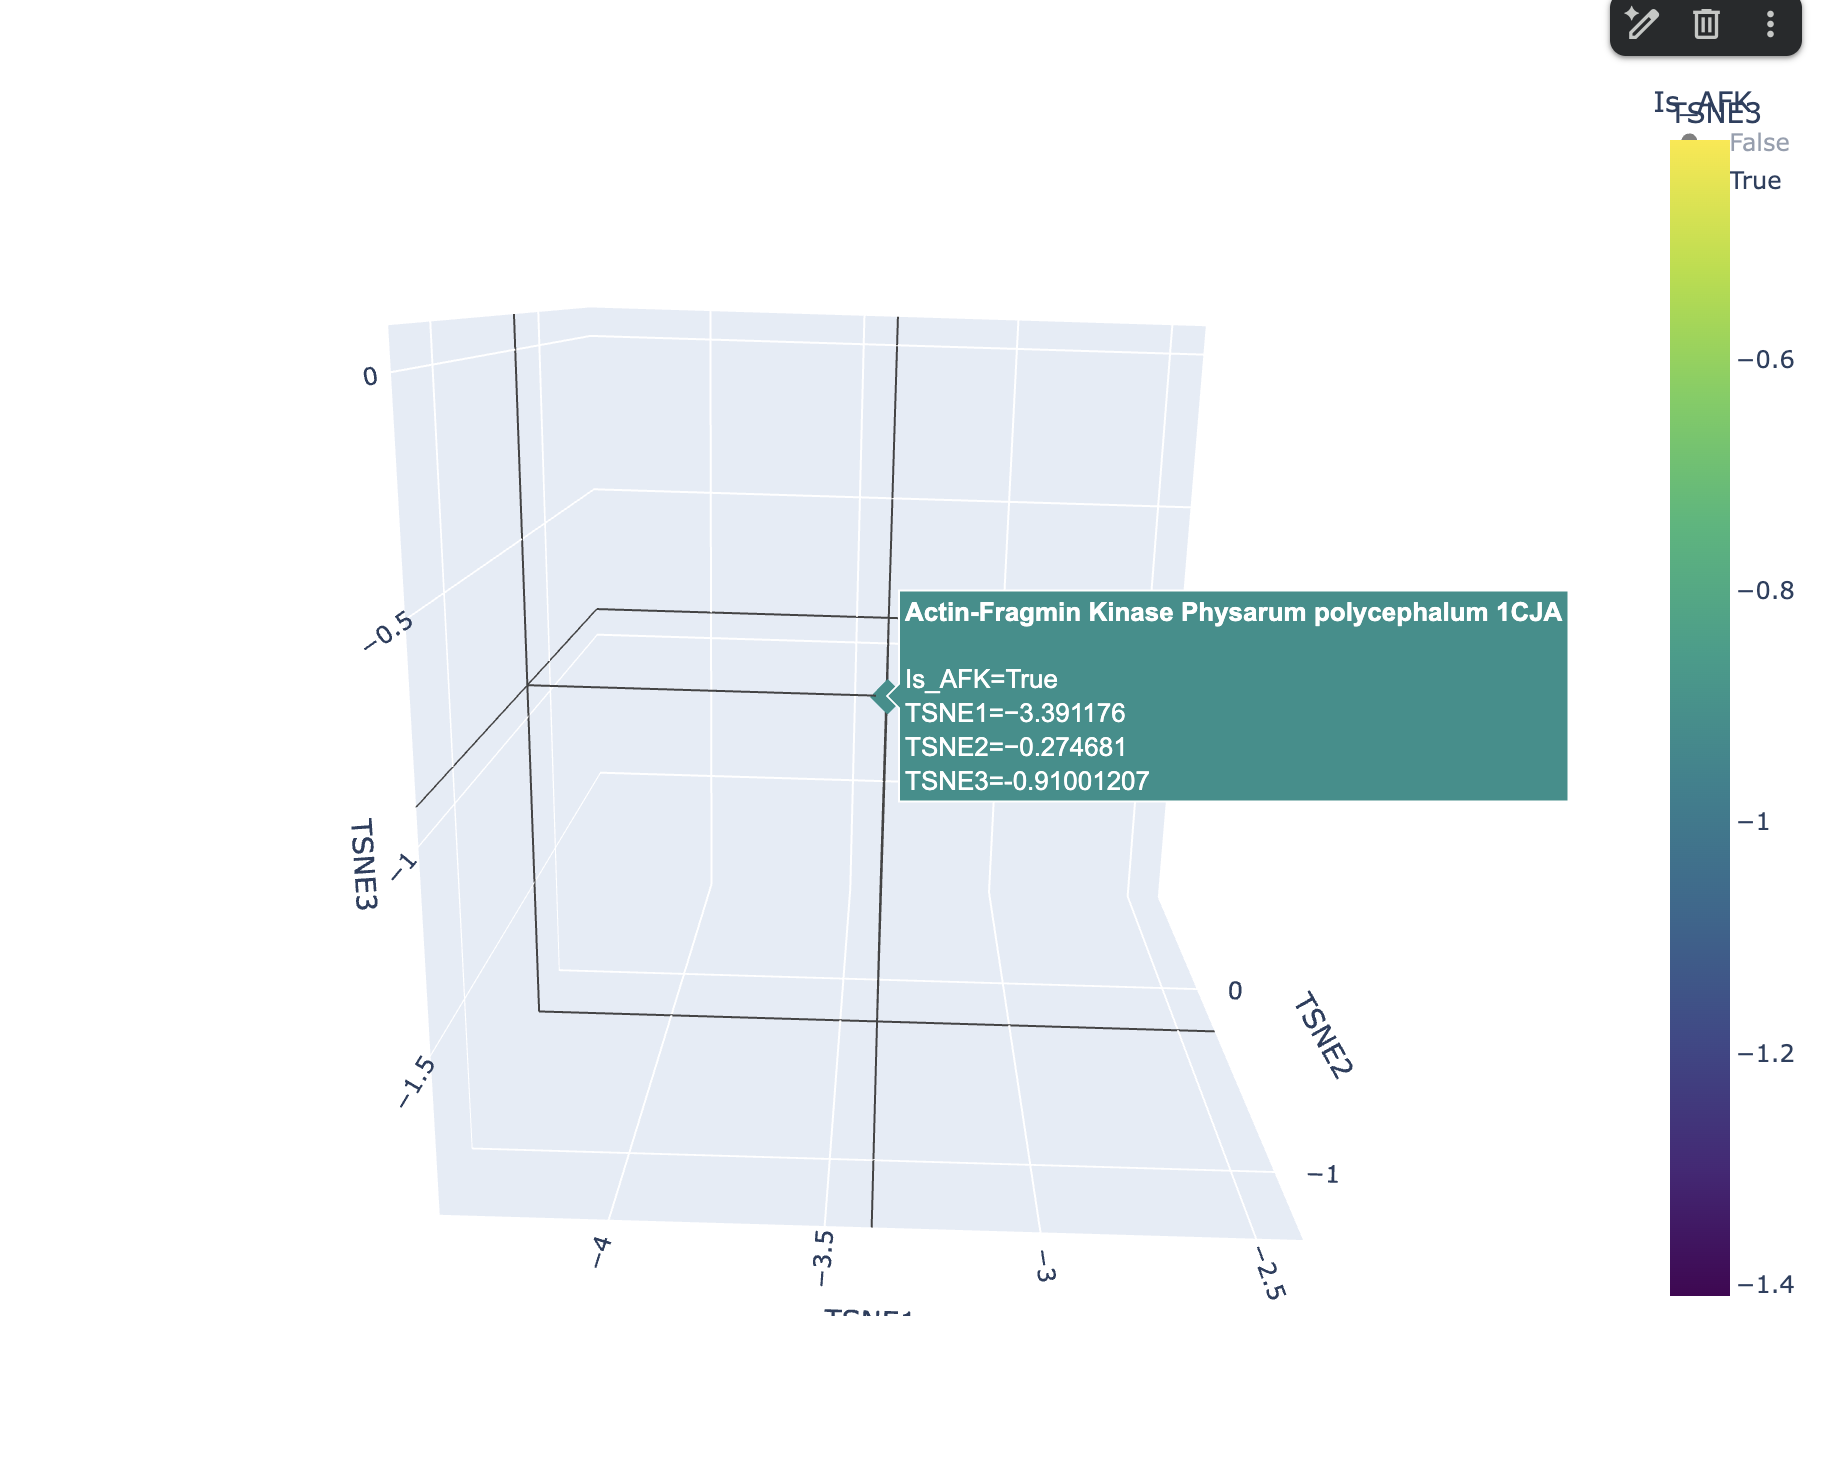
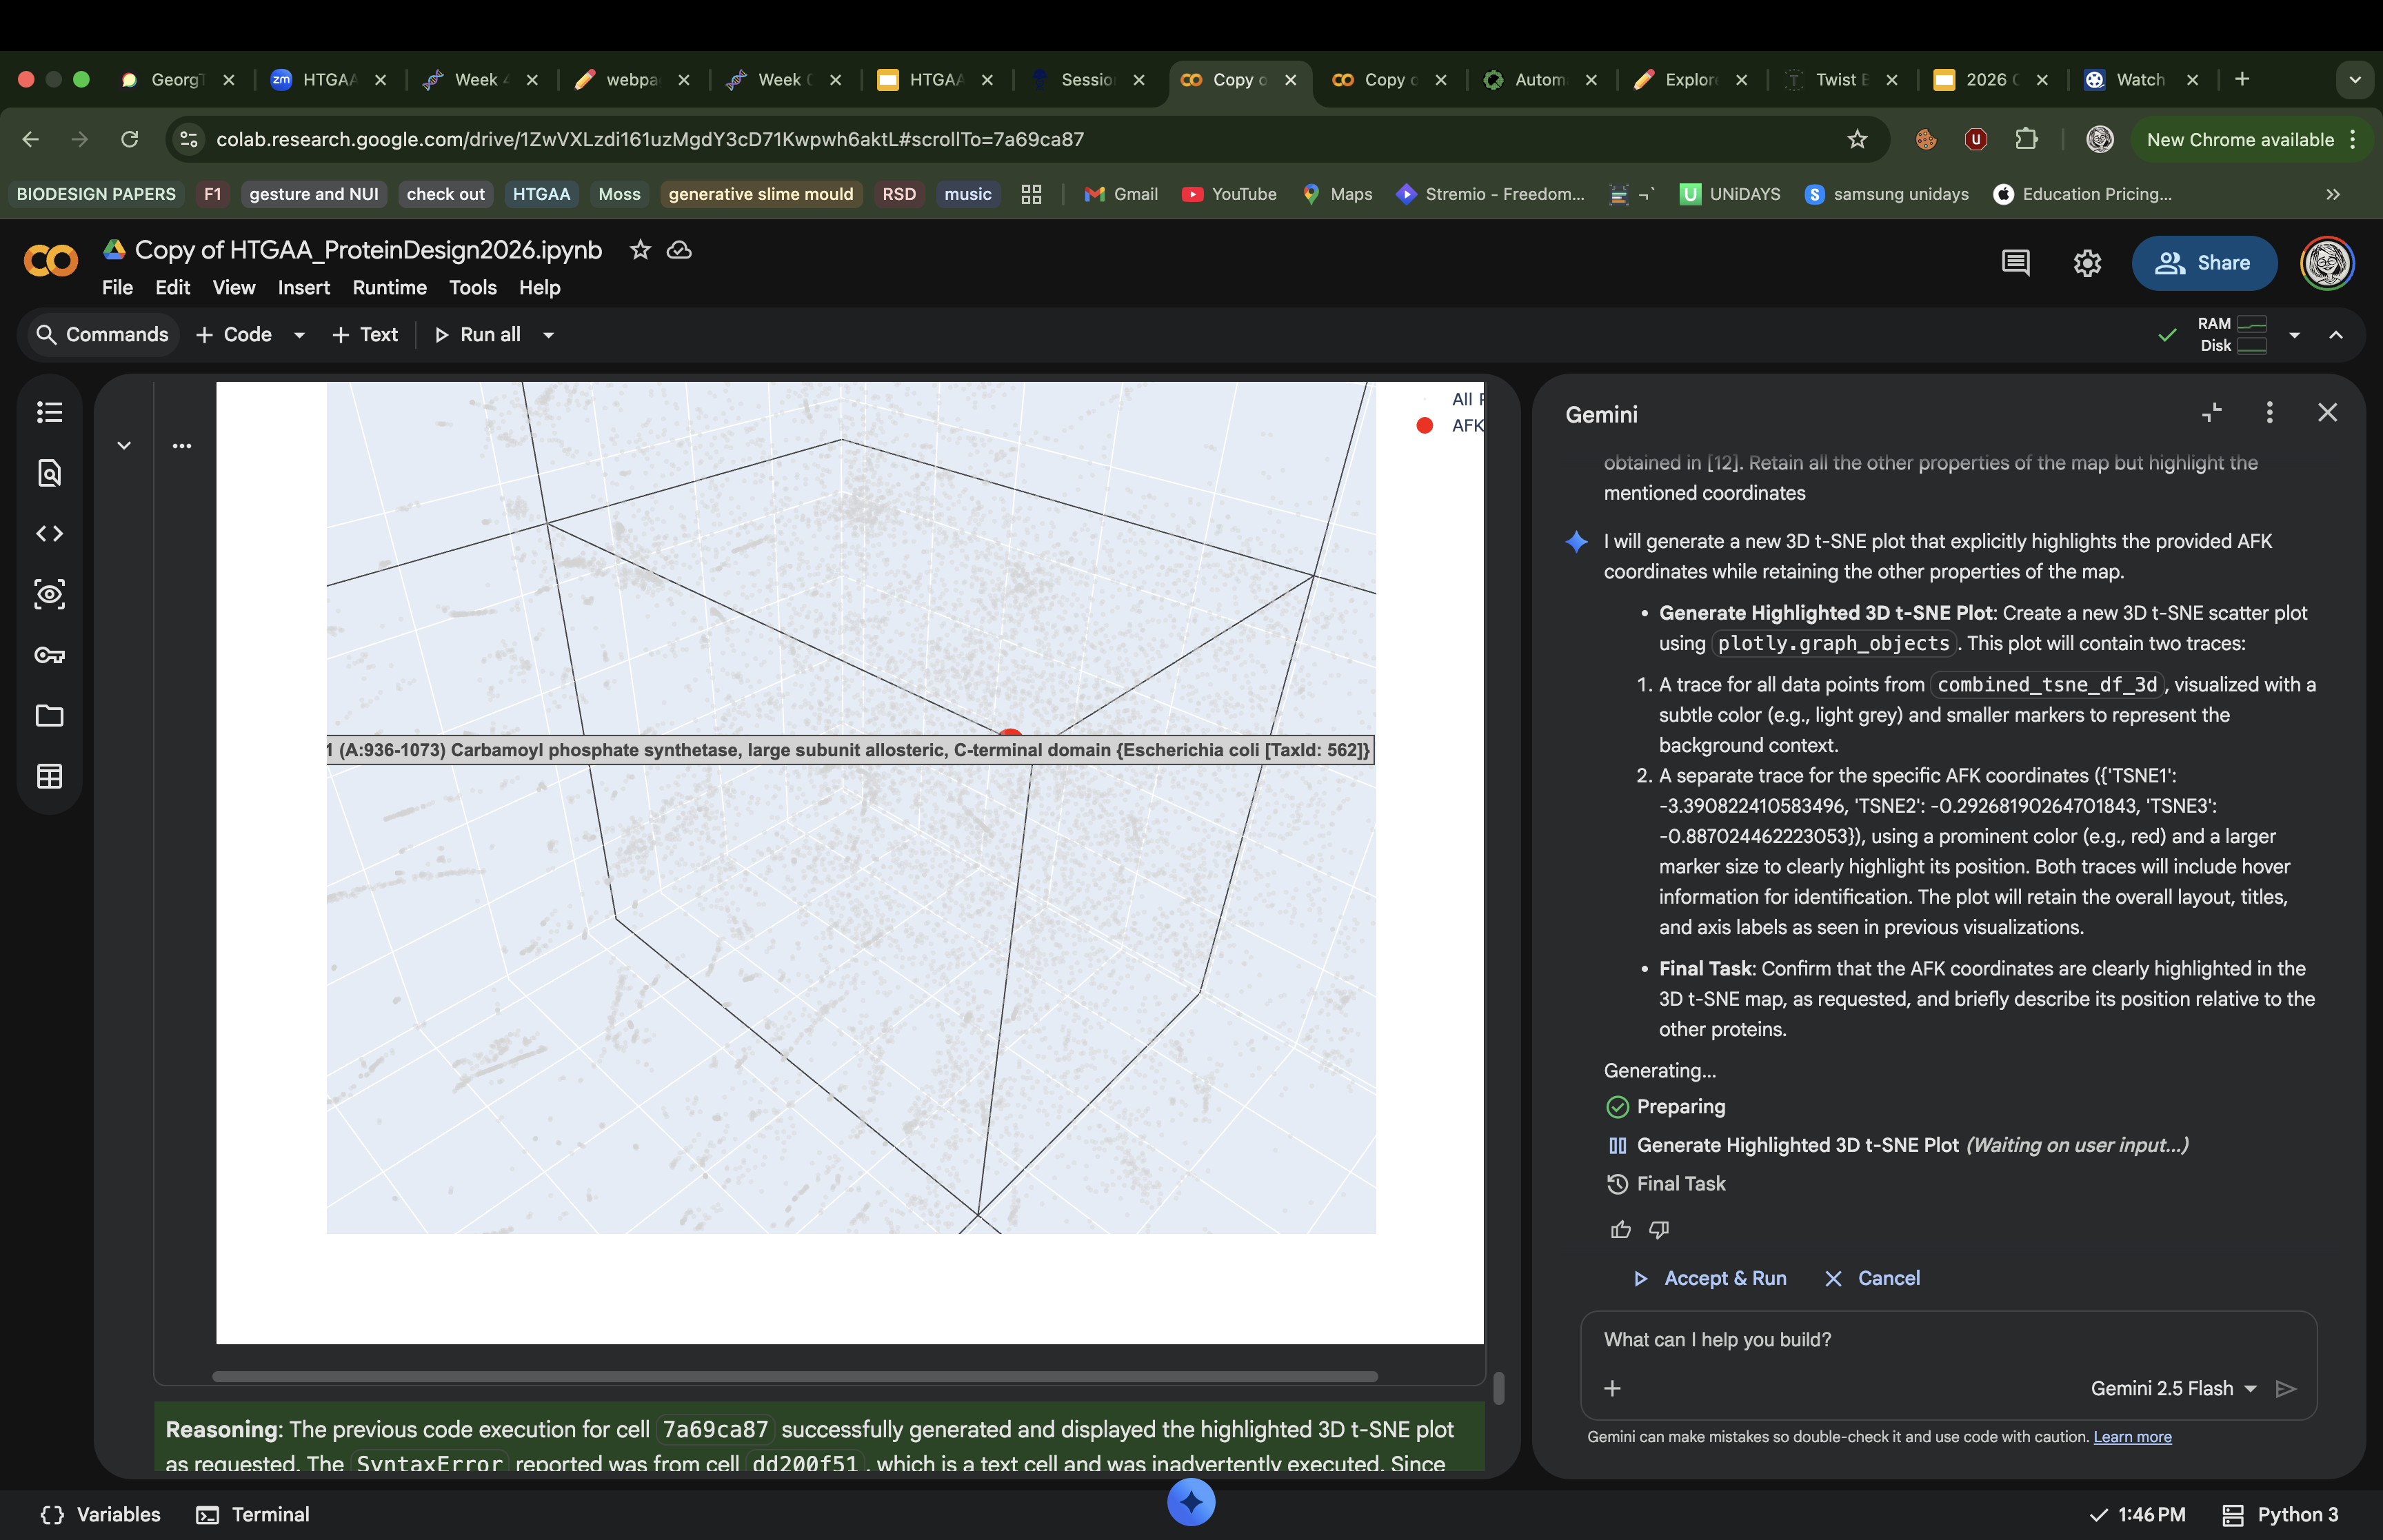
I ran a request in Gemini to create another 3d t-SNE with the AFK highlighted and this is how it looked
AFK from Physarum polycephalum lands at coordinates (−3.39, −0.29, −0.89) in a sparse, isolated region of the map with no tight cluster, reflecting its status as an evolutionarily unique kinase with no sequence homology to classical eukaryotic protein kinases. Its nearest neighbors are similarly atypical, low-homology proteins rather than mainstream kinases or cytoskeletal proteins like actin
Protein Folding
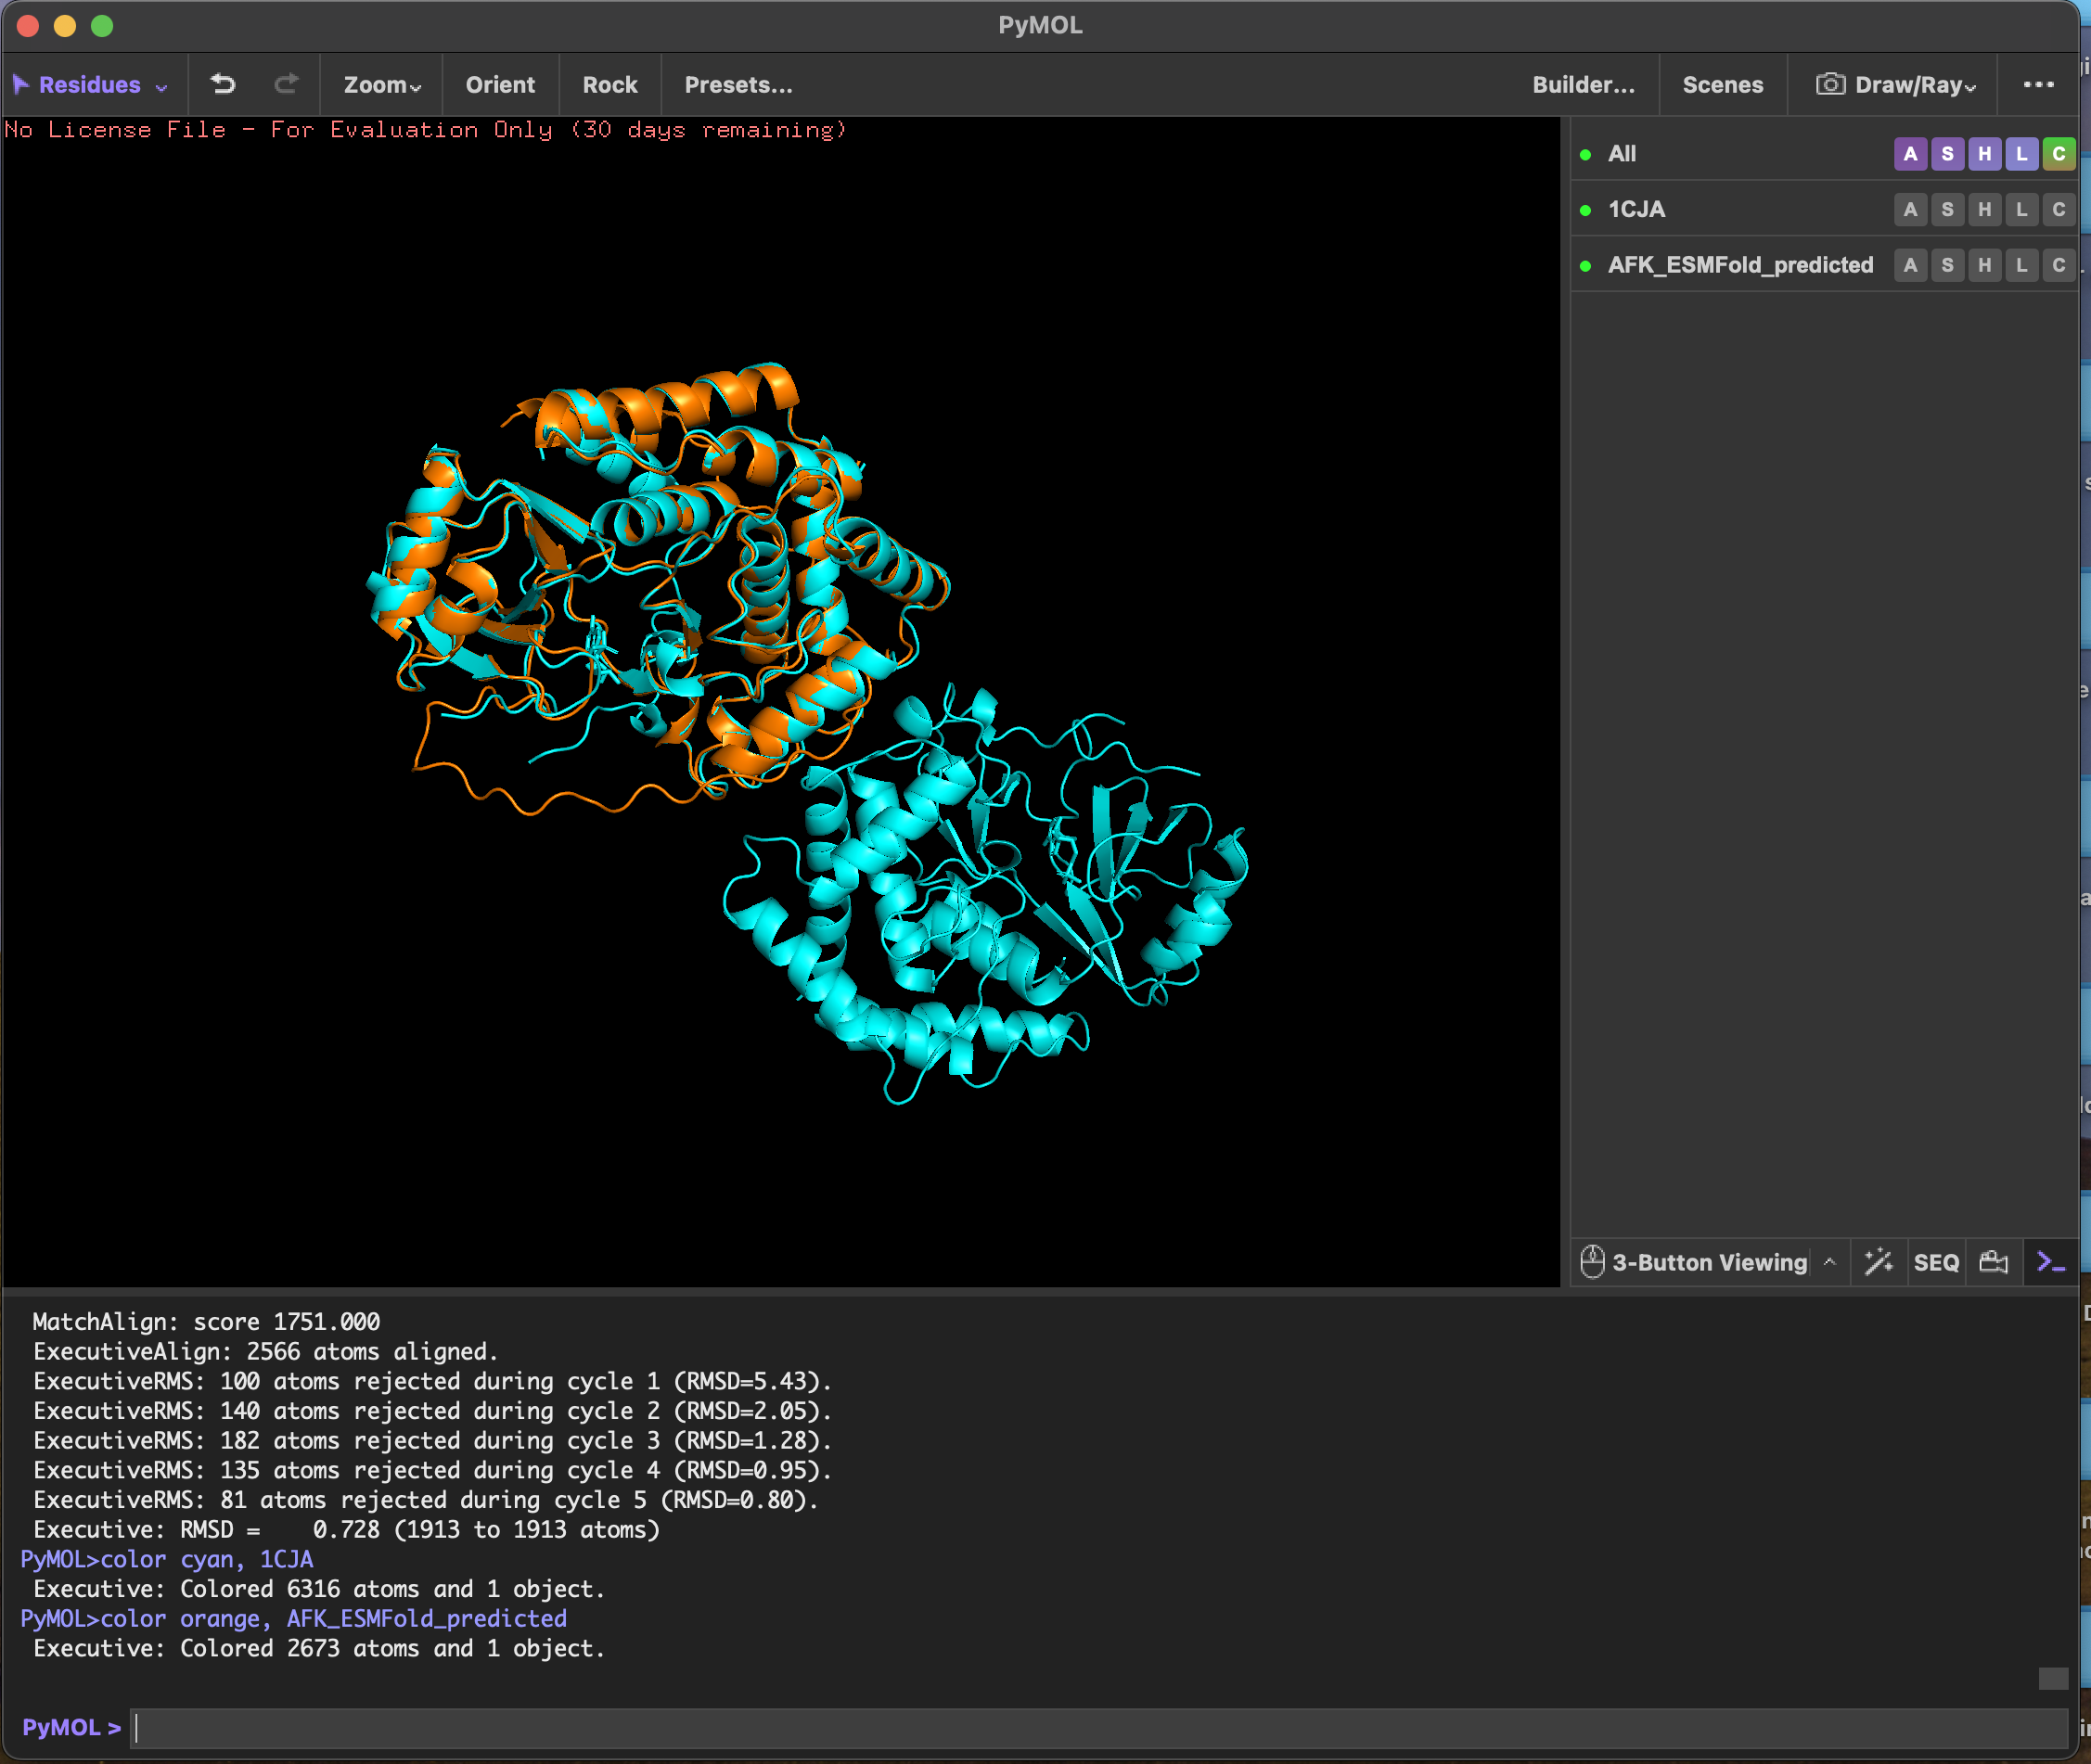
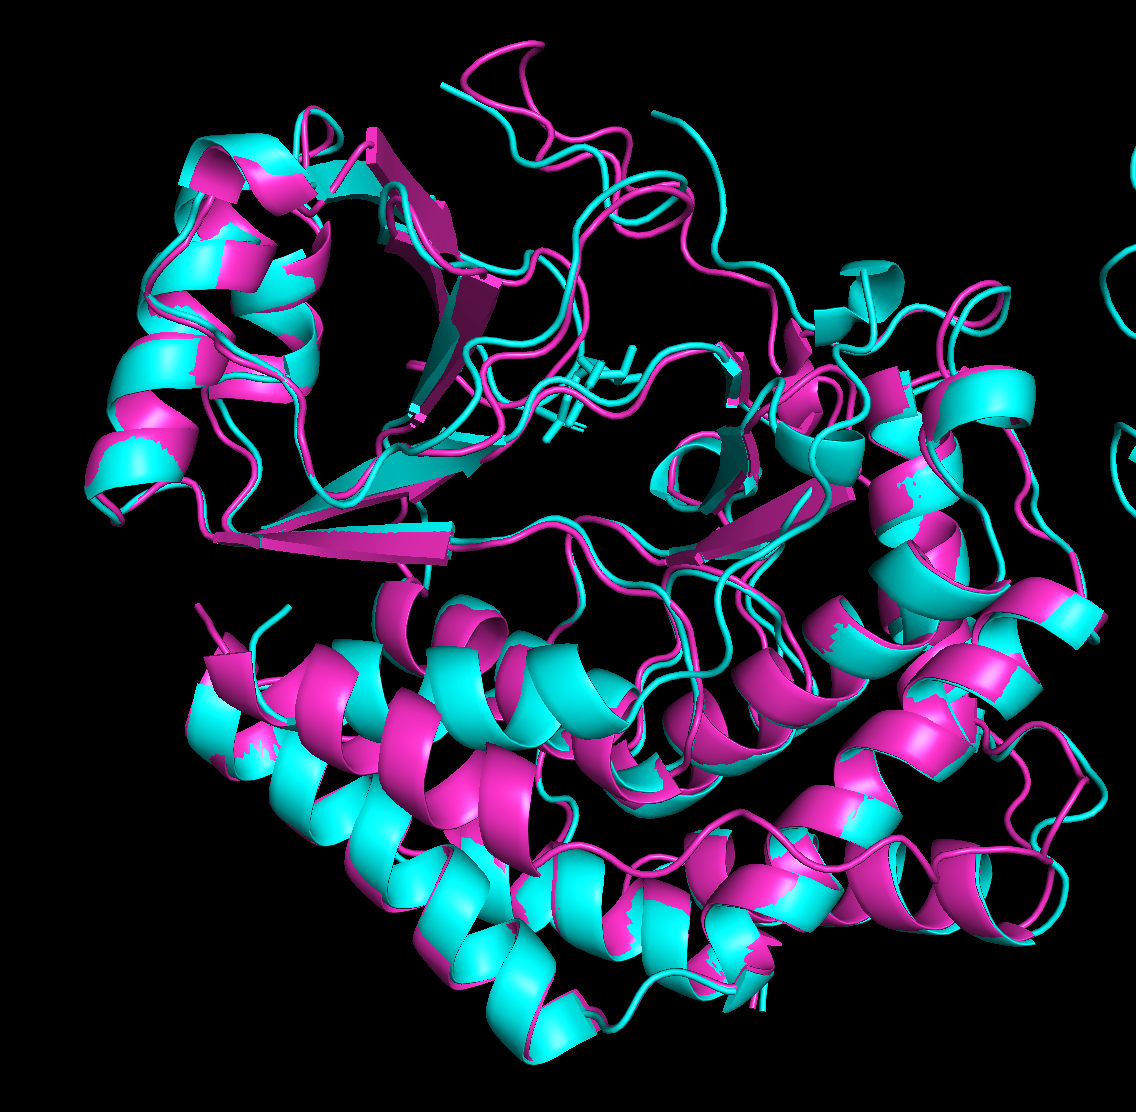
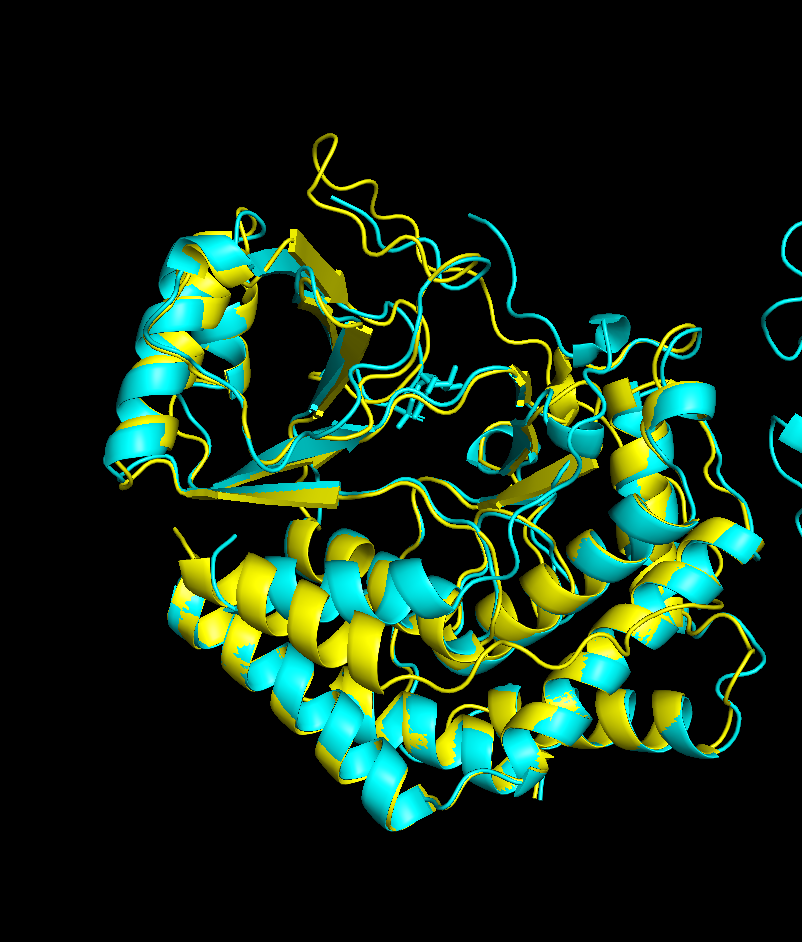
predicted structure after running it through colab
RMSD score Executive: RMSD = 0.728 (1913 to 1913 atoms)
ESMFold predicted the 3D structure of Actin-Fragmin Kinase from Physarum polycephalum using sequence alone, achieving an RMSD of 0.728 Å against the experimentally determined crystal structure 1CJA
Mutation 1 - position 45, changed S (Serine) to A (Alanine)
Executive: RMSD = 0.744 (1918 to 1918 atoms) only
Mutation 2 - changed position 155, which is in the catalytic core. L (Leucine) to P (Proline)
The sequence recovery of 43.7% means ProteinMPNN retained fewer than half the original residues while designing a backbone-compatible alternative sequence. This is expected for AFK given its unusual fold — the model is not constrained to reproduce the evolutionary sequence, only to find any sequence that satisfies the backbone geometry. Positions it did preserve are likely the most structurally or functionally constrained, such as the catalytic Asp109 and residues lining the nucleotide-binding cleft.
One notable difference: the inverse-folded sequence replaces many of AFK’s surface-exposed serine-rich regions (the native protein is 11.4% serine, unusually high) with a more typical distribution of charged and polar residues. This suggests the high serine content in the native protein is an evolutionary feature — possibly related to phosphorylation regulation of AFK itself — rather than a strict structural requirement for maintaining the fold.
Human SOD1 sequence
MATKAVCVLKGDGPVQGIINFEQKESNGPVKVWGSIKGLTEGLHGFHVHEFGDNTAGCTSAGPHFNPLSRKHGGPKDEERHVGDLGNVTADKDGVADVSIEDSVISLSGDHCIIGRTLVVHEKADDLGKGGNEESTKTGNAGSRLACGVIGIAQ
After adding A4V mutation
MATKVVCVLKGDGPVQGIINFEQKESNGPVKVWGSIKGLTEGLHGFHVHEFGDNTAGCTSAGPHFNPLSRKHGGPKDEERHVGDLGNVTADKDGVADVSIEDSVISLSGDHCIIGRTLVVHEKADDLGKGGNEESTKTGNAGSRLACGVIGIAQ
Therefore, produced peptides:
index
Binder
Pseudo Perplexity
1
WLYVVAAVRWKX
23.320599604199636
2
WRYVAAAAAHKE
8.96053025308908
3
WLYVPAGLALWX
13.021677157633269
4
WLYYVVAVAHKX
15.430388570774006
5
FLYRWLPSRRGG
11.545571242285833
##Part 2: Evaluating Binders with alpha fold3
The alpha fold results for some reason are not loading for me, despite multiple attempst and troubleshooting. Hence the results were analyzed with the help of Claude using PAE matrices
peptide 1 ipTM 0.38
The PAE matrix shows a uniformly mid-green inter-chain strip with no distinct dark patch, indicating no preferred binding site and the peptide appears to be floating without specific engagement.
peptide 2 ipTM 0.35
The inter-chain strip is mostly light green with a very faint darker region around residues 60–100, suggesting a weak, non-specific affinity toward the β-barrel region, though confidence is low.
peptide 3 ipTM 0.36
The inter-chain strip is the lightest and most uniform of all five, indicating the highest positional uncertainty. It appears to have the least defined interaction with SOD1.
peptide 4 ipTM 0.37
A slightly darker patch in the inter-chain strip around residues 1–30 hints at proximity to the N-terminal region where the A4V mutation sits, making this the most therapeutically interesting placement among the PepMLM peptides.
peptide 5 ipTM 0.41
Shows the darkest and most defined inter-chain strip overall, with a signal around residues 60–110 suggesting some affinity toward the β-barrel mid-region consistent with it being a known SOD1 binder and having the highest ipTM.
Part 2: AlphaFold3 Summary
Across all five peptides, ipTM scores ranged from 0.35 to 0.41 — all falling below the 0.5 threshold generally considered indicative of confident binding. The known SOD1-binding peptide FLYRWLPSRRGG achieved the highest ipTM of 0.41, and none of the four PepMLM-generated peptides matched or exceeded this score. Peptide 4 (ipTM 0.37) was the most therapeutically interesting placement among the generated candidates, showing a faint signal near the A4V mutation site at the N-terminus, but the overall structural confidence for all generated peptides was low. This suggests PepMLM sampling alone, without site-specific guidance, does not reliably outperform an experimentally validated binder on structural confidence metrics.
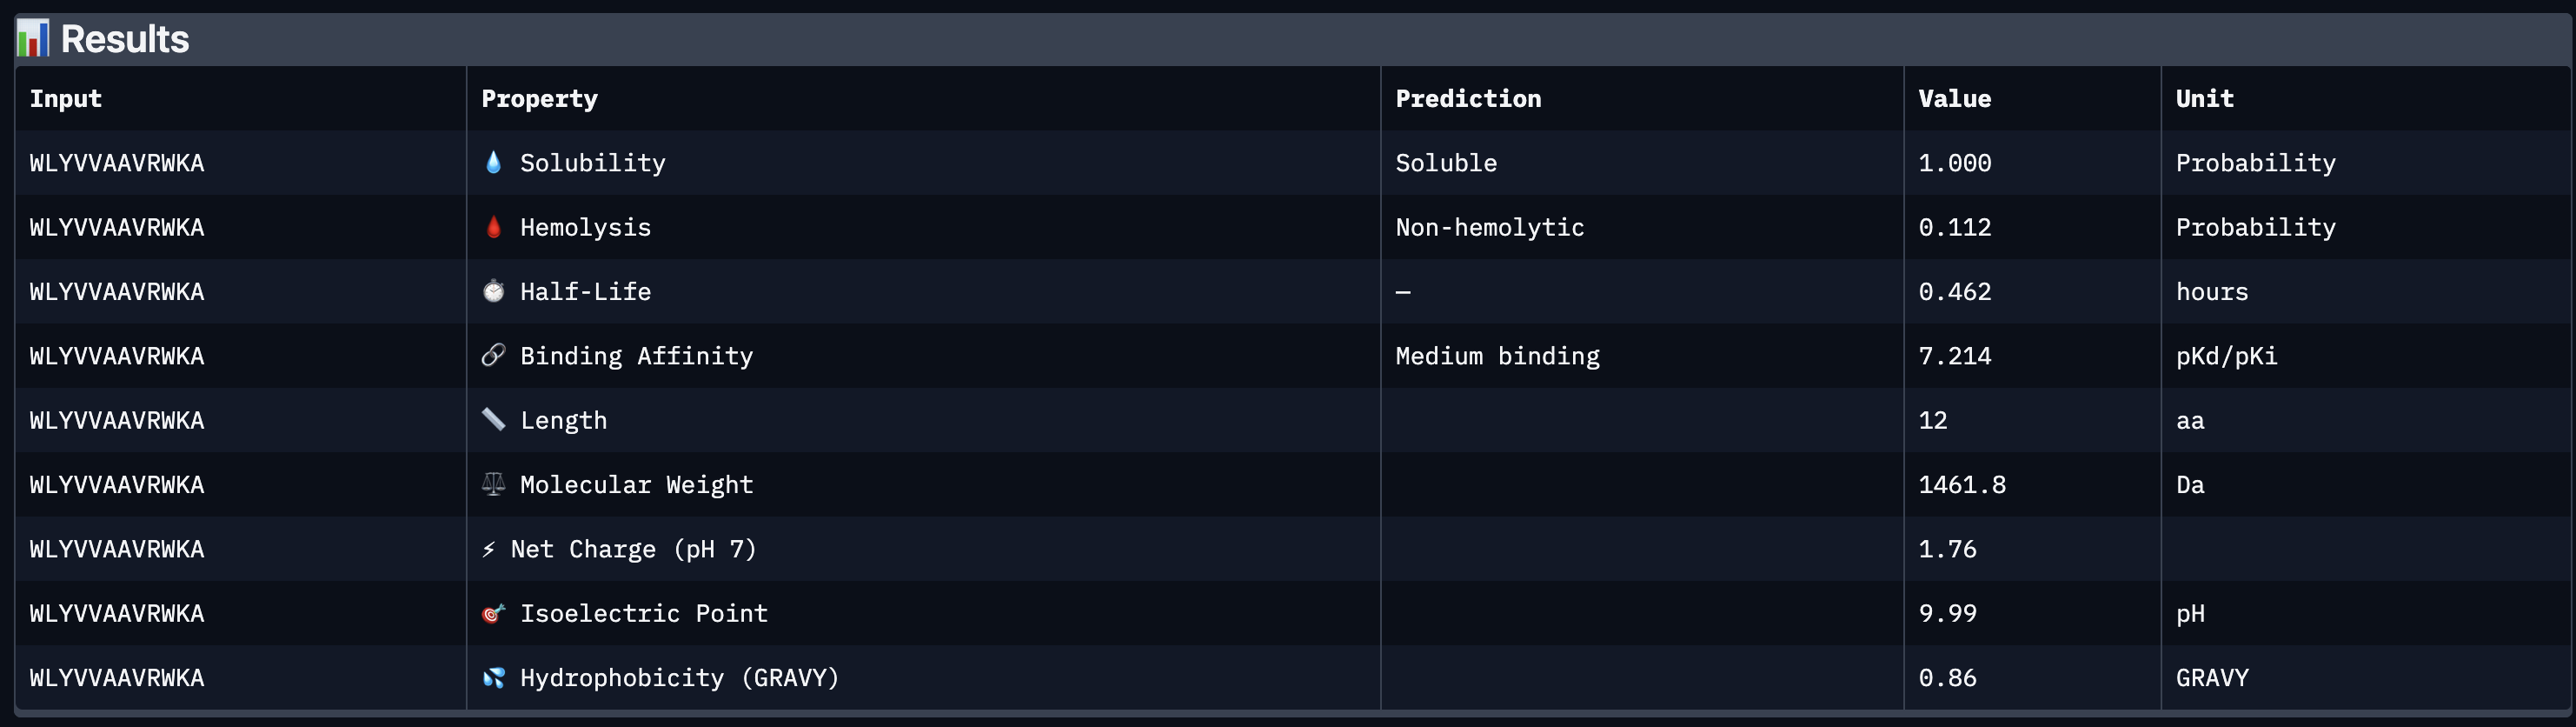
Part 3: Evavluating properties of generated peptides in Peptiverse
Peptide 1 WLYVVAAVRWKA
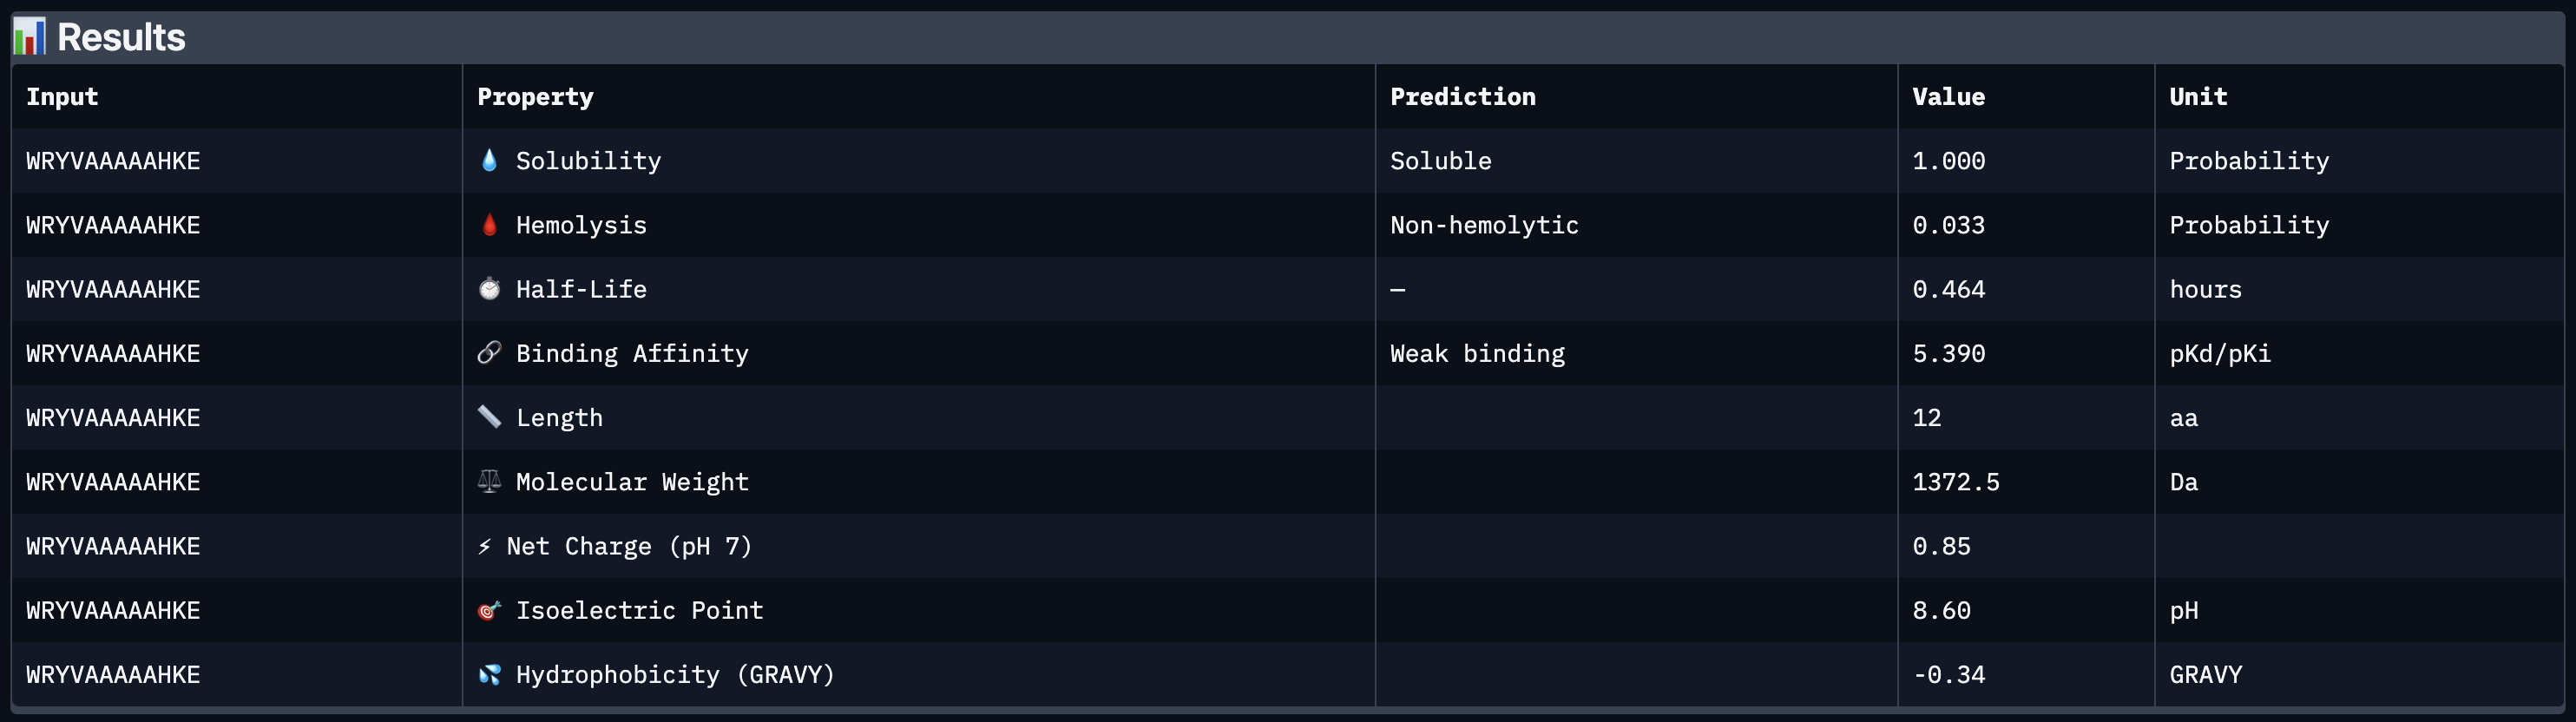
Peptide 2 WRYVAAAAAHKE
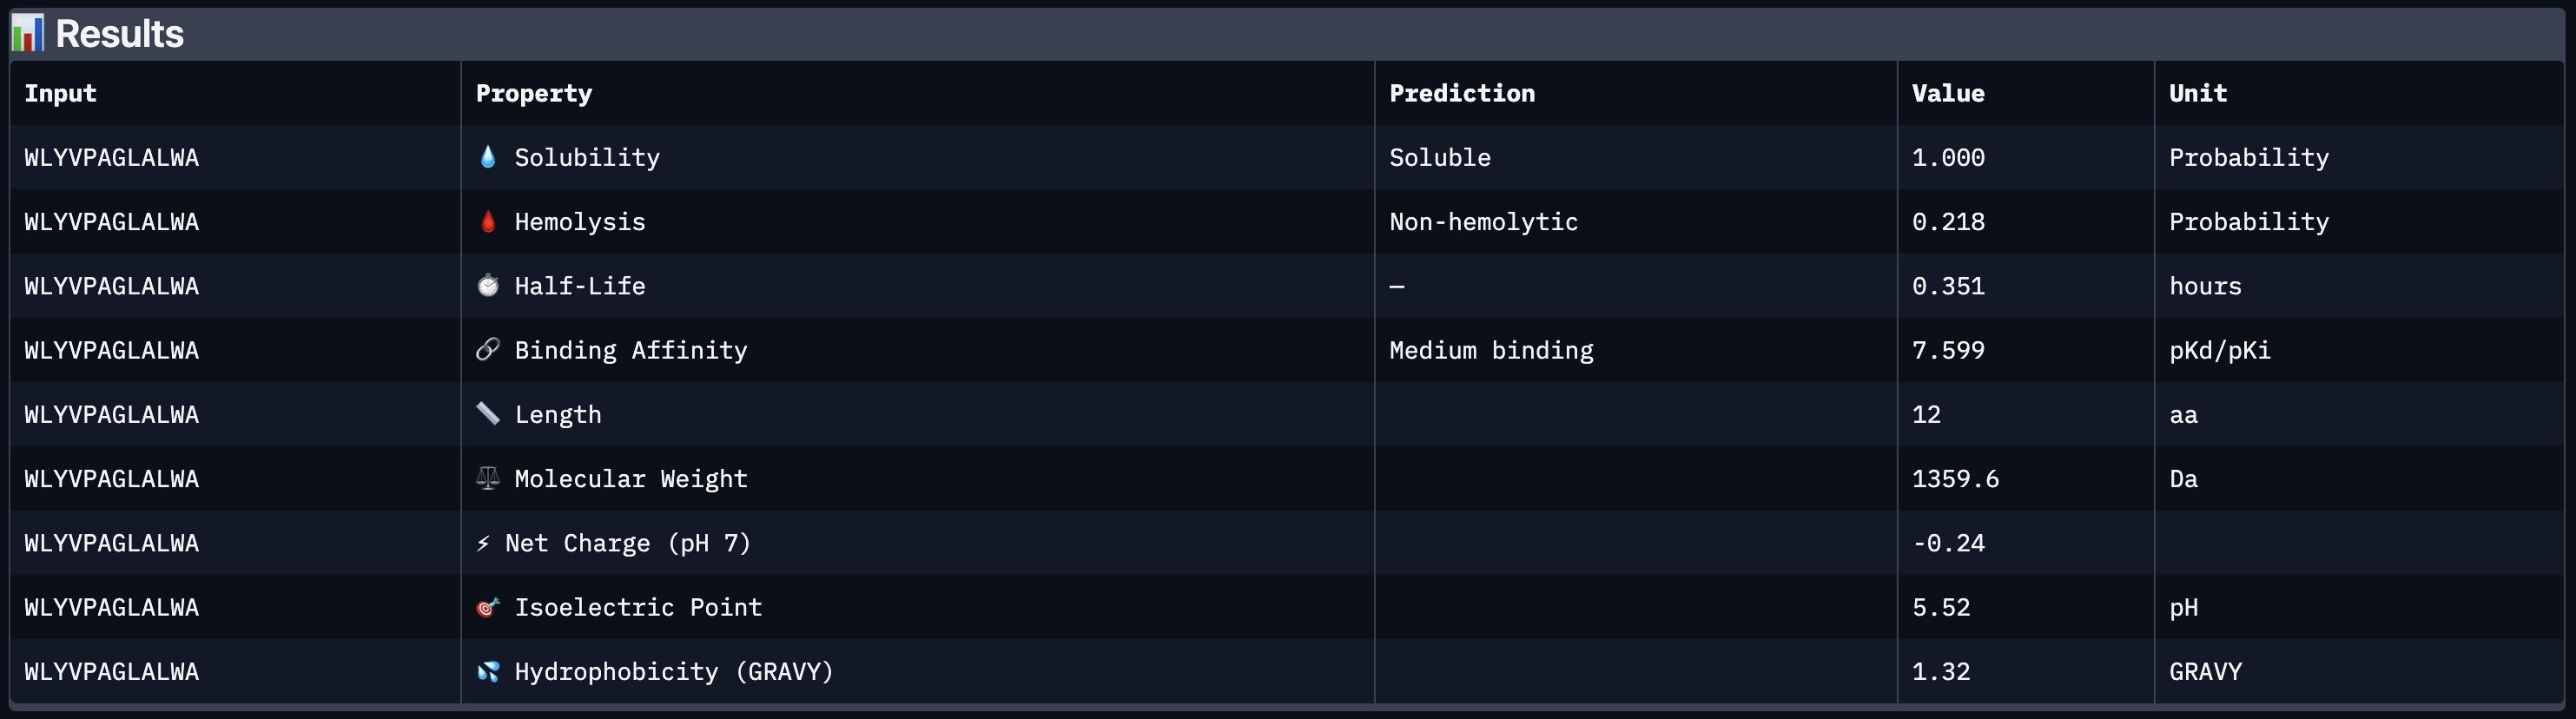
Peptide 3 WLYVPAGLALWA
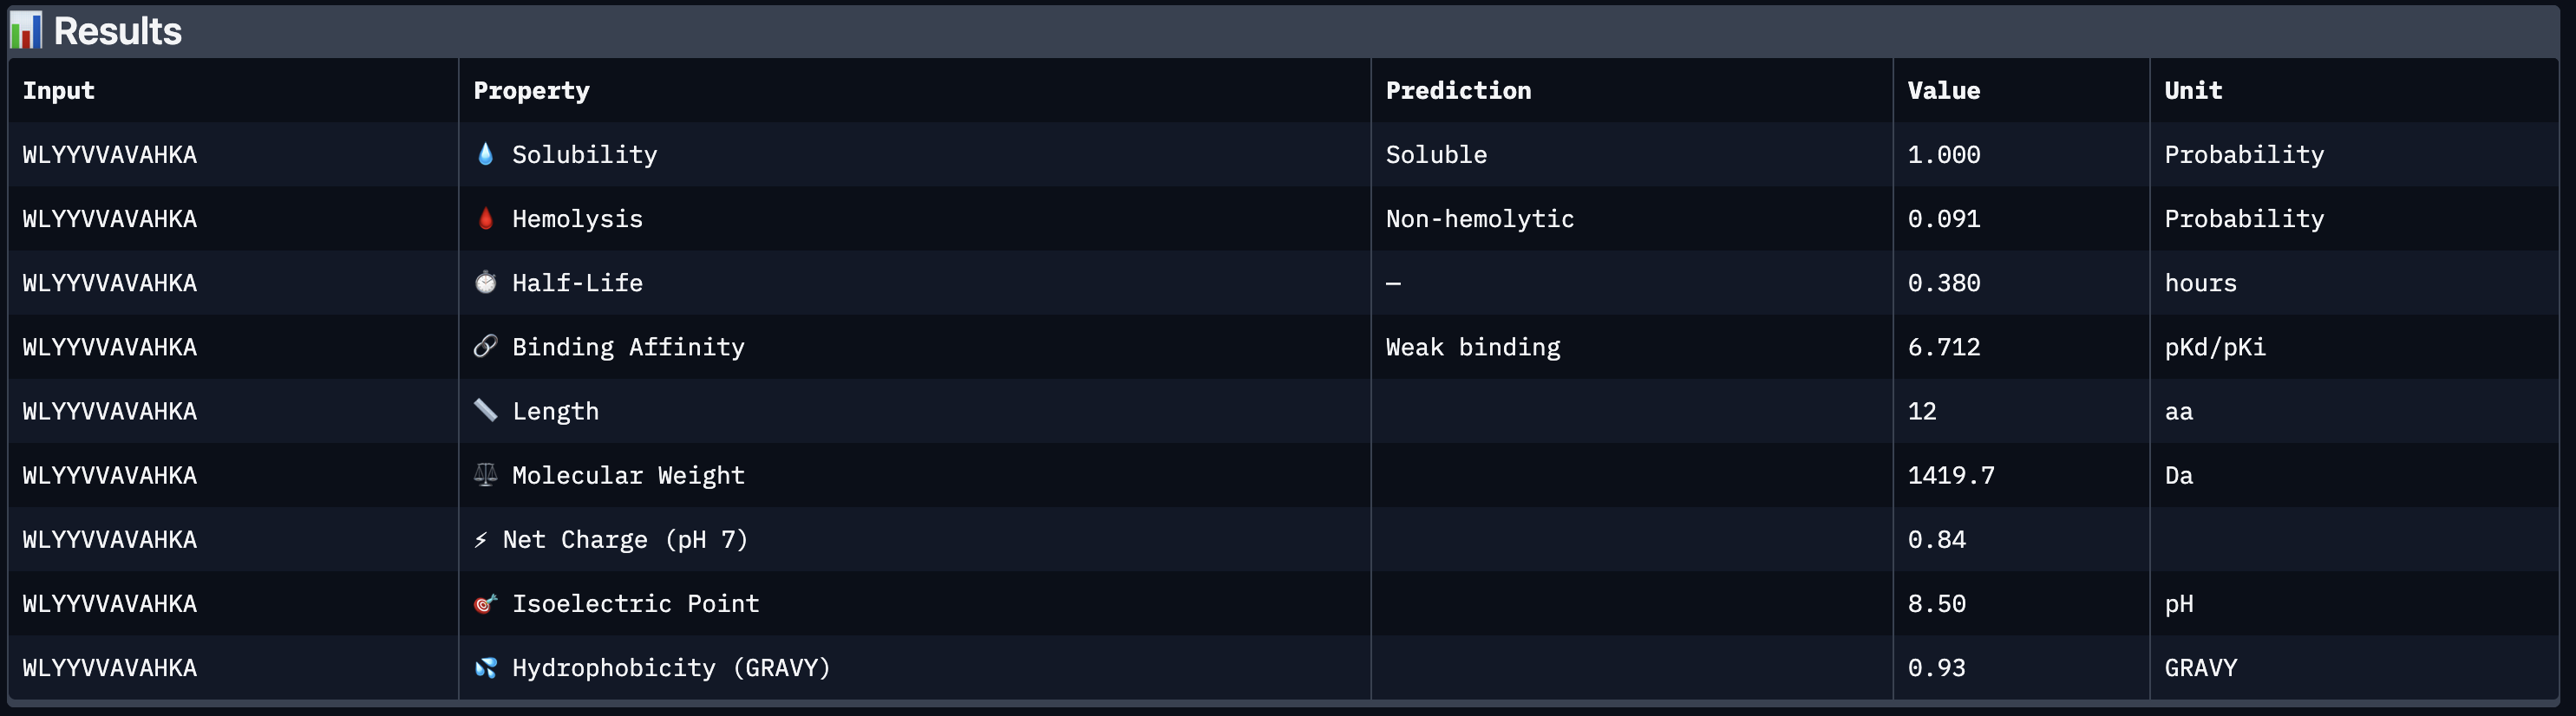
Peptide 4 WLYYVVAVAHKA
Peptide 5 FLYRWLPSRRGG
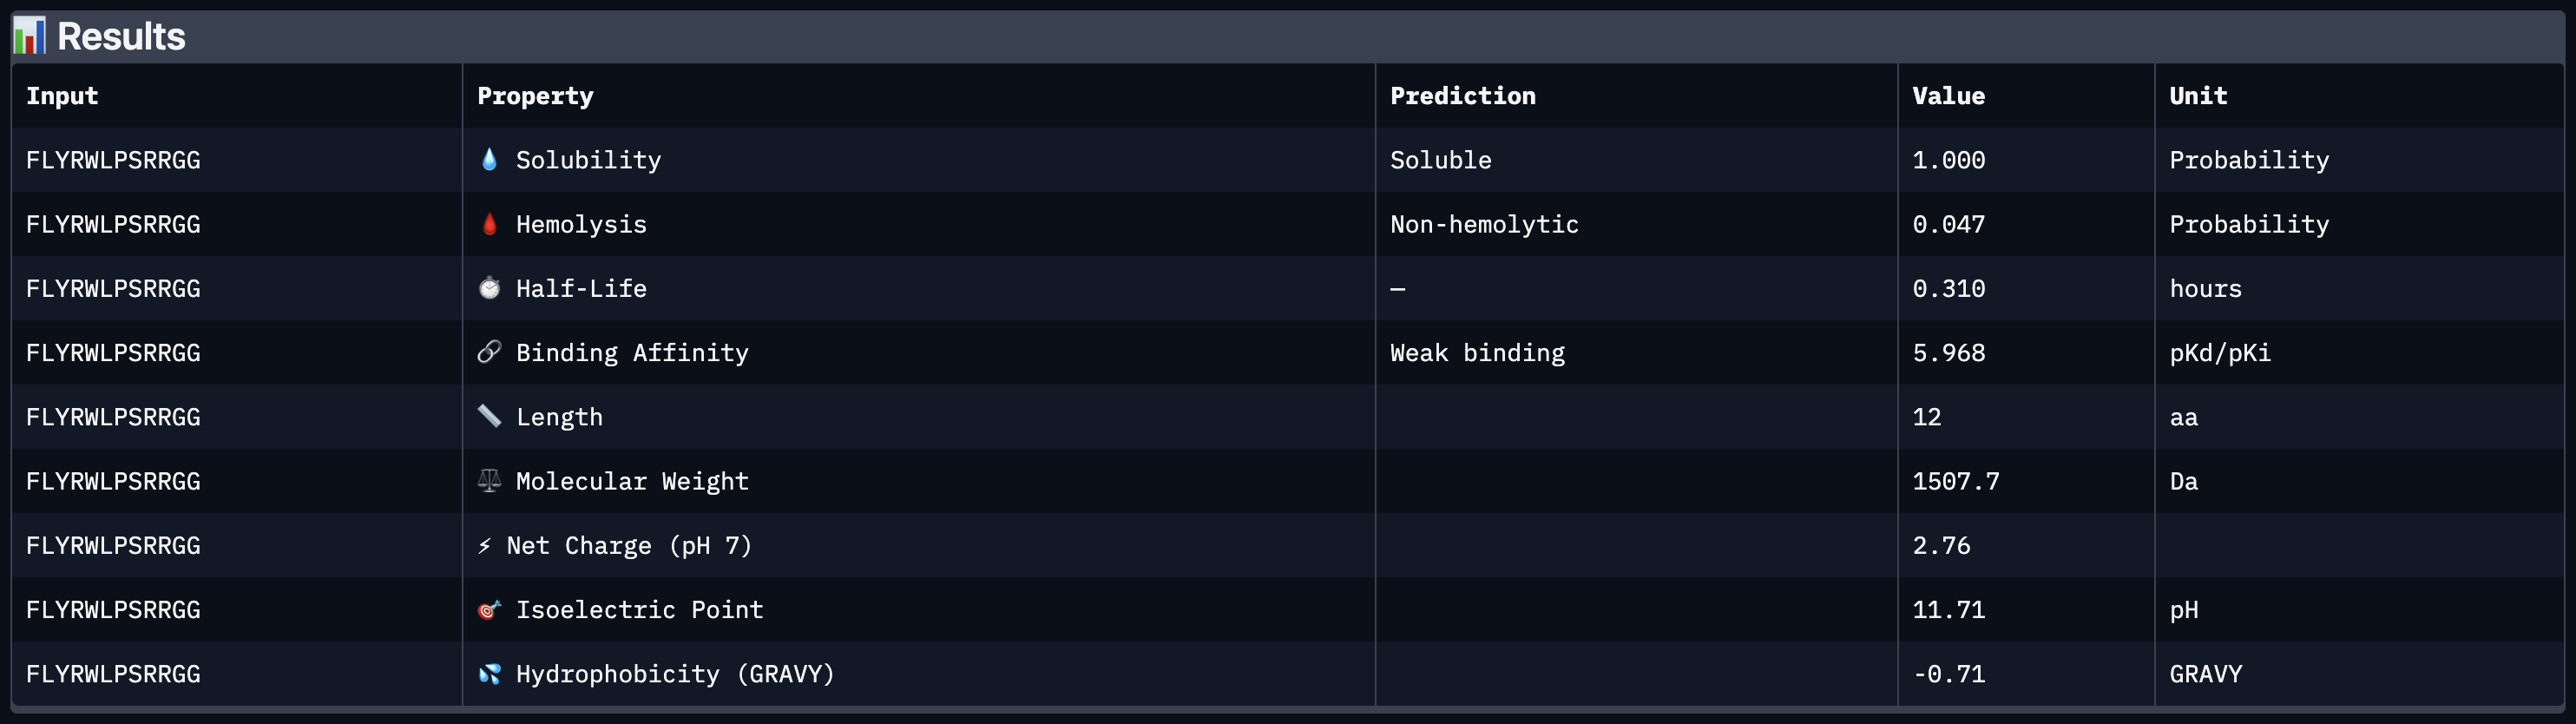
All four peptides demonstrated favorable therapeutic profiles when evaluated through PeptiVerse, and outperformed FLYRWLPSRRGG in predicted binding affinity. Every peptide showed perfect solubility (1.000 probability) and was predicted to be non-hemolytic, confirming a safe baseline. In terms of binding affinity, Peptide 3 (WLYVPAGLALWA) emerged as the strongest binder with a medium binding score of 7.599 pKd/pKi, followed by Peptide 1 (WLYVVAAVRWKA) at 7.214. FLYRWLPSRRGG achieved a weak binding score of 5.968. This is a significant finding as it suggests PepMLM successfully generated peptides with stronger predicted affinity than an experimentally validated binder. Based on this analysis, Peptide 3 (WLYVPAGLALWA) remains the top candidate to advance. It has the highest predicted binding affinity, full solubility, low hemolytic risk, and a drug-like molecular weight of 1359.6 Da, making it the strongest overall therapeutic candidate from this screen pending AlphaFold3 structural confirmation.
Part 3: PeptiVerse Cross-Comparison
Comparing AlphaFold3 ipTM scores against PeptiVerse-predicted binding affinity reveals a partial disconnect: higher ipTM did not consistently predict stronger binding affinity. FLYRWLPSRRGG had the highest ipTM (0.41) but the weakest predicted affinity at 5.968 pKd — the lowest of all five peptides. Meanwhile Peptide 3 (WLYVPAGLALWA), which had a mid-range ipTM of 0.36, showed the strongest predicted affinity at 7.599 pKd. This discrepancy highlights the complementary nature of the two tools: AlphaFold3 captures structural plausibility while PeptiVerse captures predicted biochemical potency, and they do not necessarily agree.
In terms of safety, all four PepMLM-generated peptides were predicted to be non-hemolytic with perfect solubility (1.000), meaning none present an obvious therapeutic liability on those axes. FLYRWLPSRRGG, despite being an experimentally validated binder, was outperformed on predicted affinity by three of the four generated peptides, suggesting that PepMLM can generate sequences with improved computational properties even if structural confidence remains modest.
Peptide 3 (WLYVPAGLALWA) best balances predicted binding affinity, solubility, non-hemolytic profile, and drug-like molecular weight and is the top candidate to advance.
Interpretation of PeptiVerse results
The generated peptides showed trade-offs between predicted binding affinity, therapeutic safety, and developability.
Peptide 7 (GKRYYYYKDKCF) showed the strongest predicted binding affinity (pKd = 9.123), making it the most promising binder from an interaction standpoint. However, it had a relatively low motif score (0.340), suggesting weaker alignment with the desired design motif.
Peptide 8 (VGTCYCIKKKKM) had the highest hemolysis probability (0.978), which makes it less attractive as a therapeutic candidate despite a reasonably strong predicted affinity (pKd = 7.123) and a strong motif score (0.730).
Peptide 9 (TKQCKFTRPQNE) had the strongest motif score (0.876), indicating good alignment with the desired interaction pattern, but its predicted binding affinity (pKd = 5.533) was lower than the best-performing candidates.
Overall, Peptide 7 appears strongest in terms of predicted affinity, while Peptide 9 may represent a more motif-consistent but weaker-binding alternative. Since all candidates showed high hemolysis probabilities, additional optimization would likely be required before therapeutic development.
Part 4: Optimized peptide generation with moPPIt
Index
Peptide
Hemolysis
Solubility
Affinity (pKd)
Motif Score
6
GKCGKNEVHKHR
0.955
0.917
5.692
0.396
7
GKRYYYYKDKCF
0.945
0.917
9.123
0.340
8
VGTCYCIKKKKM
0.978
0.750
7.123
0.730
9
TKQCKFTRPQNE
0.955
0.833
5.533
0.876
Overall, moPPIt gives more rational, multi-objective candidates anchored to a therapeutic hypothesis (binding the A4V site), while PepMLM provides broader sequence diversity without site or safety guidance.
Among the moPPIt candidates, GKRYYYYKDKCF (Peptide 7) is the strongest candidate to advance. It has by far the highest predicted binding affinity (9.12 pKd), a hemolysis score of 0.945 (non-hemolytic), and a solubility score of 0.917. Its motif score of 0.340 is the lowest among the four, suggesting it may not perfectly engage the exact residues targeted near position 4, but given that its affinity is dramatically higher than all other candidates from both tools, it warrants further structural and experimental investigation to determine where exactly it binds SOD1.
Before advancing any moPPIt candidate to clinical studies, I would evaluate them through: (1) experimental binding assays (SPR or ITC) to confirm predicted affinity against recombinant A4V SOD1, (2) cell-based toxicity assays in neuronal cell lines to validate the non-hemolytic predictions, (3) serum stability assays to assess protease resistance, and (4) aggregation inhibition assays to confirm the candidate reduces A4V SOD1 misfolding rather than merely binding without functional effect.
Part B skipped since optional
Part C: Final project L-Protein Mutants
Option 1: Mutagenesis
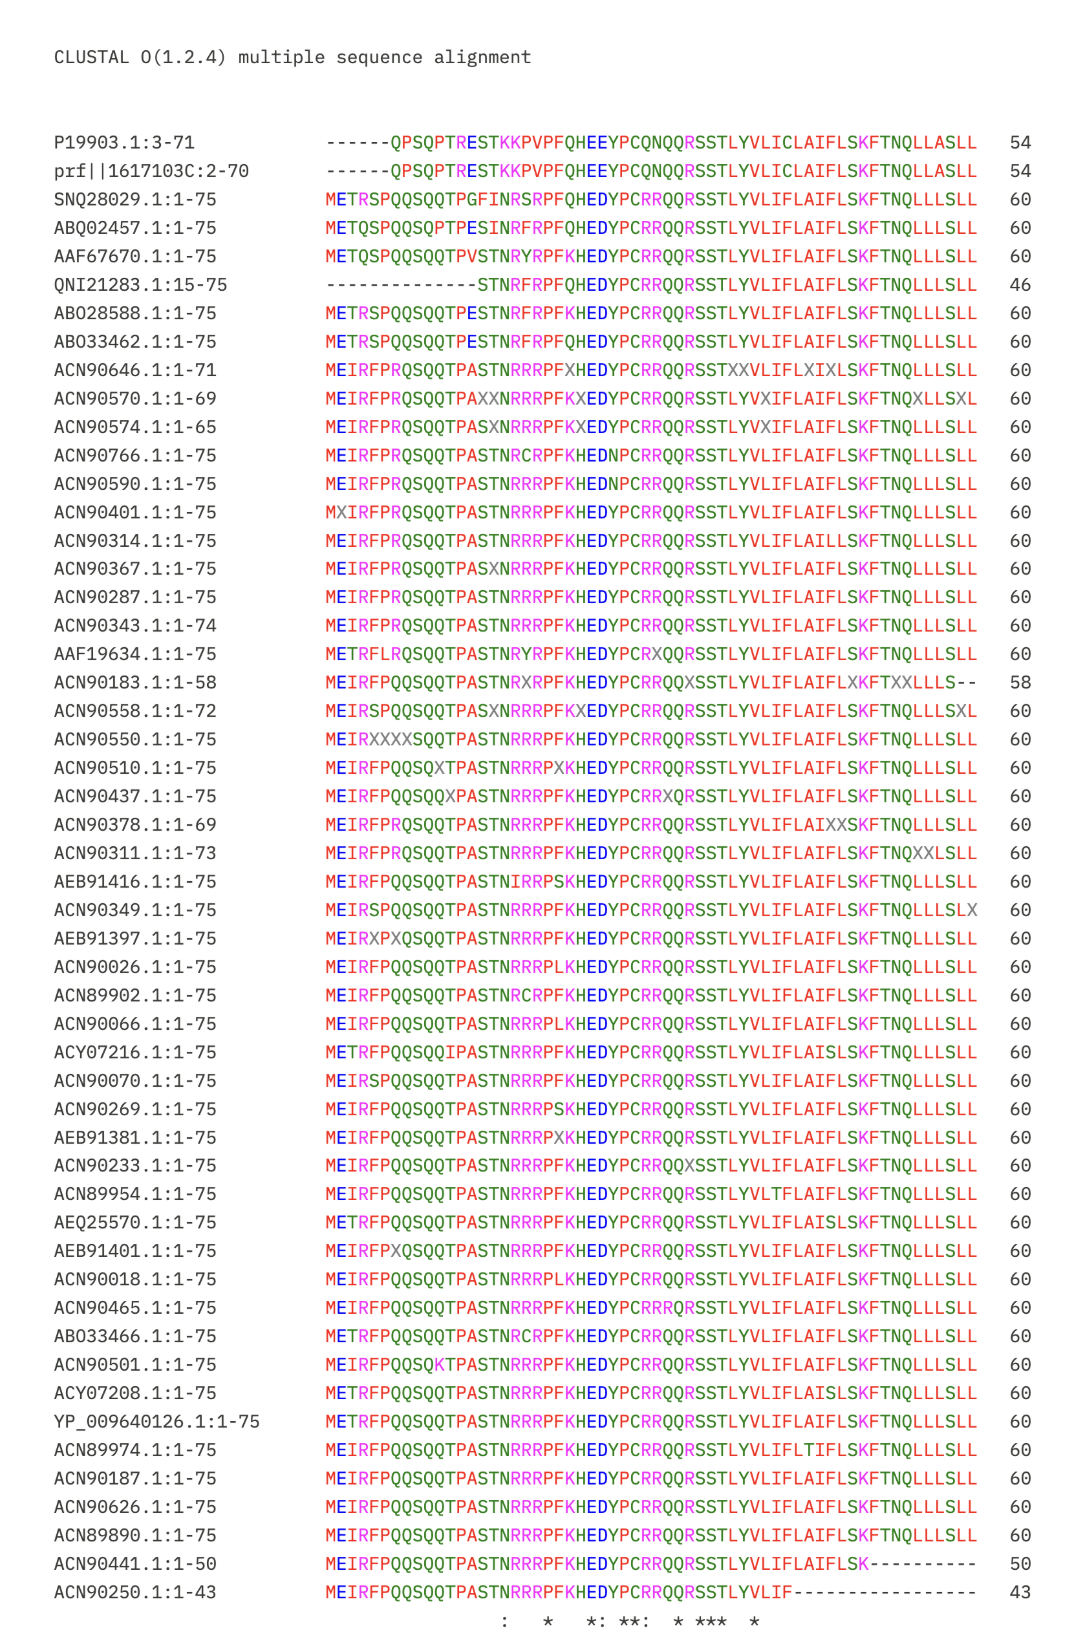
Attaching MSA output
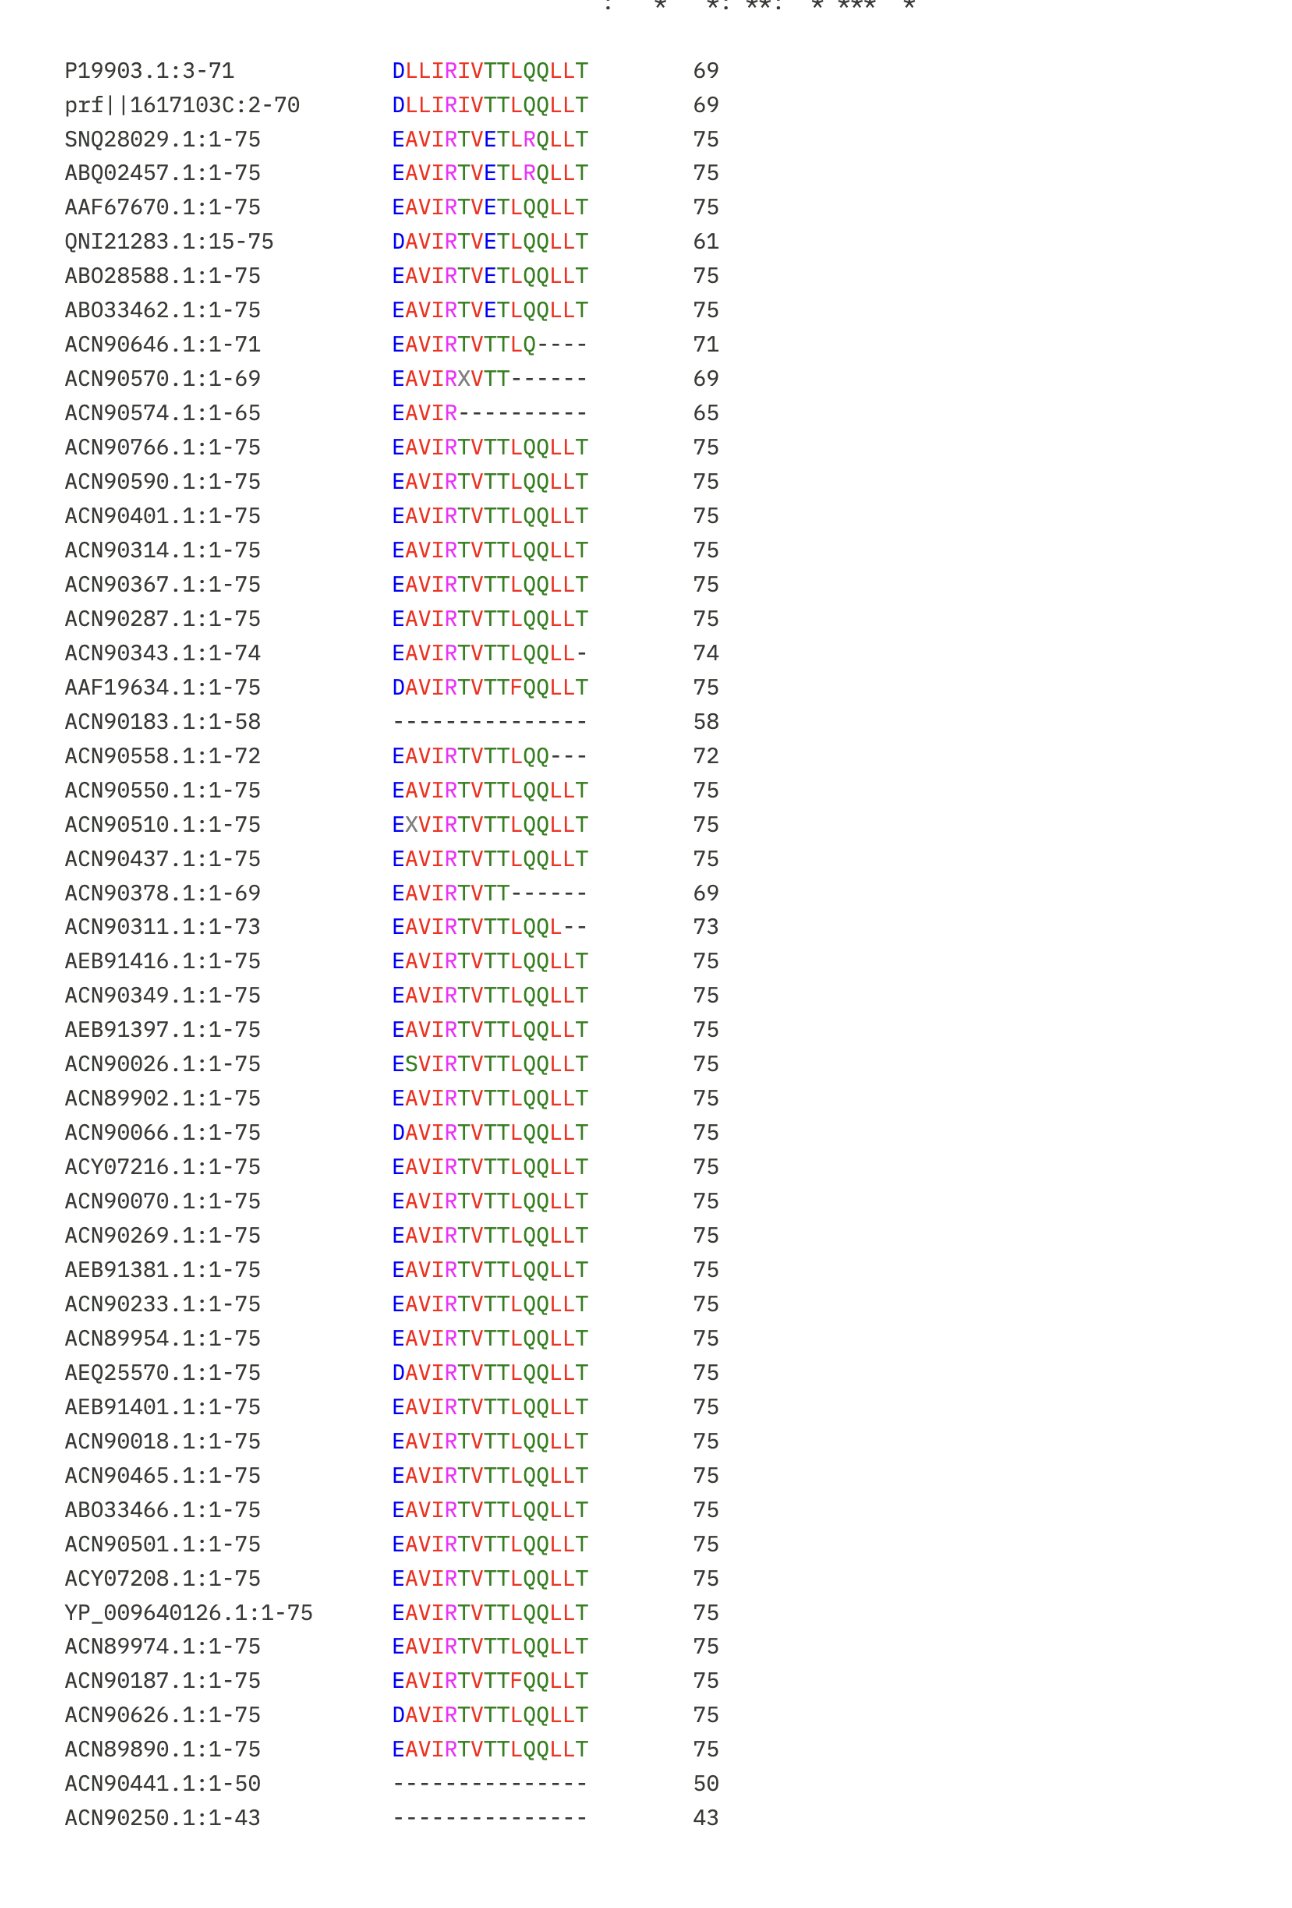
looking at the TM region in Image 2, almost every sequence ends with EAVIRTVTTLQQLLT. This stretch is extremely conserved, which means residues ~62–75 (VIRTVTTLQQLLT) are very risky to mutate.
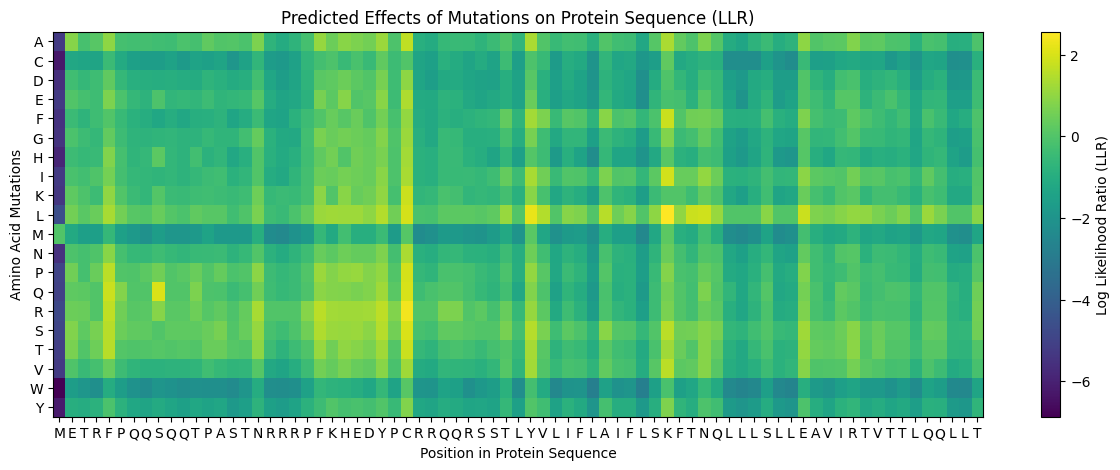
And the L Protein mutation heatmap,
The heatmap x-axis follows the full L-protein sequence. Mapping positions to amino acids:
M(1) E(2) T(3) R(4) F(5) P(6) Q(7) Q(8) S(9) Q(10)Q(11)T(12)P(13)A(14)S(15)T(16)
N(17)R(18)R(19)R(20)P(21)F(22)K(23)H(24)E(25)D(26)Y(27)P(28)C(29)R(30)R(31)Q(32)
Q(33)R(34)S(35)S(36)T(37)L(38)Y(39)V(40) | L(41)I(42)F(43)L(44)A(45)I(46)F(47)L(48)
S(49)K(50)F(51)T(52)N(53)Q(54)L(55)L(56)L(57)S(58)L(59)L(60)E(61)A(62)V(63)I(64)
R(65)T(66)V(67)T(68)T(69)L(70)Q(71)Q(72)L(73)L(74)T(75)
ESM Score vs. Experimental Data Correlation
To evaluate whether the ESM-based mutational scores capture real functional information, I cross-referenced the heatmap against the experimental L-protein mutant dataset from the spreadsheet. Positions such as those in the conserved EAVIRTVTTLQQLLT stretch of the TM domain (residues 62–75) consistently appear as dark columns in the ESM heatmap, indicating strong negative predicted fitness for any substitution. This aligns well with the MSA data, where these positions show near-zero variation across related phage sequences. Conversely, some positions in the soluble N-terminal domain (residues 1–40) show yellow-to-neutral scores at certain substitutions, suggesting the model predicts these changes are tolerable and consistent with the experimental observation that many soluble-domain mutations retain partial lysis activity.
The following 5 mutations were selected based on positive ESM LLR scores, MSA
conservation analysis, and structural reasoning. Two mutations fall in the TM domain
(residues 41–75) and three in the soluble N-terminal domain (residues 1–40). The mutations I chose to continue with in the Soluble Domain and Transmembrane domain are:
Index
Position
Wildtype_AA
Mutation_AA
LLR Score
1
29
C
R
2.3954
2
09
S
Q
2.014
3
50
K
L
2.5615
4
53
N
L
1.8649
5
22
F
R
1.6020
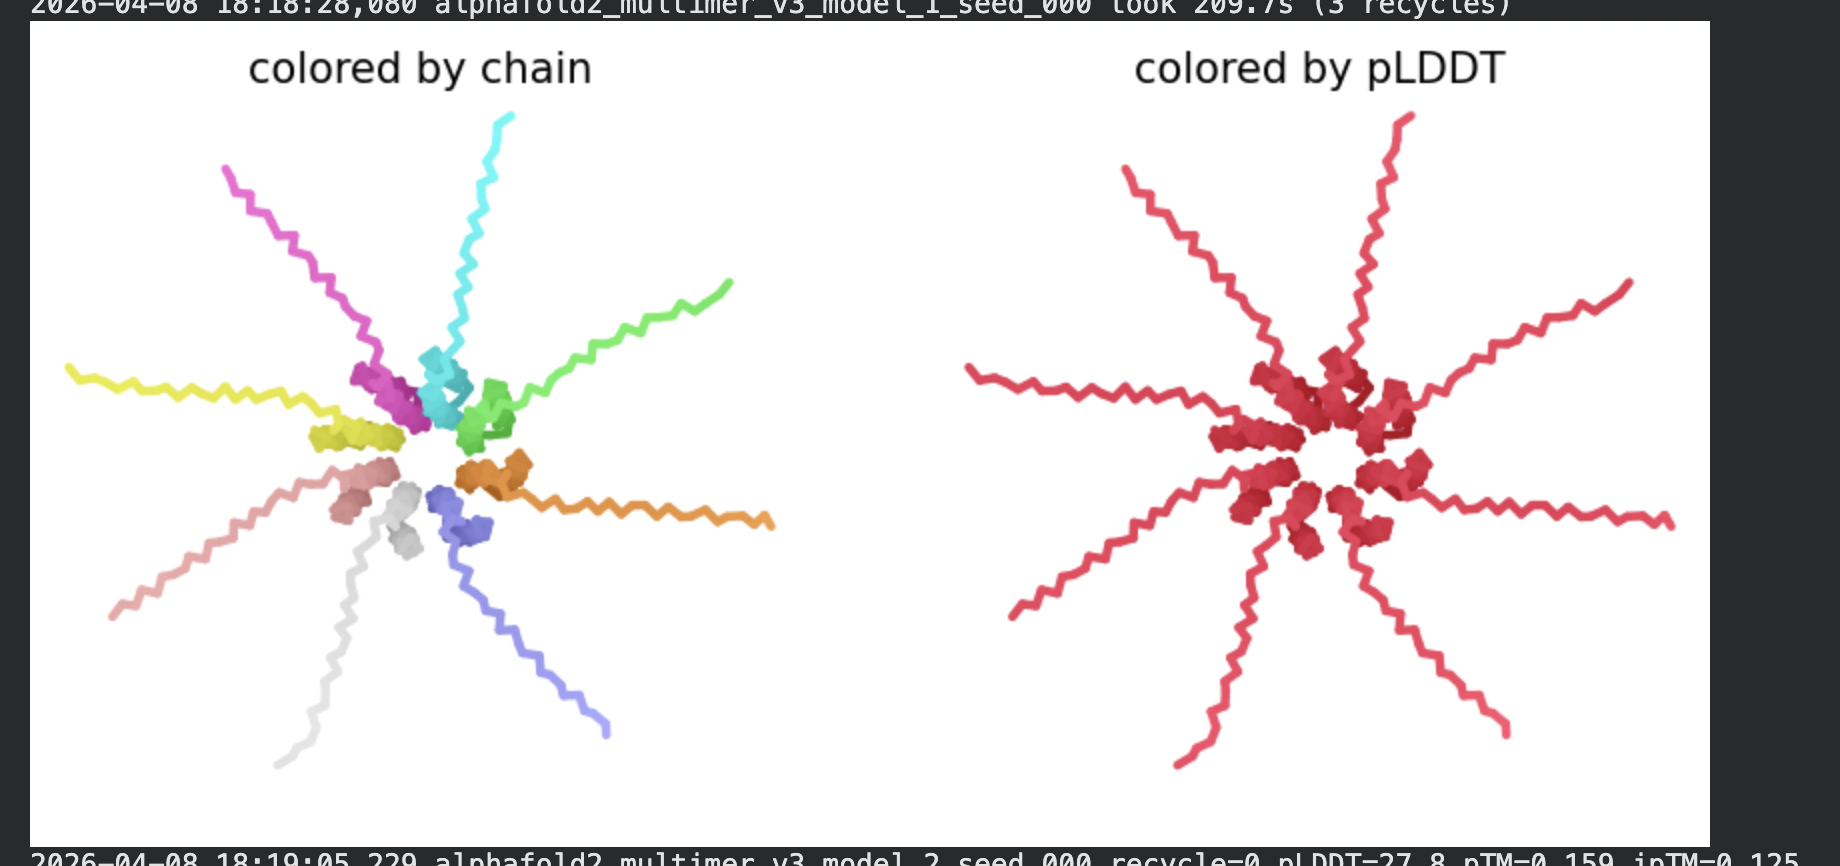
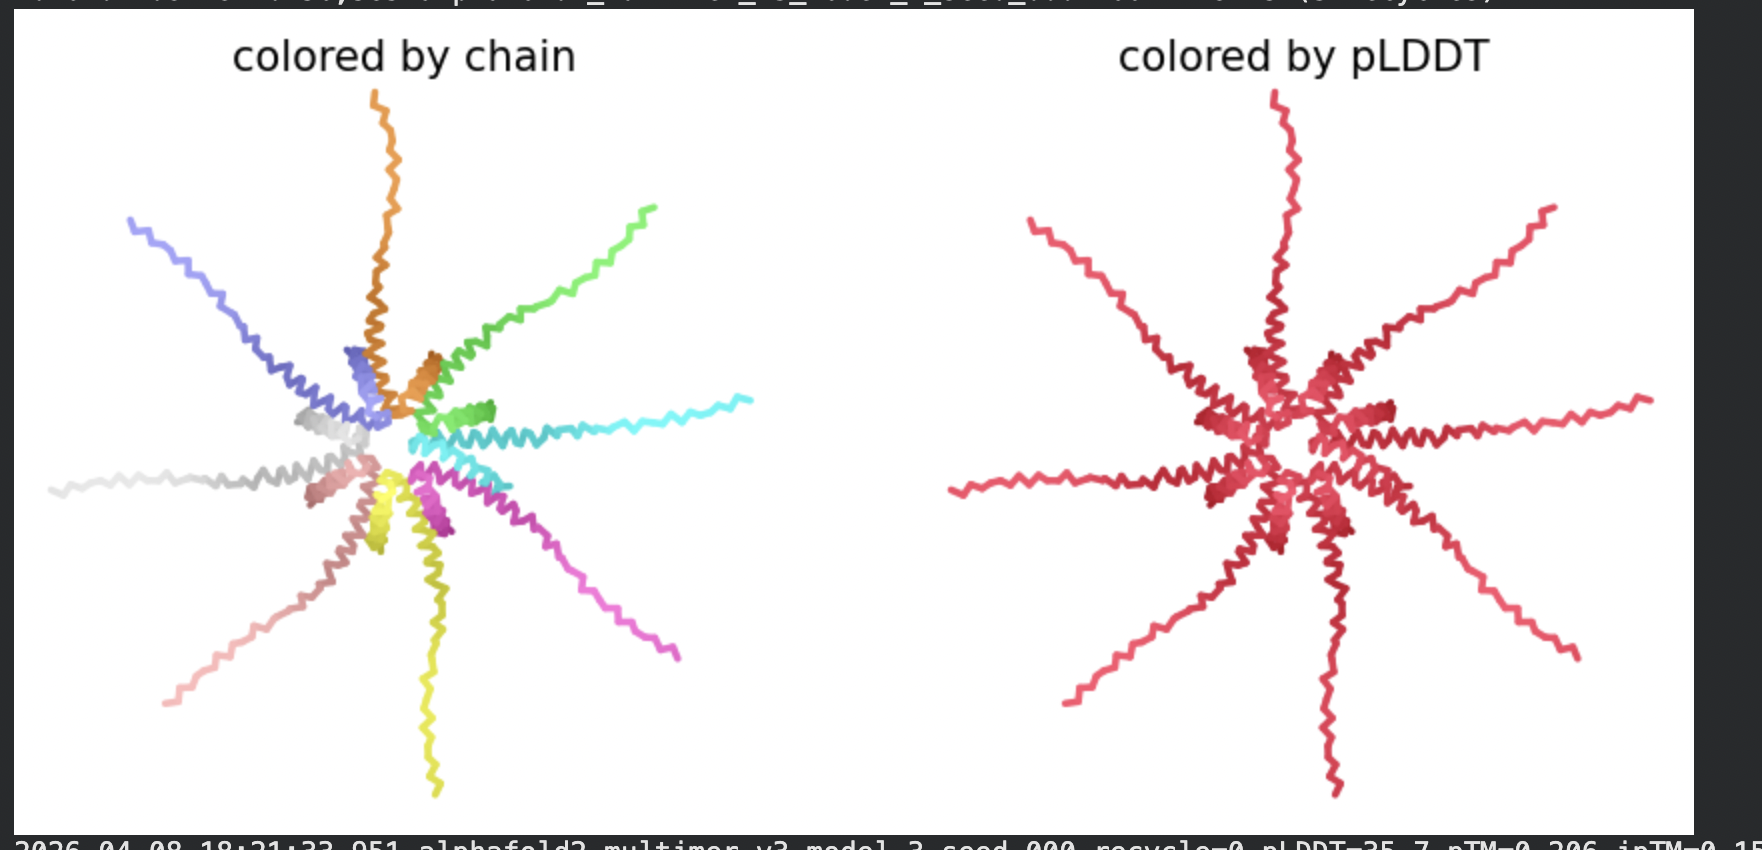
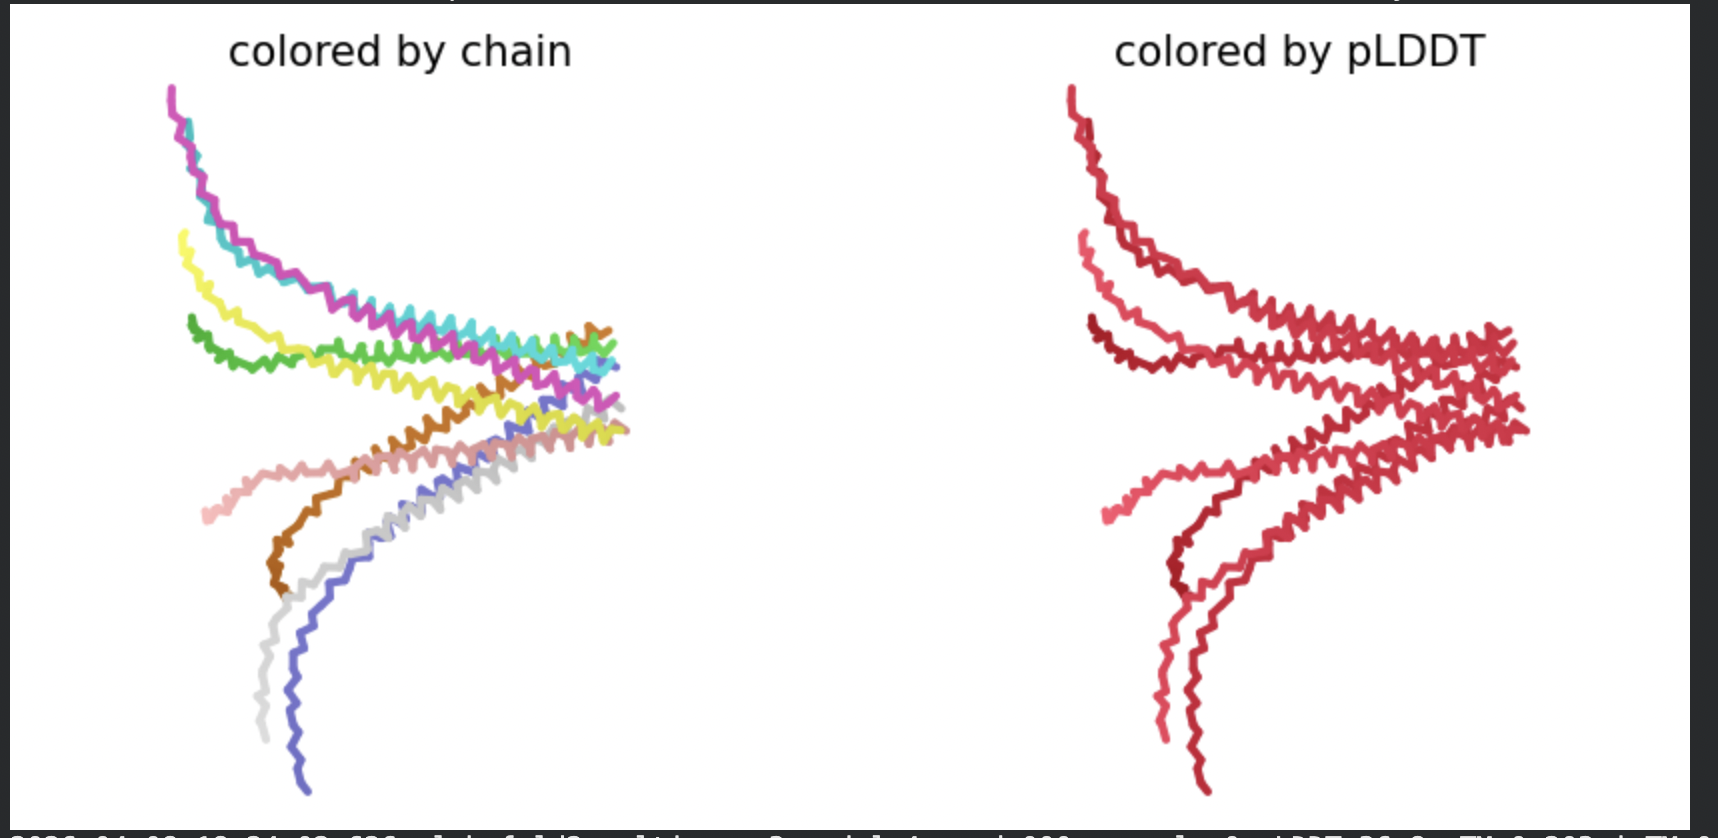
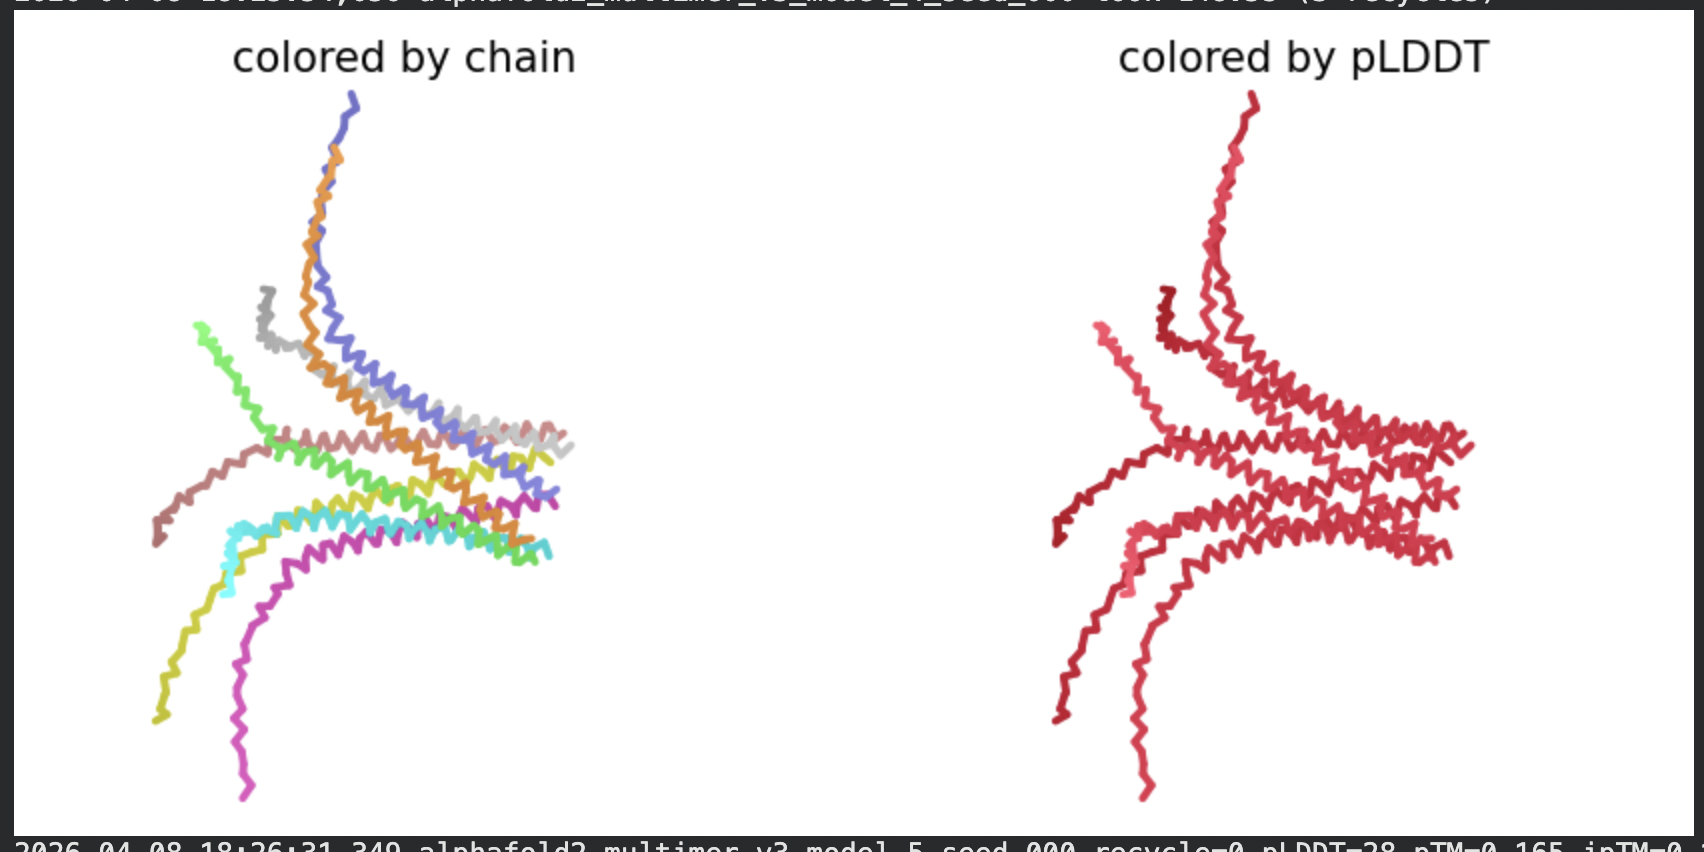
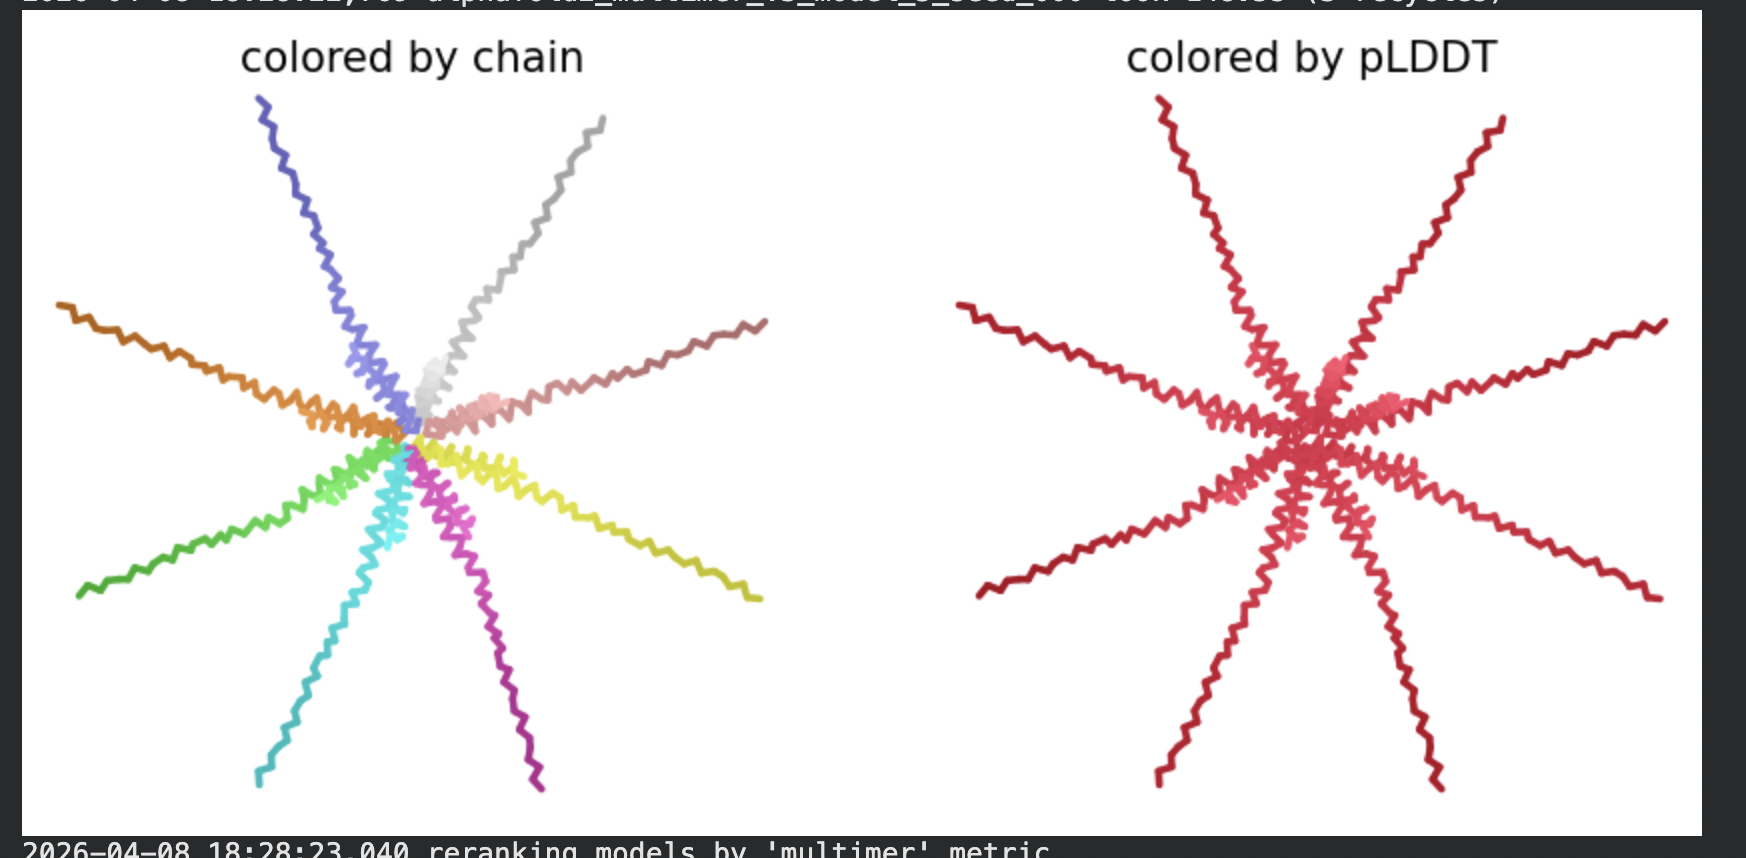
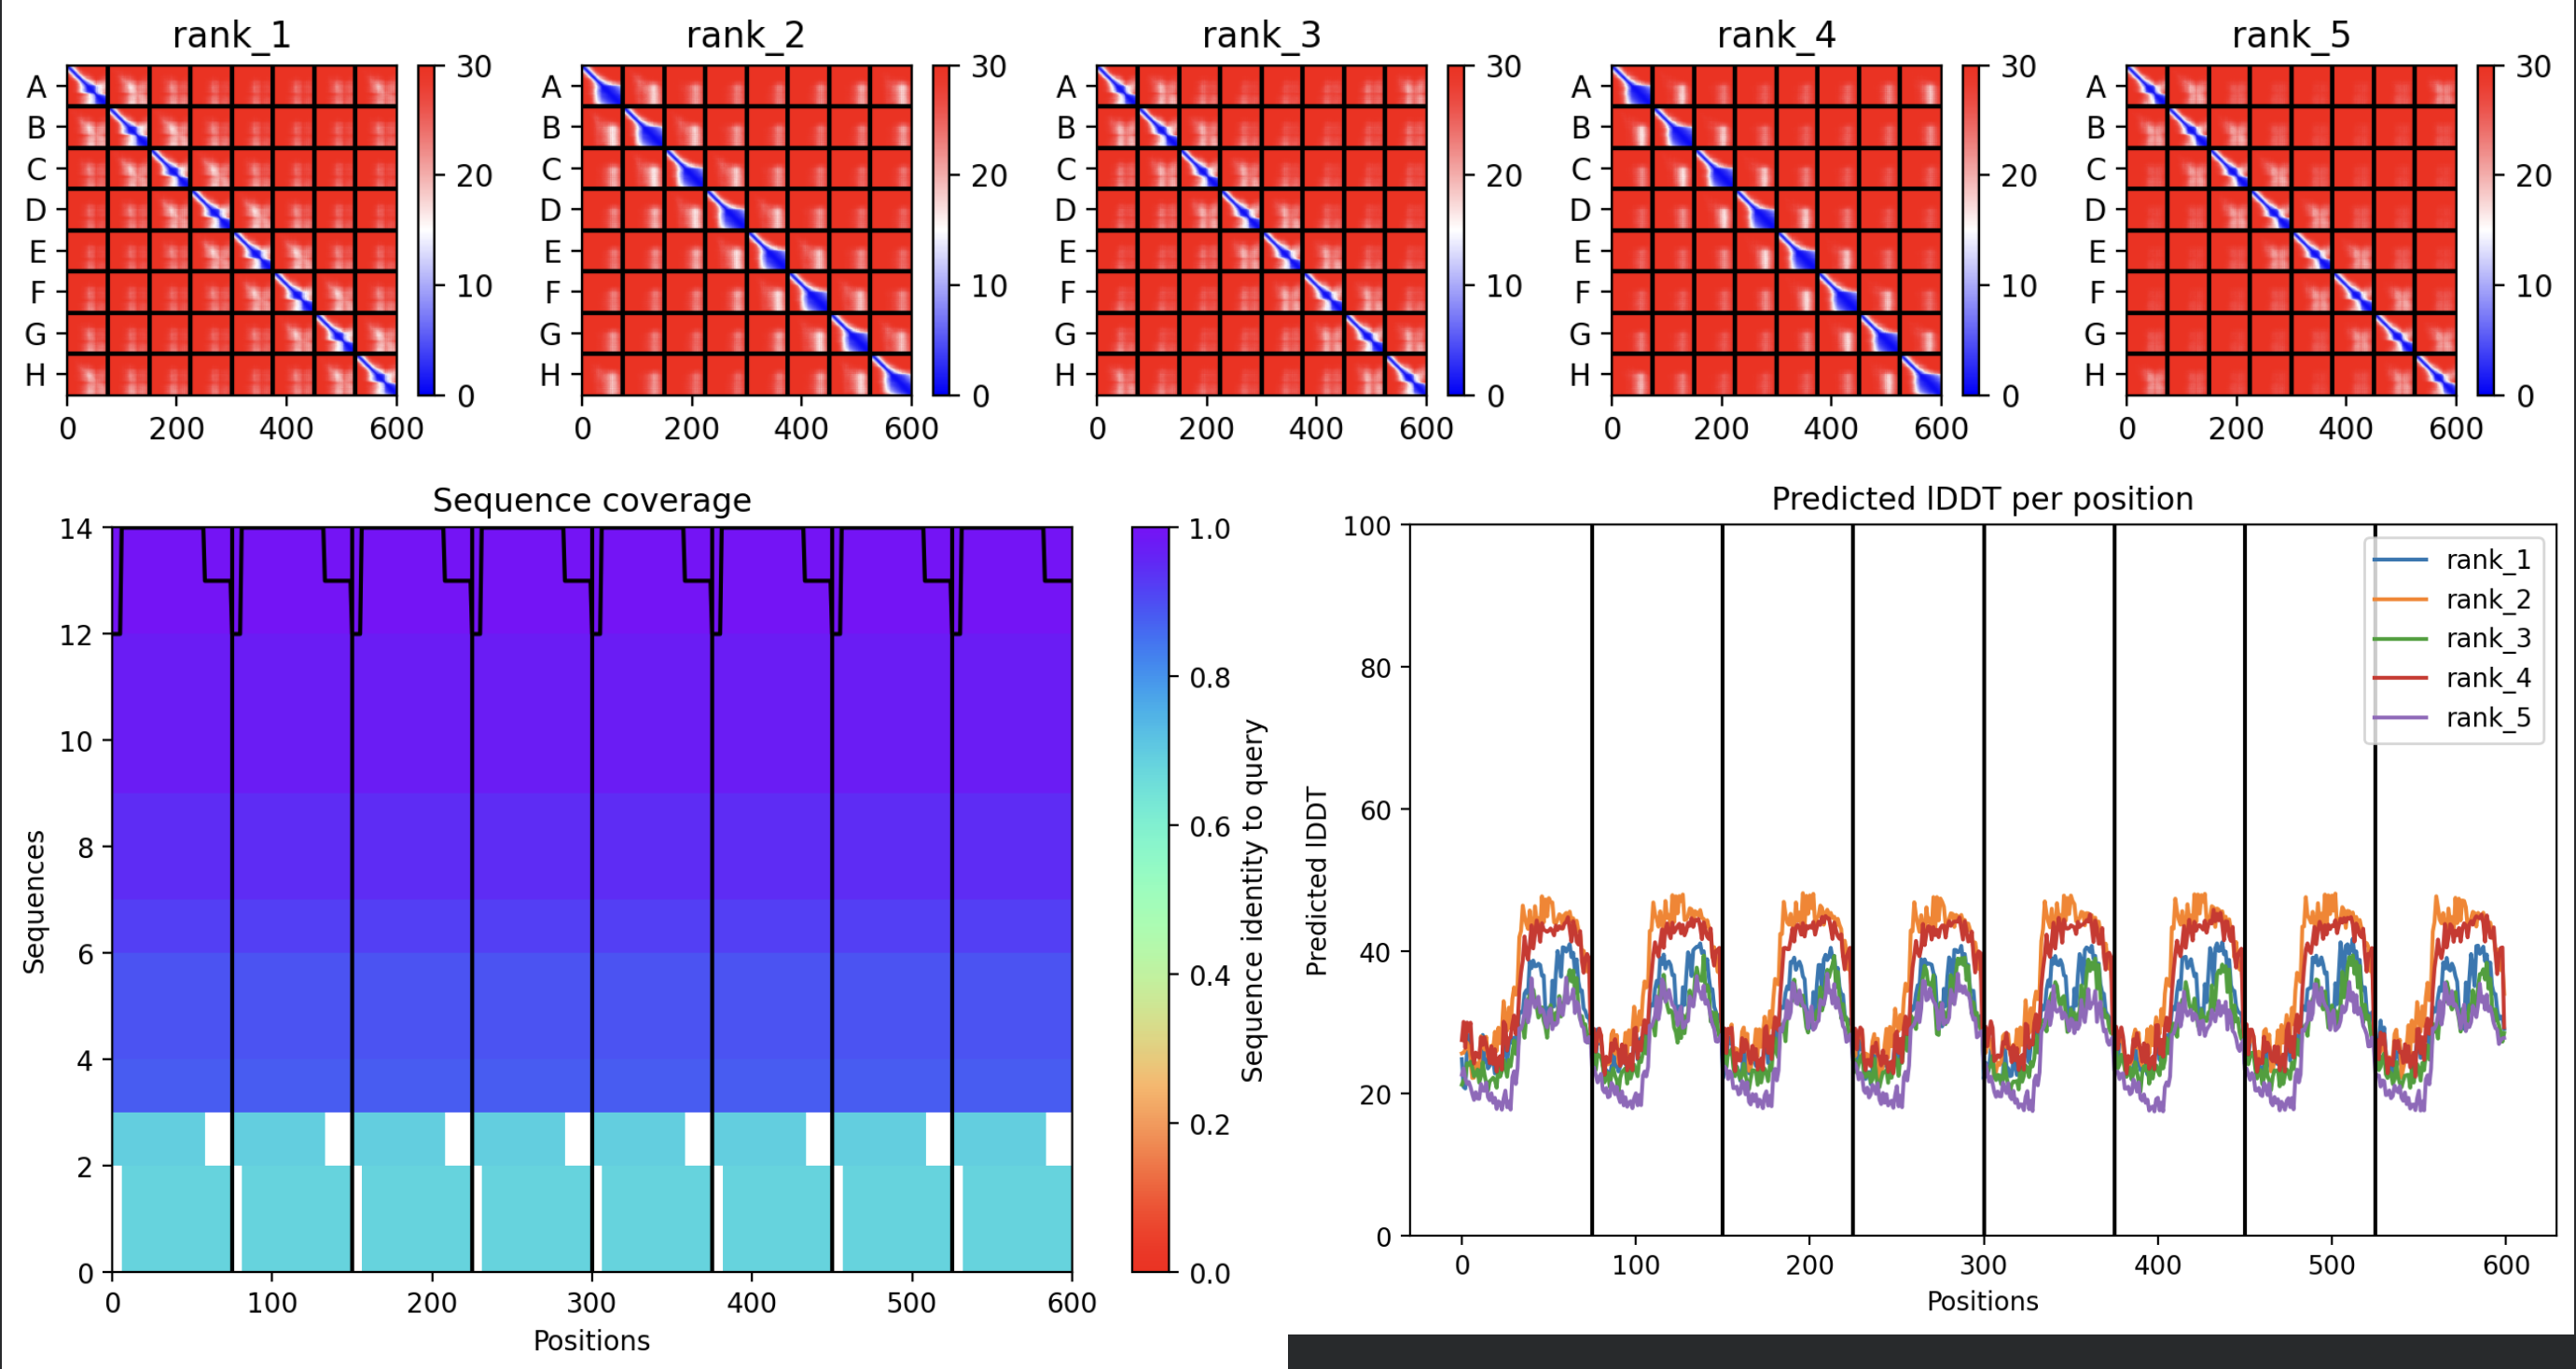
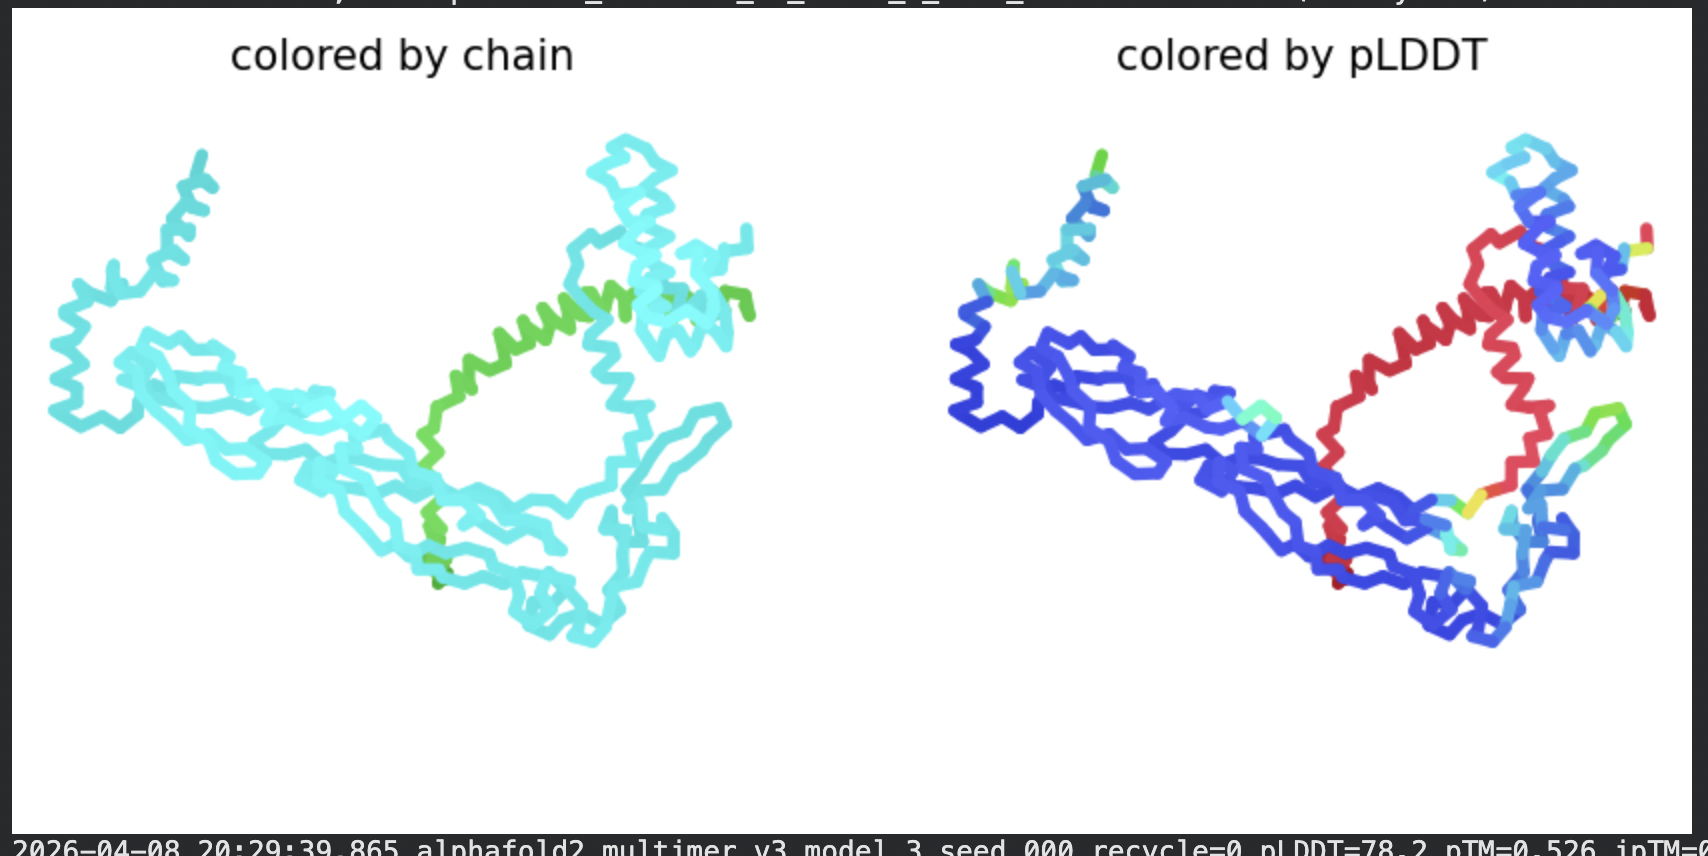
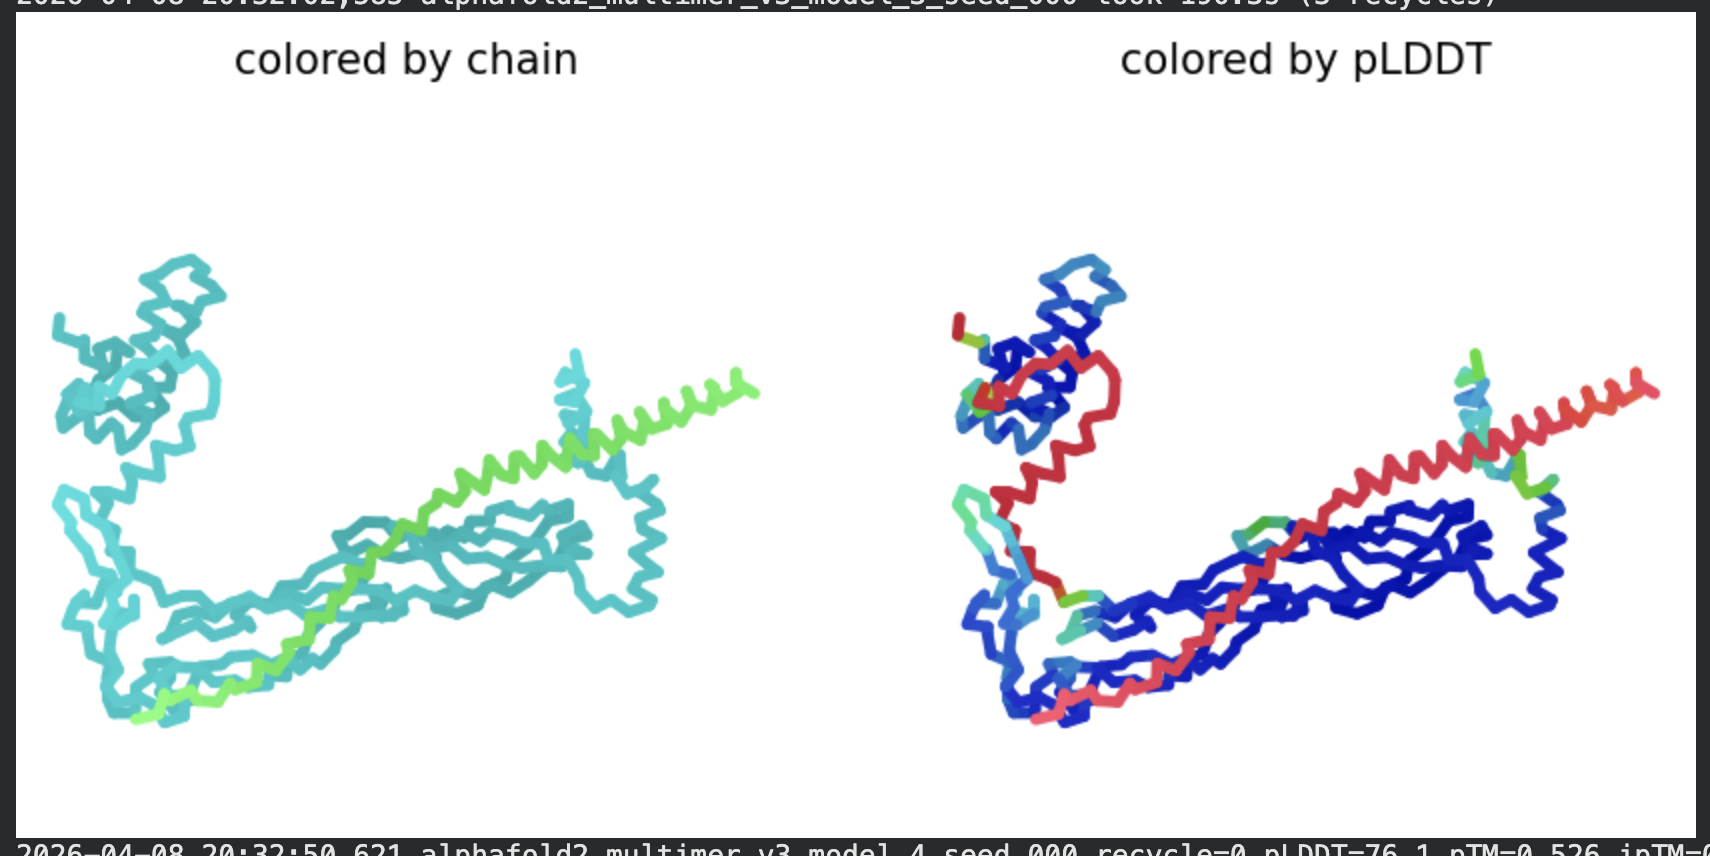
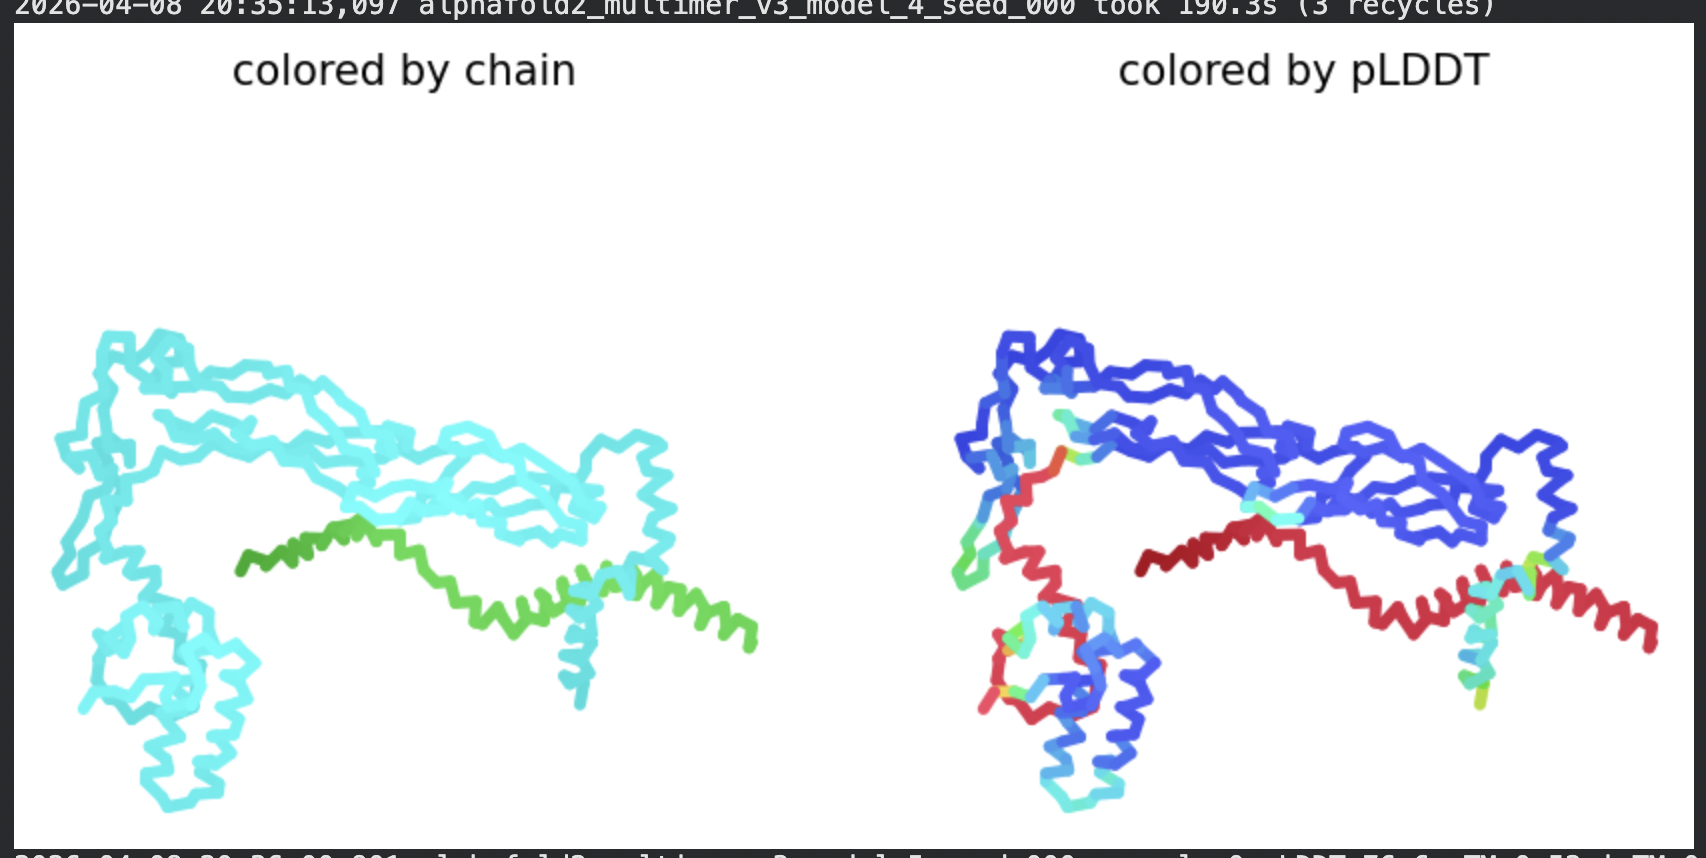
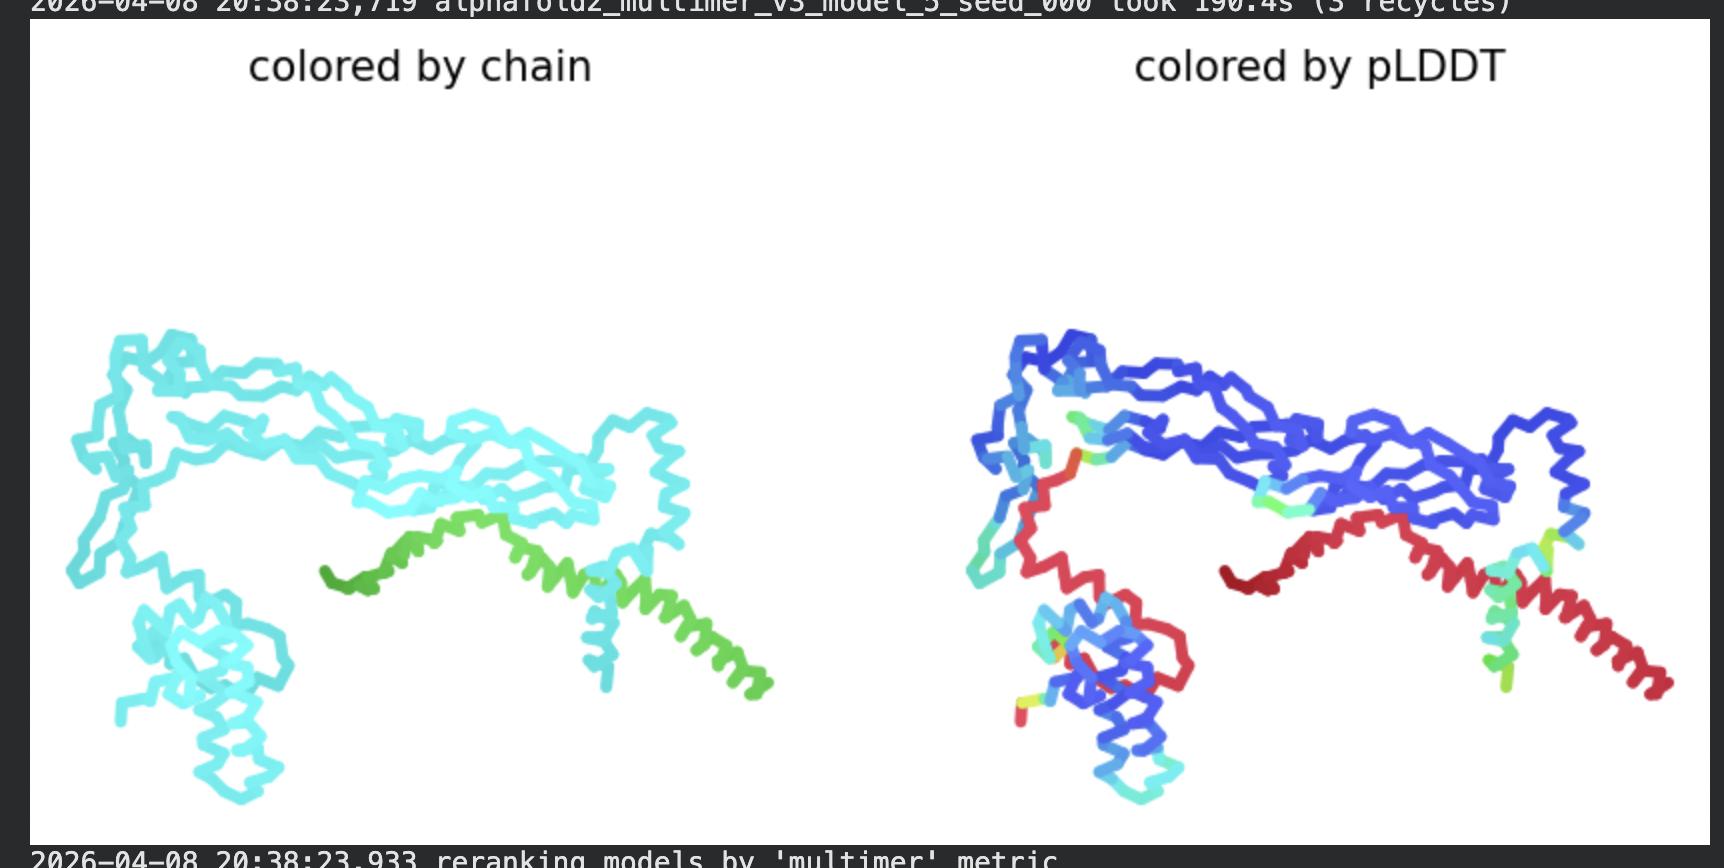
Alphafold multimer runs
8 chains of L-protein (including proposed mutations) separated by colons,
total length 600 residues.
All five ranked models show uniformly very low pLDDT scores (20–28, well below the
<50 threshold). The PAE matrices are nearly uniformly red (~25–30 Å error) across all off-diagonal inter-chain blocks, with confidence only on the per-chain diagonal. This means the model cannot confidently place any chain relative to any other.
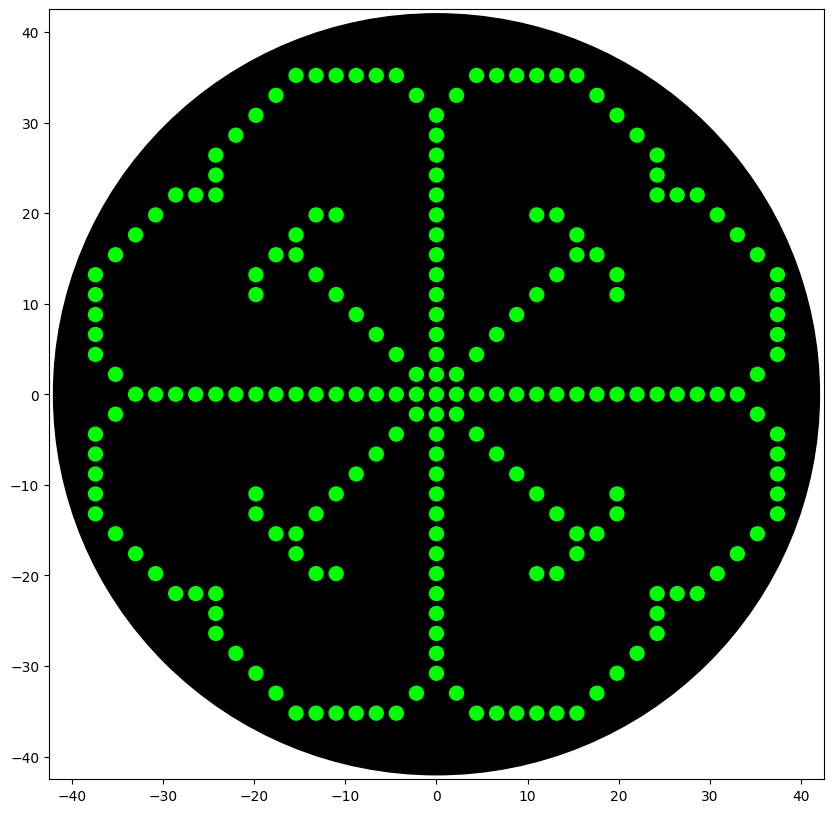
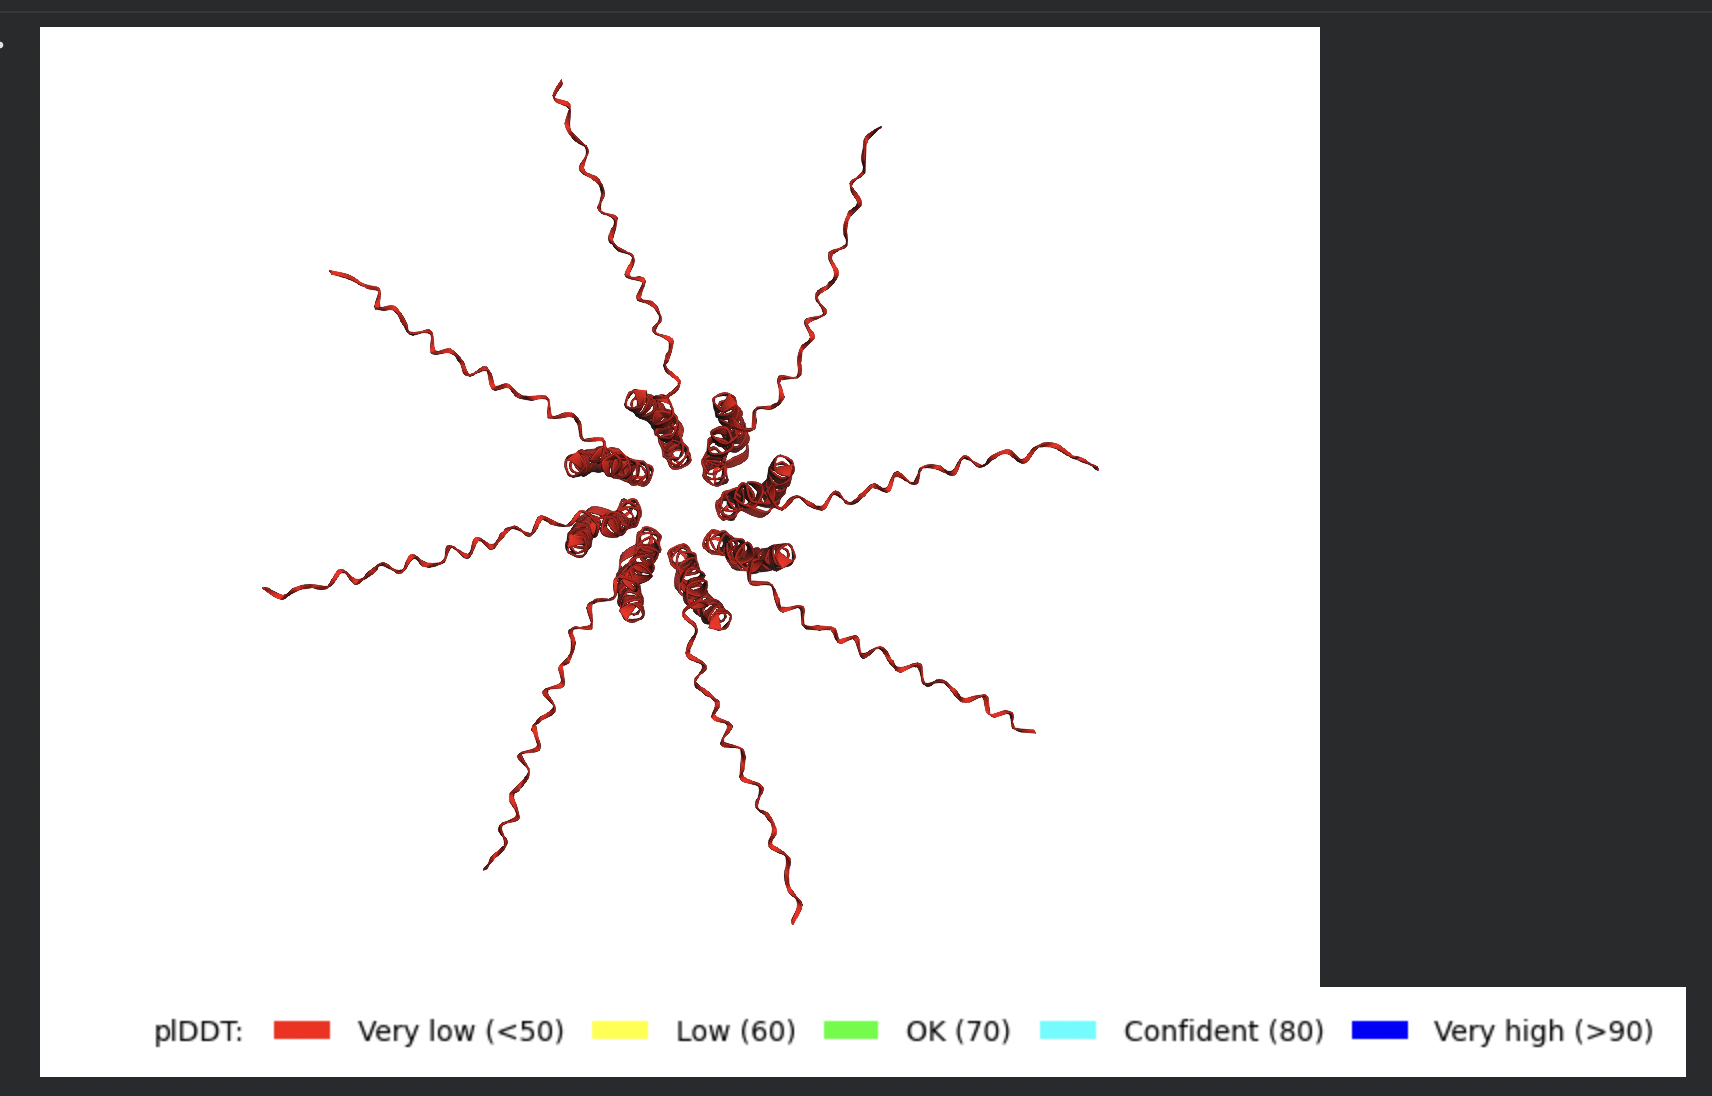
Despite the low confidence scores, the predicted structures display a biologically
interesting pattern: in the Mol* viewer, helical secondary structure is
visible at the center of the assembly, with disordered tails radiating outward in a
sunburst arrangement. This is consistent with the pore-formation hypothesis for the
L-protein. the TM helices converge at the central axis (as expected for a membrane
pore), while the soluble N-terminal domains remain disordered and point outward into
the cytoplasm. The per-position IDDT plot shows periodic peaks that
correspond to the TM helix region of each chain, which is the only portion with
marginally higher local confidence (~40–50).
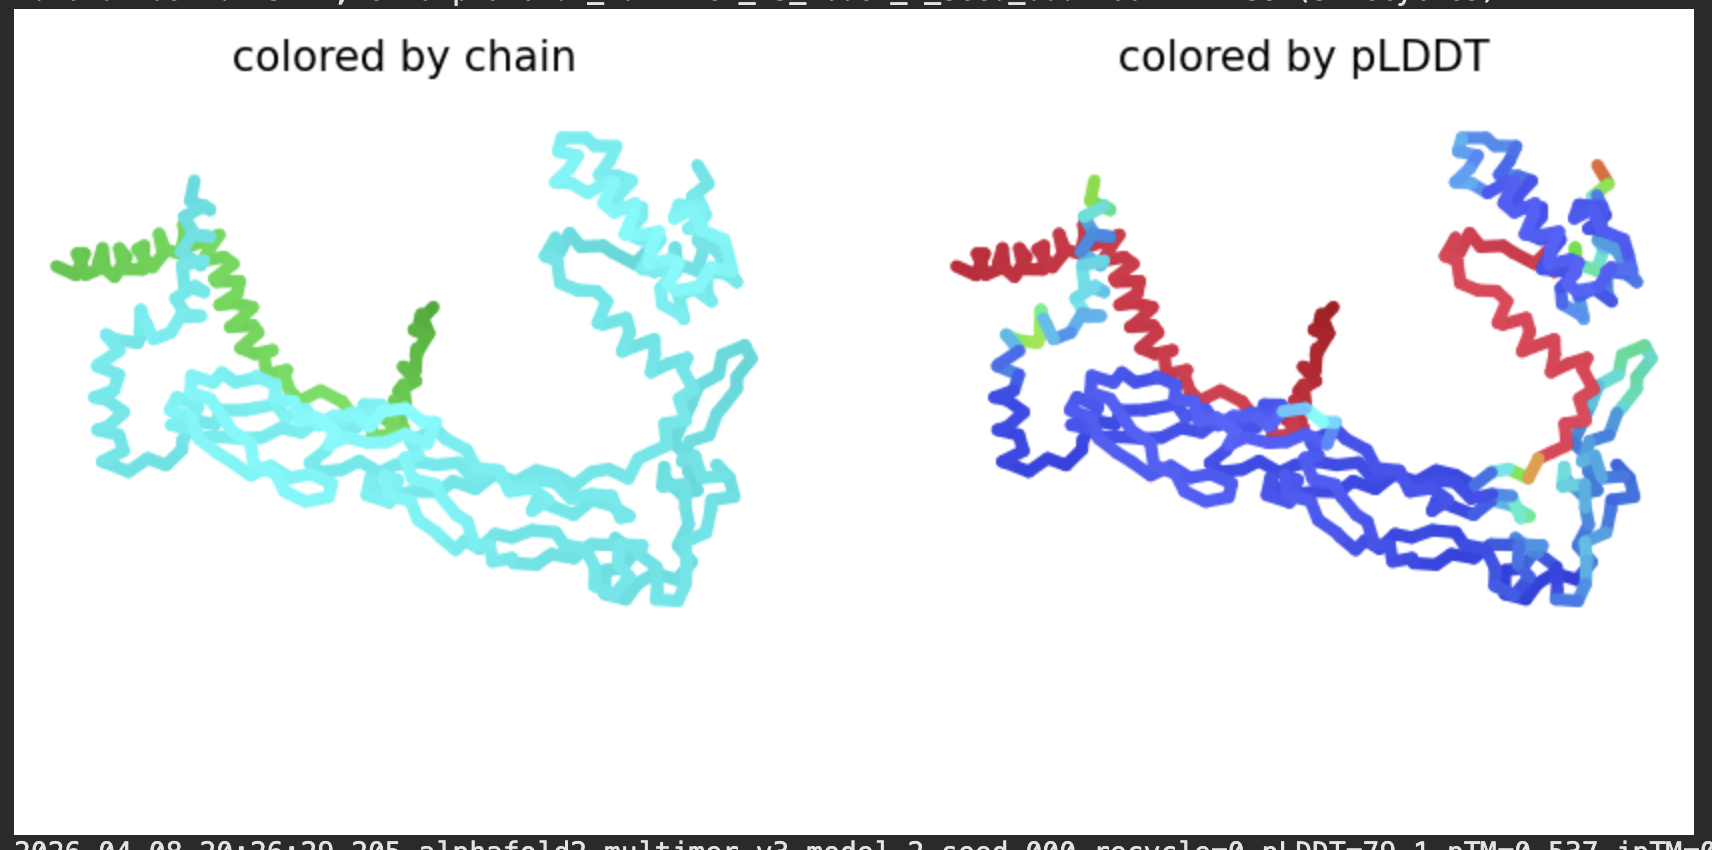
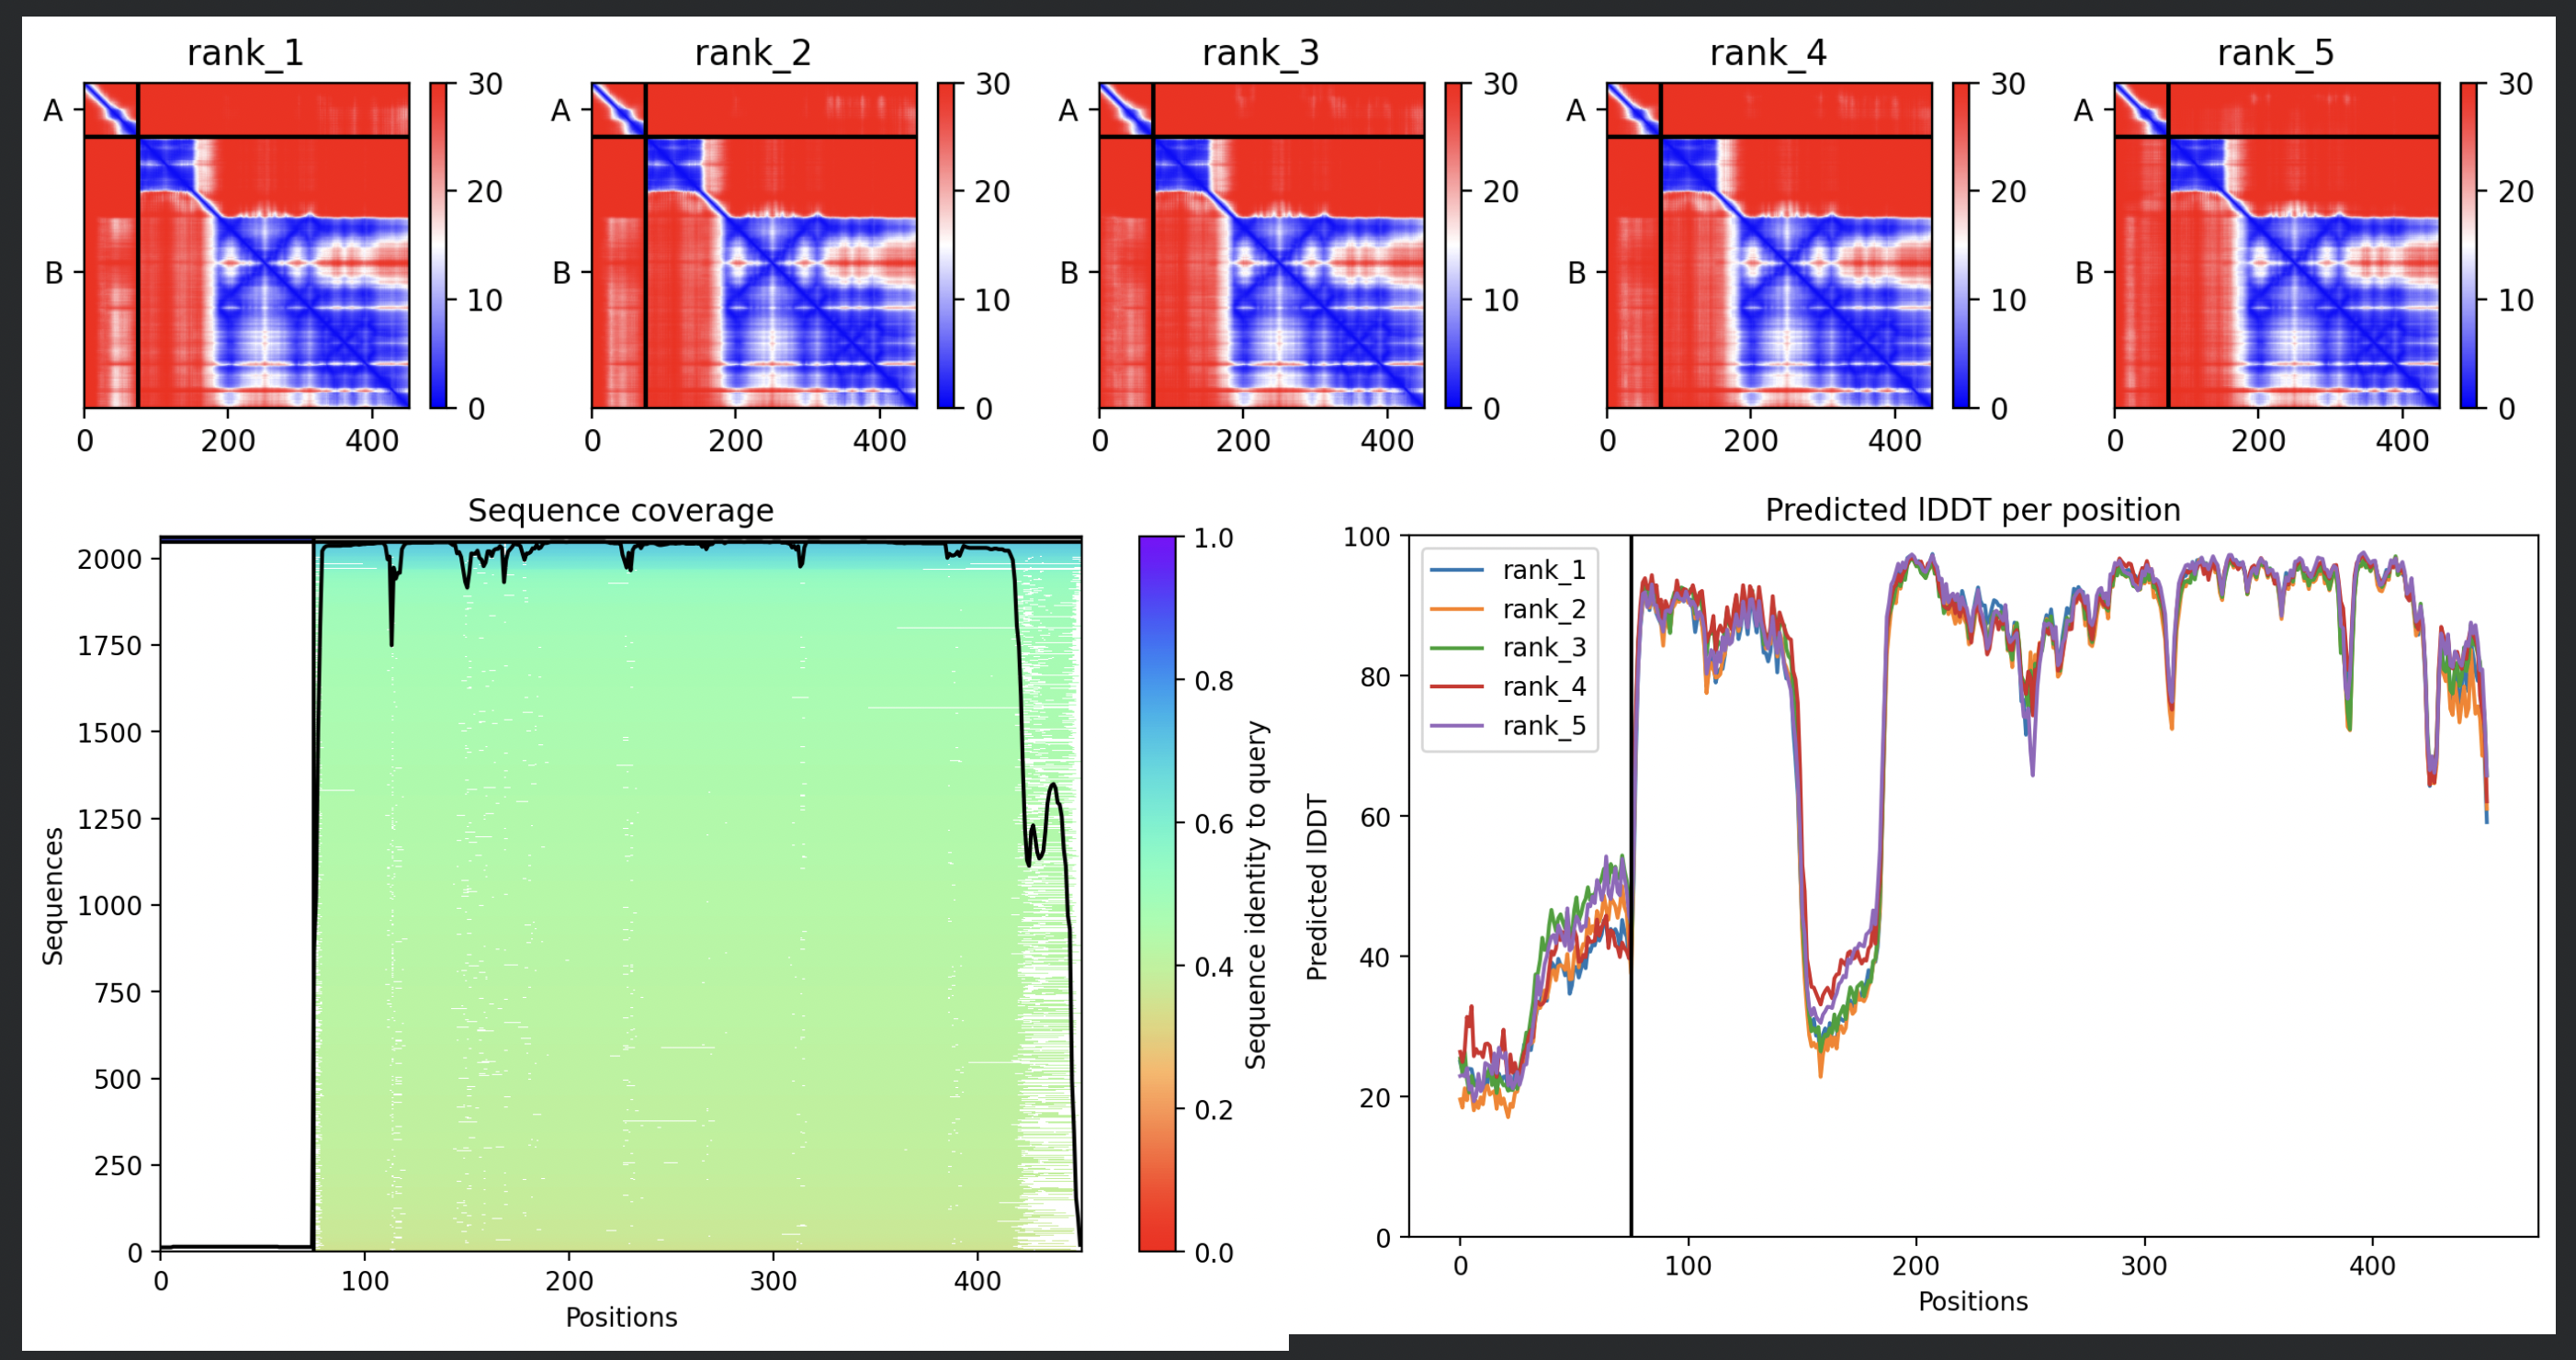
Run 2: L-Protein + DnaJ CoFold
L-protein (mutant sequence, 75 residues, Chain A) + DnaJ (357 residues,
Chain B), submitted as a two-chain heterodimer to ColabFold AlphaFold2 Multimer v3
In contrast to the octamer run, the L-protein + DnaJ co-fold produces
substantially higher confidence scores across all five models (pLDDT 70–78, pTM
~0.527), indicating that AlphaFold2 can form a meaningful structural prediction for
this complex. This difference is expected: DnaJ is a well-characterised soluble
protein with rich MSA coverage (~2000 sequences, Image 1), which anchors the
prediction and allows confident inter-chain contact modeling.
The per-position IDDT plot reveals the key asymmetry of the complex:
Chain A (L-protein, positions 0–75) consistently scores in the 20–50 range across
all models while Chain B (DnaJ, positions 75–450) scores
80–95 throughout, well into the “confident” to “very high” range. This is biologically
meaningful: the L-protein is a largely disordered, membrane-dependent protein that AF2
cannot confidently fold in isolation, while DnaJ is a structured chaperone that the
model predicts with high accuracy. The L-protein’s low per-residue confidence does
not invalidate the interaction prediction — it reflects the intrinsic disorder of
the L-protein rather than a failure of the complex model.
All five ranked models show distinct blue (low error, ~0–10 Å) regions in the inter-chain quadrants, specifically, the L-protein (chain A, rows 0–75) shows confident predicted placement relative to the N-terminal J-domain region of DnaJ (approximately positions 100–250 in chain B). This is a strong signal: the model is confidently predicting that the L-protein contacts DnaJ, and that the interaction interface is localised rather than diffuse. Crucially, the contact region maps to L-protein residues in the soluble N-terminal domain (residues 1–40), not the TM domain — consistent with the
published biological evidence that DnaJ interacts with the soluble domain of the
L-protein (Chamakura et al., 2017).
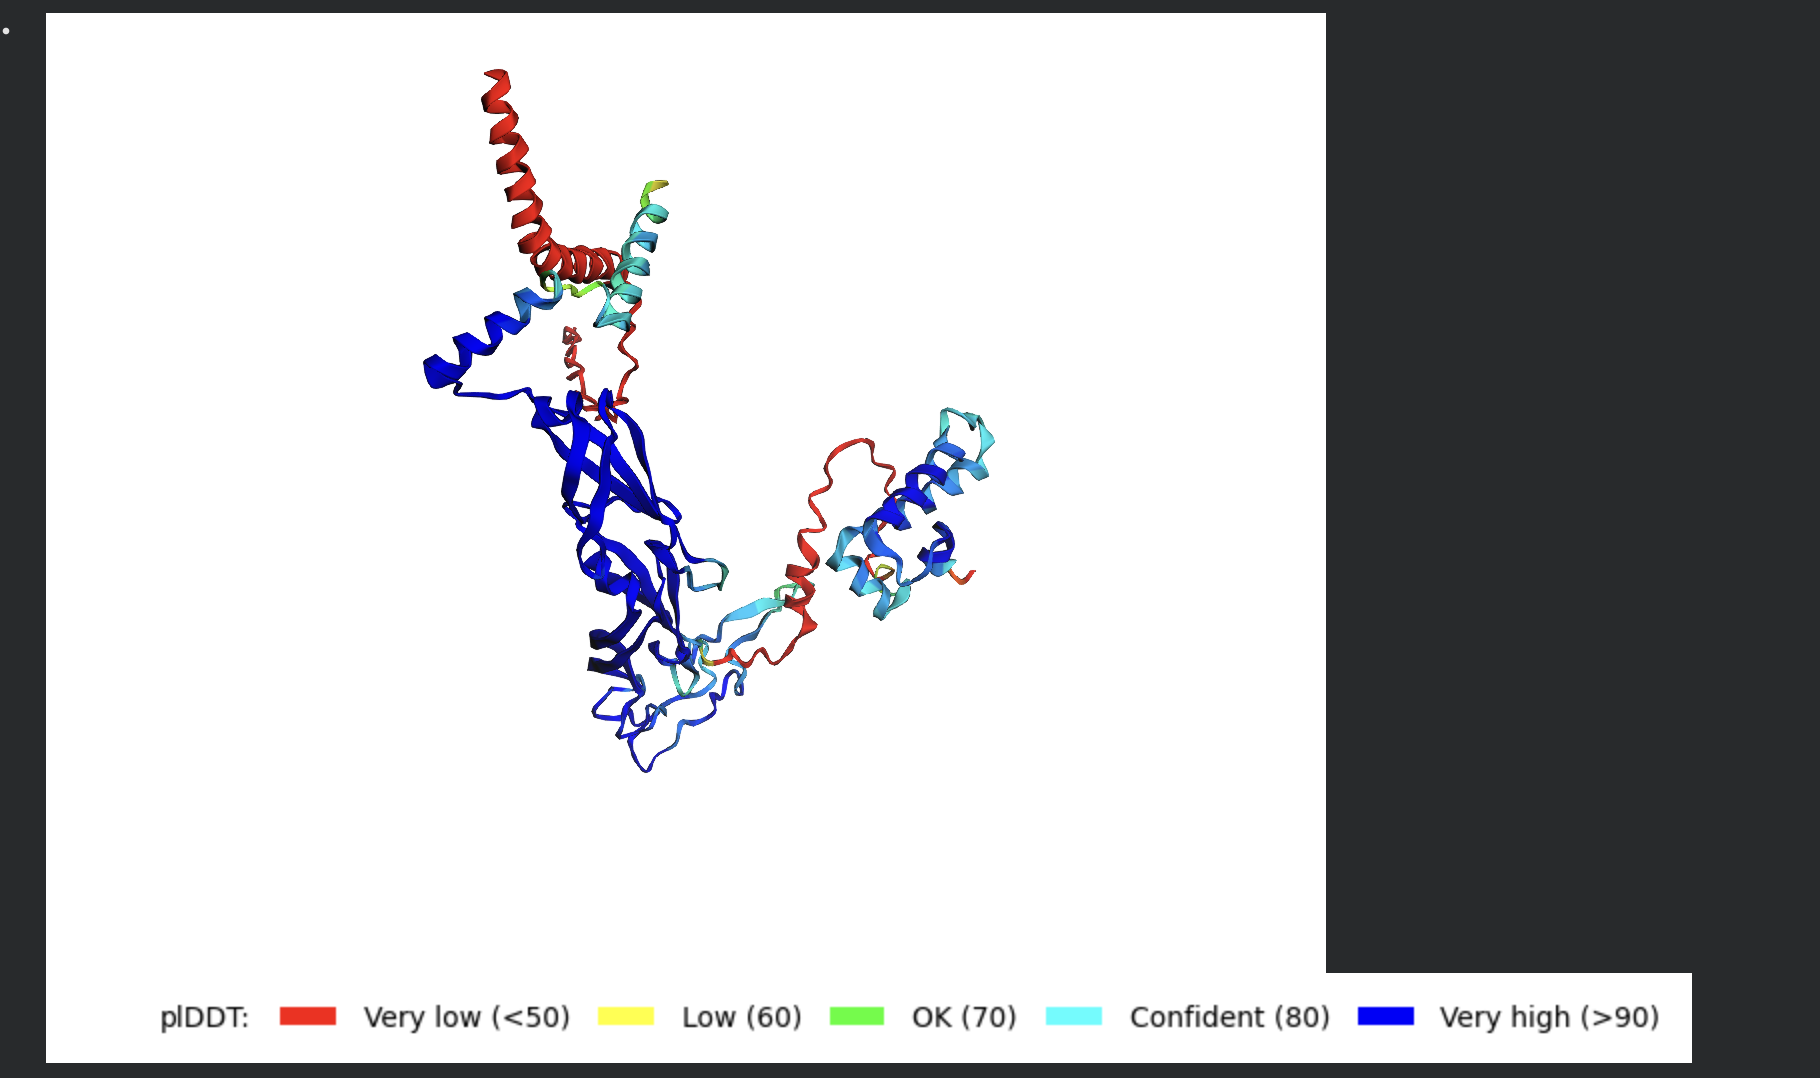
The Mol* structure shows DnaJ folded as a large, confident beta-sheet and
helix domain (blue/dark blue throughout), with the L-protein appearing as a short
helix (red, low pLDDT) docked against DnaJ’s surface at the J-domain. The helical
secondary structure of the L-protein’s TM region is partially preserved even in this
soluble context, appearing as a compact helical element adjacent to the DnaJ
interaction surface.
Relevance to proposed mutations:
Three of the five proposed mutations (S9Q, F22R, and C29R) fall directly within
the soluble domain (residues 1–40) that the PAE matrix identifies as the predicted
DnaJ contact region. This strongly supports their therapeutic rationale:
C29R introduces a positively charged arginine at a cysteine position within
the predicted interface. This could either strengthen hydrophilic contacts with
DnaJ or, more importantly, sterically and electrostatically disrupt the native
interaction — potentially enabling DnaJ-independent folding by forcing the
L-protein to adopt a stable conformation without chaperone assistance.
F22R replaces an aromatic residue with arginine at another interface-proximal
position, similarly altering the electrostatic character of the binding surface.
S9Q lies at the N-terminal edge of the predicted contact zone; the glutamine
substitution introduces new hydrogen-bonding capacity that could stabilize the
soluble domain’s fold autonomously.
The two TM mutations (K50L and N53L) fall in Chain A positions beyond the confident
inter-chain contact region, consistent with TM residues not participating in DnaJ
binding — instead targeting membrane insertion efficiency independently of the
DnaJ interaction.
The L-protein’s low per-residue pLDDT throughout means the exact
contact geometry should be treated as a hypothesis rather than a reliable atomic
model. AlphaFold2 lacks membrane context, so the TM domain is modeled as if soluble.
Validation via co-immunoprecipitation or crosslinking mass spectrometry of the
wildtype and mutant complexes would be required to confirm the predicted interface.
A more reliable structural prediction for just the soluble domain co-folded with
DnaJ’s J-domain (rather than full-length L-protein) could also be attempted, as
this would focus modeling resources on the well-defined interaction region.
Week 6 HW: Genetic Circuits Part I
1. What are some components in the Phusion High-Fidelity PCR Master Mix and what is their purpose?
Phusion High-Fidelity PCR Master Mix contains most of the key ingredients needed for PCR, except the template DNA and primers. It is designed to make DNA amplification more accurate and easier to set up.
Some of the main components are:
Phusion High-Fidelity DNA Polymerase – the enzyme that synthesizes new DNA strands.
dNTPs – the nucleotide building blocks (A, T, G, and C) used to build the new DNA.
MgCl₂ – provides magnesium ions, which are required for the polymerase to function.
Reaction buffer – maintains the correct pH and salt conditions so the reaction can proceed efficiently.
Together, these components create the right environment for accurate and efficient PCR amplification.
2. What are some factors that determine primer annealing temperature during PCR?
The annealing temperature in PCR depends on how well the primers can bind to the target DNA sequence. If the temperature is too low, the primers might bind non-specifically. If it is too high, they may not bind properly at all. So overall, the annealing temperature is chosen to balance specificity and efficiency during PCR.
3. There are two methods from this class that create linear fragments of DNA: PCR, and restriction enzyme digests. Compare and contrast these two methods, both in terms of protocol as well as when one may be preferable to use over the other.
PCR works by amplifying a specific region of DNA using primers, DNA polymerase, dNTPs, and thermal cycling. The main advantage of PCR is that it is highly flexible. PCR is especially useful when I need a specific insert or when I only have a small amount of starting DNA.
Restriction enzyme digestion works by cutting DNA at specific recognition sites using restriction enzymes. Unlike PCR, it does not amplify DNA but cuts the DNA wherever those enzyme sites are present. This method is often easier and more straightforward if the plasmid or DNA sequence already contains the right restriction sites.
4. How can you ensure that the DNA sequences that you have digested and PCR-ed will be appropriate for Gibson cloning?
To make sure that the DNA fragments are appropriate for Gibson cloning, the main thing I need to check is whether they have the correct overlapping ends. Gibson Assembly works by joining DNA fragments that share homologous sequences at their ends, so the insert and the vector backbone need to have matching overlap regions. Usually, these overlaps are designed into the PCR primers so that the amplified insert already contains the right sequences for assembly. The plasmid backbone also needs to be linearized in a way that exposes the corresponding matching ends.
5. How does the plasmid DNA enter the E. coli cells during transformation?
Plasmid DNA enters E. coli cells when the cell membrane is temporarily made permeable during transformation. Normally, DNA cannot easily cross the bacterial membrane because of charge repulsion and the barrier created by the cell envelope.
In chemical transformation, the cells are made competent using salts such as calcium chloride, which helps the DNA interact more easily with the cell surface. A brief heat shock is then used to create temporary changes in membrane permeability, allowing the plasmid DNA to enter.
In electroporation, a short electrical pulse creates temporary pores in the membrane, and the DNA enters through those openings.
6. Describe another assembly method in detail (such as Golden Gate Assembly)
Gibson Assembly is a molecular cloning method that joins multiple DNA fragments in a single, isothermal reaction. Each fragment is designed with short overlapping ends, and a mix of enzymes, a 5′ exonuclease, DNA polymerase, and DNA ligase, works together to assemble them seamlessly. The exonuclease creates single-stranded overhangs, allowing complementary regions to anneal; the polymerase fills in gaps, and the ligase seals the nicks. This enables rapid and scarless construction of complex DNA constructs without the need for restriction enzymes.
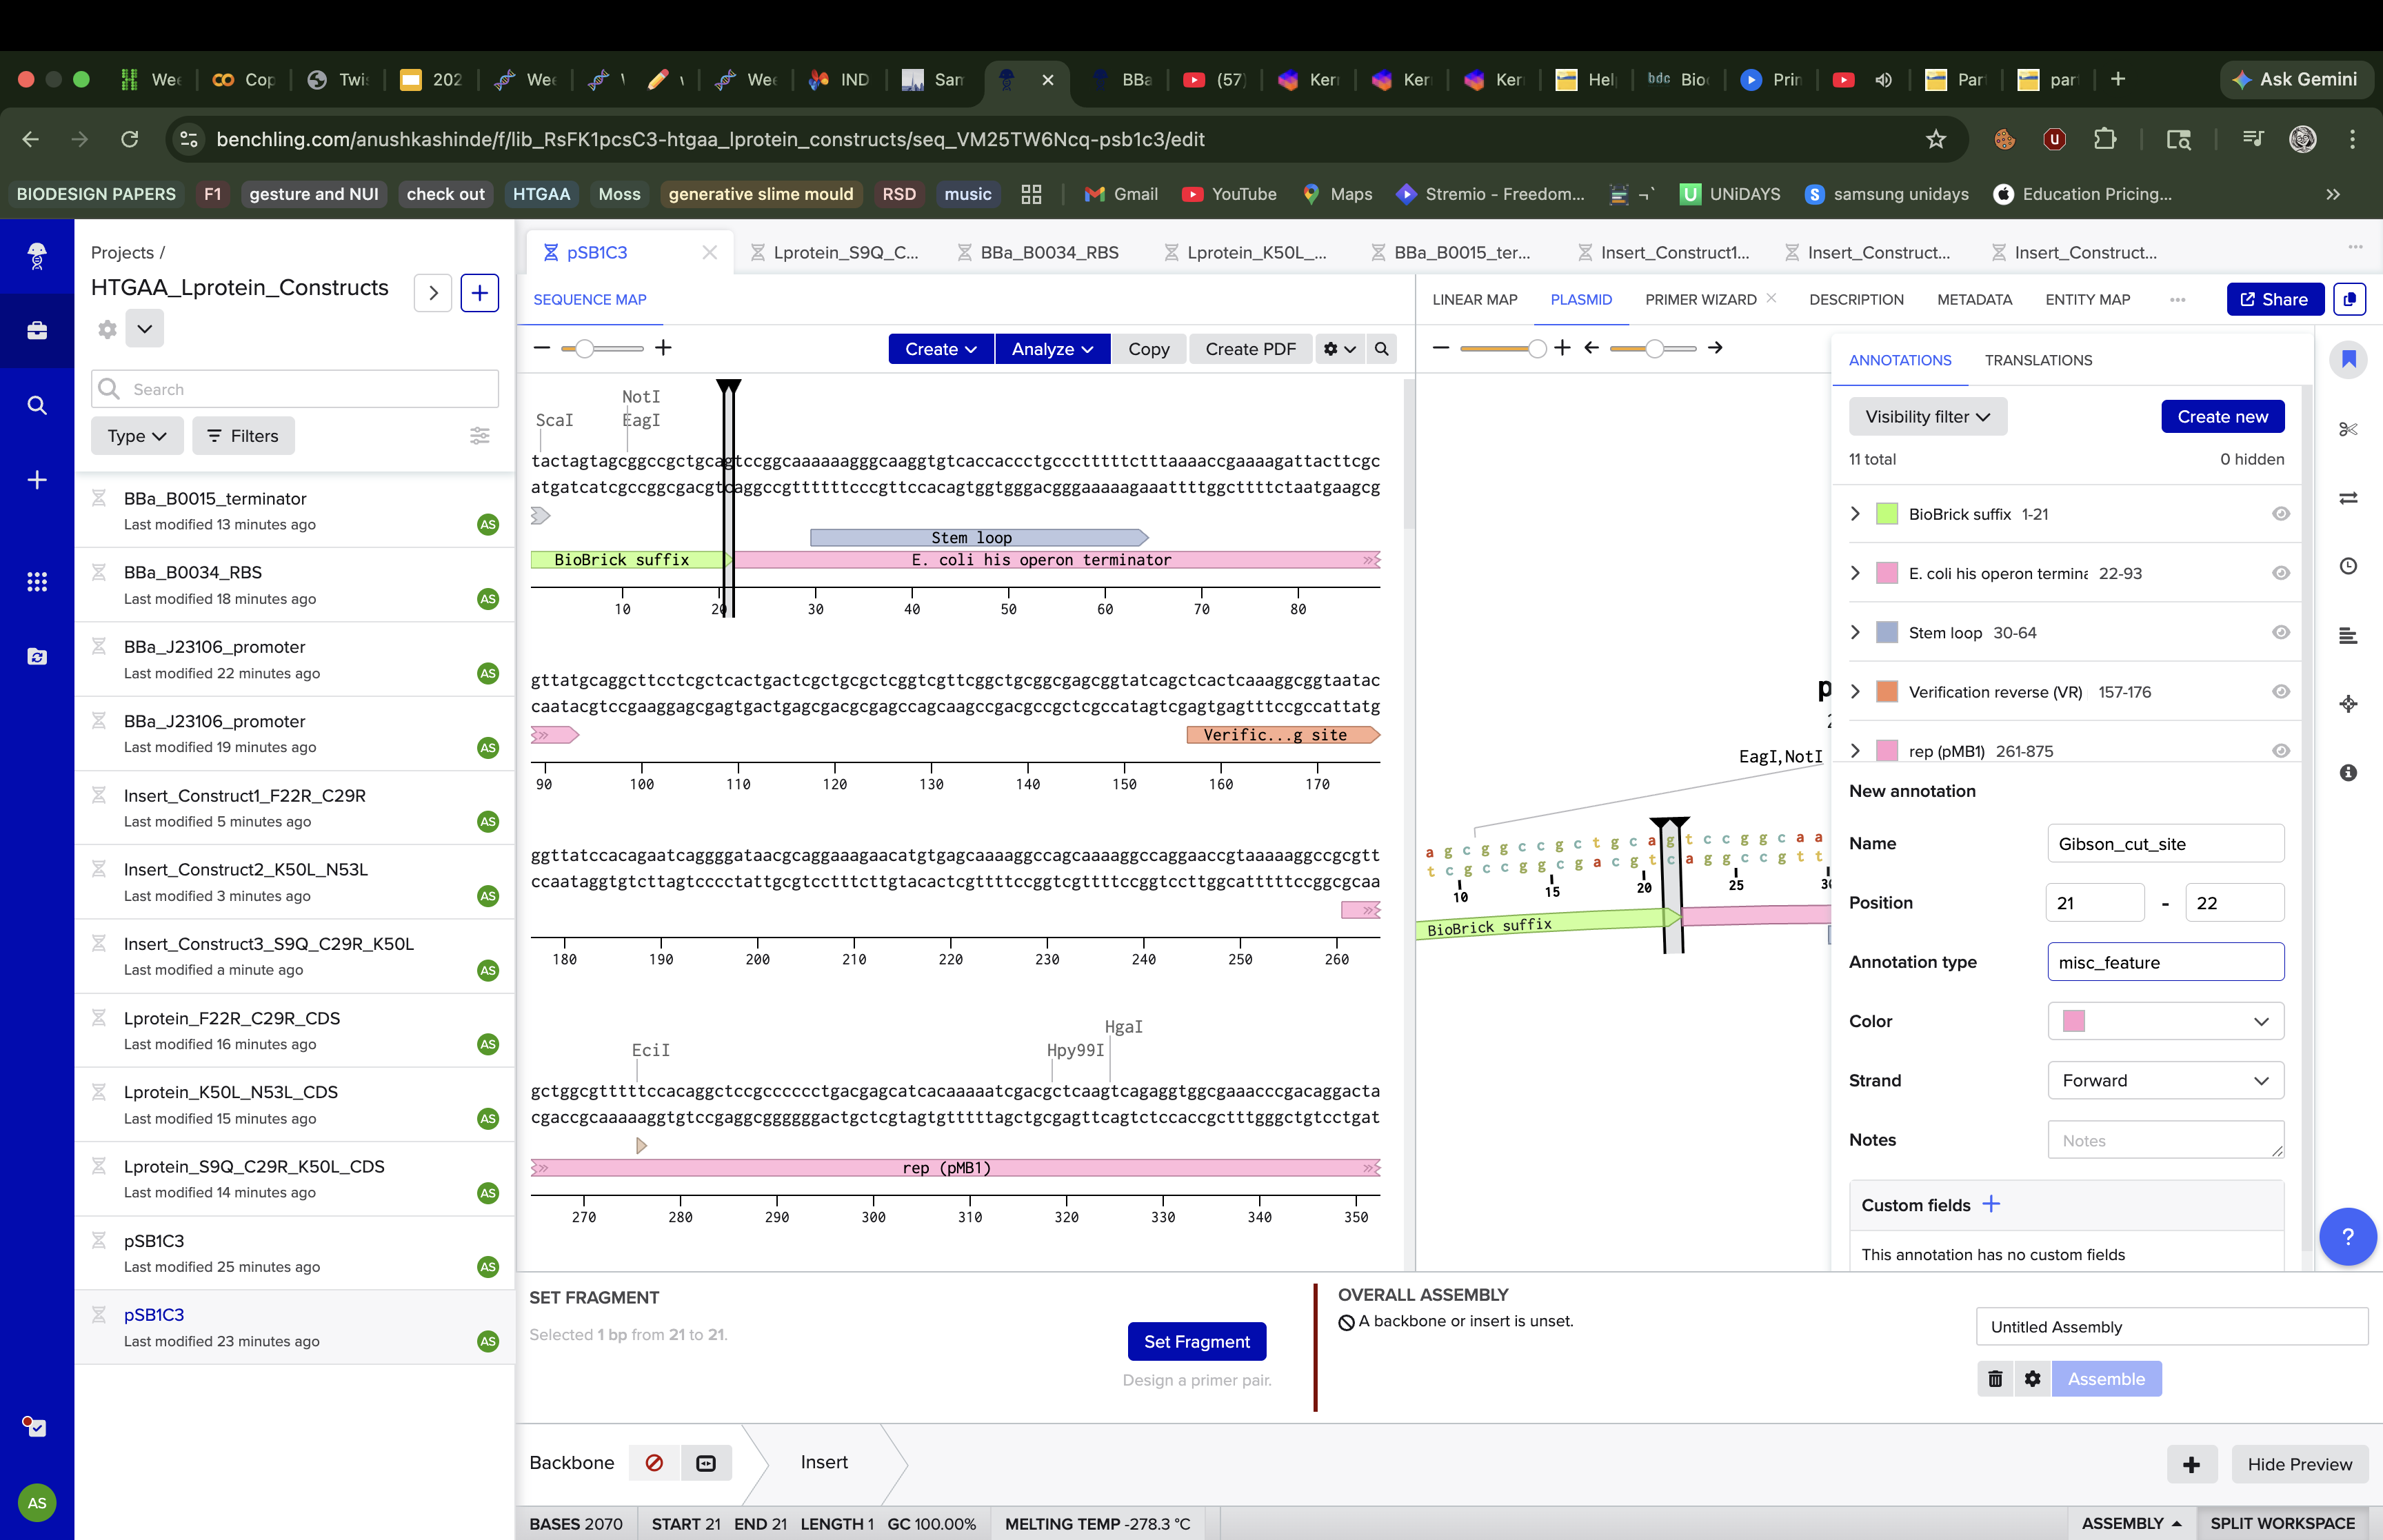
Gibson Assembly — Construct Design in Benchling
I used Benchling’s Gibson Assembly tool with pSB1C3 as the expression vector.
I chose pSB1C3 because it is the standard iGEM backbone used throughout
this course, is high-copy, and worksreliably in E. coli, making it the most practical choice for expressingthe L-protein mutant.
The construct architecture I used was:
Anderson constitutive promoter BBa_J23106, followed by the Elowitz RBS
BBa_B0034, the mutant L-protein coding sequence, and the double terminator
BBa_B0015, all cloned into the pSB1C3 backbone. I built it as a
separate DNA sequence in Benchling, then concatenated them into a single
insert fragment per construct before attempting assembly.
The assembly process was not straightforward. When I first tried using
Benchling’s new Gibson Assembly tool, the vector slot showed a persistent
orange dot indicating it couldn’t resolve the cut site on the circular
pSB1C3 sequence.
I tried lowering the minimum Tm, widening the homology length range, increasing the Tm difference tolerance but the orange dot remained. After troubleshooting, I realised
the issue was that Benchling’s newer assembly interface couldn’t
automatically determine where to linearise an imported iGEM vector, likely
because pSB1C3 lacks a standard cut site annotation that the tool
expects.
To navigate this, I switched to Benchling’s legacy assembly tool, which
handles vector linearisation differently and gave me direct control over
the cut position. I also manually created a linearised version of pSB1C3
by reorienting the sequence to start at position 22, effectively
pre-cutting the vector at the BioBrick MCS insertion site between the
BioBrick suffix and the his operon terminator. This bypassed the
auto-detection issue entirely. Using the linearised vector with the legacy
tool, the assembly ran successfully on the first attempt.
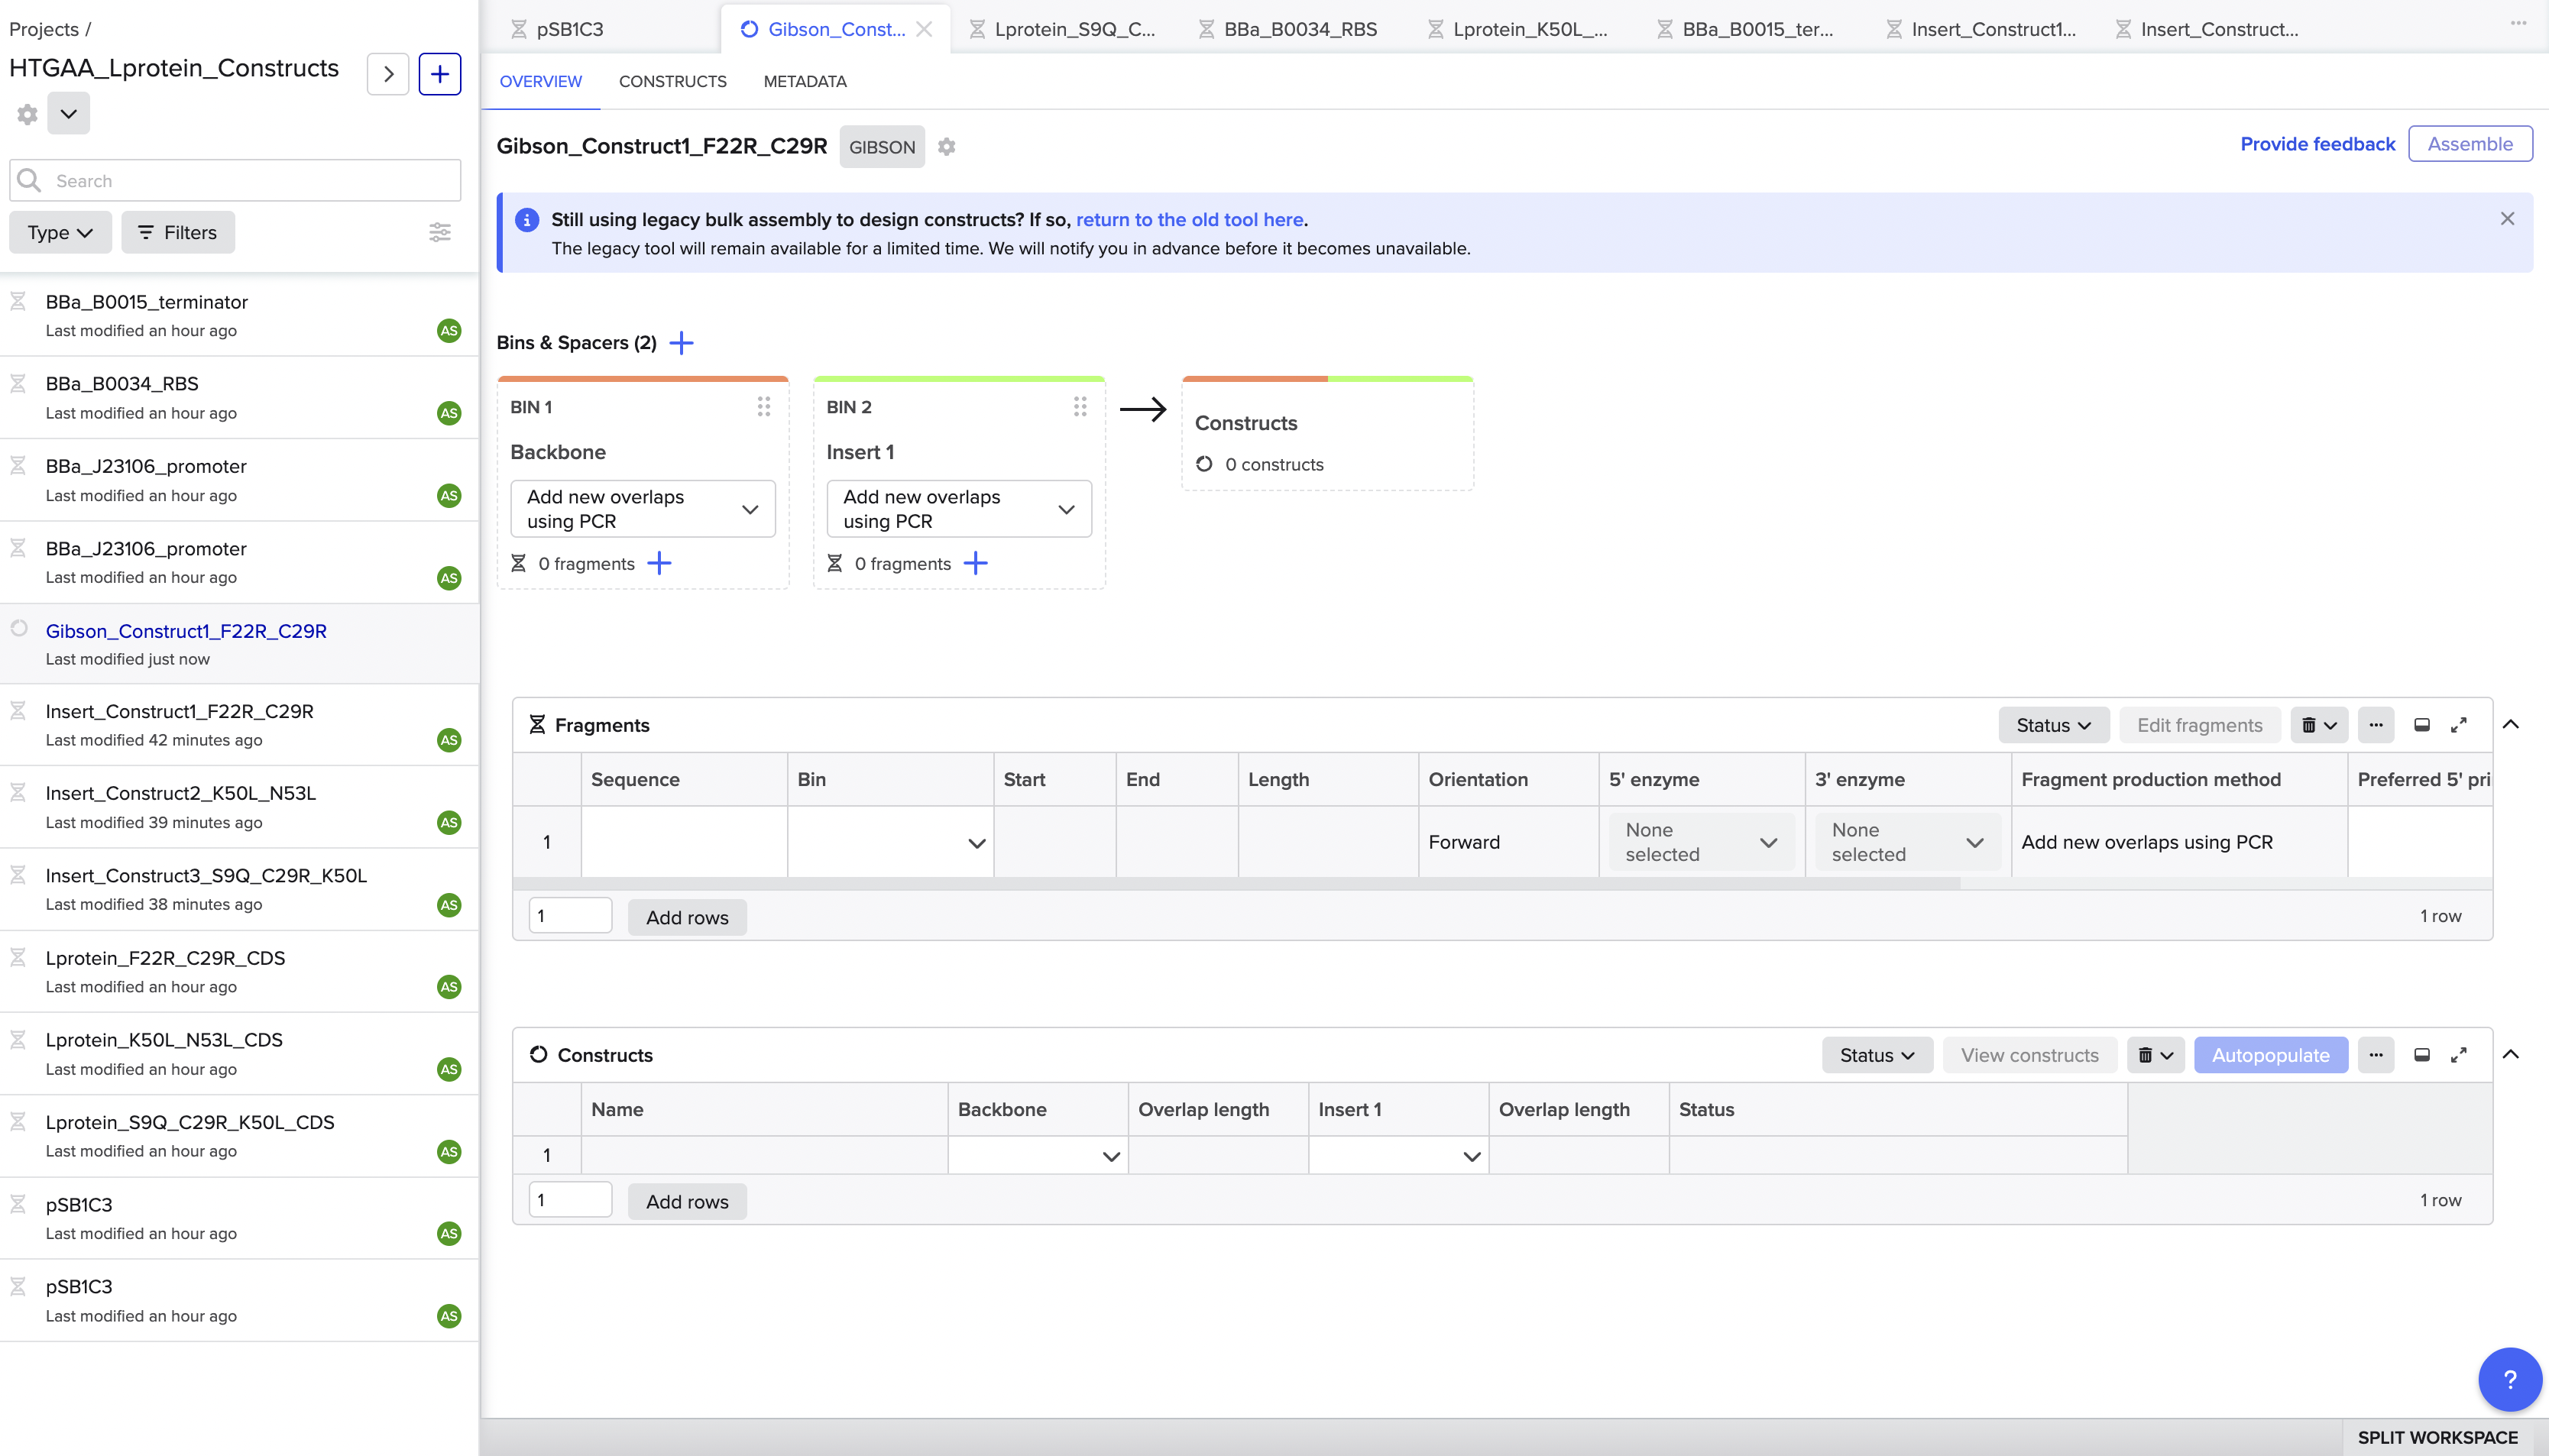
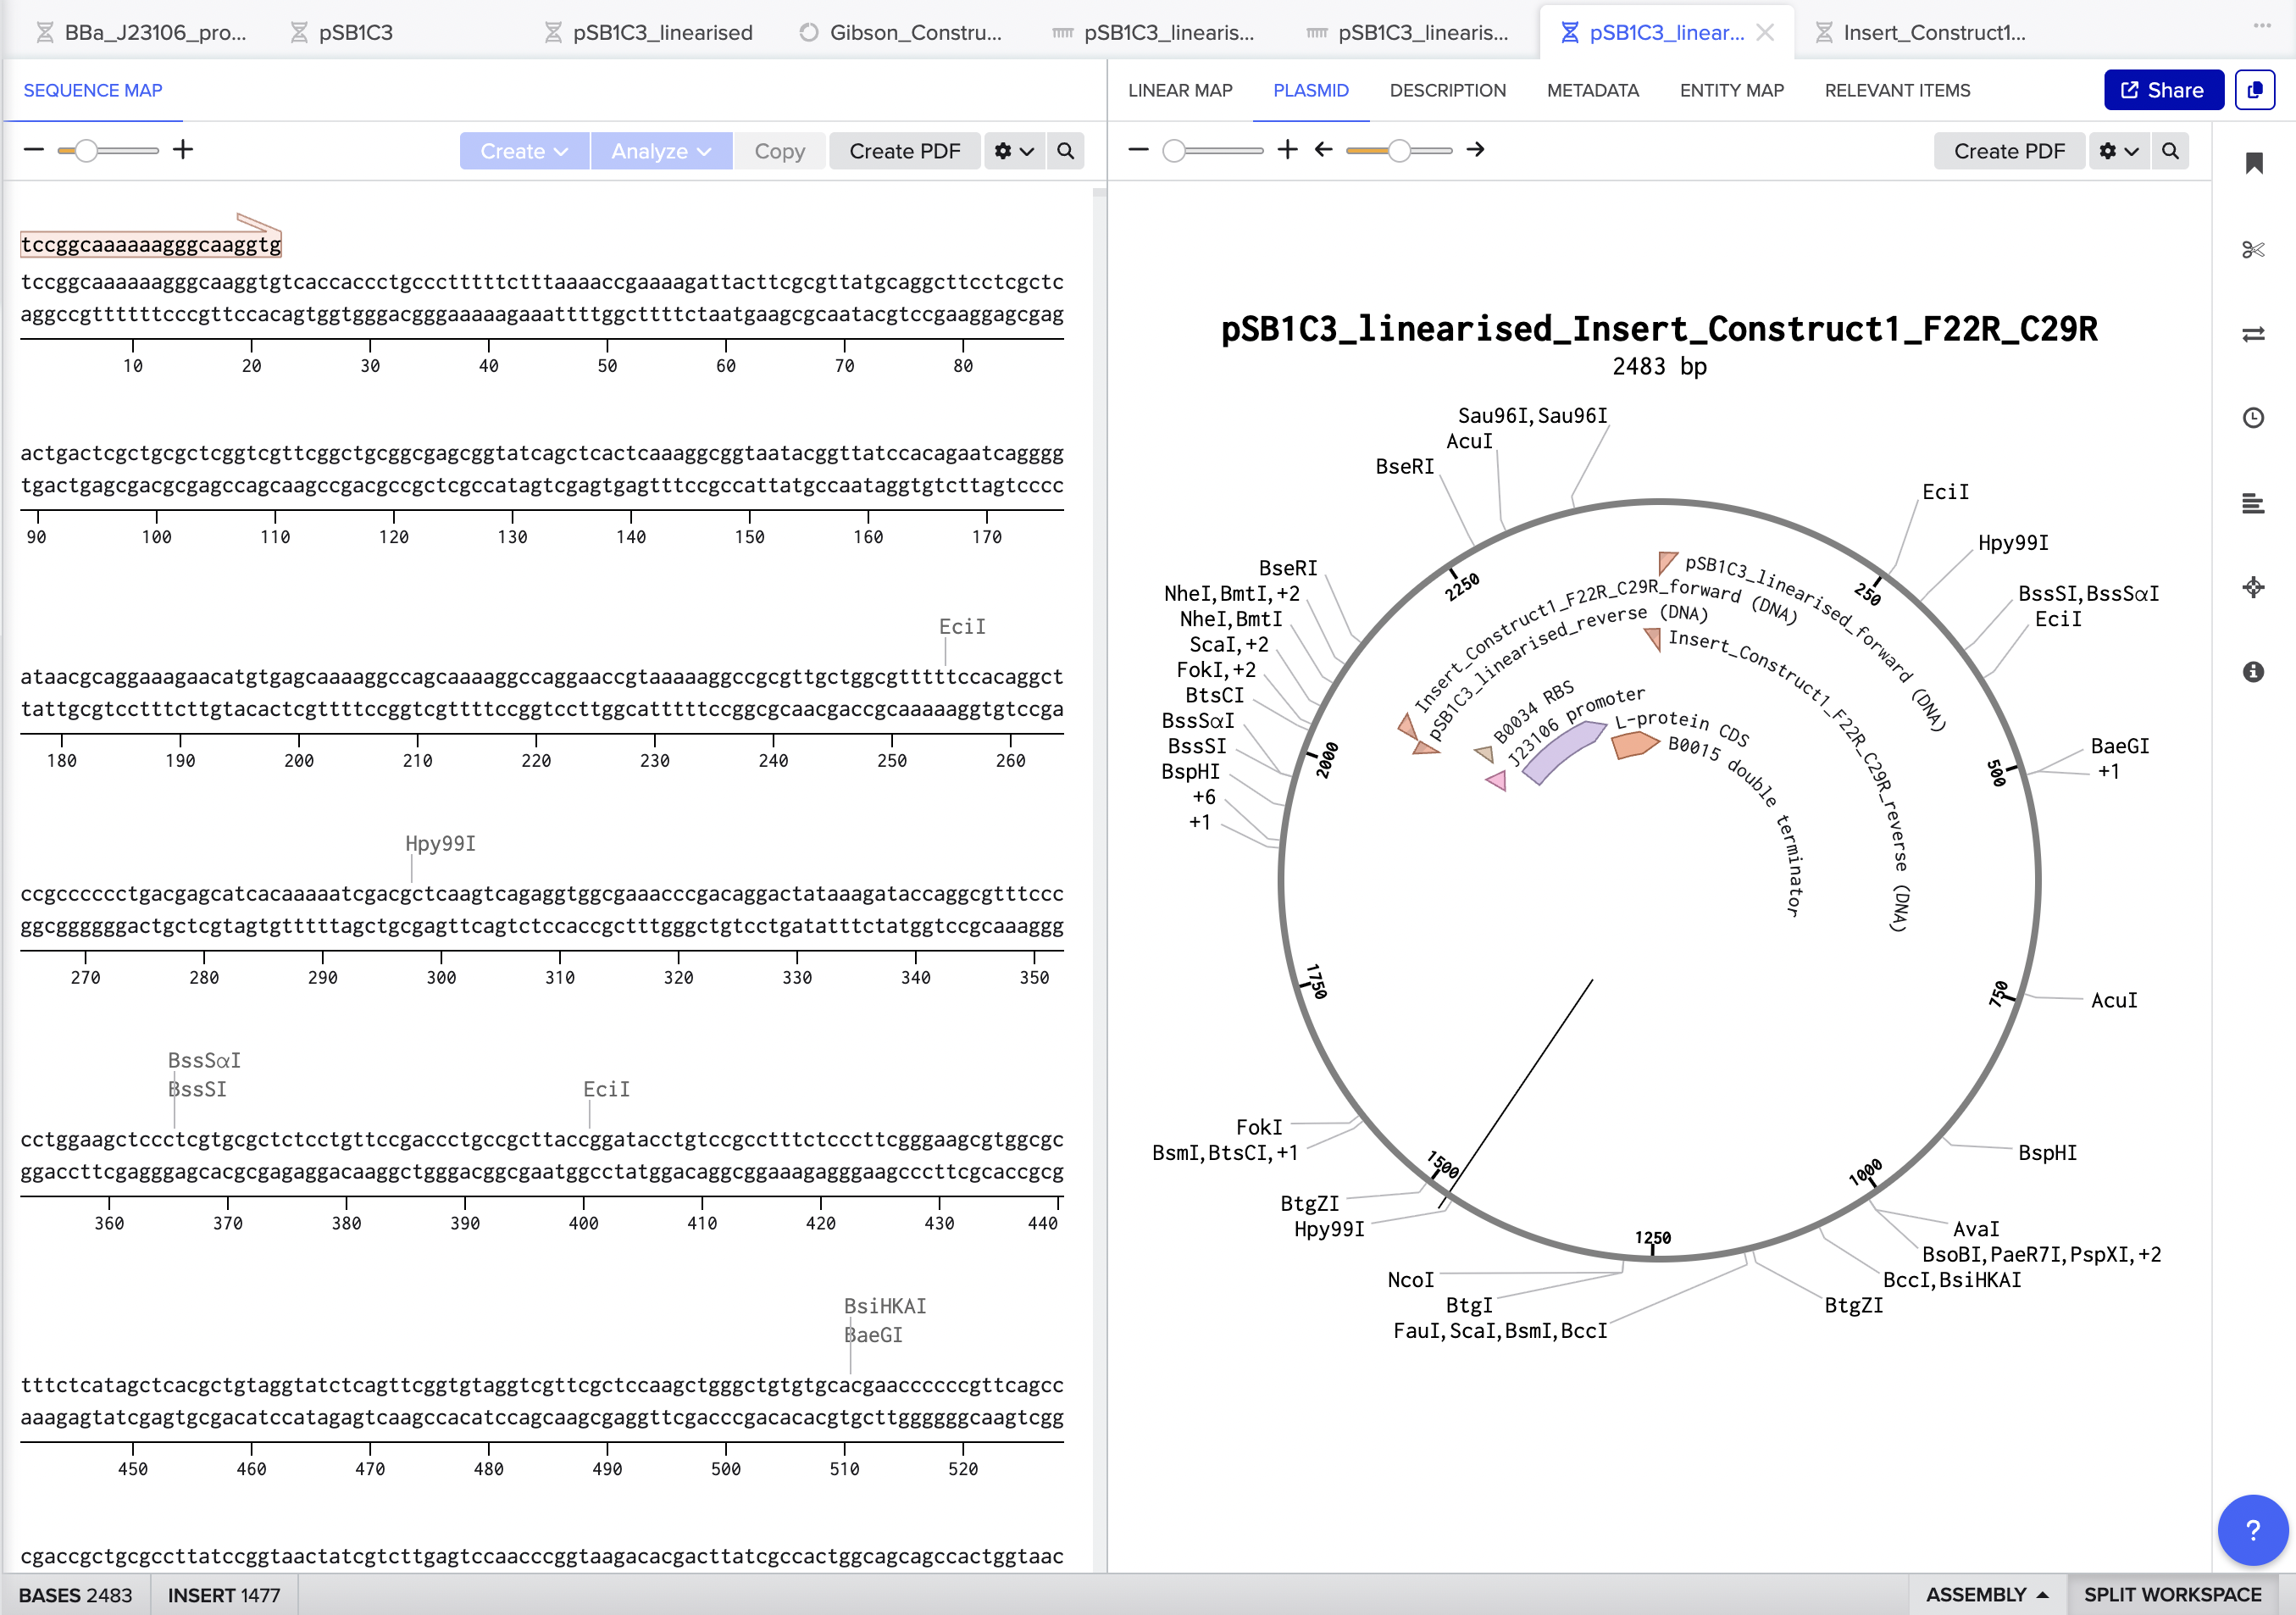
The final assembled plasmid for Construct 1 (F22R + C29R) came out at
2483 bp, with all four insert annotations J23106 promoter, B0034 RBS,
L-protein CDS, and B0015 terminator correctly placed and visible in
the circular map. Benchling also auto-designed all four Gibson primers
(vector forward, vector reverse, insert forward, insert reverse) with
appropriate overlapping tails for in vitro assembly.
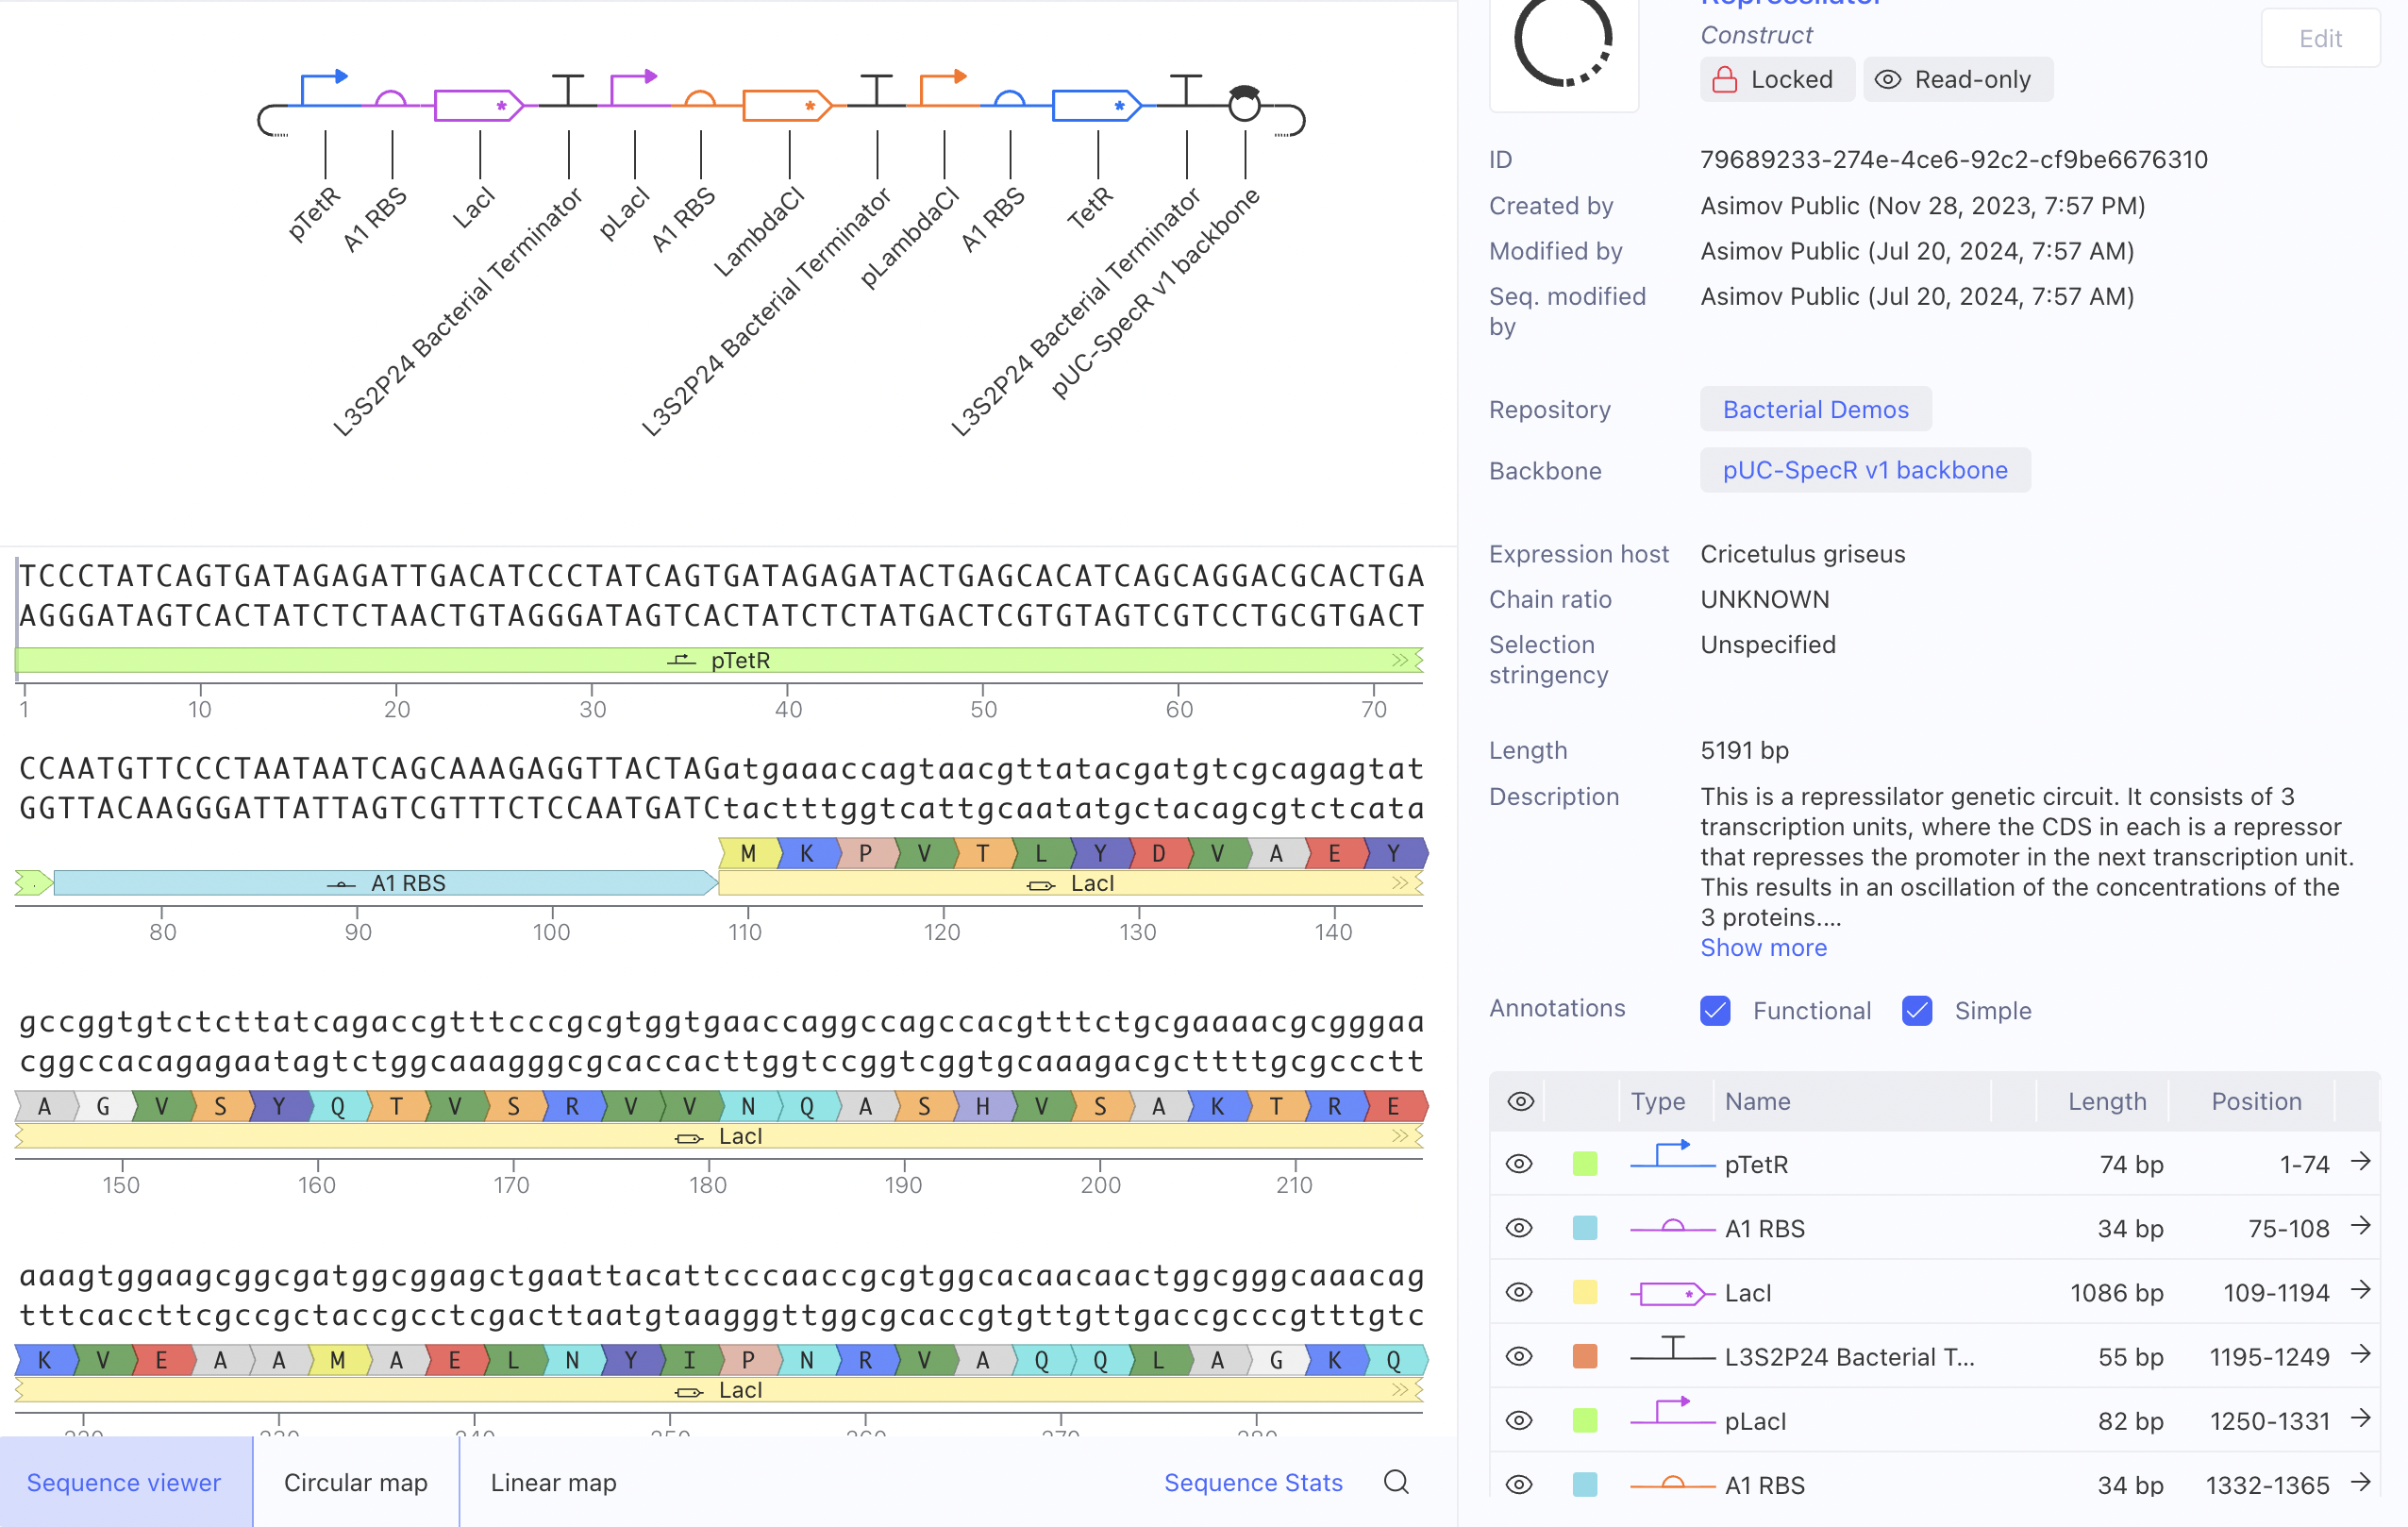
Asimov Kernel
Bacterial Demo
I ran the bacterial demo in the repository on Asimov first
And then tried to recreate it using the given parts in the Characterizeed bacterial parts repository
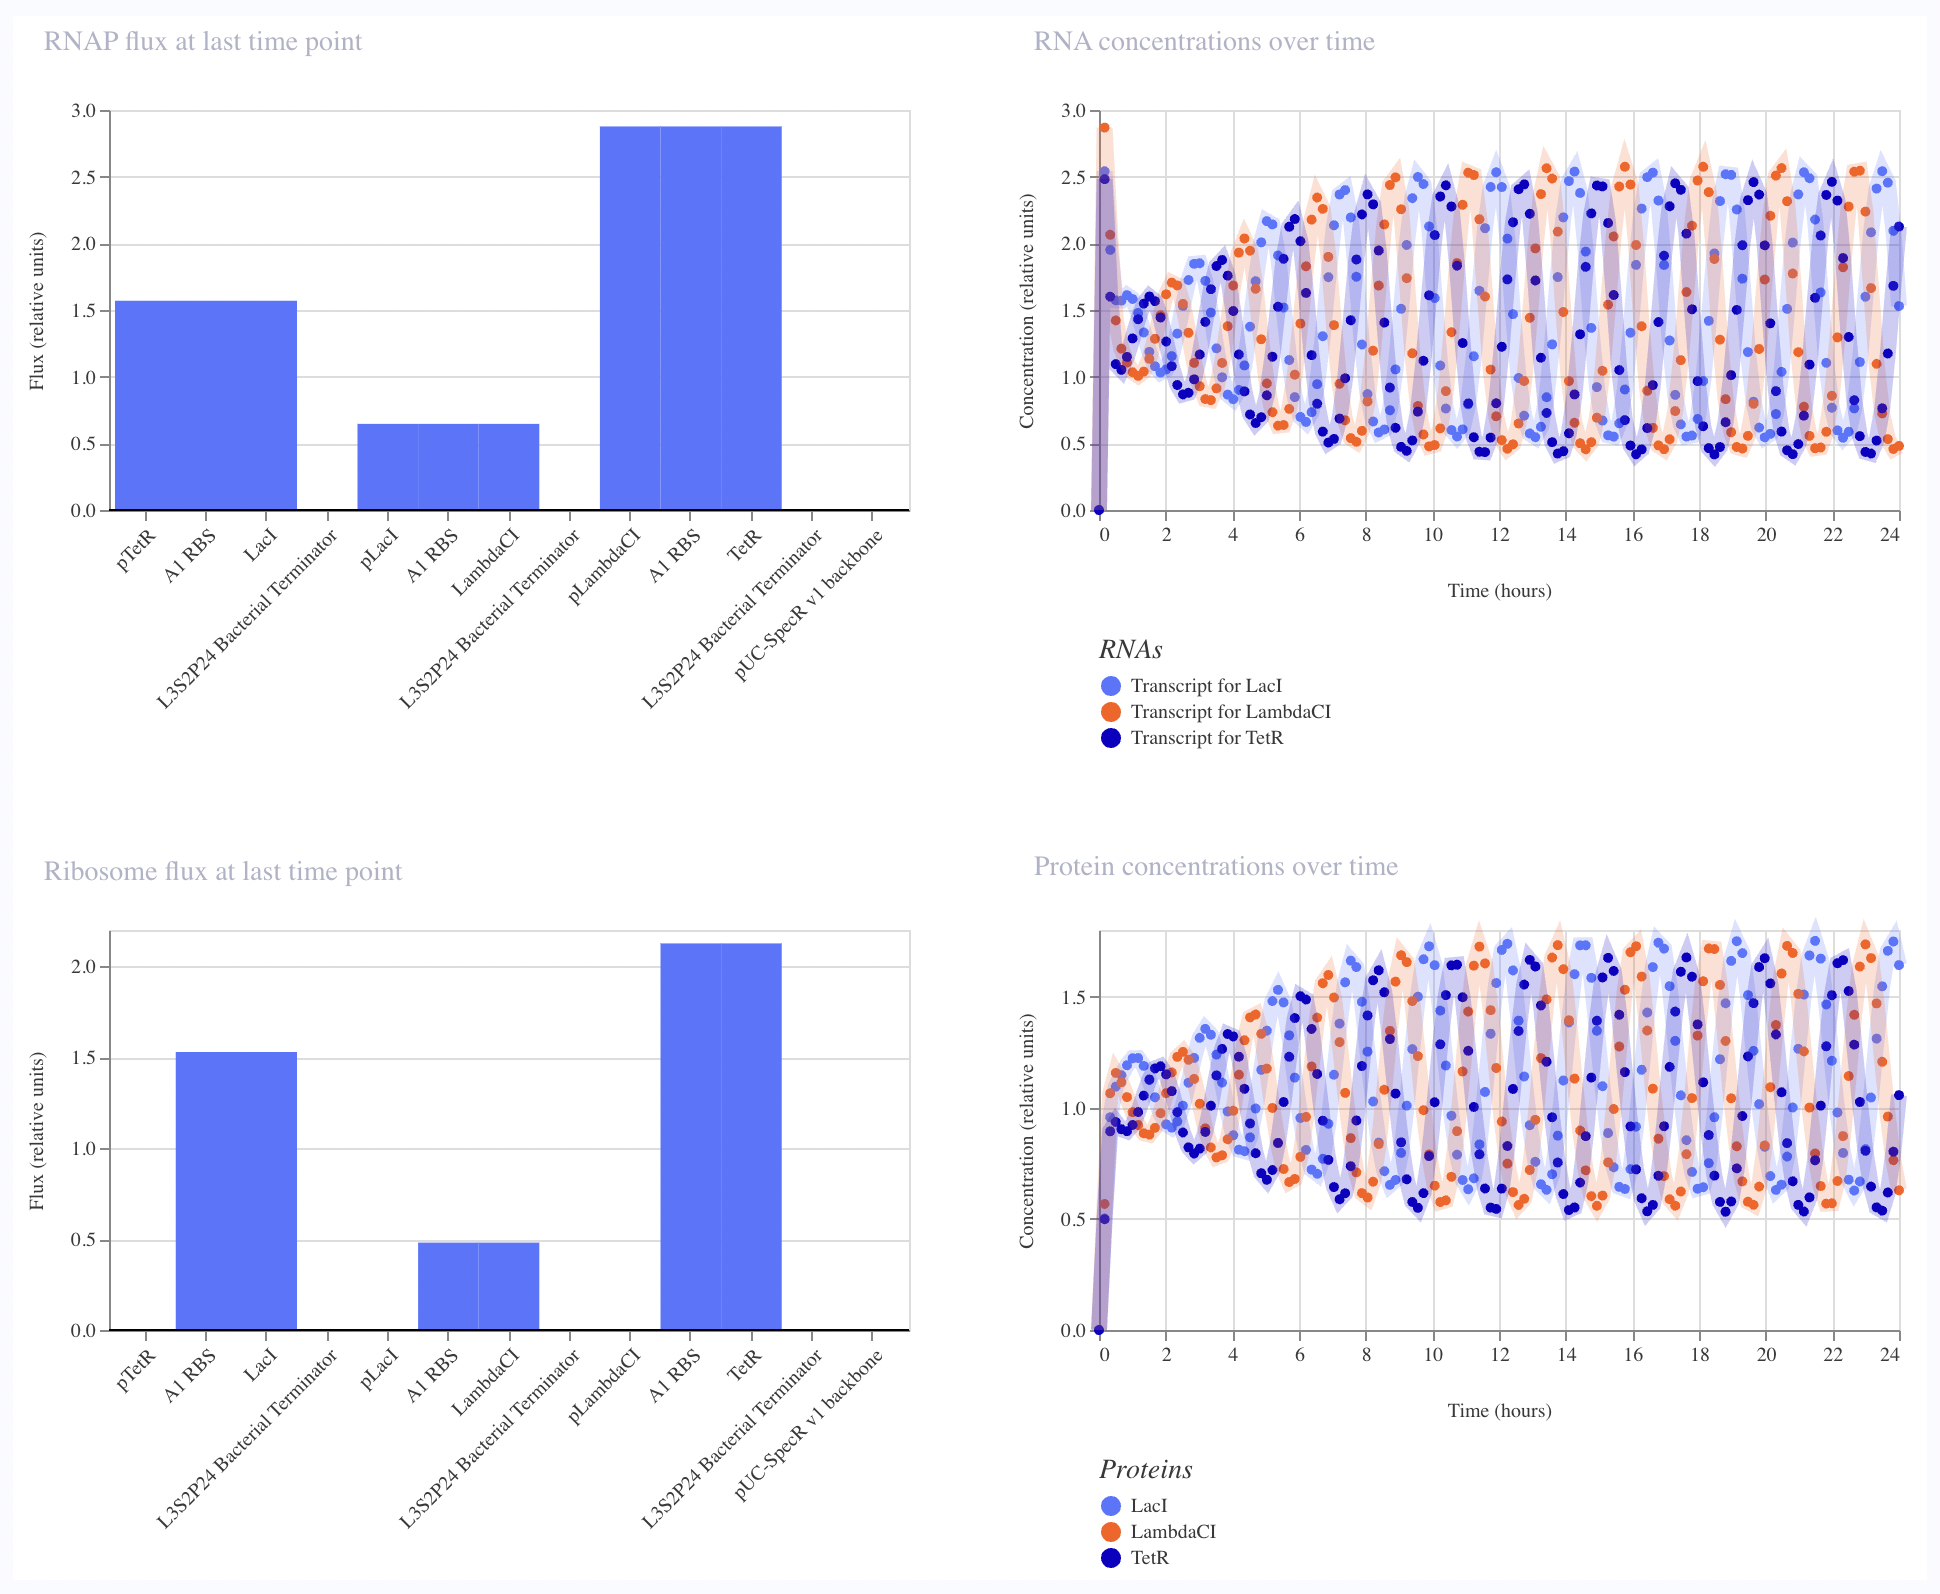
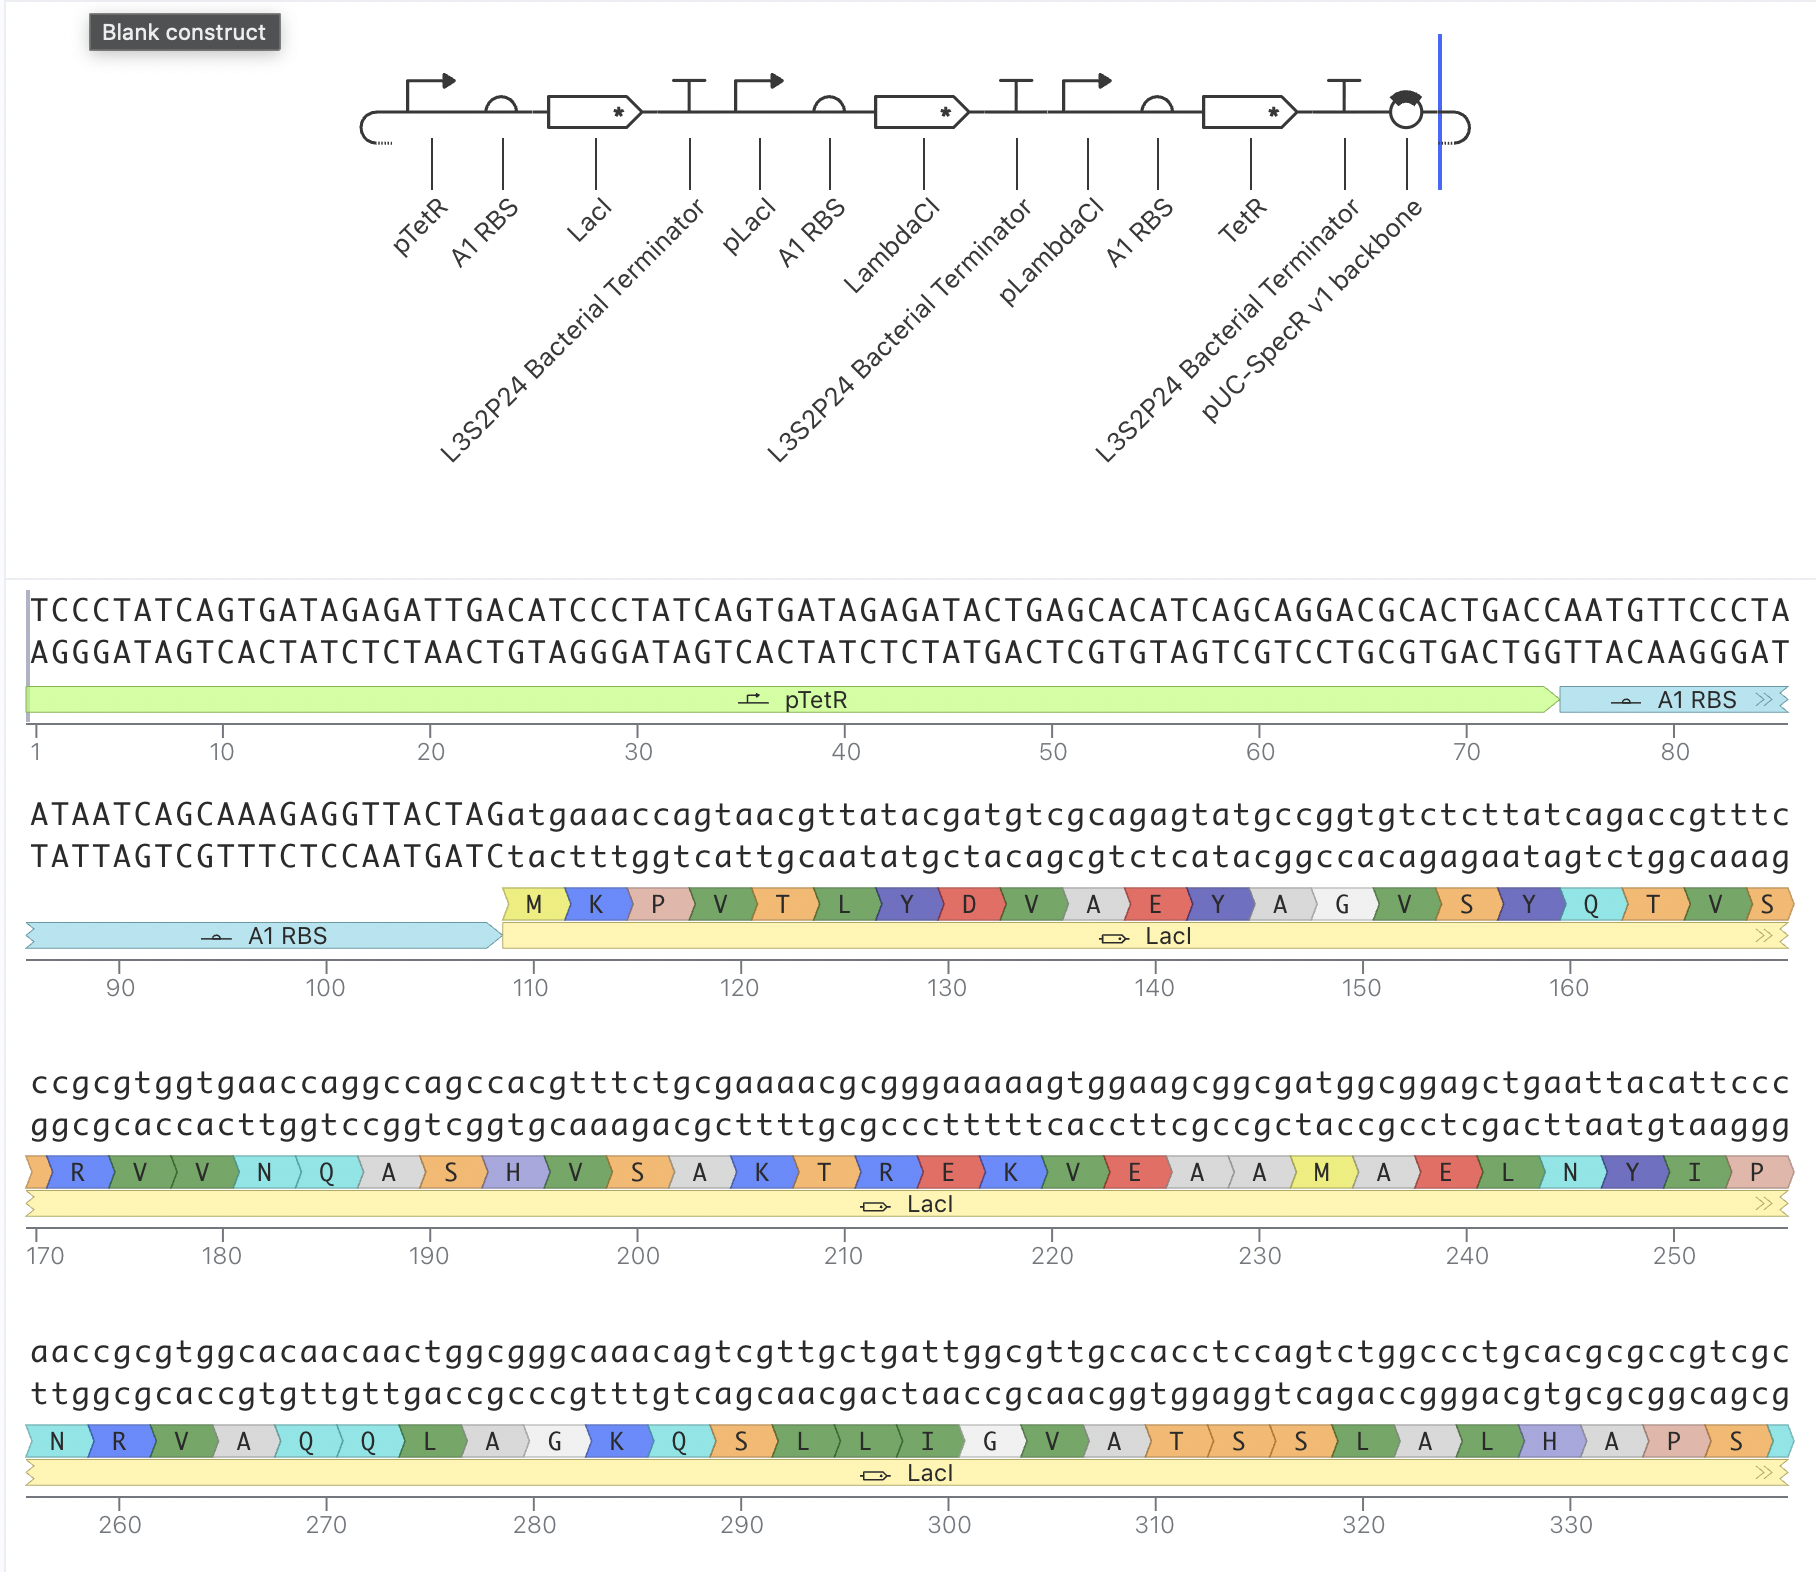
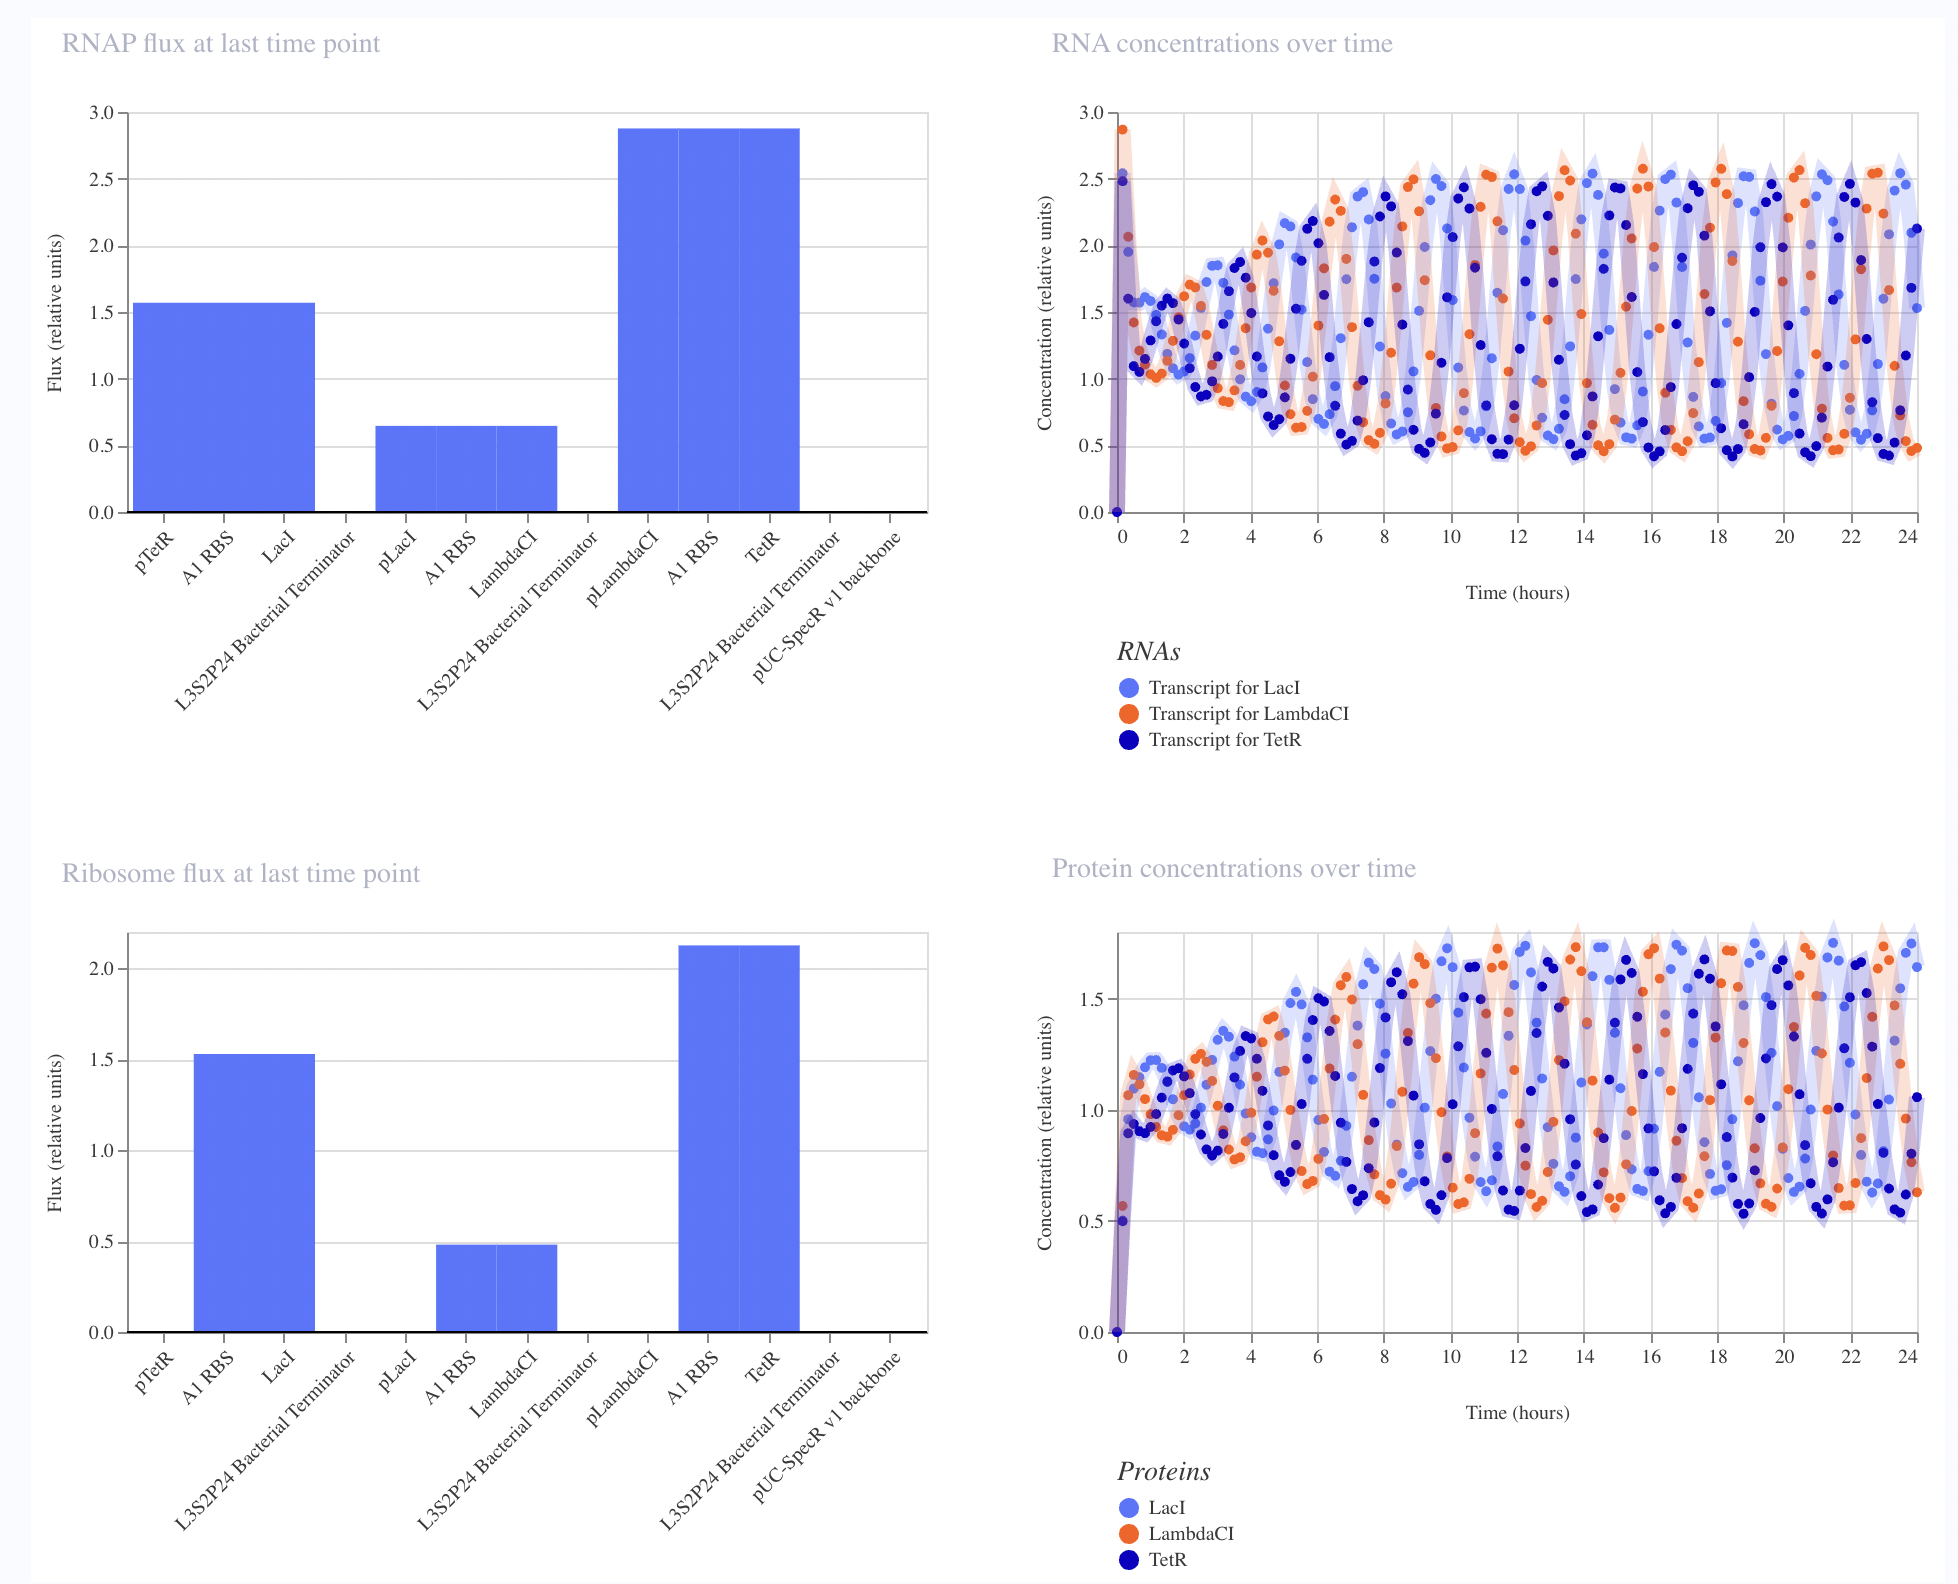
The recreated Repressilator appears to match the original very closely at the circuit-design and dynamical-behavior level. The topology is preserved, the annotated sequence structure is essentially the same, and the simulated outputs show the expected three-node oscillatory repression dynamics.
L-Protein Mutant Constructs
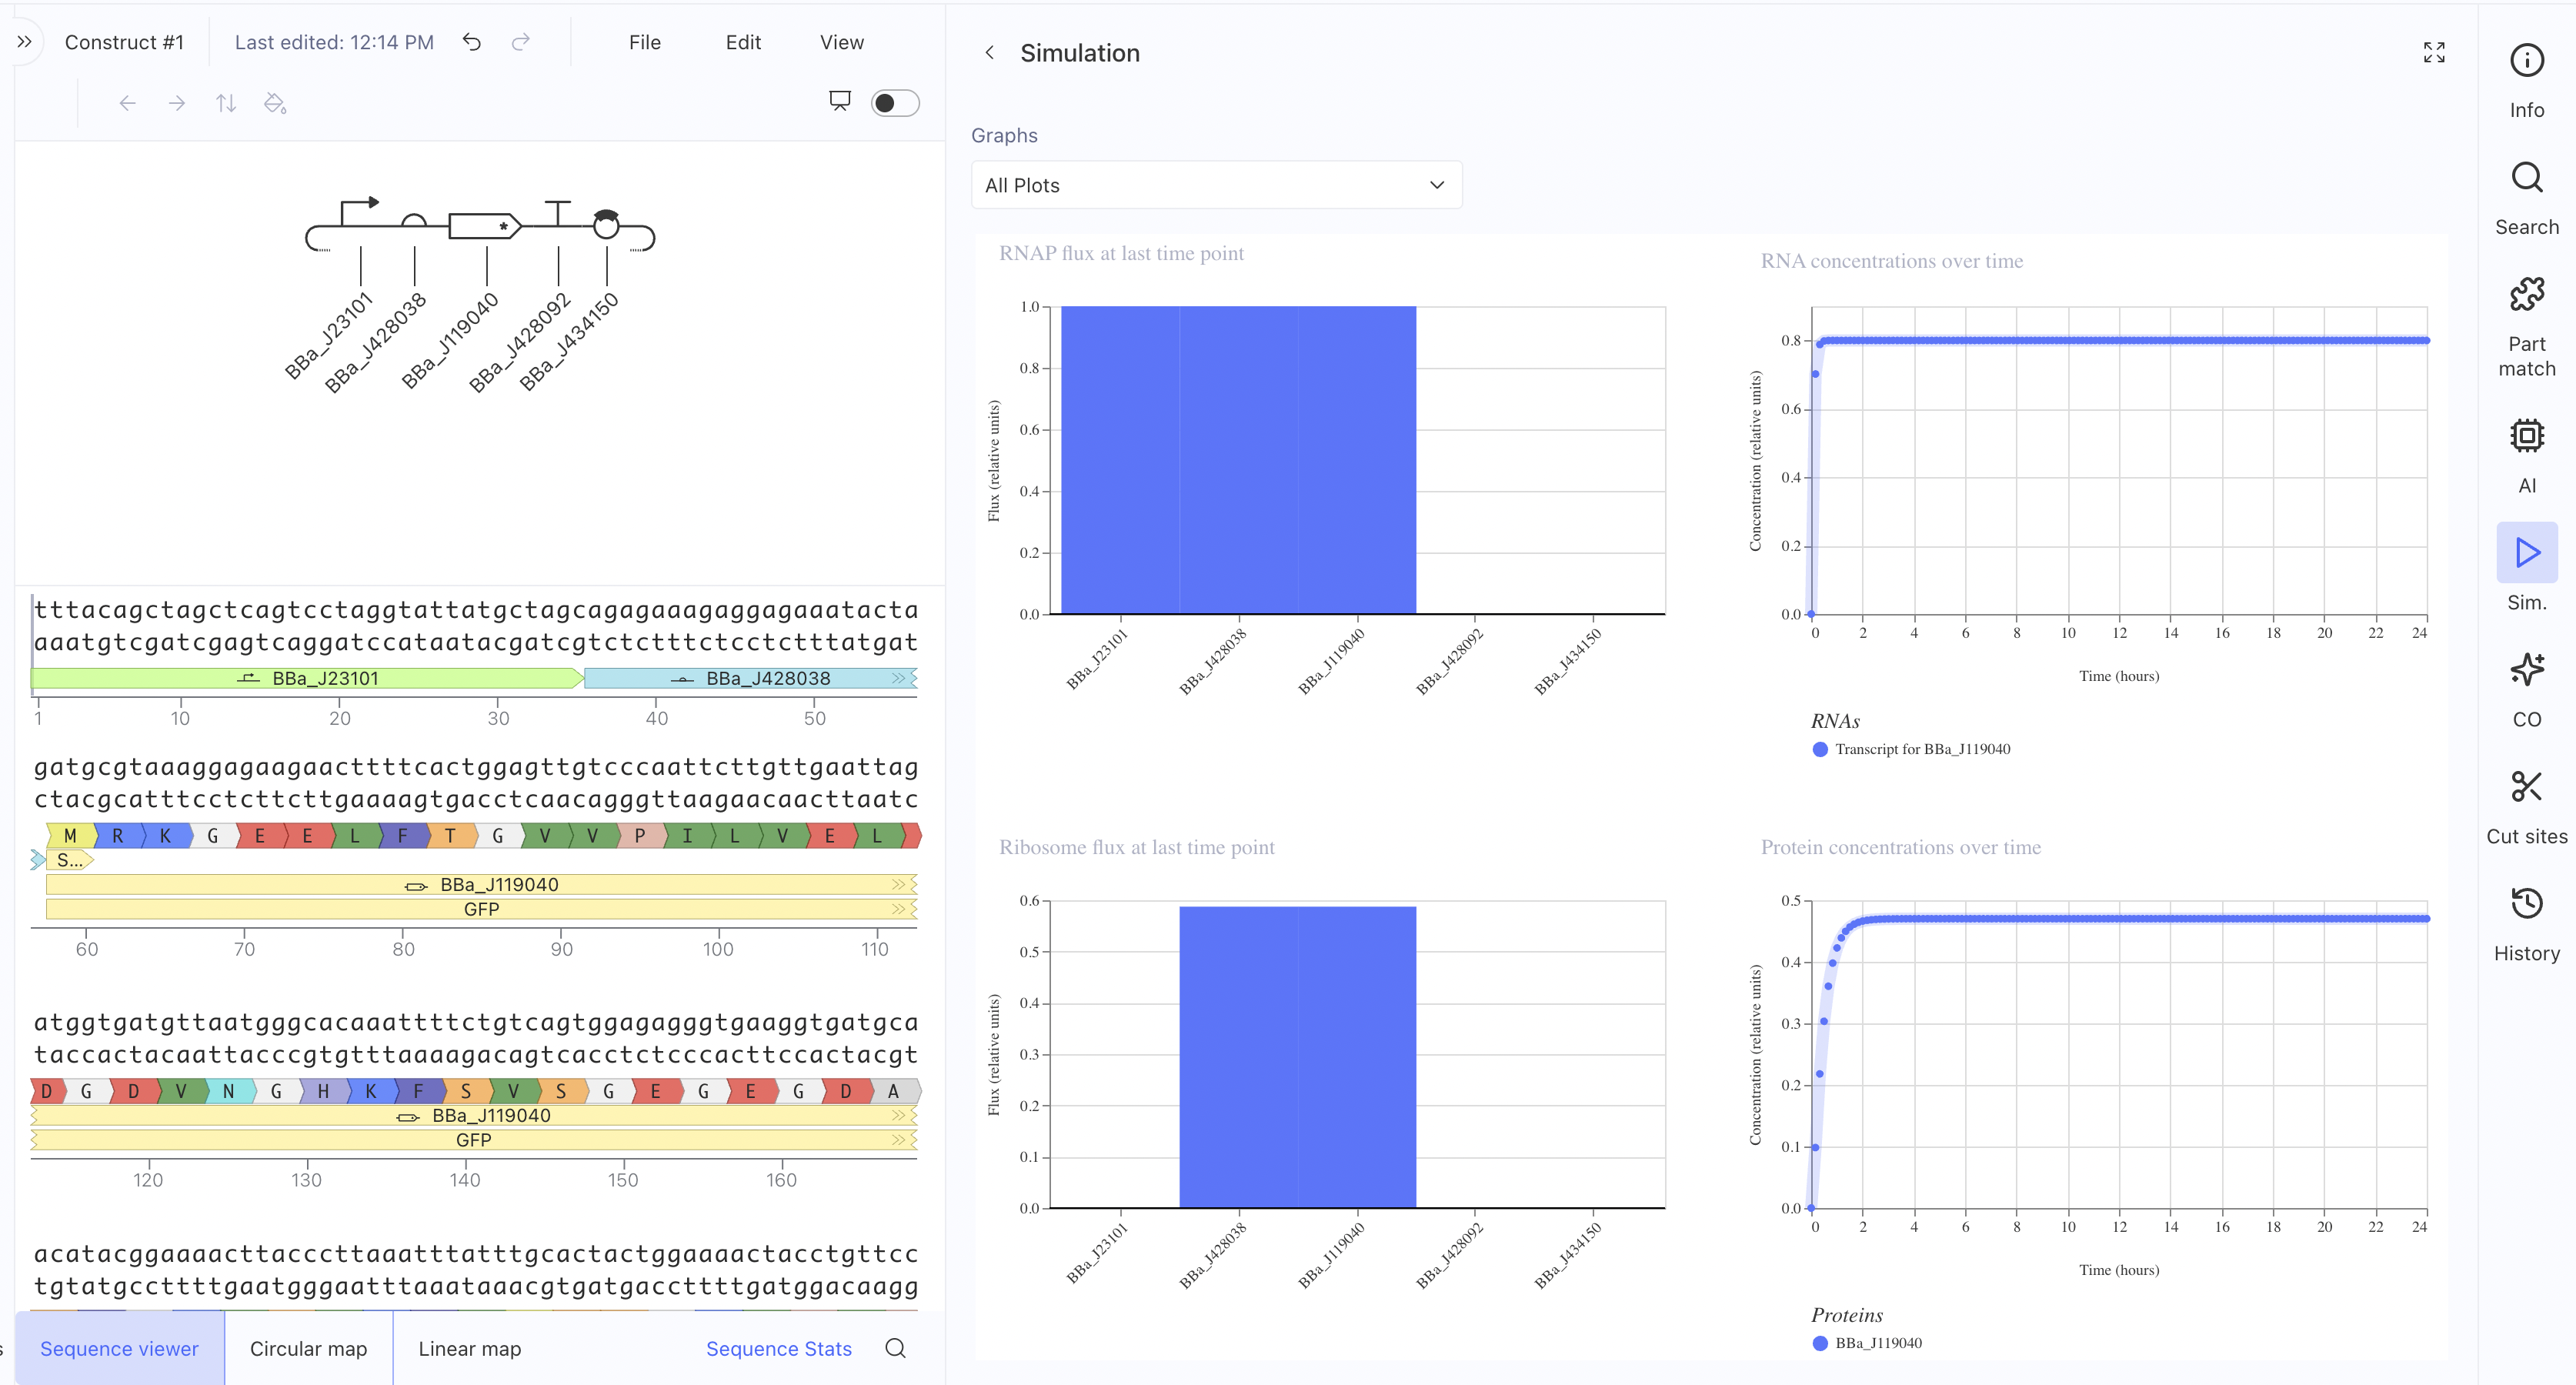
Construct 1: Constitutive GFP Expression Circuit
This is a simple constitutive expression circuit used as a reference
design to test the Kernel simulation environment.
This construct uses a Short HsEef1a1 promoter driving expression of
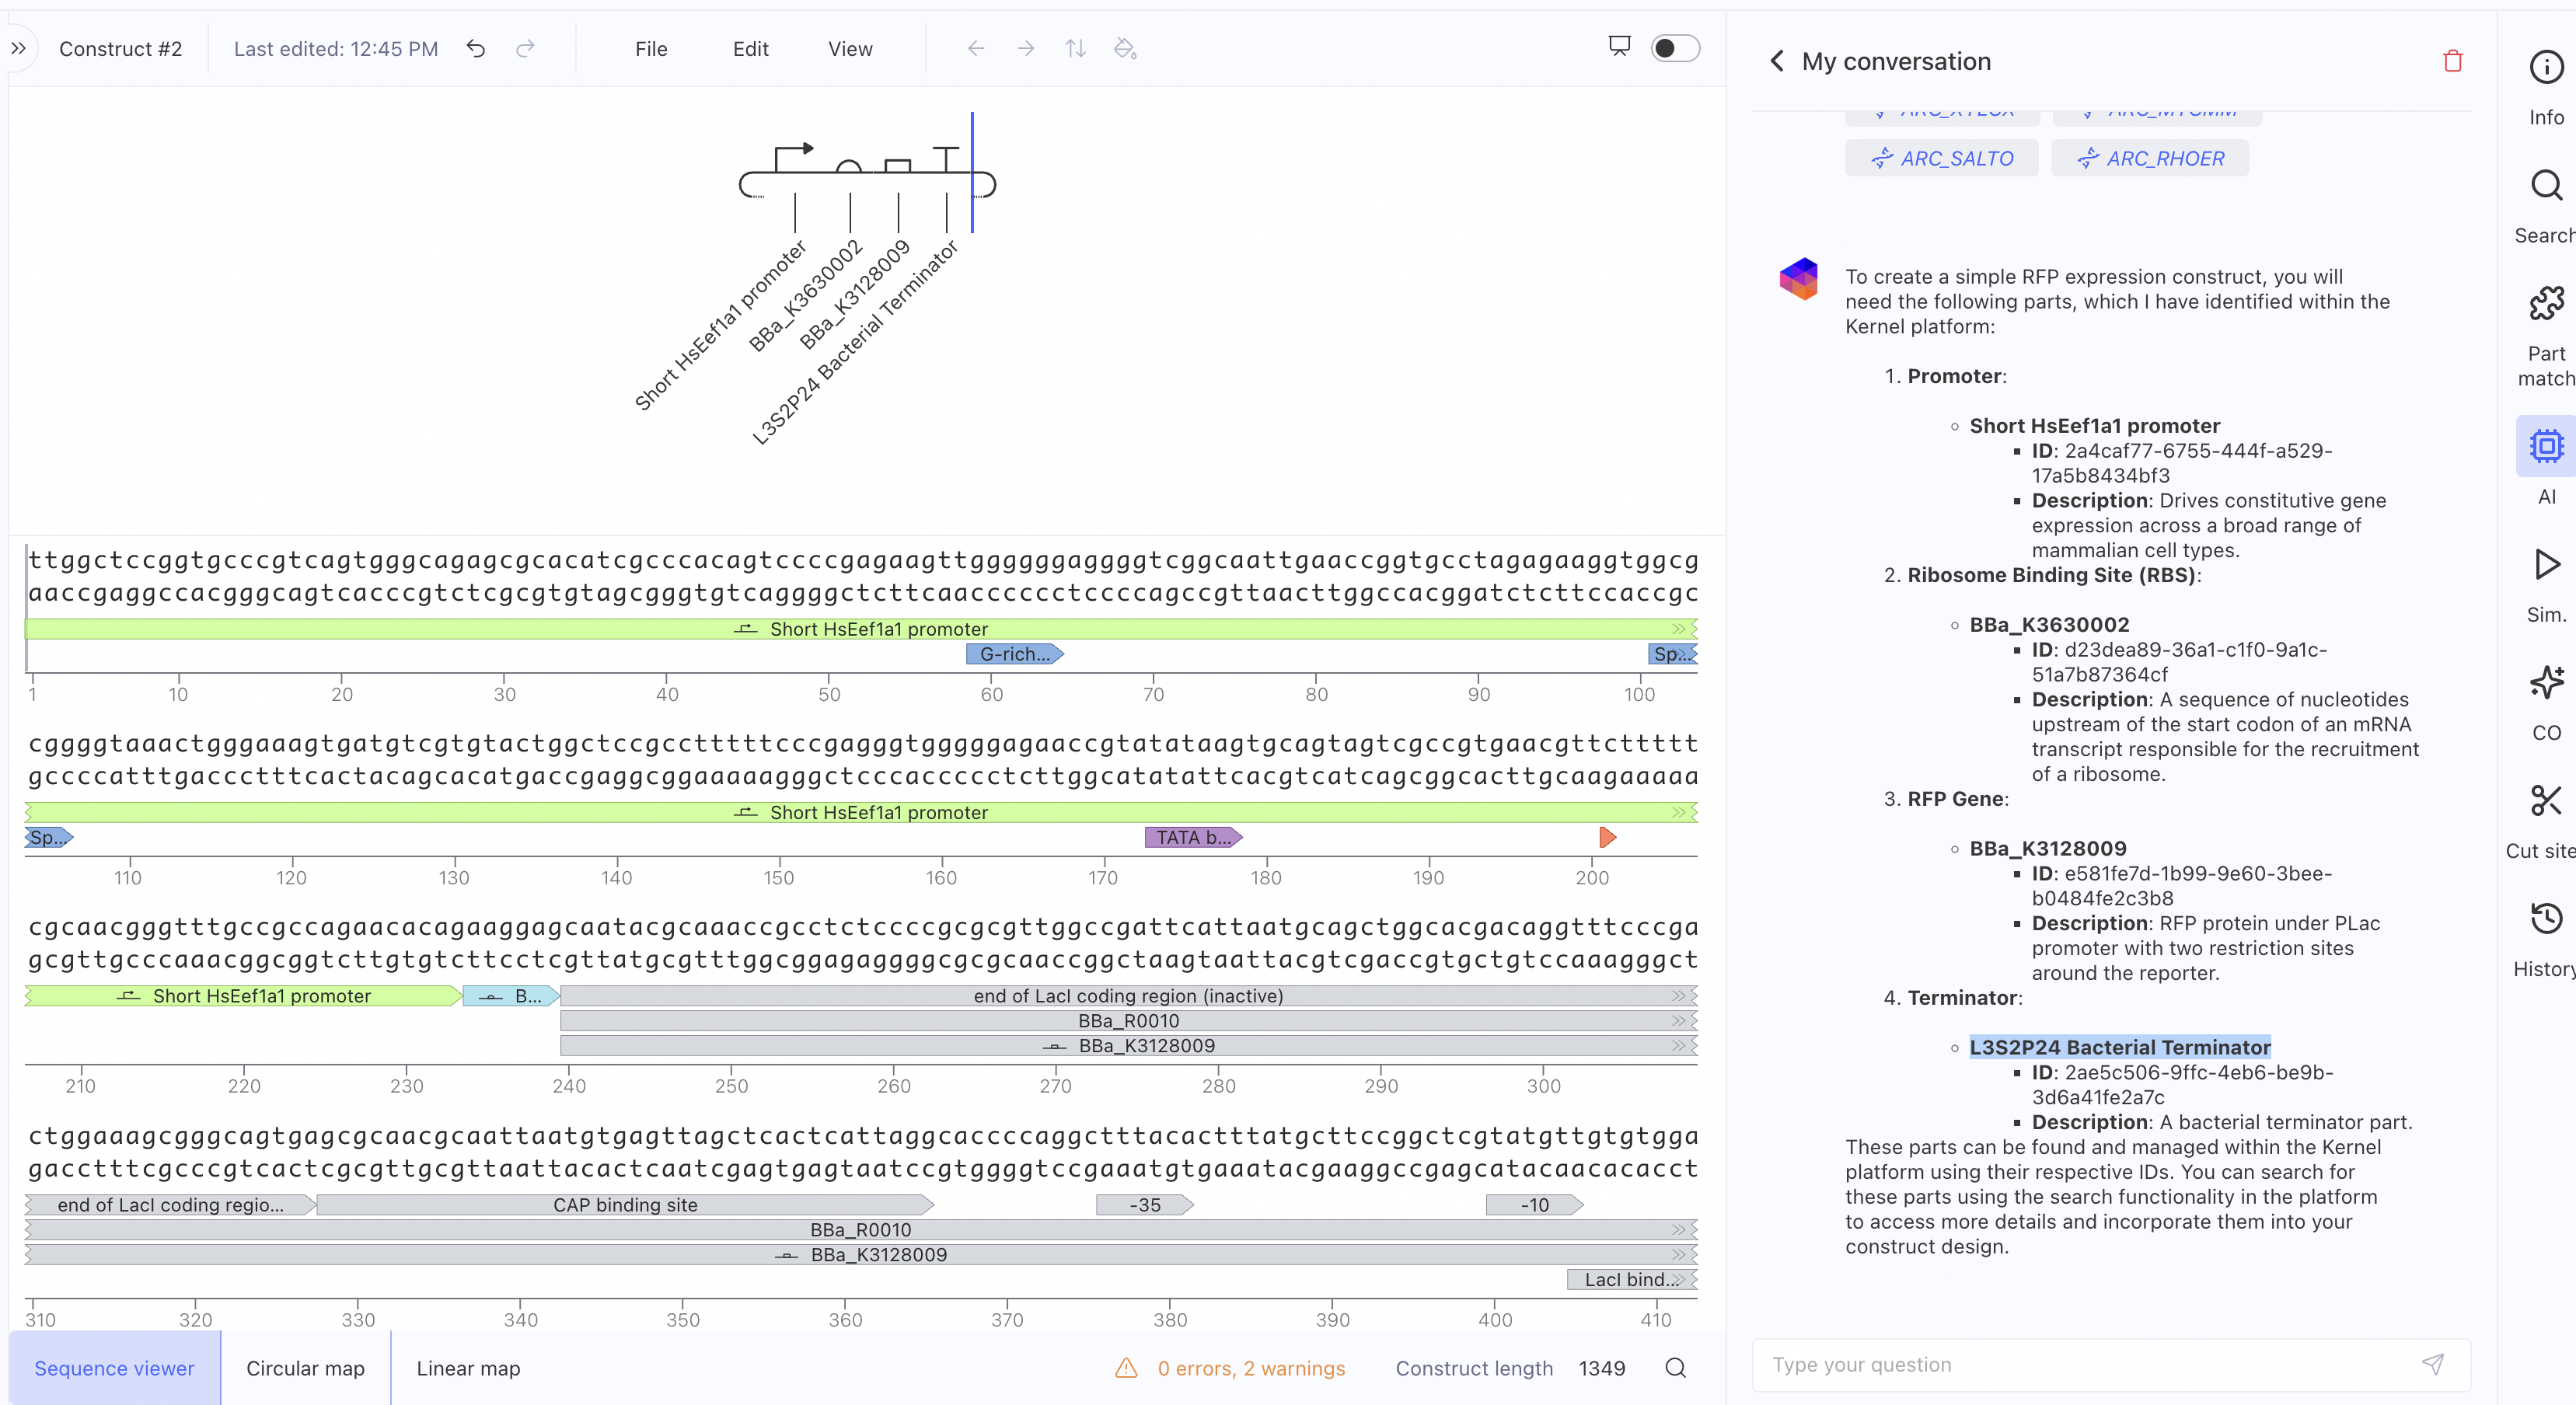
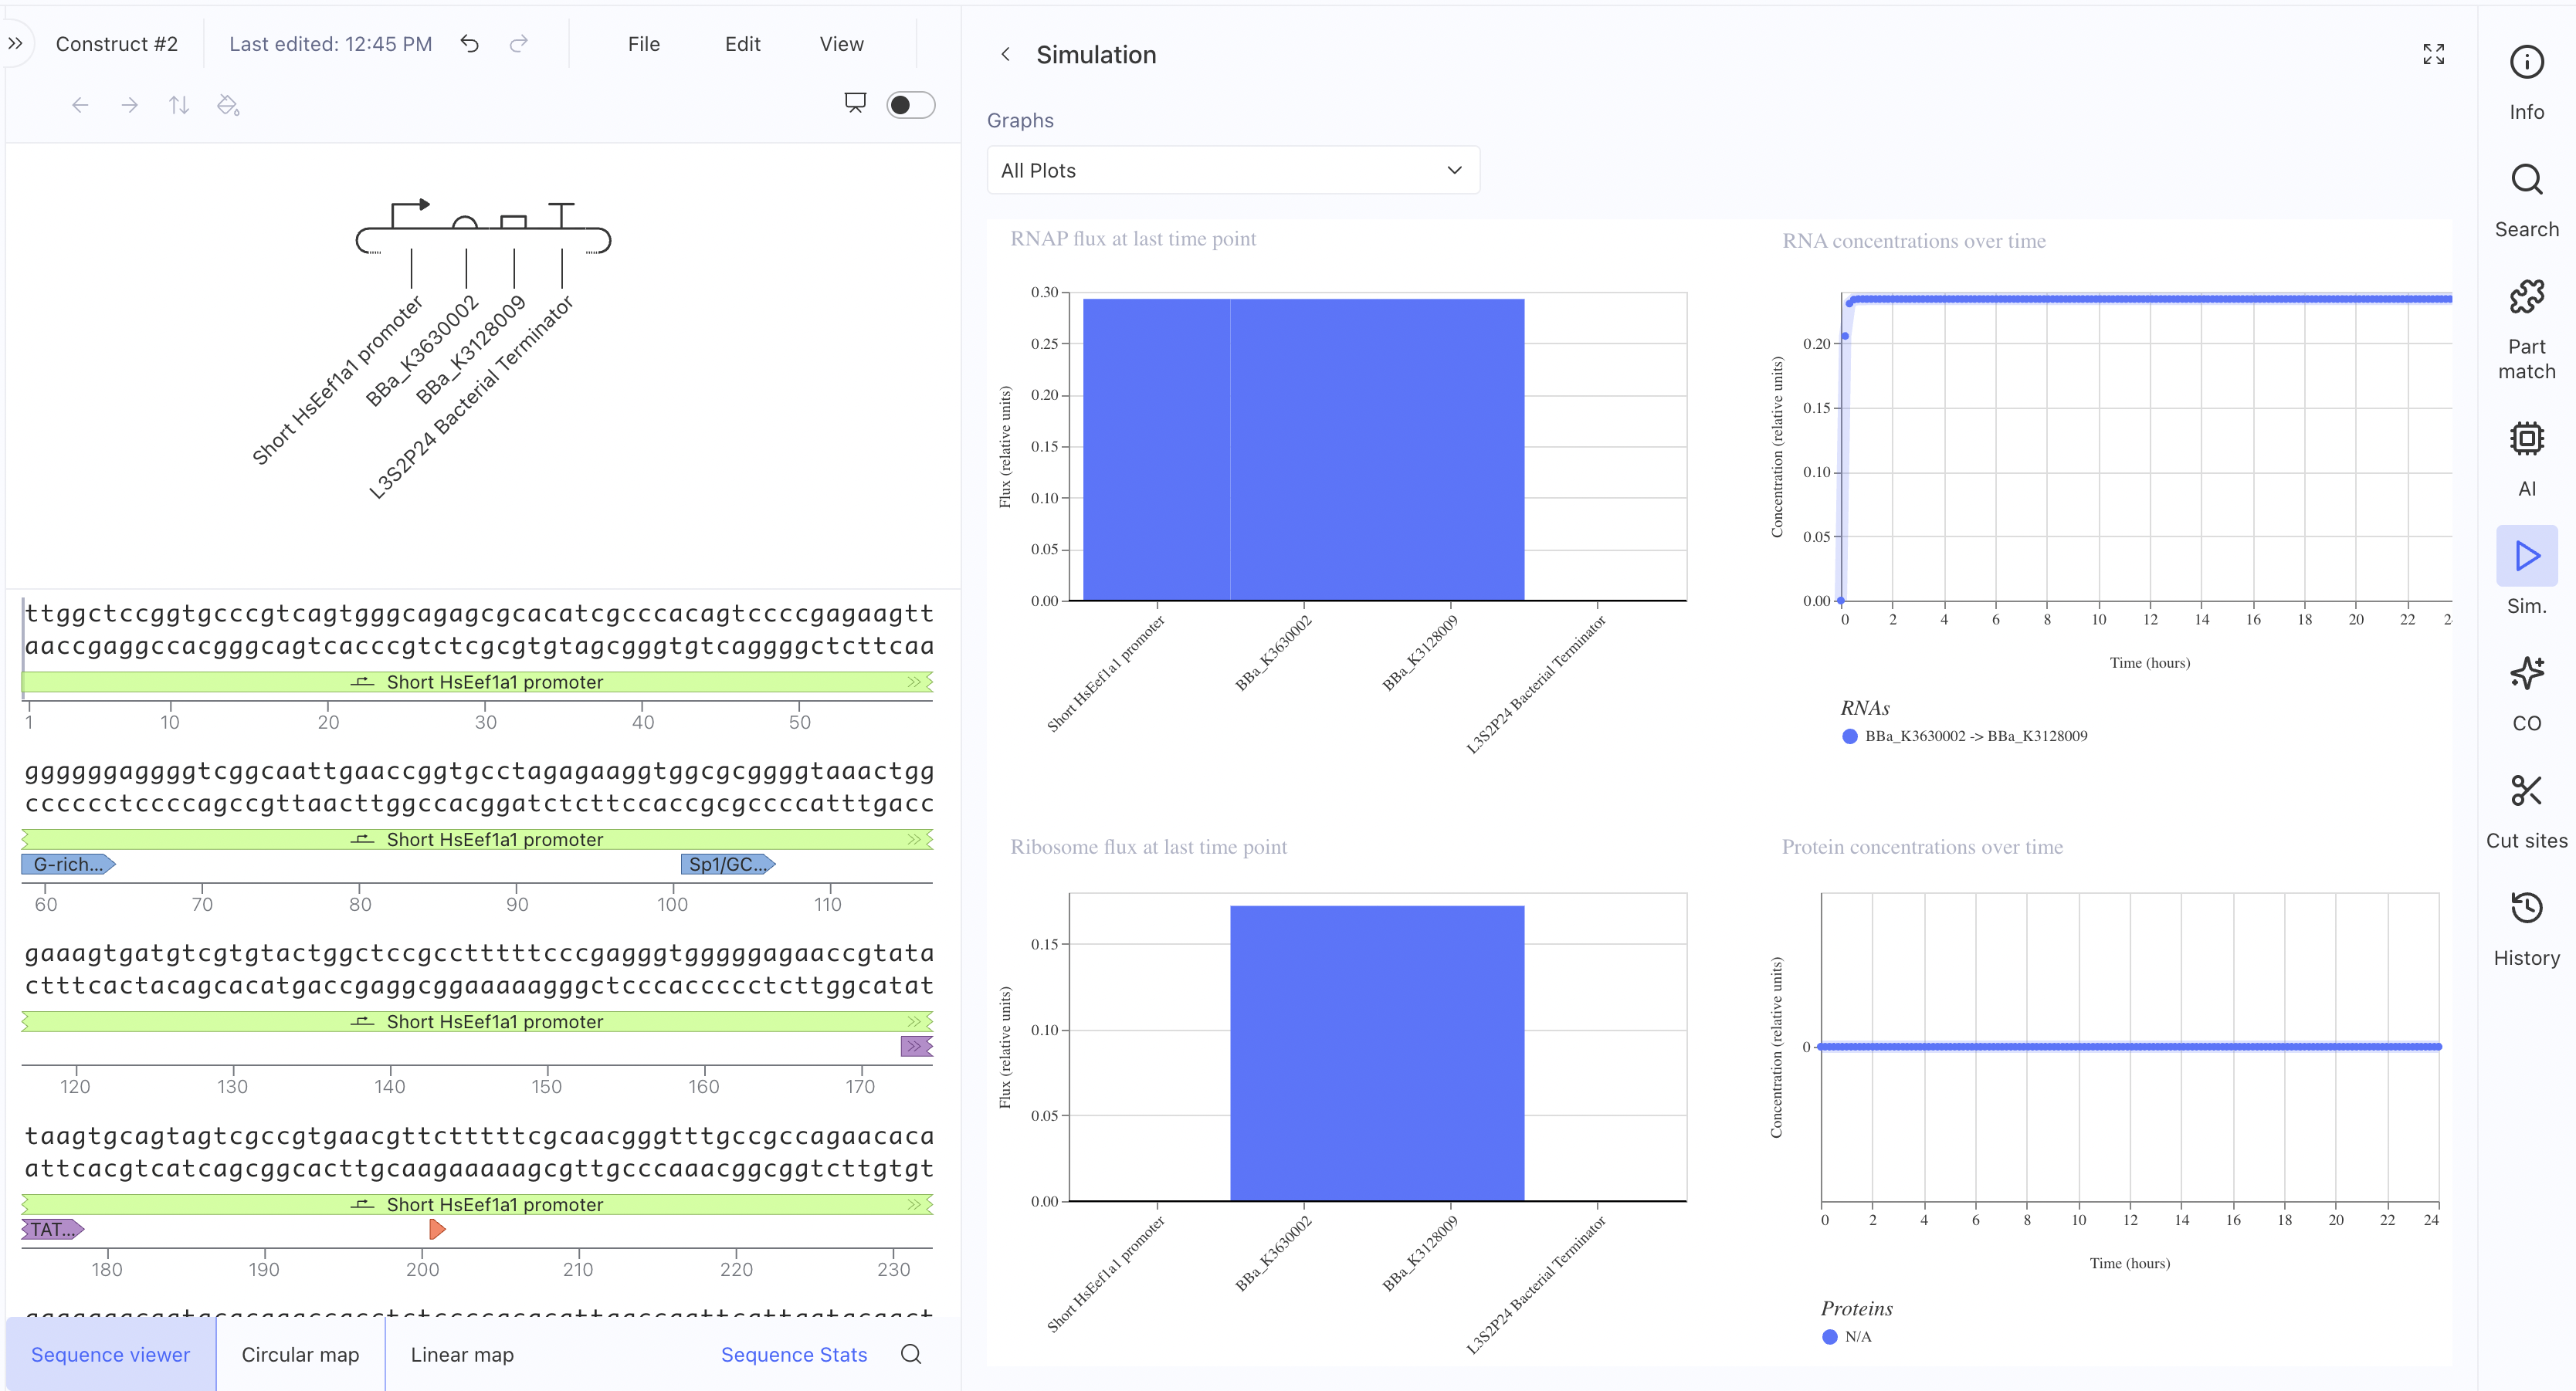
BBa_K3630002 and BBa_K3128009, with an L3S2P24 bacterial terminator.
The RNAP flux was lower here (~0.27 relative units) compared to
Construct 1, which makes sense since the HsEef1a1 promoter is a
mammalian promoter and not optimised for bacterial simulation contexts. I also asked the asimov AI for assistance
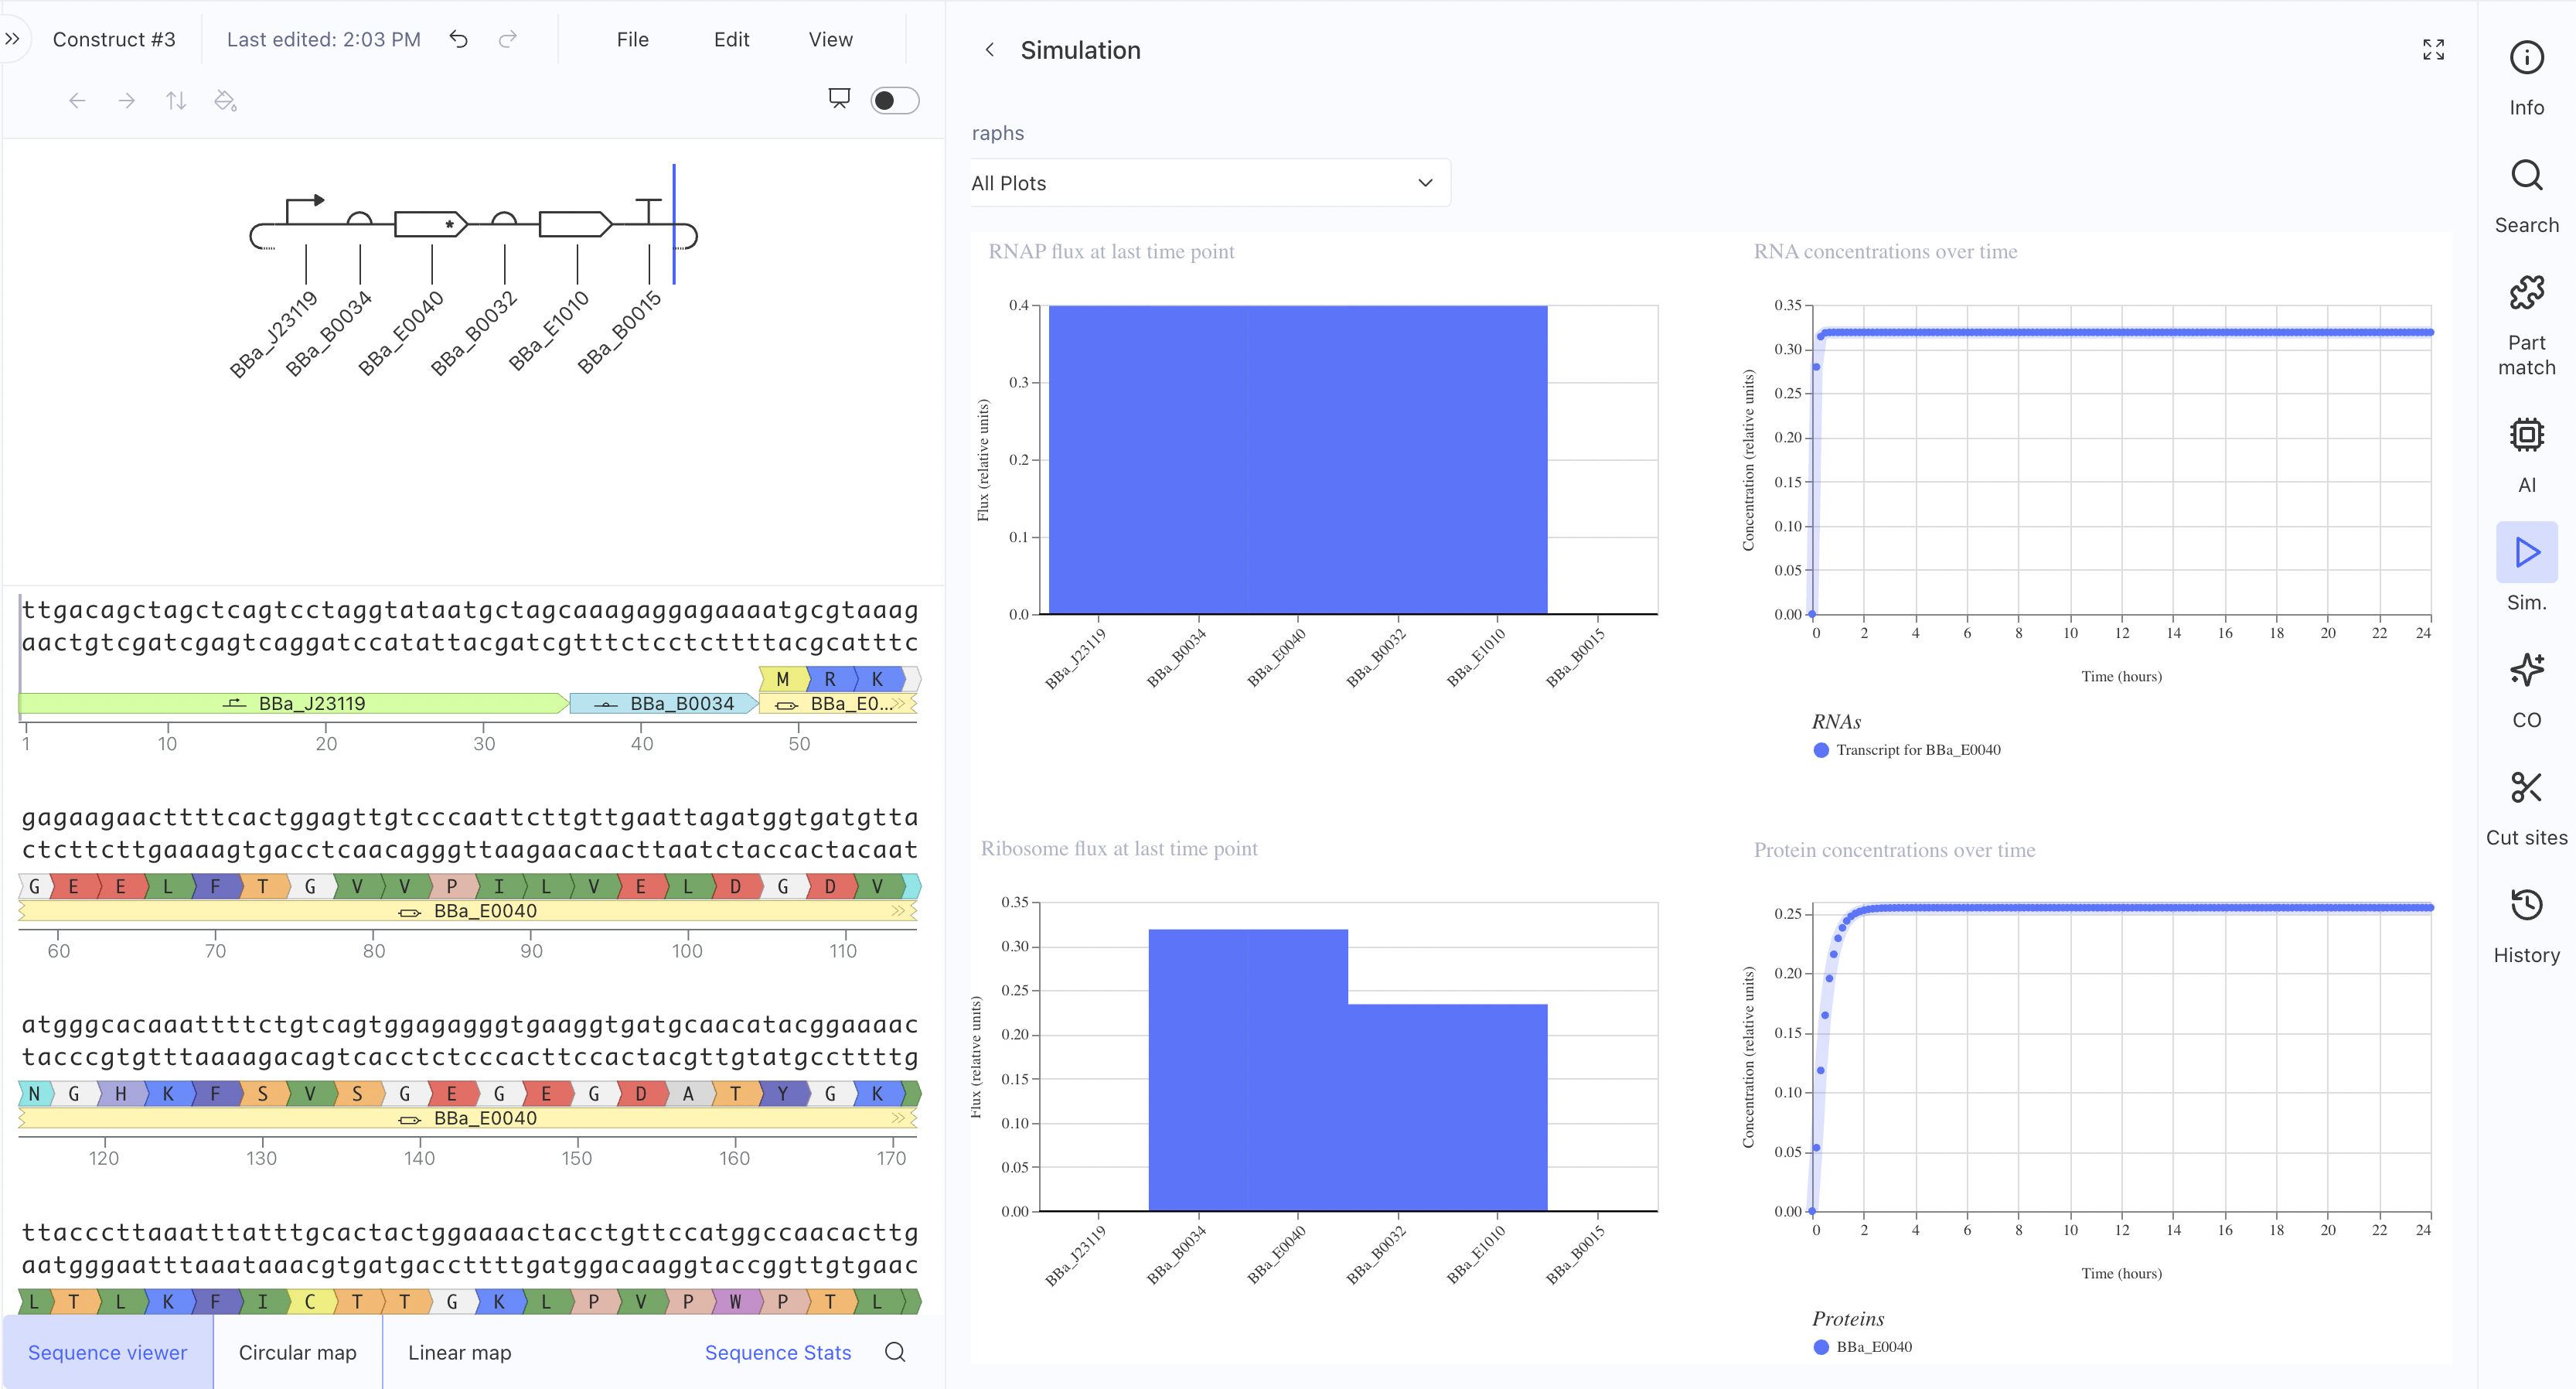
This uses the constitutive promoter BBa_J23119, RBS BBa_B0034, the L-protein
coding sequence BBa_E0040, a coding sequence extension BBa_B0032, an insulator BBa_E1010, and terminator BBa_B0015. The simulation showed RNAP flux, and interestingly the ribosome flux graph showed two distinct peaks suggesting the simulator is resolving translation at two separate coding regions. This is the construct architecture most directly applicable to expressing L-protein mutants in E. coli for the downstream plaque assay experiments.
Week 7 HW: Genetic Circuits Part II
Part1: Intracellular Artificial Neural Networks
What advantages do IANNs have over traditional genetic circuits, whose input/output behaviors are Boolean functions?
Traditional genetic circuits treat inputs as binary. This works for simple logic but breaks down when you need nuanced, graded decisions based on multiple continuous signals. Biology itself is almost never binary; cells exist on spectrums of gene expression and signalling intensity. IANNs overcome this by operating in the analog domain. An IANN computes a weighted sum of all inputs and applies a nonlinear activation function, exactly like an artificial neuron. The same molecular parts can be reused to implement completely different decision boundaries just by changing the weights, without engineering new biological parts from scratch. IANNs can also be stacked into multiple layers, enabling hierarchical computation that is completely impossible with single-layer Boolean circuits.
Describe a useful application for an IANN; include a detailed description of input/output behavior, as well as any limitations an IANN might face to achieve your goal.
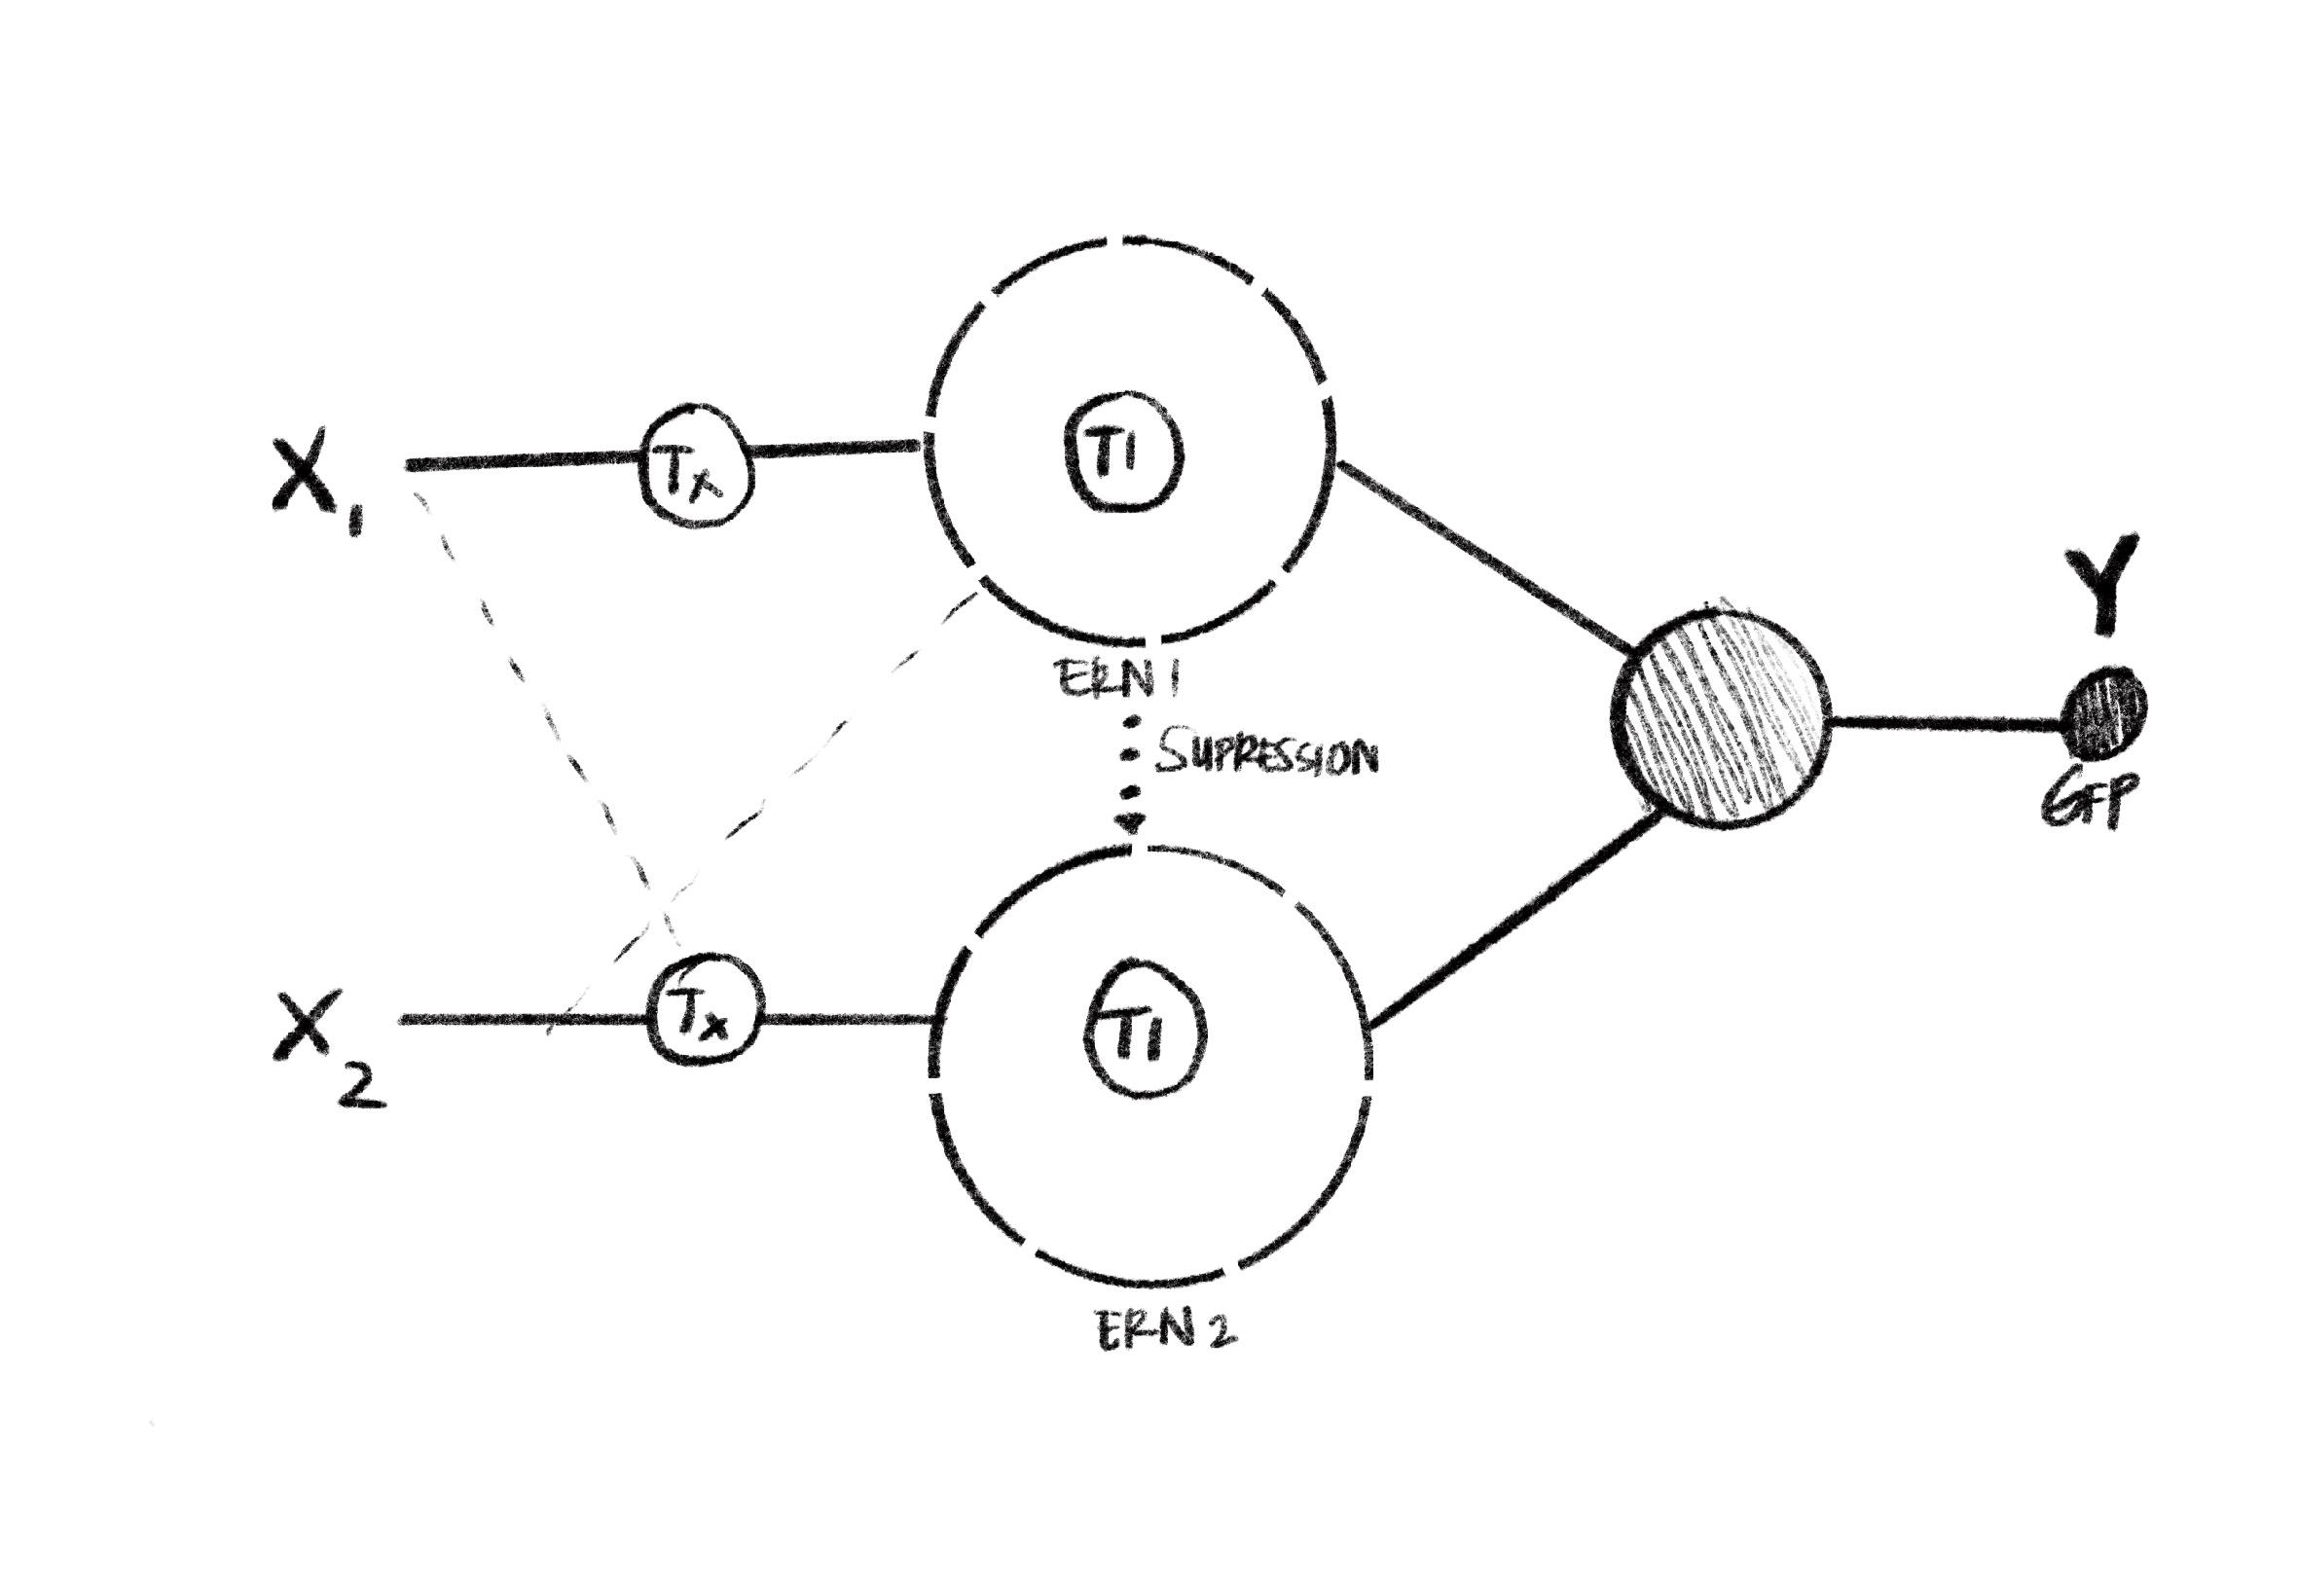
Application: multi-signal tumour detection
A compelling use case is engineering a cancer-detecting IANN in CAR-T cells that triggers apoptosis only when multiple tumour markers are simultaneously present at the right levels, while ignoring healthy cells that express some markers at lower concentrations.
Three inputs (HER2, MUC1, HIF-1a) drive promoters at strengths proportional to their concentration. Those promoters produce endoribonucleases whose expression encodes the weighted input combination. Layer 1 outputs Csy4, whose concentration reflects the weighted sum. In layer 2, a caspase gene carries a Csy4-recognition hairpin in its 5’ UTR. If Csy4 is below threshold, the hairpin is intact and the cell triggers apoptosis in the target. If Csy4 is high, it cleaves the mRNA and nothing happens.
Limitations: the number of well-characterised orthogonal ERNs is small, capping practical input dimensionality. The system is also sensitive to transcriptional noise at low signal concentrations, and tuning promoter strengths reliably across cell types is difficult.
Draw a diagram for an intracellular multilayer perceptron where layer 1 outputs an endoribonuclease that regulates a fluorescent protein output in layer 2.
Part 2: Fungal Materials
What are some examples of existing fungal materials and what are they used for? What are their advantages and disadvantages over traditional counterparts?
The most developed fungal material is mycelium composite, where filaments of fungi like Ganoderma are grown through agricultural waste substrates like corn stalks and grain husks. The mycelium binds these particles into a solid mass that can be moulded. Ecovative Design uses this for packaging foam replacing expanded polystyrene. Bolt Threads grows mycelium leather sheets (Mylo) used by fashion brands, and Mogu produces acoustic wall panels and floor tiles.
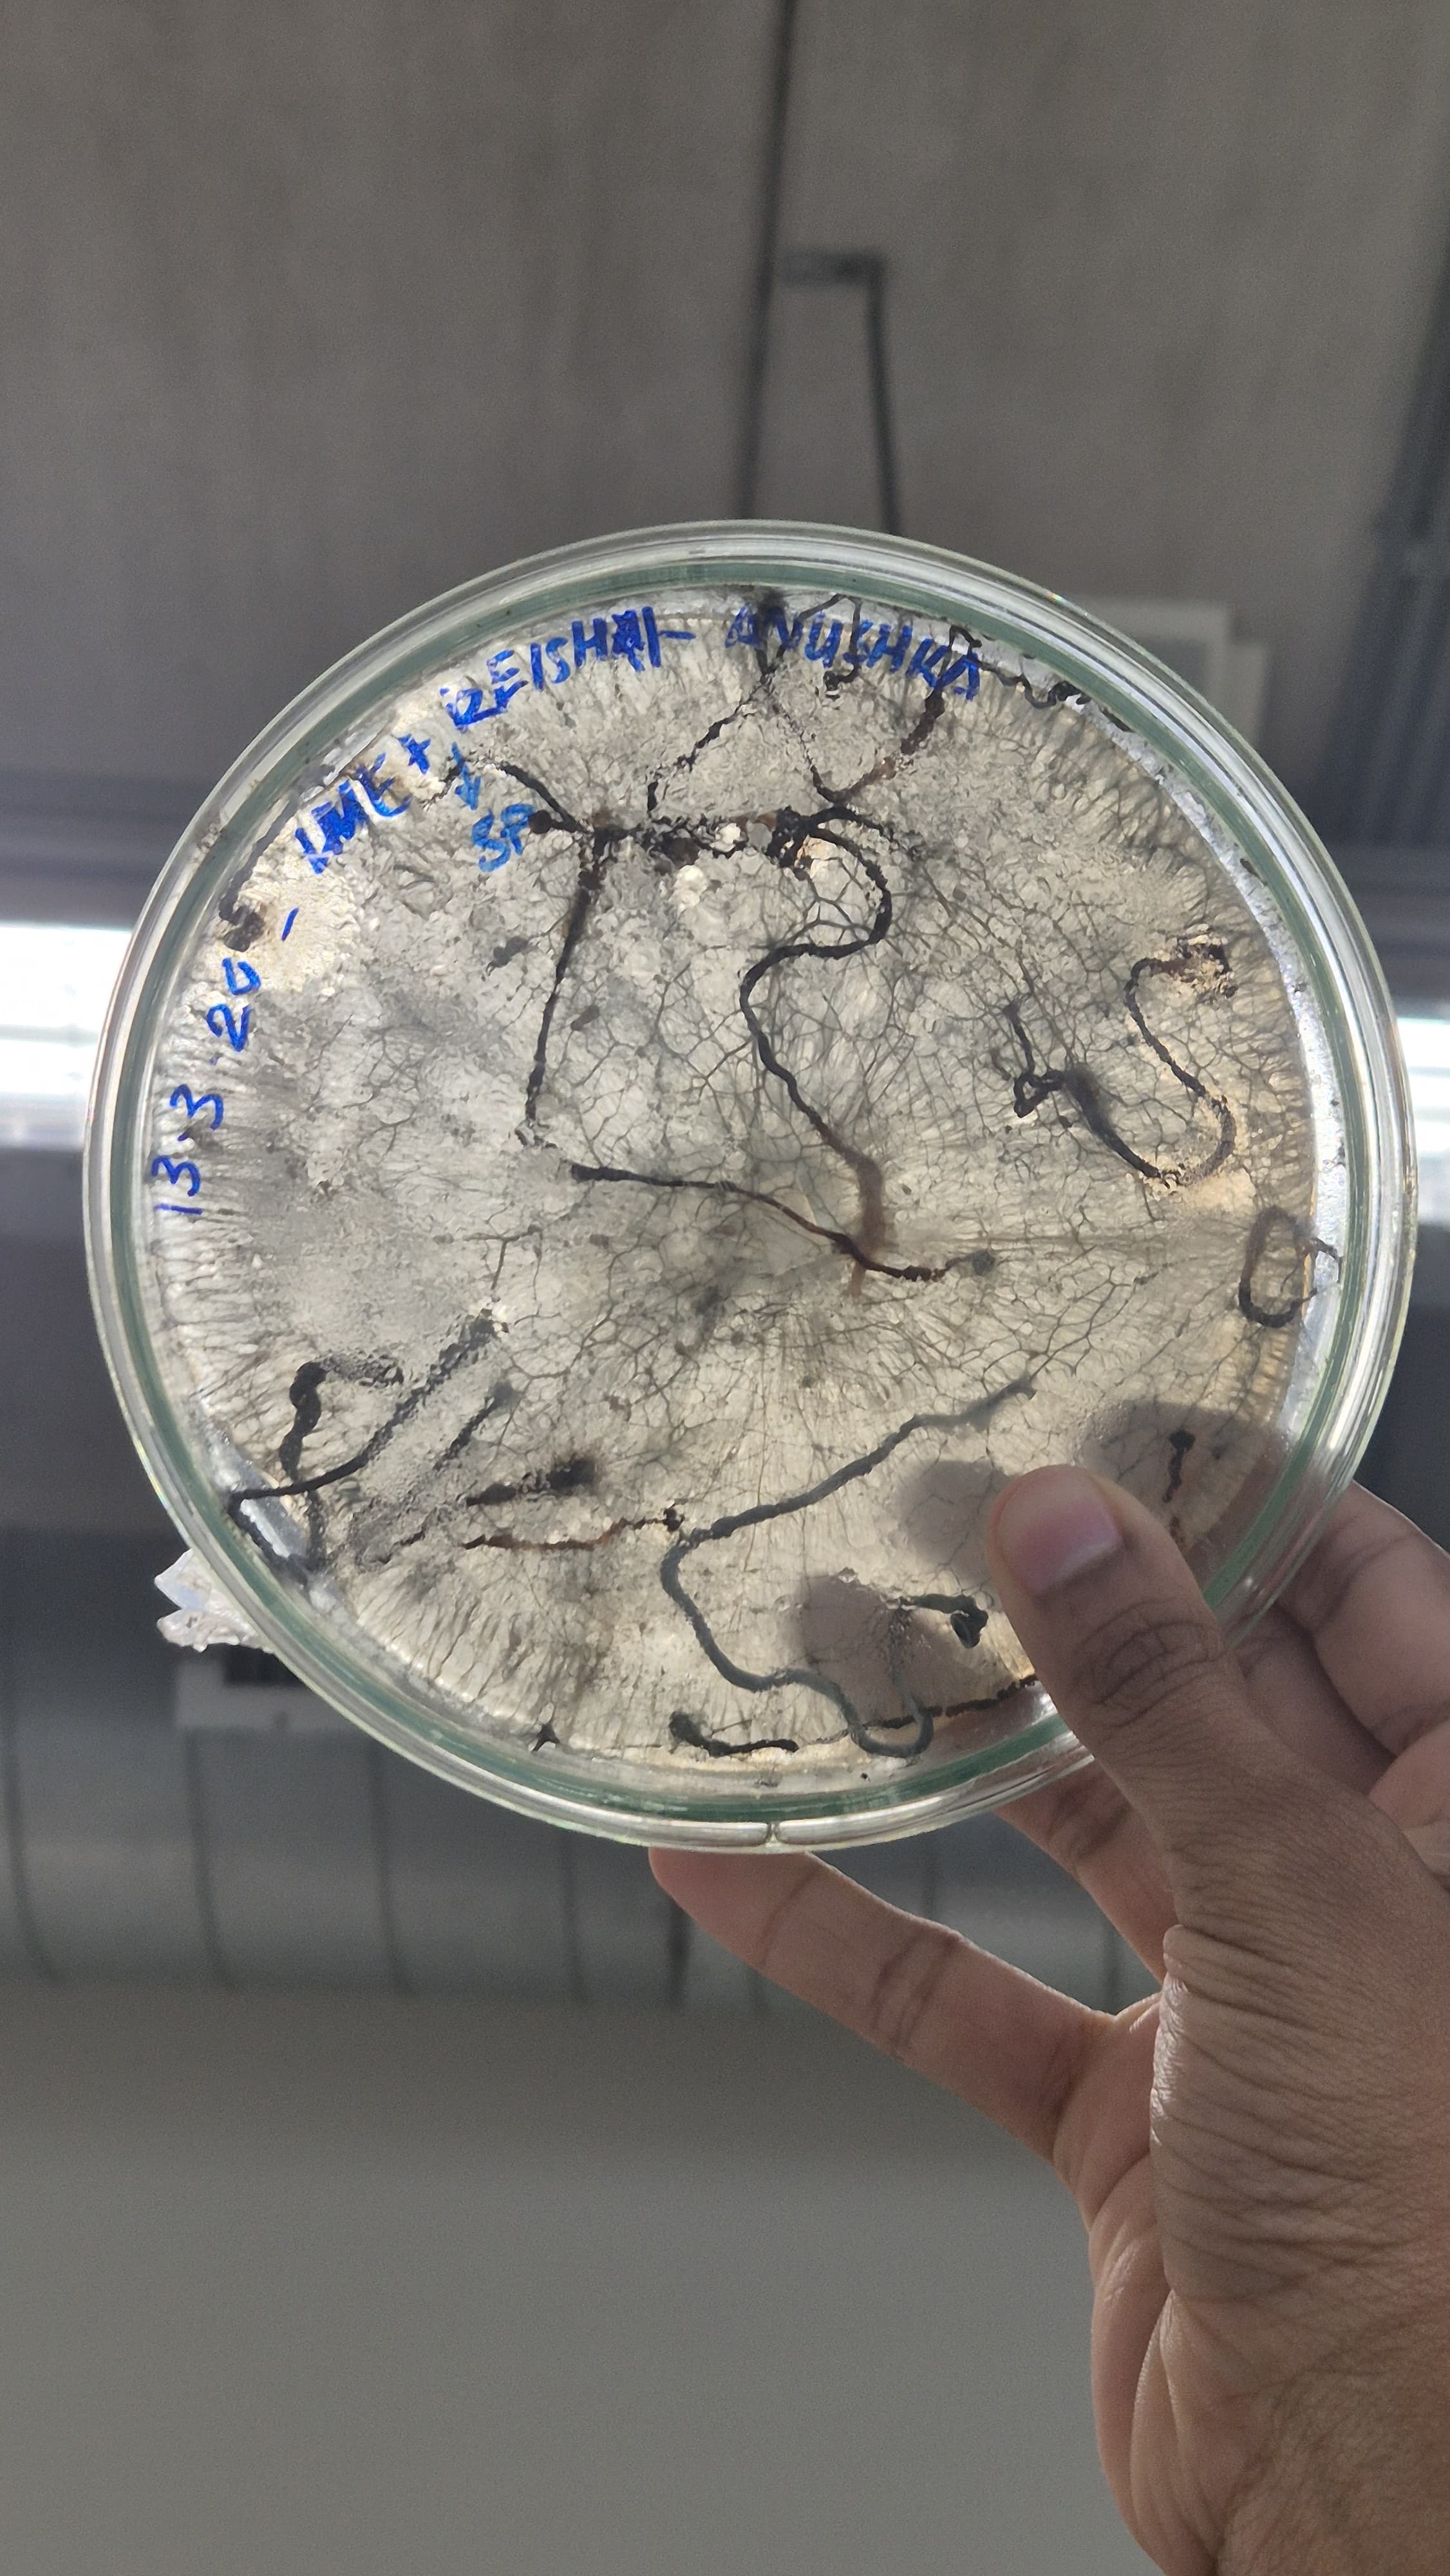
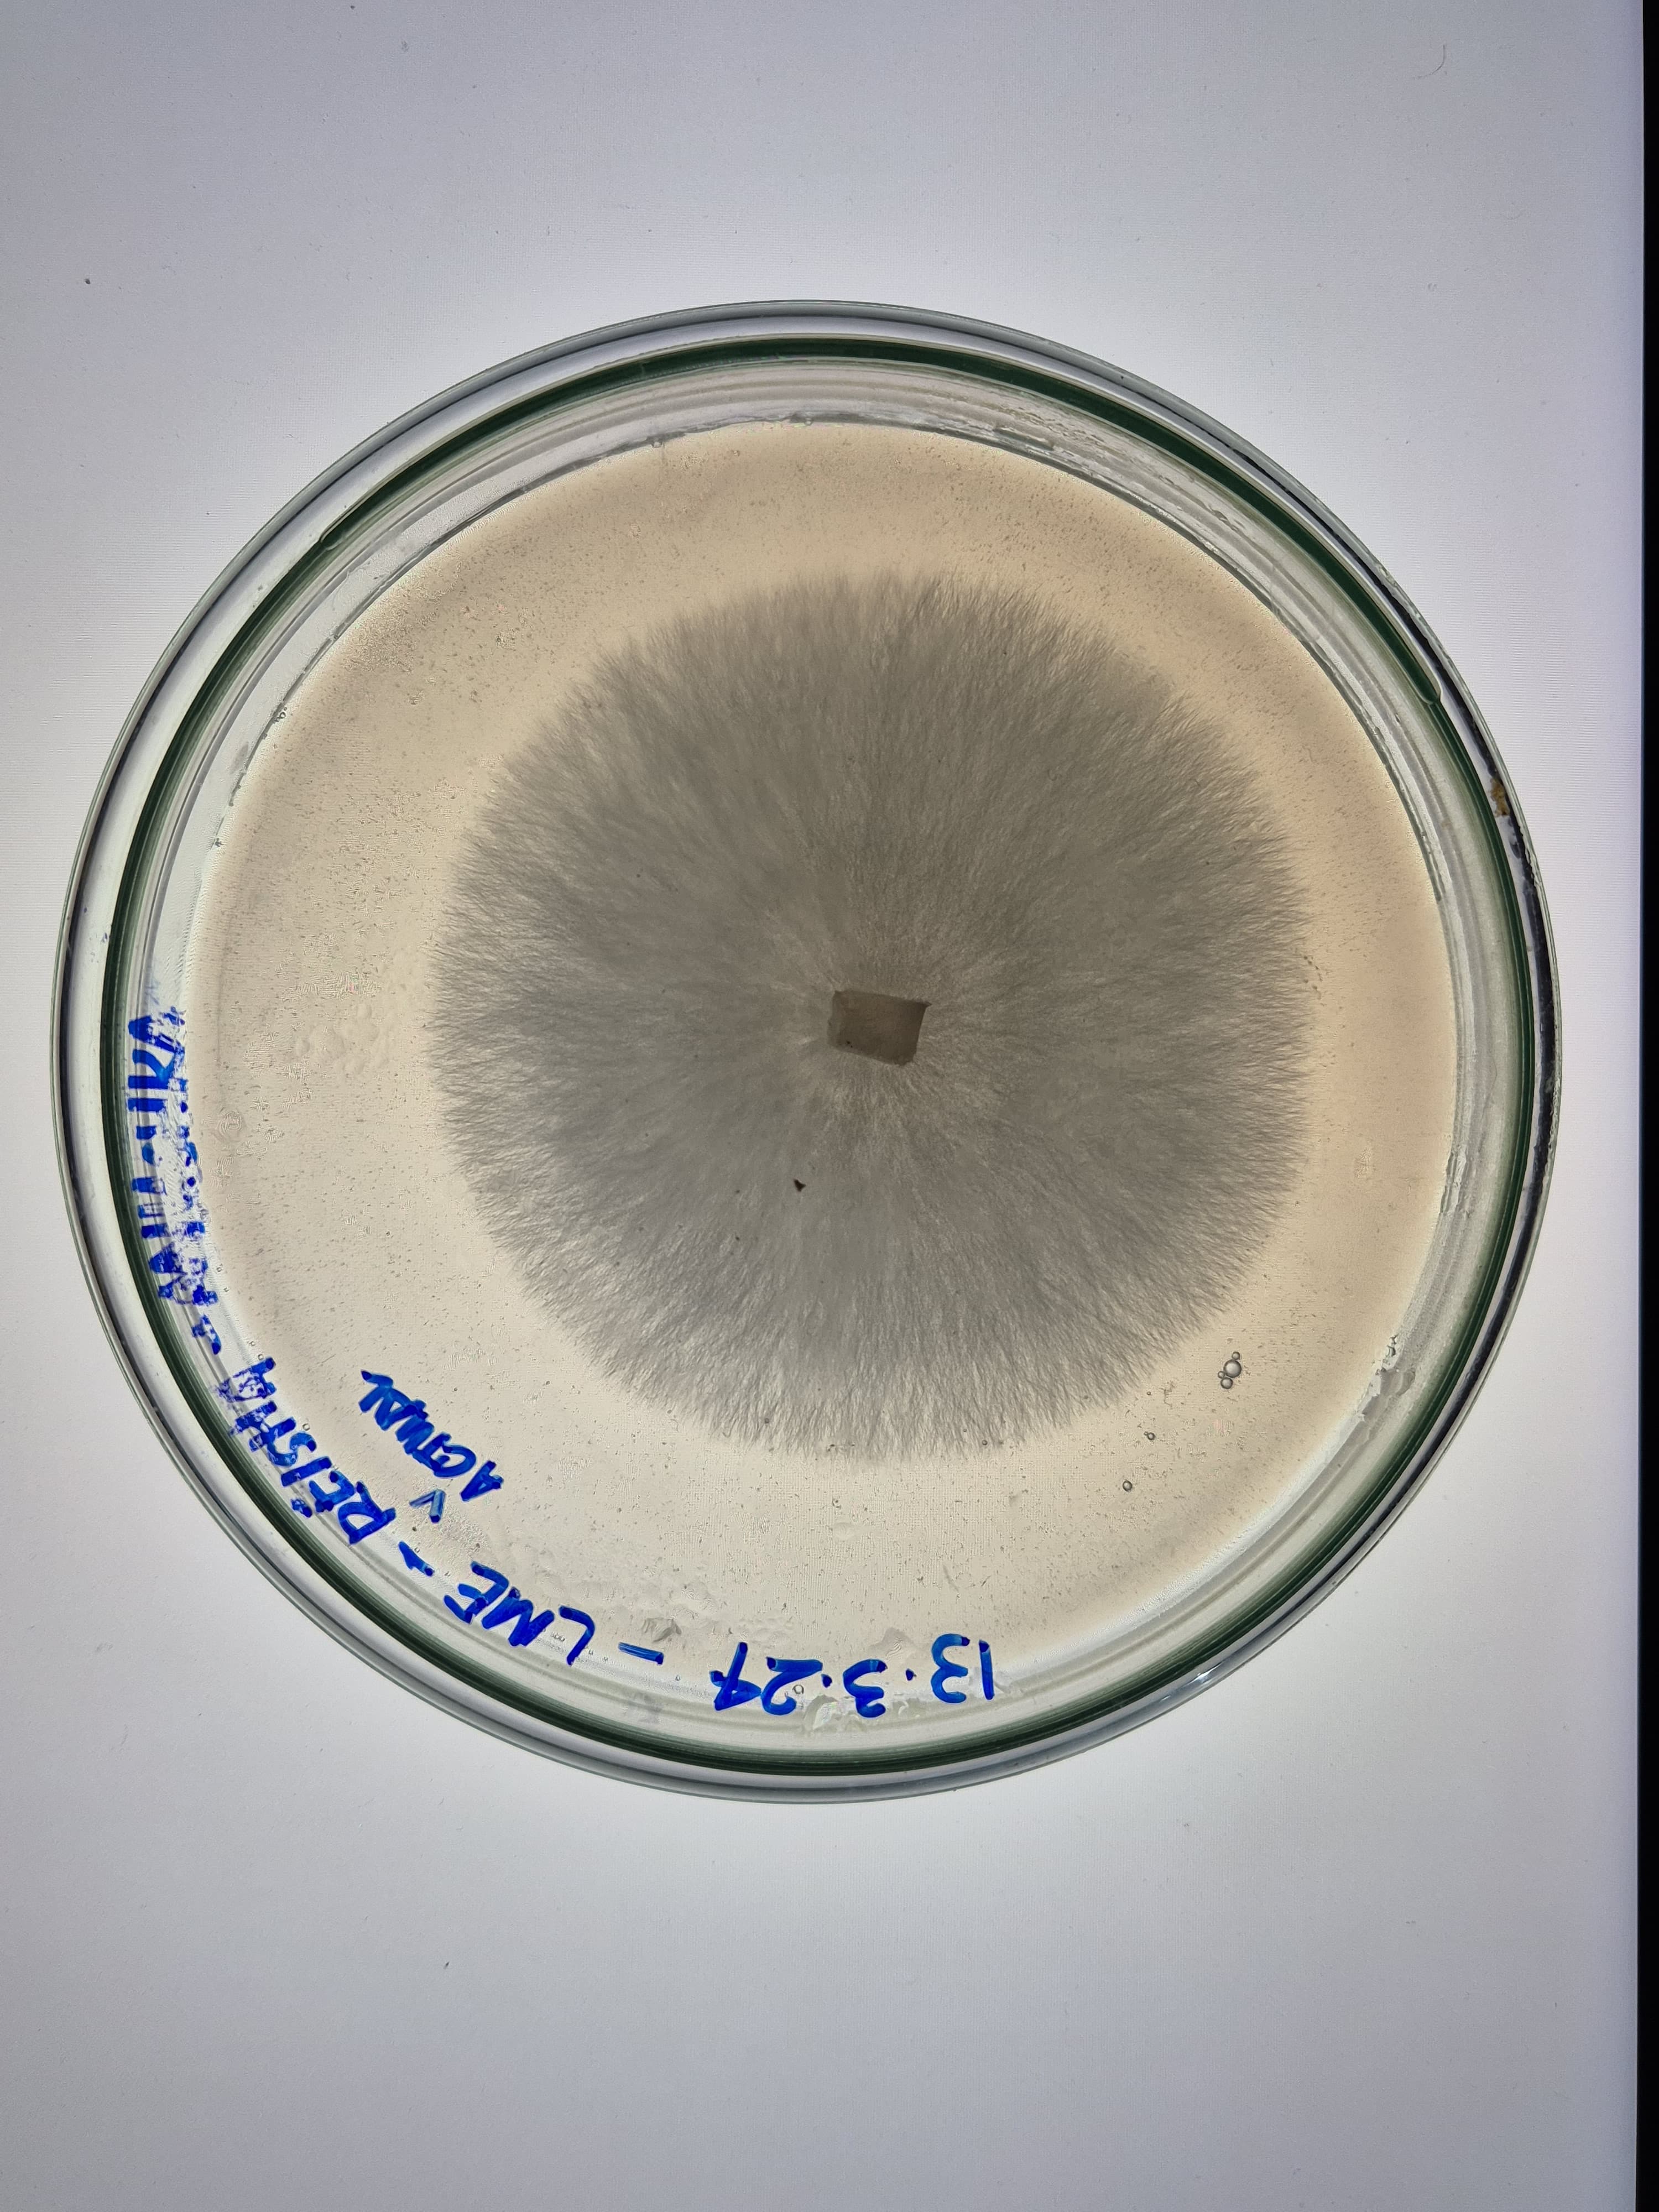
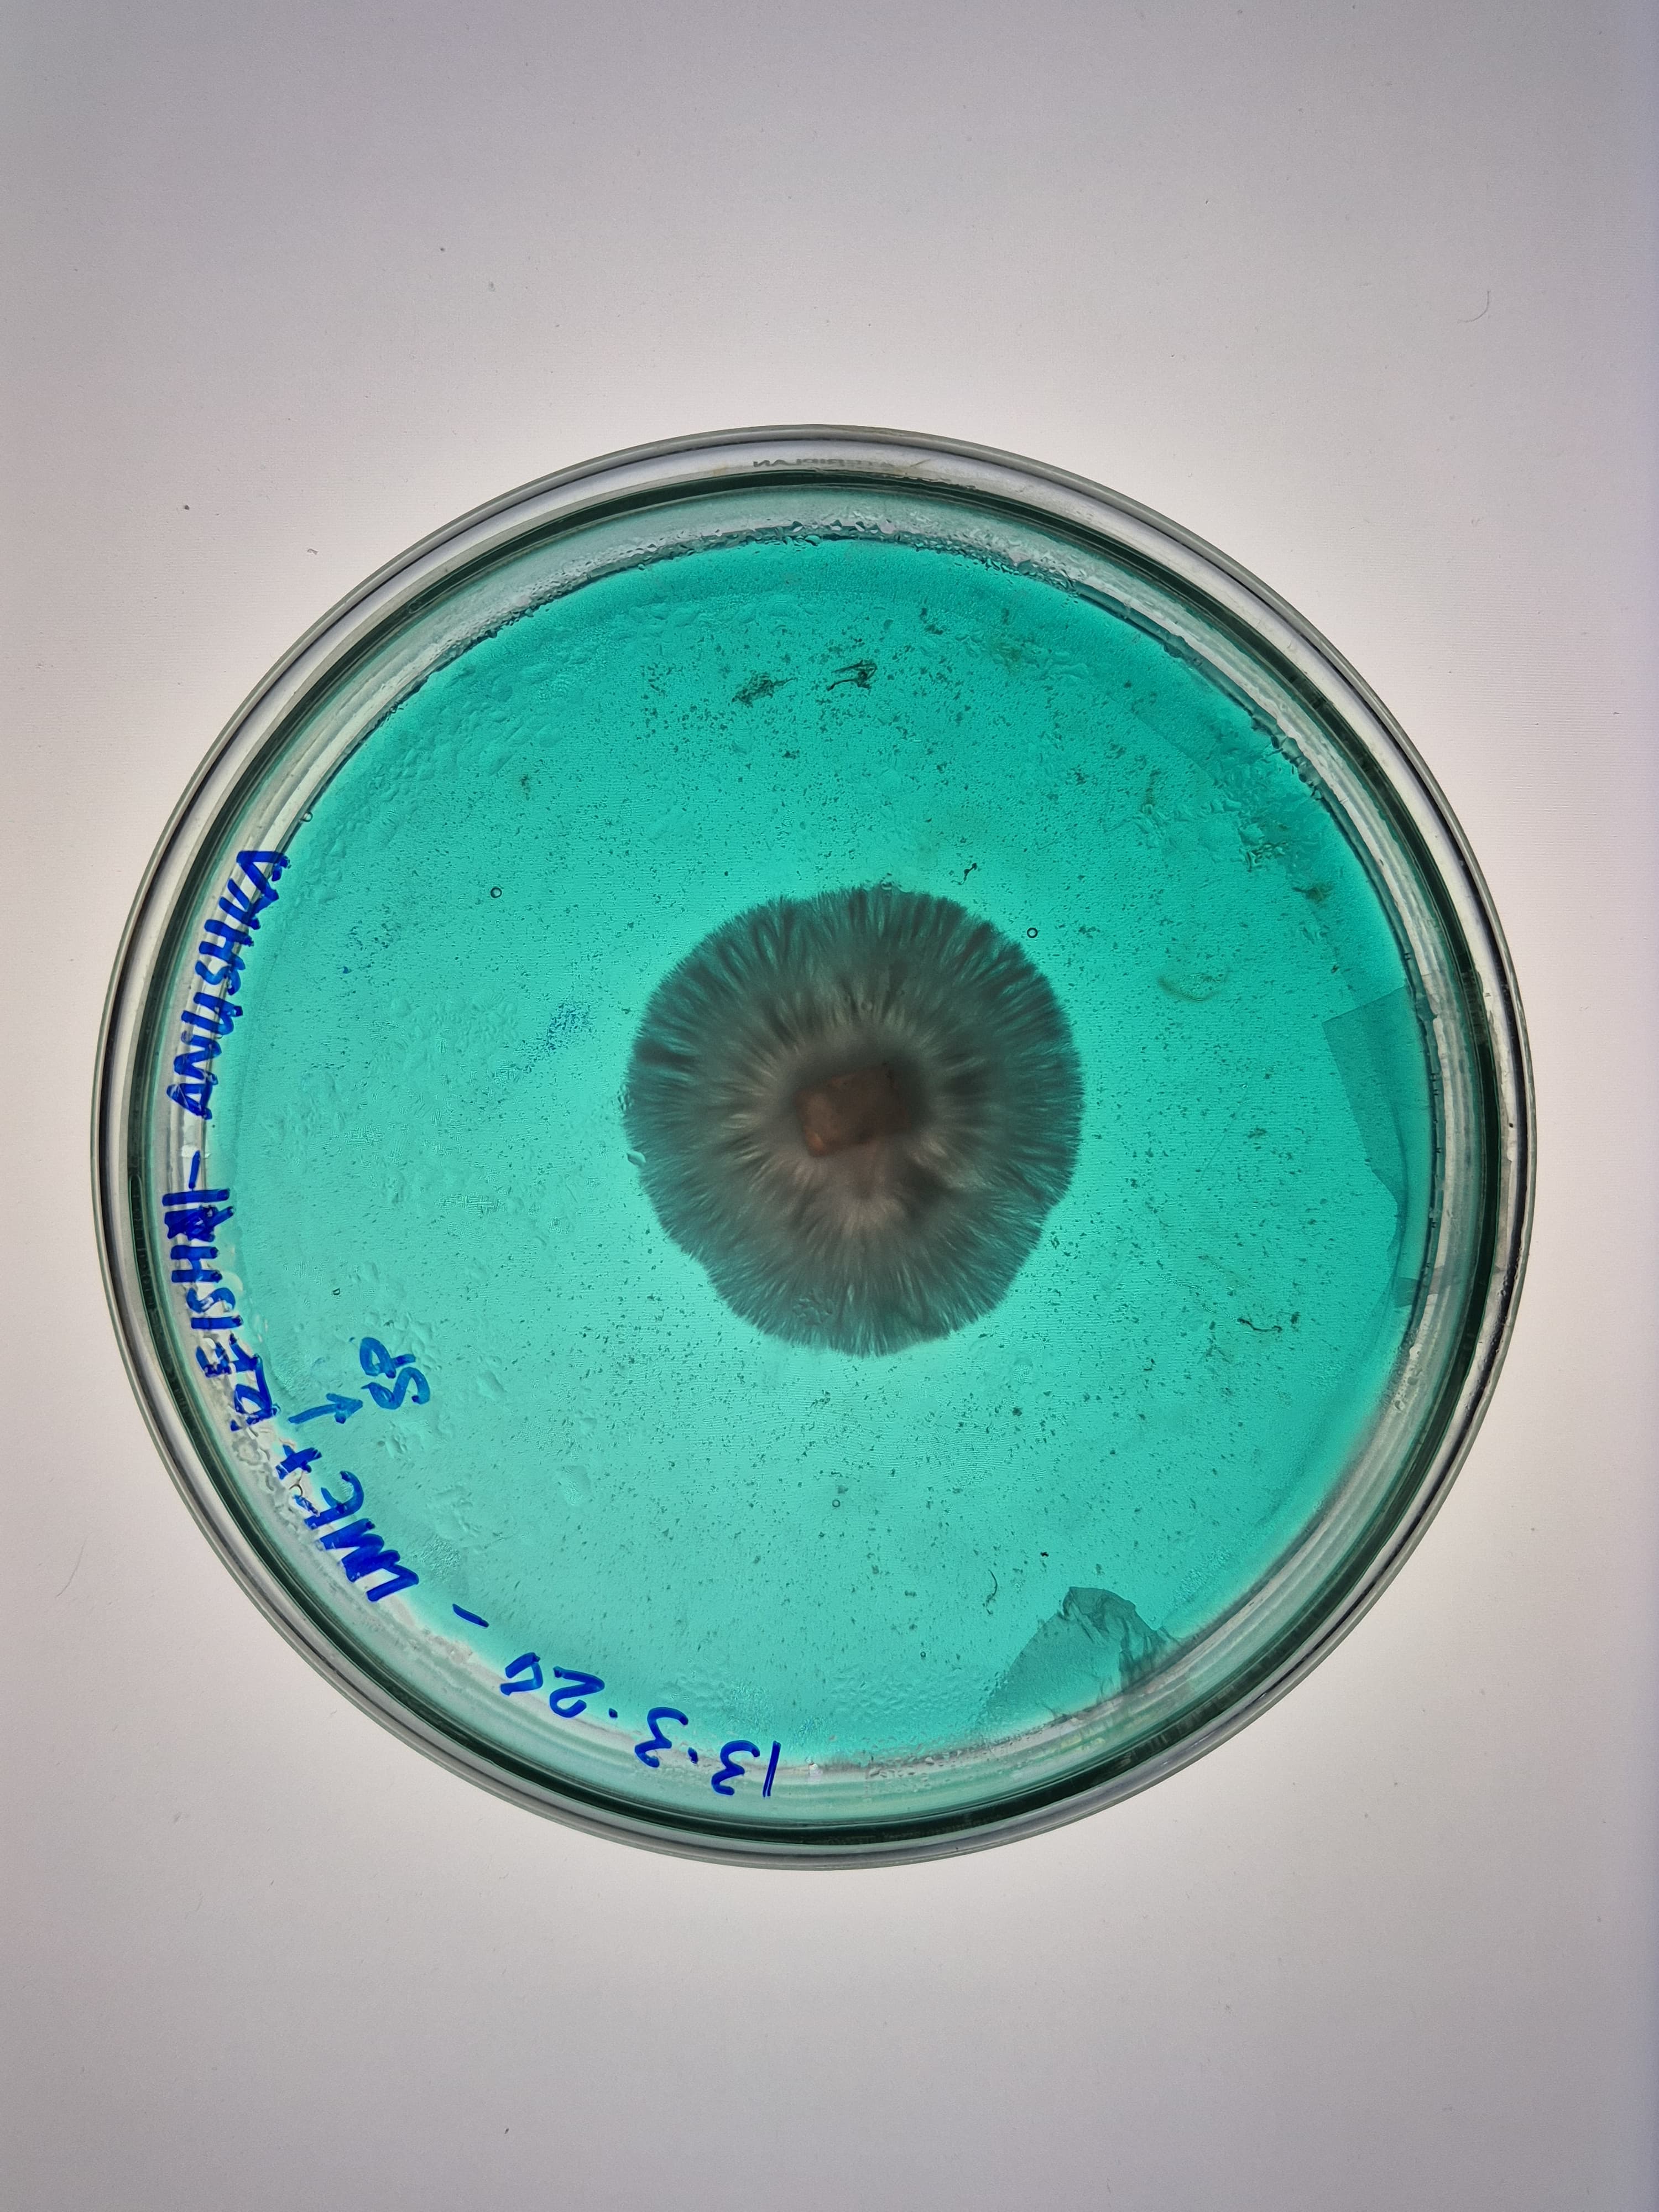
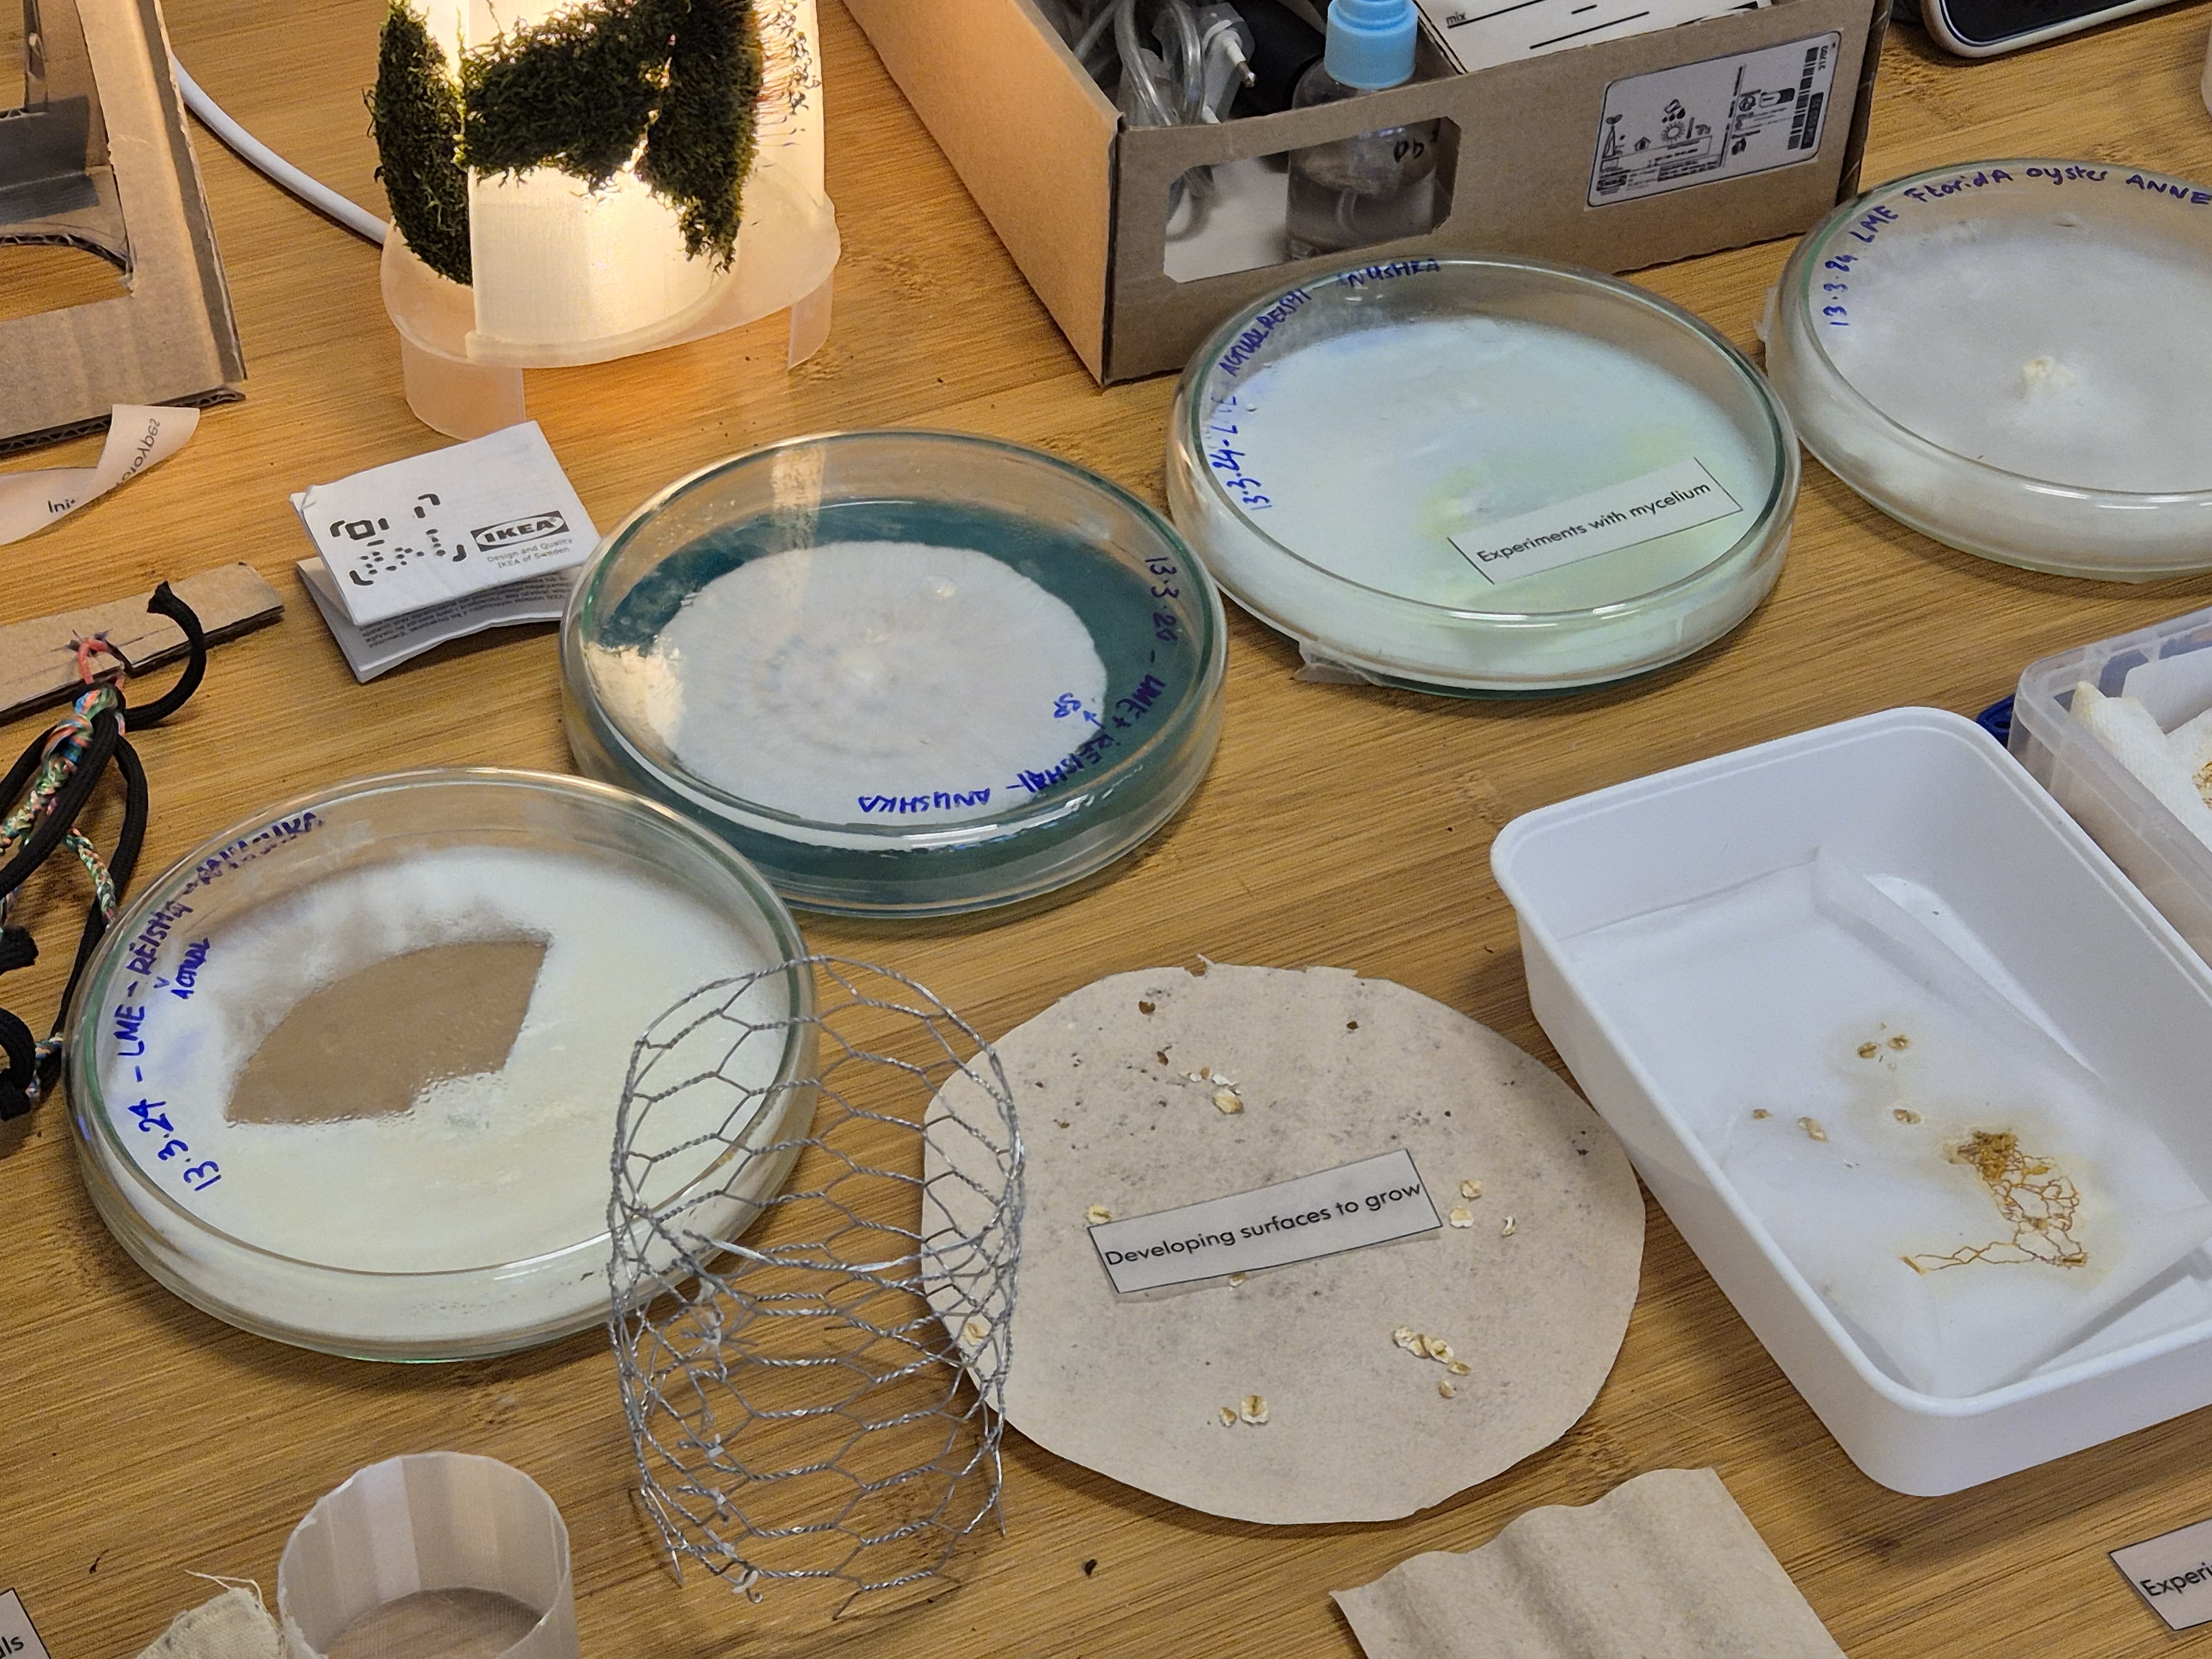
Here are some samples of mycelium I grew in 2024. The strains used are reishi and florida oyester mushroom strains.
Mycelium composites are biodegradable, grown on agricultural waste with no petrochemical inputs, naturally fire-resistant, and thermally insulating. Mycelium leather avoids tanning chemicals and animal welfare concerns, and unlike synthetic PU leather it does not shed microplastics.
Disadvantages: the material must be heat-killed at the end of growth to stop fungal activity, causing dehydration and shrinkage that can warp precision shapes. Moisture resistance is limited without coatings. The growth process is sensitive to contamination. And mechanical properties like tensile strength still fall short of high-performance synthetics.
What might you want to genetically engineer fungi to do and why? What are the advantages of doing synthetic biology in fungi as opposed to bacteria?
The most impactful engineering target is producing complex therapeutic glycoproteins that bacteria cannot make correctly. Beyond therapeutics, engineering mycelium to produce chitin fibres with controlled orientation or to express spider silk proteins could yield composites with dramatically improved mechanical properties. Fungi could also be engineered for mycoremediation, bioaccumulating heavy metals from contaminated soil.
Fungi secrete proteins at rates 10 to 1000 times higher than bacteria, survive harsh conditions like low pH and desiccation, and build three-dimensional hyphal networks enabling solid-state fermentation without large water volumes.
Part 3: First DNA Twist Order
Final Project Summary
Project title: Stress-Chromatic Mycelium: Engineering Ganoderma lucidum to Visually Report Mechanical Stress via Indigoidine Biosynthesis
My individual final project engineers Ganoderma lucidum to function as a living mechanical stress reporter. The central hypothesis is that placing the bpsA gene from Streptomyces lavendulae — encoding the non-ribosomal peptide synthetase (~141 kDa) responsible for blue indigoidine pigment production — under the control of the GlSwi6B-responsive GL18134 chitin synthase promoter will drive spatially localized blue pigmentation in hyphal zones experiencing elevated cell wall stress, including mechanical compression. As mycelium-based composites scale into architecture and furniture, no current bio-based structural material can non-destructively report its internal stress history — this project directly addresses that gap.
Insert Sequence Design
The integration construct was designed in Benchling as a linear DNA sequence (8,375 bp total) targeting the G. lucidum leu2 locus by homologous recombination. Episomal vectors were explicitly excluded — they are unreliable in basidiomycetes and genomic integration is the established approach for stable G. lucidum transformation.
Construct name:pGl_bpsA_leu2_integration (renamed from pGl_GL18134_bpsA_integration_8375bp to meet Twist’s 32-character name limit)
Part map:
Part
Length
Source
GL18134 promoter (GlSwi6B-responsive)
500 bp
AGAX01000194.1:11986–12485; FIMO-confirmed CGCGAAA SCB motif at p = 5.35×10⁻⁵
bpsA codon-optimized
3,849 bp
AB240063, JCat optimized for S. cerevisiae codon tables (CAI = 0.860, GC = 44.2%)
bpsA and Sfp PPTase were both codon-optimized using JCat with S. cerevisiae codon usage tables. G. lucidum was not available as a codon optimization host in either Twist’s tool or JCat; S. cerevisiae was selected as the closest available eukaryotic reference with published functional bpsA expression precedent (Wehrse et al., 2018). This substitution is a documented limitation flagged for iterative optimization in Aim 2.
Backbone Vector
Backbone vector: pTwist Amp High Copy — selected for E. coli propagation before fungal transformation. Before G. lucidum transformation, the plasmid is linearized by restriction digest within one homology arm; the backbone does not integrate into the fungus.
Google Form Submission
I submitted the Google Form with draft Aim 1, project summary, and shared Benchling folder link. Industry council selections prioritized: Twist Bioscience, MycoWorks, BioFabricate, and Ginkgo Bioworks — all directly relevant to the stress-chromatic mycelium composite application.
1. Explain the main advantages of cell-free protein synthesis over traditional in vivo methods, specifically in terms of flexibility and control over experimental variables. Name at least two cases where cell-free expression is more beneficial than cell production.
Cell-free protein synthesis gives you a level of control over the reaction
environment that you simply cannot get when working inside a living cell.
Because there’s no cell membrane, you can directly add or remove
components, adjust concentrations in real time, and introduce molecules
that would be toxic to a living cell without worrying about killing your
chassis. You also get direct access to the product without needing to
lyse cells or purify through layers of cellular debris.
Two cases where cell-free is better than cell-based production is
MS2 L-protein punches holes in membranes and kills bacteria, you can’t
reasonably produce it inside a living E. coli because it would lyse its
own host before you getting meaningful yield. Cell-free lets you synthesize
toxic protein in a controlled environment without that problem. It also lets you iterate and test on dozens of variants quickly.
2. Describe the main components of a cell-free expression system and explain the role of each component.
A cell-free expression system is essentially the inside of a cell,
extracted and reconstituted in a tube. It conssits of:
Cell extract: This is the ‘machinery’ containing ribosomes,
translation factors, chaperones, and all the machinery needed to read
an mRNA and assemble a protein.
DNA template or mRNA: This is what you want expressed. You can add
a plasmid, linear PCR product, or pre-transcribed mRNA depending on
whether you want transcription to happen in the reaction or not.
RNA polymerase: Needed if you’re starting from DNA typically T7
RNAP is added for prokaryotic systems since it’s fast and highly
processive.
Amino acids: The building blocks. You supply all 20 at defined
concentrations so the ribosomes have raw material.
Energy regeneration system: ATP is consumed rapidly during
translation. You need a system to regenerate it typically
phosphocreatine + creatine kinase, or PEP (phosphoenolpyruvate).
3. Why is energy provision regeneration critical in cell-free systems? Describe a method you could use to ensure continuous ATP supply in your cell-free experiment.
Energy regeneration is critical because translation is ATP-
intensive. The cell-free reaction has a finite supply, and without regeneration the reaction stalls within minutes.
The most common approach is the phosphocreatine/creatine kinase system that catalyzes the transfer of a phosphate group from phosphocreatine to ADP, regenerating ATP. This is simple to add and works well for reactions up to a few hours.
4. Compare prokaryotic versus eukaryotic cell-free expression systems. Choose a protein to produce in each system and explain why.
Prokaryotic cell-free systems (E. coli-based) are faster to prepare,
cheaper, and give higher yields for most simple proteins. The extract is
easy to make in bulk and the system is well characterized. I’d use it to
produce the MS2 L-protein, its natural context is E. coli, all the relevant chaperones are present in the E. coli extract, and I need high yield quickly for membrane insertion assays.
Eukaryotic systems are needed when your protein requires post-translational modifications like glycosylation, disulfide bond formation in the ER, or mammalian-specific folding chaperones. I’d use a mammalian cell-free system to produce
human SOD1 it’s a cytosolic metalloenzyme that requires proper
copper and zinc cofactor loading, and its folding energetics in the A4V
mutant form are already perturbed, so having the right chaperone
environment matters.
5. How would you design a cell-free experiment to optimize the expression of a membrane protein? Discuss the challenges and how you would address them in your setup.
Membrane proteins are the hardest class to express in cell-free systems
because they’re hydrophobic and aggregate instantly in aqueous solution
without a membrane to insert into. The key is to provide a hydrophobic
environment during synthesis.
I would design the experiment as follows: use an E. coli-based cell-free
system supplemented with nanodiscs or liposomes added directly to the
reaction so the protein co-translationally inserts into a lipid bilayer
as it comes off the ribosome. For the L-protein specifically, I’d prepare
nanodiscs made from POPC and MSP1D1 scaffold protein, add them at ~0.2 mg/mL
to the cell-free reaction, and run the reaction to slow translation slightly and give the protein more time to fold beforethe next ribosome catches up.
The main challenges are: (1) aggregation before membrane insertion
addressed by pre-adding nanodiscs before starting transcription; (2) low
yield because hydrophobic proteins titrate out ribosomes, addressed by
using a PURE system where you have more control over ribosome
concentration; (3) confirming proper insertion addressed by running a
protease protection assay where correctly inserted protein is shielded
from externally added proteinase K.
6. Imagine you observe a low yield of your target protein in a cell-free system. Describe three possible reasons for this and suggest a troubleshooting strategy for each.
Reason 1: The genetic template isn’t intact or there isn’t enough of it.
The machinery can only build what it can read. If the DNA or RNA blueprint
has degraded, or if there simply isn’t enough of it in the reaction, the
output will be low no matter how healthy everything else is. To fix this,
I’d first verify the quality and quantity of my template before adding it
to the reaction. If the instructions are broken, no amount of tweaking
elsewhere will help. I’d also protect the template from being destroyed
mid-reaction by adding agents that block the enzymes responsible for
degrading nucleic acids.
Reason 2: The energy or building blocks ran out.
Protein synthesis is energy-hungry, and a cell-free reaction
has a fixed starting supply. Once it is exhausted, the machinery stops,
even if everything else is fine. Similarly, if the amino acid pool gets
depleted partway through, the ribosomes stall. To troubleshoot this, I’d
make sure the reaction includes an energy regeneration system so the fuel
gets continuously recycled rather than just consumed, and I’d check that
all twenty amino acids are present and well-supplied throughout the
reaction.
Reason 3: The reaction environment isn’t right for this particular protein.
The chemical conditions inside the tube things like salt balance and
pH affect how well the machinery functions and whether the protein folds
correctly after being made. A protein that misfolds immediately gets
flagged and broken down, so even if translation is happening, the yield
of intact product stays low. I’d troubleshoot this by running a small
set of test reactions where I vary the buffer conditions slightly and see
which environment gives the best result for my specific protein, rather
than assuming the default conditions work for everything.
Homework Question from Kate Adamala
1. Function
a. What would your synthetic cell do? What is the input and what is
the output?
My synthetic cell would act as a targeted antibiotic delivery vesicle
for treating antibiotic-resistant bacterial infections. The input is a
specific lipopolysaccharide (LPS) signature from a pathogenic gram-negative
bacterium (e.g. K. pneumoniae). The output is localized release of a
pore-forming peptide payload directly at the bacterial surface, lysing
the pathogen without systemic antibiotic exposure.
b. Could this function be realized by cell-free Tx/Tl alone, without
encapsulation?
No. Without encapsulation, there is no spatial specificity. The
pore-forming peptide would be released everywhere and would be toxic to
host cells as well. Encapsulation is what makes the delivery targeted:
the synthetic cell only releases its payload when it docks onto a
pathogen-specific surface signal.
c. Could this function be realized by a genetically modified natural
cell?
Not easily. A living cell programmed to lyse bacteria would face serious
immune clearance, regulatory hurdles, and the risk of horizontal gene
transfer to other organisms. A synthetic minimal cell is non-replicating,
non-living, and therefore much safer and more controllable.
d. Describe the desired outcome of your synthetic cell operation.
When the synthetic cell encounters a K. pneumoniae surface, a LPS-sensing
aptamer on the membrane surface triggers expression of a pore-forming
peptide (colistin mimetic) from the encapsulated Tx/Tl system. The peptide
inserts into the bacterial membrane, causing lysis specifically at the site
of infection, while host mammalian cells which lack LPS are untouched.
2. Component Design
a. What would the membrane be made of?
POPC (1-palmitoyl-2-oleoyl-sn-glycero-3-phosphocholine) as the main
structural lipid, supplemented with 30% cholesterol for membrane stability,
and 5% DSPE-PEG2000 for steric stabilization and extended circulation
time in biological fluids. The LPS-sensing aptamer would be conjugated to
DSPE-PEG-maleimide on the outer leaflet.
b. What would you encapsulate inside?
Bacterial cell-free Tx/Tl system (E. coli S30 extract)
Linear DNA template encoding the pore-forming peptide under a T7
promoter with an aptazyme riboswitch responsive to LPS
ATP regeneration mix (phosphocreatine + creatine kinase)
All 20 amino acids at standard PURE system concentrations
Mg²⁺ optimized to 8 mM
c. Which organism will your Tx/Tl system come from?
Bacterial (E. coli S30 extract) — this is sufficient because the trigger
is an aptazyme riboswitch, which works in bacterial Tx/Tl. No mammalian
promoter system is needed since I’m not using Tet-ON or similar
mammalian-specific inducible systems.
d. How will your synthetic cell communicate with the environment?
The LPS signal is detected by a surface-conjugated aptamer that, upon
binding, triggers local membrane destabilization — releasing the Tx/Tl
system contents or initiating fusion with the bacterial outer membrane.
The pore-forming peptide produced inside the synthetic cell is
hydrophobic enough to insert directly into the adjacent bacterial membrane
upon release, without needing a dedicated membrane channel for export.
3. Experimental Details
a. List all lipids and genes:
Lipids:
POPC (main bilayer)
Cholesterol (30 mol%)
DSPE-PEG2000-maleimide (5 mol%, for aptamer conjugation)
Genes:
Pore-forming peptide gene: synthetic codon-optimized gene encoding
Magainin-2 (a well-characterized antimicrobial peptide) under T7
promoter, with an LPS-responsive aptazyme (based on the
OxyS aptazyme scaffold) in the 5’ UTR
T7 RNA polymerase gene: for transcription of the peptide gene inside
the vesicle
Aptamer: LPS-binding aptamer sequence (Johnson et al., 2008, derived from
SELEX against LPS from E. coli O111:B4) conjugated to DSPE-PEG-maleimide
via thiol chemistry.
b. How will you measure the function of your system?
Primary readout: mix synthetic cells with K. pneumoniae in liquid culture
and measure optical density at 600 nm over 6 hours a drop in OD600
indicates bacterial lysis. Secondary readout: add SYTOX Green (a membrane-
impermeant DNA dye) to the co-culture. If bacteria are lysed, SYTOX
enters and fluorescence increases, which can be quantified by plate reader
or flow cytometry.
Homework Question from Peter Nguyen
Field chosen: Architecture
One-sentence pitch:
A building facade material embedded with dormant slime mould networks
and freeze-dried cell-free reporters that together map and visually
display real-time moisture stress, structural load distribution, and
ventilation dead zones across a building’s surface thereby turning the wall
itself into a living diagnostic instrument.
How it works:
Slime mould (Physarum polycephalum) is a remarkable organism that
naturally grows its network along paths of least resistance, optimises
for efficient transport between nodes, and retreats from dry or
chemically hostile zones. These are exactly the same problems a building
faces: where is moisture accumulating behind cladding? Where are thermal
bridges concentrating stress? Where is air circulation failing?
The material would work in two layers. The first is a slime mould
network layer a thin hydrogel matrix embedded in the interior face
of a facade panel, seeded with dormant freeze-dried Physarum. When
humidity inside the wall cavity rises above a threshold (indicating
moisture ingress, condensation, or a failing vapour barrier), the
slime mould rehydrates and begins growing. Because Physarum
preferentially colonises humid corridors and avoids dry zones, its
network topology after 24–48 hours of growth literally traces the
moisture distribution map of that wall section — the densest growth
appears where the problem is worst.
The second layer is a freeze-dried cell-free biosensor layer sitting
just inside the visible surface of the panel. As the slime mould
network grows, it releases metabolic byproducts specifically
extracellular ATP and changes in local pH that diffuse into the
cell-free layer. These chemical signals activate a riboswitch in the
encapsulated Tx/Tl system, driving expression of a pigment or
structural protein that causes a visible color shift on the panel’s
surface. The wall literally marks its own problem zones in a colour
visible from outside, without any wiring, sensors, or power supply.
When the moisture problem is resolved and the wall dries out, Physarum
desiccates back into its dormant spore state, the cell-free reaction
stops (no more trigger signal), and the panel resets, ready to respond
again if the problem returns. Multiple panels across a facade create a
distributed, self-reporting moisture map of the entire building skin.
Societal challenge addressed:
Hidden moisture damage is one of the most expensive and dangerous
failure modes in construction. It causes structural rot, mould growth,
and insulation failure, and it is almost always detected too late because
it is invisible until the damage is severe. Current monitoring requires
either invasive physical inspection or expensive embedded electronic
sensor networks that need power, maintenance, and replacement. A
passive biological system that self-activates, self-maps, and self-resets
would give architects and building managers a continuous, maintenance-free
diagnostic layer in the fabric of the building itself is particularly
valuable in social housing, schools, and infrastructure in lower-resource
settings where sensor networks are not economically viable.
Addressing cell-free limitations:
The one-time-use limitation is turned into a feature here. Each
activation event corresponds to a real moisture event, and the system
resetting when conditions improve means the panel is always ready for
the next event rather than giving a permanent false positive. Stability
is handled by the slime mould’s own biology by naturally
encysting into desiccation-resistant sclerotia when dry, which can
survive years without nutrients, and the freeze-dried cell-free layer
sits dormant in the same conditions. Activation is not by externally
added water but by the building’s own pathological moisture. The system only triggers when there is a genuine problem, not from rain on the outer surface or ambient humidity fluctuations. The spatial resolution of the diagnostic comes for free from Physarum’s network growth dynamics.
Homework Question from Ally Huang
Using BioBits® Cell-Free Protein Expression System
1. Background
Astronauts on long-duration missions experience significant immune
dysregulation, including reduced lymphocyte function and increased
susceptibility to latent viral reactivation. In space, standard
laboratory-based immune monitoring is completely out of reach. Early
detection of immune stress markers is critical for crew health,
especially on future Mars missions where communication delays make
real-time Earth-based medical support impossible. A lightweight,
freeze-dried diagnostic system that can be activated on demand would
directly address this gap.
2. Molecular Target
Interleukin-6 (IL-6) mRNA — an early biomarker of systemic immune
activation, inflammation, and viral reactivation in astronauts.
3. How the target relates to the challenge
IL-6 spikes within hours of infection or physiological stress and has
been documented at elevated levels in astronaut blood samples linked to
latent herpesvirus reactivation during ISS missions. Detecting IL-6 mRNA
using a cell-free toehold switch biosensor gives real-time immune status
information without cold-chain reagents, trained personnel, or
centrifuges.
4. Hypothesis
I hypothesize that a freeze-dried BioBits cell-free expression system
programmed with an IL-6 mRNA-responsive toehold switch will reliably
detect elevated IL-6 transcript levels aboard the ISS, producing a
fluorescent output measurable by the P51 Molecular Fluorescence Viewer.
The toehold switch keeps the ribosome binding site sequestered in a
hairpin until the target IL-6 mRNA binds and unfolds it, triggering
translation of sfGFP. A visible fluorescence signal indicates immune
activation. The system will be validated against known IL-6 concentration
standards before flight.
5. Experimental Plan
Freeze-dried BioBits pellets will be rehydrated with a small whole blood
lysate sample from crew members at pre-flight, mid-mission, and
post-flight timepoints. The miniPCR thermal cycler will maintain isothermal
incubation conditions, and fluorescence will be read on the P51 viewer.
Controls include a synthetic IL-6 mRNA positive control and a buffer-only
negative control. Fluorescence presence or absence relative to a set
threshold identifies immune activation events across mission timepoints.
Part B: Individual Final Project
Project Selection
I submitted the Final Project selection form and placed my project slide in the Committed Listener final project slide deck.
Project title: MycoTint - Stress-Chromatic Mycelium: Engineering Ganoderma lucidum to Visually Report Mechanical Stress via Indigoidine Biosynthesis
One-sentence summary: I am engineering Ganoderma lucidum to couple its cell wall integrity (CWI) signaling pathway to heterologous indigoidine (bpsA) biosynthesis, so that mycelium composite panels permanently record internal mechanical stress history as visible blue pigmentation, enabling non-destructive structural diagnostics in bio-based architecture without instrumentation.
Aim 1
Design and order a genomic-integration construct (pGl_bpsA_leu2_integration, 8,375 bp) encoding bpsA from Streptomyces lavendulae under the GlSwi6B-responsive GL18134 chitin synthase promoter, co-expressed with a constitutively expressed Sfp PPTase cassette, flanked by homology arms targeting the G. lucidum leu2 locus. Transform into G. lucidum protoplasts via PEG-mediated transformation. Apply mechanical compression, osmotic stress (1 M sorbitol), and heat stress (37°C) as parallel conditions, then measure indigoidine production by absorbance at 590 nm on the Spark Plate Reader to determine whether mechanical compression produces a statistically distinct indigoidine signal (≥1.5-fold, p < 0.05) relative to other CWI-activating stressors.
Workflow: Design plasmid DNA with protein of interest → Transform bacteria with plasmid DNA → Get many copies of plasmid DNA → Introduction of plasmid DNA to cells
Working in Benchling
After signing in I imported it into Benchling and ran digests for:
EcoRI
HindIII
BamHI
KpnI
EcoRV
SacI
SalI
And then ran digests on SalI, SacI, BamHI, KpnI, EcoRV, BamHI, KpnI, SacI, SalI to create an Elephant! 🐘
Codon optimization is necessary because different organisms use synonymous codons (DNA triplets encoding the same amino acid) at different frequencies. Even if the amino acid sequence is identical, a coding sequence with rare codons for the host organism causes ribosome stalling, reduced translation efficiency, and lower protein yield. By swapping rare codons for frequently used equivalents in the host, we maximize the probability that the host’s tRNA pool can keep up with translation demand.
I optimized the actin sequence for E. coli expression, since it is the most common and accessible bacterial chassis for initial protein production. E. coli is fast-growing, inexpensive to culture, and has well-characterized expression systems, making it the practical choice for early characterization work even though actin is a eukaryotic protein.
I would recommend a plasmid-based cloning approach for initial expression work. The optimized DNA can be inserted into a standard expression plasmid and introduced into E. coli via transformation. Once inside the bacterial cells, the plasmid replicates autonomously, allowing the host machinery to transcribe my DNA into mRNA and subsequently translate it into actin protein. However, since actin is a eukaryotic cytoskeletal protein and my sequence lacks the signal peptides and targeting sequences necessary for membrane localization or secretion, the expressed protein will likely accumulate intracellularly. This necessitates cell lysis and downstream purification via affinity chromatography or other protein separation techniques to isolate and characterize my recombinant actin.
Alternatively, the PURE system (Protein synthesis Using Recombinant Elements) presents a compelling option due to its turnaround time. In this cell-free approach, my DNA template is incubated with a defined set of recombinant enzymes and cellular extracts that provide the necessary transcriptional and translational machinery. This in vitro reaction proceeds rapidly without the overhead of maintaining living cells, generating my actin protein directly in the reaction mixture. The resulting product must subsequently be purified via affinity chromatography to obtain homogeneous, functional protein suitable for downstream biochemical investigations.
Part 4: Twist DNA Synthesis Order
I used GFP (from Aequorea victoria, UniProt P42212) as my synthesis target, as it is a useful fluorescent reporter for tracking actin dynamics in Physarum polycephalum tubes. Physarum polycephalum has actin and myosin predominantly, and to understand the movements within the Physarum tubes, fluorescence can help visualize protein dynamics.
Protein sequence (UniProt):
sp|P42212|GFP_AEQVI Green fluorescent protein OS=Aequorea victoria OX=6100 GN=GFP PE=1 SV=1
MSKGEELFTGVVPILVELDGDVNGHKFSVSGEGEGDATYGKLTLKFICTTGKLPVPWPTL
VTTFSYGVQCFSRYPDHMKQHDFFKSAMPEGYVQERTIFFKDDGNYKTRAEVKFEGDTLV
NRIELKGIDFKEDGNILGHKLEYNYNSHNVYIMADKQKNGIKVNFKIRHNIEDGSVQLAD
HYQQNTPIGDGPVLLPDNHYLSTQSALSKDPNEKRDHMVLLEFVTAAGITHGMDELYK
Reverse translated DNA sequence:
reverse translation of sp|P42212|GFP_AEQVI to a 714 base sequence using https://www.bioinformatics.org/sms2/rev_trans.html
atgagcaaaggcgaagaactgtttaccggcgtggtgccgattctggtggaactggatggc
gatgtgaacggccataaatttagcgtgagcggcgaaggcgaaggcgatgcgacctatggc
aaactgaccctgaaatttatttgcaccaccggcaaactgccggtgccgtggccgaccctg
gtgaccacctttagctatggcgtgcagtgctttagccgctatccggatcatatgaaacag
catgatttttttaaaagcgcgatgccggaaggctatgtgcaggaacgcaccatttttttt
aaagatgatggcaactataaaacccgcgcggaagtgaaatttgaaggcgataccctggtg
aaccgcattgaactgaaaggcattgattttaaagaagatggcaacattctgggccataaa
ctggaatataactataacagccataacgtgtatattatggcggataaacagaaaaacggc
attaaagtgaactttaaaattcgccataacattgaagatggcagcgtgcagctggcggat
cattatcagcagaacaccccgattggcgatggcccggtgctgctgccggataaccattat
ctgagcacccagagcgcgctgagcaaagatccgaacgaaaaacgcgatcatatggtgctg
ctggaatttgtgaccgcggcgggcattacccatggcatggatgaactgtataaa
On Twist, I selected Genes → Clonal Genes and uploaded the FASTA file of my expression cassette. I selected pTwist Amp High Copy as the cloning vector (Ampicillin resistance, high copy origin). I downloaded the full construct as a GenBank file and re-imported it into Benchling to view the complete plasmid map.
[Screenshot of Twist order screen and Benchling plasmid map]
Part 5: DNA Read / Write / Edit
5.1 DNA Read
(i) What DNA would I want to sequence and why?
I would want to sequence the genome of wild-type Physarum polycephalum and compare it against my engineered strain expressing tyrosinase/laccase-type oxidase. Sequencing would allow me to confirm the insertion site, verify no off-target integrations have occurred, and monitor for any spontaneous mutations that emerge over passages. This is directly relevant to the biosafety goals outlined in Week 1 — tracking genomic stability of the GMO is essential to ensuring the narrow functional envelope I described there.
(ii) Sequencing technology: Nanopore long-read sequencing (Oxford Nanopore Technologies)
Generation: Third-generation sequencing. Nanopore reads single DNA molecules directly without PCR amplification, enabling very long reads (tens of kilobases), which is well suited to assembling the large, complex Physarum genome.
Input & preparation: Genomic DNA extracted from the plasmodium, end-repaired and adapter-ligated using a ligation sequencing kit. No fragmentation is needed for long-read mode.
Essential steps & base calling: DNA strands are driven through protein nanopores by an applied voltage. As each base translocates, it causes a characteristic disruption in ionic current. A neural-network basecaller (e.g., Dorado) converts the current signal into a nucleotide sequence.
Output: Long-read FASTQ files, assembled into a draft genome or aligned to a reference for variant and insertion-site calling.
5.2 DNA Write
(i) What DNA would I want to synthesize and why?
I would synthesize the expression cassette for tyrosinase fused to a secretion signal peptide, optimized for expression in Physarum polycephalum. This is the core genetic payload for my dyeing application — the enzyme needs to be secreted into the extracellular slime trail to catalyze pigment formation on the substrate fabric. The GFP sequence prepared above would also be synthesized as a reporter to co-localize with the enzyme and confirm secretion into the trail.
(ii) Synthesis technology: Phosphoramidite-based gene synthesis (via Twist Bioscience)
Essential steps: Solid-phase synthesis of oligonucleotides (~200 nt max per oligo), followed by error-correction, oligo assembly via overlap extension or Gibson Assembly into the full gene, and sequence verification by Sanger sequencing before delivery.
Limitations: Maximum direct synthesis length is ~200 nt per oligo, so longer genes require assembly of multiple fragments introducing additional error-checking steps. Error rate of approximately 1 in 200 bases per oligo necessitates error-correction. Very GC-rich or repetitive sequences (common in some signal peptide sequences) require special synthesis handling.
5.3 DNA Edit
(i) What DNA would I want to edit and why?
I would edit the Physarum polycephalum genome to knock in the tyrosinase expression cassette at a defined safe-harbor locus — a genomic location where insertion causes no disruption to essential genes. Targeted integration is preferable to plasmid-based expression because it provides stable, heritable expression without plasmid loss over successive growth cycles, which is important for a consumer product where batch-to-batch consistency matters.
(ii) Editing technology: CRISPR-Cas9
How it works: A guide RNA (gRNA) complementary to the target locus directs the Cas9 nuclease to create a double-strand break at a specific site adjacent to a PAM sequence (5’-NGG-3’). The break is repaired via homology-directed repair (HDR) using a donor template containing the tyrosinase expression cassette flanked by homology arms matching the safe-harbor locus.
Preparation & inputs: Design gRNA targeting the safe-harbor locus using Benchling’s CRISPR design tool, synthesize the gRNA, prepare Cas9 protein or plasmid, and construct an HDR donor template with ~500 bp homology arms flanking the insertion site.
Limitations: HDR efficiency in Physarum is not well characterized and may require significant optimization of delivery method (electroporation or lipofection). Off-target cuts remain a concern and require whole-genome sequencing to verify clean edits. PAM site availability constrains the exact targetable positions within the locus.
Week 10 HW: Imaging and Measurement
Final Project: Measurements
Tthe primary measurable output is
indigoidine production by engineered Ganoderma lucidum in response to
mechanical and other stress conditions. The key measurement aspects are:
Indigoidine quantification —
The most direct readout of bpsA expression and BpsA enzyme activity is
the blue pigment indigoidine, which has a peak absorbance at 590 nm. I will
use the Spark Plate Reader to measure absorbance at 590 nm across all stress
conditions (mechanical compression, osmotic, heat, no-stress control) in
384-well format, with a standard curve of purified indigoidine (0–100 µM)
to convert absorbance to concentration. This gives a quantitative measure
of promoter activity under each stress condition and is the primary success
metric for Aim 1.
2. Construct integration verification — Colony PCR + gel electrophoresis
After PEG-mediated transformation of G. lucidum, I will use colony PCR
with one primer outside the leu2 homology arm (genomic) and one inside
bpsA to confirm correct genomic integration. The expected band is ~800 bp.
Gel electrophoresis on a 1.5% agarose gel with ethidium bromide staining
will visualize the PCR product.
3. Single-copy integration confirmation — qPCR (CFX Opus)
Quantitative PCR will compare the copy number of the integrated bpsA gene
relative to a single-copy genomic reference gene, confirming that the
construct has integrated once (not multi-copy tandem insertions that could
confound expression data).
4. Protein-level confirmation — SDS-PAGE and Western blot
If indigoidine production is detected, I will confirm BpsA protein
expression by running total cell lysate on SDS-PAGE (expected band ~141 kDa)
and probing with an anti-His antibody (the construct does not include a
His-tag in the current design — this could be added in Aim 2 for easier
detection).
5. Mass spectrometry (future Aim 2)
If I can purify BpsA from the engineered strain, intact protein LC-MS on a
system like the Waters Xevo G3 QTof would confirm the molecular weight of
the expressed protein and verify it matches the predicted 141 kDa, ruling
out truncation or incorrect translation. Peptide mapping after tryptic
digest would further confirm the primary sequence of the expressed BpsA.
Waters Part I Molecular Weight
Question 1: Based on the predicted amino acid sequence of eGFP (see below) and any known modifications, what is the calculated molecular weight?
Using the ExPASy Compute pI/Mw tool with the provided eGFP sequence
Theoretical MW = 28,006.60 Da
Question 2: Calculate the molecular weight of the eGFP using the adjacent charge state approach described in the recitation.
Using the two adjacent charge state peaks:
Deconvoluted MW ≈ 27,982 Da
Question 3: Can you observe the charge state for the zoomed-in peak in the mass spectrum for the intact eGFP? If yes, what is it? If no, why not?
No, the charge state cannot be determined from the zoomed-in peak. Determining the charge state requires at least two adjacent charge-state peaks so their spacing can be used to calculate $z$. In the zoomed region, only a single isolated peak is shown with no neighboring charge-state peak visible, so there is insufficient information to assign a charge state.
Waters Part III — Peptide Mapping (Primary Structure)
Q1.How many Lysines (K) and Arginines (R) are in eGFP? Please circle or highlight them in the eGFP sequence given in Waters Part I question 1 above.
There are 20 Lysines (K) and 6 Arginines (R) in the eGFP sequence, for a total of 26 cleavage sites.
Q2. How many peptides will be generated from tryptic digestion of eGFP?
Using the PeptideMass tool at https://web.expasy.org/peptide_mass/ with the eGFP sequence, trypsin as enzyme, no missed cleavages, and the parameters shown in Figure 4, the tool generates 19 tryptic peptides.
Q3. Based on the LC-MS data for the Peptide Map data generated in lab (please use Figure 5a as a reference) how many chromatographic peaks do you see in the eGFP peptide map between 0.5 and 6 minutes? You may count all peaks that are >10% relative abundance.
Counting peaks above 10% relative abundance in Figure 5a between 0.5 and
6 minutes, there are approximately 18–20 chromatographic peaks visible
in the total ion chromatogram.
Q4. Assuming all the peaks are peptides, does the number of peaks match the number of peptides predicted from question 2 above? Are there more peaks in the chromatogram or fewer?
Accounting for all peaks the total would be 22, more than the predicted 19 peaks
Q5. Identify the mass-to-charge of the peptide shown in Figure 5b. What is the charge of the most abundant charge state of the peptide (use the separation of the isotopes to determine the charge state). Calculate the mass of the singly charged form of the peptide ([M+H])+ based on its m/z and z.
The singly charged form [M+H]⁺ would have m/z equal to the neutral mass plus one proton:
Q6. Identify the peptide based on comparison to expected masses in the PeptideMass tool. What is mass accuracy of measurement? Please calculate the error in ppm.
Observed peptide mass (MW_experiment): 1050.52438 Da
Theoretical peptide mass (MW_theory): 1050.5214 Da
The mass accuracy is calculated using the absolute difference between experimental and theoretical mass values, normalized to the theoretical mass:
Error in ppm
Final Answer
Observed peptide mass: 1050.52438 Da
Closest predicted peptide mass: 1050.5214 Da
Mass error: 2.84 ppm
Assessment: This error is well below the <10 ppm threshold, indicating excellent measurement accuracy for high-resolution mass spectrometry
Q7. Number of peptides from tryptic digestion
88 percent
Homework: Waters Part IV — Oligomers
The oligomer masses are
7FU Decamer: Mass = 10 x 340 kDa = 3400 kDa (3.4 (MDa))
8FU Didecamer: Mass = 20 x 400 kDa = 8000 kDa (8 (MDa))