Week 5 HW: Protein Design Part II
Human SOD1 sequence MATKAVCVLKGDGPVQGIINFEQKESNGPVKVWGSIKGLTEGLHGFHVHEFGDNTAGCTSAGPHFNPLSRKHGGPKDEERHVGDLGNVTADKDGVADVSIEDSVISLSGDHCIIGRTLVVHEKADDLGKGGNEESTKTGNAGSRLACGVIGIAQ
After adding A4V mutation MATKVVCVLKGDGPVQGIINFEQKESNGPVKVWGSIKGLTEGLHGFHVHEFGDNTAGCTSAGPHFNPLSRKHGGPKDEERHVGDLGNVTADKDGVADVSIEDSVISLSGDHCIIGRTLVVHEKADDLGKGGNEESTKTGNAGSRLACGVIGIAQ
Therefore, produced peptides:
| index | Binder | Pseudo Perplexity |
|---|---|---|
| 1 | WLYVVAAVRWKX | 23.320599604199636 |
| 2 | WRYVAAAAAHKE | 8.96053025308908 |
| 3 | WLYVPAGLALWX | 13.021677157633269 |
| 4 | WLYYVVAVAHKX | 15.430388570774006 |
| 5 | FLYRWLPSRRGG | 11.545571242285833 |
##Part 2: Evaluating Binders with alpha fold3
The alpha fold results for some reason are not loading for me, despite multiple attempst and troubleshooting. Hence the results were analyzed with the help of Claude using PAE matrices
peptide 1 ipTM 0.38
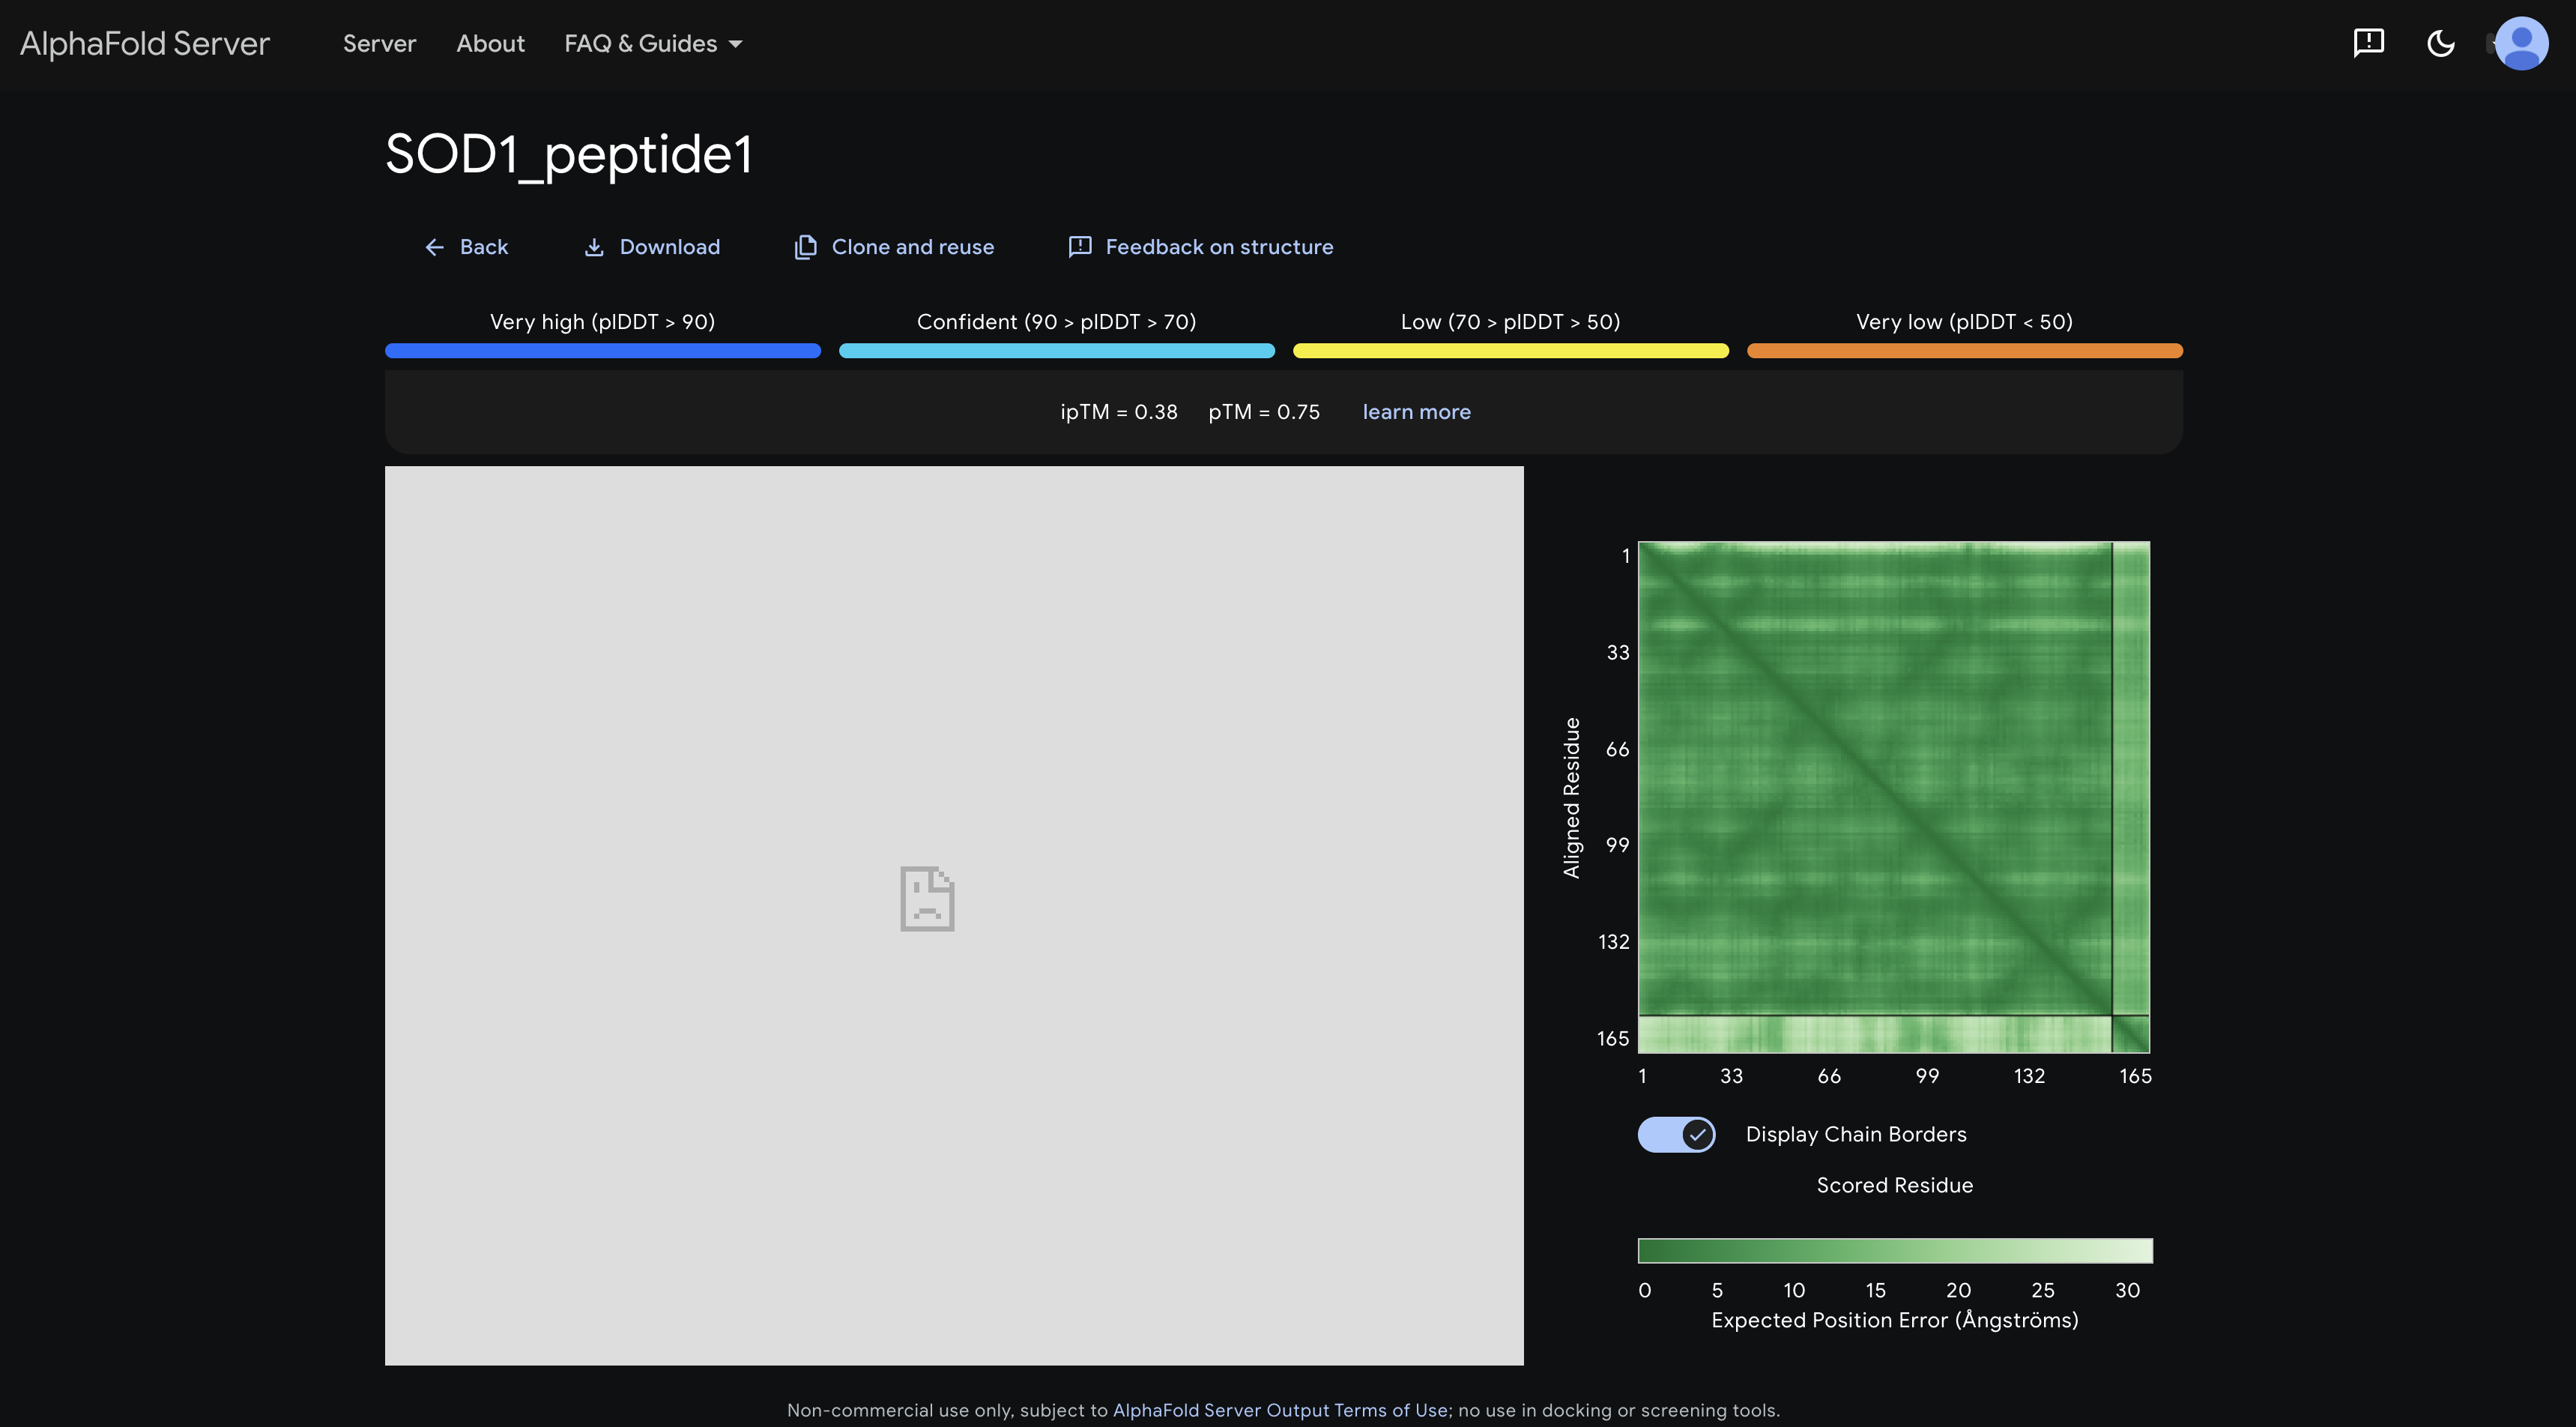 The PAE matrix shows a uniformly mid-green inter-chain strip with no distinct dark patch, indicating no preferred binding site and the peptide appears to be floating without specific engagement.
peptide 2 ipTM 0.35
 The inter-chain strip is mostly light green with a very faint darker region around residues 60–100, suggesting a weak, non-specific affinity toward the β-barrel region, though confidence is low.
peptide 3 ipTM 0.36
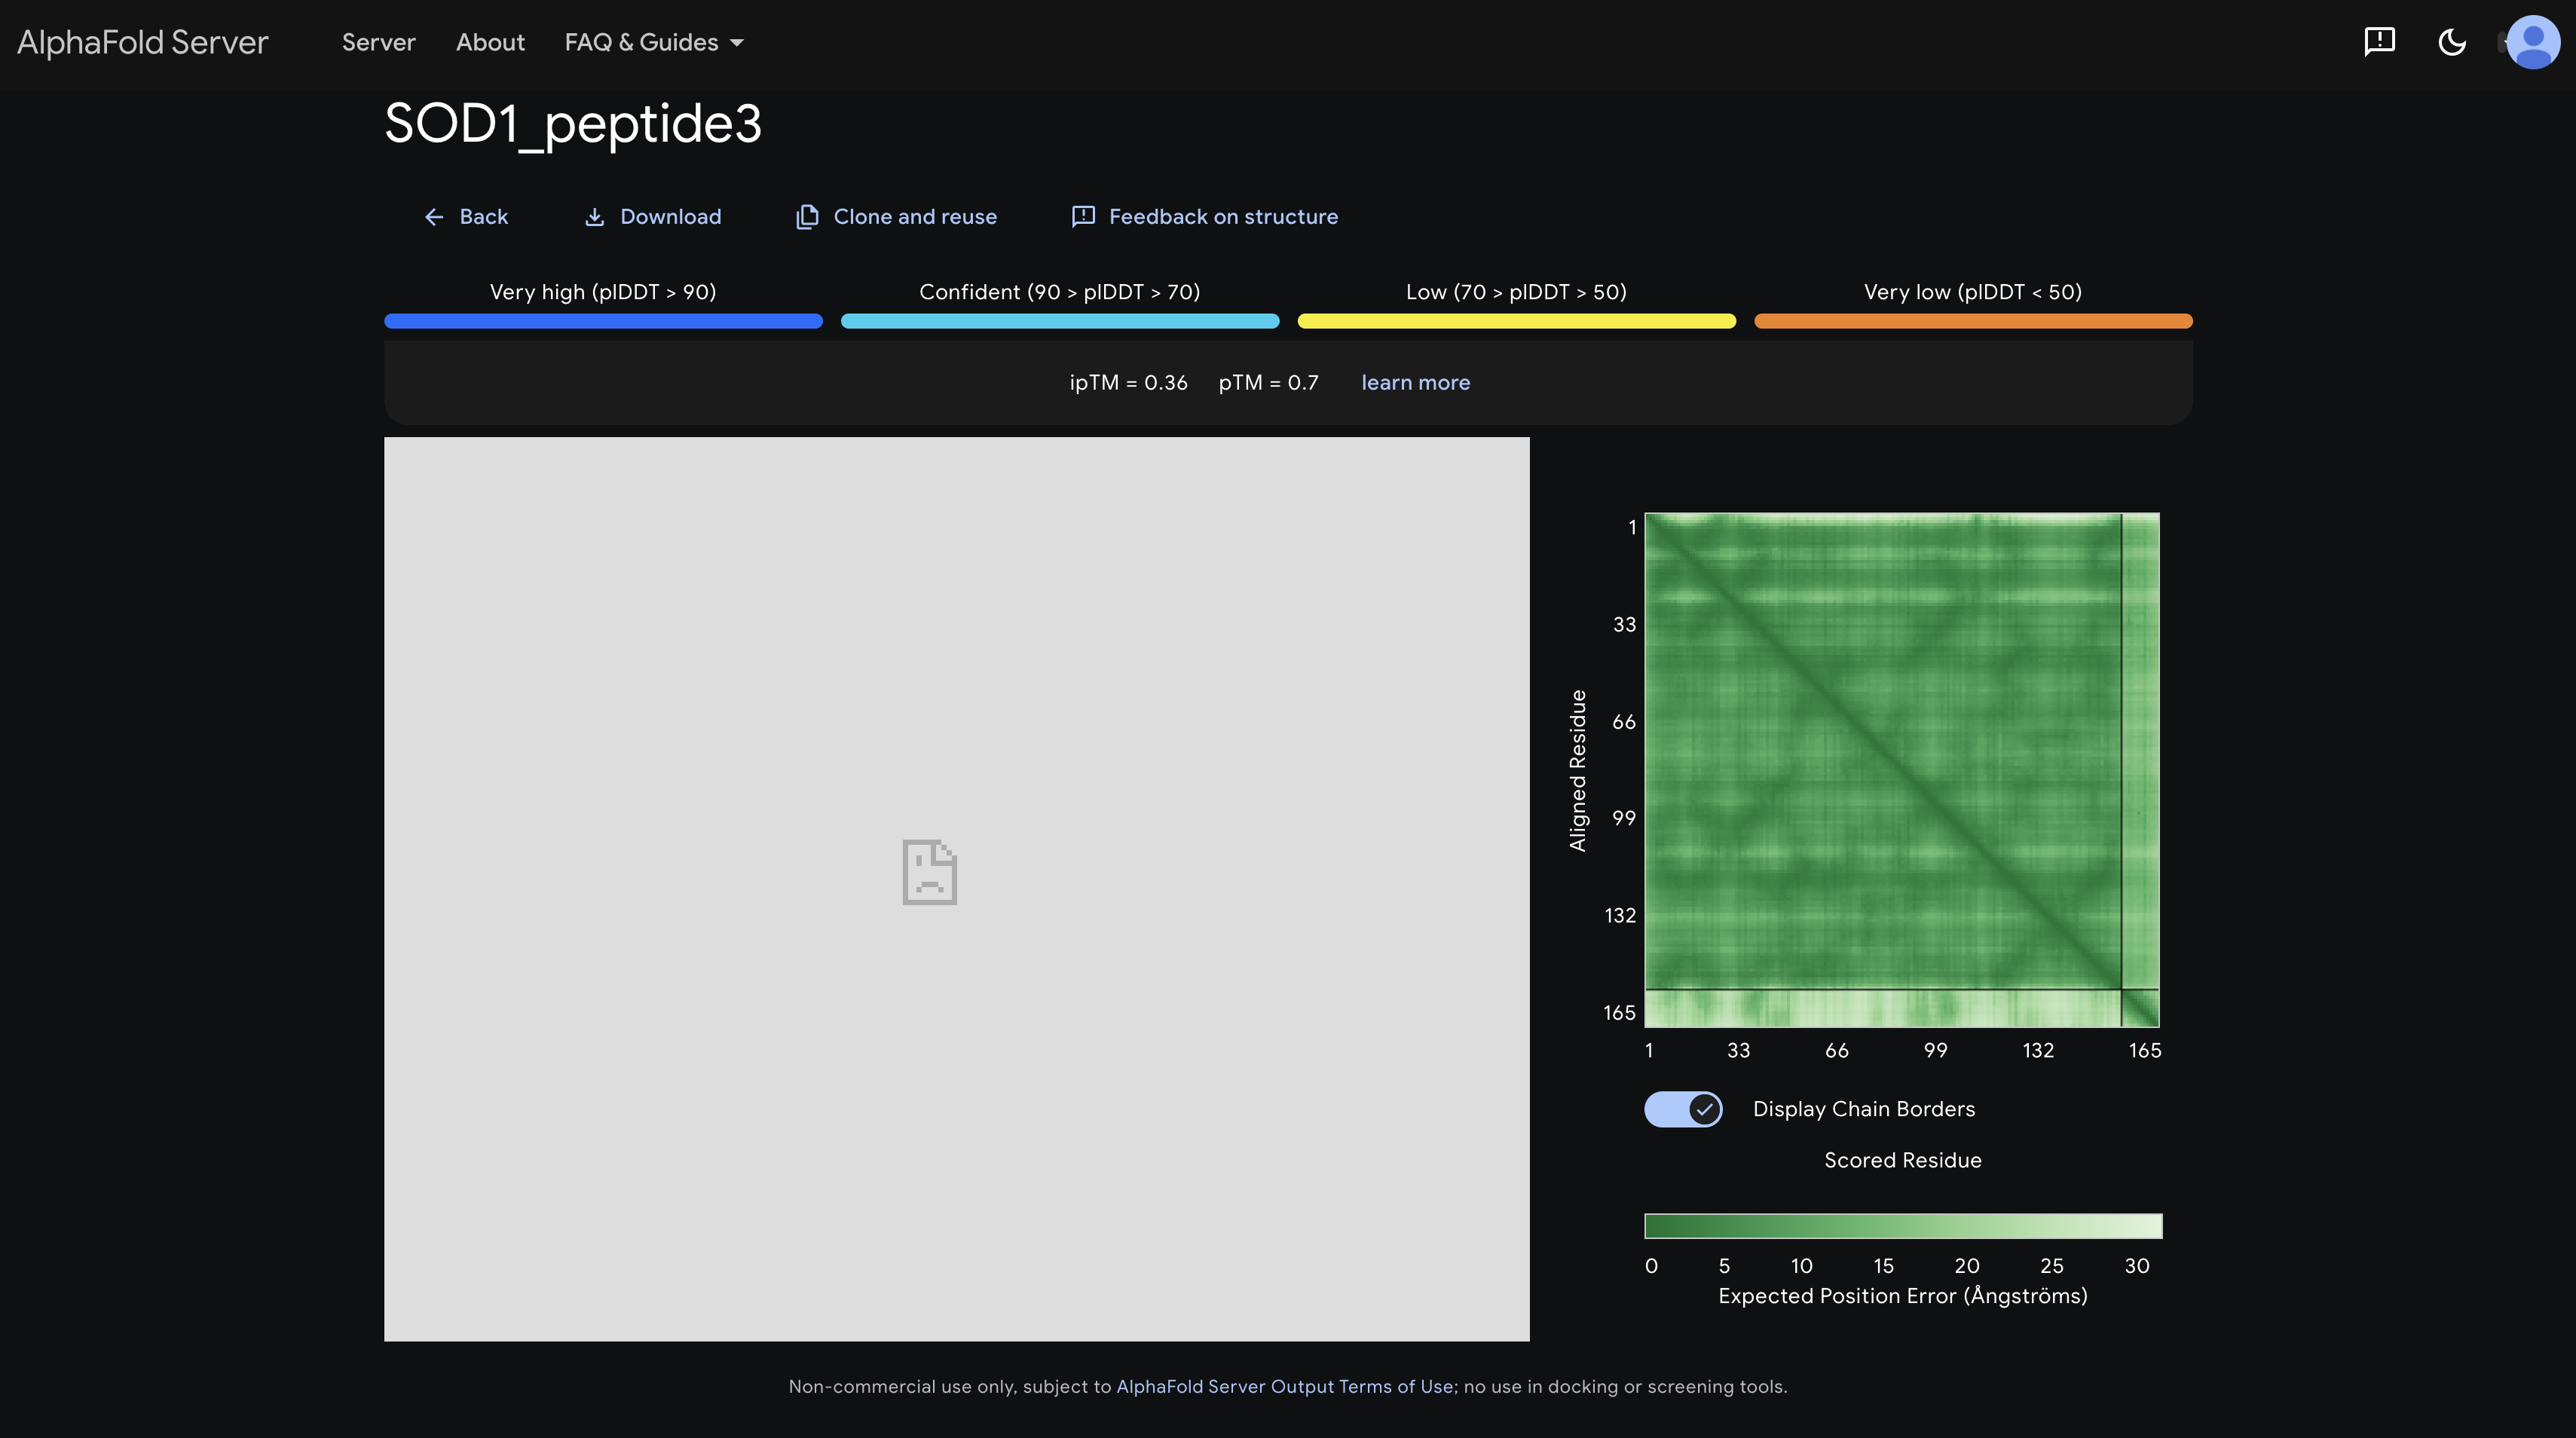 The inter-chain strip is the lightest and most uniform of all five, indicating the highest positional uncertainty. It appears to have the least defined interaction with SOD1.
peptide 4 ipTM 0.37
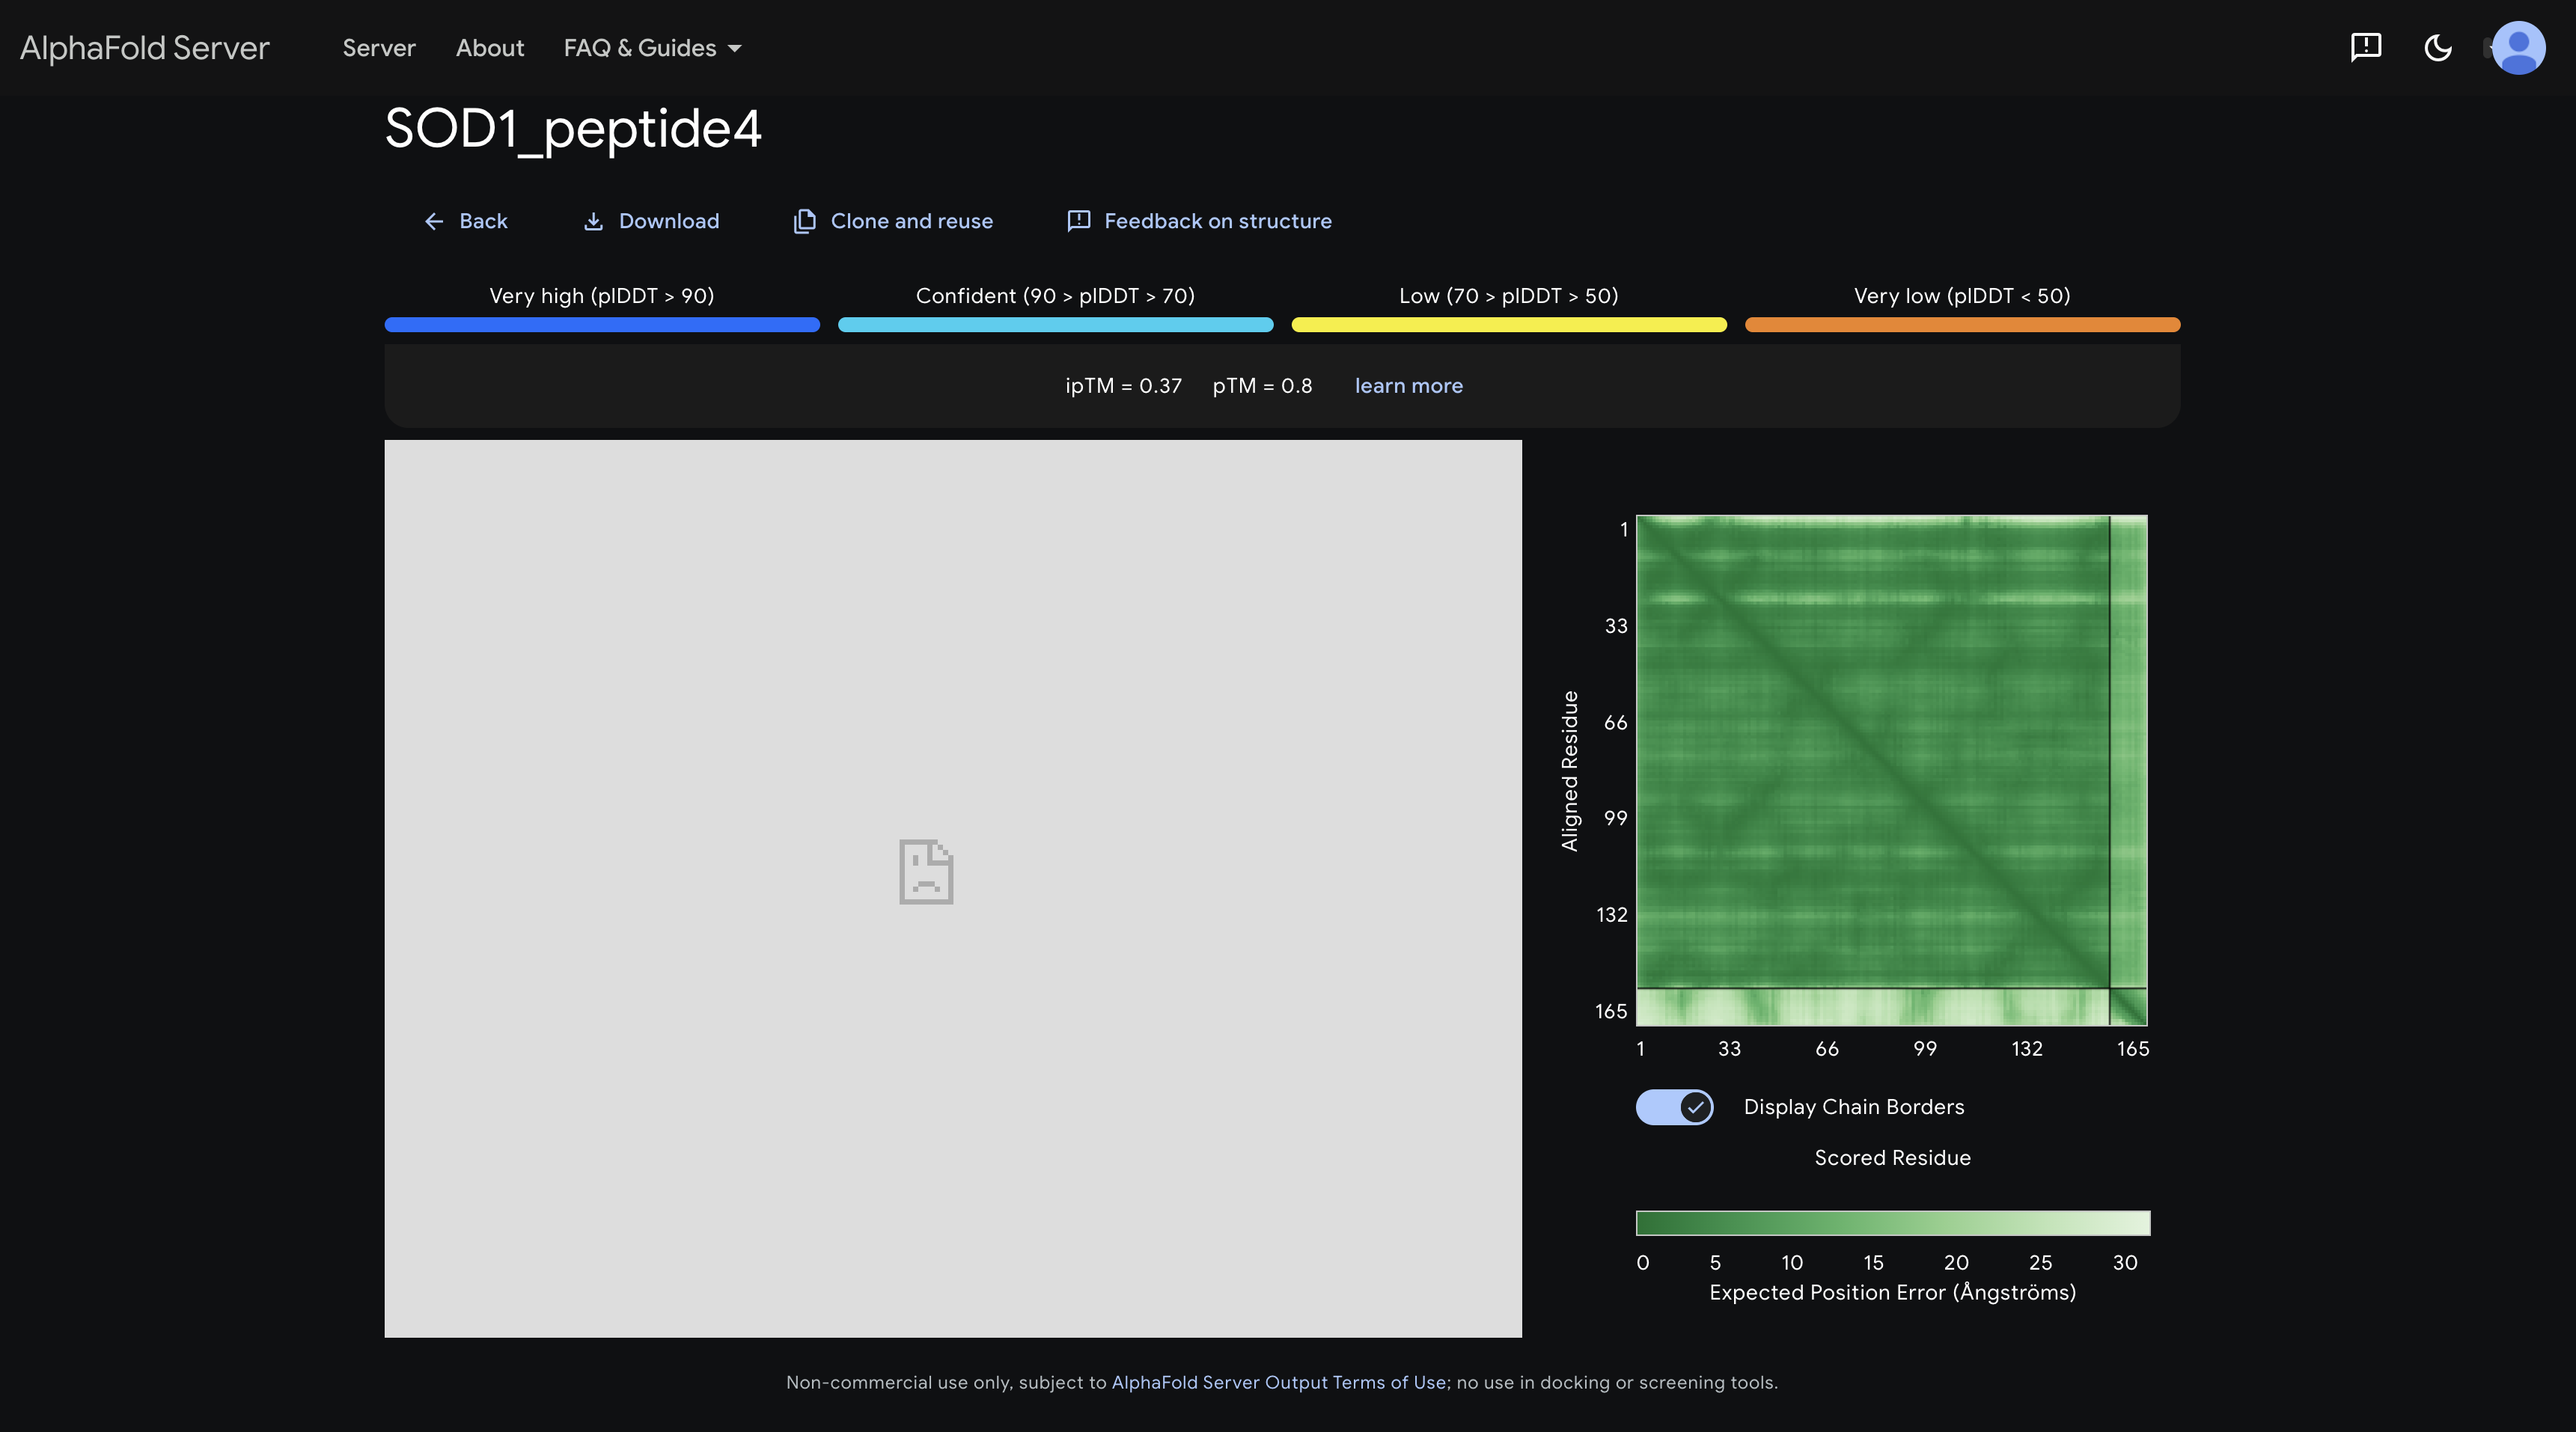 A slightly darker patch in the inter-chain strip around residues 1–30 hints at proximity to the N-terminal region where the A4V mutation sits, making this the most therapeutically interesting placement among the PepMLM peptides.
peptide 5 ipTM 0.41
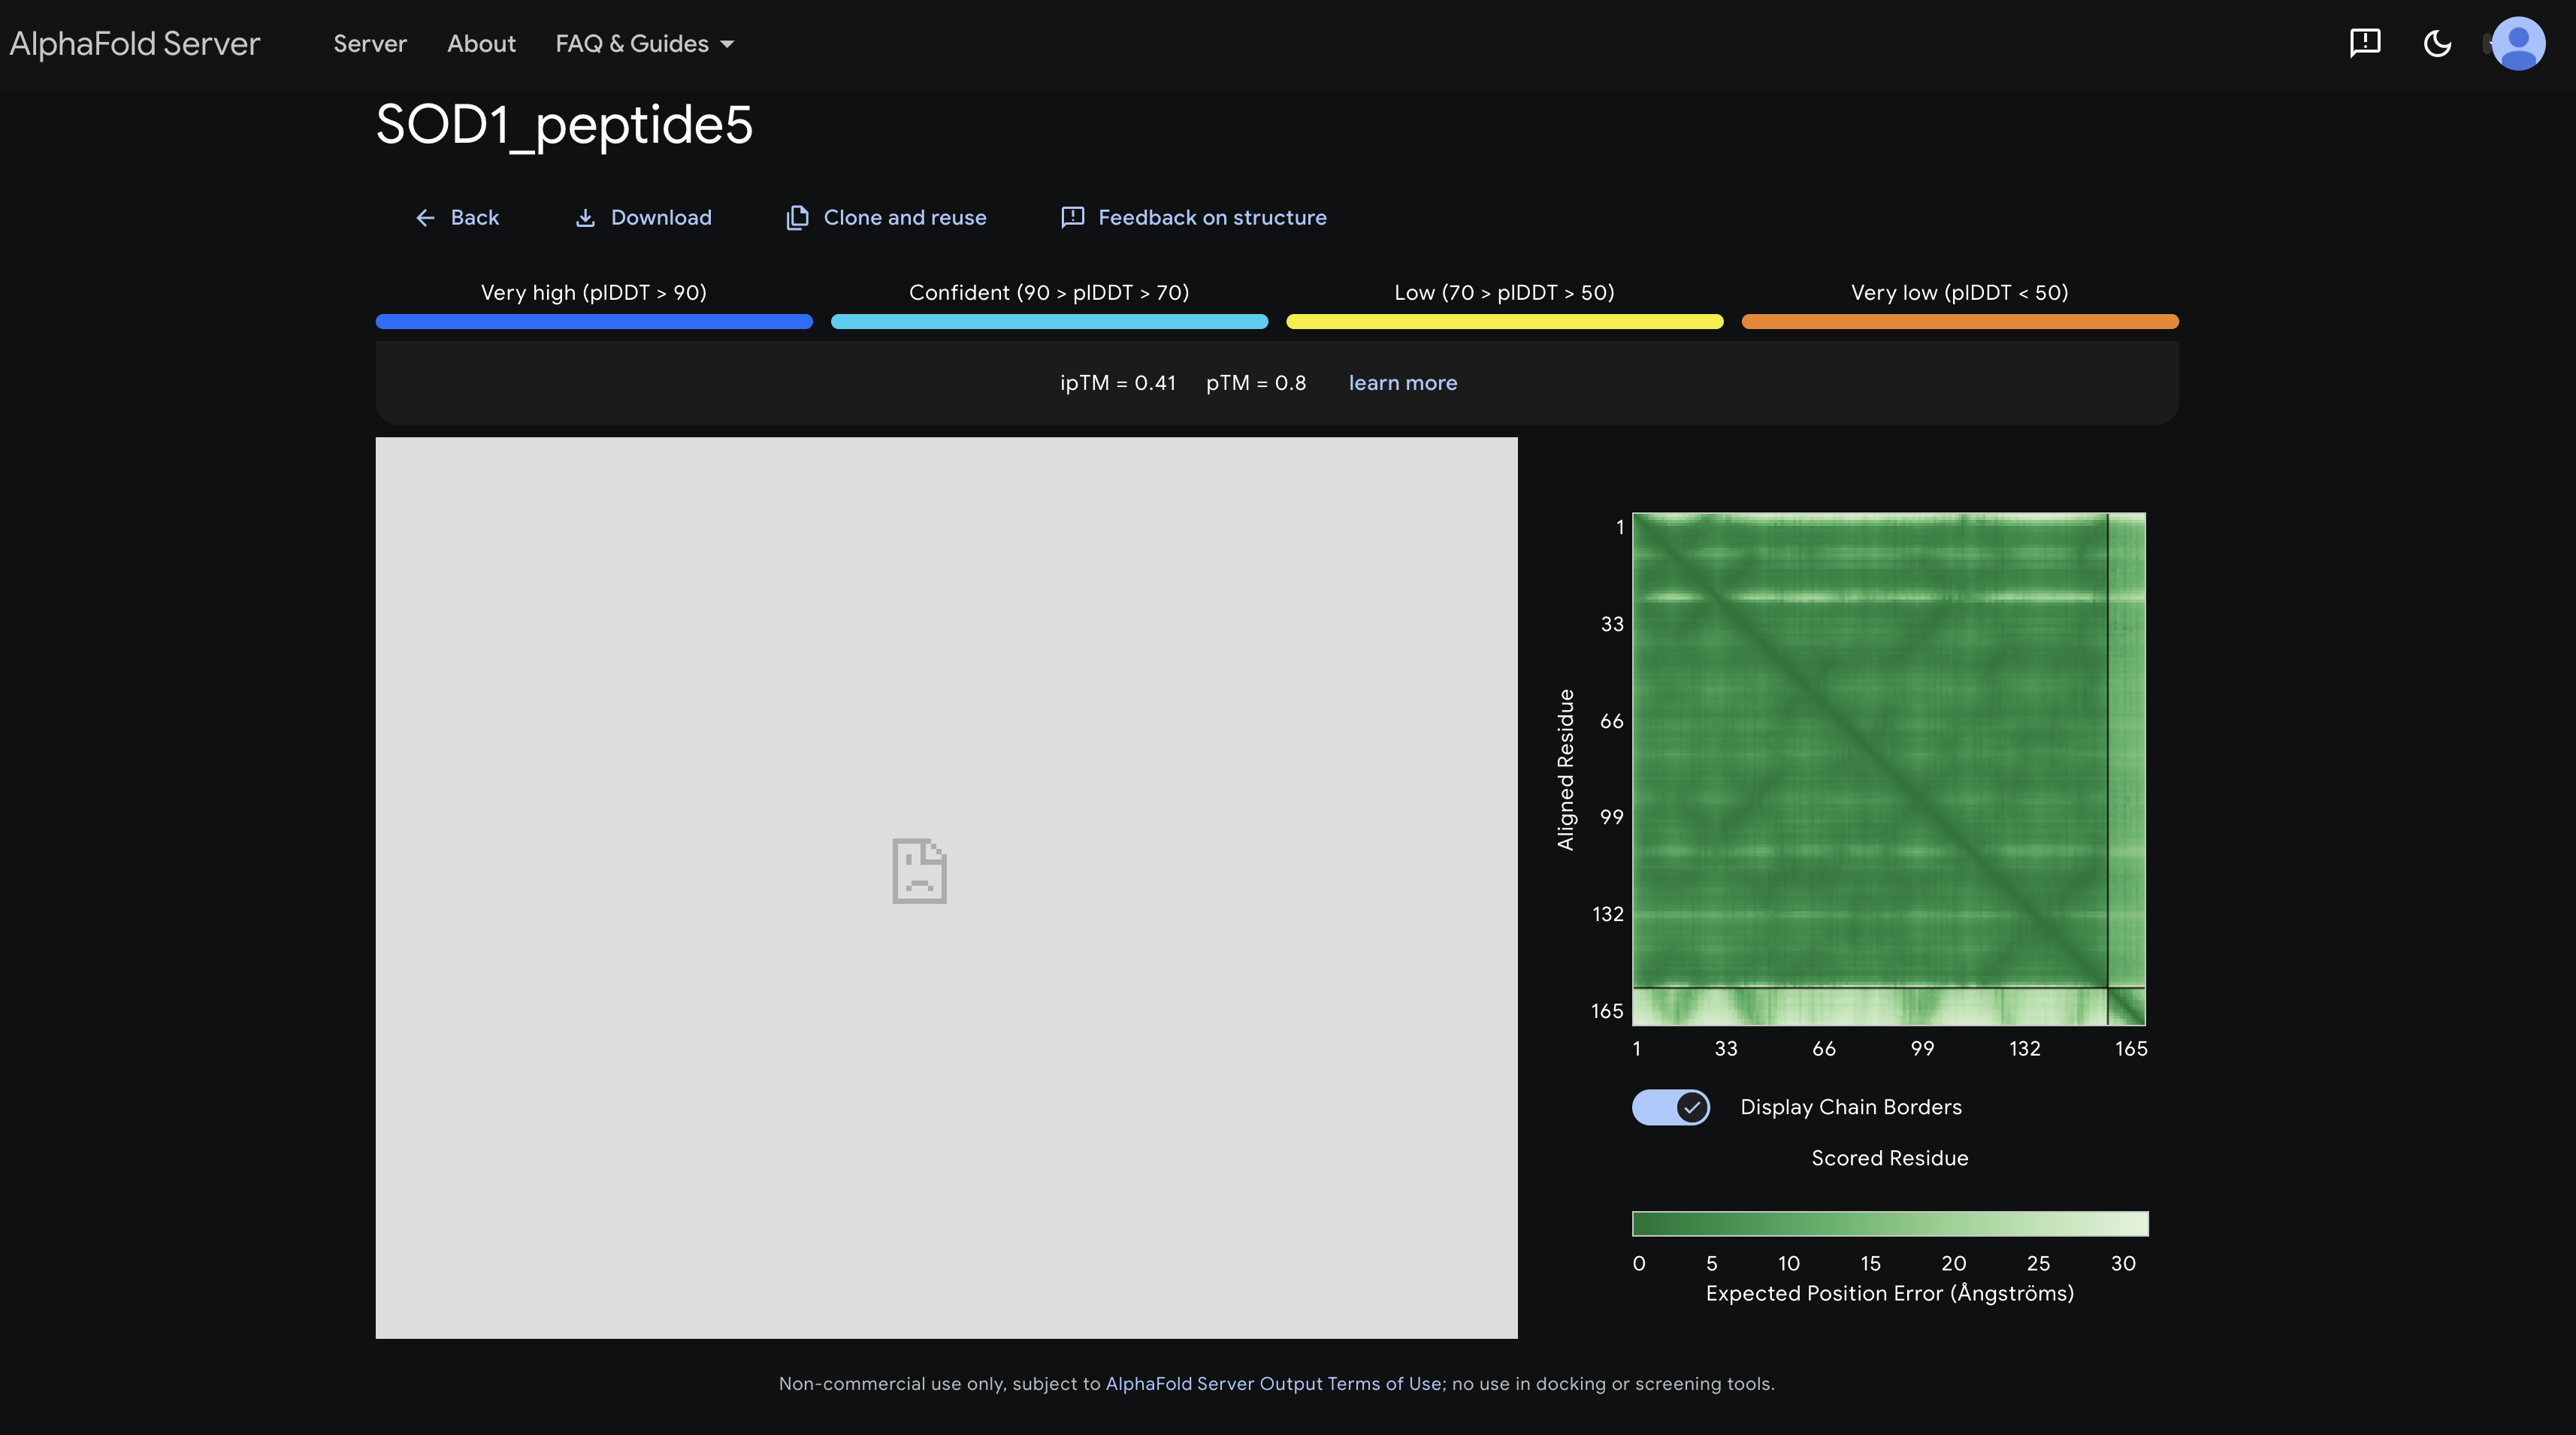 Shows the darkest and most defined inter-chain strip overall, with a signal around residues 60–110 suggesting some affinity toward the β-barrel mid-region consistent with it being a known SOD1 binder and having the highest ipTM.
Part 2: AlphaFold3 Summary
Across all five peptides, ipTM scores ranged from 0.35 to 0.41 — all falling below the 0.5 threshold generally considered indicative of confident binding. The known SOD1-binding peptide FLYRWLPSRRGG achieved the highest ipTM of 0.41, and none of the four PepMLM-generated peptides matched or exceeded this score. Peptide 4 (ipTM 0.37) was the most therapeutically interesting placement among the generated candidates, showing a faint signal near the A4V mutation site at the N-terminus, but the overall structural confidence for all generated peptides was low. This suggests PepMLM sampling alone, without site-specific guidance, does not reliably outperform an experimentally validated binder on structural confidence metrics.
Part 3: Evavluating properties of generated peptides in Peptiverse
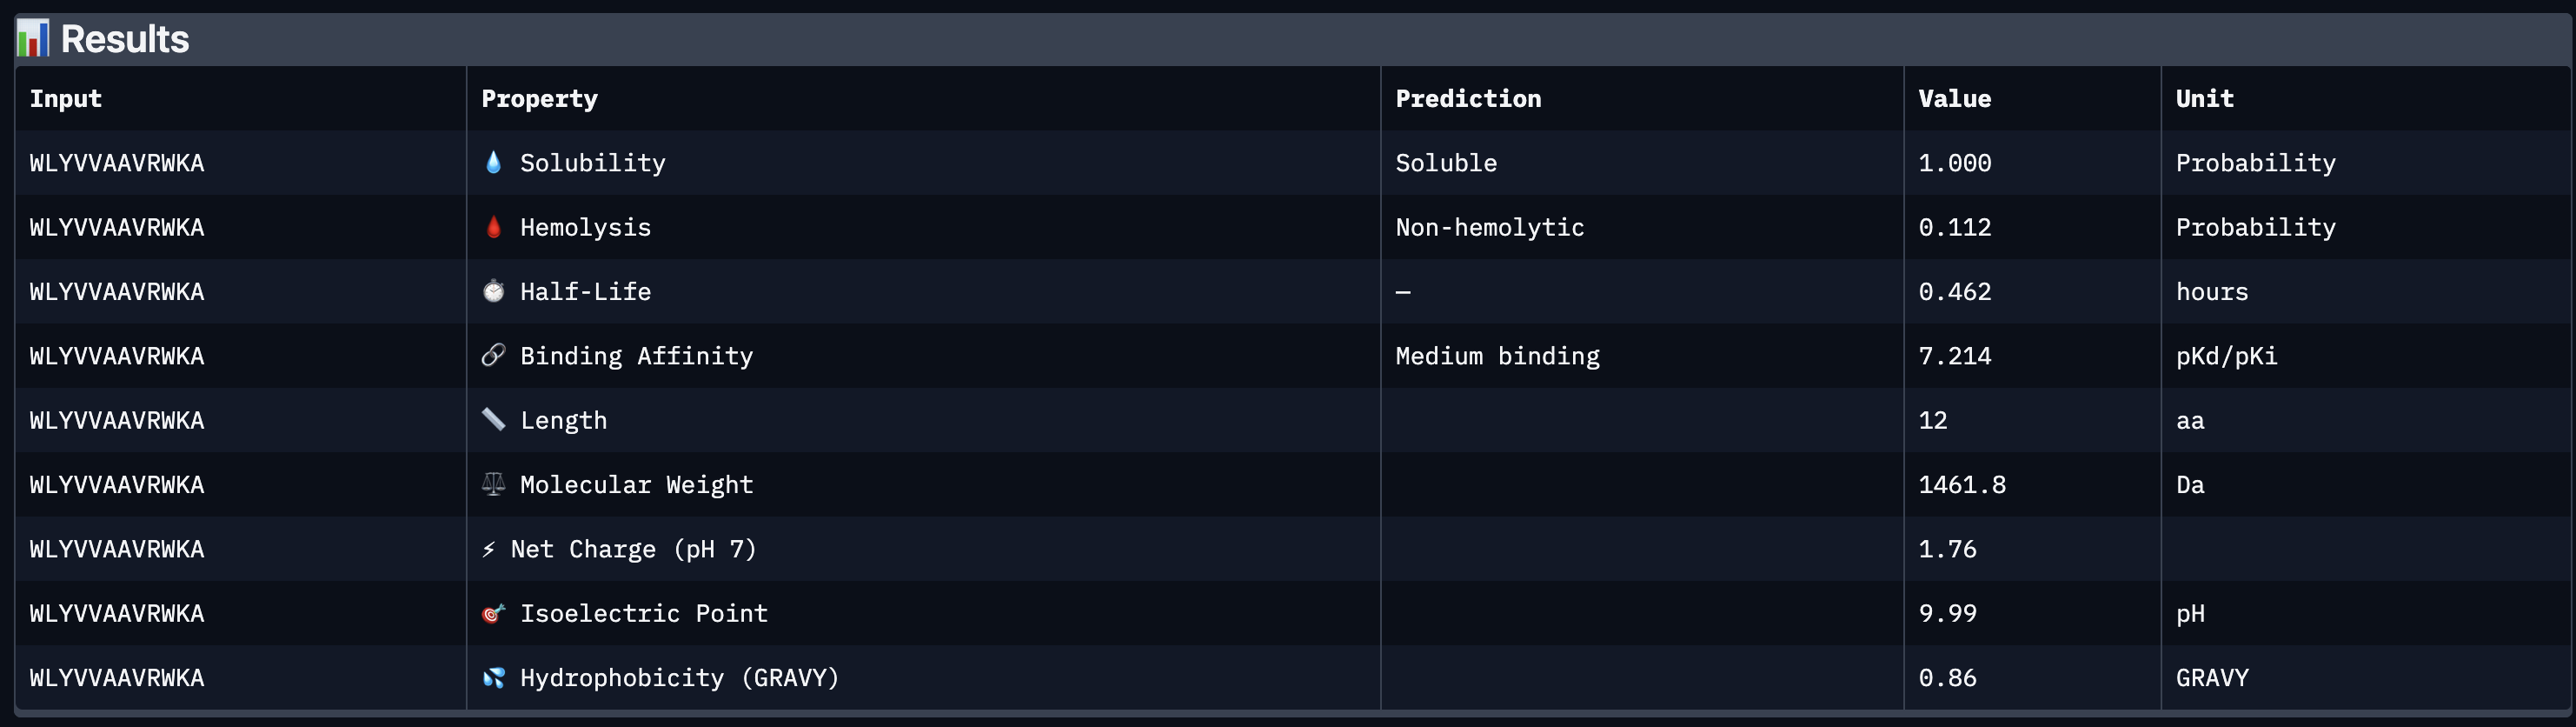
Peptide 1 WLYVVAAVRWKA
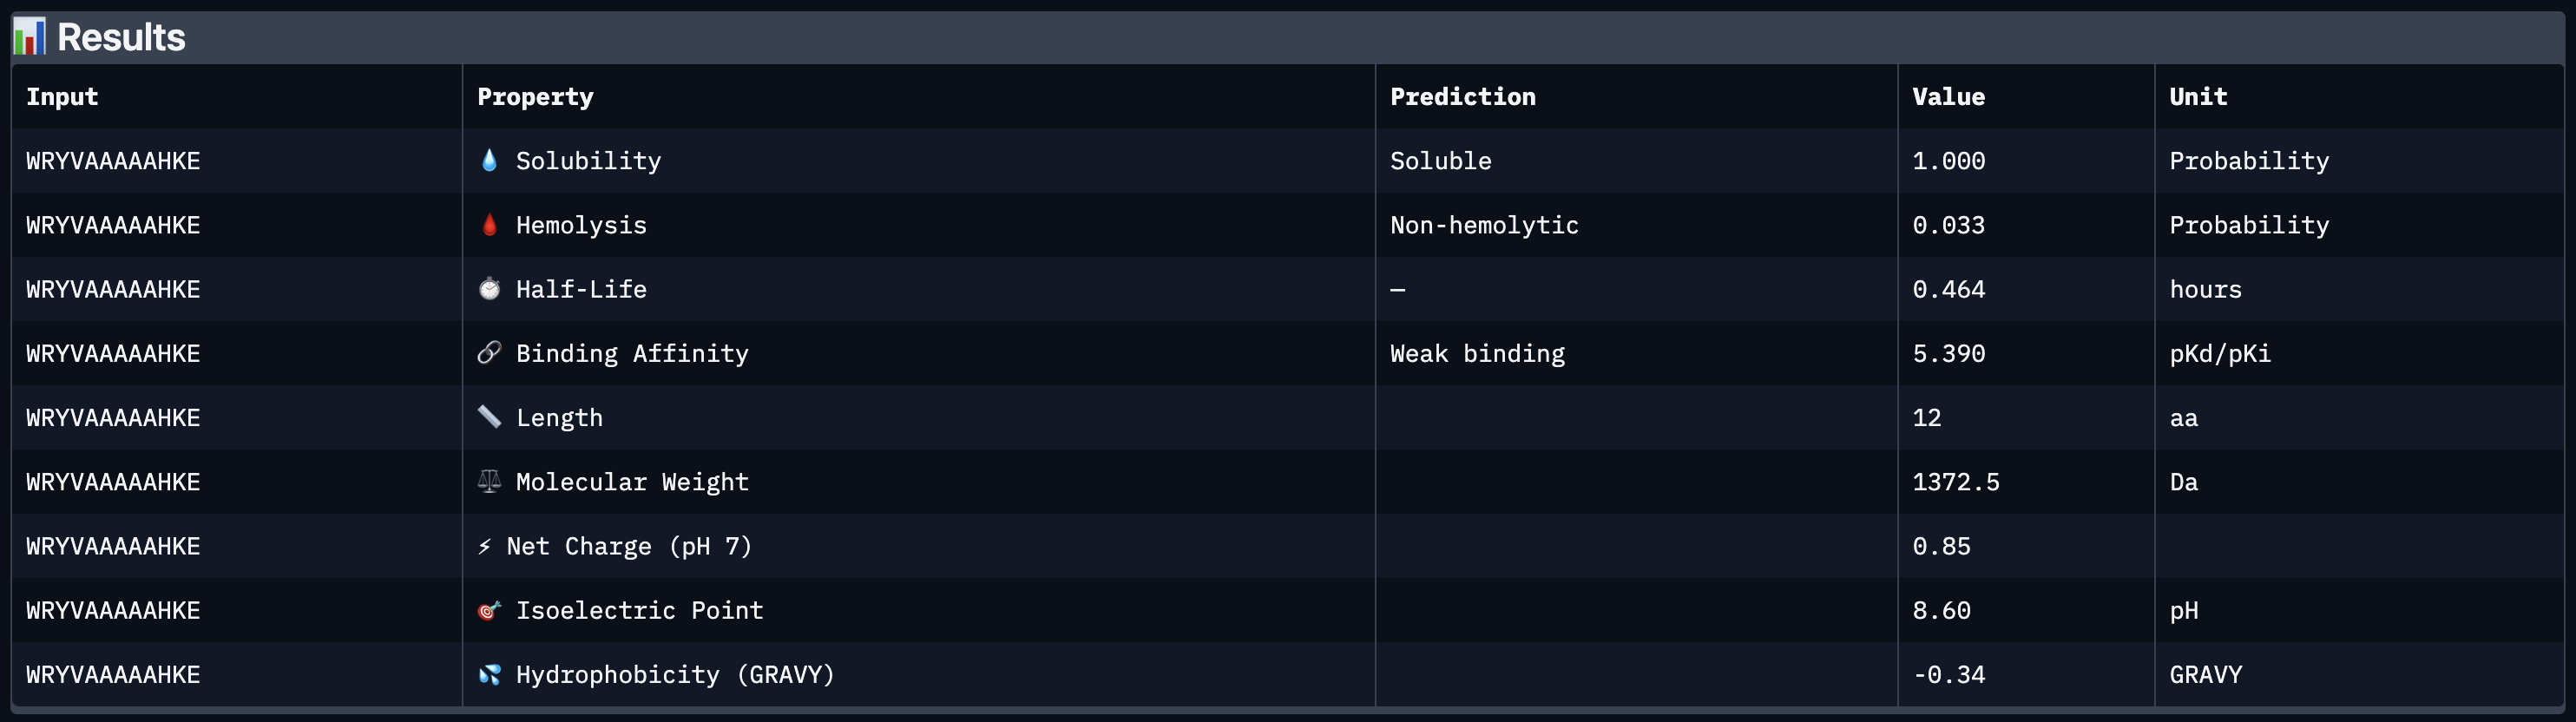
Peptide 2 WRYVAAAAAHKE
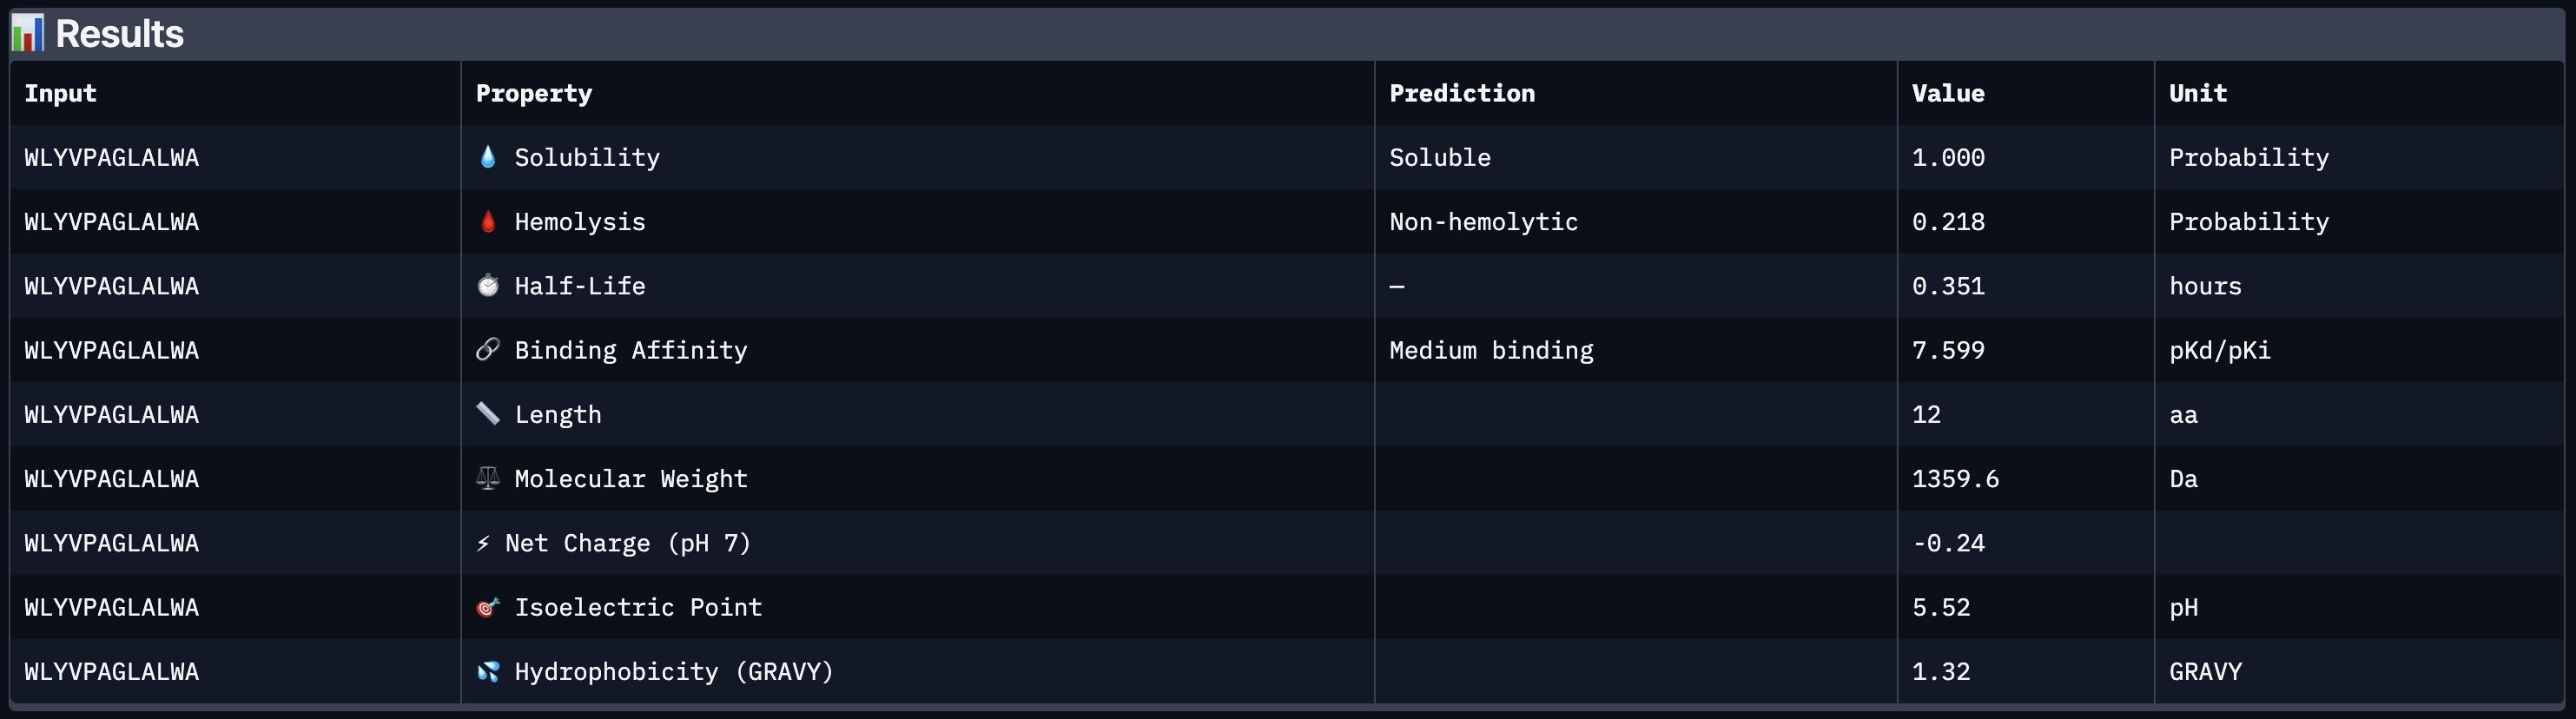
Peptide 3 WLYVPAGLALWA
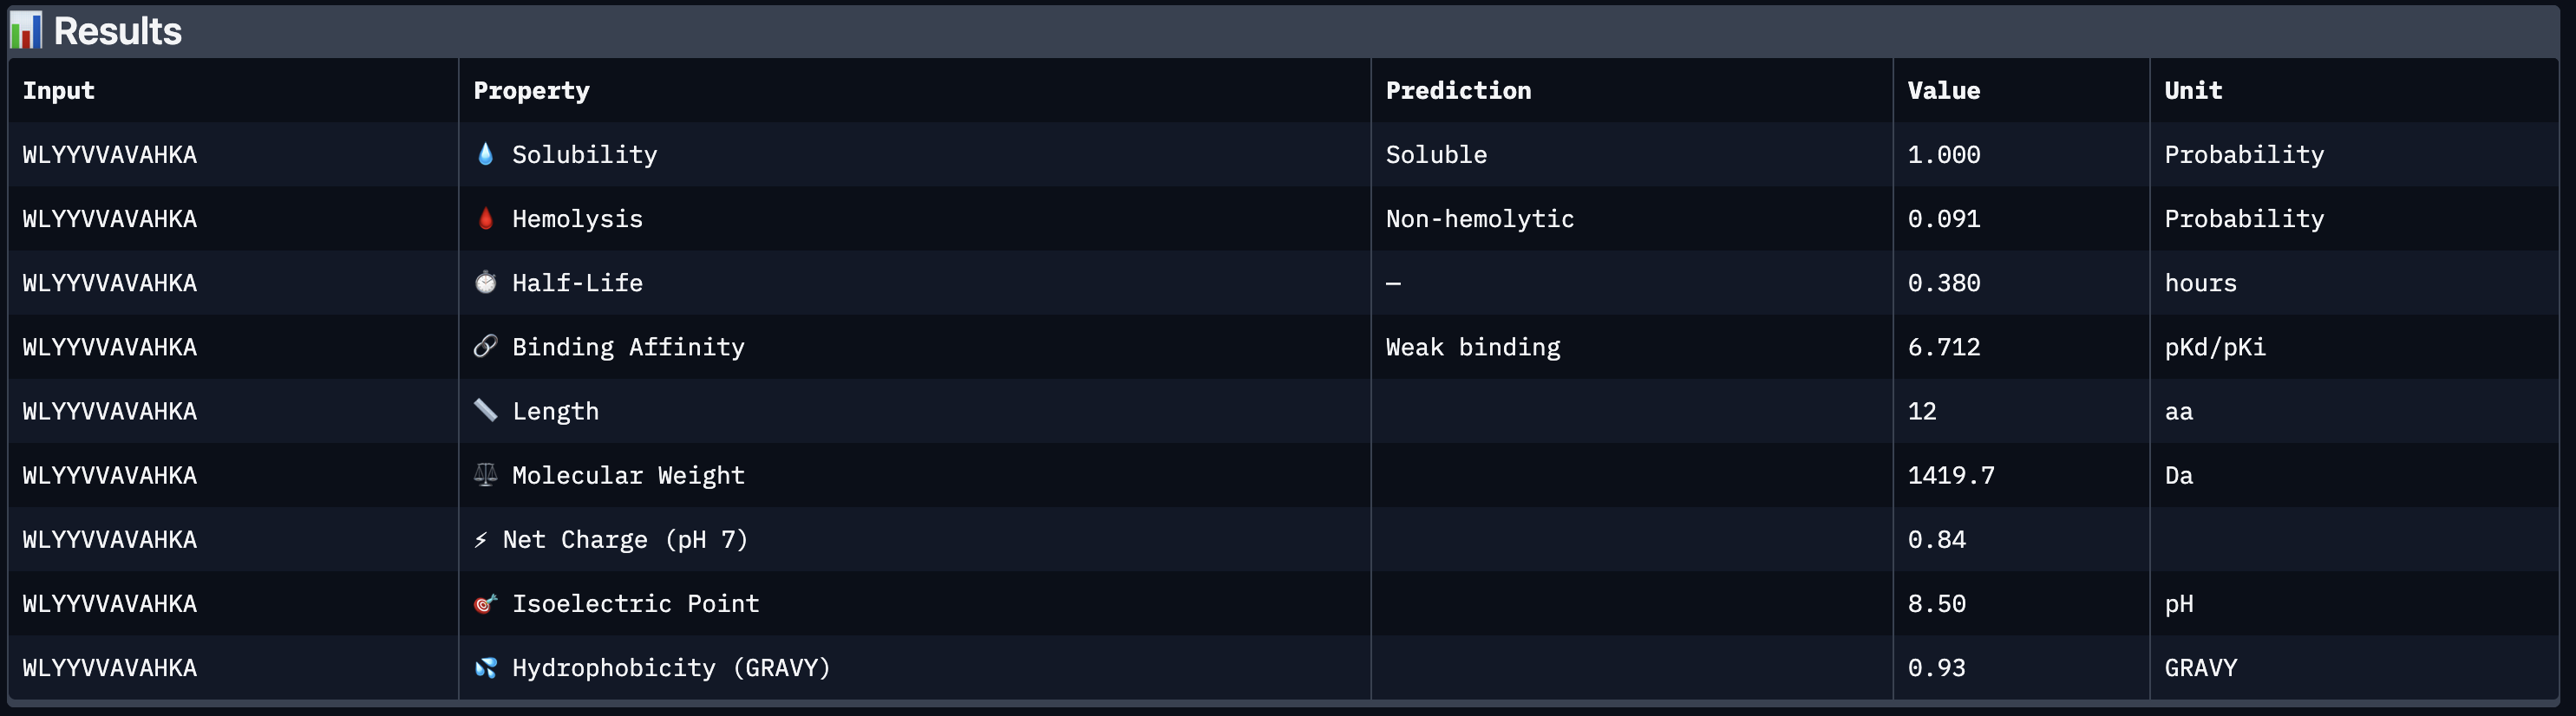
Peptide 4 WLYYVVAVAHKA
Peptide 5 FLYRWLPSRRGG
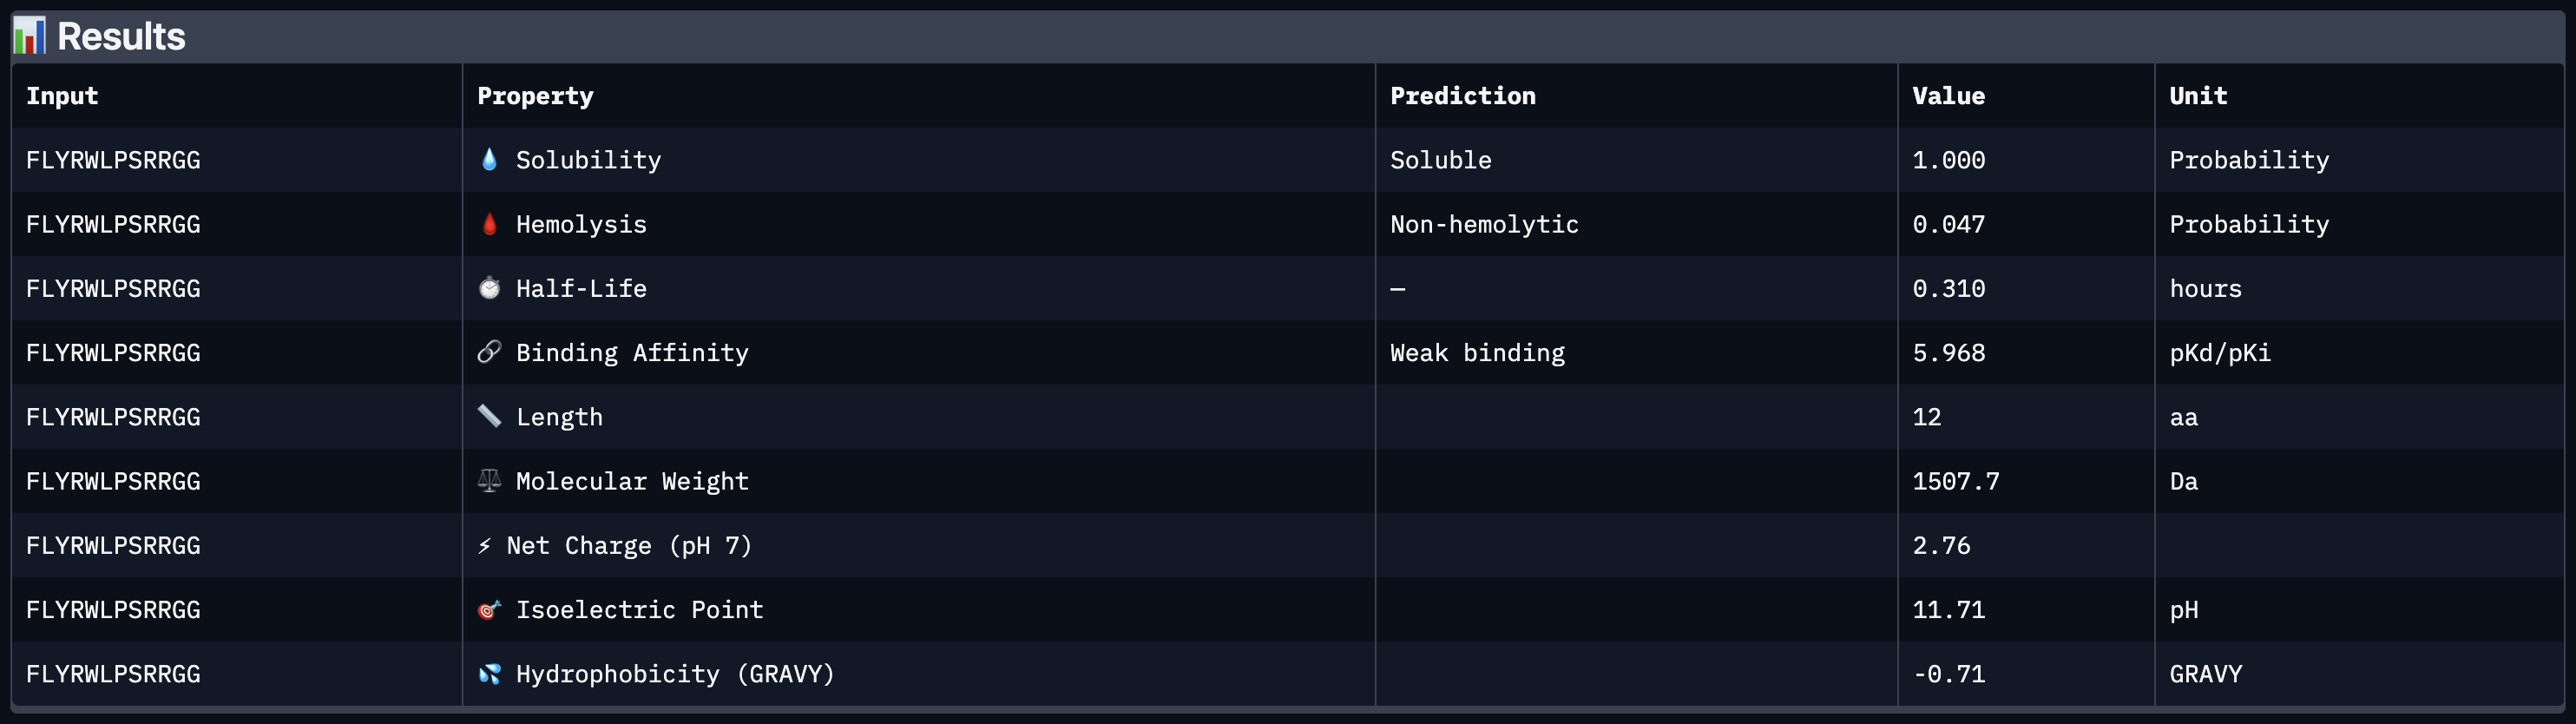
All four peptides demonstrated favorable therapeutic profiles when evaluated through PeptiVerse, and outperformed FLYRWLPSRRGG in predicted binding affinity. Every peptide showed perfect solubility (1.000 probability) and was predicted to be non-hemolytic, confirming a safe baseline. In terms of binding affinity, Peptide 3 (WLYVPAGLALWA) emerged as the strongest binder with a medium binding score of 7.599 pKd/pKi, followed by Peptide 1 (WLYVVAAVRWKA) at 7.214. FLYRWLPSRRGG achieved a weak binding score of 5.968. This is a significant finding as it suggests PepMLM successfully generated peptides with stronger predicted affinity than an experimentally validated binder. Based on this analysis, Peptide 3 (WLYVPAGLALWA) remains the top candidate to advance. It has the highest predicted binding affinity, full solubility, low hemolytic risk, and a drug-like molecular weight of 1359.6 Da, making it the strongest overall therapeutic candidate from this screen pending AlphaFold3 structural confirmation.
Part 3: PeptiVerse Cross-Comparison
Comparing AlphaFold3 ipTM scores against PeptiVerse-predicted binding affinity reveals a partial disconnect: higher ipTM did not consistently predict stronger binding affinity. FLYRWLPSRRGG had the highest ipTM (0.41) but the weakest predicted affinity at 5.968 pKd — the lowest of all five peptides. Meanwhile Peptide 3 (WLYVPAGLALWA), which had a mid-range ipTM of 0.36, showed the strongest predicted affinity at 7.599 pKd. This discrepancy highlights the complementary nature of the two tools: AlphaFold3 captures structural plausibility while PeptiVerse captures predicted biochemical potency, and they do not necessarily agree.
In terms of safety, all four PepMLM-generated peptides were predicted to be non-hemolytic with perfect solubility (1.000), meaning none present an obvious therapeutic liability on those axes. FLYRWLPSRRGG, despite being an experimentally validated binder, was outperformed on predicted affinity by three of the four generated peptides, suggesting that PepMLM can generate sequences with improved computational properties even if structural confidence remains modest.
Peptide 3 (WLYVPAGLALWA) best balances predicted binding affinity, solubility, non-hemolytic profile, and drug-like molecular weight and is the top candidate to advance.
Interpretation of PeptiVerse results
The generated peptides showed trade-offs between predicted binding affinity, therapeutic safety, and developability.
Peptide 7 (GKRYYYYKDKCF) showed the strongest predicted binding affinity (pKd = 9.123), making it the most promising binder from an interaction standpoint. However, it had a relatively low motif score (0.340), suggesting weaker alignment with the desired design motif.
Peptide 8 (VGTCYCIKKKKM) had the highest hemolysis probability (0.978), which makes it less attractive as a therapeutic candidate despite a reasonably strong predicted affinity (pKd = 7.123) and a strong motif score (0.730).
Peptide 9 (TKQCKFTRPQNE) had the strongest motif score (0.876), indicating good alignment with the desired interaction pattern, but its predicted binding affinity (pKd = 5.533) was lower than the best-performing candidates.
Overall, Peptide 7 appears strongest in terms of predicted affinity, while Peptide 9 may represent a more motif-consistent but weaker-binding alternative. Since all candidates showed high hemolysis probabilities, additional optimization would likely be required before therapeutic development.
Part 4: Optimized peptide generation with moPPIt
| Index | Peptide | Hemolysis | Solubility | Affinity (pKd) | Motif Score |
|---|---|---|---|---|---|
| 6 | GKCGKNEVHKHR | 0.955 | 0.917 | 5.692 | 0.396 |
| 7 | GKRYYYYKDKCF | 0.945 | 0.917 | 9.123 | 0.340 |
| 8 | VGTCYCIKKKKM | 0.978 | 0.750 | 7.123 | 0.730 |
| 9 | TKQCKFTRPQNE | 0.955 | 0.833 | 5.533 | 0.876 |
Overall, moPPIt gives more rational, multi-objective candidates anchored to a therapeutic hypothesis (binding the A4V site), while PepMLM provides broader sequence diversity without site or safety guidance.
Among the moPPIt candidates, GKRYYYYKDKCF (Peptide 7) is the strongest candidate to advance. It has by far the highest predicted binding affinity (9.12 pKd), a hemolysis score of 0.945 (non-hemolytic), and a solubility score of 0.917. Its motif score of 0.340 is the lowest among the four, suggesting it may not perfectly engage the exact residues targeted near position 4, but given that its affinity is dramatically higher than all other candidates from both tools, it warrants further structural and experimental investigation to determine where exactly it binds SOD1.
Before advancing any moPPIt candidate to clinical studies, I would evaluate them through: (1) experimental binding assays (SPR or ITC) to confirm predicted affinity against recombinant A4V SOD1, (2) cell-based toxicity assays in neuronal cell lines to validate the non-hemolytic predictions, (3) serum stability assays to assess protease resistance, and (4) aggregation inhibition assays to confirm the candidate reduces A4V SOD1 misfolding rather than merely binding without functional effect.
Part B skipped since optional
Part C: Final project L-Protein Mutants
Option 1: Mutagenesis
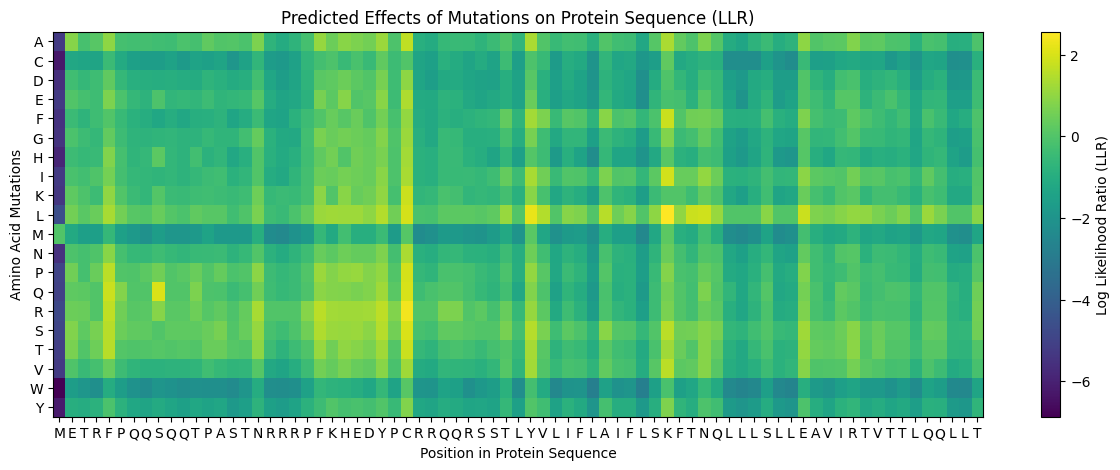
Attaching MSA output
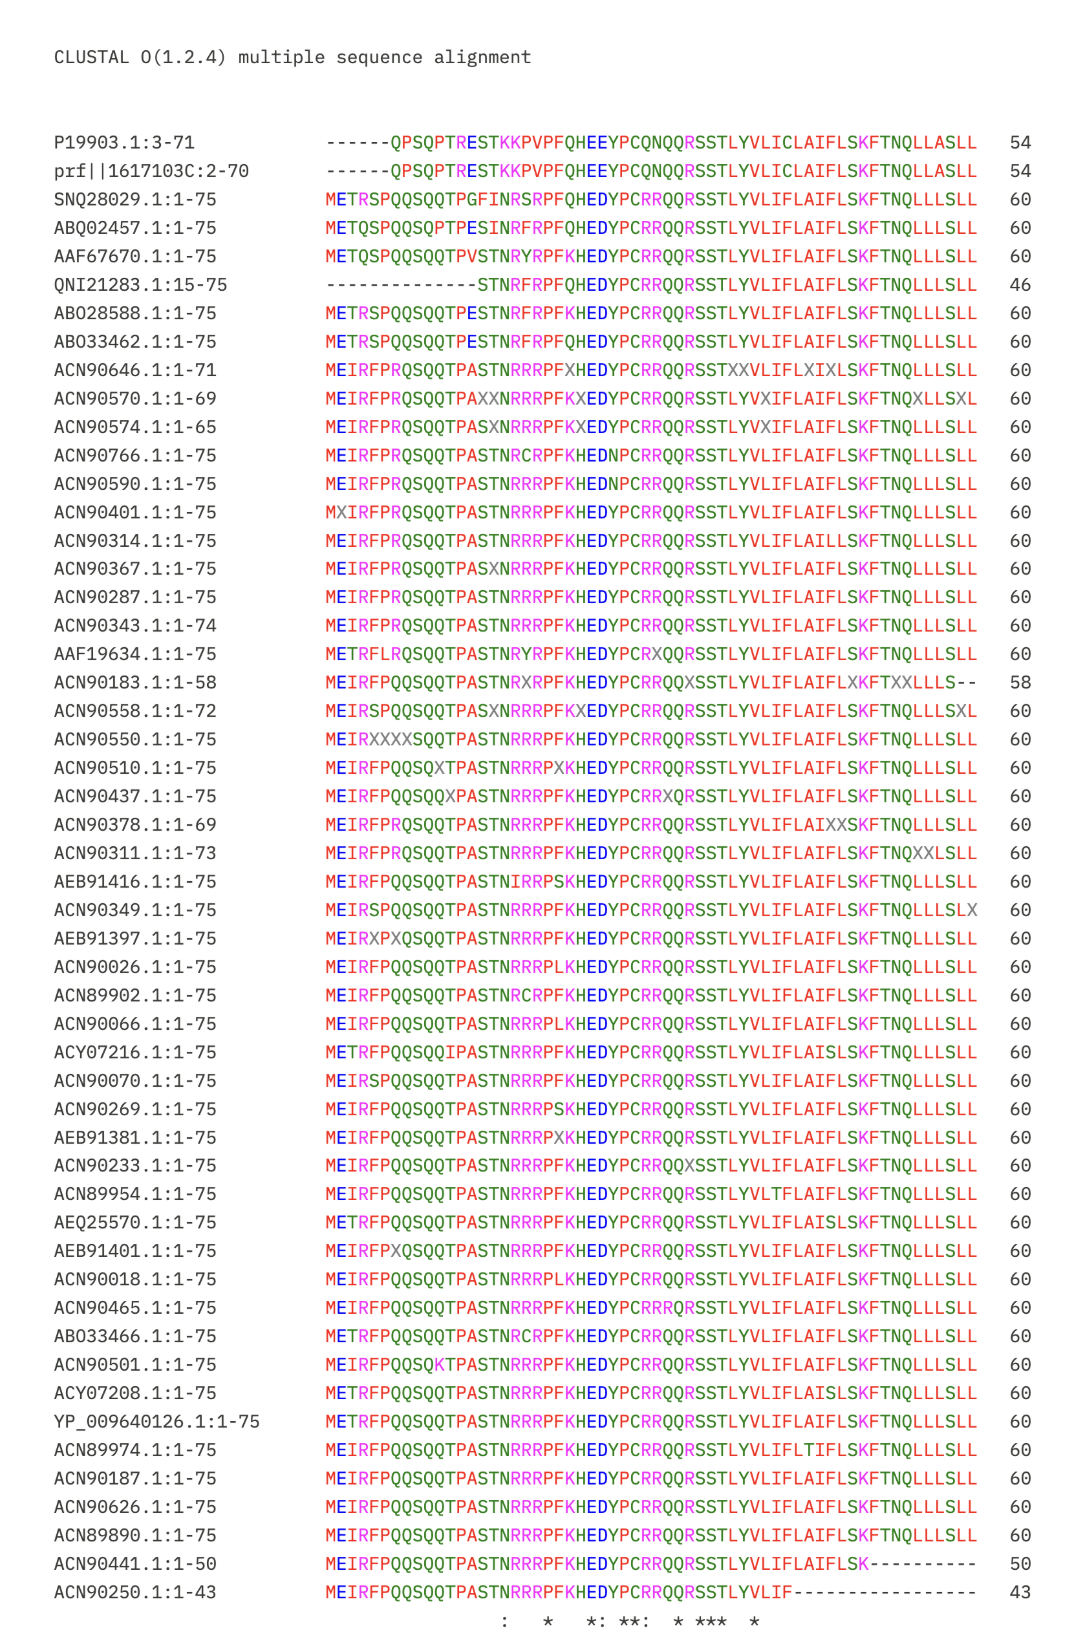
looking at the TM region in Image 2, almost every sequence ends with EAVIRTVTTLQQLLT. This stretch is extremely conserved, which means residues ~62–75 (VIRTVTTLQQLLT) are very risky to mutate.
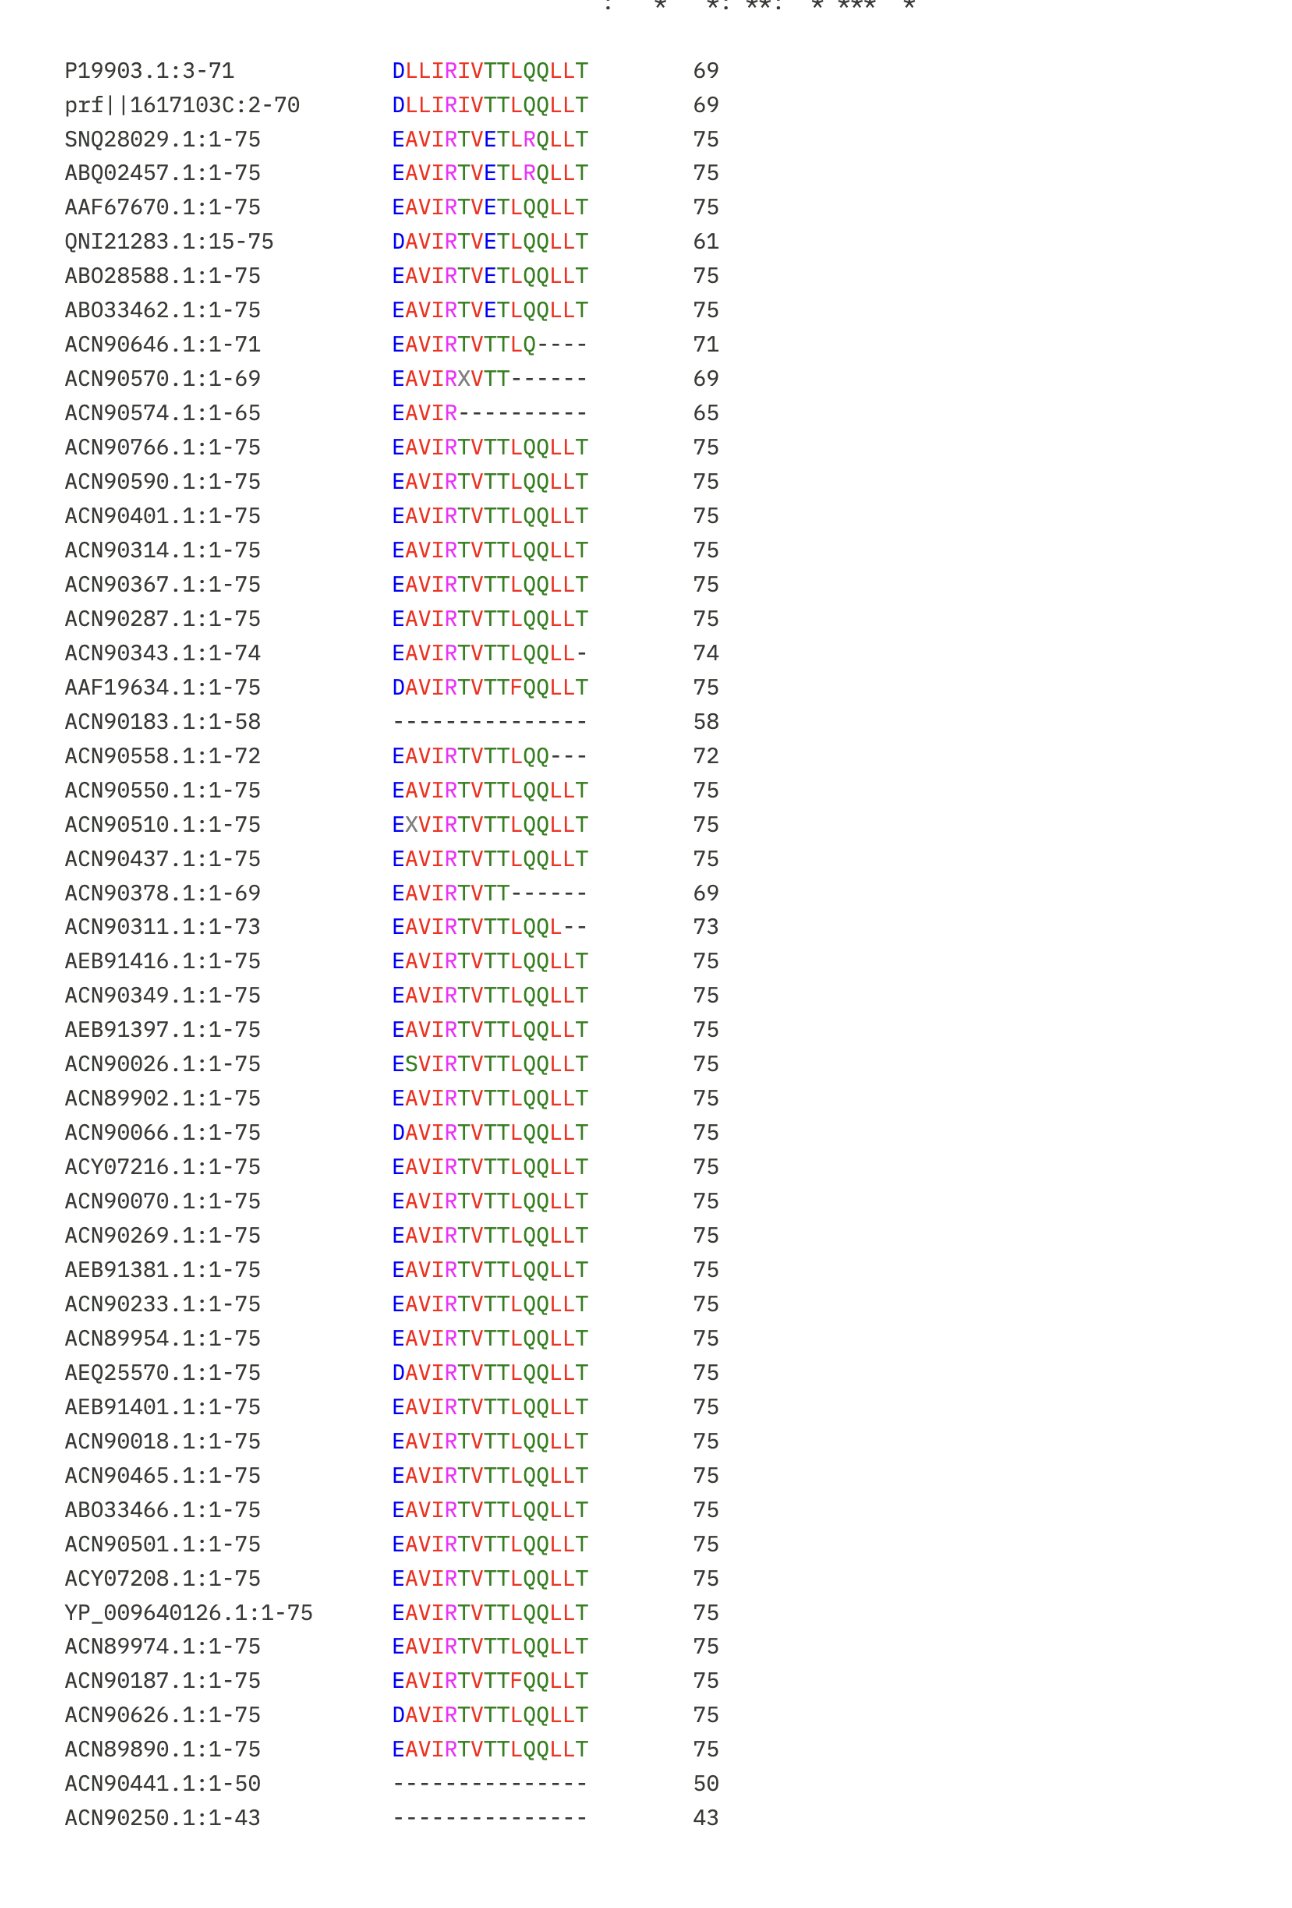
And the L Protein mutation heatmap,
The heatmap x-axis follows the full L-protein sequence. Mapping positions to amino acids: M(1) E(2) T(3) R(4) F(5) P(6) Q(7) Q(8) S(9) Q(10)Q(11)T(12)P(13)A(14)S(15)T(16) N(17)R(18)R(19)R(20)P(21)F(22)K(23)H(24)E(25)D(26)Y(27)P(28)C(29)R(30)R(31)Q(32) Q(33)R(34)S(35)S(36)T(37)L(38)Y(39)V(40) | L(41)I(42)F(43)L(44)A(45)I(46)F(47)L(48) S(49)K(50)F(51)T(52)N(53)Q(54)L(55)L(56)L(57)S(58)L(59)L(60)E(61)A(62)V(63)I(64) R(65)T(66)V(67)T(68)T(69)L(70)Q(71)Q(72)L(73)L(74)T(75)
ESM Score vs. Experimental Data Correlation
To evaluate whether the ESM-based mutational scores capture real functional information, I cross-referenced the heatmap against the experimental L-protein mutant dataset from the spreadsheet. Positions such as those in the conserved EAVIRTVTTLQQLLT stretch of the TM domain (residues 62–75) consistently appear as dark columns in the ESM heatmap, indicating strong negative predicted fitness for any substitution. This aligns well with the MSA data, where these positions show near-zero variation across related phage sequences. Conversely, some positions in the soluble N-terminal domain (residues 1–40) show yellow-to-neutral scores at certain substitutions, suggesting the model predicts these changes are tolerable and consistent with the experimental observation that many soluble-domain mutations retain partial lysis activity.
The following 5 mutations were selected based on positive ESM LLR scores, MSA conservation analysis, and structural reasoning. Two mutations fall in the TM domain (residues 41–75) and three in the soluble N-terminal domain (residues 1–40). The mutations I chose to continue with in the Soluble Domain and Transmembrane domain are:
| Index | Position | Wildtype_AA | Mutation_AA | LLR Score |
|---|---|---|---|---|
| 1 | 29 | C | R | 2.3954 |
| 2 | 09 | S | Q | 2.014 |
| 3 | 50 | K | L | 2.5615 |
| 4 | 53 | N | L | 1.8649 |
| 5 | 22 | F | R | 1.6020 |
Alphafold multimer runs
8 chains of L-protein (including proposed mutations) separated by colons, total length 600 residues.
METRFPQQSQQTPASTNRRRPFKHEDYPCRRQQRSSTLYVLIFLAIFLSKFTNQLLLSLLEAVIRTVTTLQQLLT:METRFPQQSQQTPASTNRRRPFKHEDYPCRRQQRSSTLYVLIFLAIFLSKFTNQLLLSLLEAVIRTVTTLQQLLT:METRFPQQSQQTPASTNRRRPFKHEDYPCRRQQRSSTLYVLIFLAIFLSKFTNQLLLSLLEAVIRTVTTLQQLLT:METRFPQQSQQTPASTNRRRPFKHEDYPCRRQQRSSTLYVLIFLAIFLSKFTNQLLLSLLEAVIRTVTTLQQLLT:METRFPQQSQQTPASTNRRRPFKHEDYPCRRQQRSSTLYVLIFLAIFLSKFTNQLLLSLLEAVIRTVTTLQQLLT:METRFPQQSQQTPASTNRRRPFKHEDYPCRRQQRSSTLYVLIFLAIFLSKFTNQLLLSLLEAVIRTVTTLQQLLT:METRFPQQSQQTPASTNRRRPFKHEDYPCRRQQRSSTLYVLIFLAIFLSKFTNQLLLSLLEAVIRTVTTLQQLLT:METRFPQQSQQTPASTNRRRPFKHEDYPCRRQQRSSTLYVLIFLAIFLSKFTNQLLLSLLEAVIRTVTTLQQLLT
| Model | pLDDT | pTM | ipTM |
|---|---|---|---|
| Rank 1 | 27.8 | 0.159 | 0.125 |
| Rank 2 | 25.7 | 0.206 | ~0.13 |
| Rank 3 | 25.7 | 0.206 | ~0.13 |
| Rank 4 | 28.0 | 0.165 | — |
| Rank 5 | 28.0 | 0.165 | — |
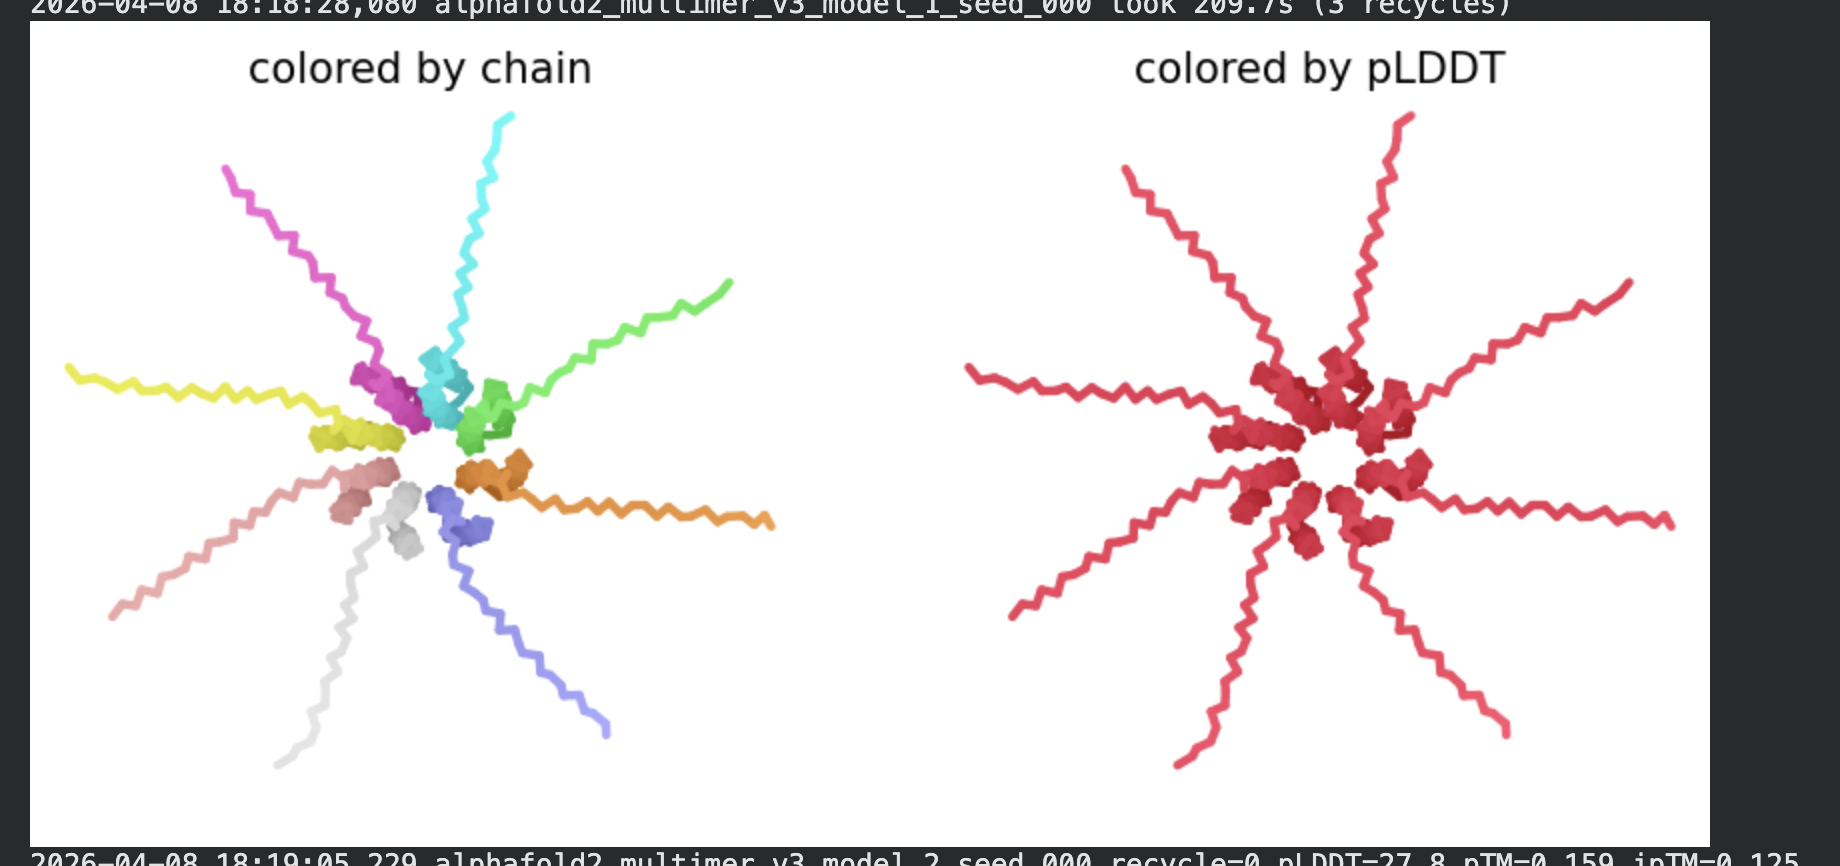
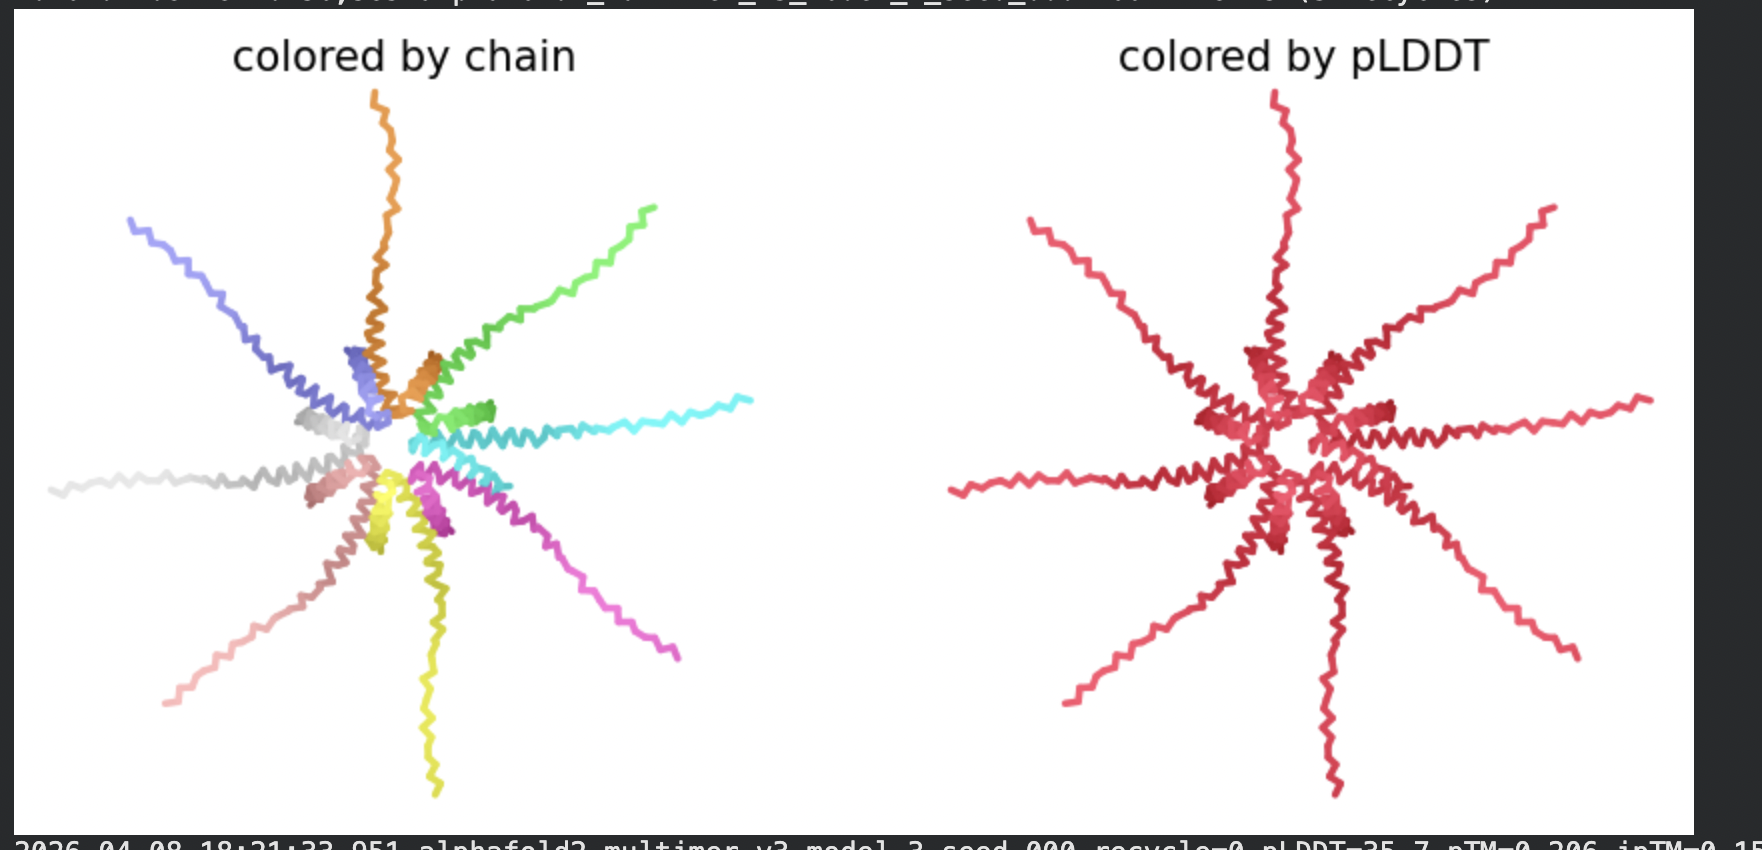
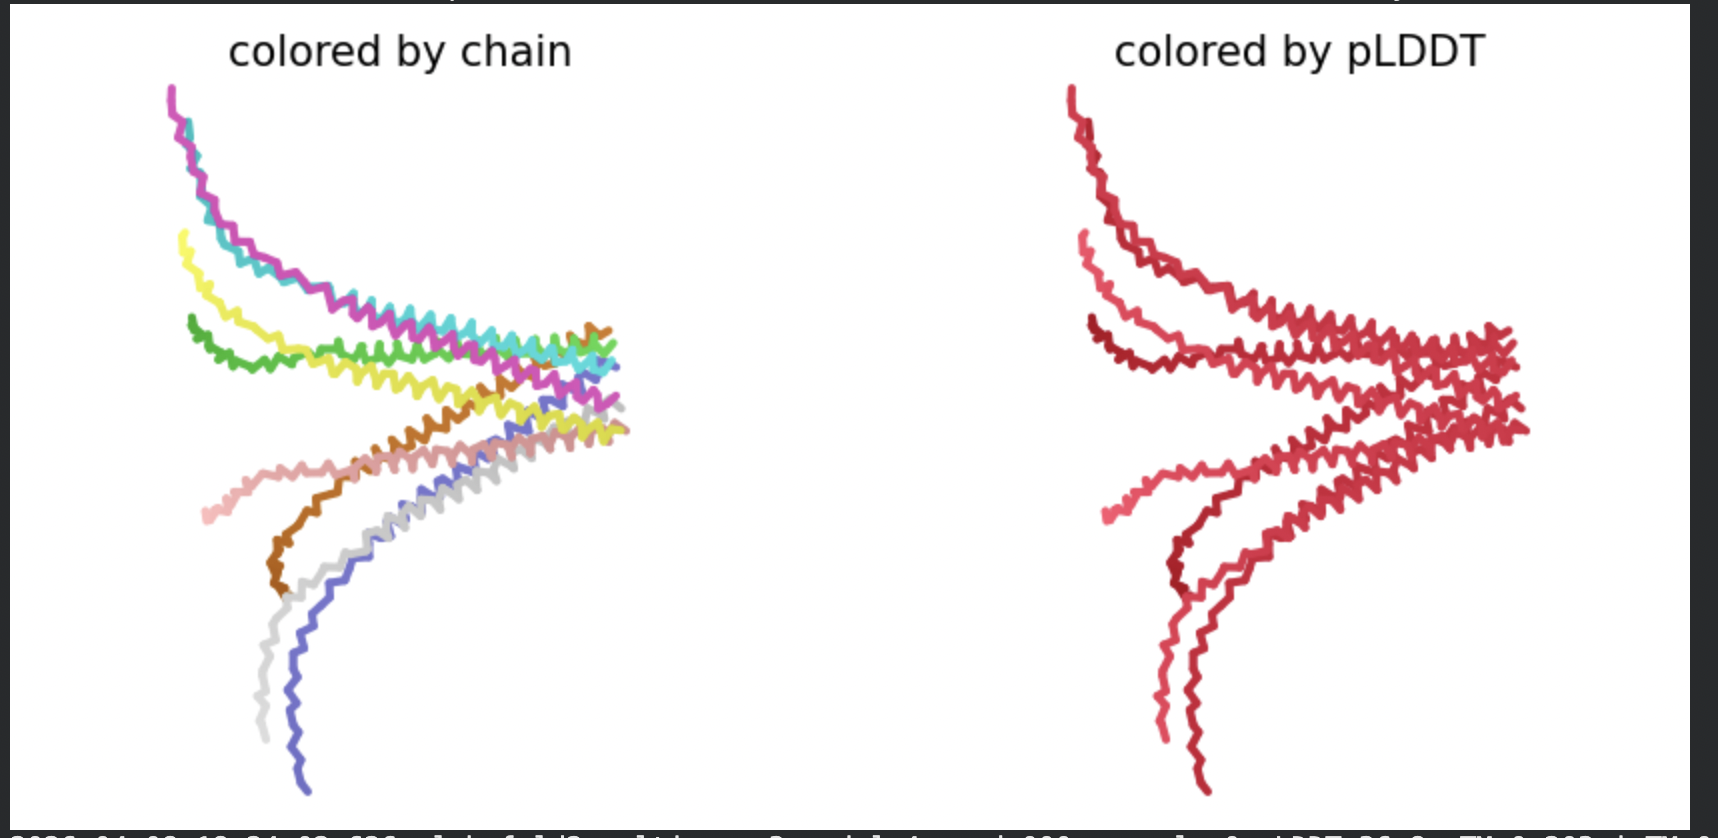
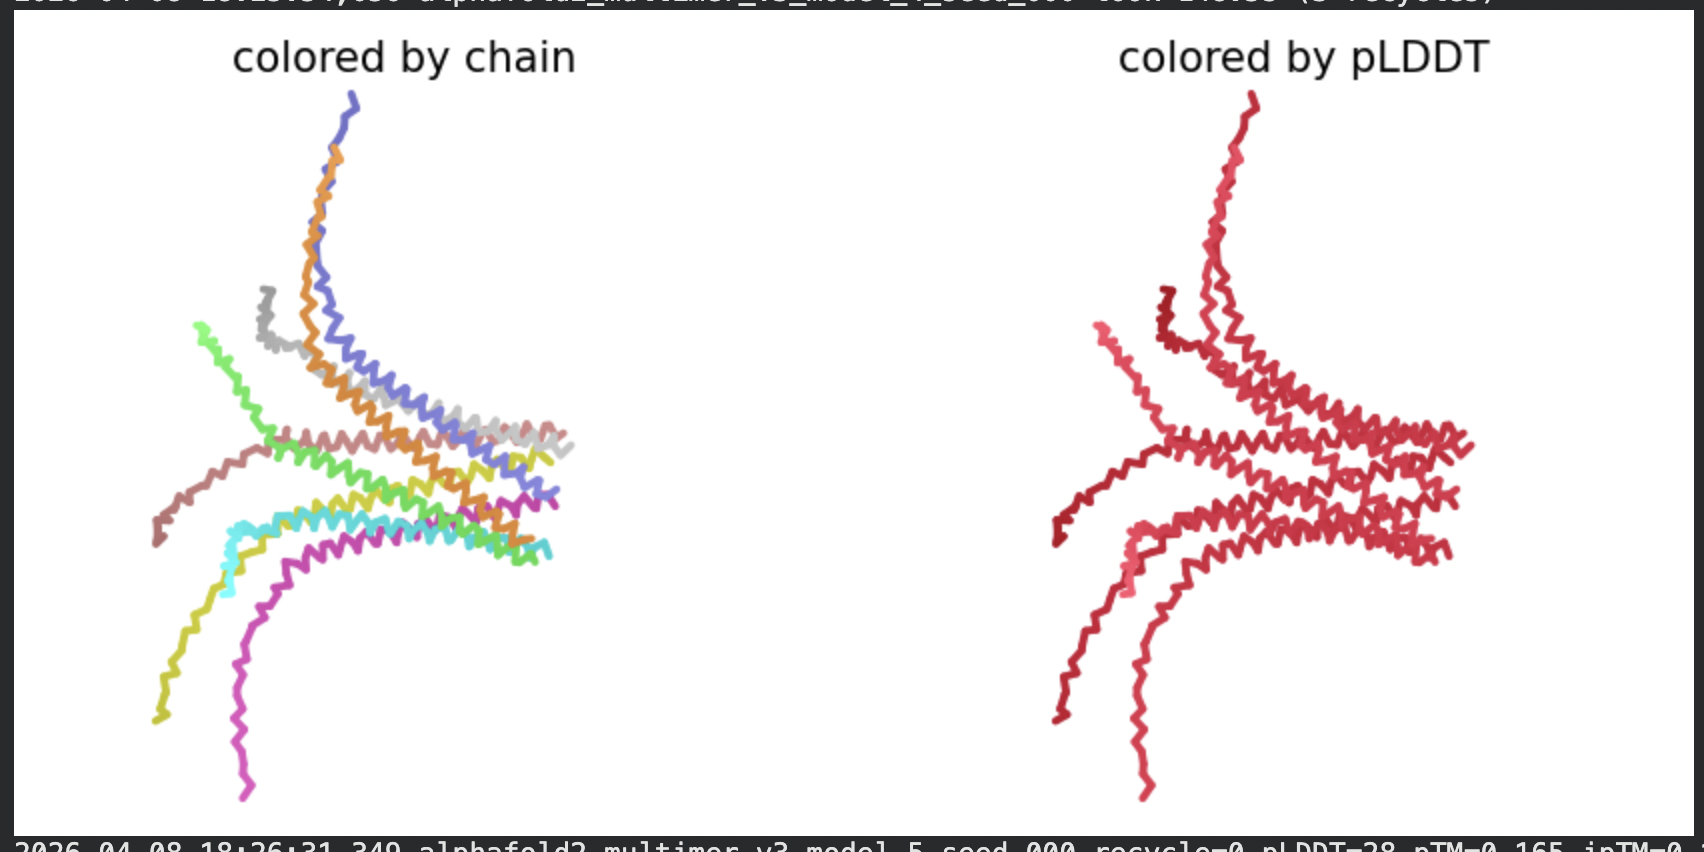
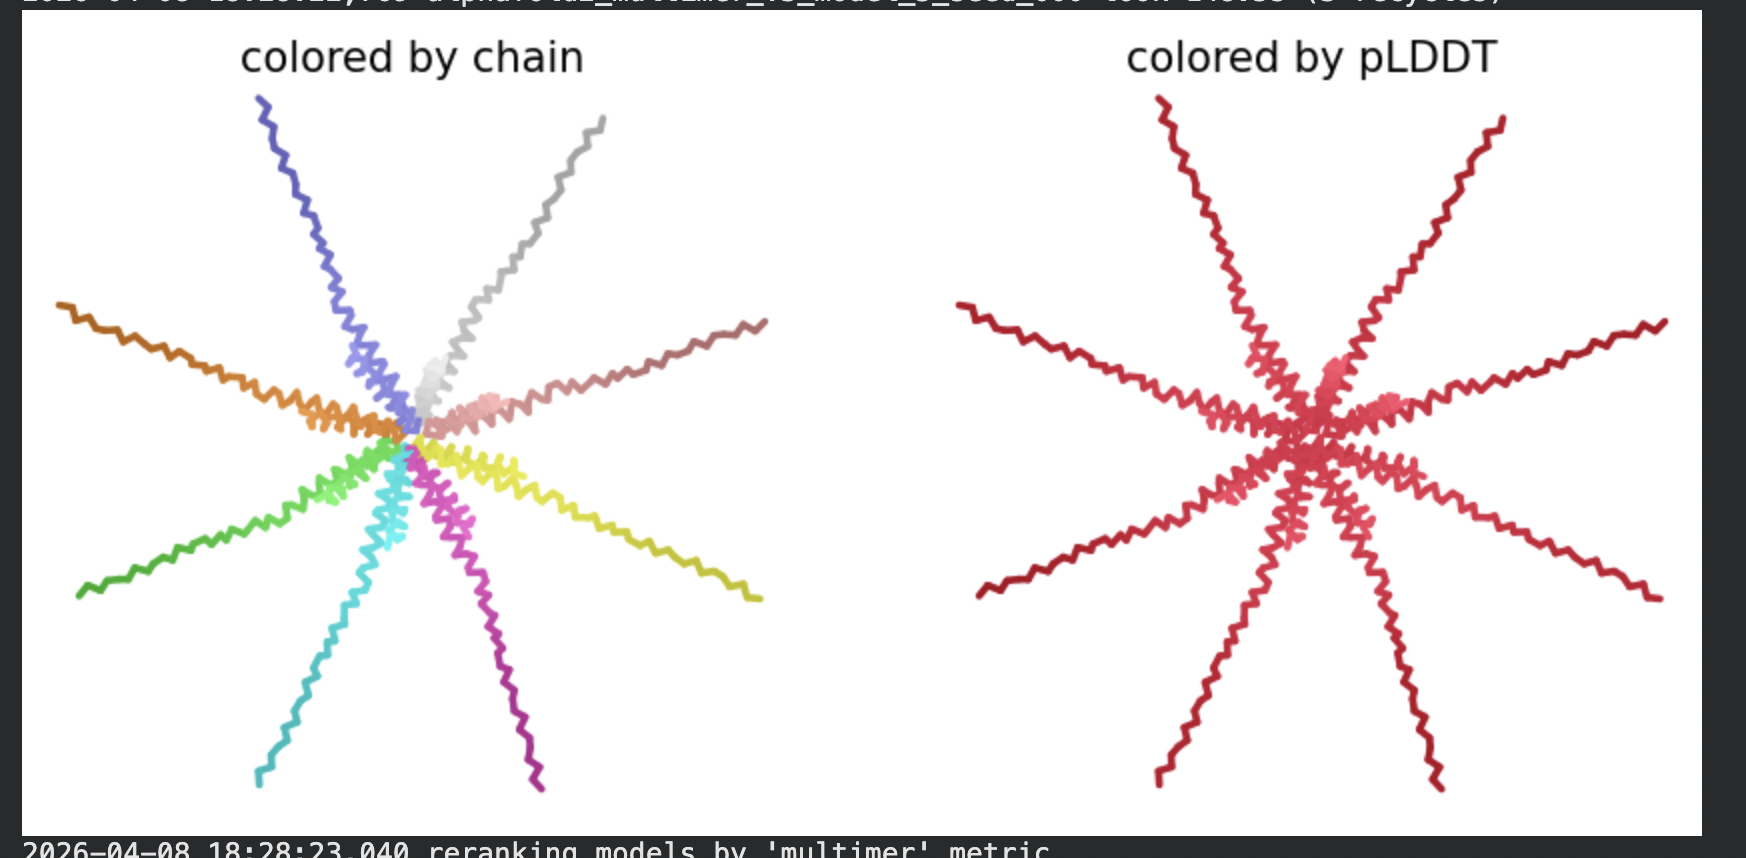
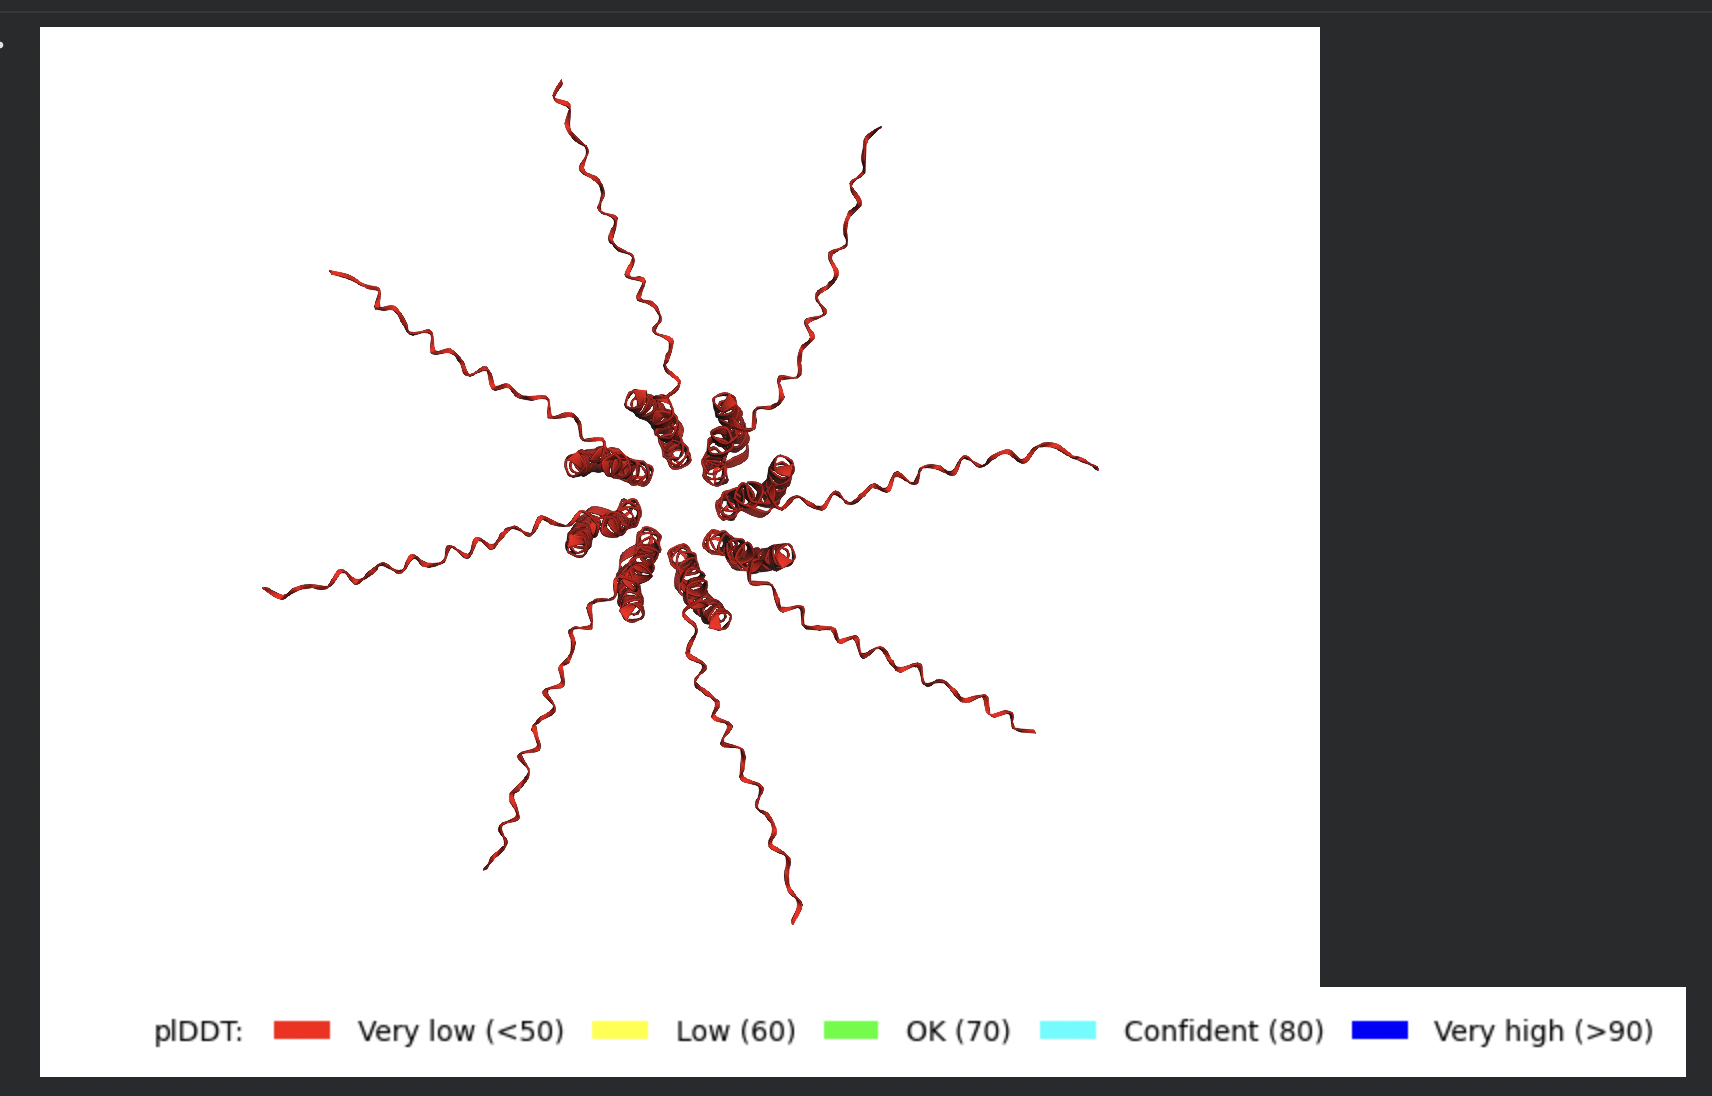
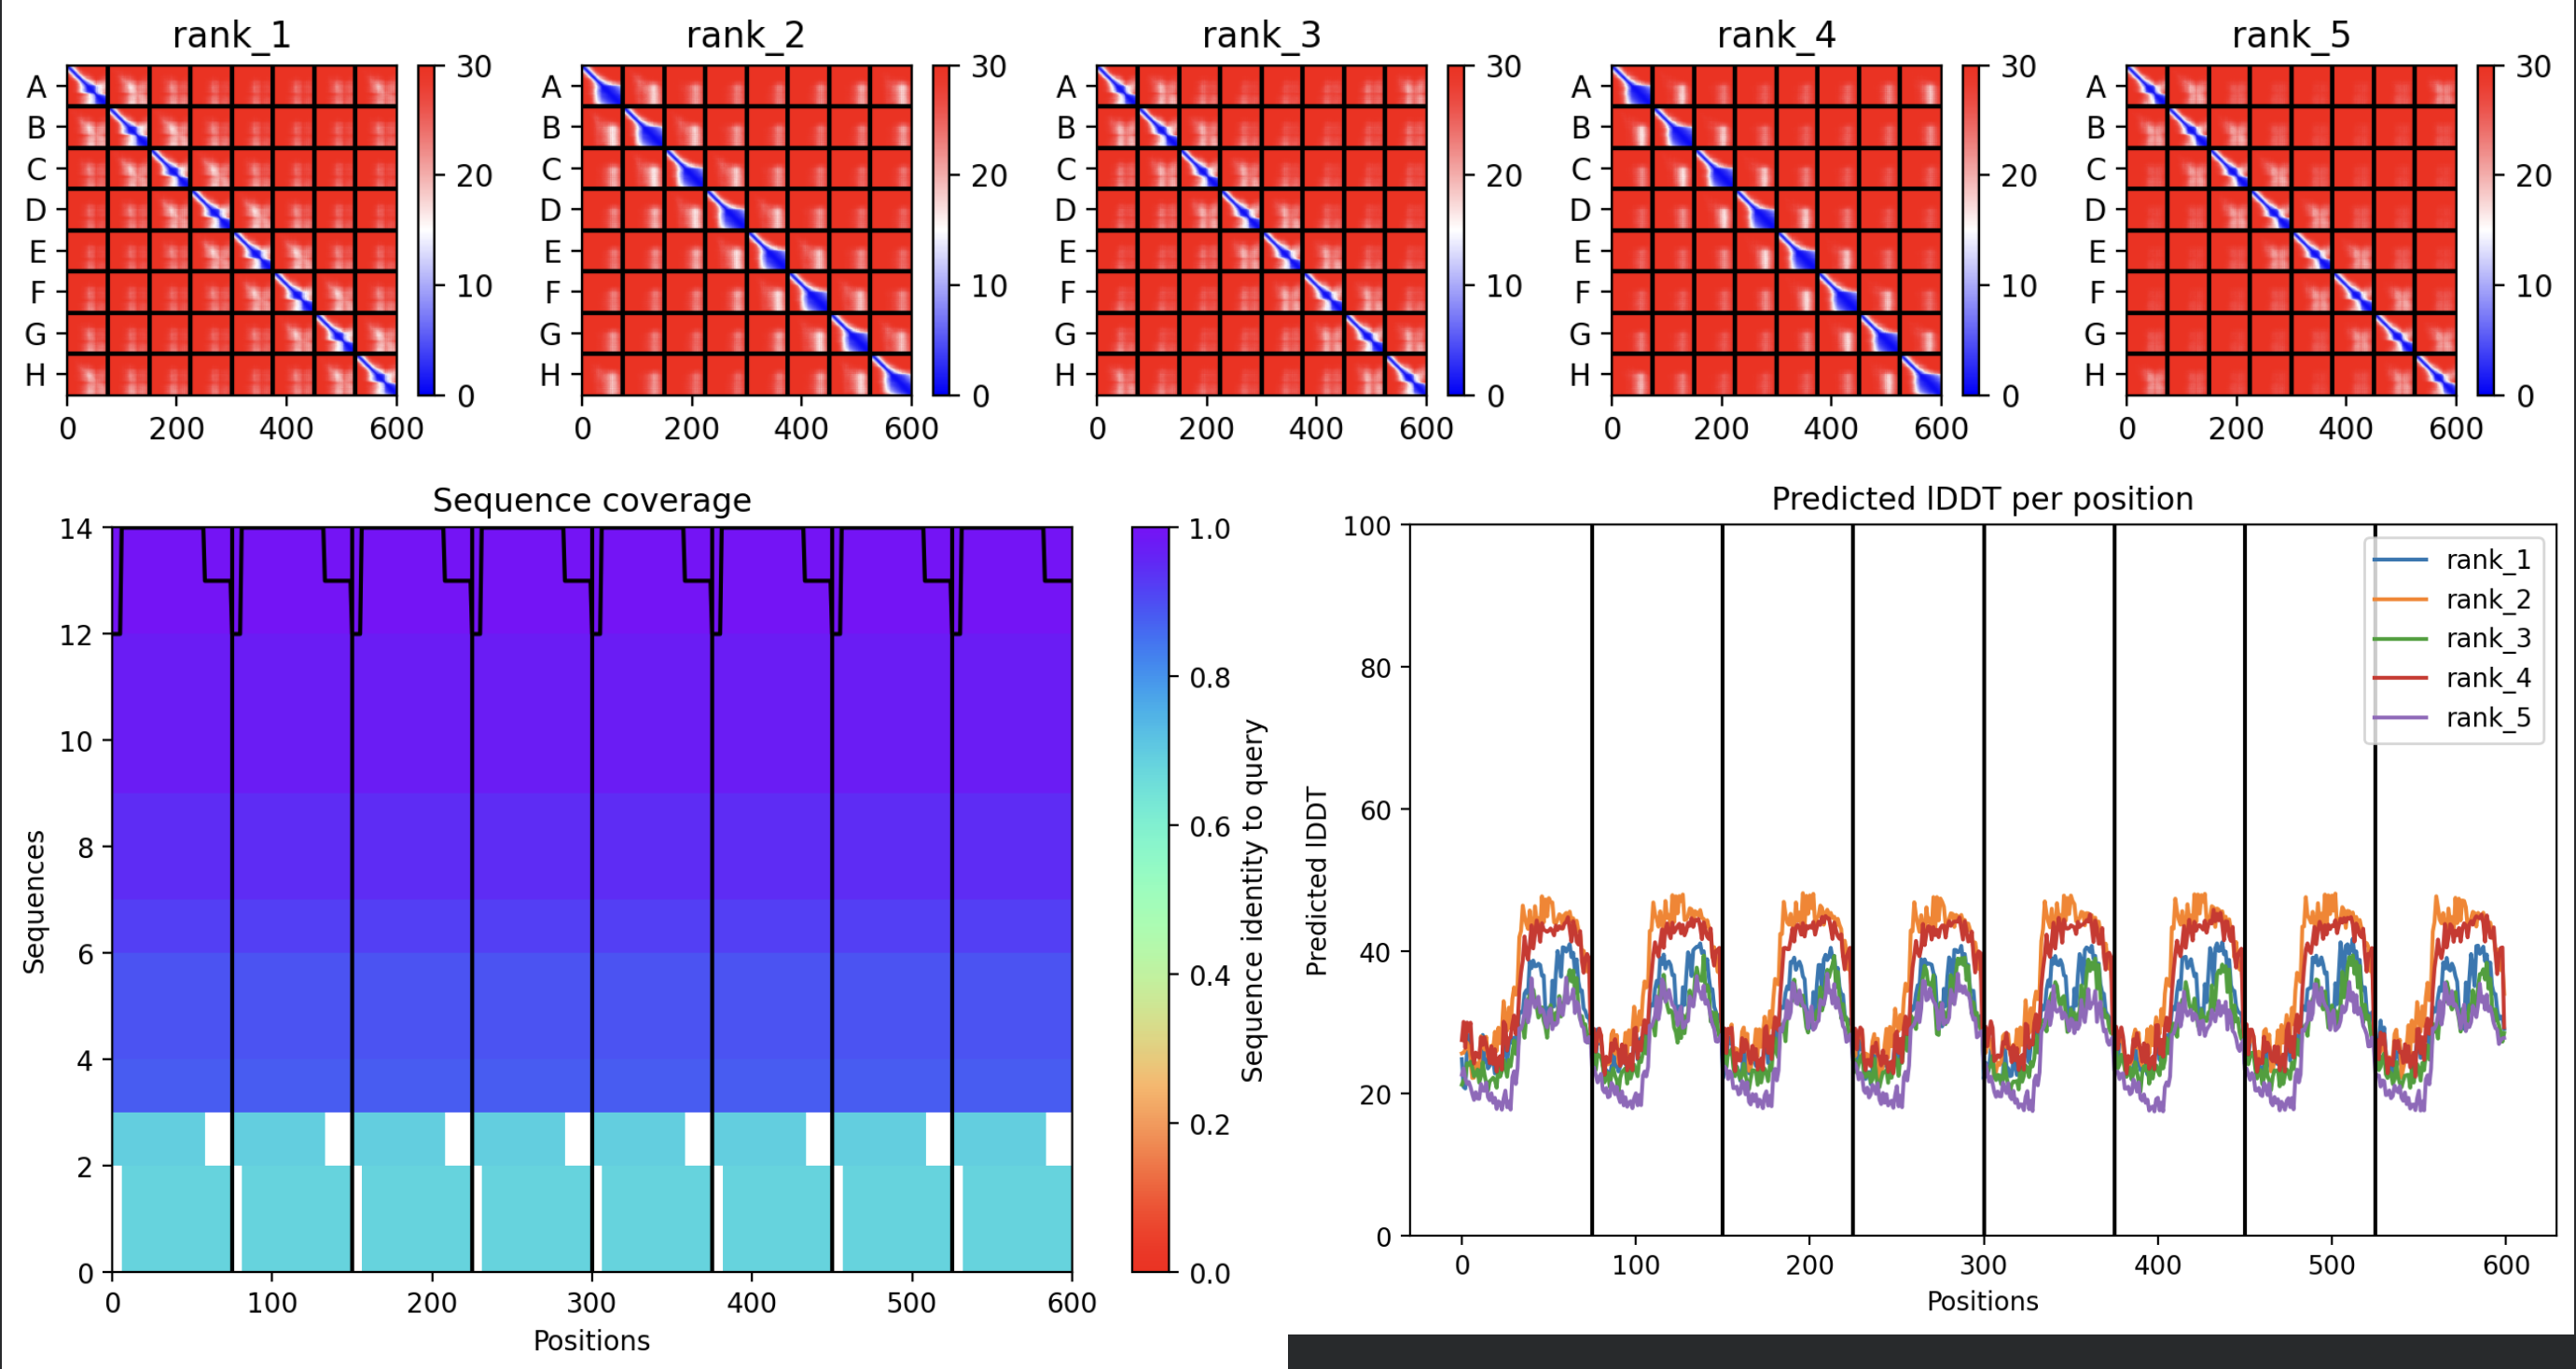
Structural Interpretation
All five ranked models show uniformly very low pLDDT scores (20–28, well below the <50 threshold). The PAE matrices are nearly uniformly red (~25–30 Å error) across all off-diagonal inter-chain blocks, with confidence only on the per-chain diagonal. This means the model cannot confidently place any chain relative to any other.
Despite the low confidence scores, the predicted structures display a biologically interesting pattern: in the Mol* viewer, helical secondary structure is visible at the center of the assembly, with disordered tails radiating outward in a sunburst arrangement. This is consistent with the pore-formation hypothesis for the L-protein. the TM helices converge at the central axis (as expected for a membrane pore), while the soluble N-terminal domains remain disordered and point outward into the cytoplasm. The per-position IDDT plot shows periodic peaks that correspond to the TM helix region of each chain, which is the only portion with marginally higher local confidence (~40–50).
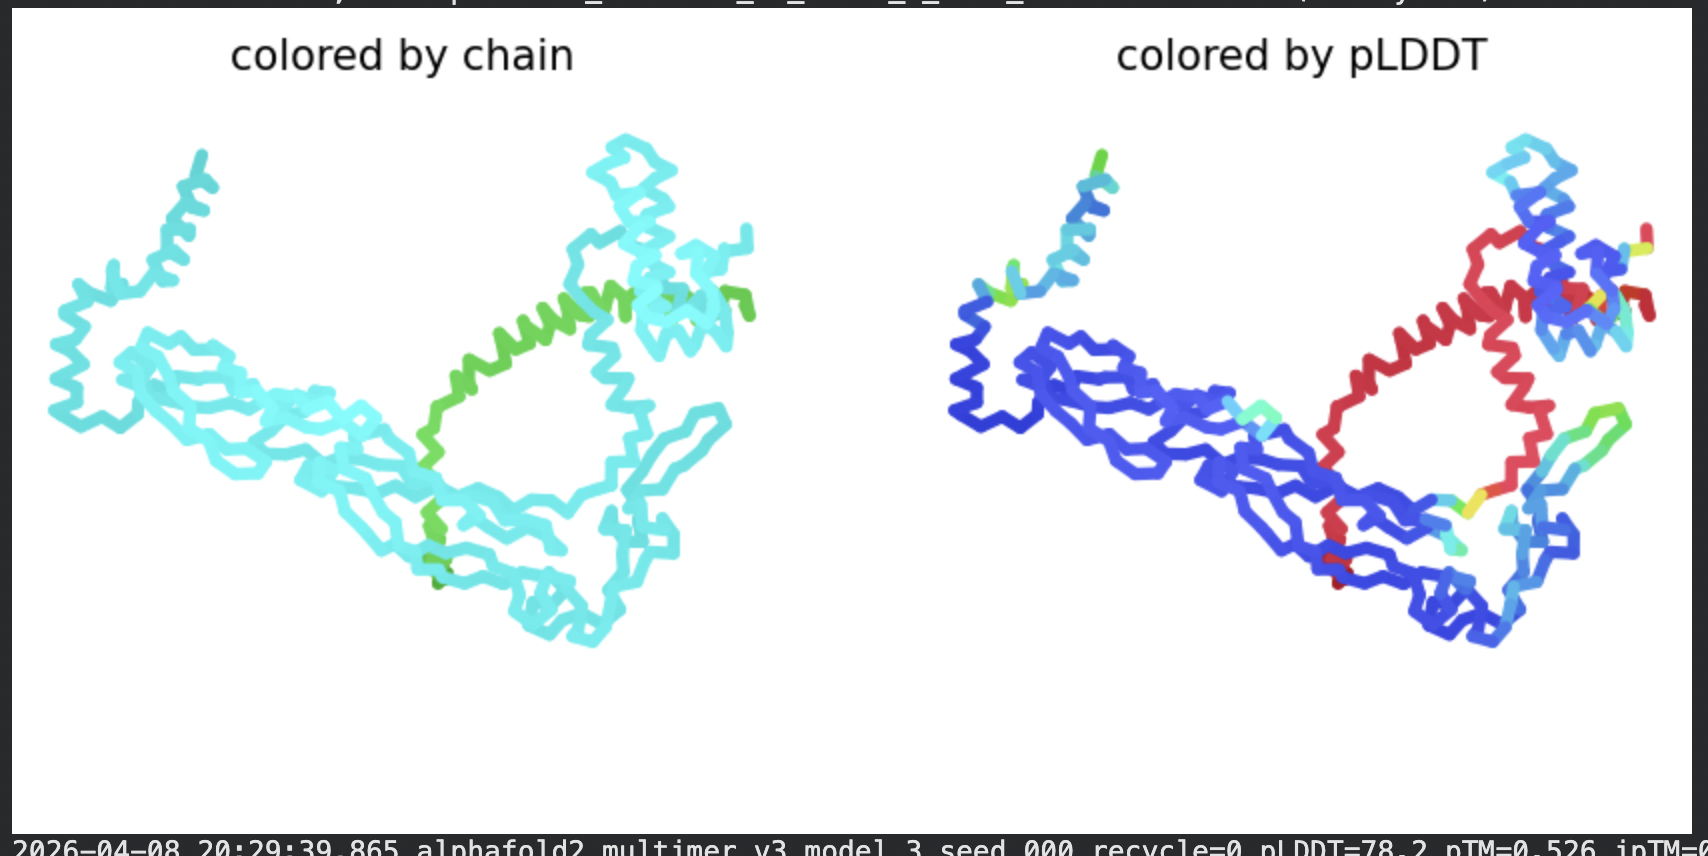
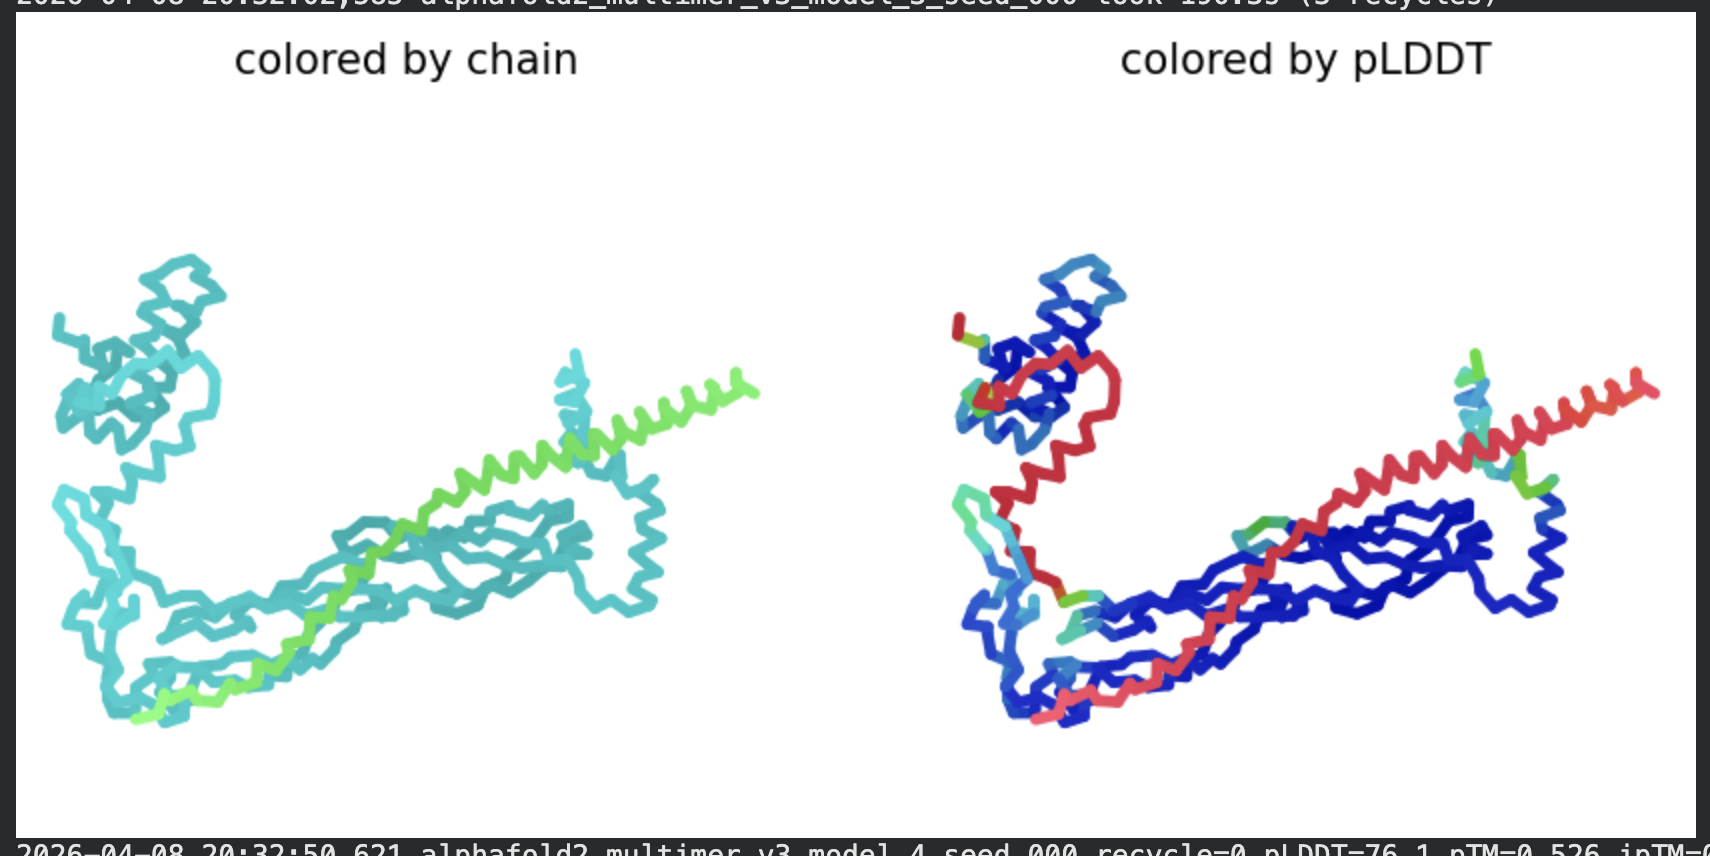
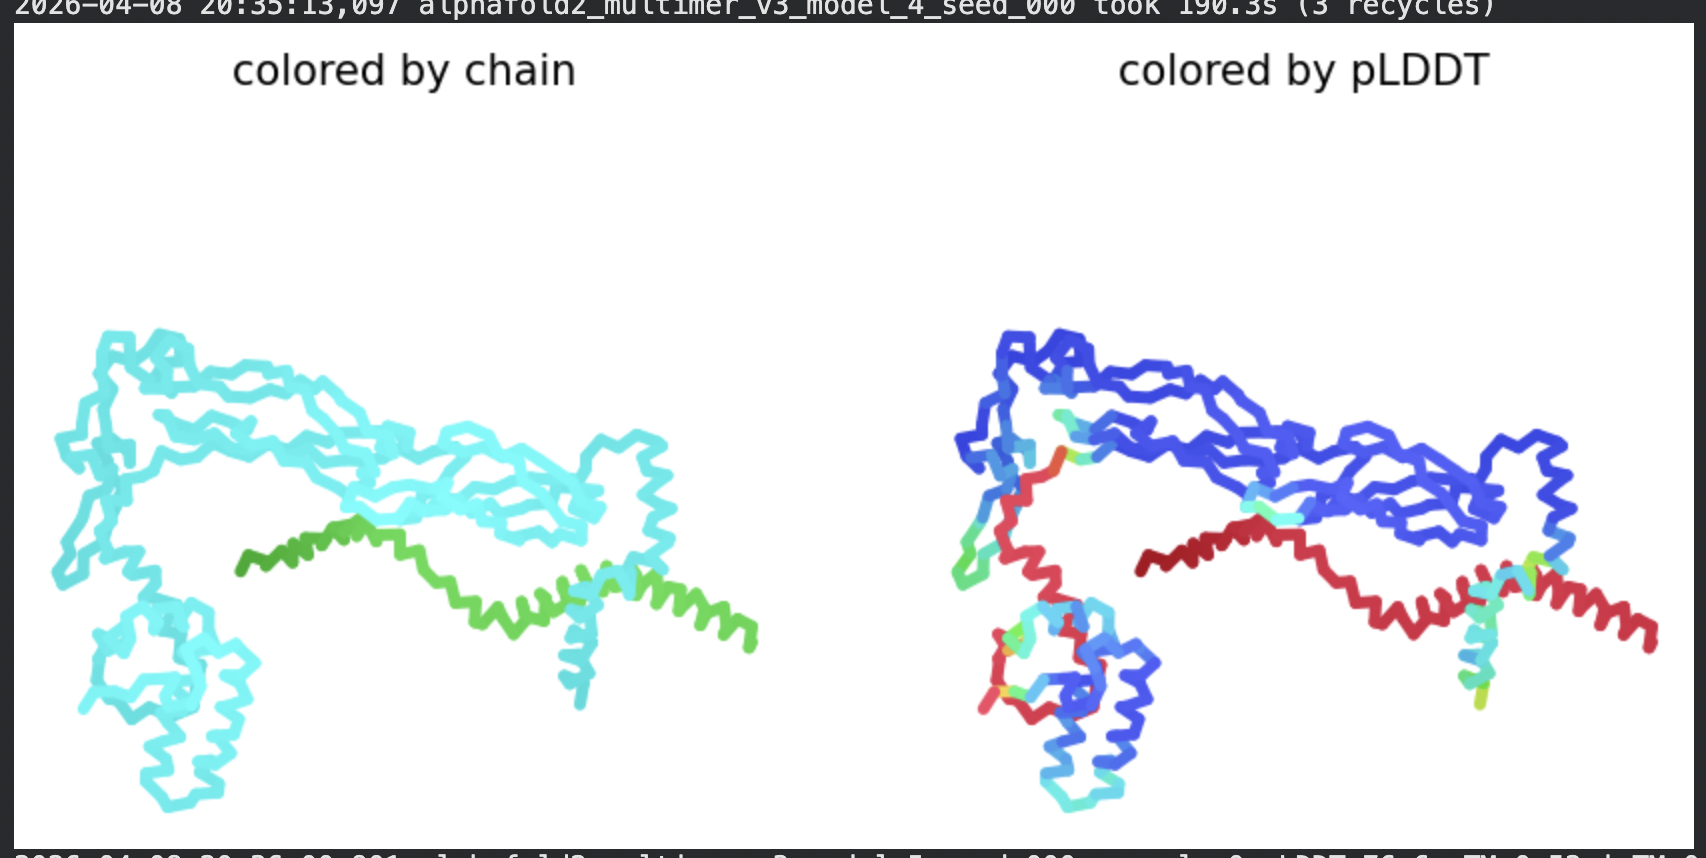
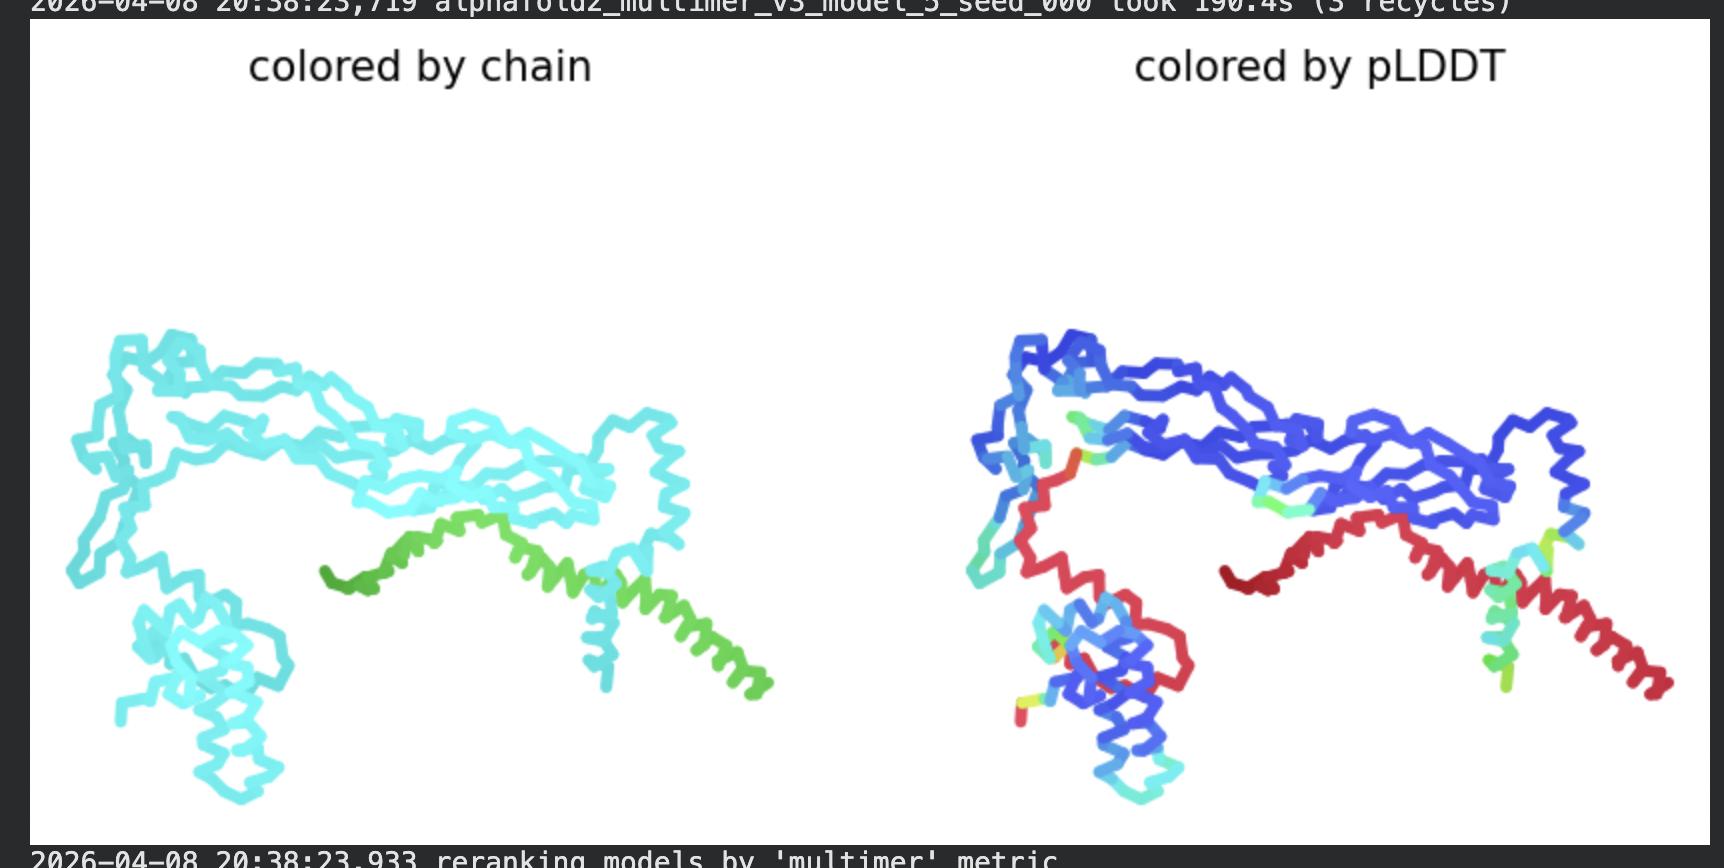
Run 2: L-Protein + DnaJ CoFold
L-protein (mutant sequence, 75 residues, Chain A) + DnaJ (357 residues, Chain B), submitted as a two-chain heterodimer to ColabFold AlphaFold2 Multimer v3
METRFPQQSQQTPASTNRRRPFKHEDYPCRRQQRSSTLYVLIFLAIFLSKFTNQLLLSLLEAVIRTVTTLQQLLT:MAKQDYYEILGVSKTAEEREIRKAYKRLAMKYHPDRNQGDKEAEAKFKEIKEAYEVLTDSQKRAAYDQYGHAAFEQGGMGGGGFGGGADFSDIFGDVFGDIFGGGRGRQRAARGADLRYNMELTLEEAVRGVTKEIRIPTLEECDVCHGSGAKPGTQPQTCPTCHGSGQVQMRQGFFAVQQTCPHCQGRGTLIKDPCNKCHGHGRVERSKTLSVKIPAGVDTGDRIRLAGEGEAGEHGAPAGDLYVQVQVKQHPIFEREGNNLYCEVPINFAMAALGGEIEVPTLDGRVKLKVPGETQTGKLFRMRGKGVKSVRGGAQGDLLCRVVVETPVGLNERQKQLLQELQESFGGPTGEHNSPRSKSFFDGVKKFFDDLTR
| Model | pLDDT | pTM | Notes |
|---|---|---|---|
| Rank 1 | 70.1 | 0.527 | Best ranked by multimer metric |
| Rank 2 | 78.2 | 0.526 | Highest per-residue confidence |
| Rank 3 | 76.1 | 0.526 | Consistent with ranks 1–2 |
| Rank 4 | 76.0 | ~0.52 | Slightly variable L-protein placement |
| Rank 5 | ~75 | ~0.52 | Similar topology to rank 3–4 |
Structural interpretation:
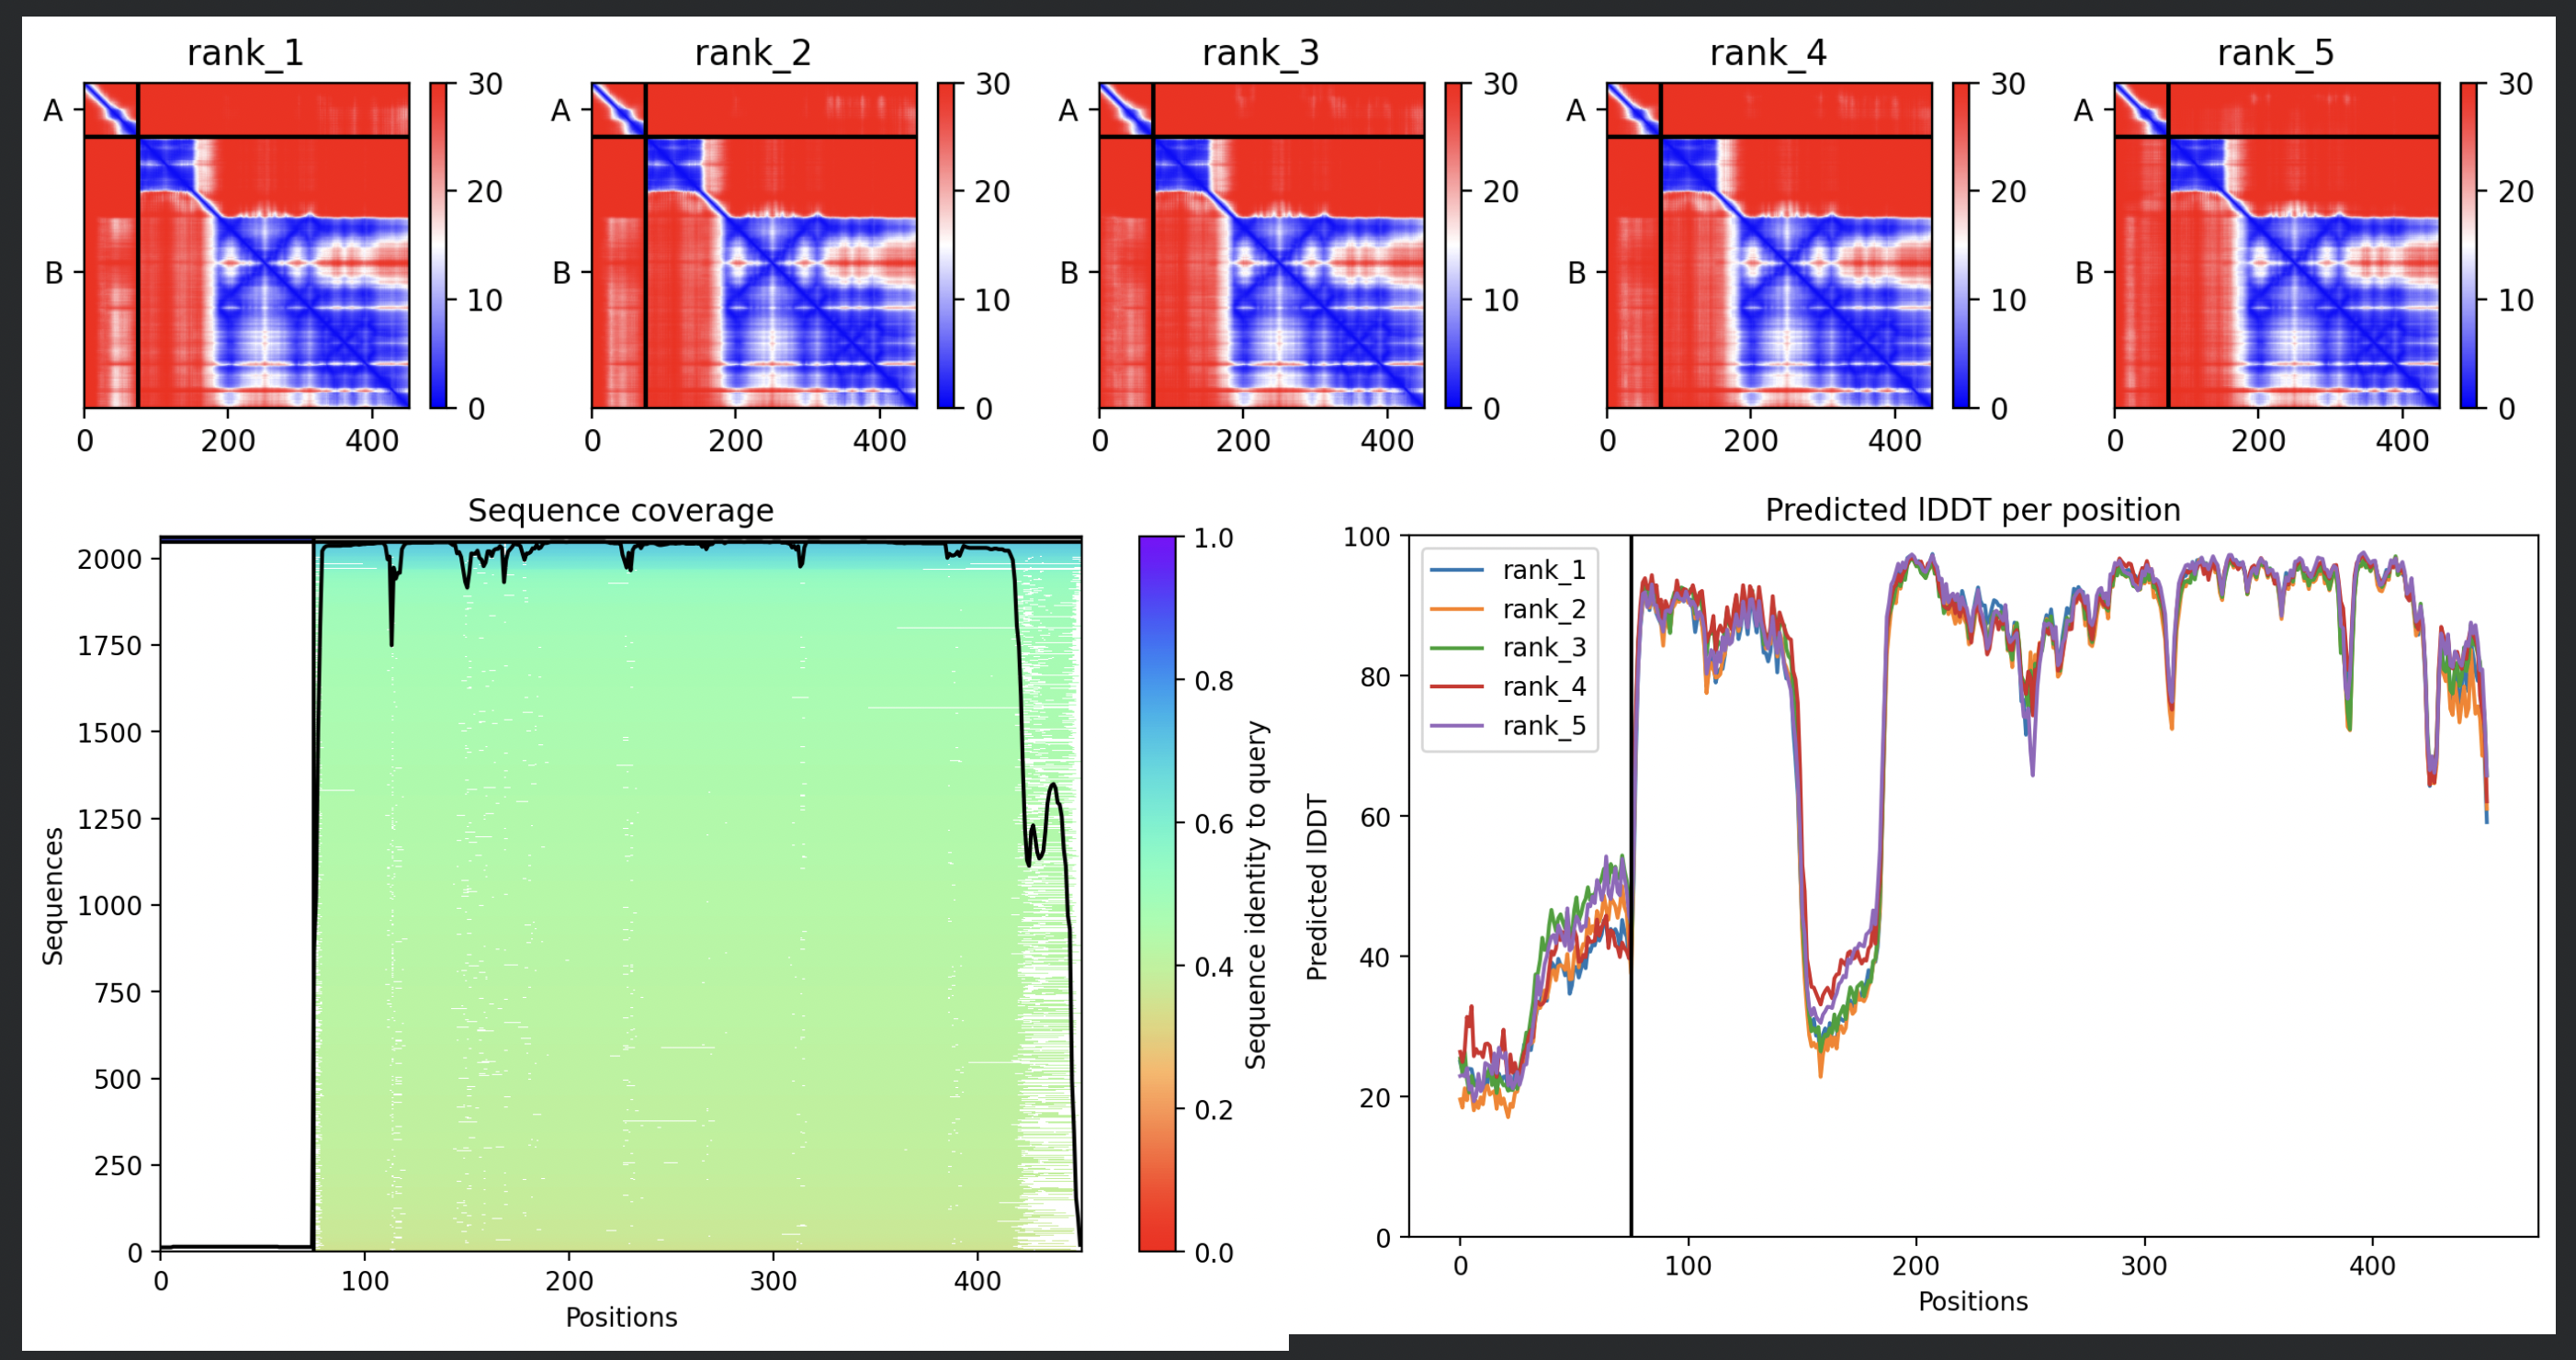
In contrast to the octamer run, the L-protein + DnaJ co-fold produces substantially higher confidence scores across all five models (pLDDT 70–78, pTM ~0.527), indicating that AlphaFold2 can form a meaningful structural prediction for this complex. This difference is expected: DnaJ is a well-characterised soluble protein with rich MSA coverage (~2000 sequences, Image 1), which anchors the prediction and allows confident inter-chain contact modeling.
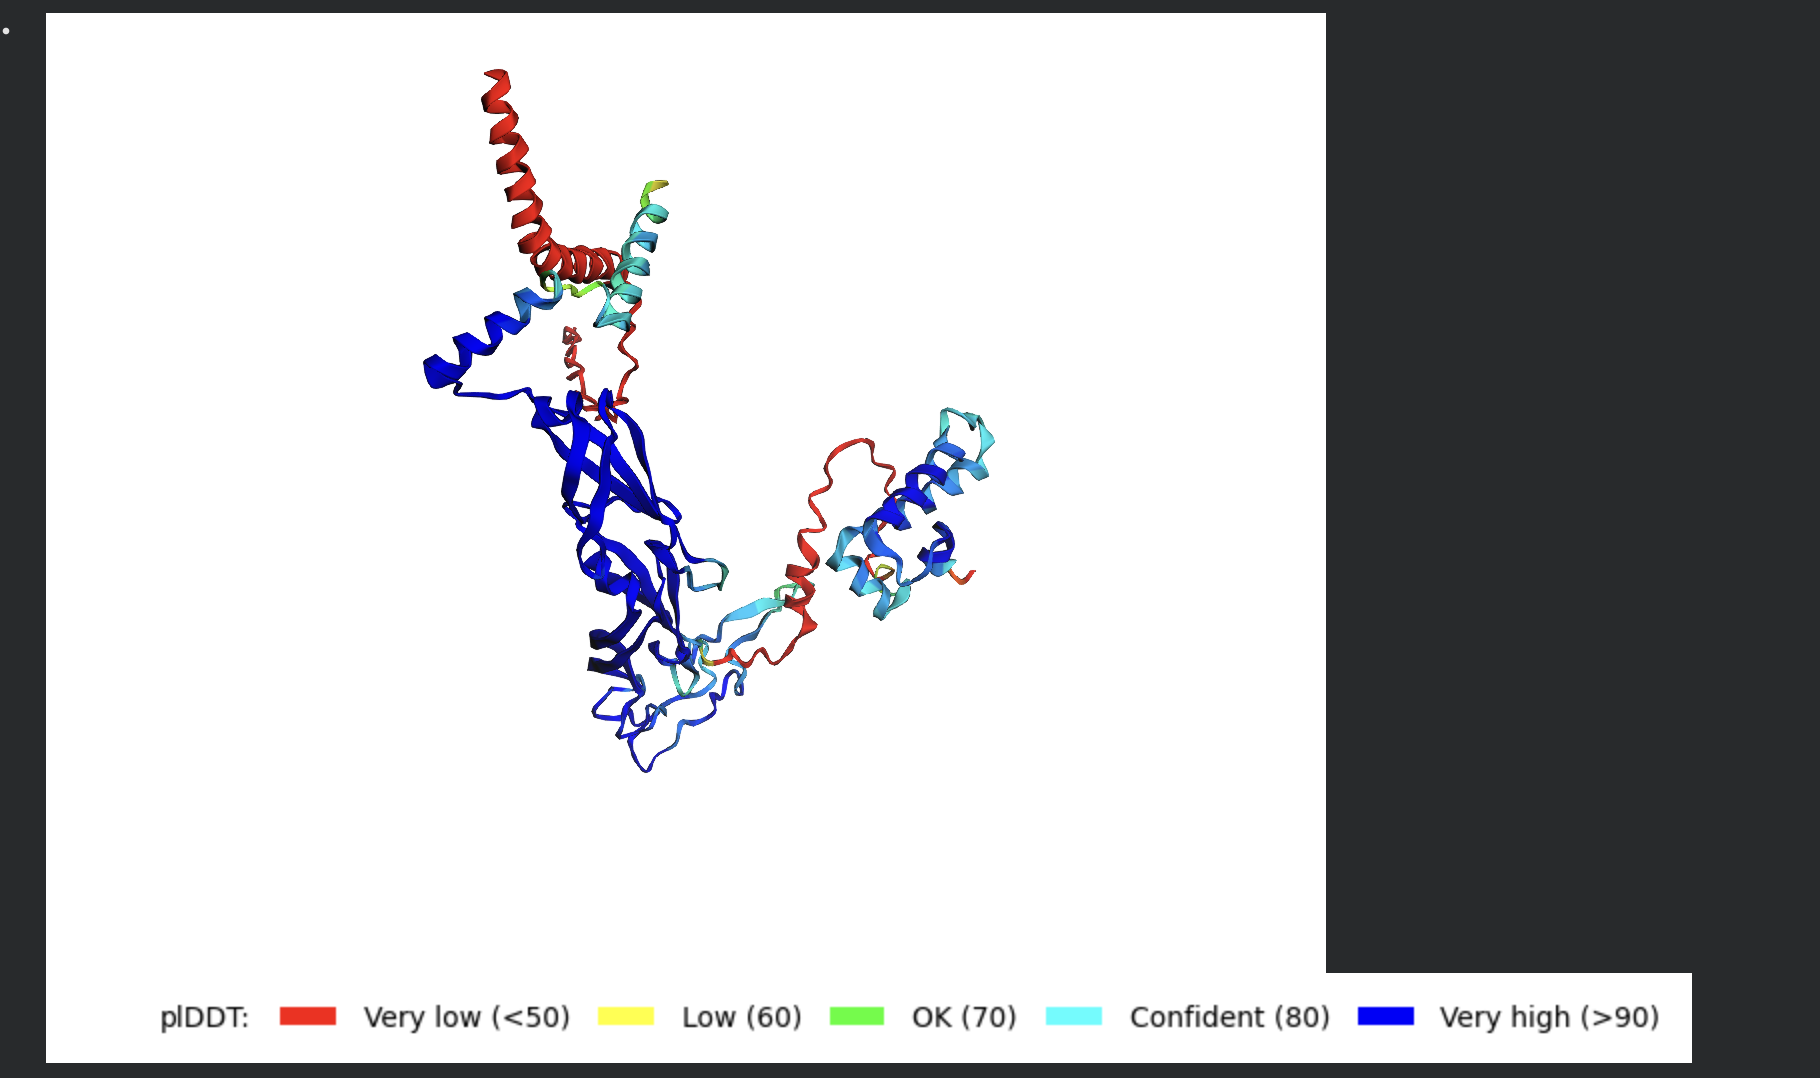
The per-position IDDT plot reveals the key asymmetry of the complex: Chain A (L-protein, positions 0–75) consistently scores in the 20–50 range across all models while Chain B (DnaJ, positions 75–450) scores 80–95 throughout, well into the “confident” to “very high” range. This is biologically meaningful: the L-protein is a largely disordered, membrane-dependent protein that AF2 cannot confidently fold in isolation, while DnaJ is a structured chaperone that the model predicts with high accuracy. The L-protein’s low per-residue confidence does not invalidate the interaction prediction — it reflects the intrinsic disorder of the L-protein rather than a failure of the complex model.
All five ranked models show distinct blue (low error, ~0–10 Å) regions in the inter-chain quadrants, specifically, the L-protein (chain A, rows 0–75) shows confident predicted placement relative to the N-terminal J-domain region of DnaJ (approximately positions 100–250 in chain B). This is a strong signal: the model is confidently predicting that the L-protein contacts DnaJ, and that the interaction interface is localised rather than diffuse. Crucially, the contact region maps to L-protein residues in the soluble N-terminal domain (residues 1–40), not the TM domain — consistent with the published biological evidence that DnaJ interacts with the soluble domain of the L-protein (Chamakura et al., 2017).
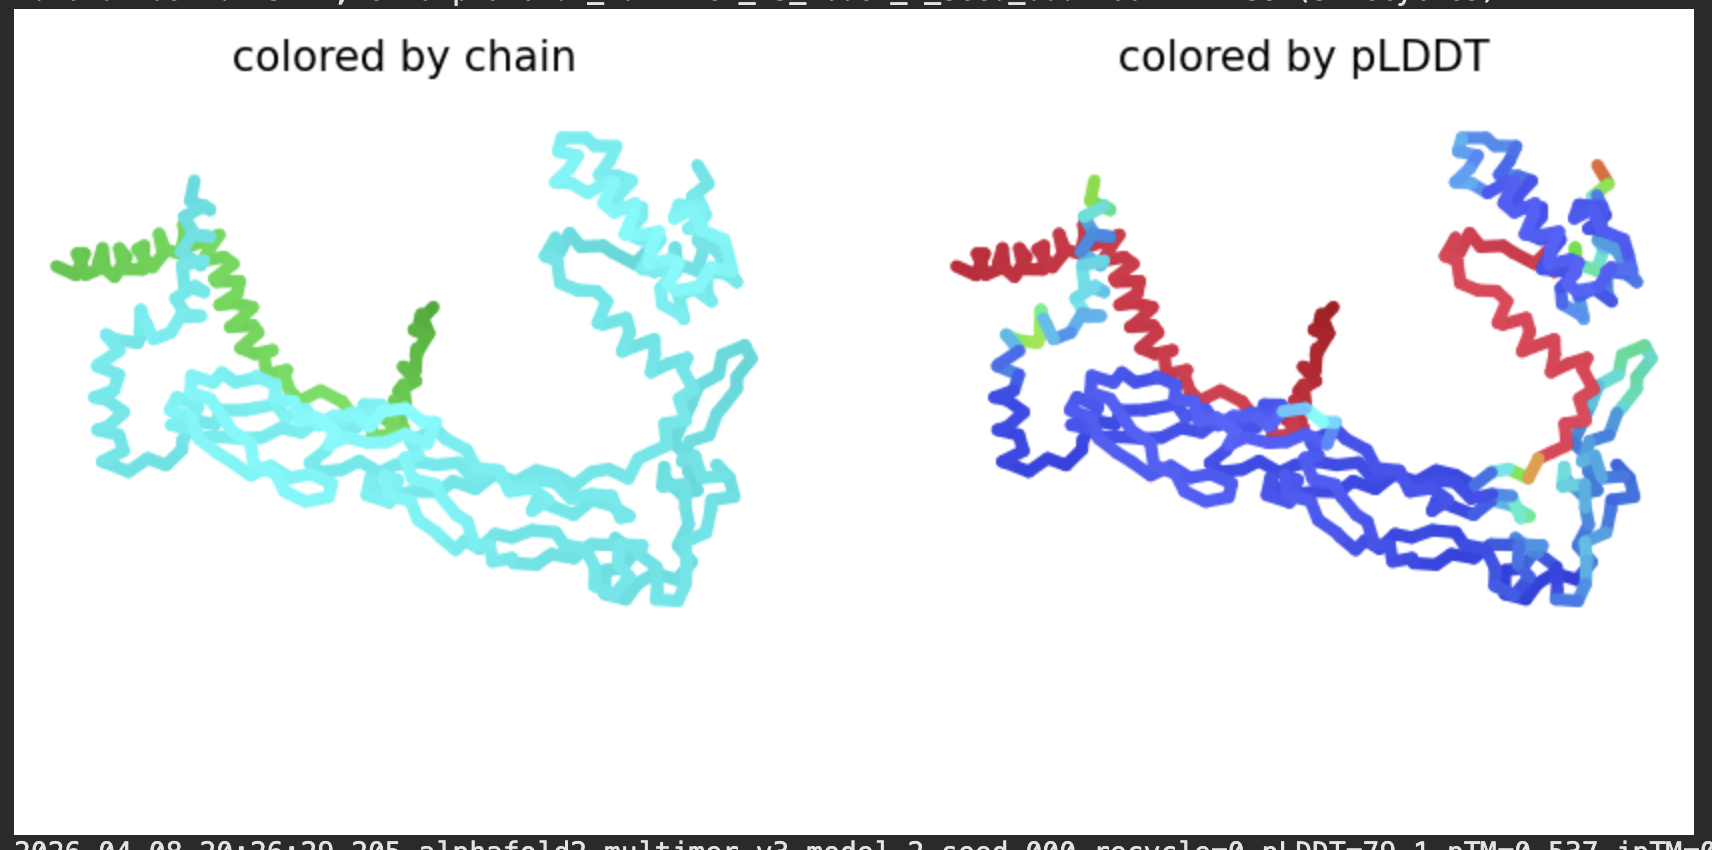
The Mol* structure shows DnaJ folded as a large, confident beta-sheet and helix domain (blue/dark blue throughout), with the L-protein appearing as a short helix (red, low pLDDT) docked against DnaJ’s surface at the J-domain. The helical secondary structure of the L-protein’s TM region is partially preserved even in this soluble context, appearing as a compact helical element adjacent to the DnaJ interaction surface.
Relevance to proposed mutations:
Three of the five proposed mutations (S9Q, F22R, and C29R) fall directly within the soluble domain (residues 1–40) that the PAE matrix identifies as the predicted DnaJ contact region. This strongly supports their therapeutic rationale:
C29R introduces a positively charged arginine at a cysteine position within the predicted interface. This could either strengthen hydrophilic contacts with DnaJ or, more importantly, sterically and electrostatically disrupt the native interaction — potentially enabling DnaJ-independent folding by forcing the L-protein to adopt a stable conformation without chaperone assistance.
F22R replaces an aromatic residue with arginine at another interface-proximal position, similarly altering the electrostatic character of the binding surface.
S9Q lies at the N-terminal edge of the predicted contact zone; the glutamine substitution introduces new hydrogen-bonding capacity that could stabilize the soluble domain’s fold autonomously.
The two TM mutations (K50L and N53L) fall in Chain A positions beyond the confident inter-chain contact region, consistent with TM residues not participating in DnaJ binding — instead targeting membrane insertion efficiency independently of the DnaJ interaction.
The L-protein’s low per-residue pLDDT throughout means the exact contact geometry should be treated as a hypothesis rather than a reliable atomic model. AlphaFold2 lacks membrane context, so the TM domain is modeled as if soluble. Validation via co-immunoprecipitation or crosslinking mass spectrometry of the wildtype and mutant complexes would be required to confirm the predicted interface. A more reliable structural prediction for just the soluble domain co-folded with DnaJ’s J-domain (rather than full-length L-protein) could also be attempted, as this would focus modeling resources on the well-defined interaction region.