Week 10 HW: Imaging and Measurement
Final Project: Measurements
Tthe primary measurable output is indigoidine production by engineered Ganoderma lucidum in response to mechanical and other stress conditions. The key measurement aspects are:
- Indigoidine quantification — The most direct readout of bpsA expression and BpsA enzyme activity is the blue pigment indigoidine, which has a peak absorbance at 590 nm. I will use the Spark Plate Reader to measure absorbance at 590 nm across all stress conditions (mechanical compression, osmotic, heat, no-stress control) in 384-well format, with a standard curve of purified indigoidine (0–100 µM) to convert absorbance to concentration. This gives a quantitative measure of promoter activity under each stress condition and is the primary success metric for Aim 1.
2. Construct integration verification — Colony PCR + gel electrophoresis After PEG-mediated transformation of G. lucidum, I will use colony PCR with one primer outside the leu2 homology arm (genomic) and one inside bpsA to confirm correct genomic integration. The expected band is ~800 bp. Gel electrophoresis on a 1.5% agarose gel with ethidium bromide staining will visualize the PCR product.
3. Single-copy integration confirmation — qPCR (CFX Opus) Quantitative PCR will compare the copy number of the integrated bpsA gene relative to a single-copy genomic reference gene, confirming that the construct has integrated once (not multi-copy tandem insertions that could confound expression data).
4. Protein-level confirmation — SDS-PAGE and Western blot If indigoidine production is detected, I will confirm BpsA protein expression by running total cell lysate on SDS-PAGE (expected band ~141 kDa) and probing with an anti-His antibody (the construct does not include a His-tag in the current design — this could be added in Aim 2 for easier detection).
5. Mass spectrometry (future Aim 2) If I can purify BpsA from the engineered strain, intact protein LC-MS on a system like the Waters Xevo G3 QTof would confirm the molecular weight of the expressed protein and verify it matches the predicted 141 kDa, ruling out truncation or incorrect translation. Peptide mapping after tryptic digest would further confirm the primary sequence of the expressed BpsA.
Waters Part I Molecular Weight
Question 1: Based on the predicted amino acid sequence of eGFP (see below) and any known modifications, what is the calculated molecular weight?
Using the ExPASy Compute pI/Mw tool with the provided eGFP sequence
Theoretical MW = 28,006.60 Da
Question 2: Calculate the molecular weight of the eGFP using the adjacent charge state approach described in the recitation.
Using the two adjacent charge state peaks:
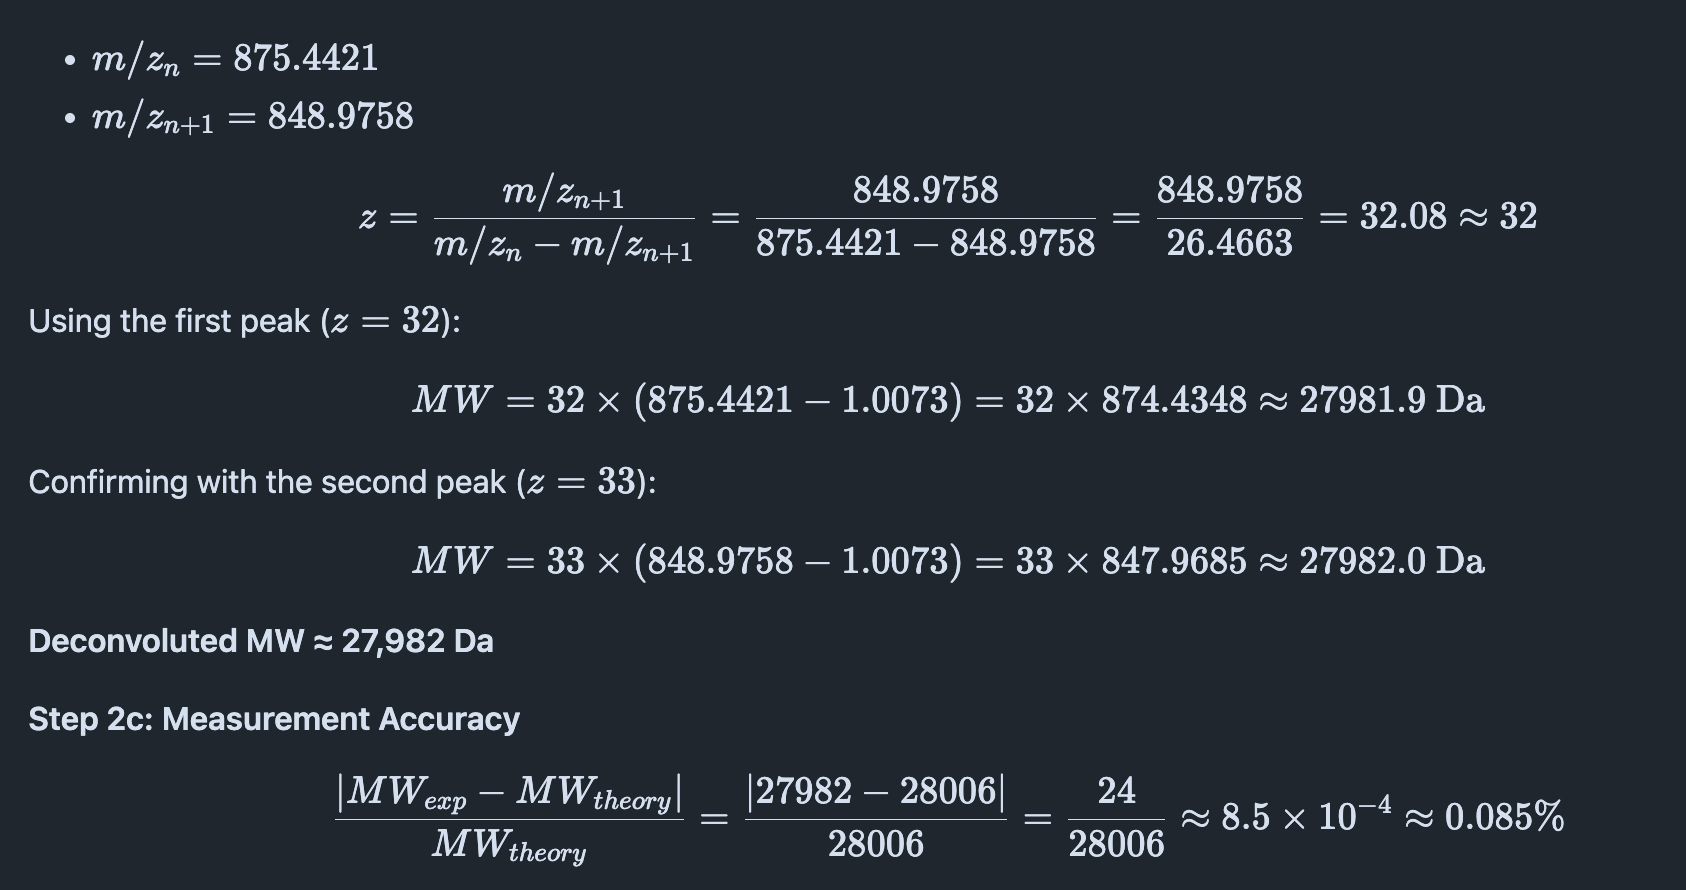
Deconvoluted MW ≈ 27,982 Da
Question 3: Can you observe the charge state for the zoomed-in peak in the mass spectrum for the intact eGFP? If yes, what is it? If no, why not?
No, the charge state cannot be determined from the zoomed-in peak. Determining the charge state requires at least two adjacent charge-state peaks so their spacing can be used to calculate $z$. In the zoomed region, only a single isolated peak is shown with no neighboring charge-state peak visible, so there is insufficient information to assign a charge state.
Waters Part III — Peptide Mapping (Primary Structure)
Q1.How many Lysines (K) and Arginines (R) are in eGFP? Please circle or highlight them in the eGFP sequence given in Waters Part I question 1 above.
There are 20 Lysines (K) and 6 Arginines (R) in the eGFP sequence, for a total of 26 cleavage sites.
Highlighted sequence (K and R in bold):
MVSKGEELFTGVVPILVELDGDVNGHKFSVSGEGEGDATYGKLTLKFICTTGKLPVPWPTLVTTLTYGVQCFSRYPDHMKQHDFFKSAMPEGYVQERTIFFKDDGNYKTRAEVKFEGDTLVNRIELKGIDFKEDGNILGHKLEYNYNSHNVYIMADKQKNGIKVNFKIRHNIEDGSVQLADHYQQNTPIGDGPVLLPDNHYLSTQSALSKDPNEK****RDHMVLLEFVTAAGITLGMDELYKLEHHHHHH
Q2. How many peptides will be generated from tryptic digestion of eGFP?
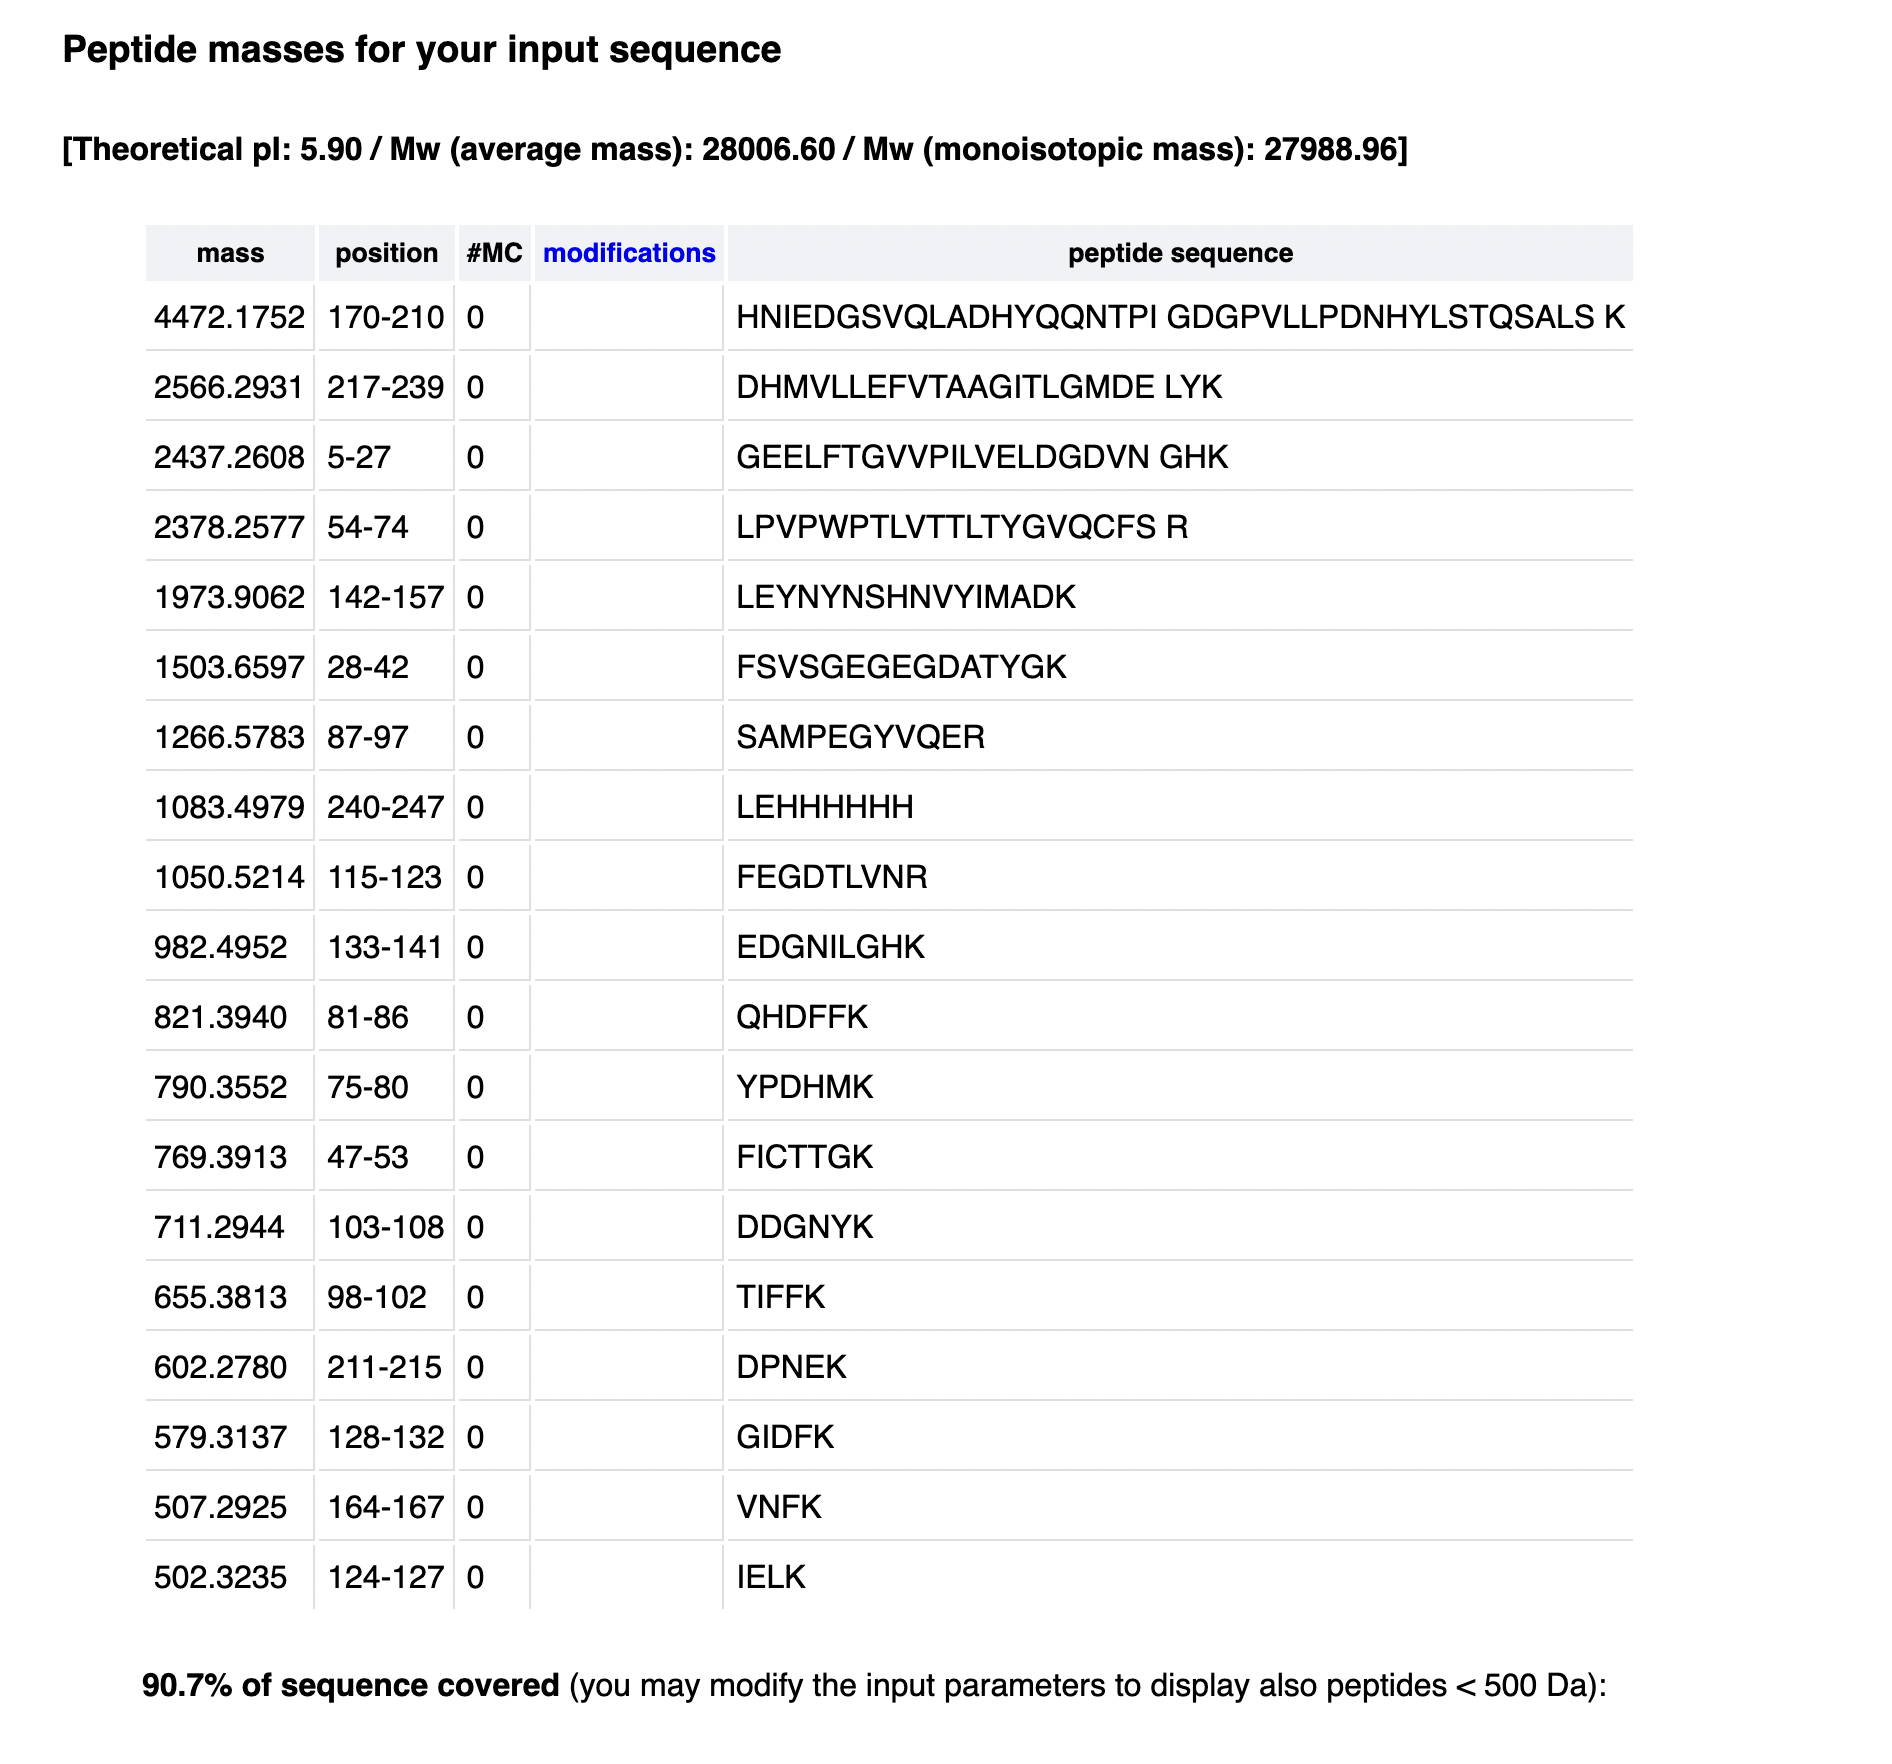
Using the PeptideMass tool at https://web.expasy.org/peptide_mass/ with the eGFP sequence, trypsin as enzyme, no missed cleavages, and the parameters shown in Figure 4, the tool generates 19 tryptic peptides.
Q3. Based on the LC-MS data for the Peptide Map data generated in lab (please use Figure 5a as a reference) how many chromatographic peaks do you see in the eGFP peptide map between 0.5 and 6 minutes? You may count all peaks that are >10% relative abundance.
Counting peaks above 10% relative abundance in Figure 5a between 0.5 and 6 minutes, there are approximately 18–20 chromatographic peaks visible in the total ion chromatogram.
Q4. Assuming all the peaks are peptides, does the number of peaks match the number of peptides predicted from question 2 above? Are there more peaks in the chromatogram or fewer?
Accounting for all peaks the total would be 22, more than the predicted 19 peaks
Q5. Identify the mass-to-charge of the peptide shown in Figure 5b. What is the charge of the most abundant charge state of the peptide (use the separation of the isotopes to determine the charge state). Calculate the mass of the singly charged form of the peptide ([M+H])+ based on its m/z and z.
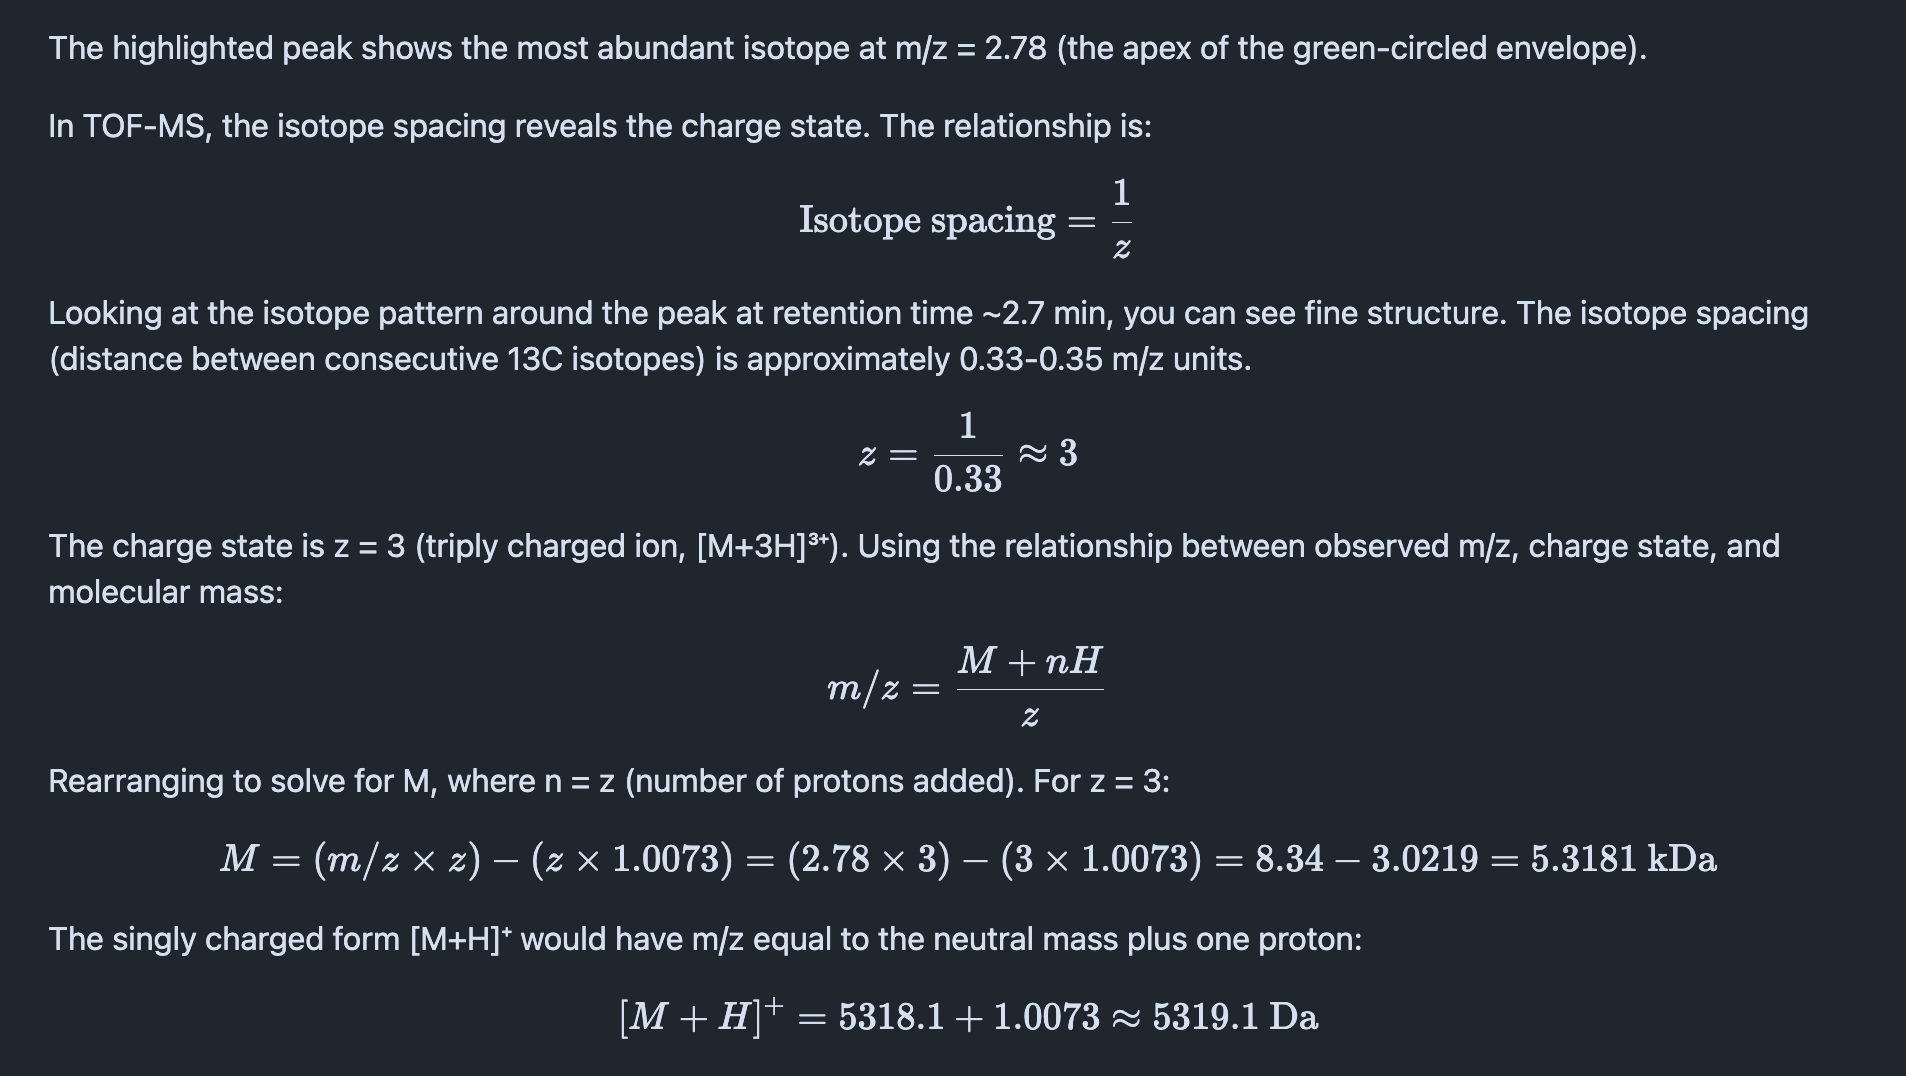
The singly charged form [M+H]⁺ would have m/z equal to the neutral mass plus one proton:
$$[M+H]^+ = 5318.1 + 1.0073 \approx 5319.1 \text{ Da}$$
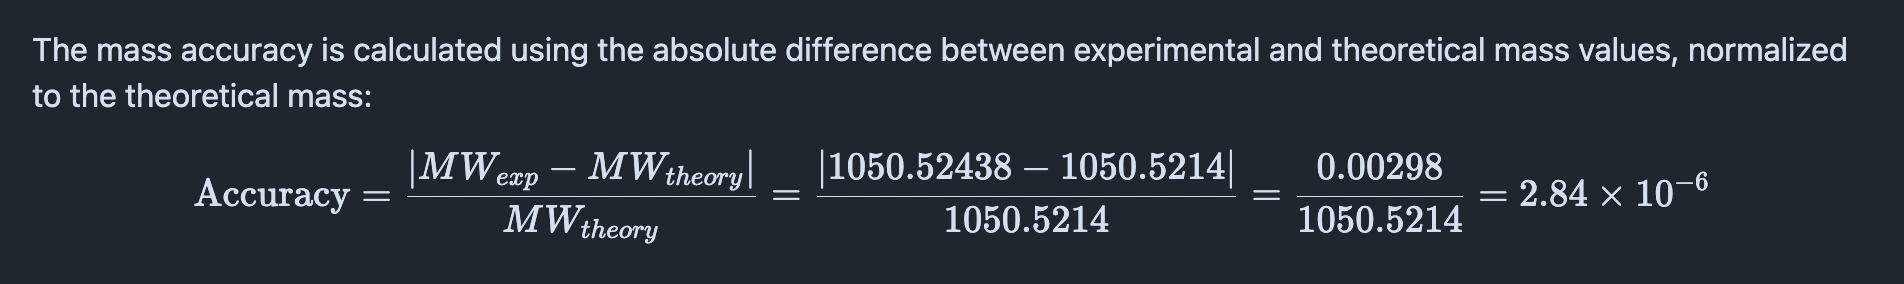
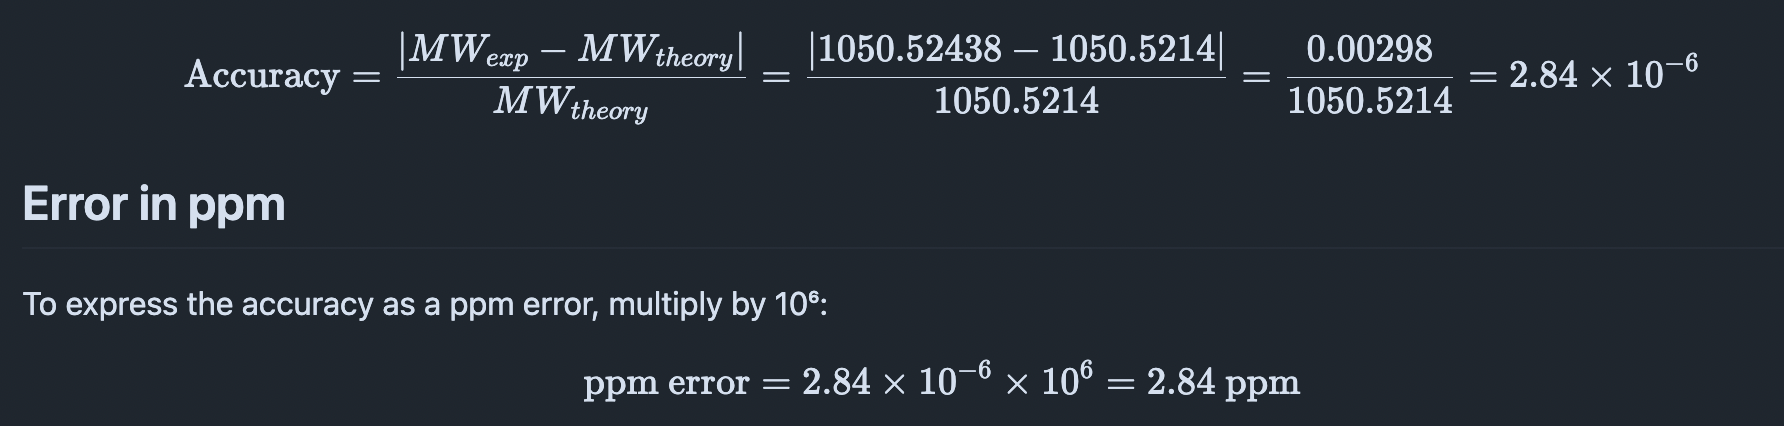
Q6. Identify the peptide based on comparison to expected masses in the PeptideMass tool. What is mass accuracy of measurement? Please calculate the error in ppm.
- Observed peptide mass (MW_experiment): 1050.52438 Da
- Theoretical peptide mass (MW_theory): 1050.5214 Da
The mass accuracy is calculated using the absolute difference between experimental and theoretical mass values, normalized to the theoretical mass:
Error in ppm
Final Answer
- Observed peptide mass: 1050.52438 Da
- Closest predicted peptide mass: 1050.5214 Da
- Mass error: 2.84 ppm
- Assessment: This error is well below the <10 ppm threshold, indicating excellent measurement accuracy for high-resolution mass spectrometry
Q7. Number of peptides from tryptic digestion
88 percent
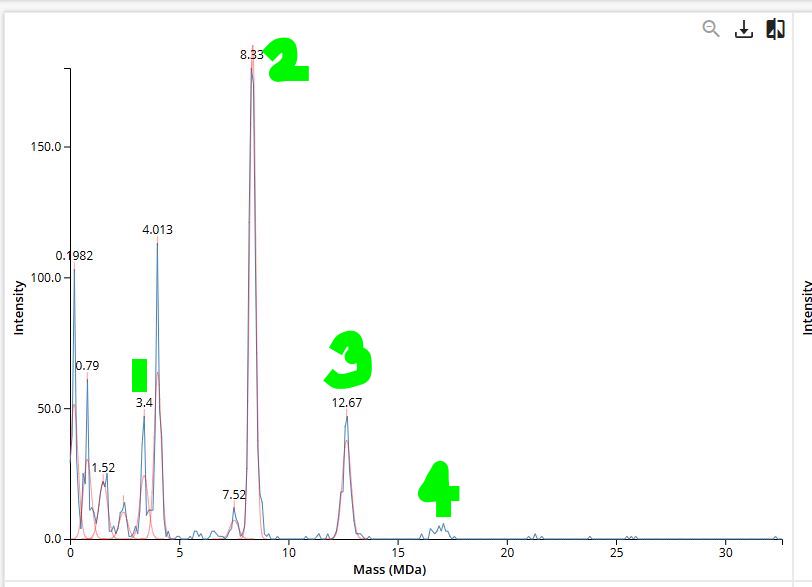
Homework: Waters Part IV — Oligomers
The oligomer masses are
- 7FU Decamer: Mass = 10 x 340 kDa = 3400 kDa (3.4 (MDa))
- 8FU Didecamer: Mass = 20 x 400 kDa = 8000 kDa (8 (MDa))
- 8FU 3-Decamer: 30 × 400 kDa = 12,000 kDa (12 MDa)
- 8FU 4-Decamer: 40 × 400 kDa = 16,000 kDa (16 MDa)
Waters Part V — Did I Make GFP?
| Parameter | Theoretical (Da) | Observed (Da) | PPM Mass Error |
|---|---|---|---|
| eGFP molecular weight | 28,006.60 | 27,982.0 | 857 ppm |