Homework is partly based on data that will be generated in the Waters Immerse Lab in Cambridge, MA. Students will characterize green fluorescent protein (eGFP, a recombinant protein standard) structure (primary, secondary/tertiary) in the lab using liquid chromatography and mass spectrometry, as well as Keyhole Limpet Hemocyanin (KLH) oligomeric states using charge detection mass spectrometry (CDMS). Data generated in the lab needed to do the homework is included both within this document and in the Appendix of the laboratory protocol.
  Please identify at least one (ideally many) aspect(s) of your project that you will measure. It could be the mass or sequence of a protein, the presence, absence, or quantity of a biomarker, etc.

  Please describe all of the elements you would like to measure, and furthermore describe how you will perform these measurements.
There are many measurements that could be taken. The DNA of the mites and their larva is a target. In addition the bacteria and other microbiota and parasites that capitalize on the infestation damage to the host epidermis. This ofcourse brings up the geometry of the host tissue and biochemical molecules all of which can be measured quantiatively or qualitatively. Specifically, when it comes to host cells there are living and deceased keratinocytes and corneocytes and the odd hair follicle, especially in most heavily infested cases. There is superinfection residues full of bacterial cocci and rods or periods and semi colons as Dr. Betsy Dyer writes. There crushed and desciated erythrocytes, platelets, and leukocytes. In addition there will be scattering fluctuations of neturophils, eosinophils, macrophages, and lymphocytes. In addition, goats are always on the move grazing when they’re not cuddled up in hay or dirt. Therefore there will be pollen grains, plant frags, seed husks and hay chaff, and plant hairs in addition to other ecotoparasites. What I want to measure most though is stress.
What are the technologies you will use (e.g., gel electrophoresis, DNA sequencing, mass spectrometry, etc.)? Describe in detail.
What does the farmer’s molecular lab contain. This will certainly increase in the coming decades as the struggle to draw nutrients from the Earth is increasingly a necessity and struggle. The same for the labor of keeping herds alive admist the global conflagurations and increasing heat and parasites. I predict by the time I retire to the dirt every farmer worth their salt will have a ready supply of gel electrophoresis, DNA sequencing, and mass spectrometry equipment and proper freezer in their shed lest they have a lab in Boston at the ready to ring.
Homework: Waters Part I — Molecular Weight
We will analyze an eGFP standard on a Waters Xevo G3 QTof MS system to determine the molecular weight of intact eGFP and observe its charge state distribution in the native and denatured (unfolded) states. The conditions for LC-MS analysis of intact protein cause it to unfold and be detected in its denatured form (due to the solvents and pH used for analysis).
Based on the predicted amino acid sequence of eGFP (see below) and any known modifications, what is the calculated molecular weight? You can use an online calculator like the one at
The high MW estimate from Benchling is 28006.50 Da for 1-247 AA. The low MW estimate with BLAST search and selection of P42212 · GFP_AEQVI combined with the ExPASy calculator 1-238 AA link resulted in Compute pI/MW - Results
GFP_AEQVI (P42212)
Description:
Green fluorescent protein
Organism:
Aequorea victoria (Water jellyfish) (Mesonema victoria)
The parameters have been computed for the following feature:
FT CHAIN 1 238 Green fluorescent protein
The computation has been carried out on the complete sequence (238 amino acids).
Molecular weight (Da):
26886.32 (average mass)
26869.36 (monoisotopic mass)
Theoretical pI:
5.67
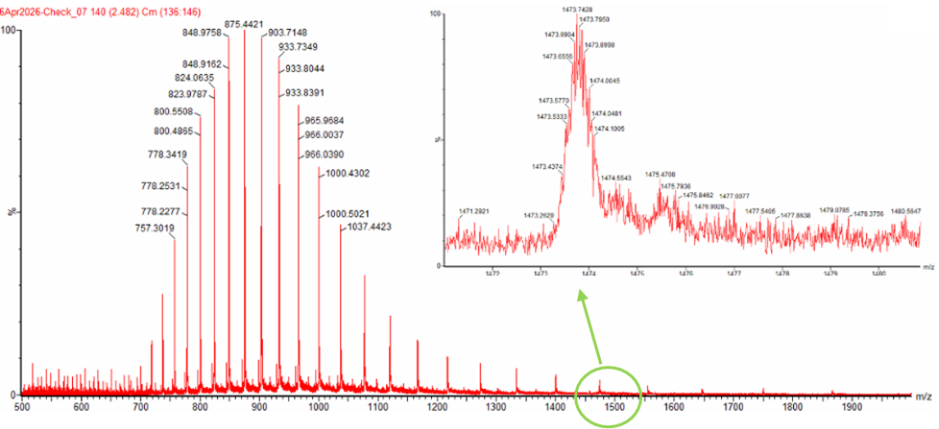
Calculate the molecular weight of the eGFP using the adjacent charge state approach described in the recitation. Select two charge states from the intact LC-MS data (Figure 1) and:
Q
Determine z for each adjacent pair of peaks (n, n+1).
A
[ z = (m/zn+1) / ((m/zn) − (m/zn+1)) ]
Q
Determine z for adjacent peaks at m/z 875.4421 and 903.7148.1
A
Formula:
z = (m/zn+1) / ((m/zn) − (m/zn+1))
Substitute values:
z = 903.7148 / (875.4421 − 903.7148)
Simplify denominator:
z = 903.7148 / (−28.2727)
Solve:
z ≈ −31.96
Take absolute value:
z ≈ 32
Therefore, the charge state is +32.
1 Peak values adapted from Ade Larsen homework data. Formatting of LaTeX blocks for math inside Git using the AI protocol droid Chat-GPT.
Q
Determine the MW of the protein using the relationship between m/zn, MW, and z.
A
[ MW = z · (m/zn) − z · H ]
Q
Determine the molecular weight (MW) of the protein using the relationship between m/zn, MW, and z.1
A
Relationship between ion mass and charge:
m/z = (MW + zH) / z
where:
MW = neutral molecular weight of the protein
z = charge state
H = mass of a proton
Proton mass:
H = 1.0073 Da
Rearrange equation to solve for MW:
MW = z · (m/zn) − z · H
Substitute values:
MW = 32 · (875.4421) − 32 · (1.0073)
Simplify:
MW = 28014.1472 − 32.2336
Solve:
MW ≈ 27981.91 Da
Therefore, the molecular weight of the protein is
~27.98 kDa.
1 Peak values adapted from Ade Larsen homework data. Theoretical GFP molecular weight from Aequorea victoria GFP sequence analysis. Formatting of LaTeX blocks for math inside Git using the AI protocol droid Chat-GPT.
Calculate the accuracy of the measurement using the deconvoluted MW from 2.2 and the predicted weight of the protein from 2.1 using:
Calculate the accuracy of the measurement using the deconvoluted MW from Section 2.2 and the predicted molecular weight from Section 2.1.1
A
Accuracy relationship:
Accuracy =
| MWexperiment − MWtheory |
/ MWtheory
Values:
MWexperiment = 27981.91 Da
MWtheory = 26886.32 Da
Substitute values:
Accuracy =
|27981.91 − 26886.32|
/ 26886.32
Simplify numerator:
Accuracy =
1095.59 / 26886.32
Solve:
Accuracy ≈ 0.0407
Therefore, the experimental measurement differs from the theoretical molecular weight by
~0.0407.
1 Experimental molecular weight determined from ESI-MS deconvolution using adjacent charge-state analysis. Theoretical molecular weight derived from the Aequorea victoria GFP amino acid sequence.
Homework: Waters Part II — Secondary/Tertiary structure
We will analyze eGFP in its native, folded state and compare it to its denatured, unfolded state on a quadrupole time-of-flight MS. We will be doing MS-only analysis (no liquid chromatography, also known as “direct infusion” experiments) on the Waters Xevo G3-QToF MS.
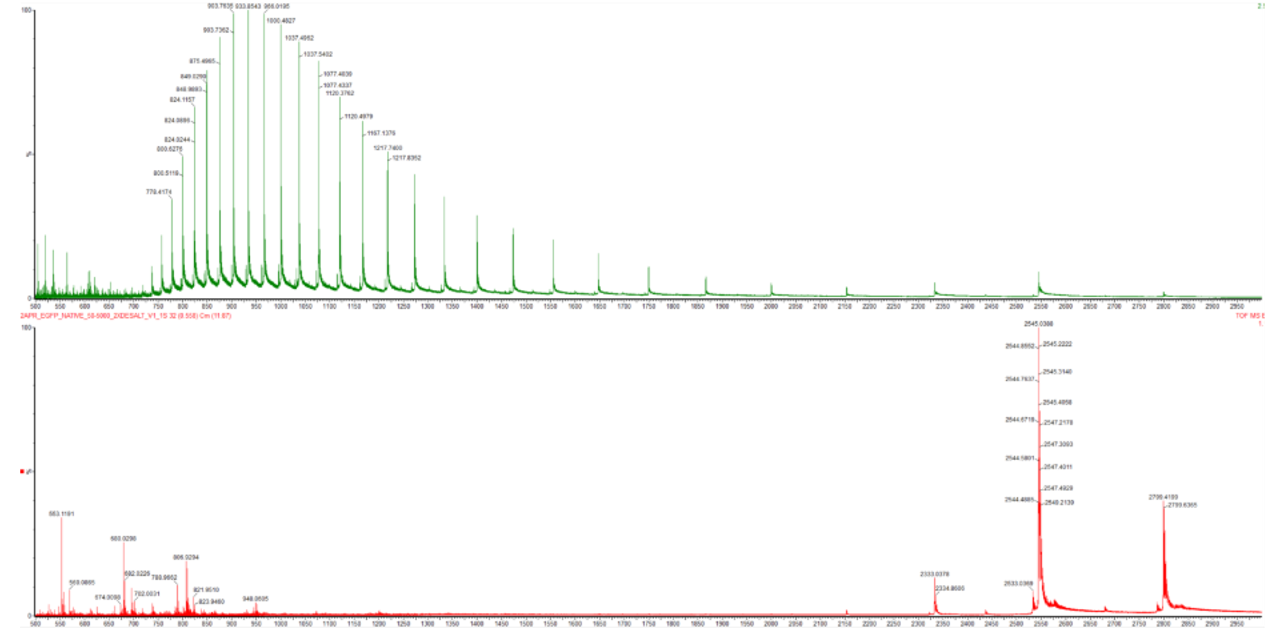
Based on learnings in the lab, please explain the difference between native and denatured protein conformations. For example, what happens when a protein unfolds? How is that determined with a mass spectrometer? What changes do you see in the mass spectrum between the native and denatured protein analyses (Figure 2)?
Figure 2. Comparison of the mass spectra between denatured (top) and native (bottom) eGFP standard on the Waters Xevo G3 QTof MS.
When a protein unfolds because of an environmental exposure, be it from acid or heat or other denaturant, the surface area of that protein is more exposed to protons from the environment that can bond to the proton during ionization. The mass spectrometer then uses electrospray ionization (ESI) to further shift the charge state of the protein. The way this works is the protein is ejected from a charged needle and the droplets formed evaporate. The time of flight is then the movement of these charged droplets as they transition into a gaseous phase.
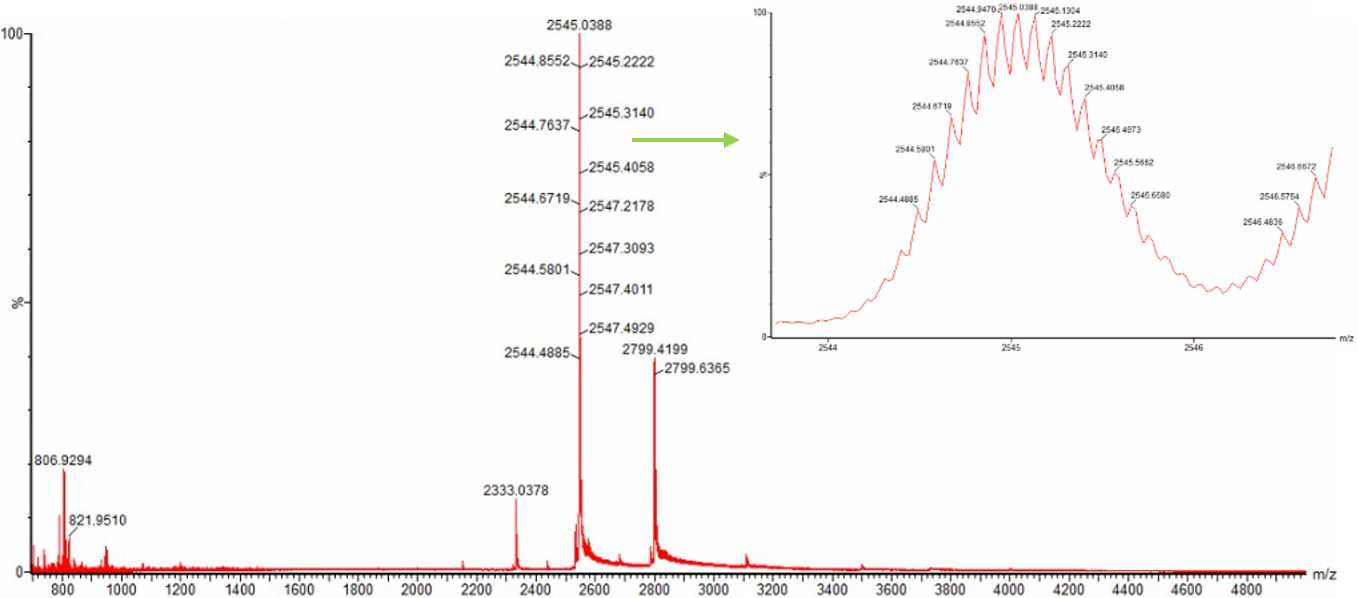
Zooming into the native mass spectrum of eGFP from the Waters Xevo G3 QTof MS (see Figure 3), can you discern the charge state of the peak at ~2800 $\frac{m}{z}$? What is the charge state? How can you tell?
Figure 3. Native eGFP mass spectrum from the Waters Xevo G3 Q-Tof MS. The inset is a zoomed-in view of the charge state at ~2800 $\frac{m}{z}$ on a mass spectrometer with 30,000 resolution.
The provided peak for charge state 10+ is ~2,800 m/z. The predicted MW of eGFP is ascertained to be ~ 26,886.32 Da. To calculate m/z for ionized protein droplet m/z = (MW + zH) / z which is the protein ion relationship where MW is molecular weight and z is charge state, and H is the mass of one proton. Now we plugin values. The mass of one proton H = 1.0073 Da. Now we rearrange the relationship equation with our available information to solve for z, so that z = MW / (m/z) - H, and m/z = is the given peak near 2,800 m/z or slighly less at m/z = 2799.42. Now we find the deconvoluted MW from before which is MW = 27,981.91 Da. Then we substitute values into our final forumula, z = 27.981.91 / (2,799.42 - 1.0073). Next z = 27,981.91 / 2,798.41. Next z ≈ 9.99. Then we round to the whole number, so z ≈ 10, which means are estimated charge state of 10 carries 10 positive charges for the native eGFP protein ion of ~ 2,800 mz.
Can you observe the charge state for the zoomed-in peak in the mass spectrum for the intact eGFP? If yes, what is it? If no, why not?
We can make an educated guess. Using zoom view in figure 1 there are multiple possible peaks around m/z = 1,473.7 and they all share the same charge state. To measure distribution, we take a min and max for example 1,473.63 and 1,473.67. We then subtract the min from the max to compute our peak spacing which amounts to about 0.04. We then use the isotope spacing relationship formula where z = 1 / 0.04 which equals approximately 24.94 which we round to z = 25. This produces our back of the envelope approximation of +25 charge state.
Homework: Waters Part III — Peptide Mapping - primary structure
We will digest the eGFP protein standard into peptides using trypsin (an enzyme that selectively cleaves the peptide bond after Lysine (K) and Arginine (R) residues. The resulting peptides will be analyzed on the Waters BioAccord LC-MS to measure their molecular weights and fragmented to confirm the amino acid sequence within each peptide – generating a “peptide map”. This process is used to confirm the primary structure of the protein.
There are a variety of tools available online to calculate protein molecular weight and predict a list of peptides generated from a tryptic digest. We will be using tools within the online resource Expasy (the bioinformatics resource portal of the Swiss Institute of Bioinformatics (SIB)) to predict a list of tryptic peptides from eGFP.
How many Lysines (K) and Arginines (R) are in eGFP? Please circle or highlight them in the eGFP sequence given in Waters Part I question 1 above. (Note: adding the sequence to Benchling as an amino acid file and clicking biochemical properties tab will show you a count for each amino acid).
Amino Acid Frequencies from Benchling
AA3
AA1
Count
Percent
Ala
A
8
3.2%
Arg
R
6
2.4%
Asn
N
13
5.3%
Asp
D
18
7.3%
Cys
C
2
0.8%
Gln
Q
8
3.2%
Glu
E
17
6.9%
Gly
G
22
8.9%
His
H
15
6.1%
Ile
I
12
4.9%
Leu
L
22
8.9%
Lys
K
20
8.1%
Met
M
6
2.4%
Phe
F
12
4.9%
Pro
P
10
4.0%
Ser
S
10
4.0%
Thr
T
16
6.5%
Trp
W
1
0.4%
Tyr
Y
11
4.5%
Val
V
18
7.3%
Pyl
O
0
0.0%
Sec
U
0
0.0%
How many peptides will be generated from tryptic digestion of eGFP?
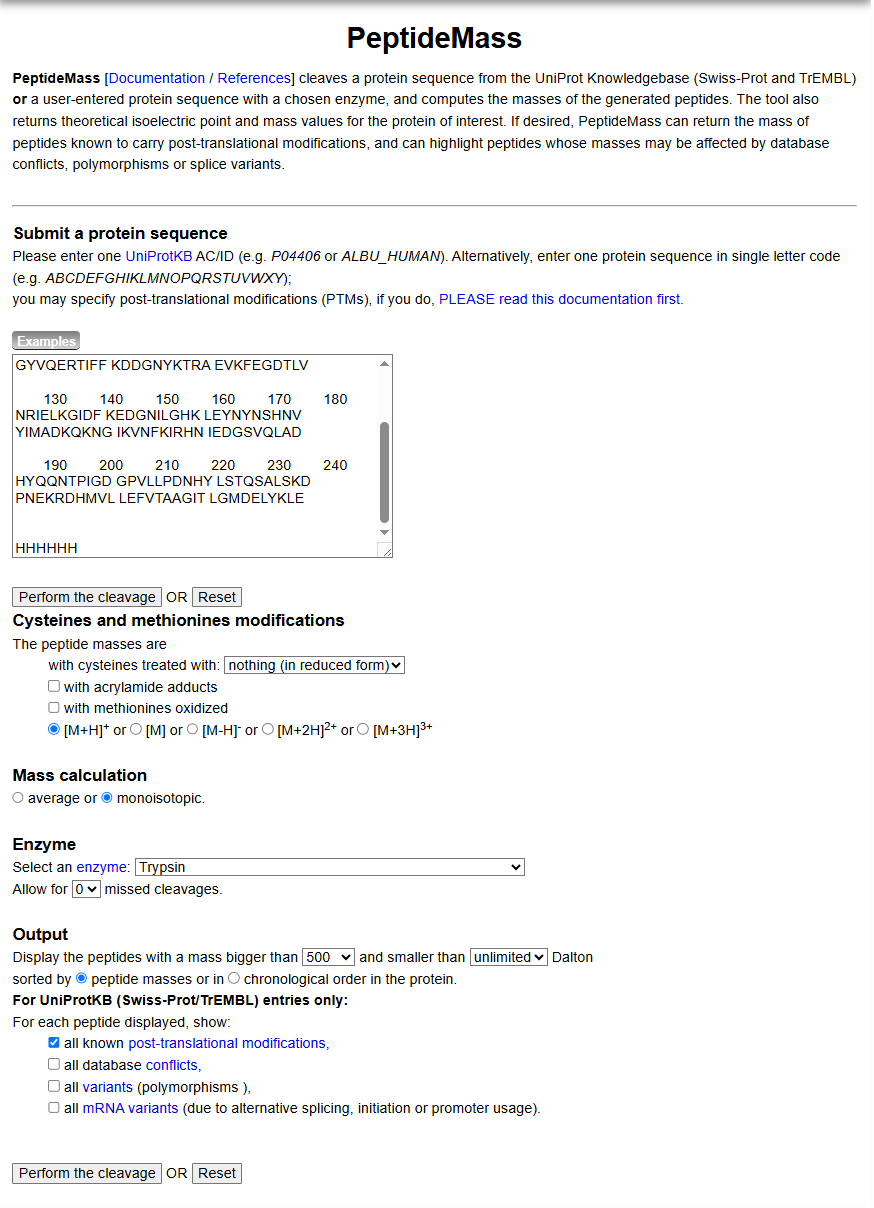
Copy/paste the sequence above into the input box in the PeptideMass tool to generate expected list of peptides.
mass
position
#MC
modifications
peptide sequence
4472.1752
170-210
0
HNIEDGSVQLADHYQQNTPI GDGPVLLPDNHYLSTQSALS K
2566.2931
217-239
0
DHMVLLEFVTAAGITLGMDE LYK
2437.2608
5-27
0
GEELFTGVVPILVELDGDVN GHK
2378.2577
54-74
0
LPVPWPTLVTTLTYGVQCFS R
1973.9062
142-157
0
LEYNYNSHNVYIMADK
1503.6597
28-42
0
FSVSGEGEGDATYGK
1266.5783
87-97
0
SAMPEGYVQER
1083.4979
240-247
0
LEHHHHHH
1050.5214
115-123
0
FEGDTLVNR
982.4952
133-141
0
EDGNILGHK
821.3940
81-86
0
QHDFFK
790.3552
75-80
0
YPDHMK
769.3913
47-53
0
FICTTGK
711.2944
103-108
0
DDGNYK
655.3813
98-102
0
TIFFK
602.2780
211-215
0
DPNEK
579.3137
128-132
0
GIDFK
507.2925
164-167
0
VNFK
502.3235
124-127
0
IELK
Use Figure 4 below as a guide for the relevant parameters to predict peptides from eGFP.
Click “Perform the Cleavage” button in the PeptideMass tool and report the number of peptides generated when using trypsin to perform the digest.
Figure 4. Example conditions for predicting the number of tryptic peptides from the eGFP standard. Please replicate all parameters shown above.
Based on the LC-MS data for the Peptide Map data generated in lab (please use Figure 5a as a reference) how many chromatographic peaks do you see in the eGFP peptide map between 0.5 and 6 minutes? You may count all peaks that are >10% relative abundance.
Figure 5a. Total ion chromatogram (TIC) of the eGFP peptide map. The peak at 2.78 minutes is circled, and its MS data is shown in the mass spectrum in Figure 5b, below.
Depending on the peaks we select as GTE to 10% relative, about 26 peaks.
Assuming all the peaks are peptides, does the number of peaks match the number of peptides predicted from question 2 above? Are there more peaks in the chromatogram or fewer?
Yes they are approximately the same.
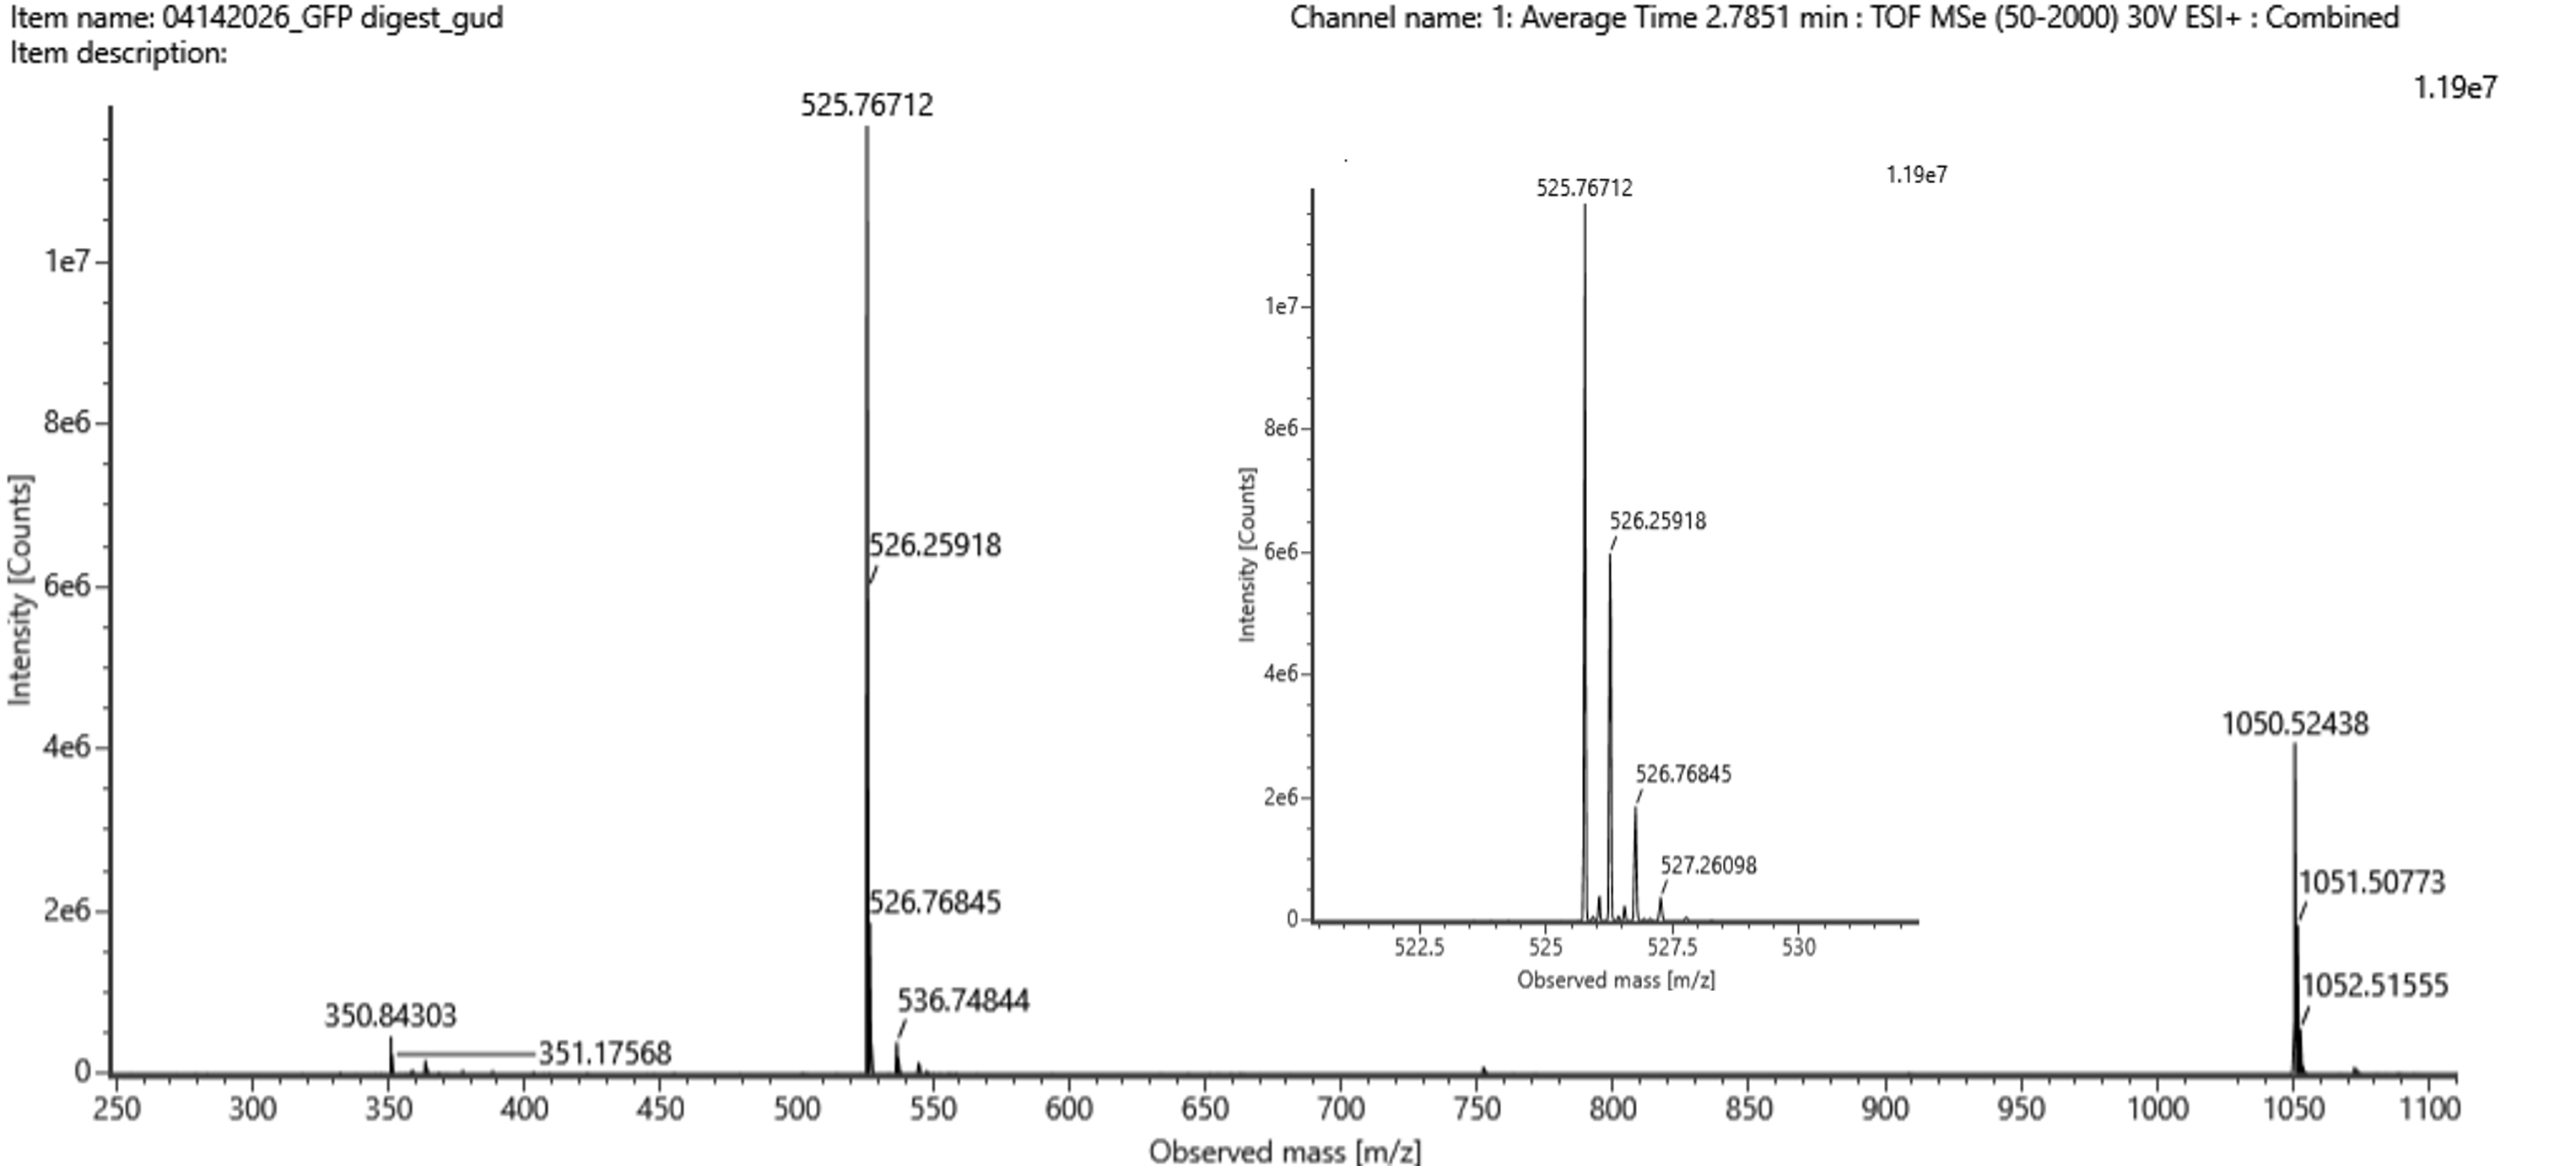
Identify the mass-to-charge ($\frac{m}{z}$) of the peptide shown in Figure 5b. What is the charge ($z$) of the most abundant charge state of the peptide (use the separation of the isotopes to determine the charge state). Calculate the mass of the singly charged form of the peptide ($\small{[M\!\!+\!\!H]^+}$) based on its $\frac{m}{z}$ and $z$.
Figure 5b. Mass spectrum figure to show $\frac{m}{z}$ for the chromatographic peak at 2.78 min from Figure 5a above. The inset is a zoom-in of the peak at $\frac{m}{z}$ 525.76, to discern the isotope peaks.
Figure 5c. Fragmentation spectrum of the peptide eluting at retention time 2.78 minutes in Figure 5a (above).
Start with the calculation of mass of the singly charged form of peptide mass from Figure 5b
[M + H]+experiment ≈ 1050.52694 Da
Then compare to the expected PeptideMass value, with the closest expected peptide being FEGDTLVNR
Identify the peptide based on comparison to expected masses in the PeptideMass tool. What is mass accuracy of measurement? Please calculate the error in ppm.
(Recall that $ \text{Accuracy} = \frac{|MW_{\text{experiment}} - MW_{\text{theory}}|}{MW_{\text{theory}}} $ )
Now we determine mass accuracy, here is the formula
Accuracy =|MWexperiment − MWtheory|
/ MWtheory
Then we substitute in our values from the previous problem
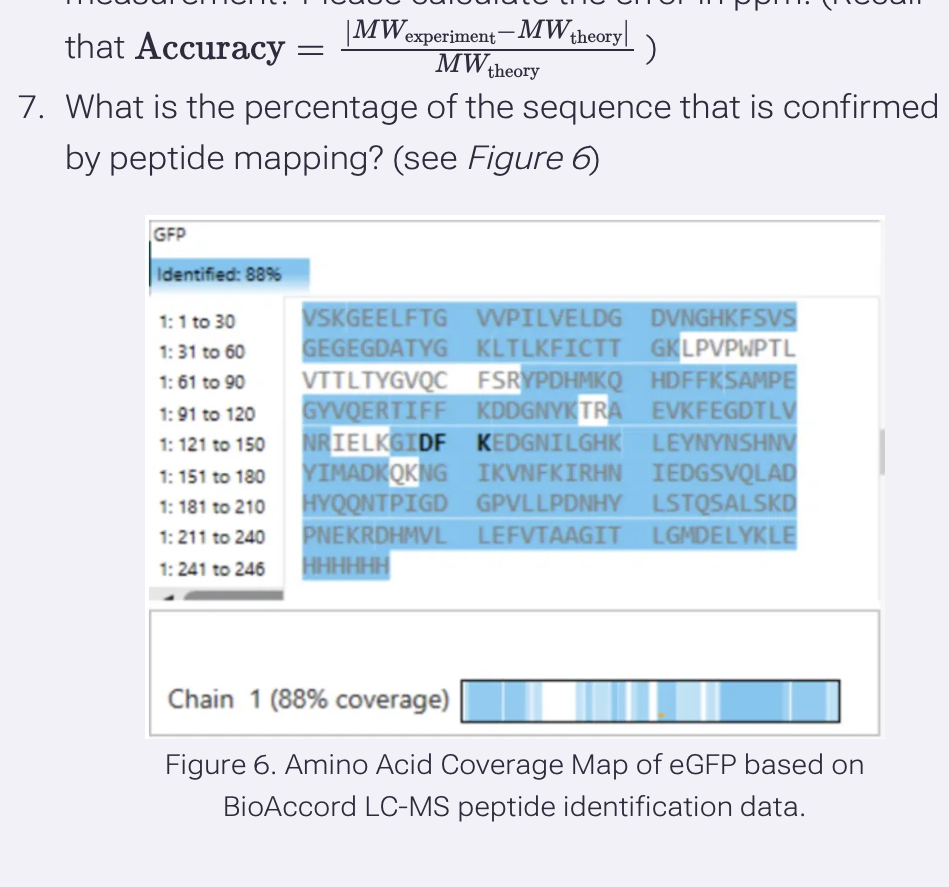
What is the percentage of the sequence that is confirmed by peptide mapping? (see Figure 6)
88% of Amino Acids in eGFP in Figure 6
Bonus Peptide Map Questions
8. Can you determine the peptide sequence for the peptide fragmentation spectrum shown in Figure 5c? (HINT: Use your results from Question 2 above to match the peptide molecular weight that is closest to that shown in Figure 5b. Copy and paste its sequence into this tool online to predict the fragmentation pattern based on its amino acid sequence: http://db.systemsbiology.net/proteomicsToolkit/FragIonServlet.html. What is the sequence of the eGFP peptide that best matches the fragmentation spectrum in Figure 5c?
Does the peptide map data make sense, i.e. do the results indicate the protein is the eGFP standard? Why or why not? Consult with Figure 6, which depicts the % amino acid coverage of peptides positively identified using their calculated mass and fragmentation pattern.
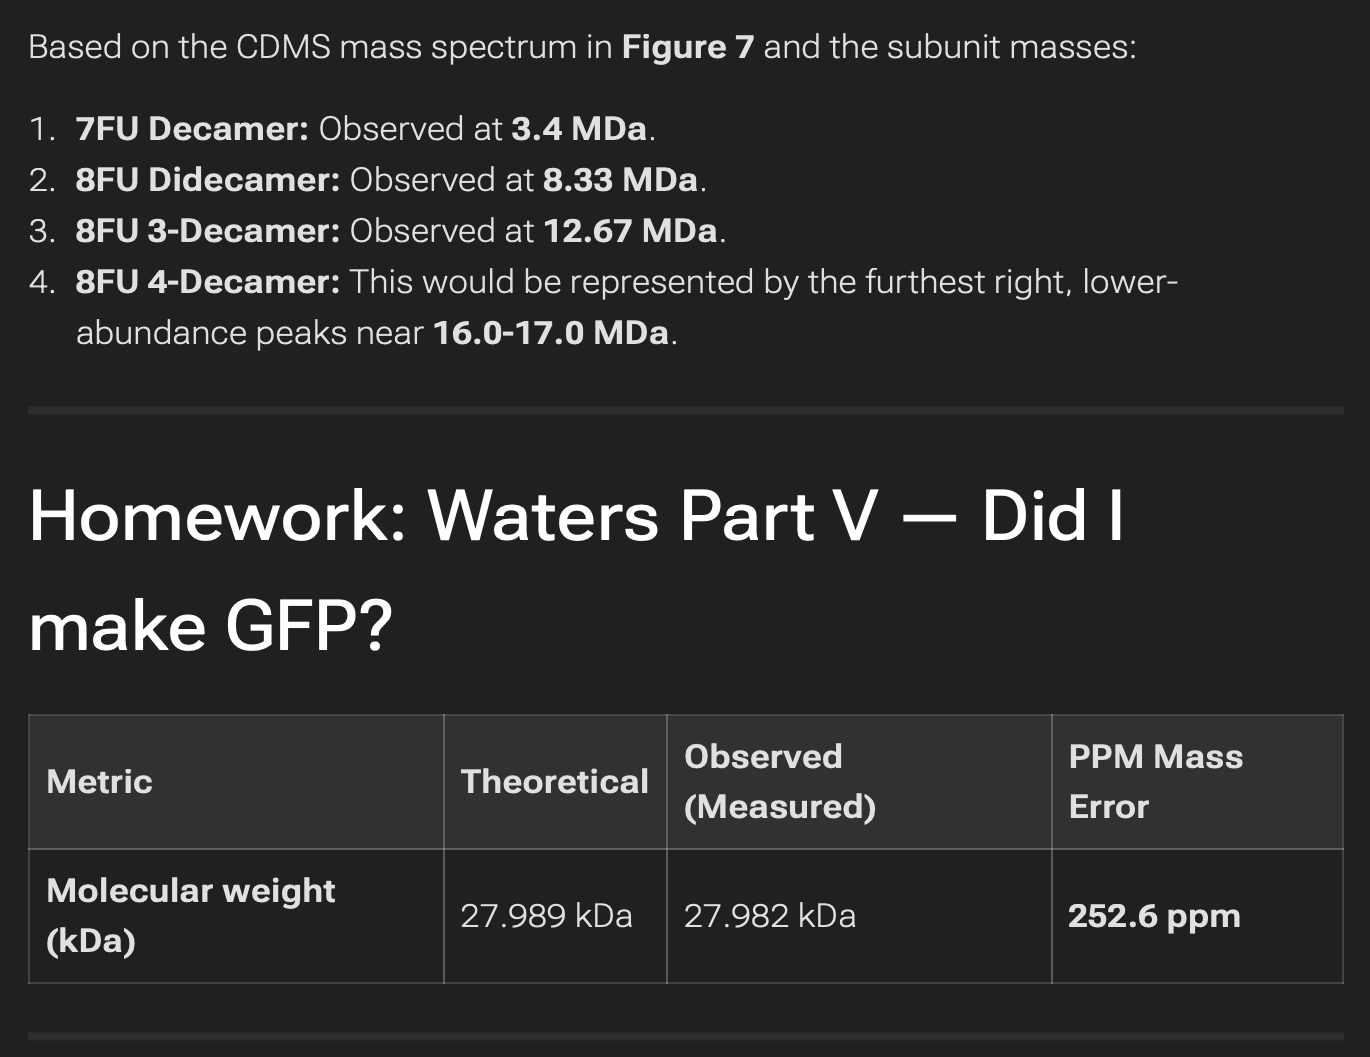
Homework: Waters Part IV — Oligomers
Homework: Waters Part V — Did I make GFP?
*Part V copied from Ade Larsen page because I did not attend Waters Lab as CL
Reading & Resources
Fundamentals of peptide and protein mass spectrometry (Steve Carr, the Broad Institute of MIT and Harvard): https://www.youtube.com/watch?v=PFOodSbH9IY
This link has 2 tutorial video presentations on some of the basics of mass analyzers and different information you can learn from “Tandem” MS (also called MS/MS): https://www.asms.org/about-mass-spec/fundamentals-hardware-instrumentation
History of LC and MS, a video presentation by Professor James Jorgenson: https://player.vimeo.com/video/53604465
Nature Methods perspectives article on “Best Practices for intact protein analysis for top-down mass spectrometry: https://www.nature.com/articles/s41592-019-0457-0
Principles of Intact Protein Analysis: https://www.youtube.com/watch?v=ySql2iKRN6U
What is Mass Spectrometry?: https://www.asms.org/docs/default-source/what-is-ms-booklet/whatisms-ppt_201243e71d0ea09c6d75a448ff000066efb8.pdf?sfvrsn=627b70c3_0
Basics of Reverse Phase Liquid Chromatography: https://www.ionsource.com/tutorial/chromatography/rphplc.htm
Peptide and protein for Bioanalysis using LC-MS: https://www.youtube.com/watch?v=vsQ-Kr4Gdoo
Article - Native vs Denatured : An in Depth Investigation of Charge State and Isotope Distributions: https://pmc.ncbi.nlm.nih.gov/articles/PMC7539638/