Week 10 HW: Advanced imaging & measurement technology
HTGAA Week 10 Advanced imaging & measurement technology
Final Project
1.Please identify at least one (ideally many) aspect(s) of your project that you will measure. It could be the mass or sequence of a protein, the presence, absence, or quantity of a biomarker, etc.
As for this project I aim to use inaK for ice production I would like to measure the ice nucleation ratio and efficiency of the inaK protein. Additionally, I would like to measure the temperatures inaK can resist to, on its own and as a supplement to an ice sample. If my initial experiments are successful I would like to measure the inaK ratio innoculated into ice to find the most optimal inaK quantity needed.
2.Please describe all of the elements you would like to measure, and furthermore describe how you will perform these measurements.
To measure the ice production ratio and efficiency of inaK I could use differential scanning calorimetry (DSC) which measures the difference in the amount of heat required to increase the temperature in the sample compared to a reference. It measures the ice nucleation ratio by calculating the enthalpy which is the area below the peak, allowing me to understand precisely how much of the water in the cell is being converted to ice. It measures the efficiency of ice nucleation by creating an exothermic peak ( release of a burst of energy) and analysing how high of a temperature the inaK can still function. This should give me information on thermodynamic efficiency. I can also measure nucleation temperature through a droplet freezing assay for smaller samples allowing me to test a multitude of potential solution mixes. Here a high speed camera paired with a cooling plate ( a Linkam for example) can allow me to assess how fast a droplet of a solution containing inaK can freeze. Testing this on multiple samples containing different amounts of inaK will give me a spectrum of freezing capacity to find the most optimal ratio of inaK. This experiment could be coupled with an infrared thermography technology which will capture the heat spike and nucleation rate of an inaK and understand how fast the ice nucleation spreads through the cell membrane.
Reference List Schmid, D. et al. (2016) ‘A high-throughput assay for the characterization of ice-nucleating proteins’, Biophysical Journal. This study outlines the specific use of droplet assays to quantify InaK efficiency.
3.What are the technologies you will use (e.g., gel electrophoresis, DNA sequencing, mass spectrometry, etc.)? Describe in detail.
For these experiments I will use a Differential Scanning Calorimeter for the DSC, a high precision camera, a cooling plate and IR thermography.
Waters Part 1 - Molecular Weight
For this section I used a combination of the tools provided, my knowledge and AI assistance as I have trouble understanding math related work.
- Based on the predicted amino acid sequence of eGFP and any known modifications, what is the calculated molecular weight ?
According to Expasy I found that this sequence has a theoretical pI/Mw of 5.90 / 28006.60. To calculate the molecular weight of this sequence I referred to the standard isotopic mass of amino acids and subtracting H²O for each peptide bond. For this amino acid sequence I found that : -eGFP of 238 AA = 26.735.6 Da -LE Linker of 2 AA = 242.3 Da -x-His Tag of 6 AA = 822.8 Da Resulting in a total molecular weight of 27800.7 Da
- Calculate the molecular weight of the eGFP using the adjacent charge state approach described in the recitation. Select two charge states from the intact LC-MS data (figure 1) and:
MW : molecular weight in Daltons m/z : value of the peak on the x-axis of the spectrum z : integer charge state of said peak H+ : mass of a proton
a.Determine z for each adjacent pair of peaks $(n, n+1)$ using: $$ {\large z} = {\Large \frac{\frac{m}{z_{n+1}}}{\frac{m}{z_n} - \frac{m}{z_{n+1}}}} $$
Here I am using the adjacent peaks at 875.4421 and 903.7148. m:zn = 875.4421 m:zn+1 = 903.7148 The lower the m/z the higher the charge versus the higher the m/z the lower the charge. Using the provided formula z = 903.7148 : (903.7148 – 875.4421) = 903.7148 : 28.2727 = 31.96 Charge states must be integers and the charge state for the peak at 903.7148 is z= 31 So, the peak at 875.4421 has a charge state of z+1=32
b.Determine the MW of the protein using the relationship between $\frac{m}{z_n}$, $MW$, and $z$
The base equation for the peaks in this figure is m:z = (MW + (z x H+)) : z Here I rearrange the formula to find MW MW = z x (m:z) - (z x H+) If z=31, then, MW = 31 x(903.7148) - (31x1.008) MW = 28 015.1588 – 31.248 MW = 27 983.91 Da
c.Calculate the accuracy of the measurement using the deconvoluted MW from 2.2 and the predicted weight of the protein from 2.1 using: $$ \text{Accuracy} = \frac{|MW_{\text{experiment}} - MW_{\text{theory}}|}{MW_{\text{theory}}} $$
Using the provided formula and substituting the values accordingly, If, Accuracy = (MW experimental - MWtheory) : MW theory Then, Accuracy = (27 982.90 - 27 782.70) : 27 782.70 Accuracy = 200.20 : 27 782.70 Accuracy = 0.0072 =0.72%
3.Can you observe the charge state for the zoomed-in peak in the mass spectrum for the intact eGFP? If yes, what is it? If no, why not?
One can observe the charge state in the zoomed in peak but not using the previous calculation method using the adjacent peak method used for the entire spectrum. The zoomed in area presents an isotopic cluster of one charge state, therefore, the observation is focused on isotopic resolution. The other peaks represent different amounts of protons. So, here, yes I can see the charge state using isotopic resolution because the peaks are distinct and separate and the instrument has high enough of a resolution to expose the isotopes separately. It is because the instrument used here is of high precision that we are able to have high resolution, if a lesser precise instrument were used then it would be very difficult to see the charge state. The formula to calculate isotopic spacing here would be z = 1 : Δm/z
Waters Part 2 - secondary & tertiary structure
1.Please explain the difference between native and denatured protein conformations. For example, what happens when a protein unfolds? How is that determined with a mass spectrometer? What changes do you see in the mass spectrum between the native and denatured protein analyses (figure 2)?
There is a structural difference between the native and the denatured protein conformations, the native protein conformation is a tightly folded protein, a unique three dimensional structure unique to its biological environment. The structure is compact but is held by weak non-covalent bonds. In contrast, a denatured protein conformation is the unfolded structure once the weak bonds are broken, the structure is flexible and unpredictable resulting in a random coil shape. The denatured protein no longer has a function compared to the native protein conformation. A mass spectrometer scans the protein shape by measuring its mass and charge rather than measuring the shape directly. The top green graph corresponds to the denatured confirmation and the bottom red chart corresponds to the native conformation. The denatured conformation graph shows crowded peaks in the 500 to 1200 m/z range, these are low m/z values. A lower m/z equals a higher z charge and when a protein is unfolded into a random coil then the basic residues are exposed to a proton rich environment and can easily be protonated creating a protein with a very high net positive charge. The native conformation has larger m/z values with peaks at 2545 and 2799, the higher the m/z value the lower the z charge. When the protein is still tightly folded the basic residues are buried in the hydrophobic core protecting it from its environment meaning protons cannot impact them so the protein is less protonated.
2.Zooming into the native mass spectrum of the eGFP from the Waters Xevo G3 QTof or MS (figure 3), can you discern the charge state of the peak at ~2800? What is the charge state? How can you tell?
It is possible to discern the charge state of the peak at ~2800 m/z because instrument provides a high resolution even if the image focuses on the 2525 m/z peak, we are still able to see the isotopic distribution by measuring the distance between the individual isotopes and we would be able to calculate the charge state. Measuring the charge state of the peak at ~2800 m/z using isotopic spacing, In a mass spectrum the individual isotopes of the same molecule differs by approximately 1 Dalton, The distance between the isotopes here on the x-axis Δm/z can be calculated using the following formula, Δm/z = 1: z Zooming in at the 2799.4199 peak same as for the 2545 peak (with a peak separation of precisely 0.1 m/z) then, z = 1: 0.1 = 10 So the charge state of the peak at ~2800 m/z is +10
Waters Part 3 - Peptide mapping, primary structure
1.How many Lysines (K) and Arginines (R) are in eGFP? Please circle or highlight them in the eGFP sequence given in Waters Part I question 1 above. (Note: adding the sequence to Benchling as an amino acid file and clicking the biochemical properties tab will show you a count for each amino acid).
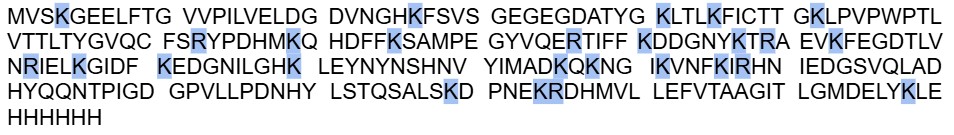
2.How many peptides will be generated from tryptic digestion of eGFP?
I found 19 peptides were generated from this sequence using the trypsin.
3.Based on the LC-MS data for the Peptide Map data generated in the lab ( please use Figure 5a as a reference) how many chromatographic peaks do you see in the eGFP peptide map between 0.5 and 6 minutes? You may count all peaks that are>10% relative abundance.
Between 0.5 and 6 minutes there are 14 distinct peaks above 10% relative abundance in this figure.
4.Assuming all the peaks are peptides, does the number of peaks match the number of peptides predicted from question 2 above? Are there more peaks in the chromatogram or fewer?
In comparison to the amount of predicted peptides, 19, there are fewer peptides in the chromatogram.
5.Identify the mass-to-charge (m:z) of the peptide shown in Figure 5b. What is the charge (z) of the most abundant charge state of the peptide (use the separation of the isotopes to determine the charge state). Calculate the mass of the singly charged form of the peptide ([M+H]+) based on its m:z and z.
The z charge of the most abundant peak in this peptide is m/z = 525.76712 To calculate the charge state, First isotope peak 525.76712 Second isotope peak 526.25918 Calculating the spacing, (Δm/z):526.25918 - 525.76712 = 0.49206 Using the formula, z = 1: 0.49206≈2.03 So the charge state z of the most abundant peak of the peptide is of +2
Calculating the mass of the singly charged form of the peptide ([M+H]+), First I need to calculate the neutral mass M using M=zx(m/z)-(zx1.00727), 1.00727 Da is the mass of a proton, So, M = 2 x (525.76712) - (2x1.00727) M = 1051.53424 - 2.01454 = 1049.5197 Da ([M+H]+) can be calculated by adding one proton mass back to the neutral mass, [M+H]+ = 1049.5197 + 1.00727 = 1050.5270 Da
6.Identify the peptide based on comparison to expected masses in the PeptideMass tool. What is mass accuracy of measurement? Please calculate the error in ppm. (Recall that Accuracy = (MW experimental - MWtheory) : MW theory)
To identify the peptide I consider that the experimental neutral molecular sight (MWexperimental) was calculated for the peak 525.76712 m/z and equaled MW: 1049.5197 Da, I will use the following peptide sequence as a theoretical tryptic digest as a comparison, LPDNHYLSTQSALSK, and considering theoretical MW (MWtheory) : 1049.5393 Da. This peptide corresponds to the residues 139–153 of the eGFP protein.
To calculate the mass accuracy, error in ppm (parts per million) I will use the following formula, Accuracy (ppm) = ((MWexperimental - MW theory) : MWtheory) x 106 Now adding the values, MW experimental = 1049.5197 MW theory = 1049.5393 Accuracy (ppm) = ((1049.5197 - 1049.5393) : 1049.5393) x 106 Accuracy (ppm) = (-0.0196) : 1049.5393) x 106 Accuracy (ppm) = –18.67ppm
7.What is the percentage of the sequence that is confirmed by peptide mapping ? (see figure 6)
The percentage of the sequence that is confirmed by peptide mapping seems to be indicated at 88%, the blue highlighted areas are confirmed amino acids in the sequence.
Waters Part 4 - Oligomers
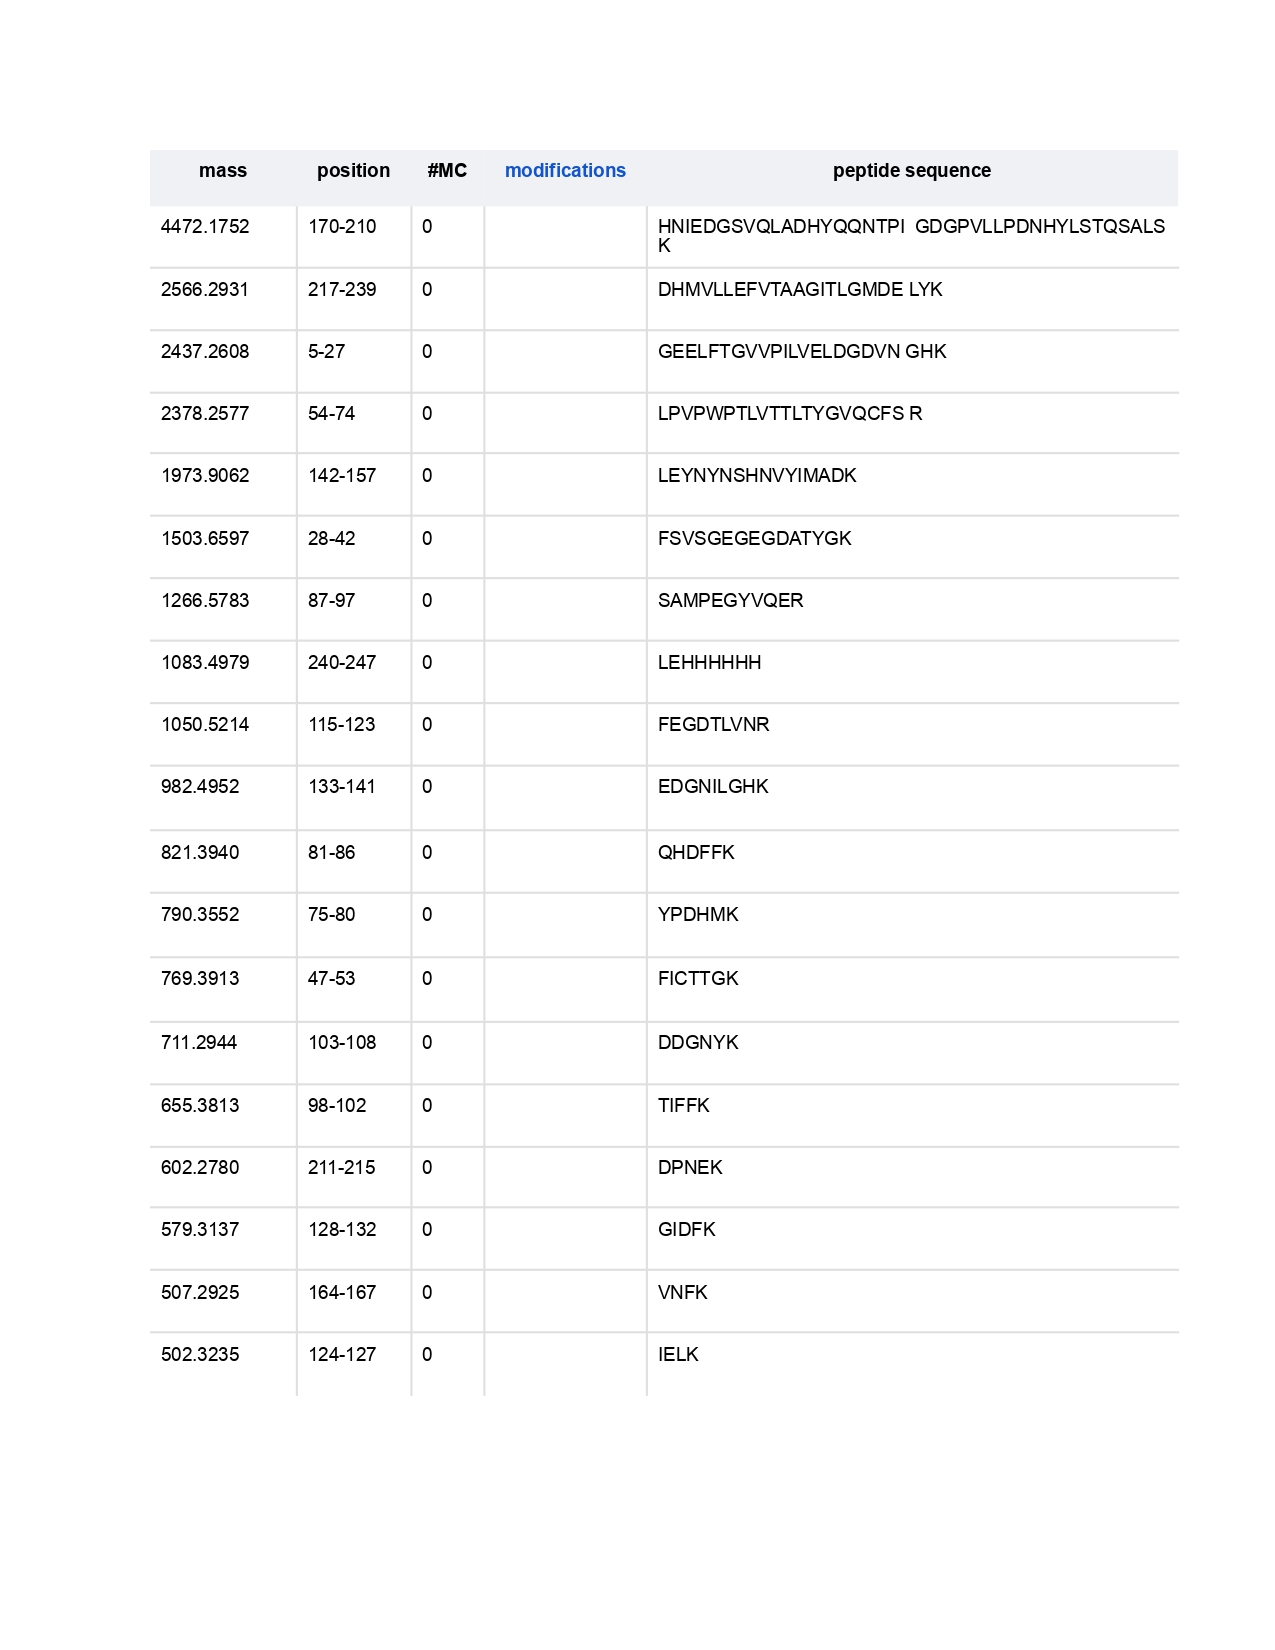
We will determine Keyhole Limpet Hemocyanin (KLH)’s oligomeric states using charge detection mass spectrometry (CDMS). CDMS single-particle measurements of KLH allow us to make direct mass measurements to determine what oligomeric states (that is, how many protein subunits combine) are present in solution. Using the known masses of the polypeptide subunits (Table 1) for KLH, identify where the following oligomeric species are on the spectrum shown below from the CDMS (Figure 7): -7FU Decamer -8FU Didecamer -8FU 3-Decamer -8FU 4-Decamer
I will first calculate the theoretical mass for the species using the given measures 7FU = 340 kDa and 8FU = 400 kDa. The axis of the spectrum is in MDa (megadaltons) where 1MDa = 1000 kDa.
I can then identify the peaks on the spectrum -7FU Decamer ≈ 3.40 MDa is the peak labeled 3.4 on the spectrum -8FU Didecamer ≈ 8.00 MDa correspond to the peak labeled 8.33 -8FU 3-Decamer ≈ 12.00 MDa matches the peak labeled 12.67 -8FU 4-Decamer ≈ 16.00 MDa would appear in the cluster of small unlabeled peaks around 16 to 17 MDa on the far right side of the chart
Waters part 5 - Did I make GFP?
- Please fill out this table with the data you acquired from the lab work done at the Waters Immerse Lab in Cambridge, or else the data screenshots in this document if you were unable to have lab work done at Waters.
