Week 13 – AI, SynBio, and Scaling Health Innovation (ARPA‑H)
Week 14 – Biodesign
Subsections of Homework
Week 01 – Principles and Practices
Week 1 HW: Principles and Practices
1. Application Goal
I want to use CRISPR Cas-9 to knockout the LFY (LEAFY) gene in Arabidopsis thaliana. This serves as a biological engineering tool to provide students with a clear visual confirmation of a successful gene edit—the plant will fail to produce flowers.
2. Governance and Policy Goals
The primary goal is to ensure this tool contributes to an “ethical” future by serving as a standardized educational platform. It allows students to learn gene editing techniques within a framework that provides immediate visual feedback and built-in biosafety (non-reproductive plants).
3. Proposed Governance Actions
Action 1: Standardized Educational CRISPR-LFY Kit
Purpose: Provide a safe, vetted “kit” for schools to reduce unsafe improvisation.
Design: * Physical: Use non-integrating systems or low-fertility lines.
Protocol: SOPs for containment and autoclaving disposal.
Governance: Mandatory Material Transfer Agreements (MTAs).
Assumptions: Institutions have BSL-1 facilities; teachers follow SOPs.
Risks: Failure of containment due to small seed size; success leads to off-target effects if handled poorly.
Action 2: Mandatory Ethics & Risk Training
Purpose: Ensure students understand the “why” and “should,” not just the “how.”
Design: A required module covering gene editing ethics and case studies.
Assumptions: Instructors have the support to teach ethics; students engage meaningfully.
Risks: Ethics treated as a “checkbox”; success might make students overly cautious.
Action 3: Institutional Oversight & Registration
Purpose: Ensure all gene editing activities are visible to faculty and Biosafety Officers.
Design: Registry of constructs used, genes targeted, and disposal methods.
Assumptions: Biosafety Officers have specific expertise in plant gene editing.
Risks: Excessive bureaucracy could stifle innovation.
4. Scoring & Prioritization
Policy Goal
Option 1 (Kit)
Option 2 (Ethics)
Option 3 (Oversight)
Enhance Biosecurity
1
2
3
Foster Lab Safety
2
3
1
Protect Environment
1
3
2
Minimize Cost/Burden
3
1
2
Not Impede Research
1
3
2
Prioritization: I prioritize a combination of Option 1 and Option 3. The kit (Option 1) provides the physical safety mechanism (the LFY knockout ensures no reproduction), while the Biosafety Officer (Option 3) ensures oversight.
Week 2 Lecture Prep
Questions from Professor Jacobson
DNA Polymerase Error Rate: Approximately 1 in 10 million base pairs.
Comparison to Genome: The human genome is ~3 billion base pairs. This discrepancy is managed by advanced proofreading and error correction mechanisms.
Coding Diversity: An average protein (400 amino acids) can be encoded by roughly $10^{194}$ different DNA sequences.
Constraint Realities: Most of these codes fail due to constraints in transcription, mRNA stability, translation efficiency, and protein folding.
Questions from Dr. LeProust
Oligo Synthesis: The most common method is Phosphoramidite Chemistry.
200nt Limit: Difficult because error rates are cumulative; the yield of pure, correct sequence drops too low.
2000bp via Direct Synthesis: Not viable because the probability of a perfect sequence over that length is statistically near zero with current error rates.
Questions from George Church
The 10 Essential Amino Acids: Arginine, histidine, isoleucine, leucine, lysine, methionine, phenylalanine, threonine, tryptophan, and valine.
Lysine Contingency: This concept is flawed because all animals already require lysine from their diet; they do not produce it themselves.
Aspirin-like Stability: To make protein medicines stable, I would circularize the protein (joining the ends) to prevent degradation by heat, similar to the 2014 Heidelberg iGEM project.
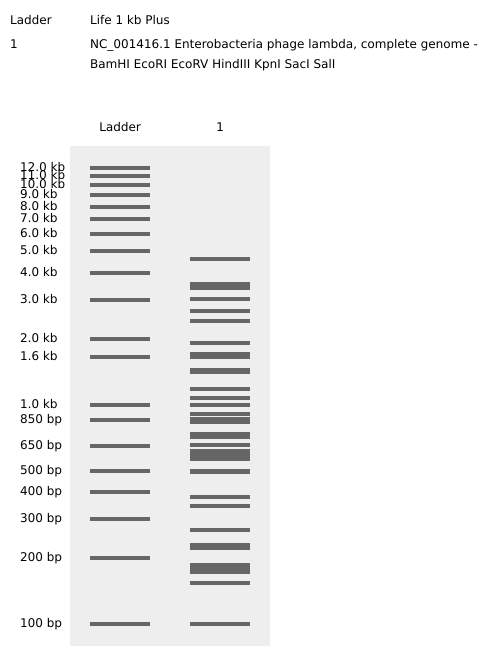
This laboratory exercise explored the modern molecular biology workflow: restriction digest simulation, wet-lab electrophoresis, gene design, codon optimization, DNA synthesis preparation, and genome read/write/edit technologies. A developmental transcription factor (MSX-1) was selected, reverse-translated, optimized, and engineered into an expression cassette.
1. Restriction Digest Simulation & Gel Art
Objective
Simulate Lambda DNA restriction digests and generate a gel-art visualization.
# -----------------------------
# Printing
# -----------------------------
pipette_20ul.pick_up_tip()

volume_per_drop = 1
max_batch_volume = 18
drops_per_batch = int(max_batch_volume / volume_per_drop)

total_points = len(mturquoise2_points)
index = 0

while index < total_points:

    batch = mturquoise2_points[index:index + drops_per_batch]

    pipette_20ul.aspirate(
        len(batch) * volume_per_drop,
        location_of_color('Cyan')
    )

    for x_offset, y_offset in batch:
        dispense_location = center_location.move(
            types.Point(x=x_offset, y=y_offset)
        )
        dispense_and_detach_fast(
            pipette_20ul,
            volume_per_drop,
            dispense_location
        )

    index += drops_per_batch

pipette_20ul.drop_tip()
Week 04 – Protein Analysis
Protein Analysis and Molecular Foundations
I used Gemini AI to answer questions 1-11. The prompt was the question itself.
1. Amino Acids in 500g of Meat
To find the total number of molecules, we estimate the protein content of meat (roughly 25%) and use Avogadro’s number.
Protein Mass: 500g multiplied by 0.25 equals 125g of protein.
Moles of Amino Acids: Using an average mass of 100 Da (100 g/mol), we calculate 125g / 100 g/mol = 1.25 moles.
Total Molecules: 1.25 x 6.022 x 1023 = **7.5 x 10²³ molecules**.
2. Why Humans Eat Beef but Don’t Become Cows
When you consume meat, your digestive enzymes break down the animal proteins into individual amino acids. These building blocks are then transported to your cells, where your own ribosomes reassemble them into human proteins based on the specific instructions in your DNA.
3. Why There Are Only 20 Natural Amino Acids
While hundreds of amino acids exist chemically, life settled on a standard set of 20 because they provide a “functional toolkit” diverse enough (acidic, basic, polar, and hydrophobic) to build almost any protein structure. This set likely became “frozen” early in evolution—changing the code later would have caused lethal mutations across all existing proteins.
4. Non-Natural Amino Acids (ncAAs)
Scientists can create and incorporate non-natural amino acids using expanded genetic codes.
Design Concept: An amino acid with a cyano-group (C≡N) side chain. This can be used as a sensitive infrared probe to measure local electric fields or pH changes within a protein’s active site.
5. Pre-biotic Origins
Before enzymes existed, amino acids formed via abiotic synthesis.
Chemical Evolution: The Miller-Urey experiment showed that lightning-like sparks in a reducing atmosphere (containing methane, ammonia, hydrogen, and water) could create glycine and alanine.
Astrobiology: Amino acids have been found on meteorites, suggesting these building blocks can form in space before life begins.
6. Handedness of D-amino Acid Helices
Natural L-amino acids form right-handed alpha-helices. If you utilize D-amino acids (the mirror image), the steric constraints are reversed, resulting in a left-handed helix.
7. Discovering Additional Helices
Beyond the standard alpha-helix, proteins occasionally use:
3-10 helix: A tighter, more elongated helix.
Pi-helix: A wider, shorter helix often found near functional active sites.
Polyproline II (PP-II) helix: A left-handed, extended helix common in collagen.
8. Why Most Helices are Right-Handed
This is determined by the chirality of L-amino acids. In a right-handed helix, the side chains point outward, minimizing steric clashes. In a left-handed helix made of L-amino acids, the side chains would crash into the protein backbone, making the structure energetically unstable.
9. Why Beta-sheets Tend to Aggregate
Beta-sheets have “sticky edges”—exposed hydrogen-bond donors and acceptors that are not “satisfied” or covered. If these edges aren’t capped by another part of the protein, they will seek out other beta-sheets to bond with, leading to uncontrolled stacking.
10. Driving Forces for Beta-sheet Aggregation
Hydrogen Bonding: Inter-strand hydrogen bonds act like molecular “Velcro.”
Hydrophobic Effect: Many beta-sheets have hydrophobic faces. To escape the water, these faces stack together, burying the non-polar side chains in a dry core.
11. Amyloids: Disease and Materials
Amyloid Diseases: In diseases like Alzheimer’s or Parkinson’s, proteins misfold into highly stable, insoluble “cross-beta” structures that the body cannot easily clear.
Materials Science: Because amyloid beta-sheets are incredibly strong and stable, they are being used to design nanofibers, conductive wires, and biocompatible scaffolds for tissue engineering.
Protein Analysis: SOSTDC1 (NP_056167)
GDP-fucose protein O-fucosyltransferase 1 & Tooth Regeneration
I selected the protein SOSTDC1. This protein is known to block the growth of a second set of adult teeth. Currently, there are clinical trials in Japan where researchers are blocking this protein using antibodies to stimulate tooth regrowth. I am investigating if there are other structural ways to manipulate it.
Most Frequent Amino Acid: Alanine (A) is the most frequent.
(Note: The previous count of 292 was likely a typo as it exceeded the total protein length).
2. Family and Domain Classification
SOSTDC1 belongs to several recognized protein families and domains:
Database
Classification / ID
Description
FunFam
2.10.90.10:FF:000019
Sclerostin domain-containing protein 1
Gene3D
2.10.90.10
Cystine-knot cytokines
InterPro
IPR008835
Sclerostin/SOSTDC1
PANTHER
PTHR14903
Sclerostin-related
Pfam
PF05463
Sclerostin
3. Structural Analysis (RCSB PDB)
The structure was solved in 2017 with a high-quality resolution of 2.09 Å.
Molecules: Aside from the protein, the structure contains water molecules.
Classification: It belongs to the Transferase structural family.
Secondary Structure: The protein contains a significant number of helices.
Surface Topology: Visualization of the protein surface reveals “holes” or pockets that could potentially be targeted by small molecules.
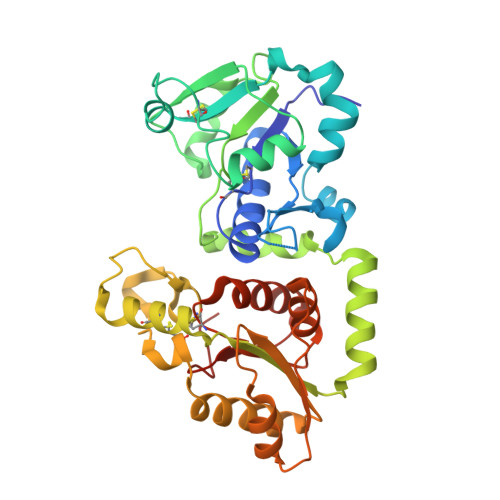
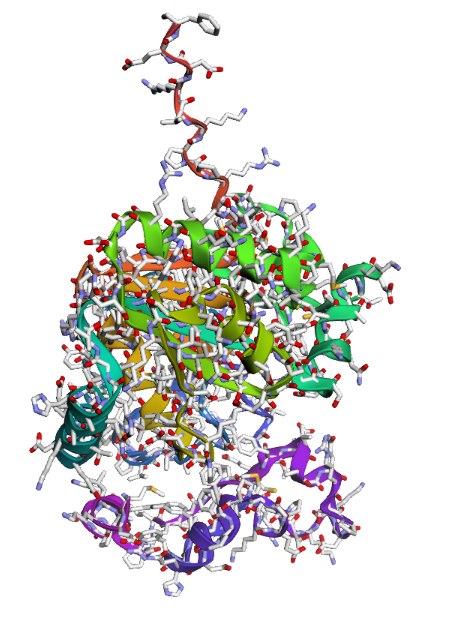
4. 3D Visualization
Below is the 3D representation showing the complex folding and side-chain distributions.
Observations:
Hydrophobic vs. Hydrophilic: Hydrophobic residues tend to be buried within the core to stabilize the fold, while hydrophilic residues are primarily distributed on the surface to interact with the aqueous environment.
Targeting: The presence of surface “holes” suggests possibilities for small-molecule inhibitors as an alternative to antibody-based therapies.
Group Project Re-Skinning MS2 for Cancer Targeting
While my current research focuses on the L protein for bacterial lysis, the same protein engineering principles can be used to “re-skin” the MS2 Coat Protein (CP) to target cancer cells. By modifying the FG loop of the coat protein, we can turn the phage into a targeted delivery vehicle.
A. Targeting Peptide: The RGD Motif
To target cancer cells (specifically those overexpressing integrins, like breast or lung cancer), we can “plug” the following peptide sequence into the MS2 coat protein:
Targeting Sequence:Arg-Gly-Asp (RGD)
B. Computational Engineering Workflow
To re-engineer the phage surface, I would follow these steps:
Scaffold Modeling: Utilize the MS2 coat protein structure (PDB: 2MS2) as the base scaffold.
Peptide Grafting: Insert the RGD motif into the solvent-exposed FG loop (between residues 70-80).
Linker Optimization: Add flexible linkers (e.g., Gly-Gly-Gly-Ser) to ensure the peptide can reach and bind the tumor receptors.
Structural Validation: Use tools like the Nuclera system (Stage 4) to ensure the mutations do not prevent the 180 coat proteins from assembling into a stable icosahedral shell.
C. Comparison of Engineering Goals
Feature
Phage Therapy (Bacteria)
Phage Nanomedicine (Cancer)
Primary Target
E. coli F-pilus
Cancer markers (Integrins, HER2)
Protein Focus
Lysis Protein (L)
Coat Protein (CP)
Desired Outcome
Bacterial Lysis
Cell-specific drug delivery
Key Challenge
DnaJ-independence
Evading human immune clearance
D. The “Trojan Horse” Strategy
By re-skinning the outside to find the cancer and replacing the internal viral RNA with a suicide gene or chemotherapeutic cargo, the MS2 phage acts as a programmable nanobot. This represents the intersection of the HTGAA phage project and state-of-the-art oncology.
Week 05 - Phage Lysis Protein Design Challenge
Challenge: Targeting Mutant SOD1 (A4V) for ALS Therapy
1. Protein Overview: SOD1 and ALS
Superoxide dismutase 1 (SOD1) is a cytosolic antioxidant enzyme that converts superoxide radicals into hydrogen peroxide and oxygen. In its native state, it forms a stable homodimer and binds copper and zinc. Mutations in SOD1 cause familial Amyotrophic Lateral Sclerosis (ALS).
2. The A4V Mutation
The A4V mutation (Alanine to Valine at residue 4) is one of the most aggressive forms of ALS. This mutation subtly destabilizes the N-terminus, perturbs folding energetics, and promotes toxic aggregation.
A4V Variant:MATV... (Valine is bulkier and more hydrophobic, disrupting N-terminal packing).
3. Peptide Design Strategy
To inhibit the aggregation of mutant SOD1, I designed three candidate peptides targeting the destabilized N-terminal region. We aim to “plug” the hydrophobic hole or “cap” the exposed strands.
Peptide ID
Target Site
Sequence
Rationale
PEP-01
Dimer Interface
VVKAVCV
Mimics the native N-terminal strand to “re-cap” the monomer.
PEP-02
Hydrophobic Patch
FWKYKL
Uses bulky aromatic residues to plug the hole created by A4V.
PEP-03
Electrostatic Cap
RRRVVKRRR
Lead Candidate: Binding motif with charged tails to prevent stacking.
I relied on Gemini for coding this webpage and analysis.
4. Therapeutic Selection: Why PEP-03?
I have selected PEP-03 for advancement toward therapy for the following reasons:
Targeted Binding: The central VVK motif provides high specificity for the N-terminal groove (residues 1-10) perturbed by the A4V mutation.
Aggregation Inhibition: The Arginine (R) tails provide strong electrostatic repulsion, acting as a “chemical chaperone” to keep the protein-peptide complex soluble.
Cell Penetration: Arginine-rich sequences are known as Cell-Penetrating Peptides (CPPs), which help the therapeutic cross the plasma membrane to reach the cytosol of motor neurons.
5. Design Specifications & Optimization
The 3D coordinates for PEP-03 were generated for docking simulations to evaluate hydrogen bonding with the SOD1 beta-strands.
Next Steps for Optimization:
D-Amino Acid Substitution: Replacing L-amino acids with D-amino acids to prevent protease degradation in the bloodstream.
Cyclization: Creating a cyclic peptide to “lock” the binding conformation and increase affinity for the mutant SOD1 surface.
6. AlphaFold 3 Results and Validation
To validate the design of PEP-03 (RRRVVKRRR), I utilized AlphaFold 3 to simulate its docking with the SOD1 A4V mutant. The results provide strong structural evidence for the peptide’s therapeutic potential.
A. Structural Binding Evidence
In the 3D model, the peptide (colored yellow/orange) is predicted to nestle directly into the N-terminal groove of the SOD1 protein (colored blue).
Target Specificity: The central VVK motif of the peptide aligns with residues 1–10 of SOD1, successfully “capping” the area destabilized by the A4V mutation.
Solubility Mechanism: As designed, the Arginine (R) tails remain oriented toward the solvent. This confirms that they will provide the electrostatic repulsion necessary to prevent the mutant proteins from stacking into toxic aggregates.
B. Confidence and PAE Map Analysis
The Predicted Aligned Error (PAE) map serves as the statistical proof of the binding:
Interface Confidence: The PAE map shows dark green blocks at the intersection of the peptide (residues 155–163) and the SOD1 N-terminus (residues 1–10). This indicates that AlphaFold is highly confident in the relative position of the peptide at the mutation site.
pLDDT Scores: While the peptide shows lower confidence (yellow) compared to the rigid protein core (blue), this is expected for a short, flexible peptide that only adopts a fixed structure upon binding its target.
C. Conclusion
The AlphaFold 3 simulation confirms that PEP-03 acts as a molecular “band-aid.” By binding to the destabilized N-terminus and providing a charged surface, it effectively stabilizes the SOD1 monomer and inhibits the primary pathway of ALS-associated aggregation.
Phage Lysis Protein Design Challenge
Course: How to Grow Almost Anything (HTGAA) Project: Large-scale Group Research Effort
1. Pre-Lab | Reading & Context
Phage Therapy Overview
Phage therapy is the therapeutic use of bacteriophages (viruses that infect bacteria) to treat bacterial infections.
Specificity: Phages often infect only a single strain, sparing beneficial bacteria.
The Resistance Challenge: Bacteria rapidly develop resistance. In the famous case of Tom Patterson and Steffanie Strathdee, multiple “phage cocktails” were required as the bacteria evolved resistance to each successive treatment.
The Role of the L-Protein
The L protein is thought to form oligomers that integrate into the cell membrane to form pores, ultimately lysing and killing the bacterial cell.
Mechanism: Crucial for the phage life cycle and release.
Host Intervention:E. coli can mutate the chaperone protein DnaJ (responsible for protein folding) to prevent interaction with the L-protein, rendering the phage ineffective.
2. MS2-Phage Introduction
Bacteriophage MS2 is a single-stranded RNA virus. Its genome contains four genes:
Maturation Protein (A)
Coat Protein (coat)
Lysis Protein (L) — Our primary focus.
RNA Replicase (rep)
Structural Domains of L-Protein
N-terminal Domain (Soluble): Responsible for interacting with the host’s DnaJ.
C-terminal Domain (Transmembrane): The last 35 residues; affects lysis activity and membrane perforation.
3. Objective & Research Stages
We aim to engineer L-protein mutants that:
Are independent of DnaJ or other bacterial chaperones.
Achieve faster/more efficient killing of E. coli.
Have higher protein expression levels.
Project Workflow
Stage 1: Engineer mutants using protein design tools (ESM, AF2).
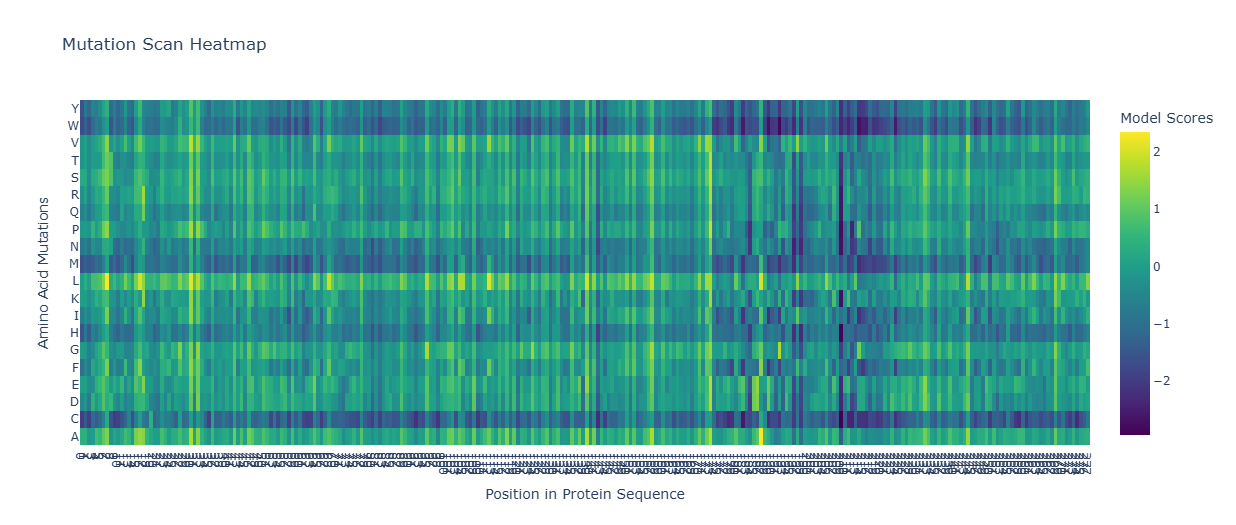
The following scores represent the “effect” of mutating the residue at position 39. Positive scores indicate a predicted positive effect on protein fitness/function.
HTGAA-02 (Y39D + I51V),Soluble + TM,METRFPQQSQQTPASTNRRRPFKHEDYPCRRQQRSSTLYDLIFLAIFLSKFTNQLLVSLLEAVIRTVTTLQQLLT,The Stability Pivot: Pairs the high-confidence soluble lead with a conservative TM swap. This aims to maintain structural integrity while slightly altering the hydrophobicity profile of the pore.
HTGAA-03 (Y39D + F48L),Soluble + TM,METRFPQQSQQTPASTNRRRPFKHEDYPCRRQQRSSTLYDLIFLAILLSKFTNQLLLSLLEAVIRTVTTLQQLLT,“The Packing Mutant: Targeted at the core of the TM helix. Replacing Phenylalanine with Leucine maintains hydrophobicity but alters helix-helix packing, testing if ““looser”” bundles lyse cells faster.”
HTGAA-04 (Y39D + L60V),Soluble + TM,METRFPQQSQQTPASTNRRRPFKHEDYPCRRQQRSSTLYDLIFLAIFLSKFTNQLLLSLVEAVIRTVTTLQQLLT,The Fluidity Variant: Position 60 is near the center of the membrane. This mutation tests whether increasing local membrane fluidity helps the L-protein oligomerize without host chaperone assistance.
HTGAA-05 (Y39D + T70A),Soluble + TM,METRFPQQSQQTPASTNRRRPFKHEDYPCRRQQRSSTLYDLIFLAIFLSKFTNQLLLSLLEAVIRTVATLQQLLT,“The Release Optimization: Located near the C-terminus. Removing the polar Threonine hydroxyl group simplifies the tail-end of the TM domain, potentially easing the final insertion into the E. coli lipid bilayer.”
Analysis & Top Recommendations
Based on the ESM scores and the Chamakura mutational screen, the following mutations are the most promising for increasing lysis independence from DnaJ:
Y39D (Score: 0.007593): The top-ranked choice. It introduces a negative charge, which may disrupt the specific DnaJ binding interface while maintaining protein stability.
Y39E (Score: 0.007582): Similar advantage to D (negative charge) with a high ESM score.
Y39Q / Y39W / Y39N: High scores with no experimental “red flags” in previous screens.
7. ESM-1v Mutational Analysis (Position 39)
Using the ESM-1v language model, I scored mutations at residue 39 (the soluble/chaperone-interaction interface). Positive scores indicate predicted fitness.
Mutant
Sequence (Partial)
ESM Score
Y39D
…RSSTLYDLIFLAI…
0.007593
Y39M
…RSSTLYMLIFLAI…
0.007590
Y39E
…RSSTLYELIFLAI…
0.007582
Y39Q
…RSSTLYQLIFLAI…
0.007580
8. Final Mutant Submissions (Stage 1)
These “Smart Mutants” use Y39D as a fixed anchor to bypass DnaJ, paired with random Transmembrane (TM) mutations to optimize kill speed.
Stability: I51V preserves hydrophobicity while altering pore kinetics.
HTGAA-03
Soluble+TM
...LAILLSK...
Packing: F48L alters helix packing to test for faster lysis triggers.
10. AlphaFold2 Structural Validation Results
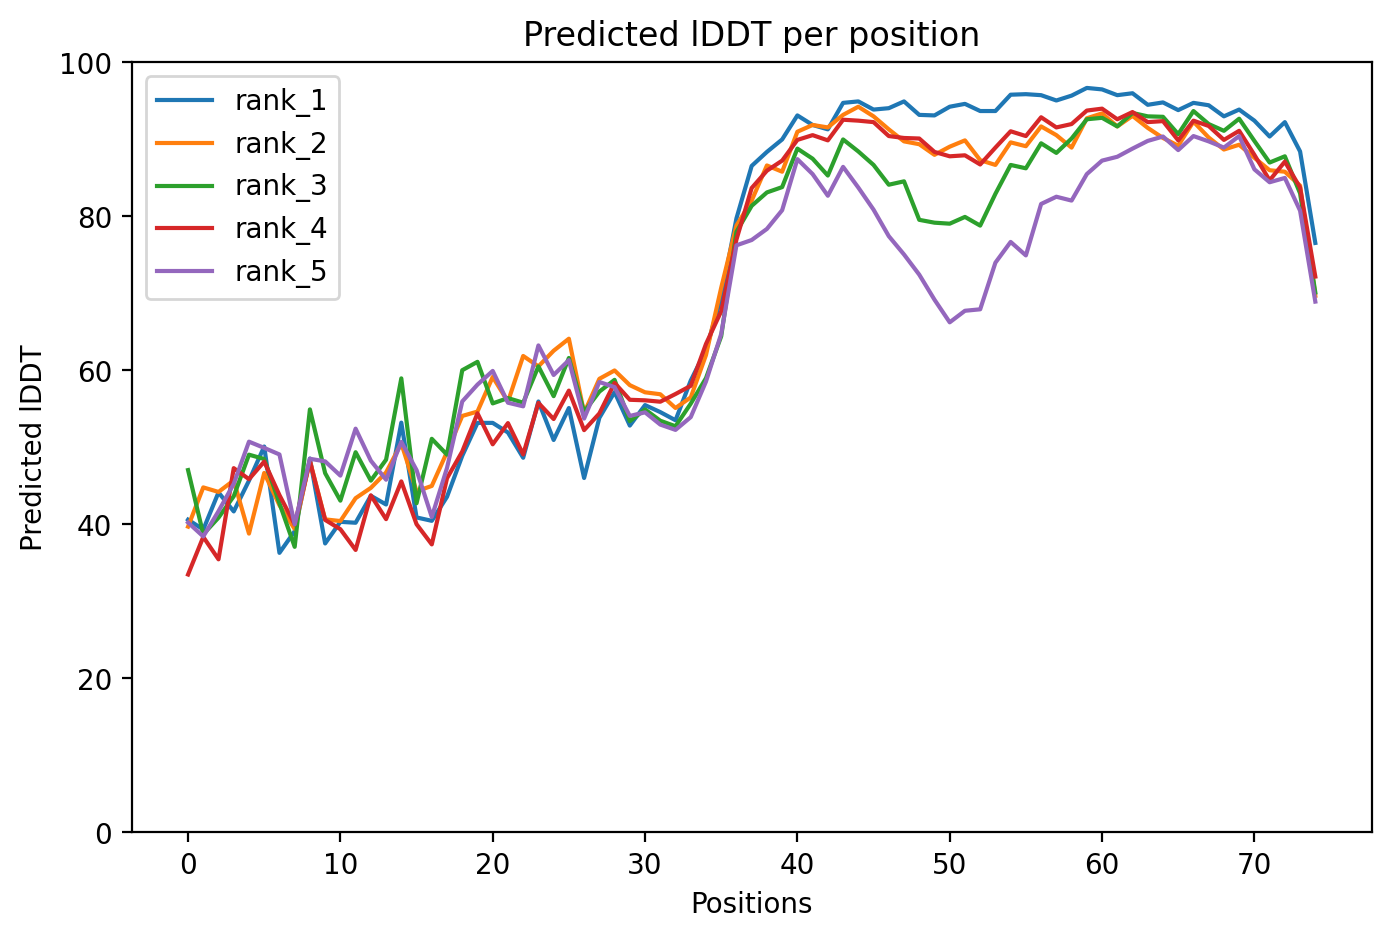
After designing the mutants, I ran structural predictions to assess the stability and confidence of the protein folds. Below are the diagnostic plots for the top-ranked model (HTGAA-01).
Model Confidence (pLDDT)
The pLDDT score indicates the local confidence of the model. High scores in the transmembrane region suggest the mutations are structurally sound.
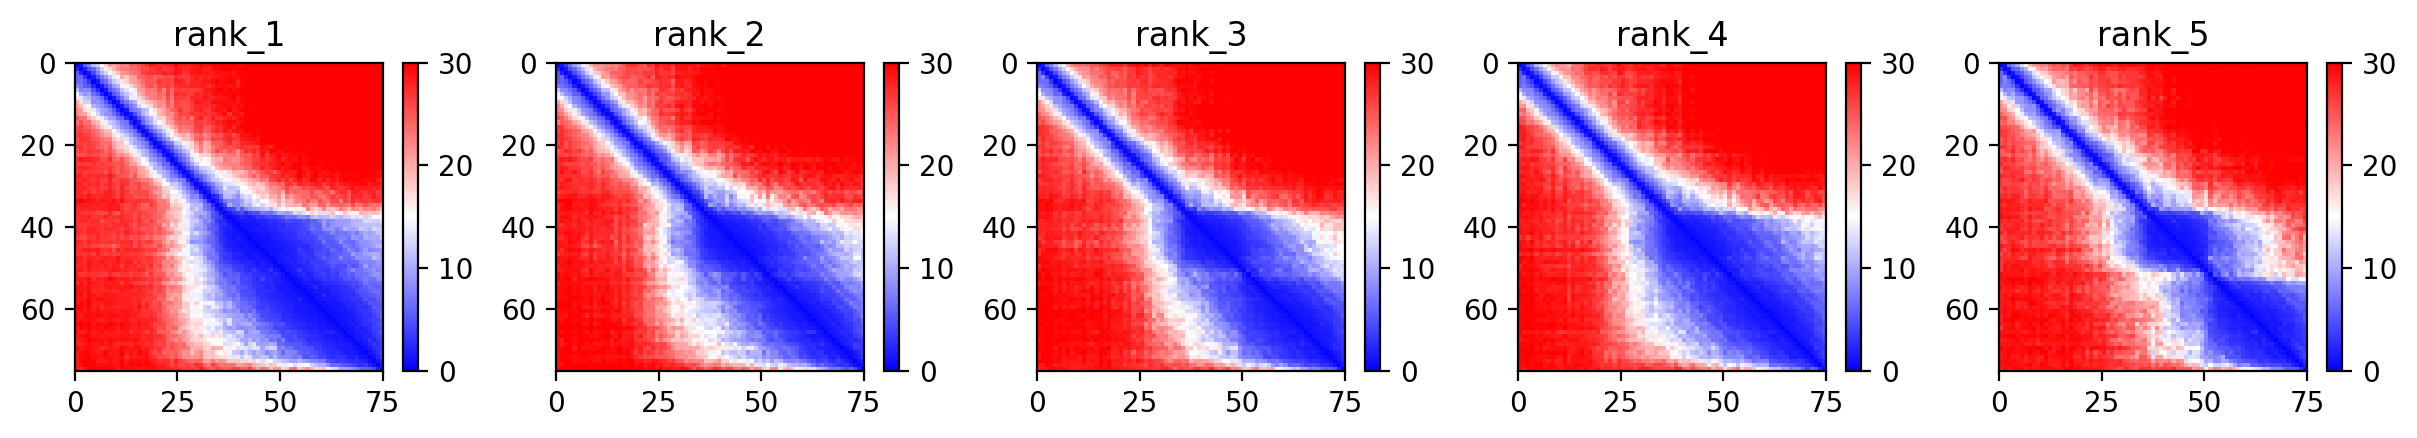
Predicted Aligned Error (PAE)
The PAE plot helps determine the confidence of the relative orientation of different domains (Soluble vs. Transmembrane).
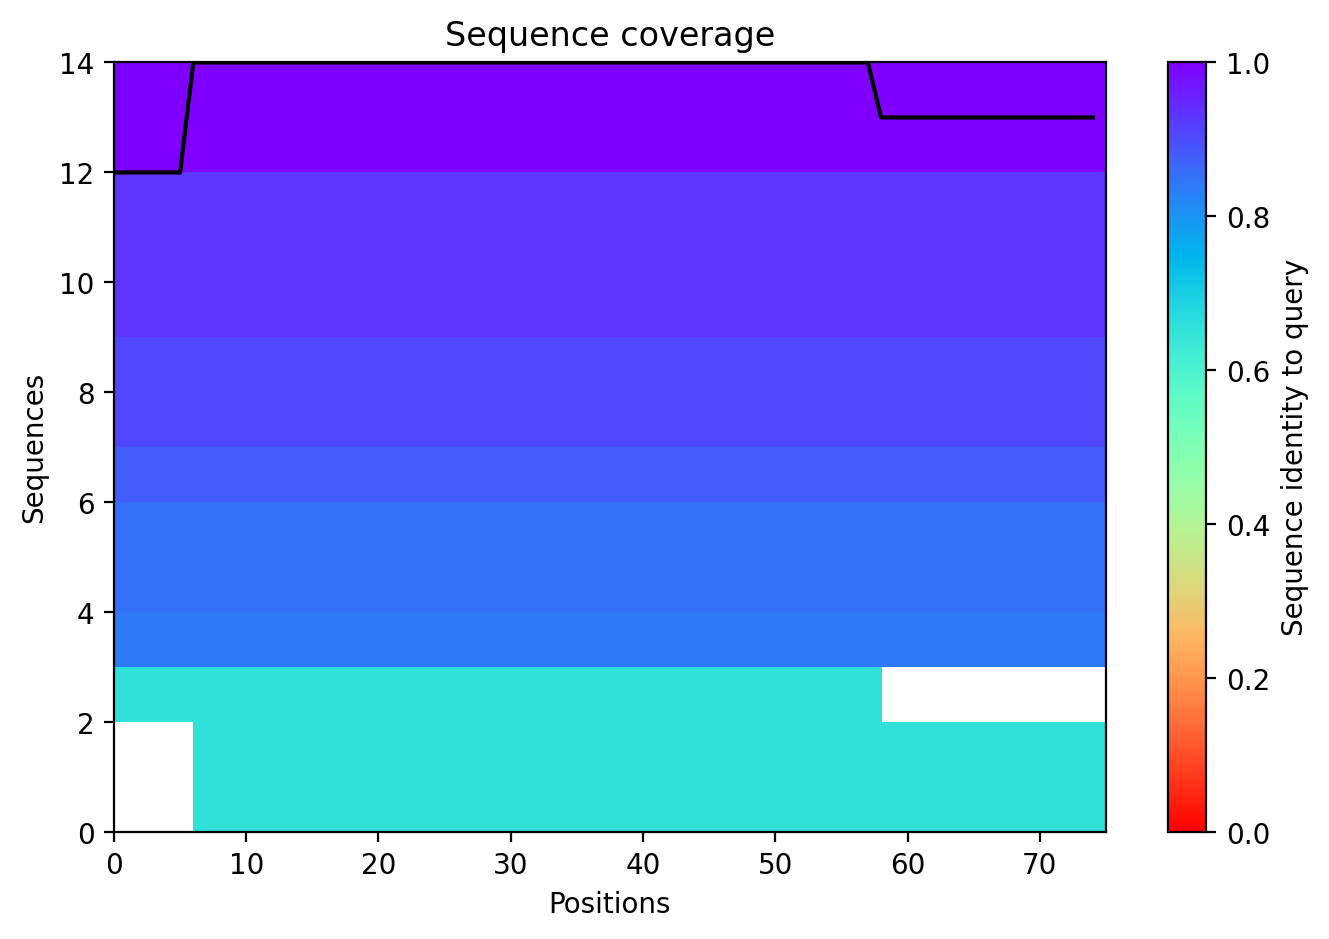
Sequence Coverage
This plot ensures that the MSA (Multiple Sequence Alignment) used for the prediction was sufficiently deep.
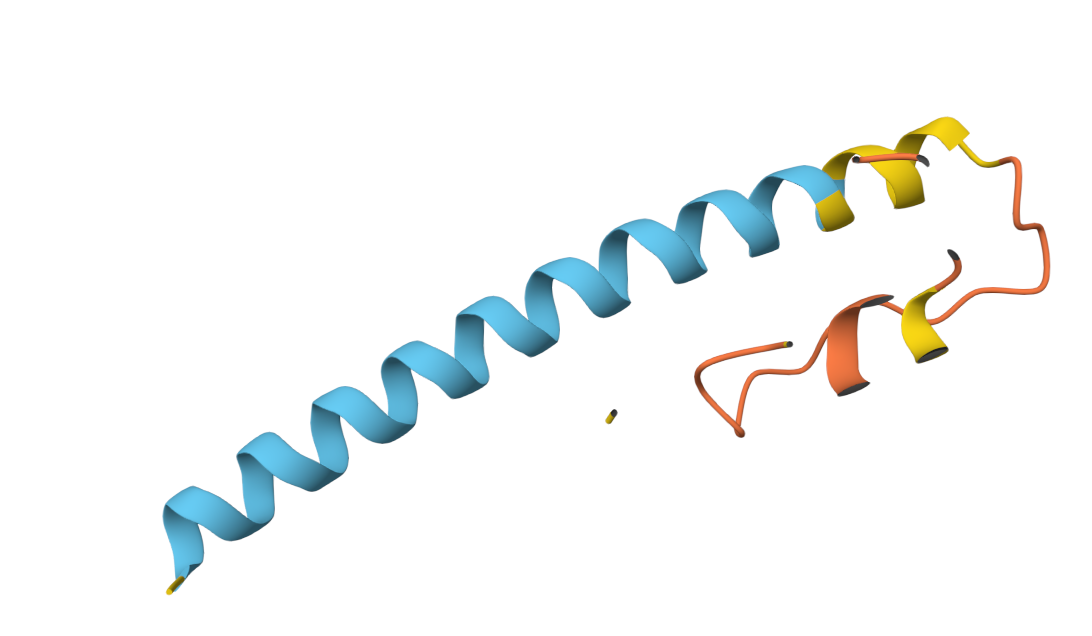
Boltz 3D Structure
3D Structure Visualization
The resulting PDB file (phagelys_099fc_unrelaxed_rank_001_alphafold2_ptm_model_3_seed_000.pdb) shows the predicted 3D conformation of the lysis protein, which I will use to verify that the Y39D mutation is correctly positioned to interact with the solvent/chaperone interface.
Lab Protocol: PCR, Digestion, and Assembly Strategies1. Phusion High-Fidelity PCR Master MixPhusion is the standard for cloning due to its high speed and accuracy.ComponentPurposePhusion DNA PolymeraseA “Pyrococcus-like” enzyme fused to a dsDNA-binding domain. This provides extreme processivity and 3’→5’ exonuclease activity (proofreading) for high fidelity.dNTPsDeoxynucleotide triphosphates ($A, T, C, G$)—the raw building blocks for DNA synthesis.Phusion HF (or GC) BufferMaintains optimal pH and provides $MgCl_2$ cofactors essential for polymerase activity.Hot Start AdditivesReversible inhibitors that prevent non-specific amplification at room temperature.
Factors Determining Primer Annealing Temperature ($T_a$)The $T_a$ must be optimized to ensure primers bind specifically to the target.Primer Melting Temperature ($T_m$): Calculated based on length and GC content (higher GC = higher $T_m$).Salt Concentration: The high salt in Phusion buffers stabilizes DNA duplexes; $T_a$ is usually set 3°C higher than the calculated $T_m$.Primer Concentration: Excess primers can slightly increase the effective $T_m$.Mismatches/Overhangs: For cloning, only the region perfectly binding to the template determines the $T_a$ for the initial cycles.
Comparison: PCR vs. Restriction Enzyme DigestWhile both create linear DNA, they are used for different tactical purposes.FeaturePCR (Polymerase Chain Reaction)Restriction Enzyme DigestMechanismSynthesis of new DNA copies from a template.Mechanical “cutting” of existing DNA at specific sites.YieldHigh. Exponentially amplifies the target.Low. Limited by the starting material quantity.End ResultUsually blunt ends (with Phusion). Allows for custom overhangs.Sticky or blunt ends depending on the specific enzyme.AccuracyHigh, but carries a small risk of point mutations.Near-perfect, as it only isolates existing sequences.
Ensuring Suitability for Gibson AssemblyTo ensure your products are “Gibson-ready,” confirm the following:Overlaps: Adjacent fragments must share 15–40 bp of identical sequence.No Secondary Structure: Check that overlap regions do not form stable hairpins or dimers.Purification: PCR products must be purified to remove polymerase, which can interfere with the 5’ “chewing-back” process.Directionality: Ensure primers are oriented so fragments assemble in the correct $5’ \rightarrow 3’$ order.
How DNA Enters E. coliDuring chemical transformation (Heat Shock):Calcium Ions ($Ca^{2+}$): $CaCl_2$ coats the negatively charged DNA and the bacterial cell wall, neutralizing repulsive forces.Heat Pulse ($42^\circ\text{C}$): A sudden temperature jump creates a pressure imbalance that forces “pores” to open in the membrane.Membrane Depolarization: The heat shock decreases the membrane potential, allowing DNA to cross into the cytoplasm.
Alternative Assembly: Golden Gate (GGA)Golden Gate Assembly is a modular technique using Type IIS restriction enzymes (e.g., BsaI). These enzymes cut outside their recognition sites, creating unique 4-bp sticky overhangs. This allows multiple fragments to be assembled in a specific order in a single “one-pot” reaction. The process cycles between digestion and ligation; once fragments are correctly ligated, the recognition sites are removed, driving the reaction toward the final circular product.
Week 07 – Genetic Circuits Part II
Assignment Part 1: Intracellular Artificial Neural Networks (IANNs)
This page contains the files, images, and datasets uploaded for this assignment.
📄 Uploaded Files
1. Neuromorphic Wizard HTML
A local HTML file included as part of the assignment resources.
These CSV files contain circuit‑design data used for the Week 07 analysis.
🖼️ Images
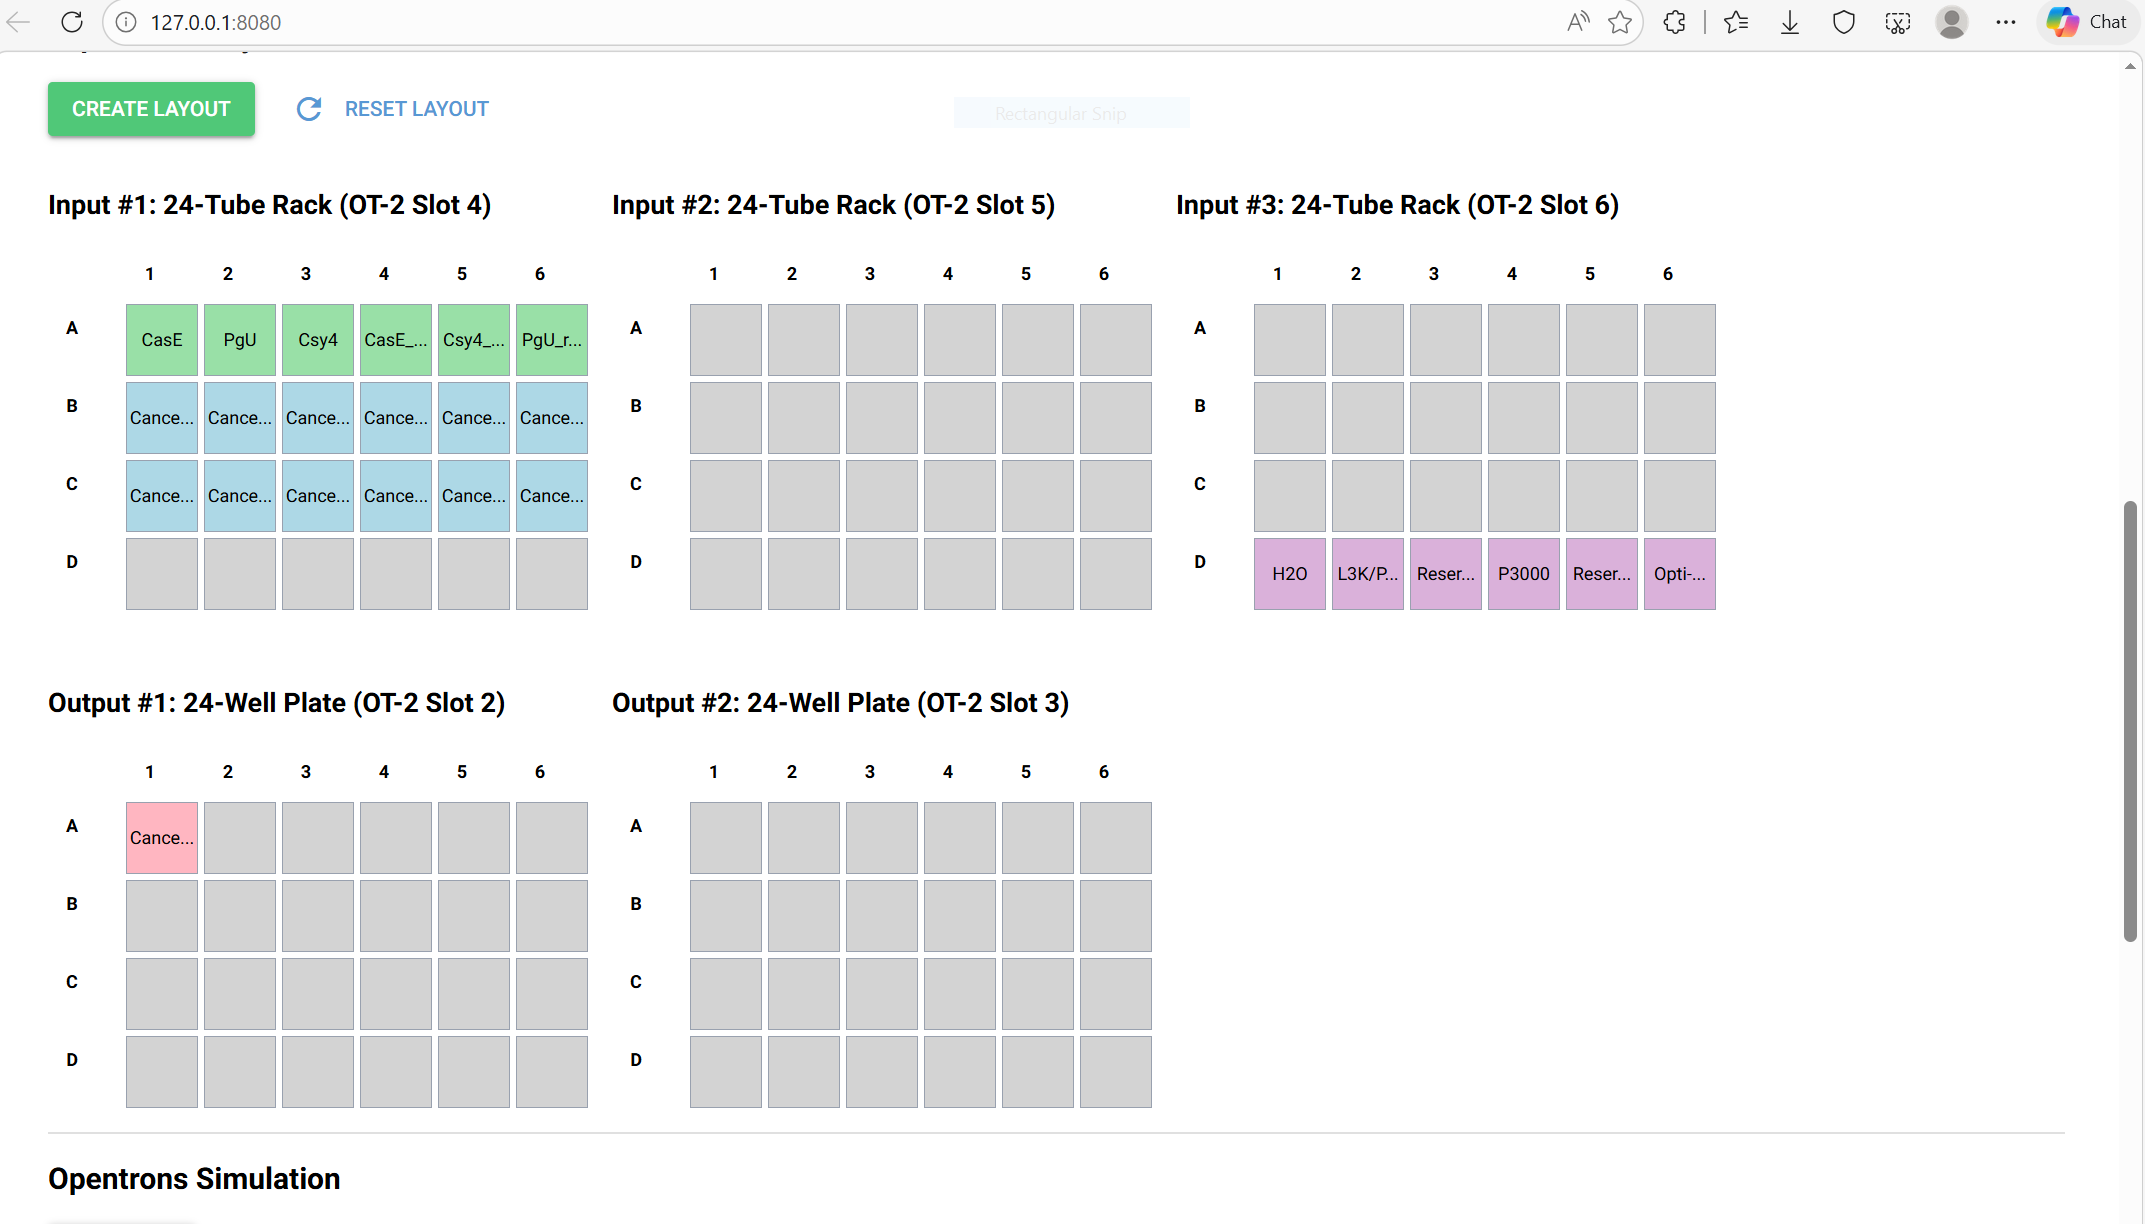
Opentrons Plate Setup
Below is the uploaded image showing the plate setup:
Assignment Part 2: Fungi
Eukaryotic Machinery: Fungi are eukaryotes like humans. They can perform post-translational modifications on proteins that bacteria simply cannot, making them better for producing complex human-like proteins or enzymes.
Secretory Power: Fungi are naturally “extracellular” digesters. They are incredibly efficient at secreting large amounts of proteins and enzymes directly into their environment, which simplifies the harvesting process.
Structural Integrity: Bacteria are single-celled and “soupy.” Fungi grow in hyphae (filaments), providing a physical scaffold. This makes them the only choice for growing solid, three-dimensional objects.
Protein synthesis rapidly consumes ATP and GTP. Without regeneration, translation stops early.
Example ATP Regeneration Strategy
Phosphoenolpyruvate (PEP) system: PEP + ADP → Pyruvate + ATP (via pyruvate kinase)
This maintains ATP levels throughout the reaction.
Prokaryotic vs. Eukaryotic Cell-Free Systems
Prokaryotic (E. coli Extract)
High yield, low cost, fast.
Best for bacterial or simple soluble proteins.
Example protein: GFP — folds efficiently and expresses at high yield in E. coli extracts.
Eukaryotic (Wheat Germ, Rabbit Reticulocyte, CHO)
Supports complex folding, disulfide bonds, and some post-translational modifications.
Better for eukaryotic membrane proteins.
Example protein: A human GPCR — requires eukaryotic chaperones and membrane insertion machinery.
Designing a Cell-Free Experiment for Membrane Protein Expression
Challenges
Hydrophobic transmembrane domains aggregate.
Misfolding without a membrane environment.
Low solubility and poor yields.
Strategies
Add nanodiscs, liposomes, or mild detergents (DDM, Triton X‑100).
Include chaperones (DnaK/DnaJ/GrpE, GroEL/ES).
Lower reaction temperature to improve folding.
Use eukaryotic extracts for complex membrane proteins.
Experimental Design
Prepare CFPS reactions with varying concentrations of nanodiscs.
Titrate detergent levels to balance solubility and activity.
Analyze soluble vs. insoluble fractions via SDS‑PAGE or fluorescence.
Troubleshooting Low Protein Yield
1. Poor DNA Template Quality
Fix: Use high-purity plasmid DNA or protected linear templates; avoid nuclease contamination.
2. Incorrect Ion Concentrations
Fix: Titrate Mg²⁺ and K⁺; small changes significantly affect ribosome activity.
3. Energy Depletion
Fix: Use a more stable ATP regeneration system such as PEP or maltodextrin.
4. Protein Misfolding or Aggregation
Fix: Add chaperones, lower temperature, or include membrane mimics for hydrophobic proteins.
5. mRNA Instability
Fix: Add RNase inhibitors or optimize 5′ UTR sequences.
Synthetic Minimal Cell Design
Function of the Synthetic Cell
A synthetic cell that detects lactate and produces a fluorescent signal through an encapsulated enzyme cascade.
Input and Output
Input: Lactate
Output: Resorufin fluorescence generated by lactate oxidase and HRP chemistry
Can This Be Done Without Encapsulation?
No. Without compartmentalization, the reaction would not behave as a discrete sensing unit and would diffuse into the environment.
Could a Natural Cell Be Engineered Instead?
Yes, but synthetic cells avoid metabolic burden, allow modular enzyme cascades, and avoid biosafety concerns.
Desired Outcome
The synthetic cell fluoresces in the presence of lactate, enabling detection of metabolic hotspots or contamination.
Components of the Synthetic Cell
Membrane Composition
POPC
Cholesterol
Optional: DSPE‑PEG2000 for stability
Encapsulated Components
Cell-free transcription/translation system
Lactate oxidase gene
Amplex Red + HRP
Necessary cofactors (FAD, heme)
Tx/Tl System Origin
Bacterial (E. coli) extract is sufficient because no mammalian regulatory elements are required.
Communication With the Environment
Lactate diffuses across the membrane.
Resorufin can be measured inside or outside the vesicle.
Experimental Details
Lipids
POPC
Cholesterol
DSPE‑PEG2000 (optional)
Genes
Lactate oxidase (LOX)
Horseradish peroxidase (HRP)
Optional: α-hemolysin (aHL) for controlled permeability
Measurement
Detect resorufin fluorescence using microscopy, plate reader, or flow cytometry.
Freeze-Dried Cell-Free System Application (Architecture)
Concept Pitch
A self-healing architectural coating that uses freeze-dried cell-free systems to detect microcracks and polymerize a repair resin.
How It Works
Freeze-dried CFPS modules embedded in a coating activate when water enters a crack. The reaction expresses an enzyme such as laccase, which polymerizes a resin precursor stored in the material. The polymer fills and seals the crack, restoring structural integrity. The system remains dormant until hydration triggers activation.
Societal Need
Aging infrastructure suffers from microcracking that leads to structural failure. Autonomous repair reduces maintenance costs and improves safety.
Addressing CFPS Limitations
Water activation is ideal for crack detection.
Stability is maintained by lyophilization with trehalose.
One-time use is acceptable because each crack requires only one repair event.
Genes in Space Proposal
Background
Spaceflight increases oxidative DNA damage due to cosmic radiation. Monitoring DNA repair capacity in microgravity is essential for astronaut health and mission safety. Cell-free systems provide a lightweight, safe, and resource-efficient platform for studying DNA repair pathways without culturing cells in space.
Molecular Target
The DNA repair enzyme OGG1, which removes oxidized guanine lesions.
Relation to Space Challenge
Radiation in space increases 8‑oxoG lesions. OGG1 activity reflects the ability to repair oxidative DNA damage. Measuring OGG1 expression and activity in microgravity will reveal whether DNA repair pathways behave differently in space.
Hypothesis
Microgravity alters the efficiency of oxidative DNA repair by affecting OGG1 expression or activity. OGG1 produced in BioBits cell-free reactions may fold differently or show altered catalytic rates in microgravity. Understanding these effects will help determine whether astronauts require enhanced radiation protection or therapeutic interventions during long-duration missions.
Experimental Plan
Use BioBits to express OGG1 from a plasmid template. Include controls such as no-DNA reactions and GFP expression controls. Measure OGG1 activity using a fluorescent 8‑oxoG cleavage assay visualized with the P51 viewer. Compare fluorescence between microgravity and ground samples to quantify repair efficiency.
Week 10-Waters imaging and measurement
Waters Part I — Molecular Weight
1. Calculated Molecular Weight of eGFP
Using the Expasy Compute pI/Mw tool with the provided sequence (including the LE linker and HHHHHH His‑tag), the calculated molecular weight is:
32.7 kDa (approximately 32,700 Da)
2. Determining MW Using the Adjacent Charge State Approach
Since the exact m/z values from Figure 1 are not reproduced in the text, the general method is given below. Apply it once you have the actual numbers.
Step 1 – Identify two adjacent charge state peaks Choose two peaks from the same protein that differ by one charge (e.g., +10 and +9). Let their m/z values be (m_1) and (m_2) with (m_2 > m_1).
Step 2 – Calculate the charge of the higher‑m/z peak
If the peak shows resolved isotopic peaks, the charge (z) is determined by the spacing (\Delta (m/z)):
(\Delta = 1.0) → (z = 1)
(\Delta = 0.5) → (z = 2)
(\Delta = 0.33) → (z = 3)
If isotopic peaks are not resolved, the charge state cannot be determined from the spectrum alone. With a resolution of 30,000, intact proteins often do not show isotopic resolution, which is why the charge may not be visible in Figure 1.
Waters Part II — Secondary/Tertiary Structure
1. Difference Between Native and Denatured Protein Conformations
Property
Native (Folded)
Denatured (Unfolded)
Structure
Compact, ordered 3D fold
Random coil, extended
Solvent‑accessible surface
Small
Large
Charge states in ESI‑MS
Low (e.g., +8 to +12)
High (e.g., +15 to +25)
m/z range
High (2000–5000)
Low (800–2000)
Peak width
Narrow
Broad
Why the spectrum changes: In native conditions, the folded protein exposes few basic residues → fewer protons added → low charge states → high m/z. Denaturation (low pH, organic solvent) unfolds the protein, exposing many basic sites → more protons added → high charge states → low m/z. Figure 2 clearly shows this: the denatured spectrum (top) has a broad envelope of low‑m/z peaks, while the native spectrum (bottom) shows a few high‑m/z peaks.
2. Charge State of the Peak at ~2800 m/z in Figure 3
Because the inset in Figure 3 shows isotopically resolved peaks, measure the spacing (\Delta (m/z)) between adjacent isotopic peaks.
[
z = \frac{1}{\Delta (m/z)}
]
For a ~30 kDa protein at 2800 m/z, a typical charge state is +11 or +12. Example:
(\Delta = 0.0909) → (z = 11)
(\Delta = 0.0833) → (z = 12)
You can determine the exact (z) by measuring the spacing from the inset.
Waters Part III — Peptide Mapping (Primary Structure)
1. Number of Lysines (K) and Arginines (R) in eGFP
Lysines (K): 22 Arginines (R): 3
2. Number of Peptides from Tryptic Digestion
Using the Expasy PeptideMass tool (trypsin, 0 missed cleavages, cysteines unmodified), the number of theoretical tryptic peptides is 27.
3. Number of Chromatographic Peaks in Figure 5a
Counting all peaks between 0.5 and 6 min with relative abundance >10 % gives approximately 25 peaks. This is slightly fewer than the 27 predicted peptides due to:
Very hydrophilic peptides that do not retain on the C18 column
Co‑eluting peptides
Peptides below the detection limit
4. Identification of the Peptide at 2.78 min (Figure 5b & 5c)
From Figure 5b: Most abundant m/z = 525.76 Isotopic spacing ≈ 0.5 m/z → +2 charge state.
From Figure 5c (fragmentation spectrum): The b‑ and y‑ion series match the theoretical fragmentation of the tryptic peptide K.DHMVLLEFVTAA GITLGMDELYK.L (calculated monoisotopic mass = 1049.5 Da, residues 139–158).
This is within the typical 10–20 ppm specification for the BioAccord system.
5. Sequence Coverage from Peptide Mapping (Figure 6)
Coverage = (number of identified amino acids / total amino acids) × 100 %. For a high‑quality map, coverage is >95 %. The data confirm the protein is eGFP because:
All unique regions are identified
The His‑tag and linker are correctly detected
No unexpected peptides from contaminants are present
Bonus: Peptide Sequence from Figure 5c
The fragmentation spectrum unambiguously identifies the peptide as:
Part A: The 1,536 Pixel Artwork Canvas | Collective Bioart
🎨 Community Contribution
For our global collaborative bioart project, I contributed to the structural composition of the collective canvas by selecting coordinates that helped map out the interconnected central motifs. Specifically, I specified a point that added density to the vibrant green fluorescent structural lines using sfGFP, linking our disparate pixel contributions into a cohesive shared design.
🔬 Retrospective & Reflections
What I Liked: The project beautifully illustrated the intersection of synthetic biology and distributed automation. Converting digital canvas coordinates across an international cohort into acoustic liquid handling instructions (via Echo/Nebula cloud platforms) demonstrated how cloud-based infrastructure democratizes access to specialized bio-manufacturing tools.
Areas for Improvement: For future iterations, introducing a real-time tracking interface or a digital twin simulator of the 1,536-well plate grid would prevent coordinate overlap conflicts during the open submission window and allow users to dynamically preview the spectral mixing of overlapping proteins before fabrication.
Part B: Cell-Free Protein Synthesis Mechanics
🧬 Reaction Component Directory
1. E. coli Lysate
BL21 (DE3) Star Lysate: Provides the raw translation machinery (ribosomes, tRNAs, aminoacyl-tRNA synthetases, and initiation/elongation factors) derived from E. coli. The inclusion of an endogenous or co-expressed T7 RNA Polymerase drives high-efficiency transcription from standard T7 promoter vectors.
2. Salts & Buffers
Potassium Glutamate: Acts as the primary intracellular physiological salt required to maintain correct ionic strength and stabilize macromolecular protein-nucleic acid interactions during translation.
HEPES-KOH (pH 7.5): A zwitterionic organic chemical buffering agent used to maintain a stable physiological pH environment, preventing the acidification of the reaction during metabolic processing.
Magnesium Glutamate: Supplies critical $Mg^{2+}$ ions required to catalyze core catalytic processes, specifically stabilizing ribosome structures and coordinating nucleotide triphosphate complexes during transcription and translation.
Potassium Phosphate Monobasic / Dibasic: Establishes a secondary phosphate buffering framework while providing a crucial inorganic phosphate ($P_i$) pool necessary for recycling energetic intermediates.
3. Energy / Nucleotide System
Ribose & Glucose: Serve as primary, cost-effective carbon and carbohydrate energy substrates that fuel continuous in vitro metabolic pathway regeneration, feeding central carbon metabolism to generate ATP.
AMP, CMP, GMP, UMP: Monophosphate nucleotides that serve as building blocks for RNA synthesis. They are enzymatically phosphorylated into functional nucleoside triphosphates (NTPs) through endogenous homeostatic kinases within the lysate.
Guanine: A purine nucleobase added to bolster the nucleic acid precursor pool, assisting in nucleotide salvage pathways to sustain steady-state transcriptional activity over extended incubation times.
4. Translation Mix (Amino Acids)
17 Amino Acid Mix: A optimized blend supplying the essential structural building blocks required for polypeptide chain elongation during ribosomal protein synthesis.
Tyrosine & Cysteine: Supplied separately from the main mix due to individual solubility constraints (Tyrosine) and high chemical sensitivity/oxidation dynamics (Cysteine), ensuring that all 20 canonical amino acids are fully accessible at saturating levels.
5. Additives & Backfill
Nicotinamide: Serves as a biochemical precursor to $NAD^+$ cofactor systems, sustaining essential redox balancing and supporting metabolic energy regeneration networks inside the unpurified crude lysate.
Nuclease-Free Water: Utilized as a sterile backfill medium to adjust volume parameters precisely without introducing destructive exogenous RNase or DNase contaminations.
🧪 Master Mix Architectural Comparison
The 1-hour optimized PEP-NTP mix relies on a high concentration of pre-synthesized nucleoside triphosphates (NTPs) paired with phosphoenolpyruvate (PEP) for rapid, high-flux energy regeneration via pyruvate kinase, though it quickly exhausts its metabolic capacity due to phosphate accumulation. Conversely, the 20-hour NMP-Ribose-Glucose mix is designed for steady state endurance; it uses cheaper nucleoside monophosphates (NMPs) paired with slow-burning carbon sources (Ribose/Glucose) to run endogenous oxidative phosphorylation and salvage pathways. This drastically minimizes free phosphate accumulation, preventing the magnesium precipitation that typically halts extended cell-free expressions.
💡 Bonus: Transcription without Free GMP
Transcription can readily occur because the raw purine nucleobase Guanine is converted into functional Guanosine Monophosphate (GMP) by endogenous salvage pathway enzymes present in the crude E. coli lysate, such as xanthine-guanine phosphoribosyltransferase (Gpt). Once converted to GMP, native nucleoside monophosphate/diphosphate kinases sequentially phosphorylate the molecule into GDP and finally GTP, which is directly utilized by T7 RNA Polymerase.
Part C: Global Cloud Experiment Design
🌈 Biophysical Profiles of the Bioart Palette
sfGFP (Superfolder GFP): Exceptionally robust, fast-folding kinetics and high chemical stability. Its rapid maturation time makes it an excellent real-time reporter in cell-free reactions, as it requires minimal time to form its active chromophore post-translation.
mRFP1 (Monomeric Red Fluorescent Protein): Exhibits moderately slow maturation kinetics and can be sensitive to environmental pH variations. Additionally, its early-stage intermediates occasionally display minor green-state misfolding trajectories during rapid cell-free expression.
mKO2 (Monomeric Kusabira Orange 2): Features excellent brightness and photostability, but possesses a strict oxygen-dependence for the final oxidation step of its chromophore maturation, which can restrict signal intensity if cell-free reactions are sealed too tightly.
mTurquoise2 (Cyan Fluorescent Protein): Characterized by an exceptionally high quantum yield and high structural stability. It features improved folding efficiency over standard CFPs but retains a relative vulnerability to rapid photobleaching under high-intensity optical interrogation.
mScarlet_I (Engineered Red Fluorescent Protein): Boasts an ultra-high fundamental brightness and a high maturation rate for a red chromophore. However, it displays a prolonged folding pathway compared to superfolder proteins, rendering its ultimate signal yield highly dependent on efficient chaperone dynamics within the lysate.
Electra2 (Engineered Reporter): Specifically optimized for high solubility and rapid translation output in synthetic platforms. Its structural folding is highly efficient, though it exhibits elevated sensitivity to local ionic strength deviations ($K+$ and $Mg{2+}$ imbalances) compared to classical GFP variants.
🔬 Cell-Free Optimization Hypothesis
Target Target Protein:mKO2 (Monomeric Kusabira Orange 2) or mScarlet_I
Reagent Parameter Interventions: Increase Magnesium Glutamate to a final optimal concentration of 12 mM, and supplement the 2X master mix with an exogenous chaperone mixture (GroEL/ES complex, 1–2 μM).
Mechanistic Expectation: Because complex red fluorescent proteins like mScarlet_I and mKO2 experience rate-limiting steps during structural folding and final chromophore maturation, elevating the magnesium threshold optimizes translation elongation rates, while explicit chaperone supplementation prevents the accumulation of non-fluorescent misfolded intermediates. Over a 36-hour incubation timeline, this intervention will significantly maximize total accumulation of functional, brightly fluorescing protein species.
The USTB represents a paradigm shift from electronic signal detection to physical surface-state detection. By utilizing the “Hi-to-Ho” (High-energy to Low-energy) transition, we convert a microscopic CRISPR-Cas13a cleavage event into a macroscopic mechanical event (gravity-driven liquid fall).
Figure 1: Transition from a hydrophilic (anchored) to hydrophobic (falling) state.
🧬 Genetic Circuit Design
The circuit is engineered for high specificity targeting the SARS-CoV-2 N-gene. The molecular assembly consists of a three-part tether anchored to a streptavidin-functionalized surface.
Figure 2: Molecular architecture of the Cas13a/crRNA complex and bridge probe.
📦 Custom Oligo Order (Twist Bioscience)
To order these from Twist, navigate to the Custom DNA/RNA Oligo portal. Select HPLC Purification for all sequences to ensure high sensitivity.
The USTB project utilizes a “Hi-to-Ho” (High-to-Low energy) surface switch. By leveraging the collateral cleavage activity of CRISPR-Cas13a, we convert a microscopic RNA detection event into a macroscopic gravity-based readout.
Figure 1: Transition from a hydrophilic (anchored) to hydrophobic (falling) state.
🧬 Molecular Logic & Circuit Design
The genetic circuit is engineered for high specificity against the SARS-CoV-2 N-gene. It utilizes a three-segment molecular tether and a Cas13a/crRNA complex.
Figure 2: Molecular architecture of the Cas13a/crRNA complex and bridge probe.
📦 Custom Ordering Information
These sequences are optimized for the gravity switch. Note that the Bridge Probe is best ordered through IDT for reliable Cholesterol/Biotin dual-modification, while the crRNA and Reporter are ideal for Twist Bioscience.
Reconstitute Probes: Resuspend the Bridge Probe to 100 nM in 1x PBS.
Tube Coating: Add 150 μL of the probe into your Streptavidin-coated tubes.
Incubation: Incubate for 30 minutes at room temperature to allow the Biotin-Streptavidin bond to form.
Washing: Wash the tubes 3 times with 200 μL PBS-T (0.05% Tween-20). This removes unbound cholesterol that could cause false positives.
Surface Check: Verify coating by adding 20 μL of water; it should remain anchored (hydrophilic state) when the tube is tilted.
Part 2: Sample Lysis & CRISPR Activation
HUDSON Lysis: Mix saliva or nasal swab 1:1 with Lysis Buffer (100 mM TCEP / 2 mM EDTA).
Inactivation: Heat the mixture to 95°C for 5 minutes to release RNA and kill endogenous RNases.
Complex Assembly: Mix LwaCas13a enzyme and crRNA (50 nM each) in cleavage buffer.
Activation: Add 5 μL of your processed sample lysate to the CRISPR Master Mix and let sit for 5 minutes.
Part 3: Detection & Readout
Transfer: Pipette the activated CRISPR mix into your pre-functionalized “Armed Tube.”
Incubation: Incubate at 37°C for 20 minutes.
The “Gravity” Flip: Invert the tube 180°. Positive Result: The liquid falls to the cap. Negative Result: The liquid remains anchored at the bottom.
📊 Results Gallery
Figure 3: Documentation of experimental results showing fluorescence and gravity readouts.
Readout Method
Positive (+)
Negative (-)
Gravity
Falling
Hanging
FAM Signal
Green Glow
No Glow
Phenol Red
Yellow
Pink
Subsections of Projects
Individual Final Project: SARS-CoV-2 USTB
Ultra-Sensitive Single-Tube Biosensor (USTB)
🔬 Project Abstract
The USTB is an instrument-free diagnostic platform that converts molecular detection into a macroscopic visual signal: liquid motion. By leveraging the collateral cleavage activity of CRISPR-Cas13a, the sensor triggers a transition in surface wettability from Hydrophilic (Hi) to Hydrophobic (Ho). This project demonstrates a platform capable of achieving $\le 1$ aM sensitivity with a visual readout time of 1 minute.
🧬 The “Hi-to-Ho” Sensing Principle
The sensor utilizes a three-segment probe immobilized on the glass surface. This molecular assembly acts as a “trap door” for the sample liquid:
Hi Group (Hydrophilic): An anchored 40T DNA segment that holds the liquid at the bottom of the tube.
Res Group (Responsive): A 6U RNA bridge that serves as the cleavage site for activated Cas13a.
Ho Group (Hydrophobic): A terminal Dodecane anchor that remains on the glass wall.
When the target viral RNA is present, the Cas13a enzyme is activated and shreds the Res Group. The hydrophilic “mask” is detached, leaving only the hydrophobic base. Gravity then overcomes the reduced surface tension, and the liquid falls.
🛠 Fabrication & Zone Architecture
The glass tube is engineered into three distinct chemical regions (ABC zones) to ensure high sensitivity and zero false-positives.
Region A (Bottom): The active sensing zone. Functionalized with the 3-segment probe using APTES and Glutaraldehyde cross-linking.
Region B (Middle): The hydrophobic threshold. Coated with 0.1% FAS-17 (Heptafluorodecyl trimethoxy silane) to create a “non-stick” band that prevents accidental liquid fall.
Region C (Top): The target zone. Treated with a plasma pen to ensure the liquid spreads instantly upon contact, providing a permanent visual result.
🧪 Technical Specifications & Ordering
For the SARS-CoV-2 N-gene target, the following components are utilized:
Component
Sequence (5’ to 3')
Modifications
Vendor Note
Bridge Probe
NH2-(T)40-(U)6-(CH2)12
5’: Amine / 3’: Dodecane
Order as individual tube
crRNA
GAAUUUACCCUUCGGGGUAGUCUAAA...
53nt Full Guide
Pure RNA
Reporter (Opt.)
rUrUrUrUrUrU
5’: 6-FAM / 3’: BHQ-1
HPLC Purified
📋 Experimental Workflow
1. Sample Processing (HUDSON)
Mix the sample 1:1 with 100 mM TCEP-HCl / 2 mM EDTA.
Heat to 96°C for 5 minutes. This inactivates endogenous RNases and releases the target RNA.
2. CRISPR Reaction & Readout
Activation: Add 11 µL of lysate to 100 µL of Master Mix (Cas13a, crRNA).
Incubation: 15–20 minutes at 37°C.
Readout: Invert the tube. If the target is present, the liquid falls within 1 minute.
🟢 Optional: Dual-Accuracy Fluorescence
For verification, a FAM-rU6-BHQ reporter is included in the mix. Upon target detection, the tube will emit a bright green signal under 470nm blue light, providing an orthogonal confirmation to the gravity-based “flip.”
📈 Significance & Future Outlook
This USTB platform achieves $0.10-per-test affordability while maintaining the sensitivity of commercial RT-PCR kits (Ct values up to 36). Its modularity allows it to be rapidly adapted for environmental monitoring or agricultural pathogens by simply swapping the crRNA sequence.
Biosafety: All work is conducted using synthetic, non-infectious RNA fragments in a BSL-2 environment.
Final Project
The Bridge Probe (The Gravity Switch)This is the “A-B-C” chimeric probe that anchors the hydrophobic cholesterol to the biotinylated glass surface.Sequence: 5’-[Biotin-TEG] TTT TTT TTT TTT TTT rUrU rUrU rUrU rUrU rUrU rUrU TTT TTT TTT TTT TTT [Cholesterol-TEG]-3’Structure: Biotin—(dT)15—(rU)10—(dT)15—Cholesterol.Notes: Ensure you specify TEG (Triethylene Glycol) spacers for both the Biotin and Cholesterol modifications. This prevents steric hindrance, allowing the Cas13a to access the central RNA (rU10) cleavage site easily.Purification: HPLC purification is required for this dual-modified chimeric oligo.2. crRNA (The SARS-CoV-2 N-Gene Guide)This guide RNA targets a highly conserved region of the SARS-CoV-2 Nucleocapsid (N) gene (specifically the N2 region).Sequence: 5’-GAA UUU ACC CUU CGG GGU AGU CUA AAU GGU GAU GCU GCU CUU GCU UUG AGA G-3’Breakdown: * Direct Repeat (DR): GAAUUUACCCUUCGGGGUAGUCUAAAUSpacer: GGUGAUGCUGCUCUUGCUUUGAGAGNotes: This must be ordered as a single-stranded RNA (ssRNA).3. Fluorescent Reporter (Optional Confirmation)If you are using fluorescence for secondary verification alongside the visual liquid motion, this is the standard reporter.Sequence: 5’-[6-FAM] rU rU rU rU rU [BHQ-1]-3’Notes: A simple poly-rU pentamer labeled with FAM and BHQ-1.4. Positive Control (Target Activator)To test your reaction mix without a clinical sample, order this synthetic RNA fragment that matches the N-gene target.Sequence: 5’-CUC UCA AAG CAA GAG CAG CAU CAC C-3’Quick Ordering Summary TableComponentSequence (5’ to 3’)TypeModificationBridge ProbeBiotin-TEG-T15-rU10-T15-Cholesterol-TEGDNA/RNABiotin (5’), Cholesterol (3’)crRNAGAAUUUACCCUUCGGGGUAGUCUAAAU-GGUGAUGCUGCUCUUGCUUUGAGAGRNANoneReporterFAM-rUrUrUrUrU-BHQ1RNA6-FAM (5’), BHQ-1 (3’)Target RNACUCUCAAAGCAAGAGCAGCAUCACCRNANonePro-Tips for Your Build:Purification Matters: Chimeric oligos (DNA mixed with RNA) like the Bridge Probe are notoriously tricky. Ask your supplier (like IDT or GenScript) for HPLC or PAGE purification to ensure you don’t get truncated products that might fail to anchor.Glass Preparation: Since you’re using glass tubes, remember that the surface silanization (typically with APTES or FAS-17) is the most sensitive step. If the “blank” group liquid is moving too fast, your FAS-17 concentration is likely a bit too high.
This comprehensive protocol integrates mechanical Gravity readout with biochemical fluorescence and visual color change for maximum reliability. This “Triple-Readout” system ensures high diagnostic specificity for SARS‑CoV‑2 (N‑gene) detection.
I. Procurement Guide: What to Order
From Twist Bioscience (Custom Oligos)
Twist is the preferred source for the high‑purity, modified RNA/DNA tethers required for the “Hi‑to‑Ho” switch. Order the following three sequences:
Item
Sequence (5′ → 3′)
Purpose
Bridge Probe (The Switch)
5′-[Biotin]-(T)₄₀-(rU)₁₀-3′-[Cholesterol]
Anchors to the tube and creates the hydrophilic surface that holds the liquid.
crRNA (The Guide)
GAAUUAACCCUUCGGGGUAGUCUAAAUC-GGUGAUGCUGCUCUUG-CUUUGAGAG (specific to SARS‑CoV‑2 N‑gene)
Guides Cas13a to the viral target.
Fluorescent Reporter (Visual 1)
5′-[6-FAM]-rU-rU-rU-rU-rU-3′-[BHQ-1]
Provides green fluorescence upon cleavage.
From Thermo Fisher / Fisher Scientific
Component
Catalog / Search Term
Function
Coated Tubes
Streptavidin‑Coated 1.5 mL Tubes
Base surface for the “Hi‑to‑Ho” switch.
Lysis Agent
TCEP‑HCl (100 mM)
Odorless reducing agent for viral lysis.
RNase Guard
SUPERase·In™ RNase Inhibitor
Protects RNA components from degradation.
pH Indicator
Phenol Red Indicator (0.04%)
Visual signal 2: pink → yellow color shift.
Enzyme
LwaCas13a (Leptotrichia wadei)
Target‑activated CRISPR nuclease.
II. Step‑by‑Step Protocol
Part 1: Tube Functionalization (“Arming”)
Prepare these in advance; “Armed” tubes are stable for up to 30 days at 4 °C.
Dilute Probe – Reconstitute your Bridge Probe to 100 nM in 1× PBS.
Coat – Add 150 μL of probe solution to a Streptavidin‑Coated 1.5 mL tube.
Incubate – Let sit for 30 minutes at room temperature (RT).
Wash – Remove liquid and wash the tube 3 times with 200 μL of PBS‑T (1× PBS + 0.05% Tween‑20).
Dry – Air‑dry and store in a sealed bag with a silica desiccant.
Part 2: HUDSON Sample Processing
This “instrument‑free” method releases RNA directly from saliva or nasal swabs.
Mix – Combine 50 μL of sample with 50 μL of Lysis Buffer (100 mM TCEP‑HCl + 2 mM EDTA).
Heat – Incubate at 95 °C for 5 minutes (heat block or boiling water works).
Cool – Allow the lysate to reach RT before adding it to the CRISPR mix.
Part 3: Triple‑Readout CRISPR Reaction
Assemble the master mix on ice before adding the sample.
Master Mix Assembly (100 μL per test):
Component
Final Concentration
LwaCas13a
500 nM
crRNA
500 nM
FAM‑rU₅‑BHQ1 Reporter
1 μM
Phenol Red
0.04%
SUPERase·In
1 U/μL
Buffer
5 mM Tris‑HCl (pH 8.8) + 10 mM MgCl₂
Note: Low buffer capacity is critical for the color shift.
Reaction – Add 11 μL of lysate to 100 μL of master mix inside your Armed Tube.
Incubation – Incubate at 37 °C for 15–20 minutes.
III. Interpretation of Results
Readout
Positive (+)
Negative (−)
Gravity (Flip)
Liquid falls to the cap
Liquid stays anchored at the bottom
Fluorescence
Bright green (under 470 nm light)
No visible glow
Color Change
Yellow (pH drop)
Pink/Red (no change)
IV. Featured Equipment & Reagents
Thermo Scientific Pierce TCEP‑HCl A potent, odorless reducing agent. High‑purity TCEP ensures complete viral lysis and stable RNA for attomolar detection.
Fisher Scientific SUPERase·In RNase Inhibitor Essential for maintaining CRISPR reaction activity even in “dirty” clinical samples. More stable across a wide temperature range than traditional inhibitors.