Week 6 HW: Genetic Circuits I
DNA Assembly
What are some components in the Phusion High-Fidelity PCR Master Mix and what is their purpose?
- The Phusion Hi-Fi PCR Master Mix has multiple components like the Phusion Hot Start II DNA Polymerase is the central enzyme. It is a polymerase enzyme with 3’ to 5’ exonuclease activity that corrects mismatched bases and therefore has low error rates than Taq polymerase. The ‘Hot Start’ part in the name refers to the modification done to enzyme to keep it inactive until the initial denaturation step so that the polymerase doesn’t amplify some other DNA at room temperature. The mix also contains dNTPs which is a given as the nucleotides are the building blocks used for extension. Another component is MgCl2 which is a cofactor required for polymerase activity, The magnesium ion helps in catalysis of the phosphodiester bond formation between nucleotides. Magnesium ions are also important to form active substrate from dNTPs which is recognized by polymerase. (The magnesium ions neutralize some of the charge of the triphosphate group so they can fit into the active site of the polymerase without hindrance) Other components in the mix are Reaction Buffer and Stabilizers. The buffer maintains the optimal pH and Ionic strength for enzyme activity.
What are some factors that determine primer annealing temperature during PCR?
- The annealing temperature is usually set 5 degree celsius below the melting temperature of the primer. (The melting temperature is the temperature at which half the DNA is separated and half is still attached ) The factors that dictate the melting temperature (and anneling temperature as it is set 5 degrees below Tm) are:
- primer length (longer primer = higher melting temperature)
- GC Content (high GC content = higher no. of hydrogen bonds therefore = higher melting temperature)
- salt/mg concentration (high salt = higher complex stability = higher melting temperature)
There are two methods from this class that create linear fragments of DNA: PCR, and restriction enzyme digests. Compare and contrast these two methods, both in terms of protocol as well as when one may be preferable to use over the other.
- The two methods do create DNA fragments but their uses are very different. PCR amplifies existing DNA and creates new fragments. Restriction enzymes cut existing DNA and form fragments, shredding existing into pieces, not creating new DNA.
- PCR amplifies a specific sequence via the use of primers and a polymerase whereas Restriction enzymes cut a DNA at specific sites, separating fragments from an existing DNA molecule. PCR only requires knowledge of primers to create a specific fragment, using RE requires knowledge of existing restrictions sites in the DNA.
- PCR is preferably when a sequence needs to be amplified and doesn’t exist as an isolated fragment or if you want to work with complex DNA and fragment it fro better study. RE digestion is preferrable, when the DNA contains compatible restriction sites.
- PCR can generate any fragment with primer design but RE digestion is limited by where restriction sites naturally occur.
How can you ensure that the DNA sequences that you have digested and PCR-ed will be appropriate for Gibson cloning?
- Gibson Assembly requires that the insert and vector share 15-30 base pairs of overlapping homologous sequence at their junctions. PCR fragments can be ensured to be Gibson-compliant by designing primers with 5’ overhangs that are homologous to the adjacent sequence in the vector. After the PCR, the overlaps will be built into the ends.
- As for RE-digested fragments, they are less commonly used in Gibson Assembly as restriction sites rarely leave exact overlapping sequences. But we can try and verify that the sequences left after digestion are compatible with the adjacent vector. Tools like Snapgene/Benchling can be used for In-Silico verification and confirm that the overlaps are 15-30 bp and contain no repetitive sequences.
How does the plasmid DNA enter the E. coli cells during transformation?
- The most common lab method is heat-shock transformation using chemically competent Escherichia coli cells. Cells are treated with cold Calcium Chloride. This helps plasmid DNA stick closer to the cell surface by reducing charge repulsion between the negatively charged DNA and the negatively charged cell membrane. Then the cells are briefly warmed (usually 42°C for 30–45 seconds). This sudden temperature change temporarily makes the membrane more permeable, allowing some DNA to enter the cell. After entering, the Plasmid must remain intact and begin replicating using its own origin of replication.
- Another method is Electroporation: A short high-voltage pulse creates temporary pores in the membrane, allowing DNA to enter. This is usually more efficient than heat shock, but it requires special equipment and specially prepared cells.
Describe another assembly method in detail (such as Golden Gate Assembly) in 5-7 sentences with diagrams.
 Credits to SnapGene for Diagram
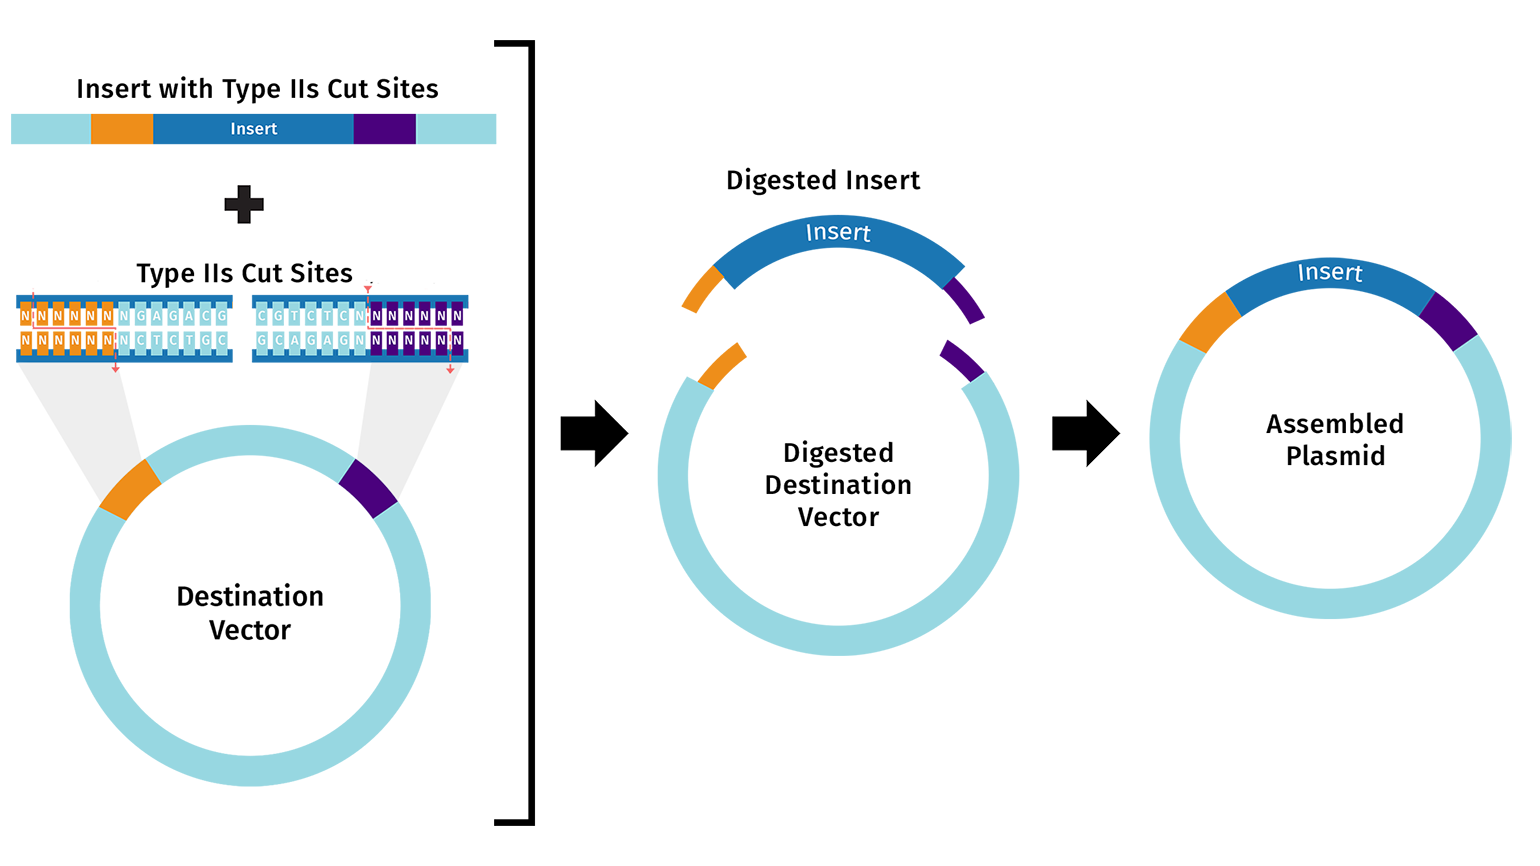
- Golden Gate Assembly is a cloning method used to join DNA fragments in a chosen order in one reaction. It uses a Type IIS restriction enzyme such as BsaI, which cuts outside its recognition site and creates custom-designed overhangs. These overhangs allow DNA fragments and the vector to fit together specifically and directionally. The reaction contains both BsaI and T4 DNA Ligase, so cutting and joining happen in the same tube during temperature cycling. Incorrect products are cut again, while correct assemblies remain intact. This makes the method efficient for assembling multiple fragments at once. Golden Gate Assembly is popular because it is fast, accurate, and leaves no unwanted extra sequence at the junctions.
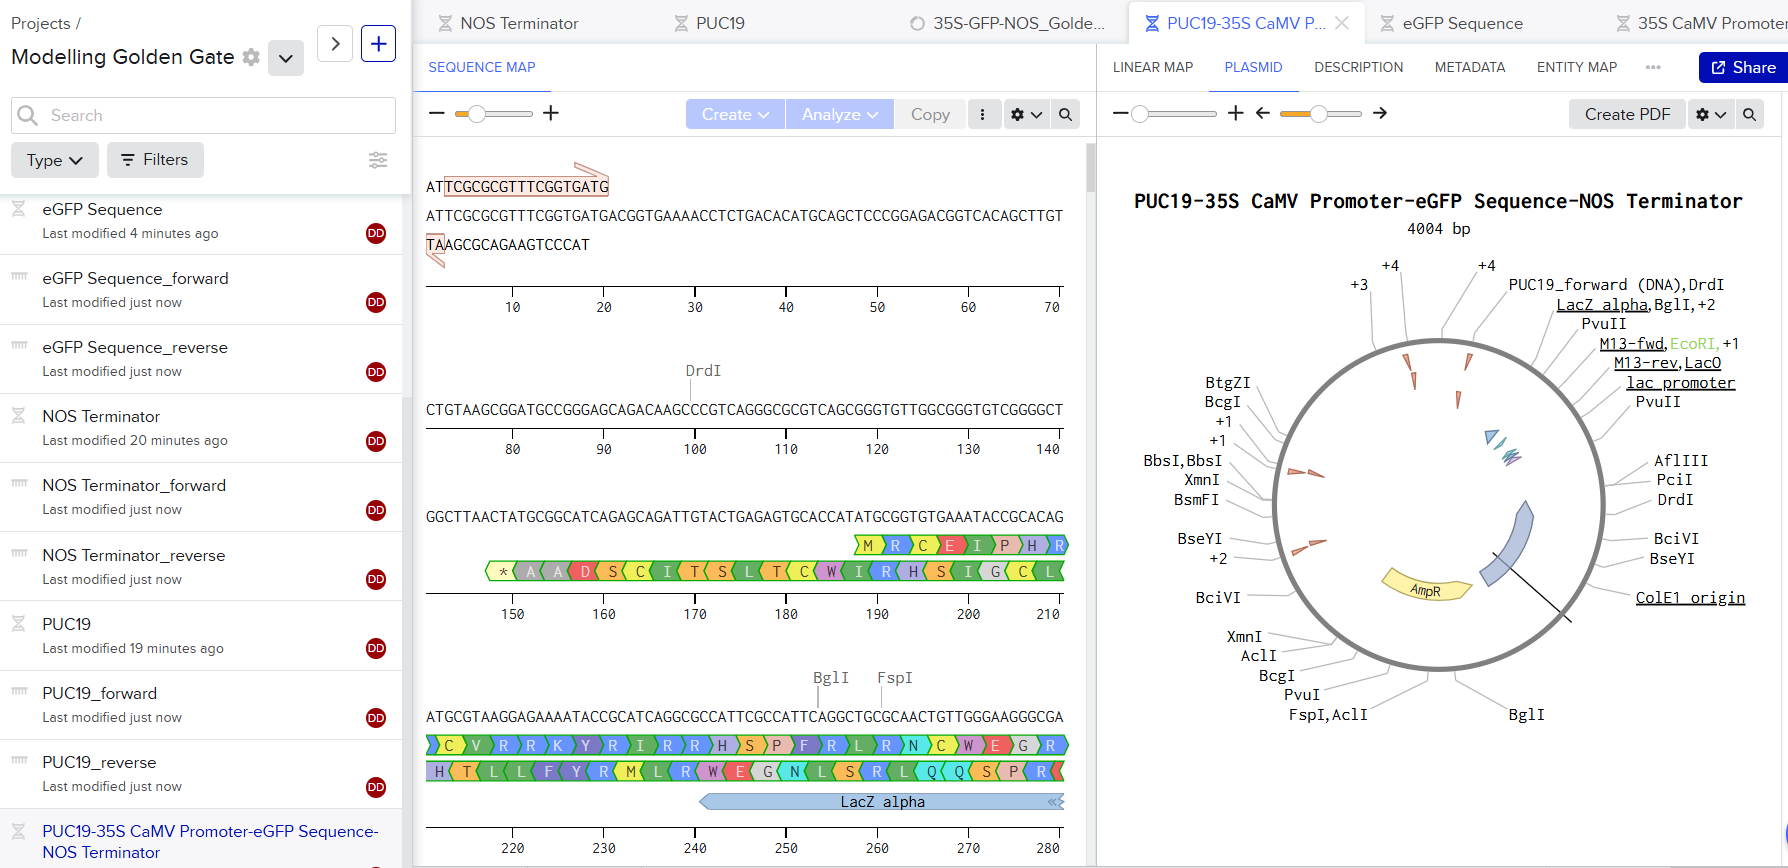
Modelling a Golden Gate Assembly in Benchling is fairly easy. I downloaded the sequences, I wanted to assemble together. I use PUC19 Plasmid as the backbone. I used Benchling’s Assembly feature and selected Golden Gate assembly. Benchling calculated the primer pairs and everything else.
Asimov Kernel
I logged in with the credentials from the BioClub Tokyo Chat then according to the homework, I created a repository for my work. (pretty simple)

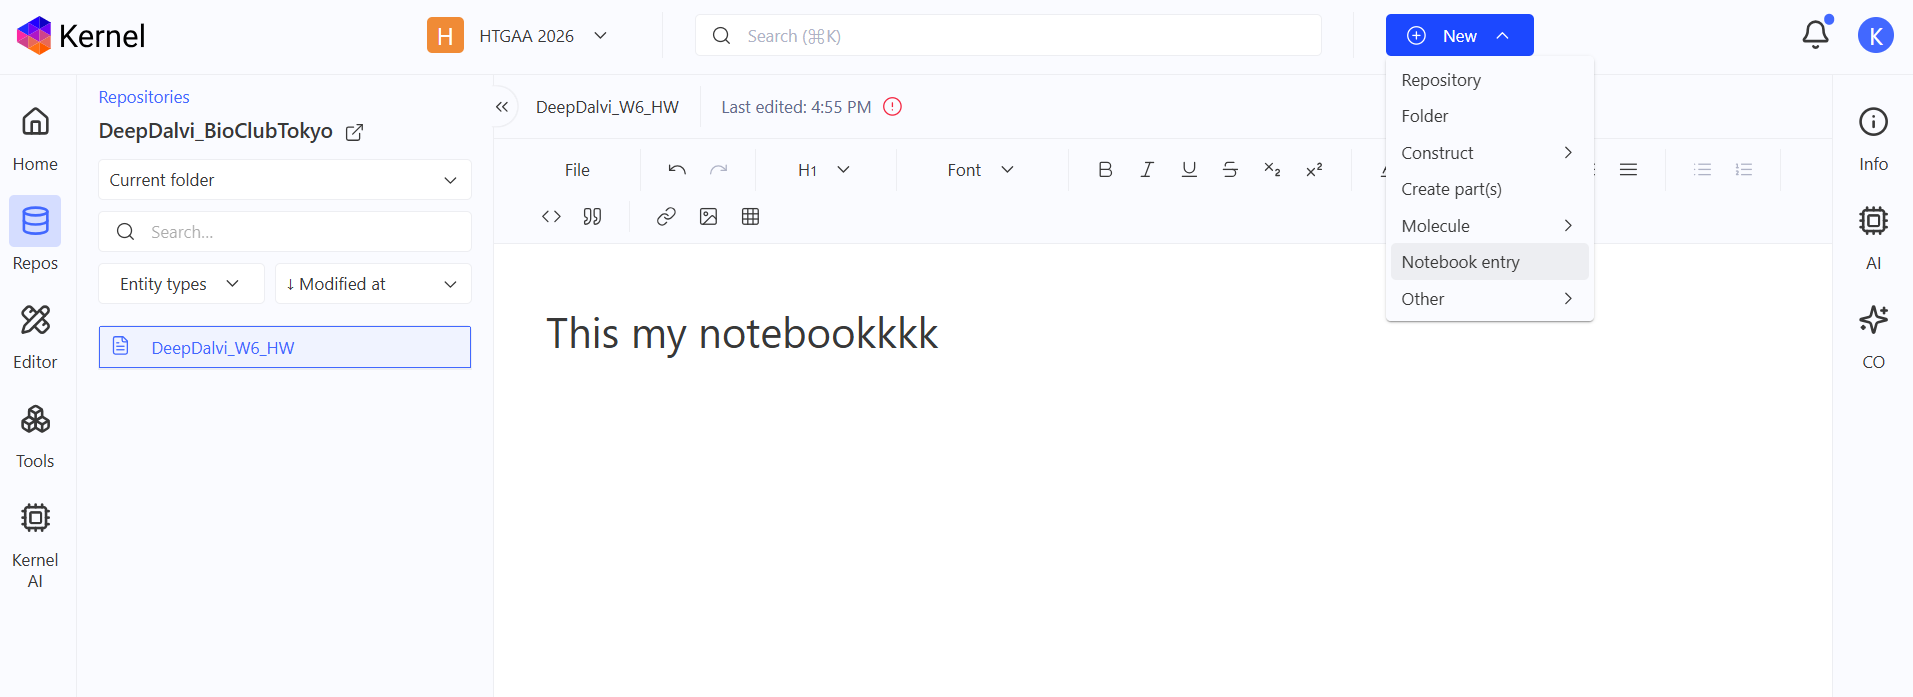
Next step was to create a blank Notebook entry to document the homework, I created it and saved it to the same repository.
Next up is some exploration! I had to explore the the devices in the Bacterial Demos Repo. I found it in all repositories. Time to explore!
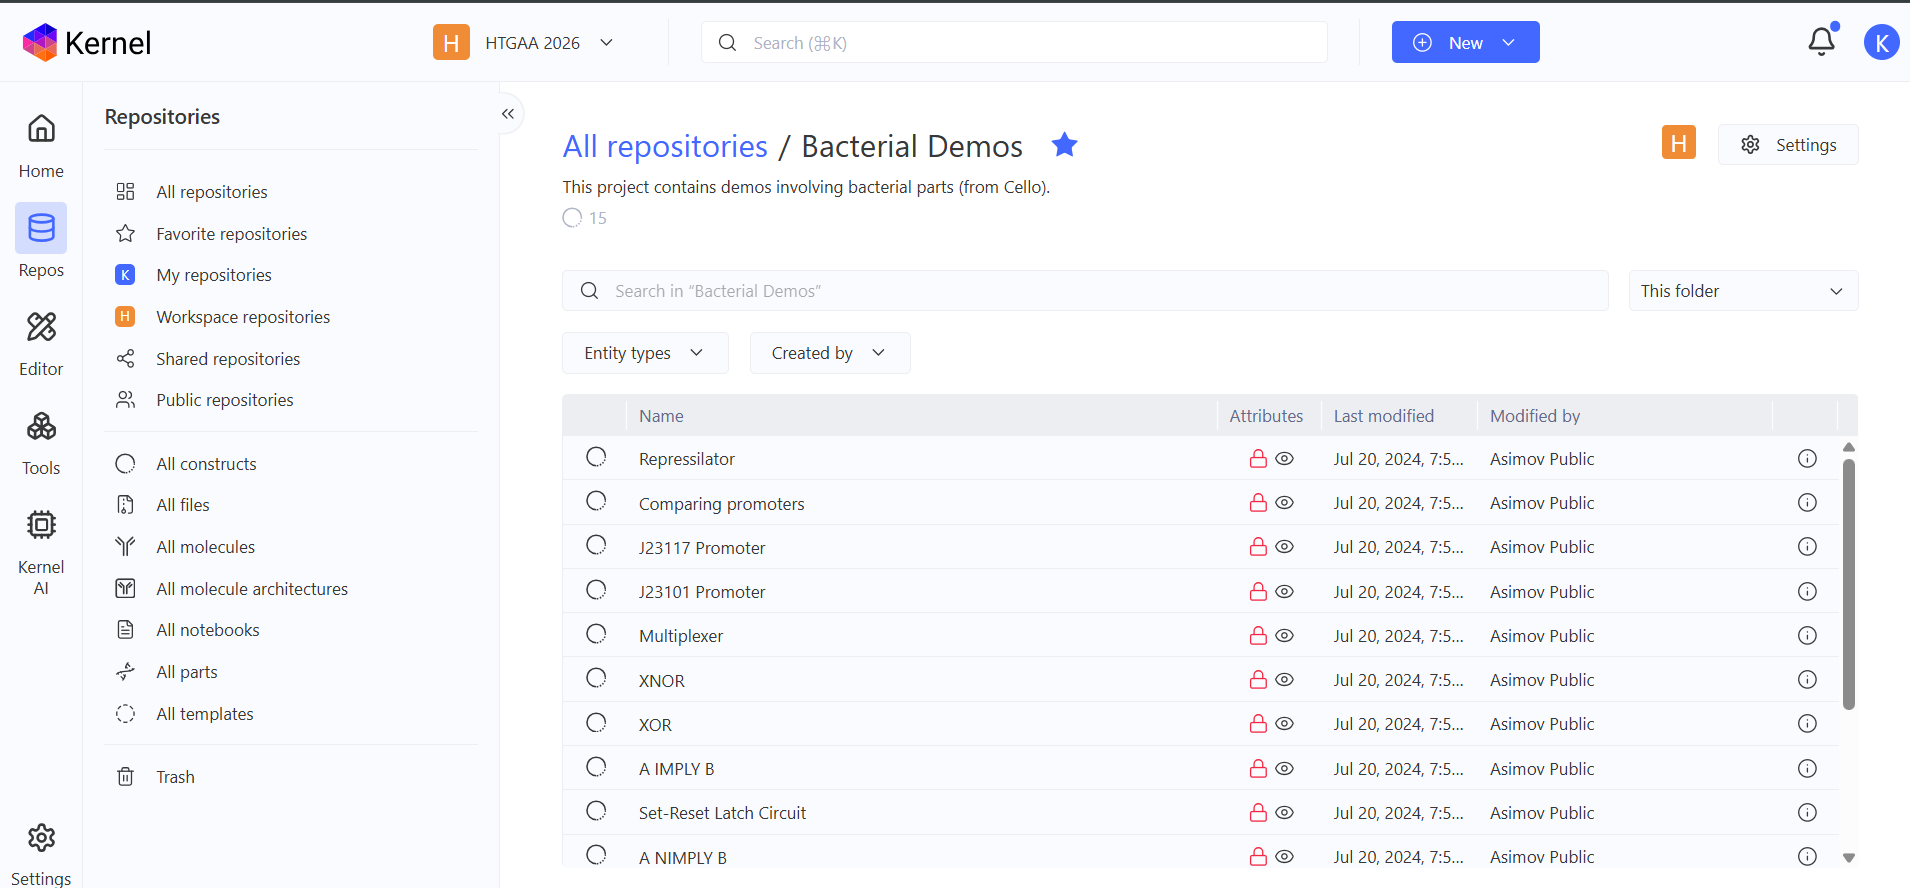
There were a lot of things to see. I had to see the ‘Repressilator’ specifically according to the homework brief.
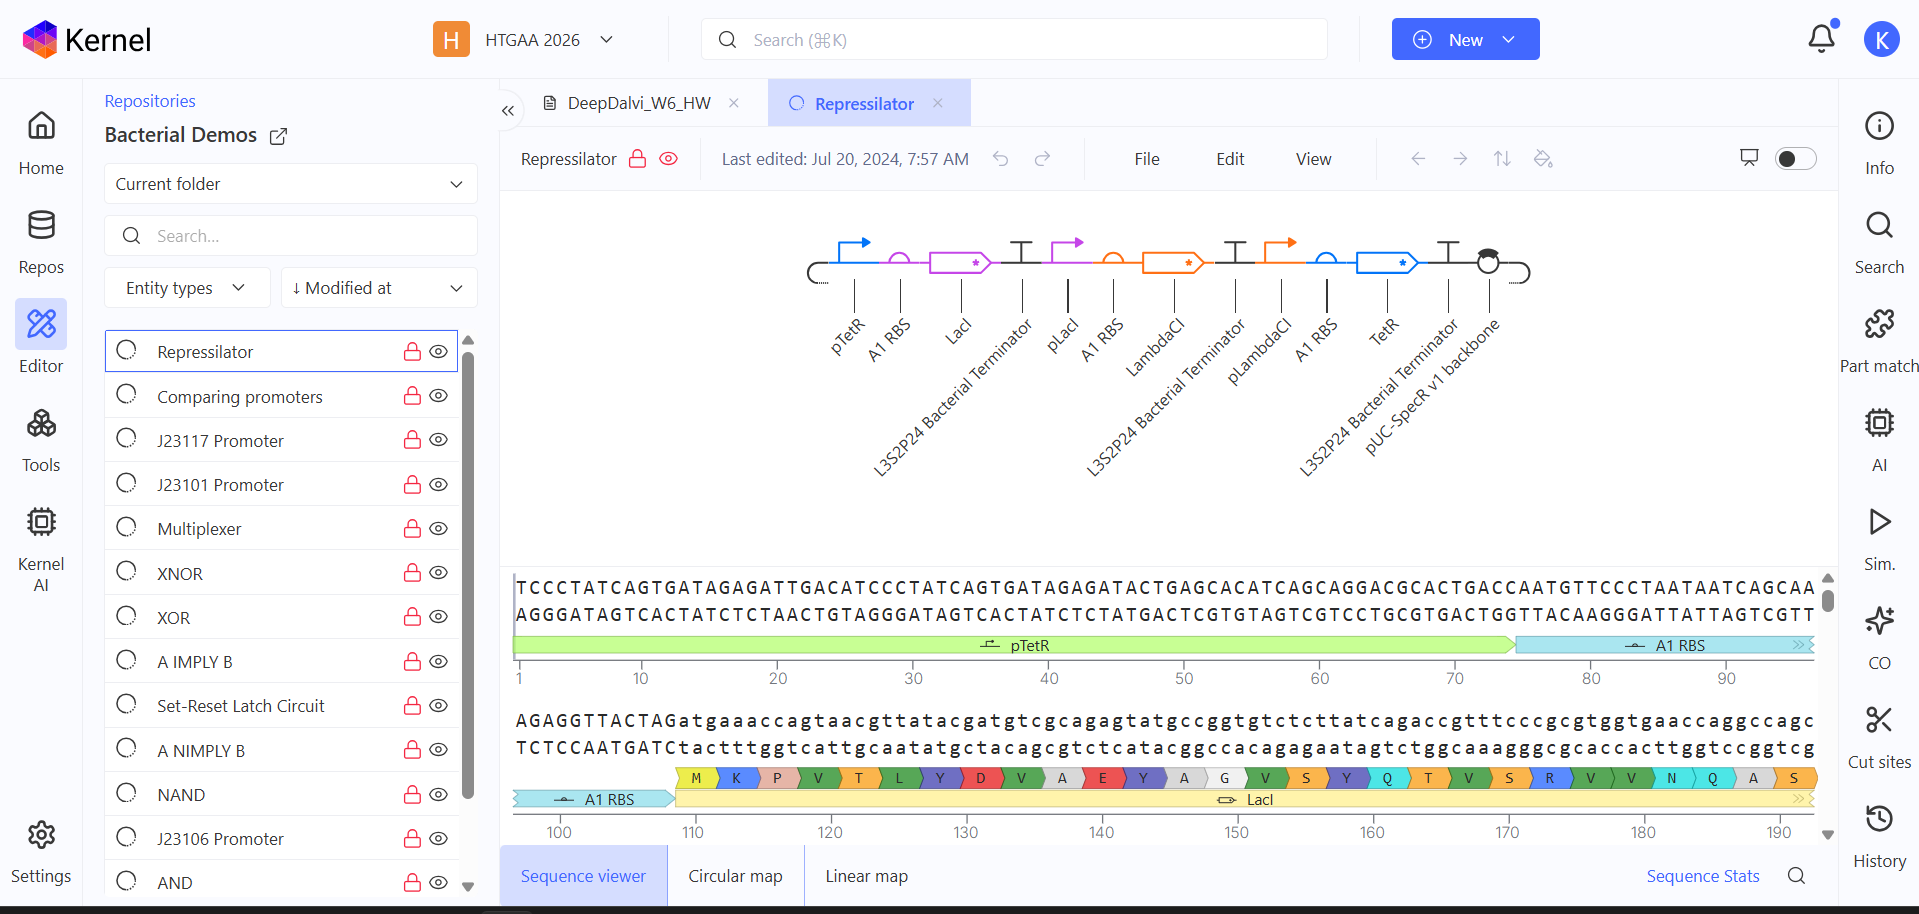
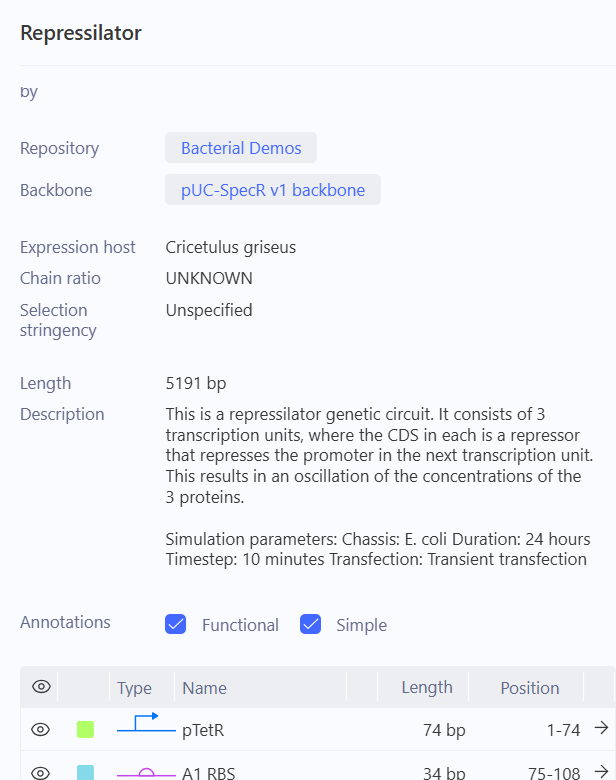
So this was the repressilator that I was supposed to recreate. I was fascinated by the sheer amount of data being thrown at me. I wanted to know what this exactly was, I found some info in the info tab. duh.
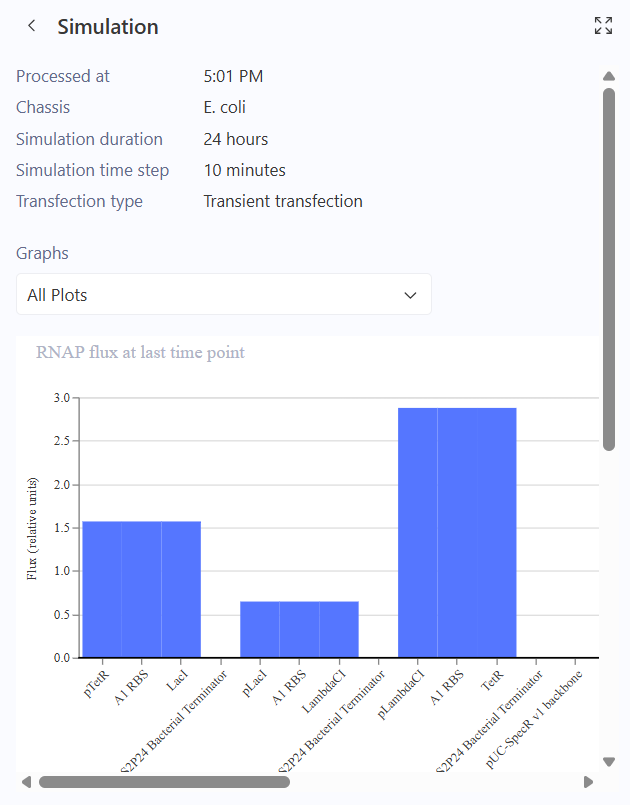
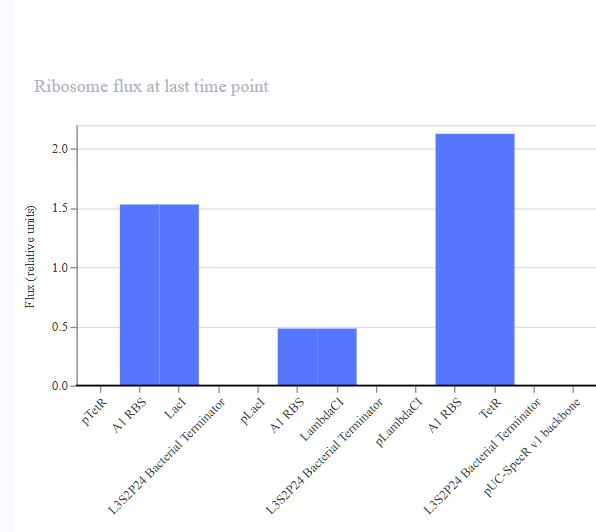
I ran the simulation and I got a bunch of graphs.
Now the next step according to the homework was recreating the Repressilator. I made a list of the parts from the time I opened the Repressilator. Then I went an recreated it.
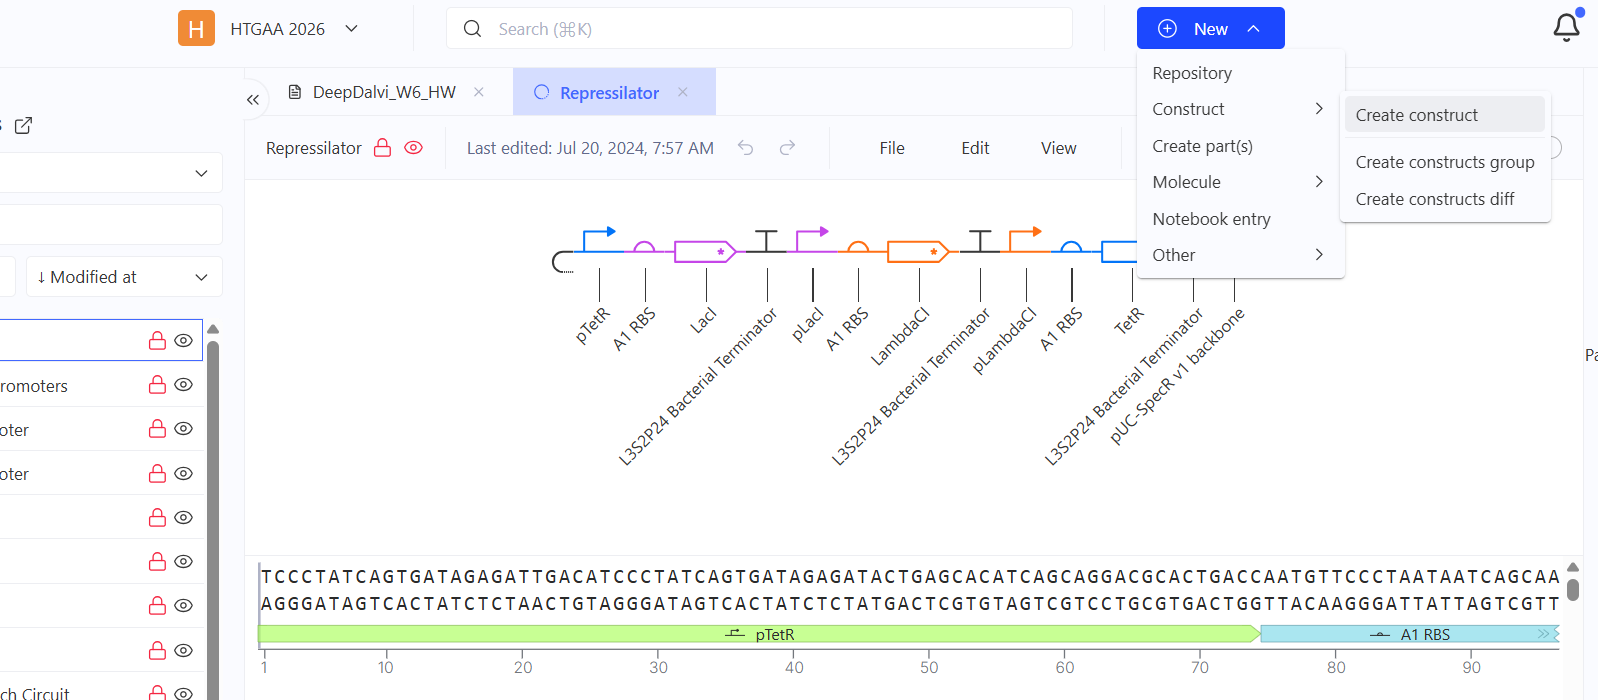 Created an empty construct
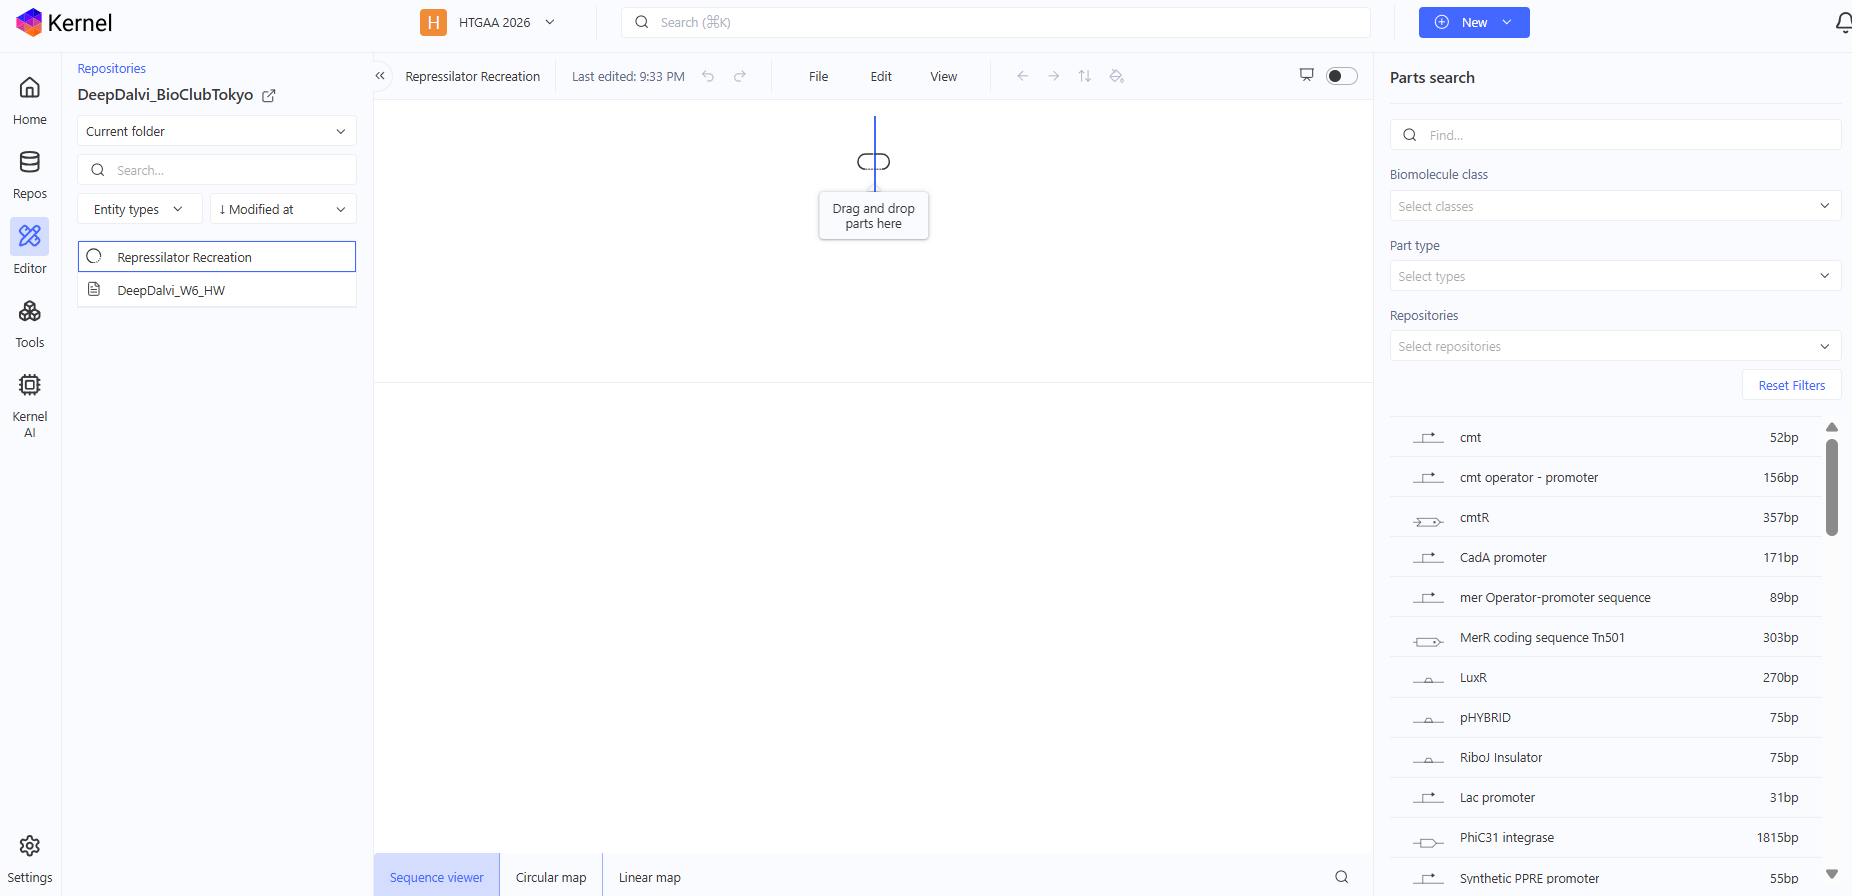 Now into the empty construct, I’ll find the parts according to the Repressilator screenshot and recreate the Repressilator.
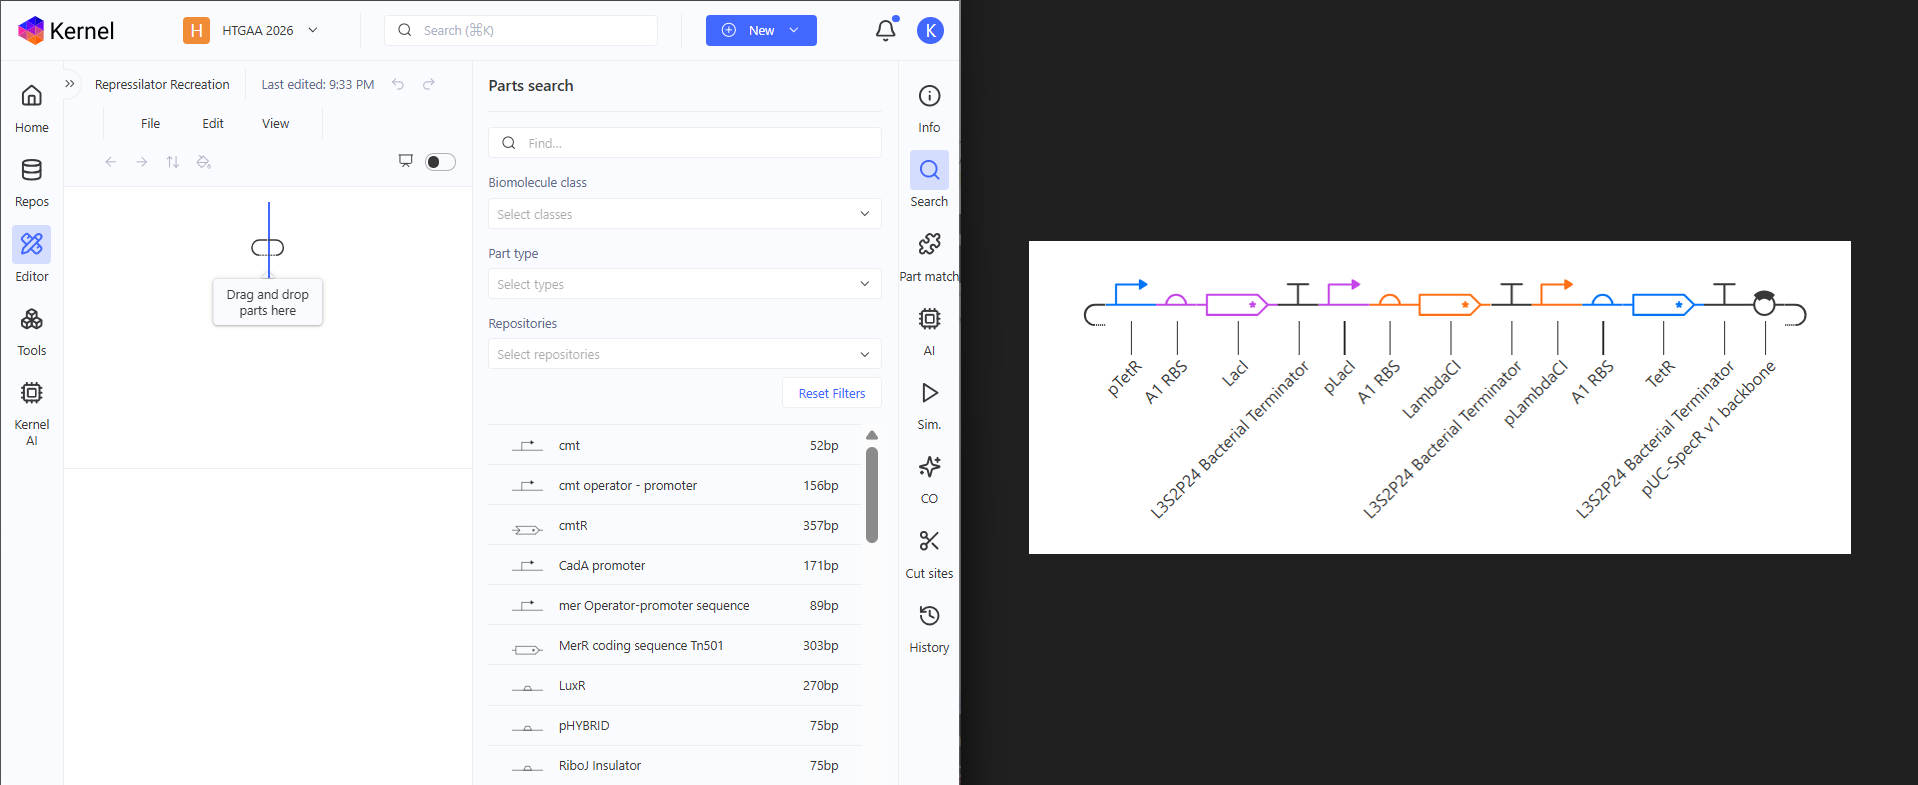
I don’t know if this is cheating, am I supposed to recreate it from memory? but yeah this is how I did it. Side by Side. Drag and Drop. I like the interface, it’s clean and intuitive. It feels like MS Word for Constructs.
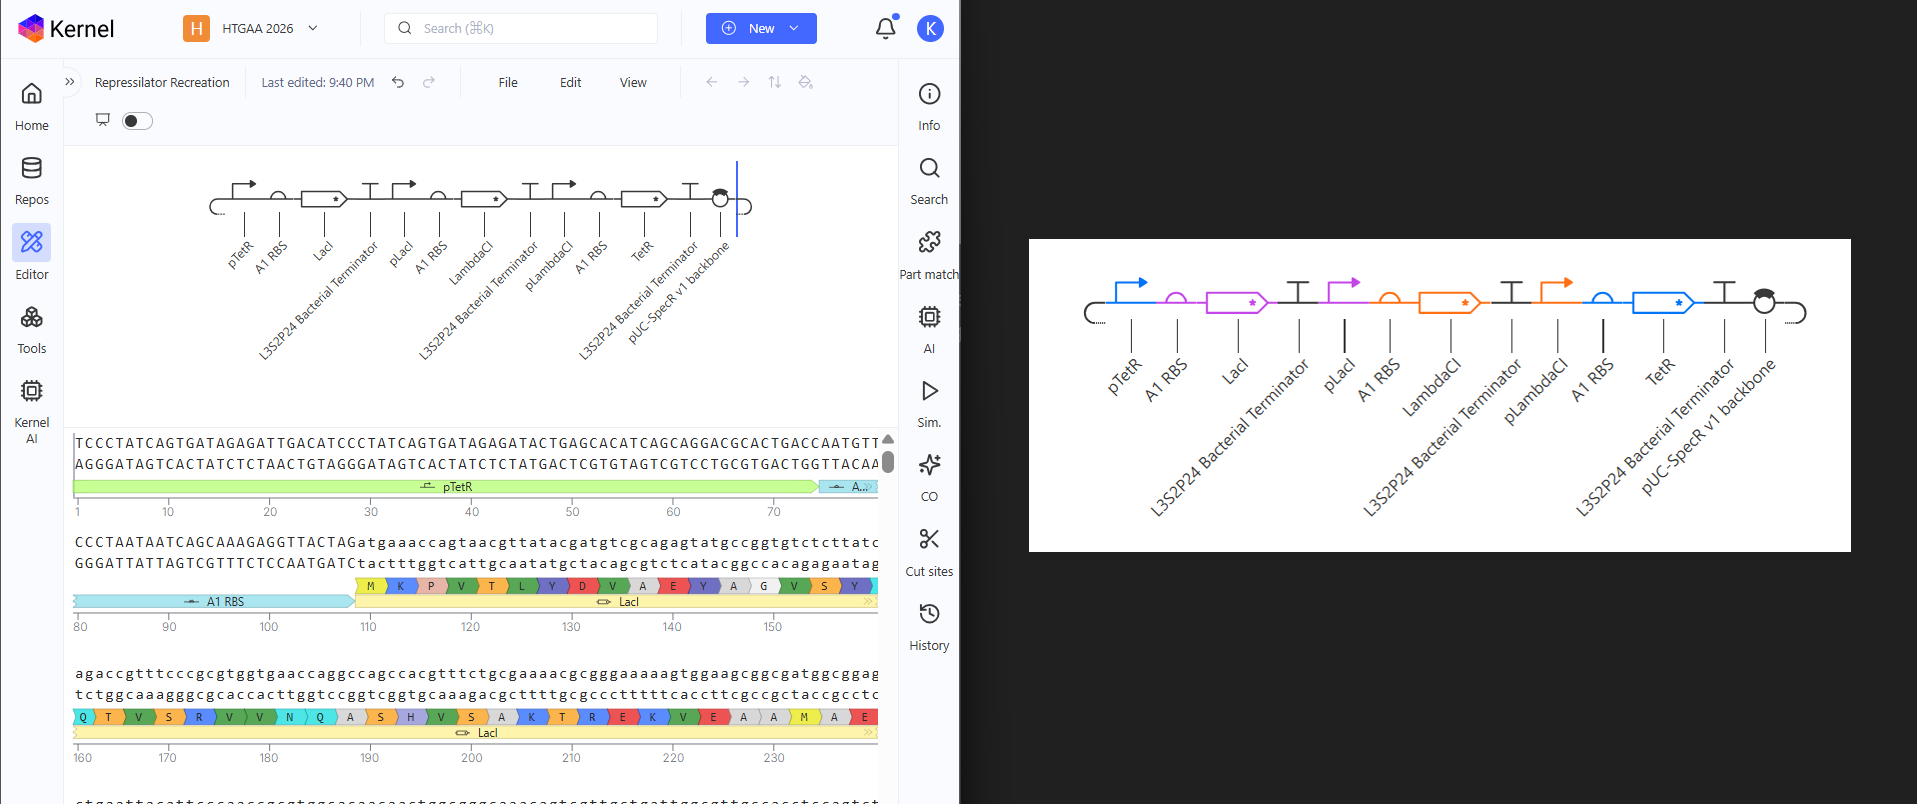
Done, matching perfect! The Repressilator has been recreated. The parts library is huge. I really don’t have metric of comparison so I could be wrong, but searching for parts made me see the various parts they have and maybe in the future, Asimov Kernel will be for Synthetic Biology like Blueprints is for Unreal Engine. Now only recreating won’t do. I have to test if it works like the original.
While I waited for the simulation to finish, (I had to choose the same parameters that I did with the original so that I can compare properly) I searched up on what Asimov Kernel was and damn, it has so many features! It really could be the drag & drop for strain / plasmid design, for synbio. It surely would help students a lot. I went on to see pricing but lol, they don’t have anything like that. I am glad I got to use this. I’m excited to see where this goes. The simulation was done and the graphs match the Original Repressilator simulation outputs. RECREATION SUCCESSFUL!
Now we create 3 of my own constructs using the parts in the characterized bacterial parts repo.
Construct 1: For the first construct, I tried to make this transcriptional NOT gate. high TerR will lead to low AmeR output.
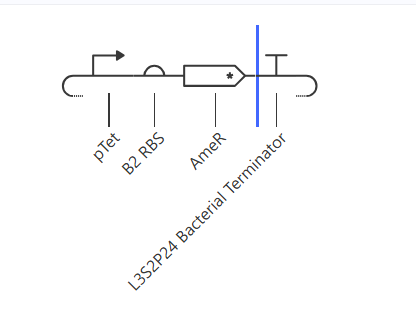
I expect that the AmeR protein level should be inversely correlated to TetR
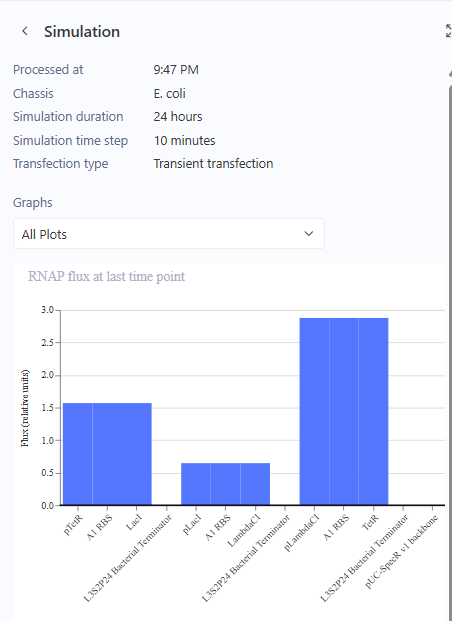
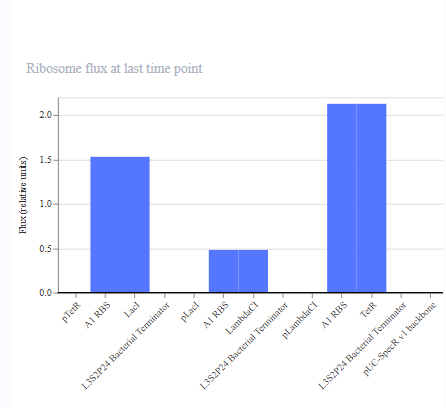
The simulation results. I added aTc at hour 0 in the first simulation, and therefore AmeR reached steady state almost immediately. In the second simulation, I added aTc at hour 24, where the difference was visible.
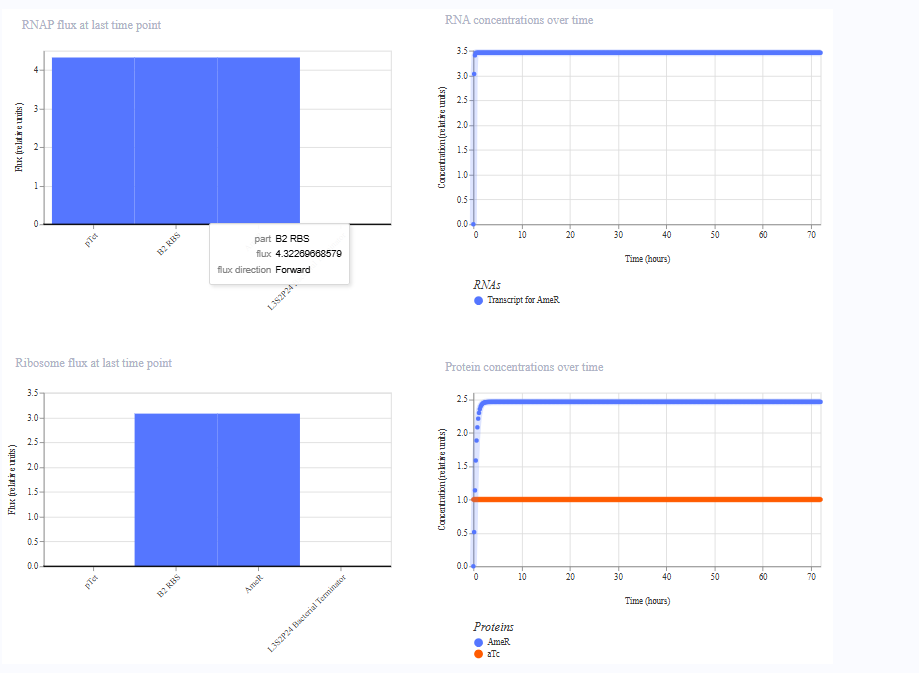 Run 1
Run 1
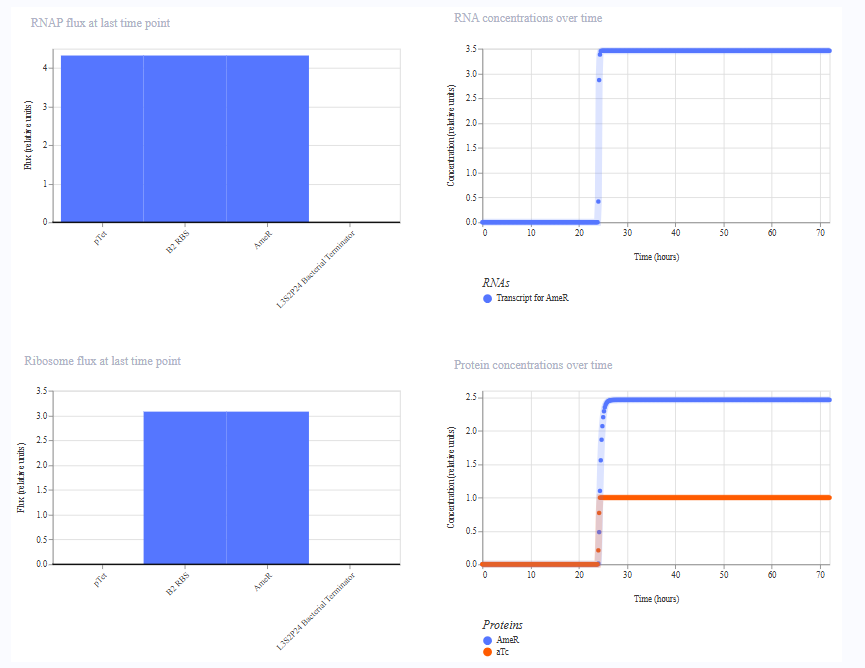 Run 2
Run 2
For the other two constructs, I just tried swapping out stuff and experimenting.
Construct 2:
For the second construct, I just replaced pTet with pBad.
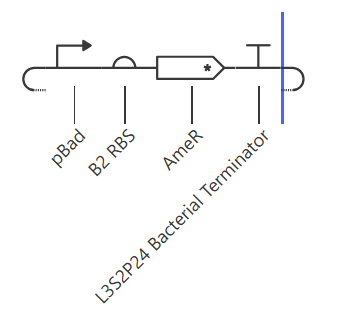
I changed the ligand in the simulation from aTc to Arabinose. I expected the same behaviour like Construct 1 but maybe the shape of curve would be different.
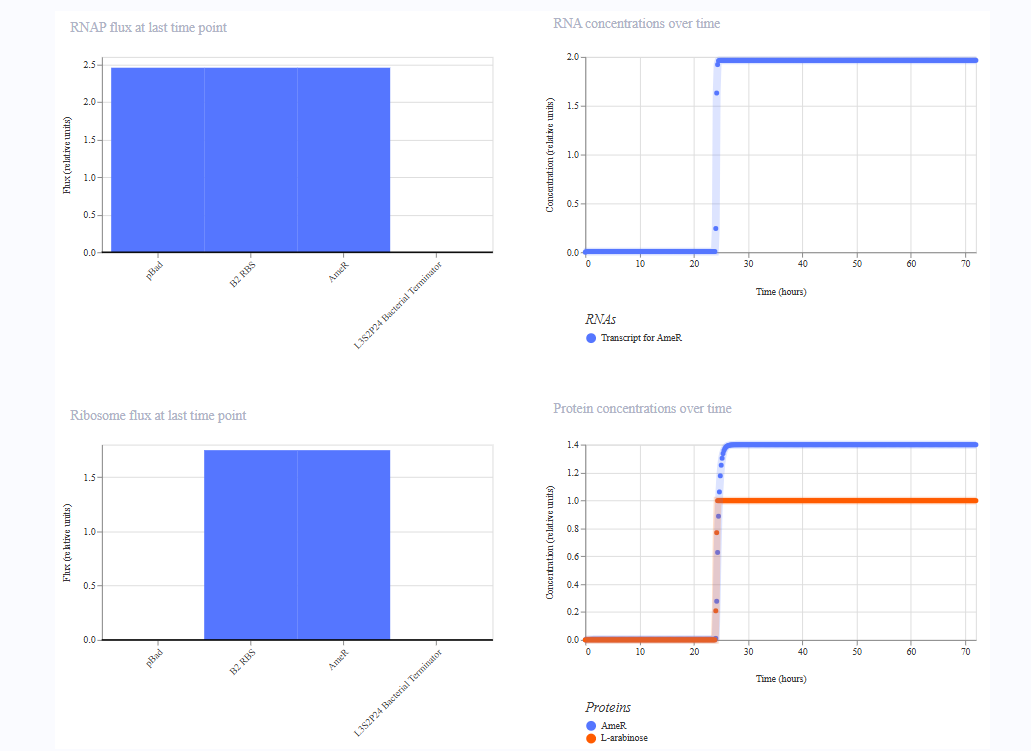
The pBad curve was indistinguishable from pTet.
Construct 3:
For the third construct, I replaced AmeR with LacI as LacI is a larger protein then AmeR, I wanted to see if that would affect anything.
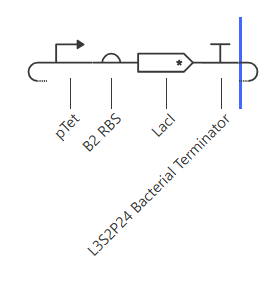
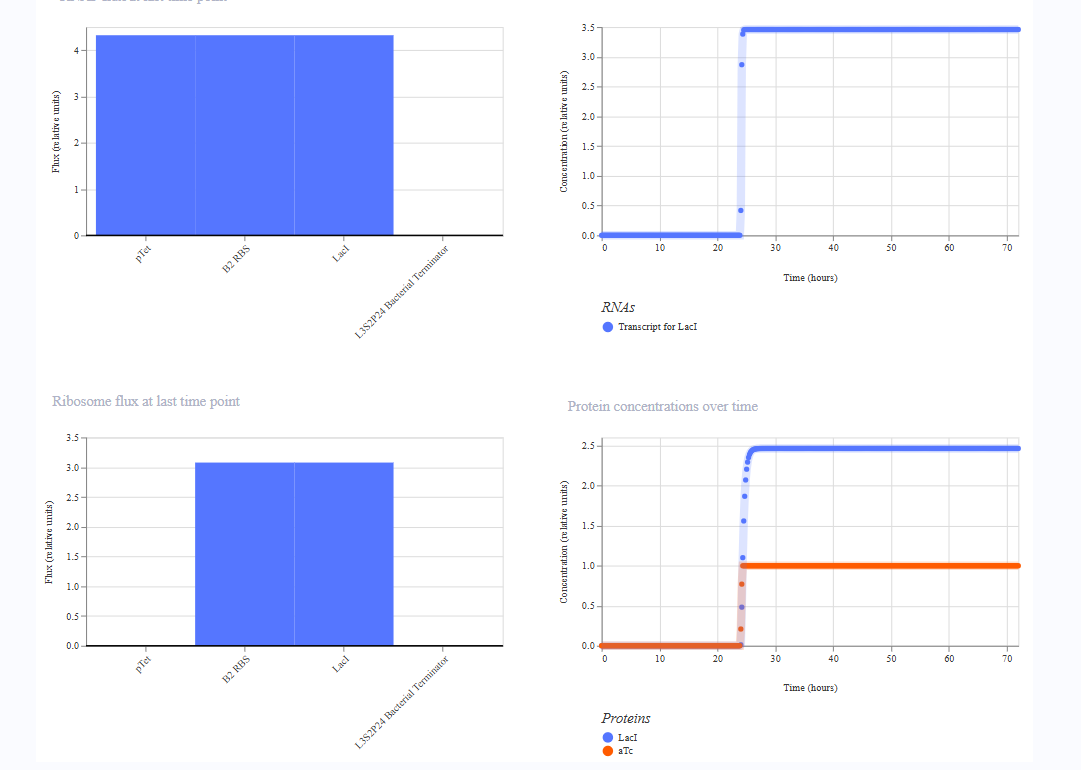
- RNA transcript plateaus at ~2.0 vs ~3.5 for AmeR which is noticeably lower
- Protein steady state looks similar but the RNAP flux bars appear slightly lower (~2.3 vs ~4.3)