I come from a biotechnology background, but I don’t operate comfortably inside a single box. I move between wet lab concepts, computational thinking, and system architecture. I write code. I think about genetic circuits. I sketch startup ideas. I design frameworks for learning and decision-making.
My interests span synthetic biology, artificial intelligence, scalable bioproduction, design thinking, programmable biological systems and other such subjects. I explore broadly, try to synthesize patterns across disciplines. At the same time, I’m equally curious about how to build organizations, tools, and companies that can translate scientific insight into real-world impact.
I love structured experimentation and playful iteration. I’m interested not just in understanding biology, but in creating leverage: technical, intellectual, and eventually financial.
A1. I want develop a living biological tool that works like a chromatography instrument. I have been thinking since a long time that what if we could use 3D bioprinting to create a living tissue (I like to call it an ‘organstrument’) that can selectively bind and separate ions/molecules. I propose it could work similar to a ion-exchange / affinity chromatography columns but instead of using mechanical parts, it would be bio-engineered. It would be made of cells and biomaterials that do the separation biologically.
What will I measure?
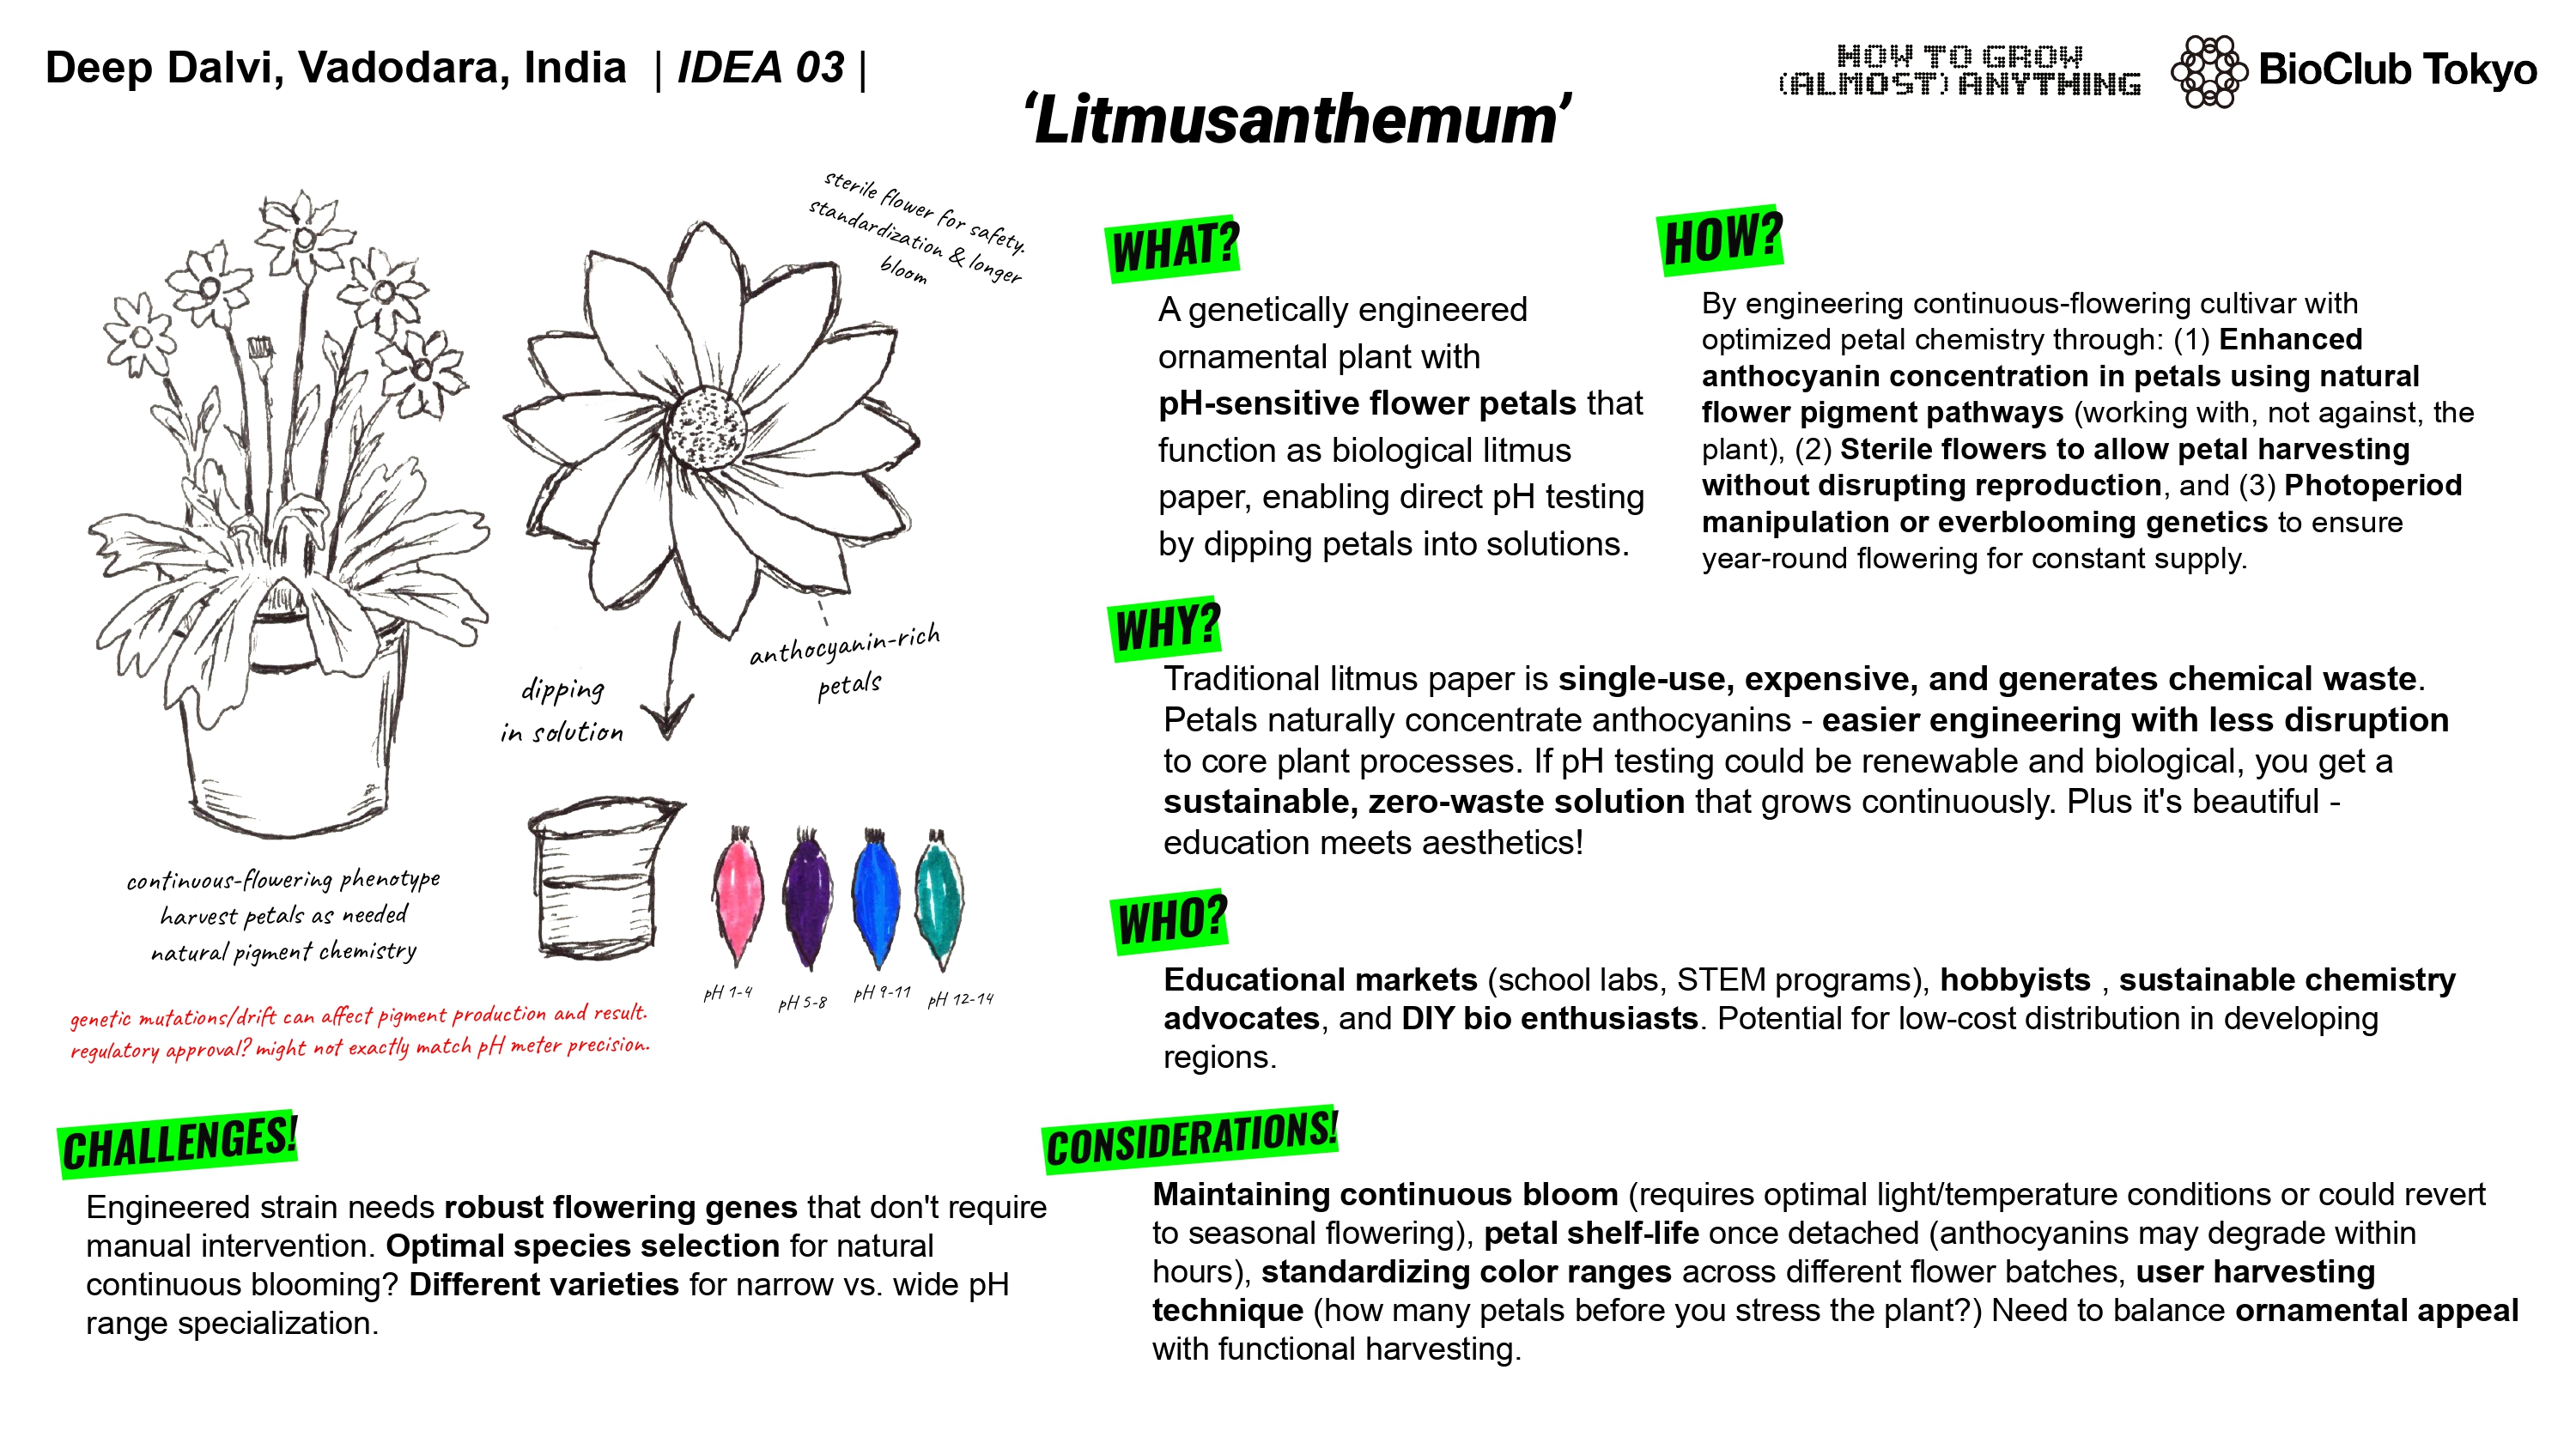
My final project involves modifying an existing flowering plant species to enhance anthocyanin pigment production. So that’s metric number one. How much production is occurring. Now the reason we’re tweaking anthocyanin production is to turn the petals of the plant into reliable pH indicators. I would also need to measure the change in color, the rate of deterioration of pigment after plucking the petal. The correlation between temperature and pigment concentration and also the overall pigment concentration in petals, if it can be even roughly standardized (all petals might not have exact amount for it to function as intended. so we tweak and see if at least all petals have similar concentration and if not then what is the limiting factor (specific env. conditions?))
Part A: The 1,536 Pixel Artwork Canvas | Collective Artwork I was unable to contribute a pixel due to access constraints with the submission window. The activity was fun overall, it was interesting to see how everyone was trying to make something definitive, only to be overrun by somebody else. Seeing a timelapse of it all in the Review meeting was intriguing. If I had gotten a chance to contribute, I definitely would have just tried to support an existing effort at making something, some people tried to disrupt the existing artworks but it was futile for the most part. Next year maybe if each node had a part of the canvas, then there would be fun things created as the nodes can then plan on what is to be made.
Week 2 : Pre-HW Professor Jacobson: A1. DNA polymerase with proofreading has an error rate of about 1 error per 10⁶ bases (10⁻⁶). This is due to its proofreading and exonuclease activity. The human genome is about 3.2 billion base pairs. At a raw error rate of 10⁻⁶, replication would introduce thousands of errors per genome copy, which is unacceptable. Biology deals with this via multiple layers of correction, DNA Polymerase proofreading, post replication mismatch repair and other such systems.
Assignment : Python Script for Opentrons Artwork I had to write a Python script for a art design. I chose to create a silhouette of the Indian subcontinent, with my city being highlighted. I did that using the Opentrons Artwork website. I thought I will make a pattern of sorts with code but I realized that would time consuming and not very symbolic as such. I got a clipart of India from google and cropped it and then used that too generate my artwork. It didn’t look very good, I had to fiddle around with the contrast, brightness and other values to make it work. It still wasn’t looking how I’d expected it too. I decided to redo it.
Part A : Conceptual Questions 1. How many molecules of amino acids do you take with a piece of 500 grams of meat? (on average an amino acid is ~100 Daltons) Amino Acids are protein building blocks, so whatever percent of protein the meat contains is technically the AA content. A quick google search tells me that most cooked meats contain 20%-30% protein by weight. I’ll take 25% as my number. Now, 25% of 500g is 125g. (500/4)
Part A: SOD1 Binder Peptide Design Part 1:
The first step was retrieving human SOD1 sequence from Uniprot and introducing the A4V mutation. Here’s the SOD1 sequence:
MATKAVCVLKGDGPVQGIINFEQKESNGPVKVWGSIKGLTEGLHGFHVHEFGDNTAGCTSAGPHFNPLSRKHGGPKDEERHVGDLGNVTADKDGVADVSIEDSVISLSGDHCIIGRTLVVHEKADDLGKGGNEESTKTGNAGSRLACGVIGIAQ Here’s the mutated SOD1 Sequence:
MATKVVCVLKGDGPVQGIINFEQKESNGPVKVWGSIKGLTEGLHGFHVHEFGDNTAGCTSAGPHFNPLSRKHGGPKDEERHVGDLGNVTADKDGVADVSIEDSVISLSGDHCIIGRTLVVHEKADDLGKGGNEESTKTGNAGSRLACGVIGIAQ I used the PepMLM Colab to generate the 4 peptides of length 12 as specified in the homework. I selected the length to be 12 and I chose 4 binders as I had to generate 4 peptides. This was the result.
DNA Assembly What are some components in the Phusion High-Fidelity PCR Master Mix and what is their purpose?
The Phusion Hi-Fi PCR Master Mix has multiple components like the Phusion Hot Start II DNA Polymerase is the central enzyme. It is a polymerase enzyme with 3’ to 5’ exonuclease activity that corrects mismatched bases and therefore has low error rates than Taq polymerase. The ‘Hot Start’ part in the name refers to the modification done to enzyme to keep it inactive until the initial denaturation step so that the polymerase doesn’t amplify some other DNA at room temperature. The mix also contains dNTPs which is a given as the nucleotides are the building blocks used for extension. Another component is MgCl2 which is a cofactor required for polymerase activity, The magnesium ion helps in catalysis of the phosphodiester bond formation between nucleotides. Magnesium ions are also important to form active substrate from dNTPs which is recognized by polymerase. (The magnesium ions neutralize some of the charge of the triphosphate group so they can fit into the active site of the polymerase without hindrance) Other components in the mix are Reaction Buffer and Stabilizers. The buffer maintains the optimal pH and Ionic strength for enzyme activity. What are some factors that determine primer annealing temperature during PCR?
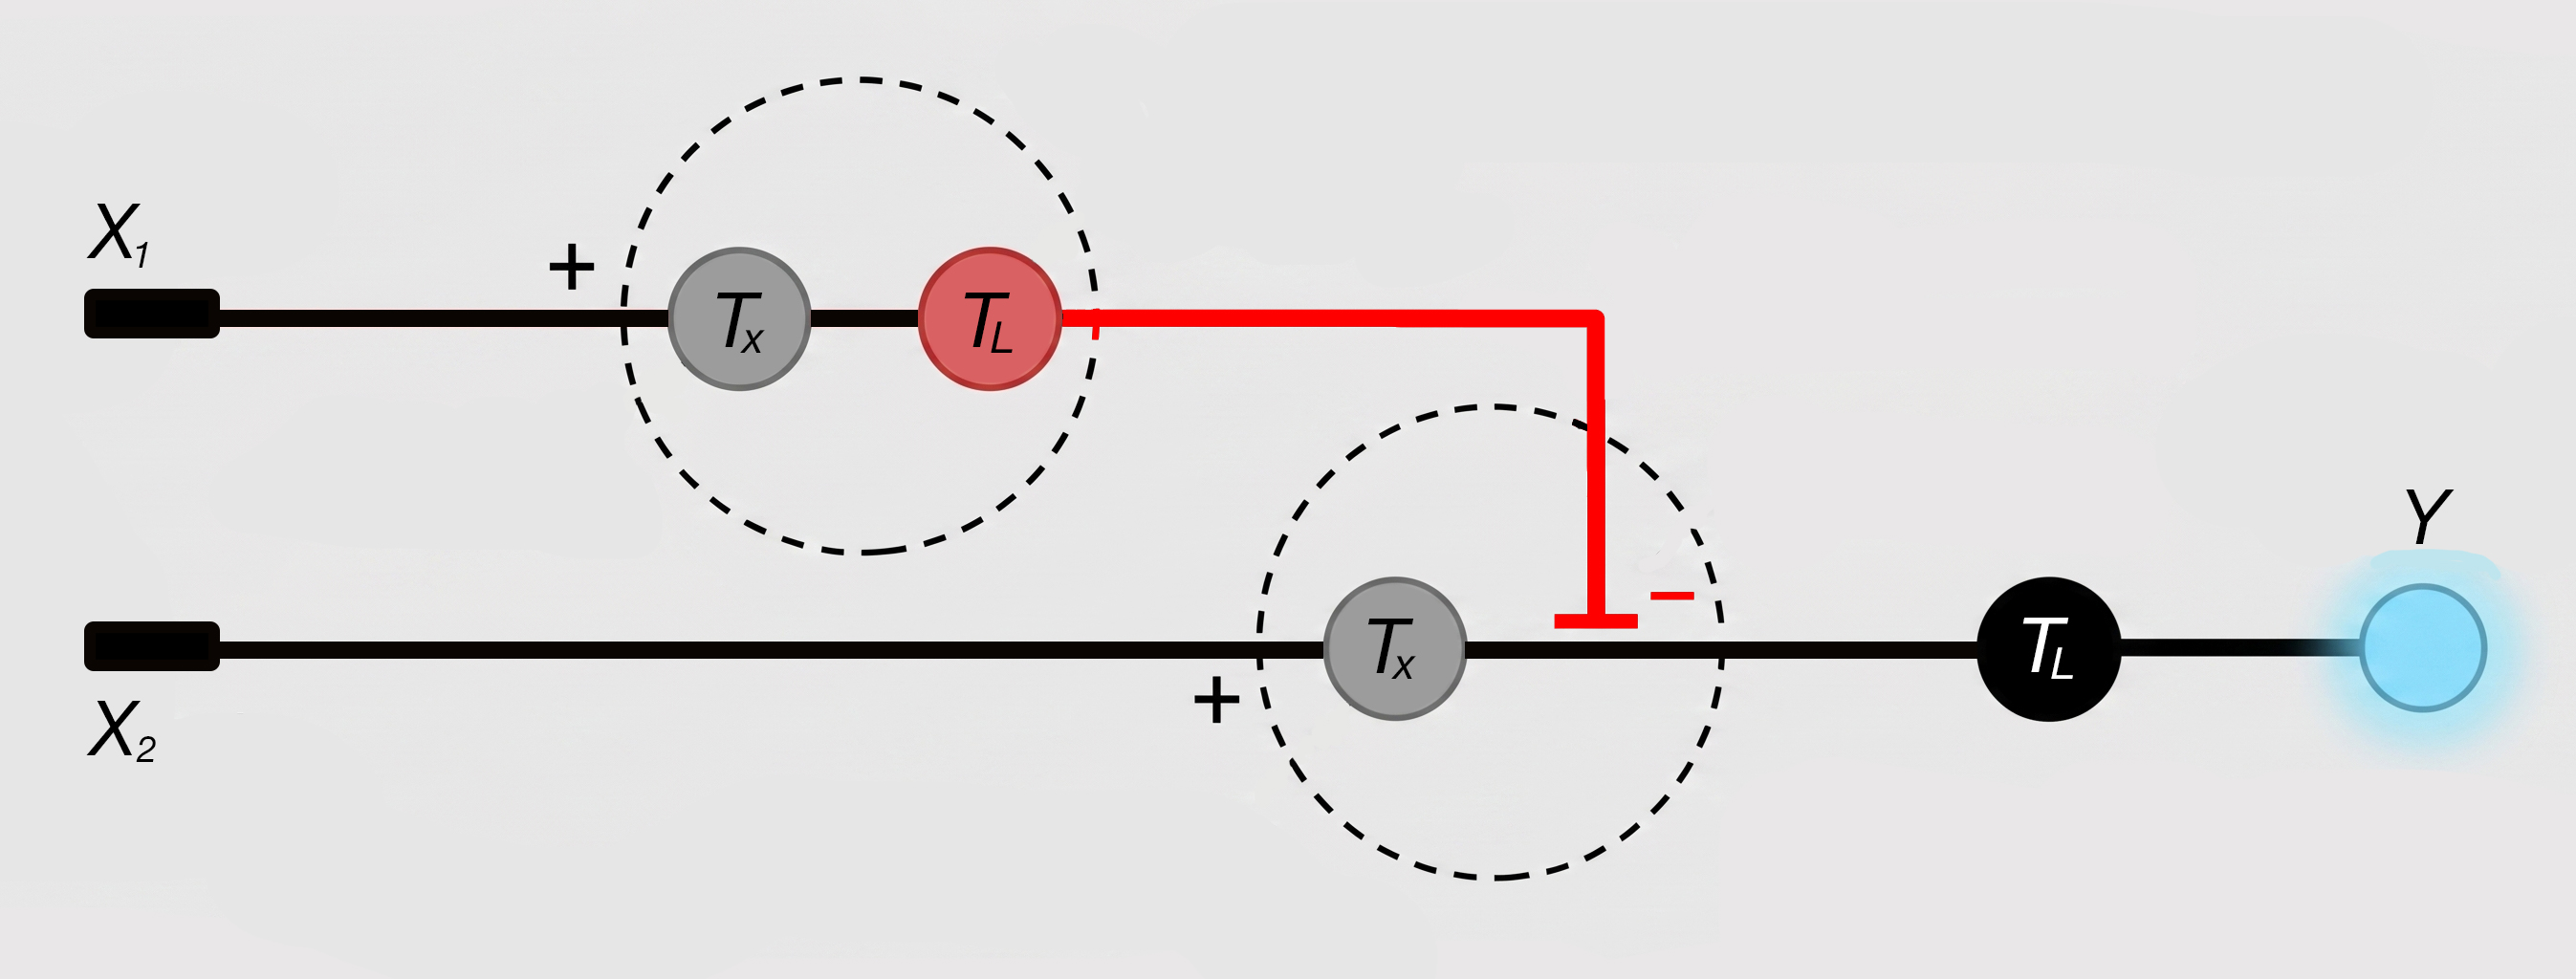
What advantages do IANNs have over traditional genetic circuits, whose input/output behaviors are Boolean functions?
Traditional genetic circuits are boolean, like the question says. Therefore, they can be either ‘on’ or ‘off’ and only can compute boolean functions. Limiting the cell’s computational ability. IANNs are different in the way that they produce continuos signals, they can take in multiple inputs. I think the benefits of IANNs over conventional genetic circuits are synonymous to the benefits of a neural network over a hard-coded solution. IANNs can react to novel inputs whereas the conv. genetic circuits can only respond to the input they were designed for. Describe a useful application for an IANN; include a detailed description of input/output behavior, as well as any limitations an IANN might face to achieve your goal.
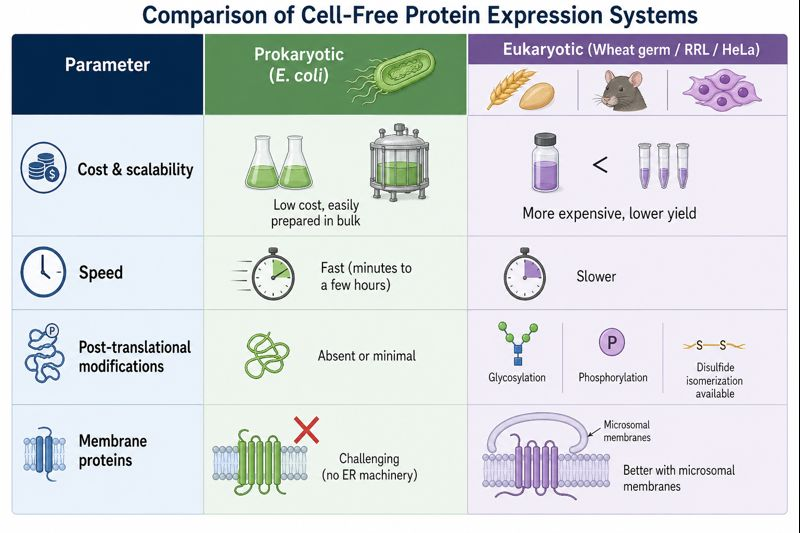
Homework Part A: General and Lecturer-Specific Questions General homework questions Explain the main advantages of cell-free protein synthesis over traditional in vivo methods, specifically in terms of flexibility and control over experimental variables. Name at least two cases where cell-free expression is more beneficial than cell production.
Subsections of Homework
Week 1 HW: Principles and Practices
A1. I want develop a living biological tool that works like a chromatography instrument. I have been thinking since a long time that what if we could use 3D bioprinting to create a living tissue (I like to call it an ‘organstrument’) that can selectively bind and separate ions/molecules. I propose it could work similar to a ion-exchange / affinity chromatography columns but instead of using mechanical parts, it would be bio-engineered. It would be made of cells and biomaterials that do the separation biologically.
The idea came to me while attending an industrial training program wherein we were being taught chromatography and other such techniques, the program also had a guest lecture on 3D bioprinting. While being taught HPLC, I asked if I could do it hands-on and try things out. The lecturer refused as if anything went awry, it would cost the university a lot of money as the column could get damaged. I thought that if the current instruments are so expensive and rigid, how about entirely replacing them entirely and biologically. The bio-nature might allows for self-adaptation and regeneration. Perhaps this could open way for bio-disposable columns (one and done kind of way). One thing that also sort of fascinates me is the ethics behind idea of using a living system as a tool.
A2. Overall goal should be that these ‘organstruments’ are developed and used safely without causing any kind of harm. The goal can be divided into 2 further subgoals.
a. Prevent harm - if the tool is highly efficient, it has to be made sure that it is not used for concentrating toxic compounds. The access will have to monitored or the tool will have to be tested for alternate use cases.
b. Ensure safety and environmental protection - reduce risks of contamination and make sure these tissues cannot evolve outside controlled settings.
A3. Governance Actions
Safe by Design - Biosafety is a major factor to consider if these tools are going to be used. Biosafety as of now depends on lab training and rules, we would have to make the tools safe by design. Incorporating specific nutrient dependence to function or using non replicating cells would make it so. The assumptions here are that these safety mechanism work properly and reliably and that the standards of use are being followed honestly. Risks - safety mechanisms fail over time. complexity of design.
Class based tools division - Dividing the organstruments into different categories based on their risk would make it easy to ensure/reduce malicious use of the tools. low risk tools would be open to use, high risks would have restricted access and so on. The assumption is that risks can be clearly defined. Reliance on too much documentations, approvals for restricted access could slow down research.
Transparency and shared registry - Researchers would voluntarily register organstrument designs, uses and safety features. if we provide incentives to them for doing so, the sharing of information would help in making the tools better and safer. The risks here would be that the shared information could be misused, the friction of registration could lead researchers to not register, therefore the registration process would have to be made smoother.
Does the option:
Option 1
Option 2
Option 3
Enhance Biosecurity
• By preventing incidents
1
2
3
• By helping respond
2
1
2
Foster Lab Safety
• By preventing incident
1
2
2
• By helping respond
2
2
1
Protect the environment
• By preventing incidents
1
2
2
• By helping respond
2
2
1
Other considerations
• Minimizing costs and burdens to stakeholders
2
3
1
• Feasibility?
1
2
1
• Not impede research
2
3
1
• Promote constructive applications
2
2
1
Week 10 HW: Imaging and Measurement
What will I measure?
My final project involves modifying an existing flowering plant species to enhance anthocyanin pigment production. So that’s metric number one. How much production is occurring. Now the reason we’re tweaking anthocyanin production is to turn the petals of the plant into reliable pH indicators. I would also need to measure the change in color, the rate of deterioration of pigment after plucking the petal. The correlation between temperature and pigment concentration and also the overall pigment concentration in petals, if it can be even roughly standardized (all petals might not have exact amount for it to function as intended. so we tweak and see if at least all petals have similar concentration and if not then what is the limiting factor (specific env. conditions?))
What would I like to measure and how ?
I am not really about the entire list of elements but I have an idea. I would like to measure:
total anthocyanin pigment concentrations in petals (HPLC-MS to identify the kinds of anthocyanins being produced) (to know if enough pigment is being produced to even have a color change)
petals color response to pH, variablity between two petals/two plants (no idea, some type of colorimetry i guess. Taking known pH solutions to test) (to check if the plant even works reliably)
pH response accuracy compared to high accuracy pH meters/litmus paper (create some sort of calibration curve and compare to pH meters) (to see how the petals compare to standard methods)
some measure of the gene expression. (using RNA-seq? )(to check the expression level of the inserted/modified genes)
metabolic activity / metabolomics (LC-MS to separate and identify metabolites) to optimize the anthocyanin synthesis pathway)
What technologies would I use?
Mostly chromatographic techniques to separate and study the pigments, to study the metabolic activity. Techniques like RNA-seq will help me study the genes behind the metabolic pathways and look for ways to optimize/upregulate.
Side Note
While trying to figure out how to make this work, I came across a species of flowers ‘Clitoria ternatum’ also known as Butterfly Pea. The flower already shows a wide range of color change to changes in pH and that too across a large range. As the flower contains ternatins, one of the most stable anthocyanins, they show a color change across the 4-12 pH range which makes them pretty usable. I think they can be picked as the candidate species as only an upregulation of existing pathways and optimization and sterility induction could make the final project possible.
The flower already shows a wide range of color change to changes in pH and that too across a large range. As the flower contains ternatins, one of the most stable anthocyanins, they show a color change across the 4-12 pH range which makes them pretty usable. I think they can be picked as the candidate species as only an upregulation of existing pathways and optimization and sterility induction could make the final project possible.
I also found out that ternatins kill cancer cells and also inhibit fat accumulation, which led me to think maybe a tea from butterfly pea would help me with the easy fat that my body is genetically inclined to store and turns out Butterfly pea tea is a REAL THING!
Homework: Waters Part I — Molecular Weight
Q1
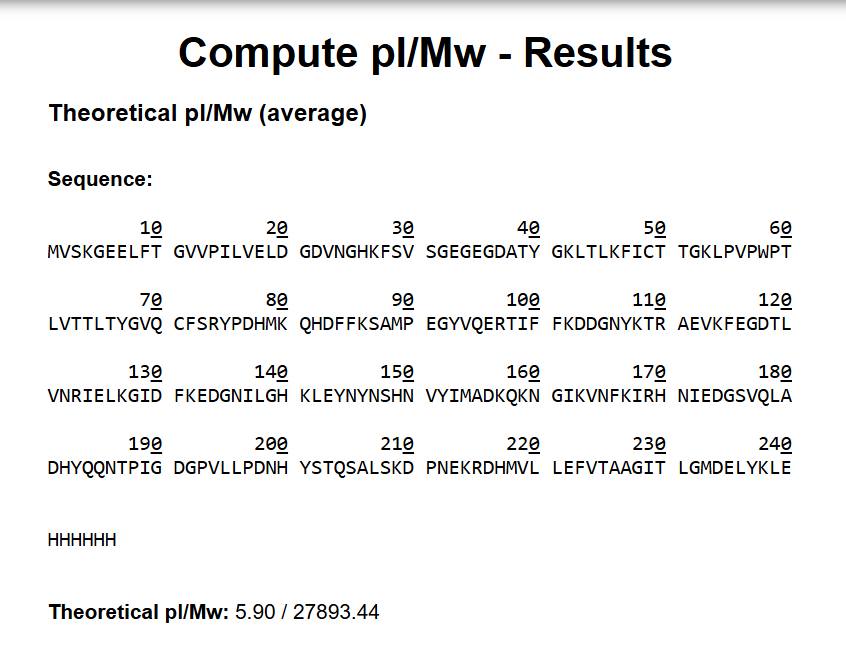
I took the eGFP sequence and went to the Expasy website’s pI (isoelectric point) and mw (molecular weight) calculator and pasted the sequence in there. The molecular weight I got was 27893.44 Dalton (The unit wasn’t specified on the website, I mean it was but in the documentation.)
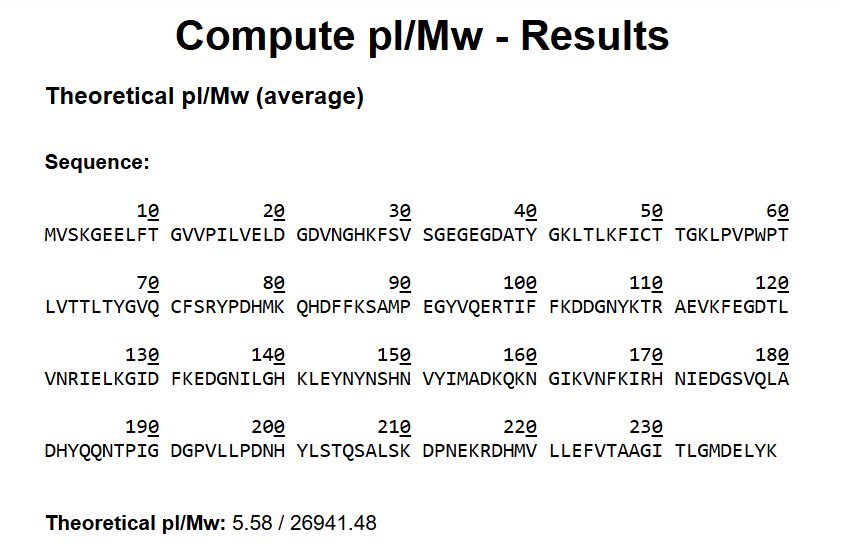
Molecular Weight with Le and HHHHHH (27893.44 Da)
Molecular weight without the LE and HHHHHH (26941.48 Da)
Q2
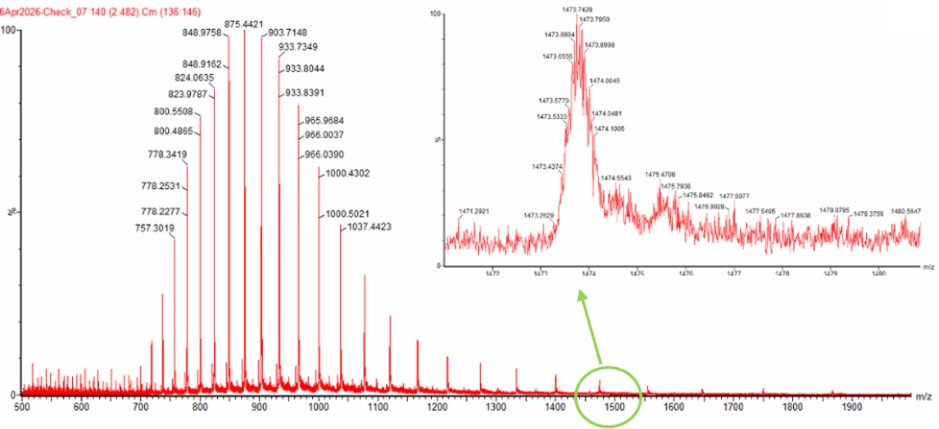
Next up was to calculate the molecular weight of eGFP using adjacent charge state approach. I calculated the molecular weight using adjacent charge state peak pairs read from Figure 1 (denatured eGFP, LC-MS).
First determine z using the formula in the homework brief.
The value we get is 27983.39 Da, which is super close to the value we computed using Expasy’s calculator. Next step is to calculate the accuracy of the measurement.
The peak near m/z 1474 also fits well with a charge state of 19+. Based on the measured molecular weight, a 19+ ion should appear at about m/z 1473.8, which is very close to the observed peak position. Therefore, the zoomed-in peak is most likely a z = 19 ion.
Homework: Waters Part II — Secondary/Tertiary structure
Q1
In the folded state, the protein keeps its compact 3D structure, so fewer protonation sites are exposed. As a result, it carries fewer charges and appears at higher m/z values with a narrow charge-state distribution in the mass spectrum. In the denatured state, the protein chain opens up and more basic residues become exposed. This allows the protein to carry more charges, producing peaks at lower m/z values with a broader charge-state distribution
In Figure 2, the native spectrum (bottom, red) shows only a few peaks at high m/z, indicating a folded protein with low charge states. The denatured spectrum (top, green) shows many peaks spread across lower m/z values, indicating an unfolded protein with high charge states.
Q2
Using the two adjacent peaks at m/z 2799.4199 and 2545.0388, the charge state of the ~2800 peak is calculated to be z = 10. Therefore, the ~2545 peak corresponds to z = 11.
Both charge states give a molecular weight of about 27,984 Da, which closely matches the theoretical value.
Homework: Waters Part III — Peptide Mapping - primary structure
Q1
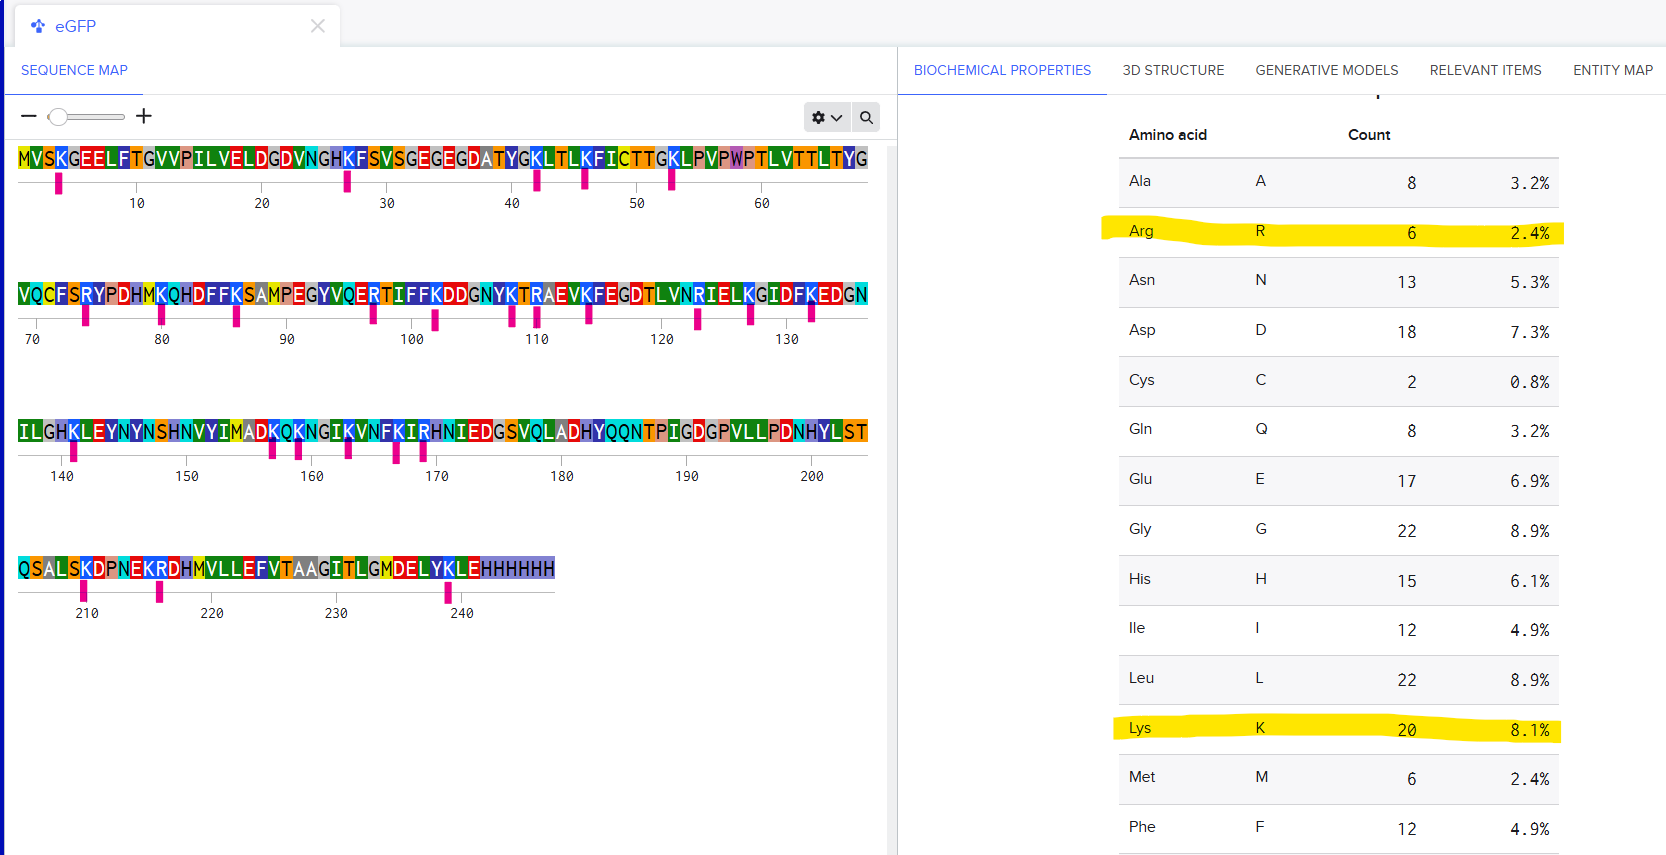
There are 6 Arginines and 20 Lysines in eGFP. I imported the sequence into Benchling and saw the count for amino acids in the Biochemical Propeties Tab.
Q2
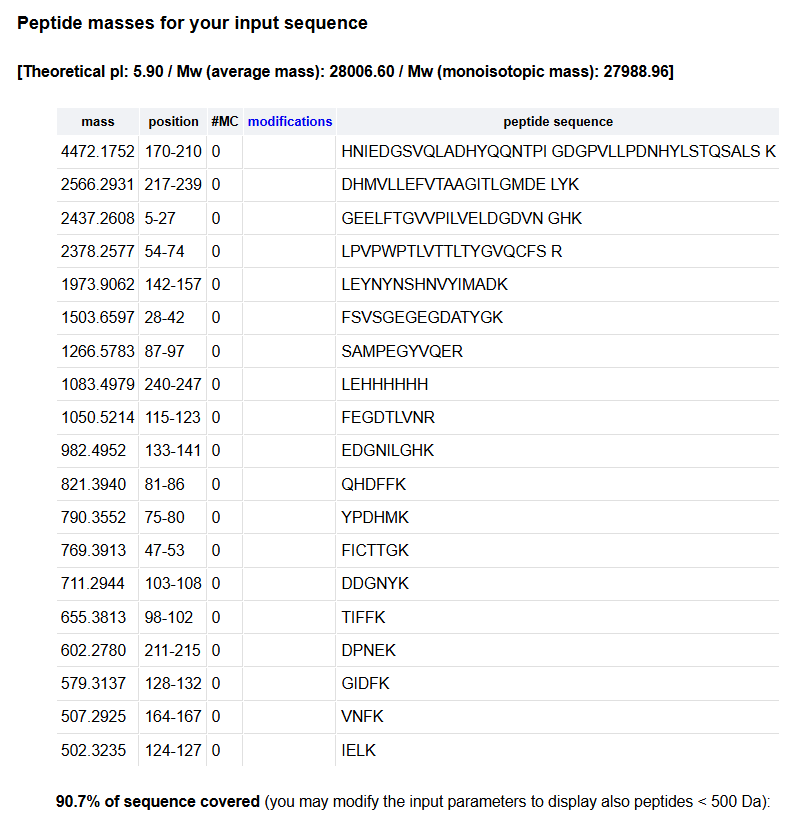
I copied the sequence for eGFP and went to the Expasy’s Peptide Mass Tool to find out how many peptides will be generated from tryptic digestion of eGFP. I pasted the sequence in the input box and used the screenshot from the homework brief to select other relevant parameters. ([M+H]+ , monoisotopic, Trypsin, 500-unlimited Da, peptide masses or in, all known post-translational modifications) (tbh they’re were already selected as is.)
This is the result that I got. There were about 19 peptides generated.
Q3
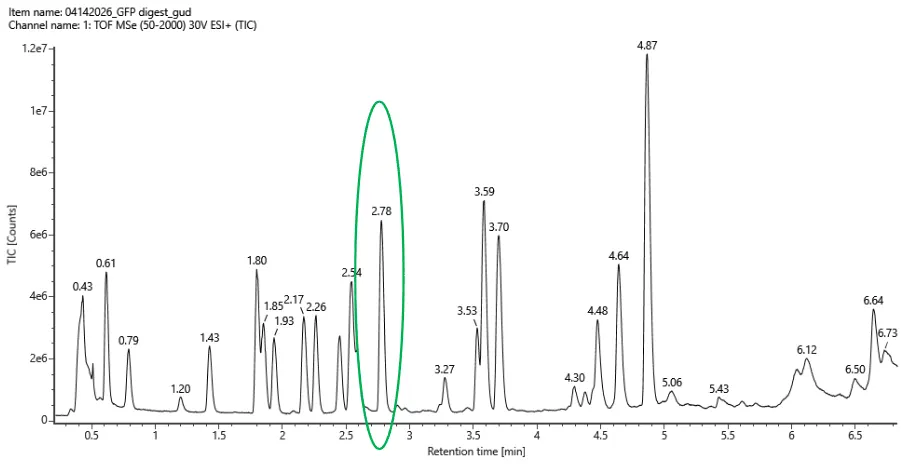
Counting all labeled peaks between 0.5 and 6.0 min with > 10% relative abundance there’s about 18-20 peaks.
Fig 5a
Q4
The number of predicted peaks was 19 and the amount of peaks are 18-20. There are more peaks in the chromatogram. But overall, the peptide map is consistent with the predicted peptides.
Q5
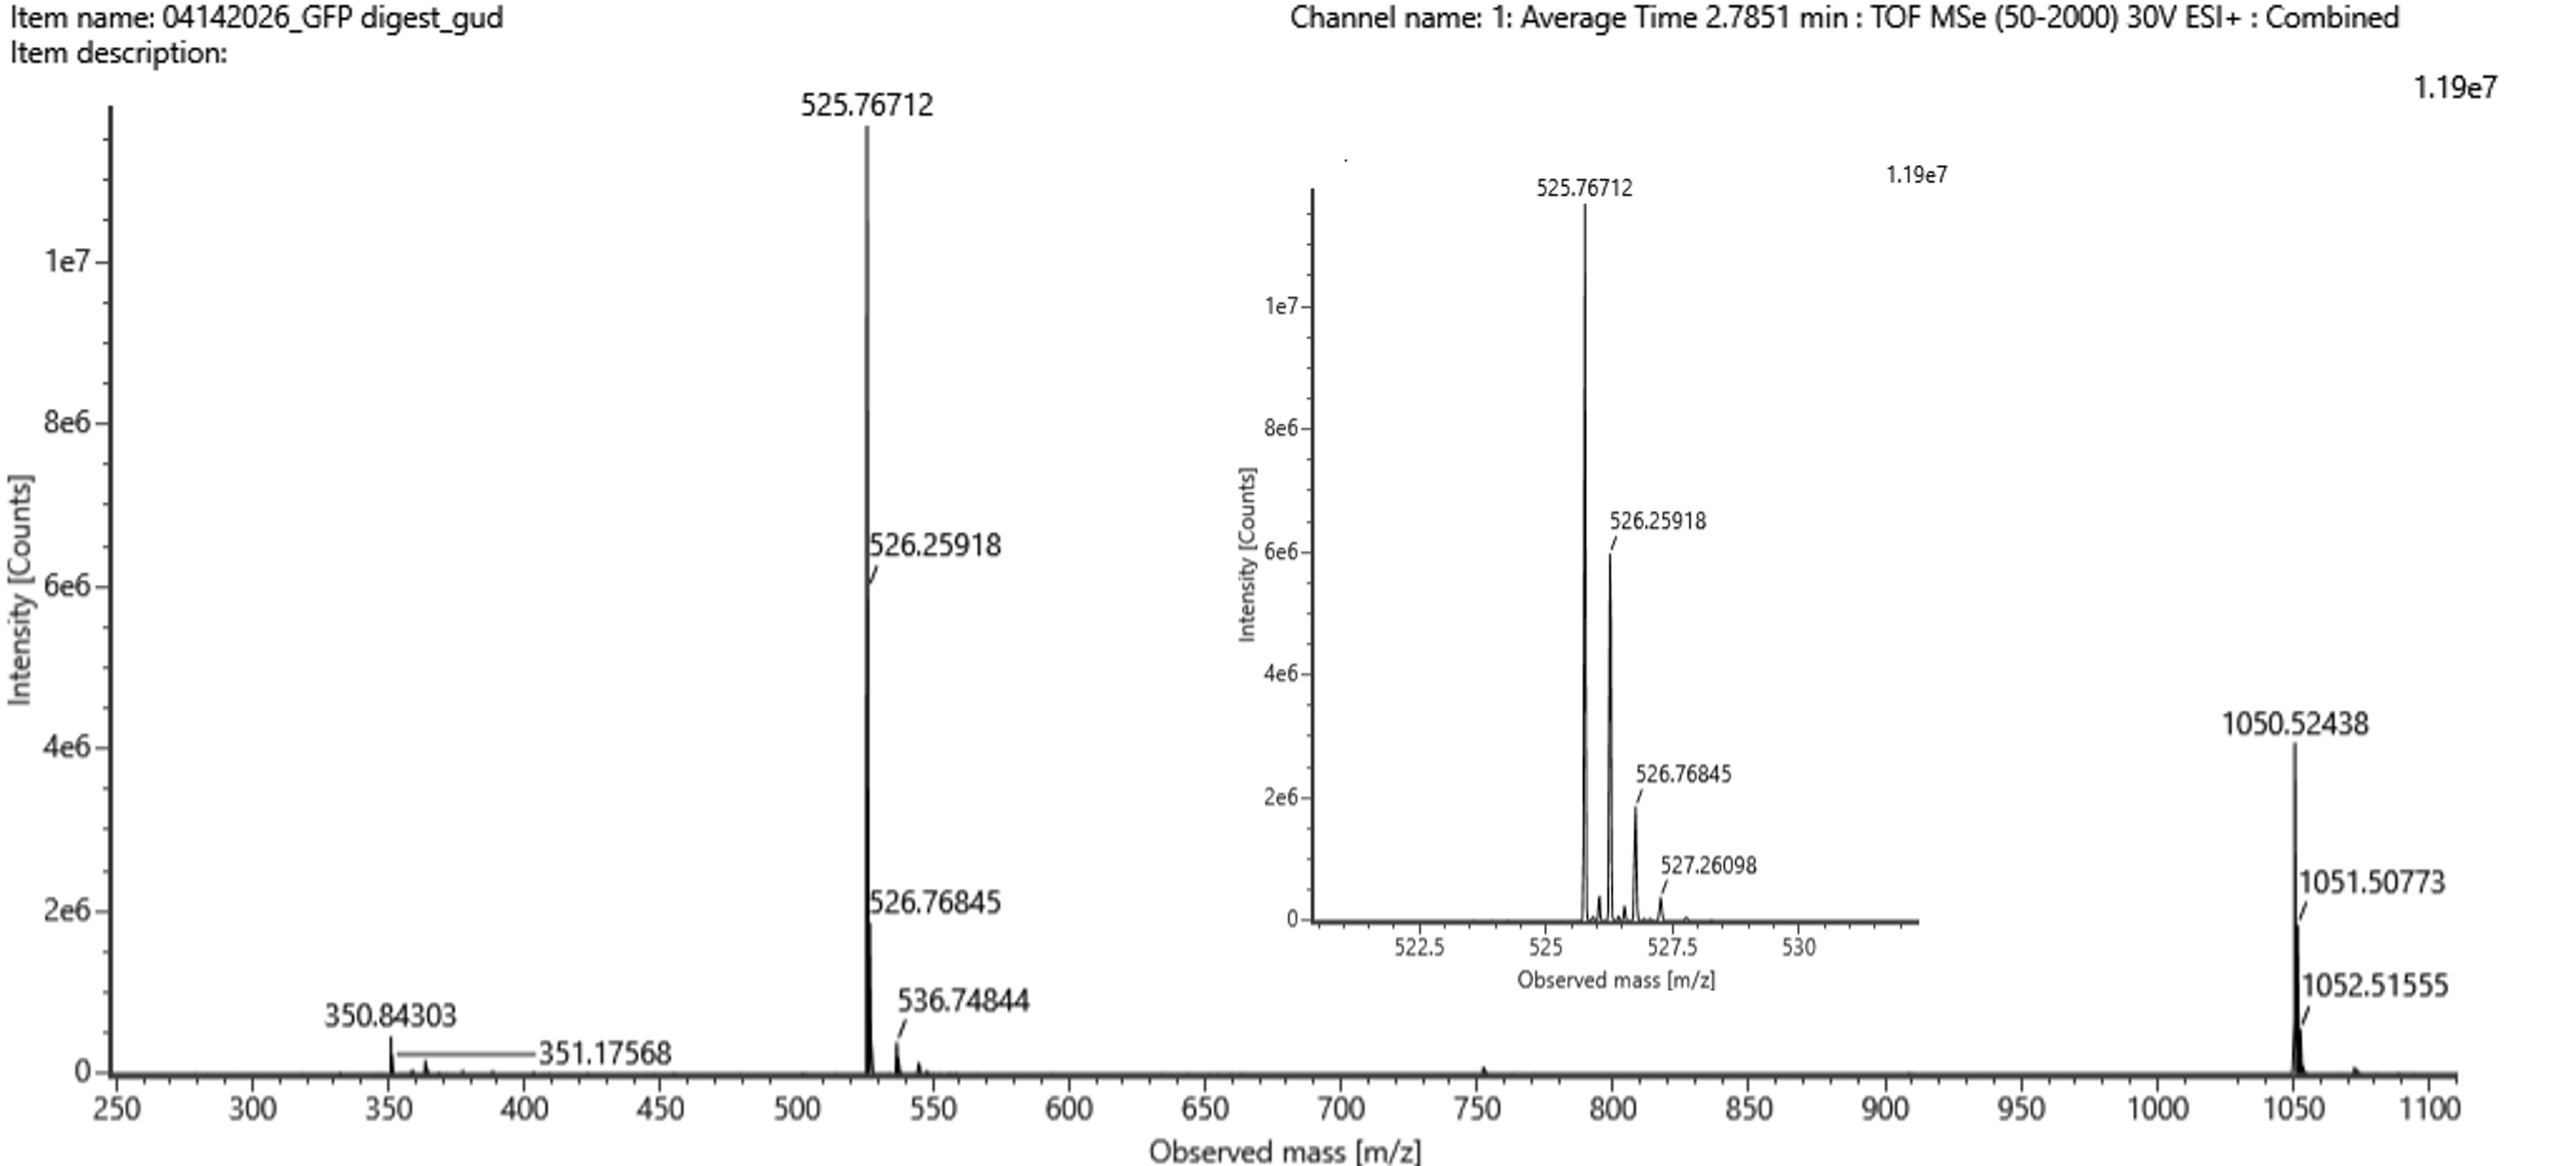
The most abundant peak in the mass spectrum of the 2.78 min fraction is at:
matches the calculated singly charged mass, confirming that it is the singly charged form of the same peptide.
Q6
Searching the PeptideMass output for [M+H]⁺ ≈ 1050.527 Da, we find out that the closest to that mass is the peptide: FEGDTLVNR. The theoretical mass (from peptide mass tool) was 1050.5214. The calculated mass was 1050.527. A difference of 0.006.
(1050.527 - 1050.521) / 1050.521 × 10^6 = 5.3 ppm
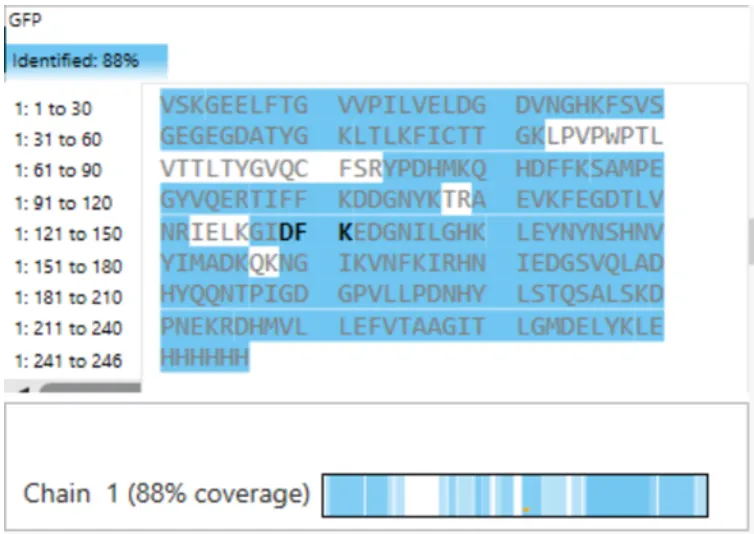
Q7
Figure 6 shows that the amino acid coverage of eGFP is 88%. This means that 88% of the eGFP sequence was confirmed by peptide mapping.
Fig 6
Homework: Waters Part IV — Oligomers
We will determine Keyhole Limpet Hemocyanin (KLH)’s oligomeric states using charge detection mass spectrometry (CDMS). CDMS single-particle measurements of KLH allow us to make direct mass measurements to determine what oligomeric states (that is, how many protein subunits combine) are present in solution. Using the known masses of the polypeptide subunits (Table 1) for KLH, identify where the following oligomeric species are on the spectrum shown below from the CDMS (Figure 7):
7FU Decamer
8FU Didecamer
8FU 3-Decamer
8FU 4-Decamer
Polypeptide Subunit Name
Subunit Mass
7FU
340 kDa
8FU
400 kDa
Predicted Masses of the Four Oligomeric Species
Each “decamer” unit = 10 polypeptide chains. Larger assemblies are multiples of this:
Oligomeric Species
Formula
Predicted Mass
7FU Decamer
10 × 340 kDa
3,400 kDa = 3.4 MDa
8FU Didecamer
20 × 400 kDa
8,000 kDa = 8.0 MDa
8FU 3-Decamer
30 × 400 kDa
12,000 kDa = 12.0 MDa
8FU 4-Decamer
40 × 400 kDa
16,000 kDa = 16.0 MDa
Table 1: KLH Subunit Masses
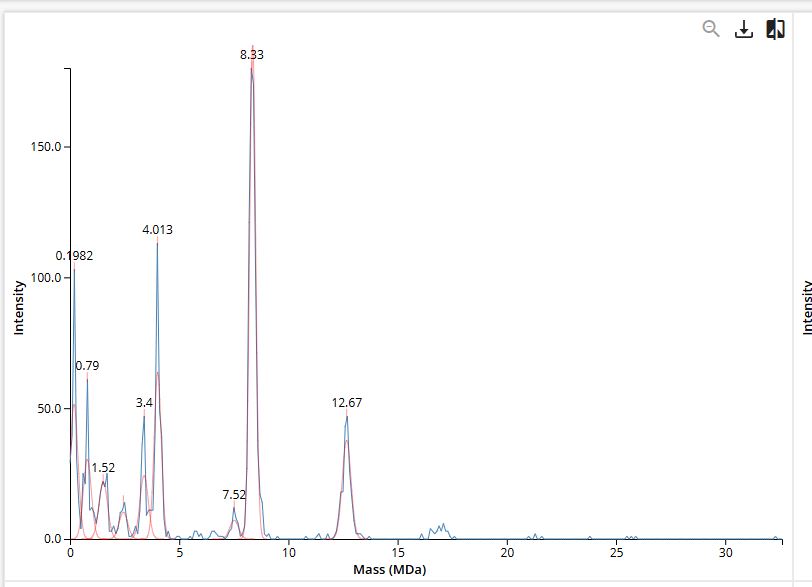
Figure 7. Mass spectrum of Keyhole Limpet Hemocyanin (KLH) acquired on the CDMS.
Assignment of Peaks in the CDMS Spectrum (Figure 7)
Species
Predicted Mass
Observed Peak
Δ (%)
7FU Decamer
3.4 MDa
3.4 MDa
0.0%
8FU Didecamer
8.0 MDa
8.33 MDa
+4.1%
8FU 3-Decamer
12.0 MDa
12.67 MDa
+5.6%
8FU 4-Decamer
16.0 MDa
no labeled peak
—
The 7FU Decamer gives a perfect match at 3.4 MDa - the labeled peak in Figure 7 at exactly 3.4 MDa is unambiguous.
The 8FU Didecamer and 3-Decamer match the 8.33 MDa and 12.67 MDa peaks with 4–6% deviation. These deviations are consistent and systematic both are higher than predicted by roughly the same factor, which is typical of CDMS calibration offsets for very large particles (>5 MDa). Notably:
12.67 / 8.33 = 1.521 ≈ 3 / 2 = 1.500
The ratio of the measured masses closely follows the expected 3:2 ratio for a 3-Decamer vs. Didecamer, strongly confirming their identities.
The 8FU 4-Decamer (predicted 16.0 MDa) has no clearly labeled peak in Figure 7. The spectrum extends to ~30 MDa but shows minimal signal beyond ~13 MDa. This likely means the 4-Decamer is either not present in this KLH sample in significant abundance, or is present at levels below the detection threshold of the CDMS measurement.
Homework: Waters Part V — Did I make GFP?
Parameter
Theoretical
Observed / Measured on Intact LC-MS
PPM Mass Error
Molecular weight (kDa)
27893.44 Da
27983.39 Da
3225 ppm
Week 11 HW: Building Genomes
Part A: The 1,536 Pixel Artwork Canvas | Collective Artwork
I was unable to contribute a pixel due to access constraints with the submission window. The activity was fun overall, it was interesting to see how everyone was trying to make something definitive, only to be overrun by somebody else. Seeing a timelapse of it all in the Review meeting was intriguing. If I had gotten a chance to contribute, I definitely would have just tried to support an existing effort at making something, some people tried to disrupt the existing artworks but it was futile for the most part. Next year maybe if each node had a part of the canvas, then there would be fun things created as the nodes can then plan on what is to be made.
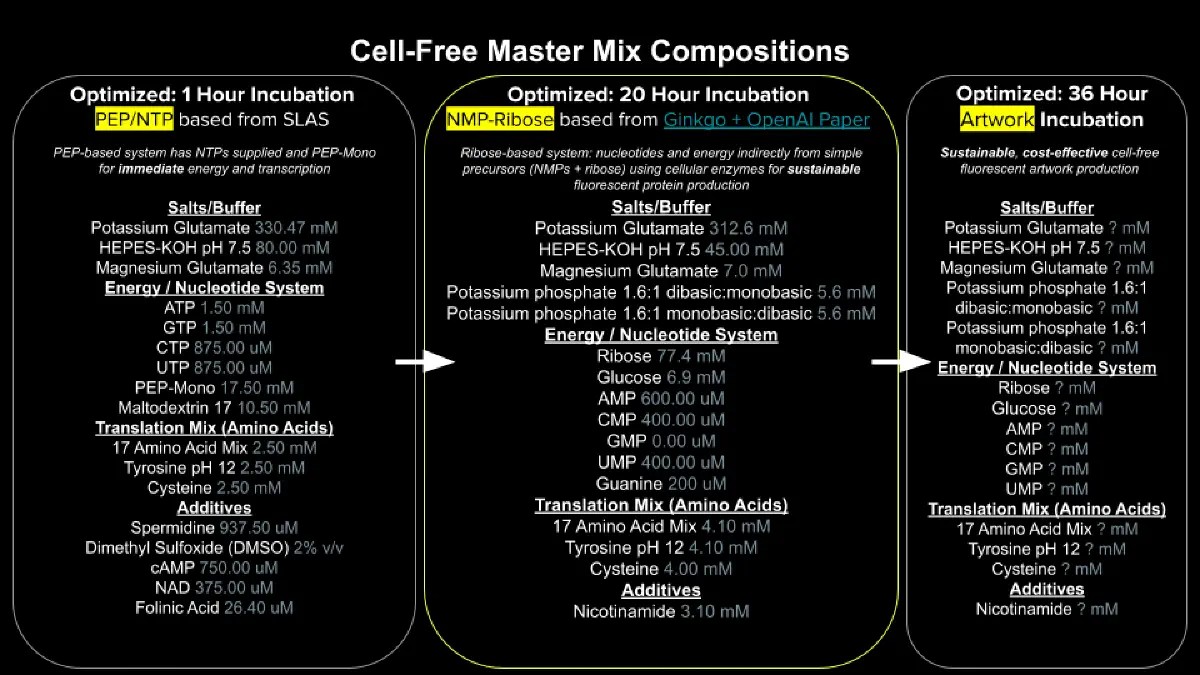
Part B: Cell-Free Protein Synthesis | Cell-Free Reagents
Referencing the cell-free protein synthesis reaction composition (the middle box outlined in yellow on the image above, also listed below), provide a 1-2 sentence description of what each component’s role is in the cell-free reaction.
E. coli Lysate
BL21 (DE3) Star Lysate (includes T7 RNA Polymerase): This lysate provides the entire cellular machinery required for gene expression, ribosomes, tRNAs, translation factors, chaperones, and metabolic enzymes. The included T7 RNA Polymerase specifically transcribes DNA templates under a T7 promoter into mRNA, initiating the transcription & translation.
Salts/Buffer
Potassium Glutamate: Provides K⁺ ions essential for ribosome stability and translation stability; The glutamate acts like compatible solute that mimics the intracellular ionic environment which in turn supports enzyme activity without inhibiting translation.
HEPES-KOH pH 7.5: A buffer that maintains the reaction pH near physiological levels (~7.5), which is optimal for the enzymatic activities of both transcription and translation machinery.
Magnesium Glutamate: Supplies Mg²⁺ ions, which are critical cofactors for ribosome assembly, RNA polymerase catalysis, and stabilization of nucleotide triphosphates (NTPs) during phosphoryl-transfer reactions.
Potassium phosphate monobasic / dibasic: The two together form secondary phosphate buffer that stabilizes pH and also donates inorganic phosphate, which participates in energy regeneration pathways within the lysate
Energy / Nucleotide System
Ribose: A pentose sugar that feeds into the pentose phosphate pathway to generate PRPP (phosphoribosyl pyrophosphate), key for synthesis of nucleotides needed for transcription.
Glucose: Serves as a primary carbon and energy source; it is metabolized via glycolysis to regenerate ATP and maintain energy in the system.
AMP, CMP, GMP, UMP: These nucleoside monophosphates are phosphorylated by kinases present in the lysate to generate NTPs (ATP, CTP, GTP, UTP) which are the direct substrates for RNA synthesis during transcription.
Guanine: A free purine base that is salvaged by the purine salvage pathway enzymes in the lysate, converting it to GMP and then to GTP, supplementing the GTP pool to sustain transcription.
Translation Mix (Amino Acids)
17 Amino Acid Mix: 17 of the 20 amino acids, these are direct building blocks for protein synthesis during translation.
Tyrosine (pH 12): An amino acid that is provided separately because it has very low solubility at neutral pH and must be dissolved at alkaline pH (pH 12) before being added. It is essential for synthesizing proteins containing tyrosine residues.
Cysteine: Supplied separately due to its high chemical reactivity (prone to oxidation); it is critical for proteins requiring disulfide bonds or specific structural folding.
Additives
Nicotinamide: A precursor to NAD⁺ (via the NAD⁺ salvage pathway), which is essential for redox reactions and energy metabolism in the lysate, helping sustain metabolic activity throughout long cell-free incubations.
Backfill
Nuclease-Free Water: Used to bring the reaction to the correct final volume without introducing RNases or DNases that would degrade the mRNA template or DNA, which would prematurely terminate protein production.
Describe the main differences between the 1-hour optimized PEP-NTP master mix and the 20-hour NMP-Ribose-Glucose master mix shown in the Google Slide above. (2-3 sentences)
The 1-hour PEP-NTP system supplies pre-formed NTPs (ATP, GTP, CTP, UTP) alongside phosphoenolpyruvate (PEP) as an immediate energy source, which provides rapid transcription and translation but is quickly consumed, limiting productive reaction time to roughly one hour. In contrast, the 20-hour NMP-Ribose-Glucose system uses nucleoside monophosphates (NMPs) plus ribose and glucose as upstream energy precursors, allowing metabolic enzymes in the lysate to continuously regenerate NTPs from simpler substrates, dramatically extending reaction duration and protein yield. As a result, the 20-hour system is more cost-effective (NMPs and simple sugars are far cheaper than pre-made NTPs) and better sustains the energy balance needed for prolonged fluorescent protein production.
How can transcription occur if GMP is not included but Guanine is?
Guanine (the free nucleobase) is a substrate for the purine salvage pathway enzymes naturally present in the E. coli lysate. Specifically, the enzyme hypoxanthine-guanine phosphoribosyltransferase (HGPRT) catalyzes the reaction: Guanine + PRPP → GMP + PPi. The resulting GMP is then sequentially phosphorylated by guanylate kinase and nucleoside diphosphate kinase to yield GDP and GTP, which T7 RNA Polymerase can use directly as a substrate for transcription. This salvage route thus replenishes the GTP pool without requiring pre-formed GMP to be added to the mix.
Part C: Planning the Global Experiment | Cell-Free Master Mix Design
Given the 6 fluorescent proteins we used for our collaborative painting, identify and explain at least one biophysical or functional property of each protein that affects expression or readout in cell-free systems. (Hint: options include maturation time, acid sensitivity, folding, oxygen dependence, etc) (1-2 sentences each)
sfGFP (Superfolder GFP): sfGFP carries several stabilizing mutations that dramatically improve thermodynamic folding, allowing it to fold correctly even in the resource-limited environment of a cell-free system where chaperones are dilute. It is oxygen-dependent for chromophore maturation but has a relatively fast maturation half-time (~30 min), making it well-suited for shorter cell-free readouts.
mRFP1: mRFP1 has a slow oxidative chromophore maturation, meaning a significant amount of translated protein may remain non-fluorescent during a short incubation window. In oxygen-limited cell-free conditions, this slow maturation is especially limiting and can cause the fluorescent signal to underrepresent actual protein yield.
mKO2: mKO2 is a monomeric orange FP with one of the faster maturation times among orange/red-class FPs (~2.5 hours half-time), making it more practical for time-course cell-free experiments. It is still oxygen-dependent, but its relatively high photostability and decent brightness make it a reliable reporter once matured.
mTurquoise2: mTurquoise2 is a cyan FP with an exceptionally high quantum yield (~0.93) (among the highest of any FP) and fast maturation, giving strong fluorescence signal per translated molecule in cell-free systems. However, it is moderately acid-sensitive, and if the pH of the cell-free reaction drifts downward during long incubations due to metabolic byproduct accumulation, the fluorescent signal could be quenched.
mScarlet-I: mScarlet-I is a bright monomeric red FP engineered for fast maturation (~60 min half-time) and high quantum yield (~0.54), which makes it one of the best-performing red reporters in cell-free contexts where time is limited. It is oxygen-dependent for chromophore maturation, so oxygen availability during the incubation directly affects how much functional protein accumulates.
Electra2: Electra2 is a recently engineered fluorescent protein optimized for expression in cell-free and synthetic biology contexts; it is notable for its reduced oxygen dependence during chromophore maturation compared to other FPs, which is a significant advantage in cell-free reactions where dissolved oxygen can become limiting over long incubations.
Create a hypothesis for how adjusting one or more reagents in the cell-free mastermix could improve a specific biophysical or functional property you identified above, in order to maximize fluorescence over a 36-hour incubation. Clearly state the protein, the reagent(s), and the expected effect.
Protein: mScarlet-I
Problem: Oxygen-dependent chromophore maturation can become rate-limiting over a 36-hour incubation as dissolved O₂ is consumed and the reaction environment becomes more reducing.
Hypothesis: Supplementing the master mix with a higher concentration of Nicotinamide will enhance NAD⁺ regeneration within the lysate, sustaining the redox environment in a more oxidized state and thereby supporting the mScarlet-I maturation. Additionally, supplementing with a small amount of G6P could feed the pentose phosphate pathway to maintain NADPH balance, preventing quenching of the chromophore-forming reaction in reductive condition.
The expected outcome is higher fluorescence from mScarlet-I wells over the 36-hour window compared to in the standard master mix, reflecting improved maturation efficiency under low-oxygen conditions.
Week 2 HW: DNA Read, Write & Edit
Week 2 : Pre-HW
Professor Jacobson:
A1. DNA polymerase with proofreading has an error rate of about 1 error per 10⁶ bases (10⁻⁶). This is due to its proofreading and exonuclease activity. The human genome is about 3.2 billion base pairs. At a raw error rate of 10⁻⁶, replication would introduce thousands of errors per genome copy, which is unacceptable. Biology deals with this via multiple layers of correction, DNA Polymerase proofreading, post replication mismatch repair and other such systems.
A2. The genetic code is degenerate in nature, therefore there could be many possible DNA sequences that could encode the same protein sequence. There could be in theory, millions of DNA sequences that could encode one protein. Most of these sequences wouldn’t work due to biological constraints like Codon bias, repetitive sequences causing errors, Inhibiions in transcription/translation.
Dr. LeProust:
A1. The most common method is chemical phosphoramidite DNA synthesis. It works via:
Stepwise base addition
Chemical protection/deprotection cycles
Typically ~5 minutes per base addition
A2. It is harder to synthesize oligos longer than ~200 nt as errors accumulate with the addition of every base. Depurination and incomplete reactions increase with time and by the time you reach ~200 nt the drops in yield and accuracy make the product unreliable.
A3. Directly synthesizing a 2000 bp gene would accumulate too many errors to be of actually use. The yield would be extremely low and the process would be expensive. We use assembly based approaches to make long genes instead via using medthods like Gibson Assemby then doing sequencing and error correction later on.
George Church:
A1. There are 10 essential amino acids that animals cannot synthesize and must get from food. They are:
I wasn’t aware of the ‘Lysine Contingency’ but a quick google search revealed that it is a reference to “Jurassic Park” wherein they engineer dinosaurs so they cannot synthesize lysine and must receive it externally, acting as a biological control mechanism. In reality, all animals already lack the ability to synthesize lysine, making them inherently dependent on plants and microbes. This makes the Lysine contingency an actually real thing, but if such dependencies could be engineered then it could be used to control organisms.
Part 1: BENCHLING ADVENTURES AND GEL ART
This week’s homework was pretty daunting as it involved Benchling. Something I’d never heard of before. I just decided to follow, the steps and figure out stuff as I go.
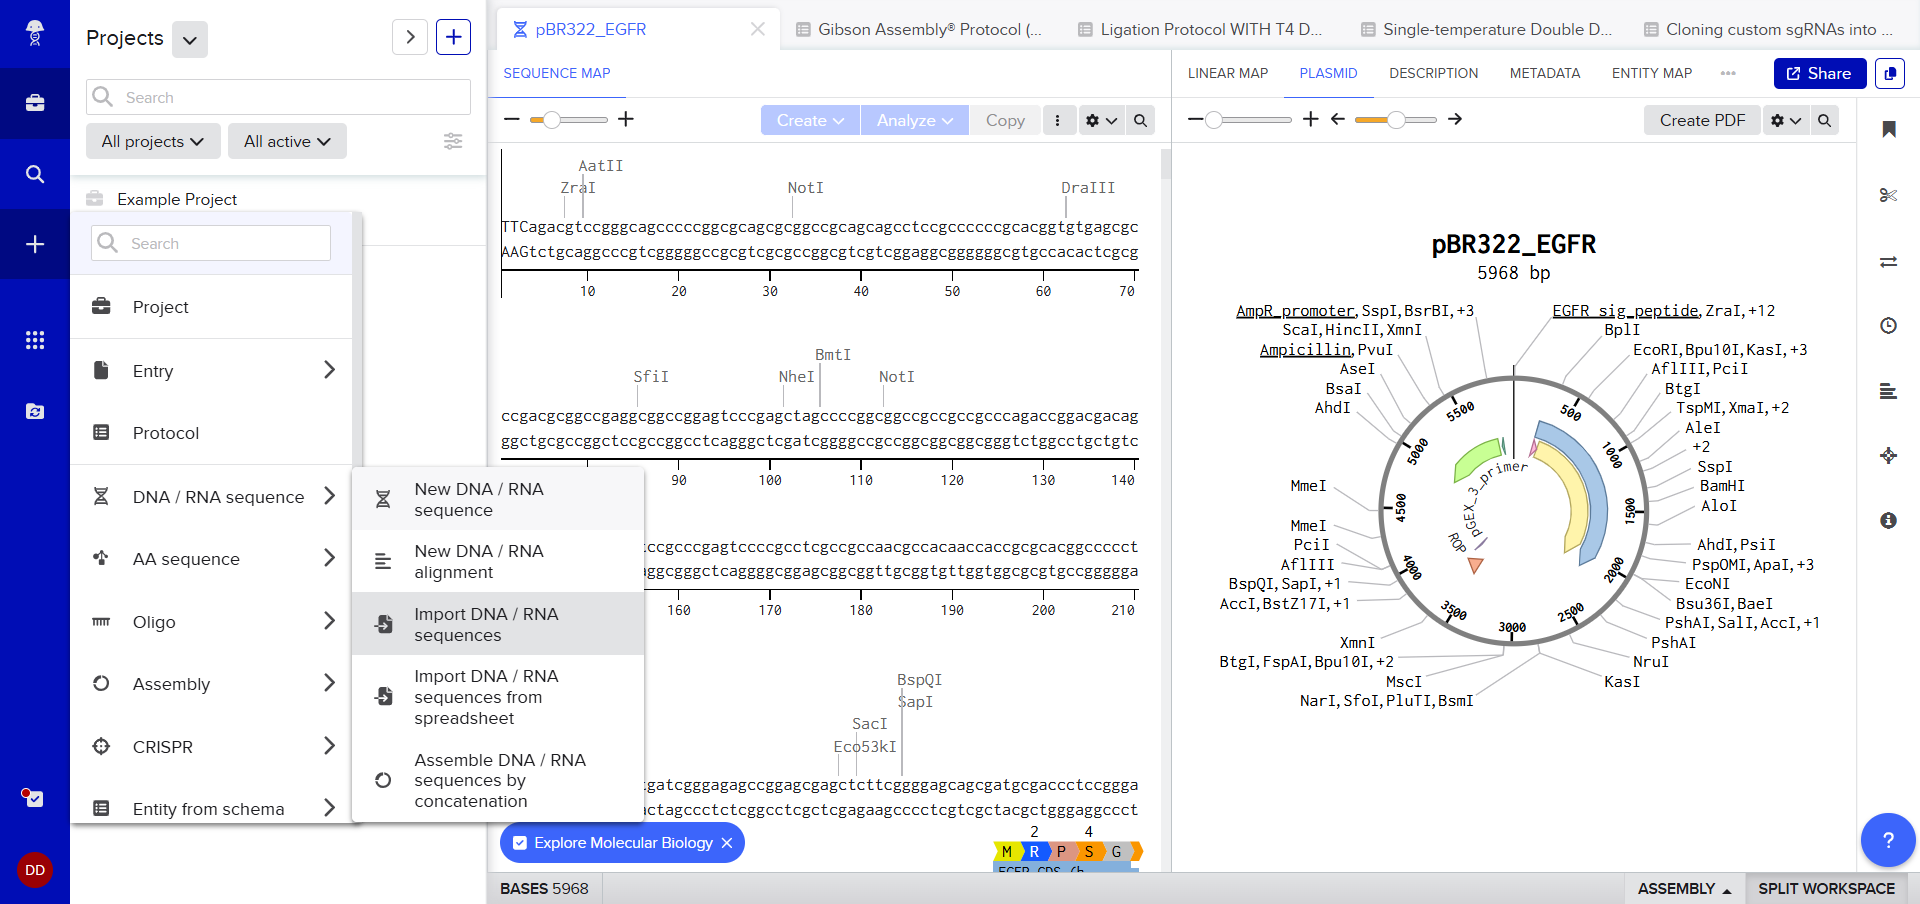
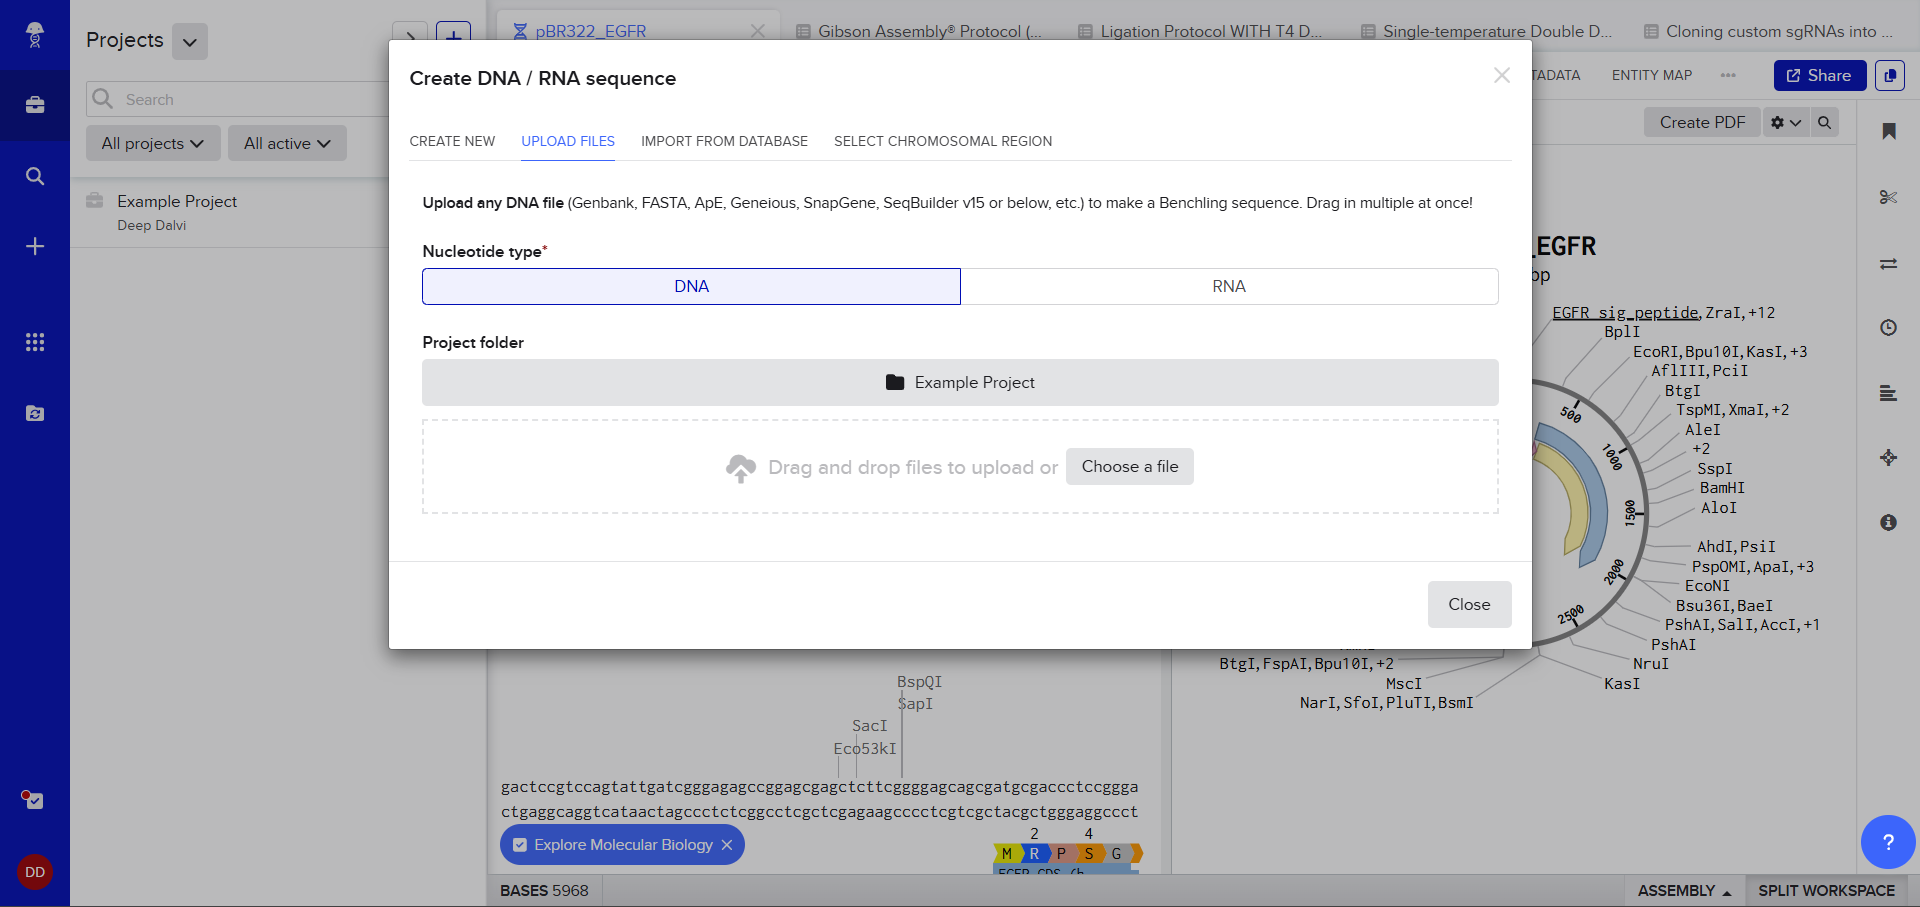
After creating a Benchling account and logging in, I was greeted by a screen that looked so complex. A plasmid on the right, DNA sequence on the left, a lot of restriction sites. I decided to just follow the next step. After clicking on the ‘plus’ icon and selecting Import DNA/RNA sequence.
A pop up window asked me to upload the DNA Sequence, I thought I could just add the accession number or something (Something I’d used in my graduate biotechnology coursework) I wasn’t sure, so I still decided to stick to the scaffold and just follow the next step. :)
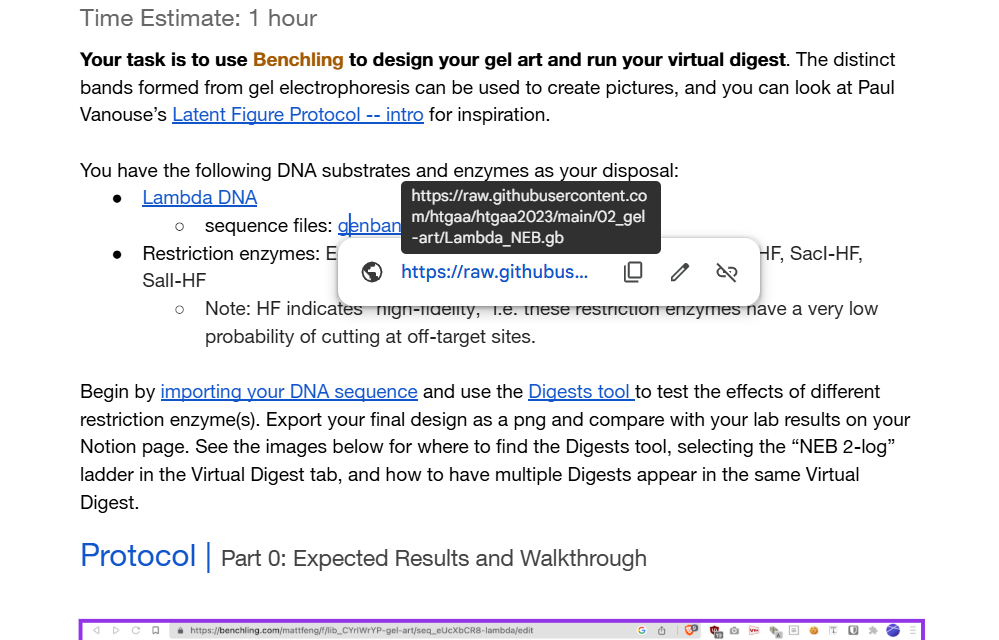
The link to lambda DNA Sequence was in the Google Doc for the homework, I opened the link and right-clicked to save the file.
I made sure that I saved with the .gb extension as I was downloading a GenBank file, it was being downloaded as a .txt file. (I didn’t want any uploading problems)
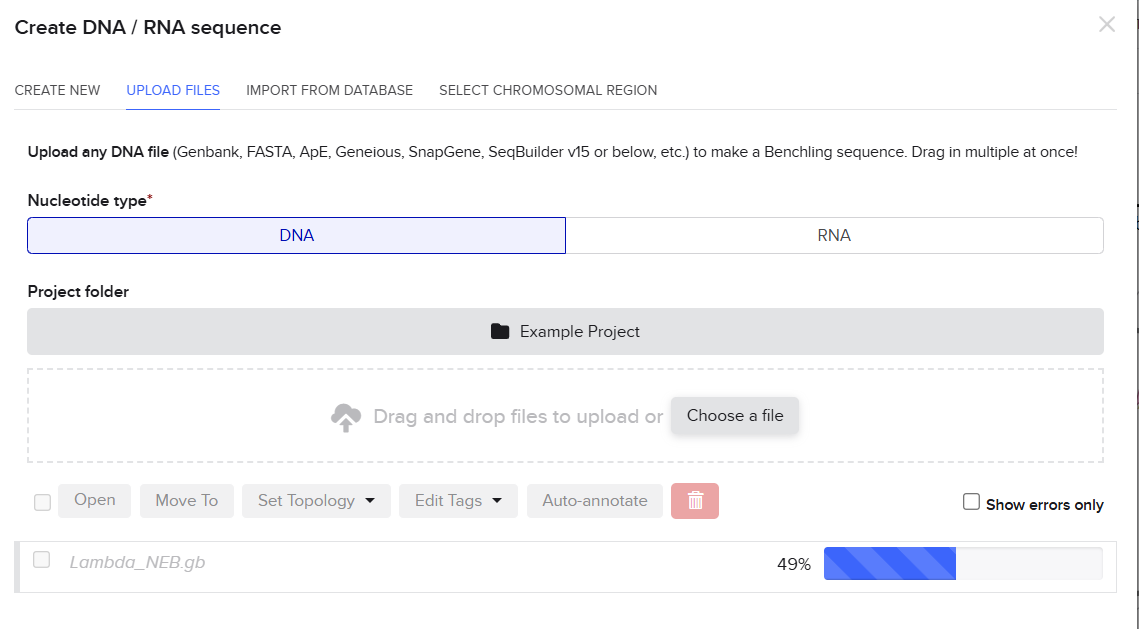
Then I just drag and dropped the .gb file to the Benchling pop-up window and the sequence started to be uploaded. (So far so good.)
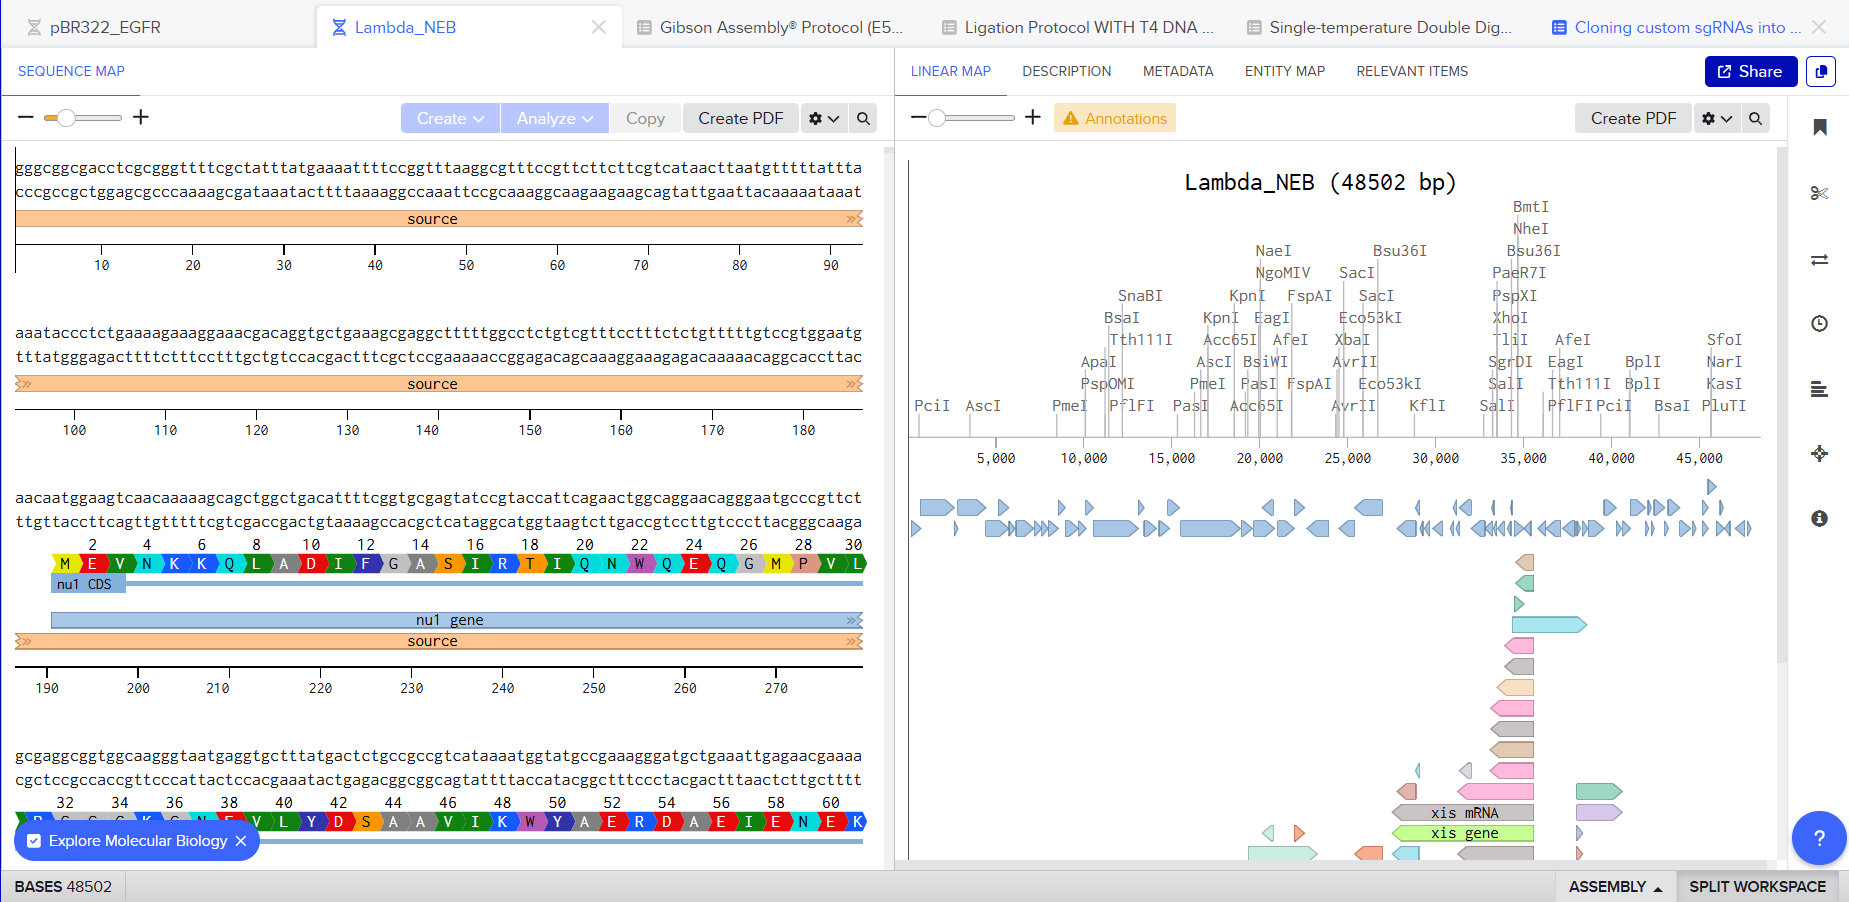
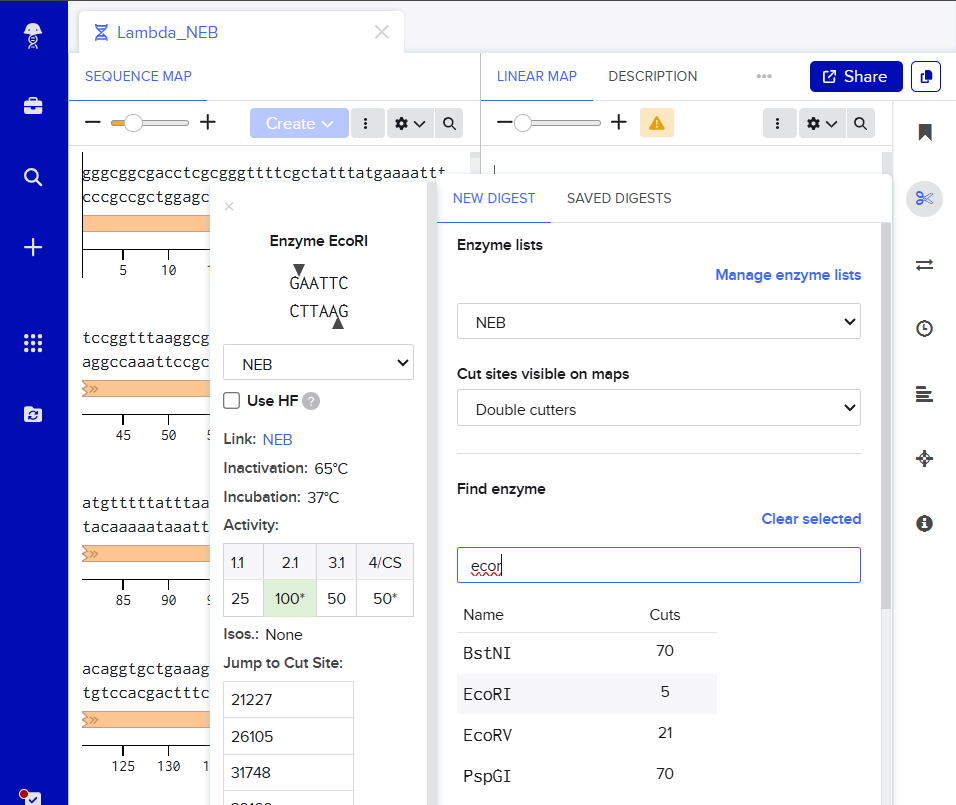
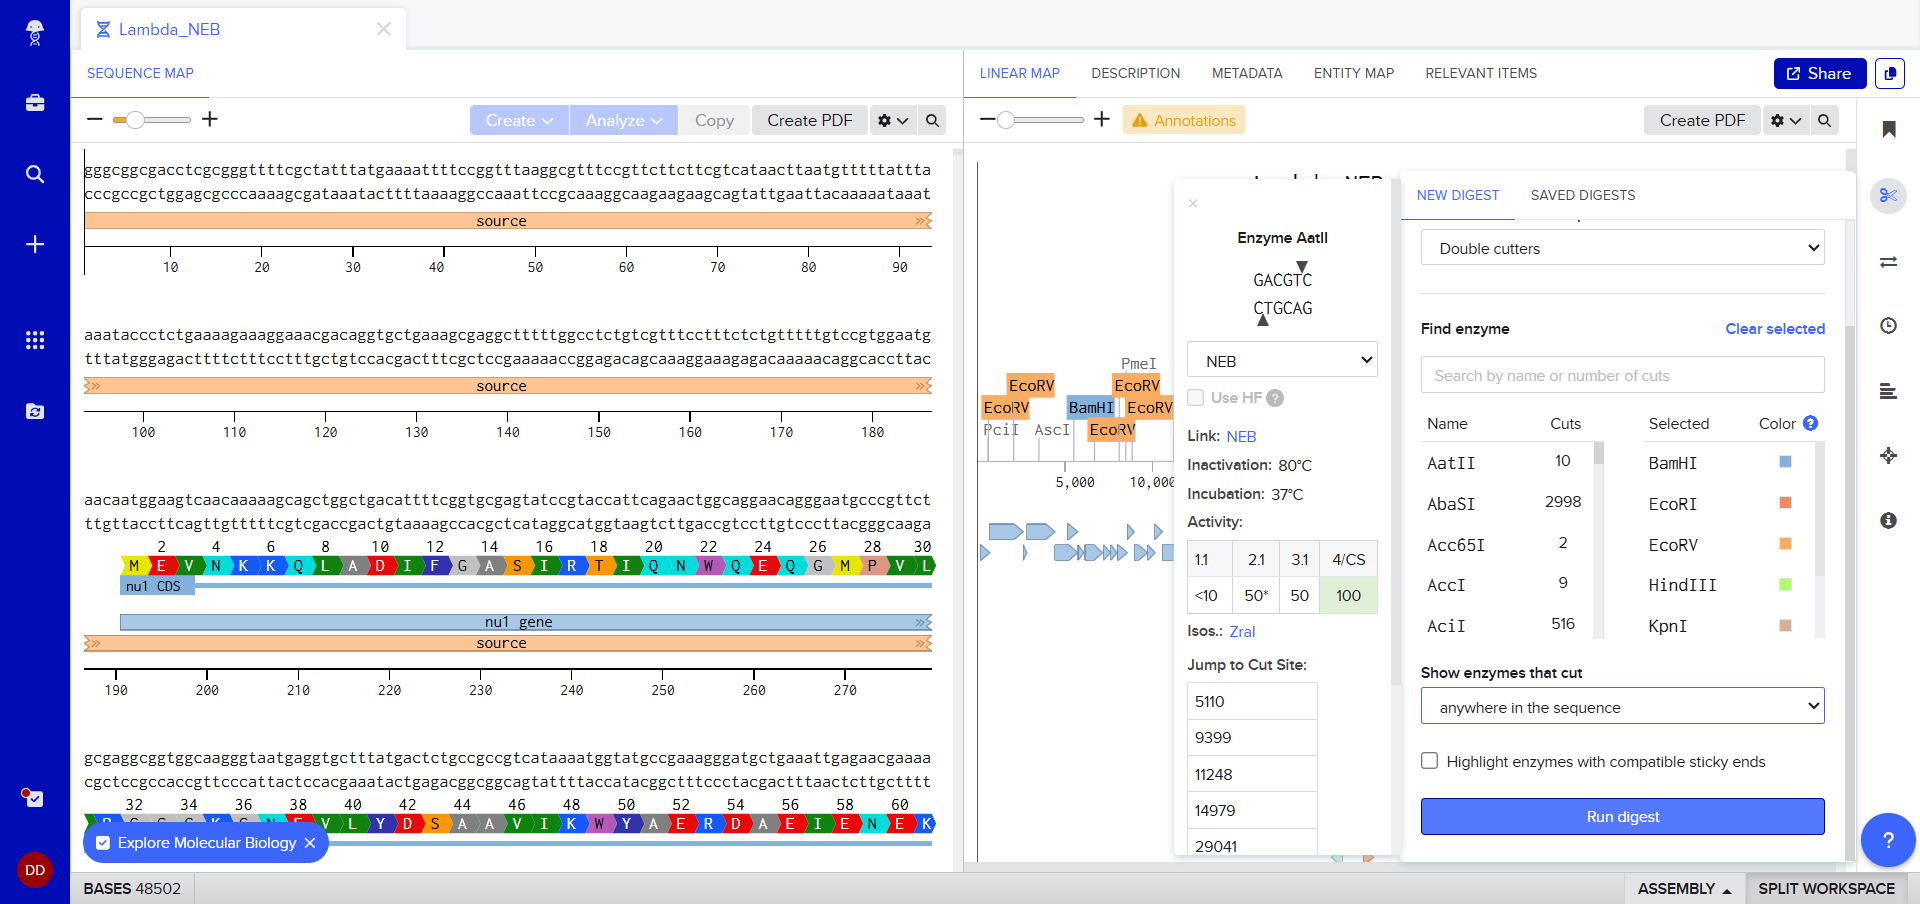
I was awestruck when I saw the screen post sequence upload; I was being overwhelmed with information. Everywhere I looked, there was something new yet it seemed familiar. I then found the digest button in the side panel on the left (SCISSOR ICON).
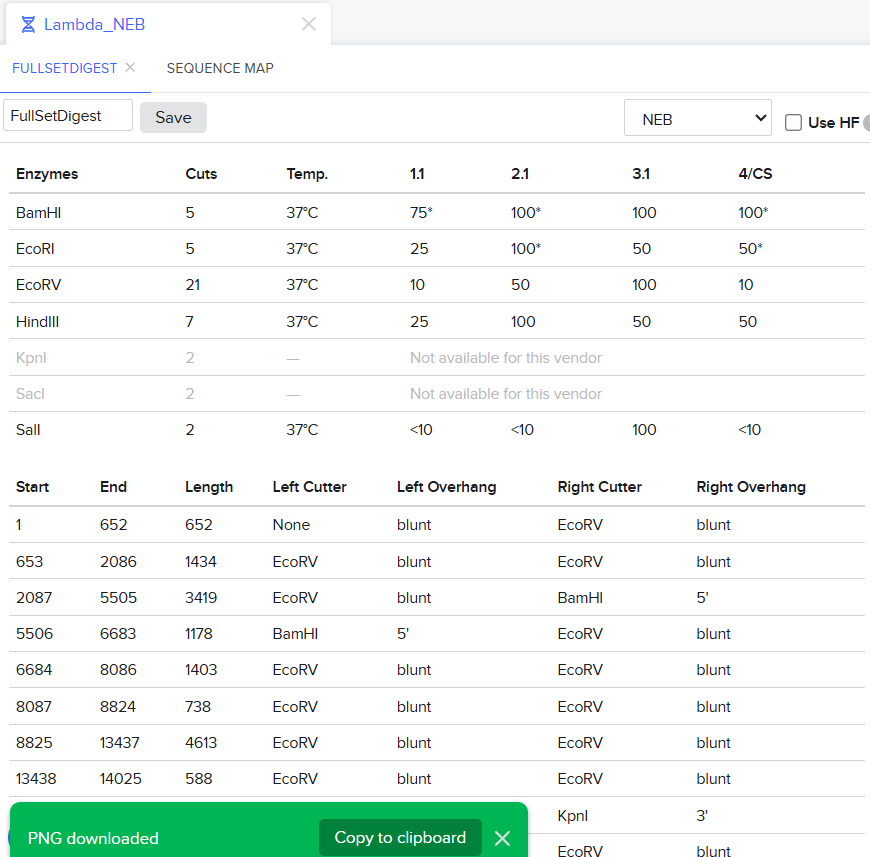
Clicking on the scissor icon, another panel for ’new digest’ opened up and it seemed intuitive. I was supposed to add the enzymes from the HW Doc, and then do an in-silico restriction of the DNA. I managed to add all the enzymes into the list and then clicked on the big blue ‘RUN DIGEST’ button.
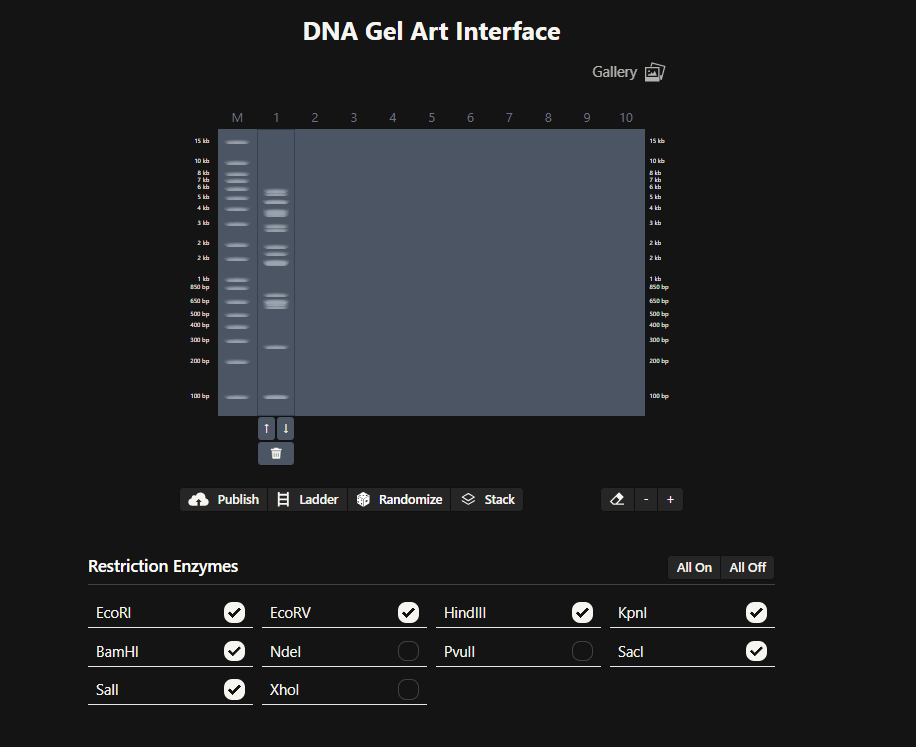
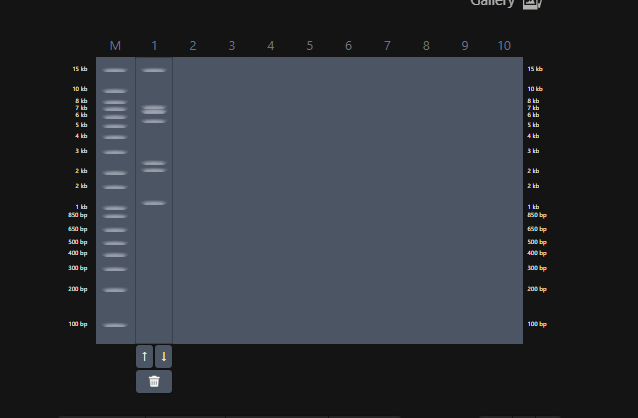
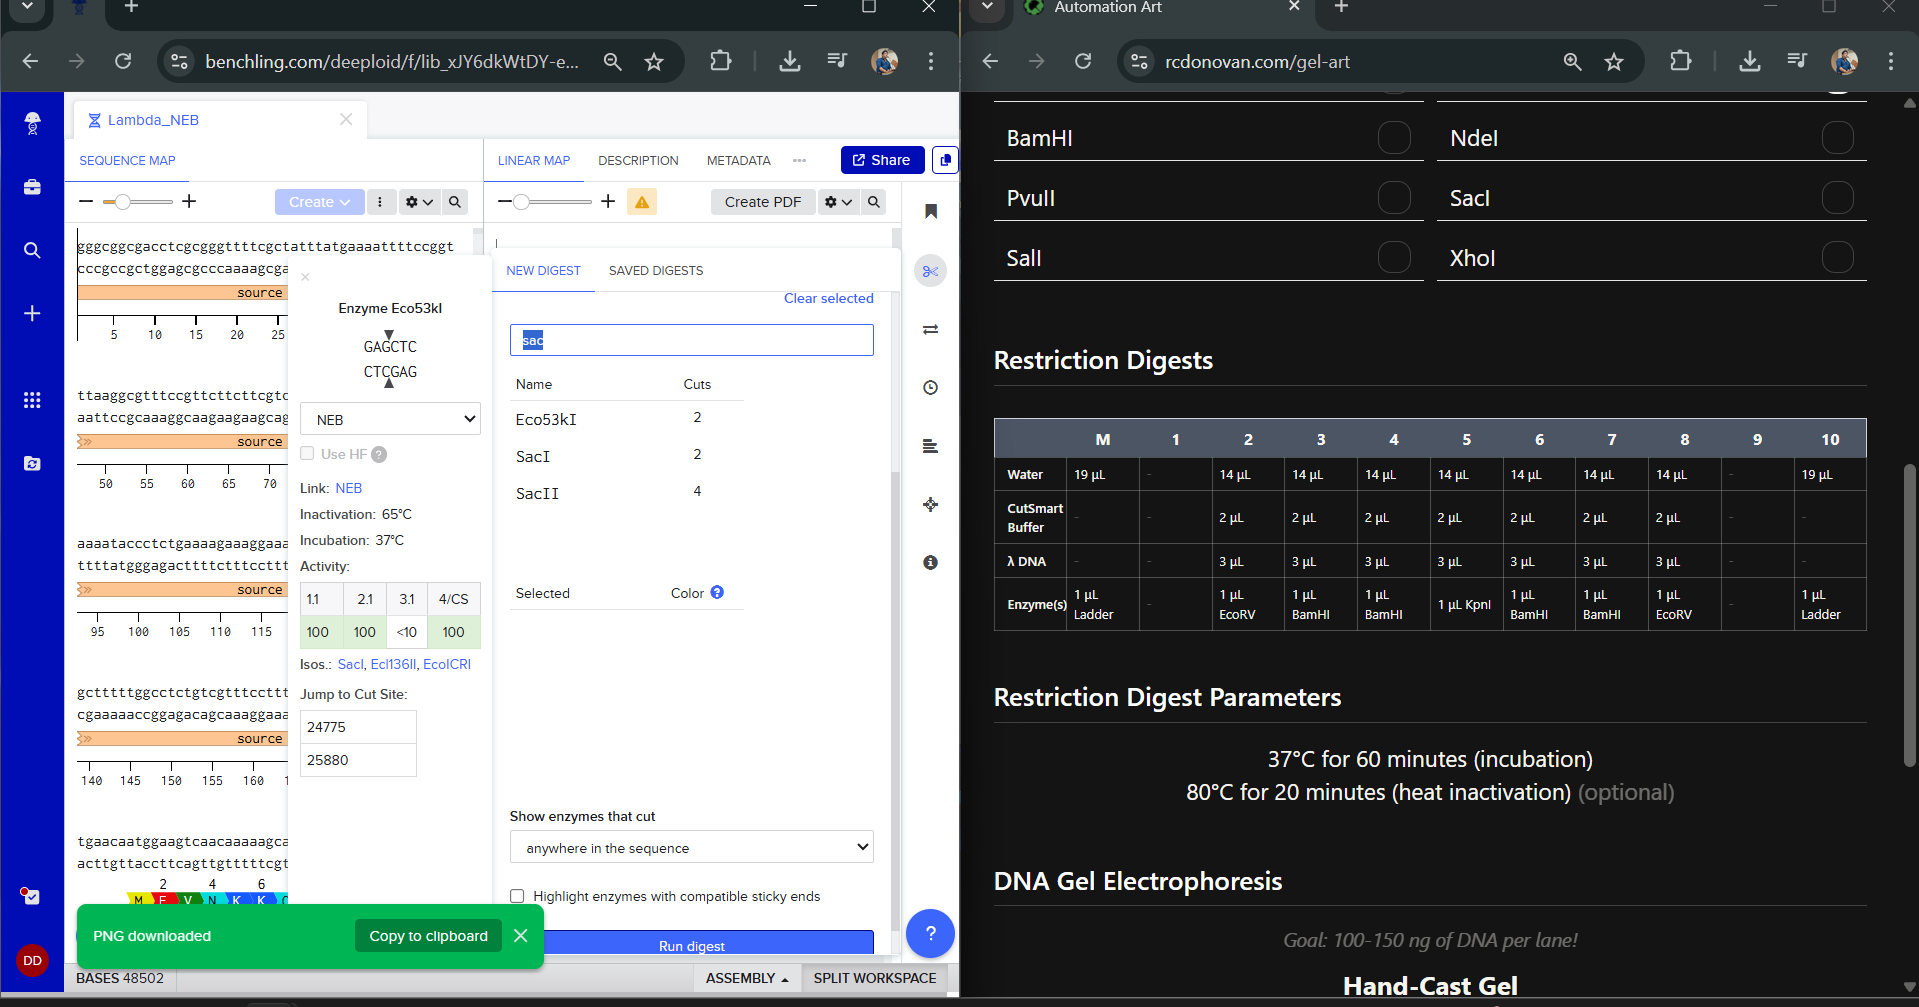
Okay so before moving ahead. I was very intimidated by Benchling and the entire homework so I had tinkered around in the whole HW Doc and I had also visited the DNA Gel Art Interface website by ‘rdonovan’ (https://rcdonovan.com/gel-art) At first I wasn’t able to understand what was happening, I only had a general idea of what this was, but there was no tutorial/tooltips, I wasn’t sure what button did what. After selecting/deselecting enzymes and pressing the arrows, I found out that this was also like Benchling’s Digest thingie but this was quicker and allowed faster tweaks. To make sure, I selected all the enzymes in DGAI (I’ll refer to rdonovan’s website this way to keep things simple) and then tried to replicate the same in Benchling.
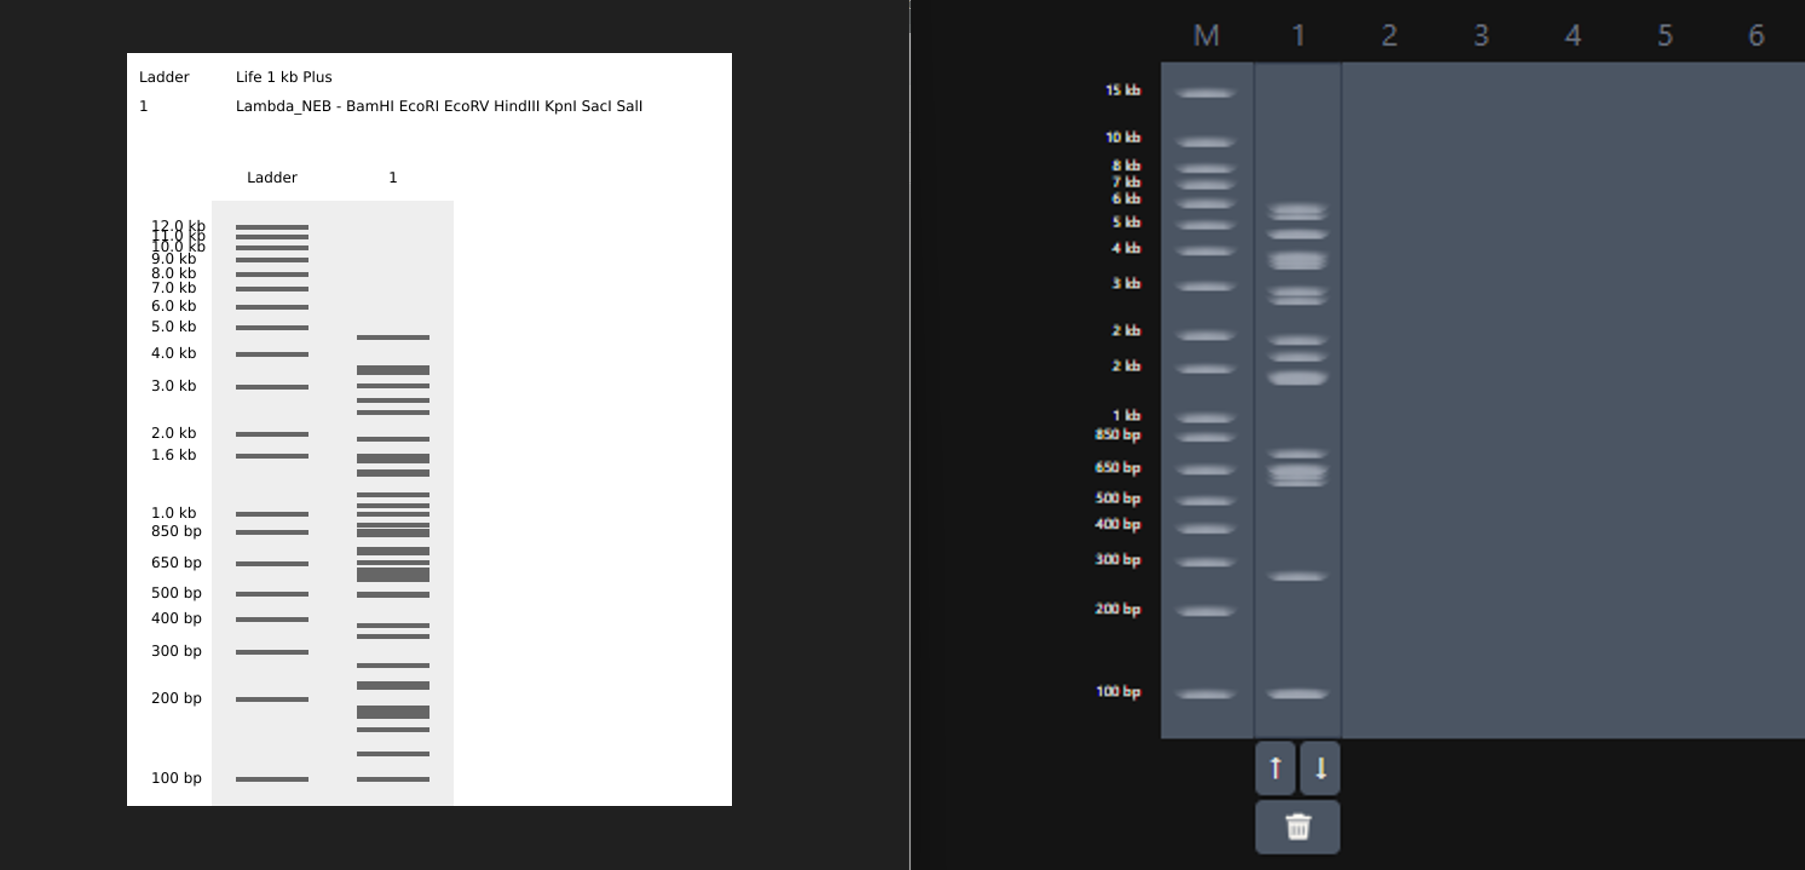
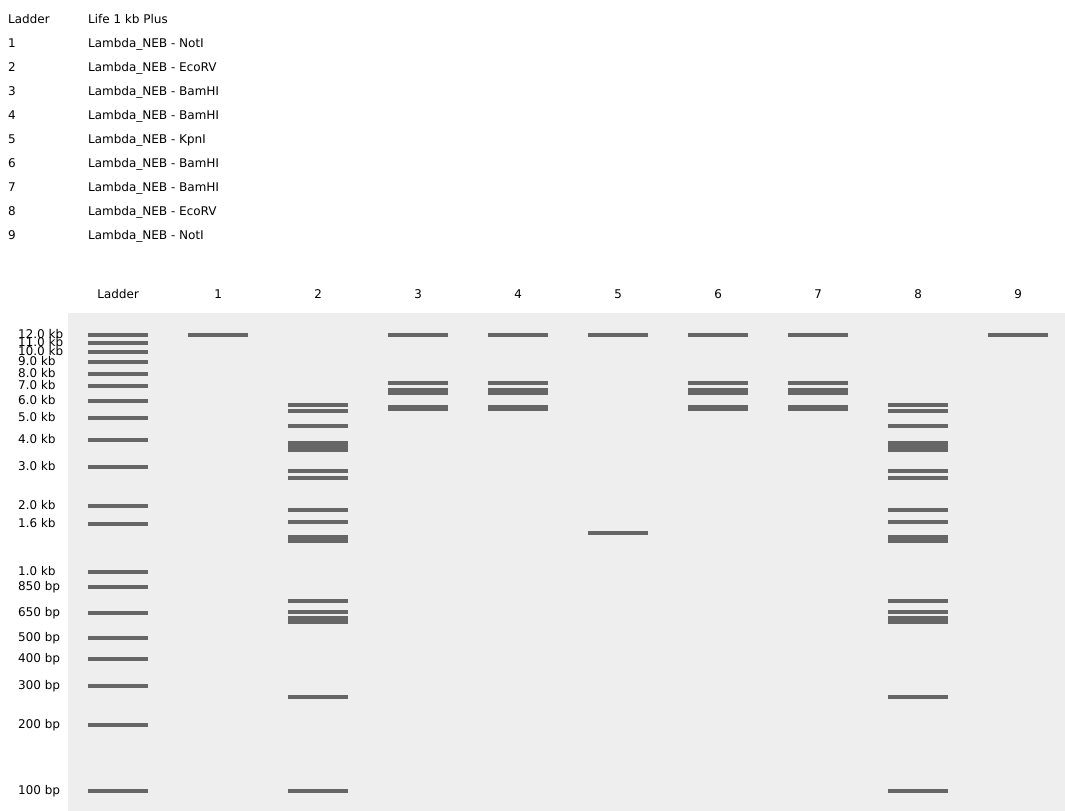
While trying to do this, I found out that the table below the enzymes in DGAI was the main thing to focus on. When I clicked on the arrows for a specific well, with a specific combination of enzymes, the table showed what enzymes were used for THAT specific result. This was I was able to find out how to replicate the DGAI gel in Benchling. For some reason, my Benchling results looked slightly different then DGAI. (side by side comparison below)
I thought maybe it was because in Benchling, it showed N/A for KpnI and SacI and in DGAI, they were selected??
I decided that to make my pattern, I’ll tinker around with different enzyme combination and see what they give me, note that down and then see what I could muster up from the patterns. I did think that maybe I could reverse engineer somehow that this combination gives these types of bands and then make a program that could somehow tell me the closest enzymes I could use to get a particular result. Like I could select the areas to keep on, like a display but all that abductive reasoning would be of no use as I wasn’t sure if it could be done. I continued with trying to make a pattern art.
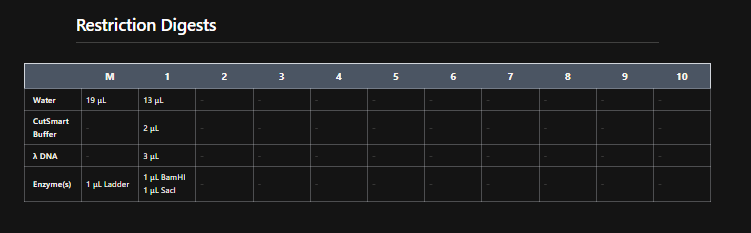
This the table that I mentioned a while ago, If you can see that in well 1, the enzymes used are BamHI and SacI. I then used the same combination in Benchling and ran a digest.
Mission Successful! I was able to get how to replicate DGAI Gels in Benchling Digest (mostly.)
Fast forward to after experimenting with multiple combos for an hour or so, I was able to make something that looked like an M. My friends said that, I do see it but to me it looked like that one cat meme (minus the whiskers and ears) in DGAI.
Then I used the table and enzymes combos from DGAI to replicate the digest in Benchling!
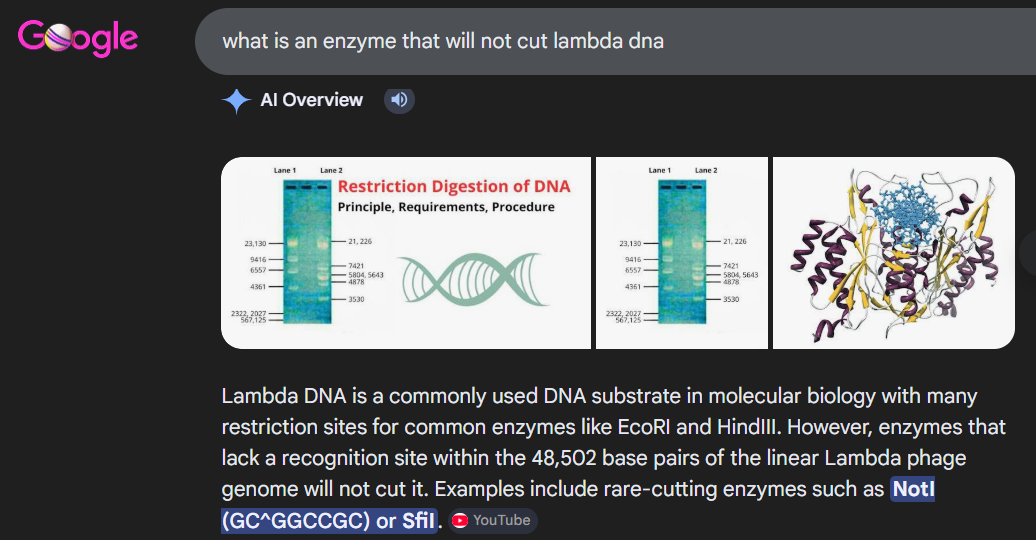
I had to get a bit crafty as Benchling didn’t allow an empty digest. I googled which enzyme doesn’t cut lambda DNA.
I used NotI in the digest to get an empty well. :) Mission two Successful! I was able to achieve the same output in Benchling.
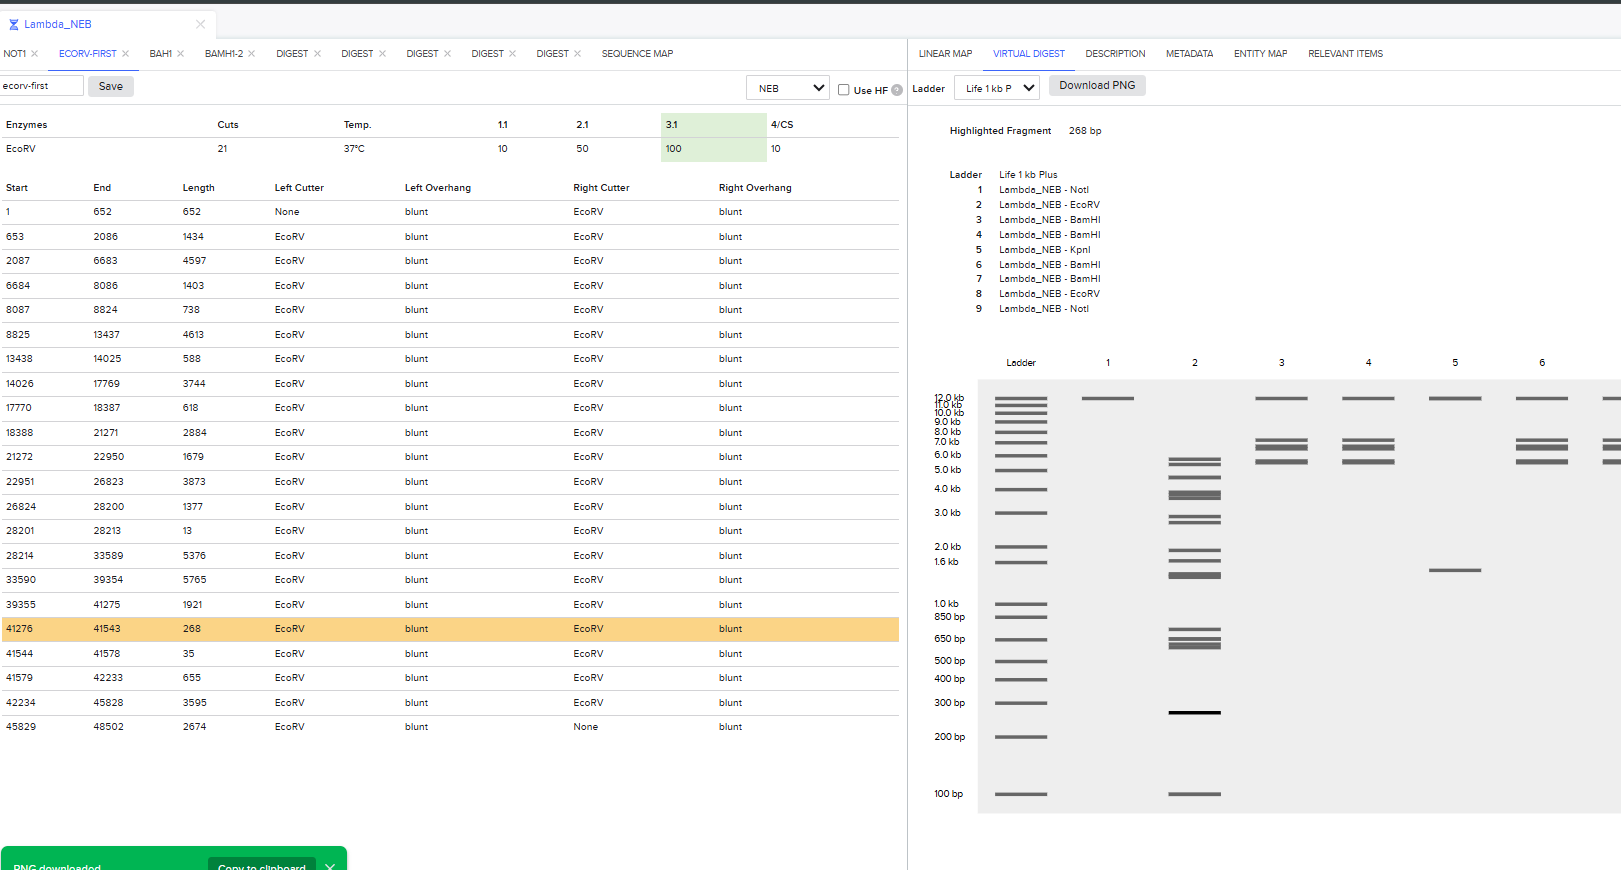
It was the end but I clicked on a band in the Benchling Gel and found out that it also shows you the exact point where the cut was made and what made THAT band. I figured that if I want to refine my art further, I can maybe use this information to my advantage.
Part 3: DNA Design
3.1. Choose your protein.
The protein that I would choose is Green Fluorescent Protein. I choose GFP because it is used a lot to track other proteins, to see expression of proteins. It’s just interesting to me that it allows us to study other proteins up close.
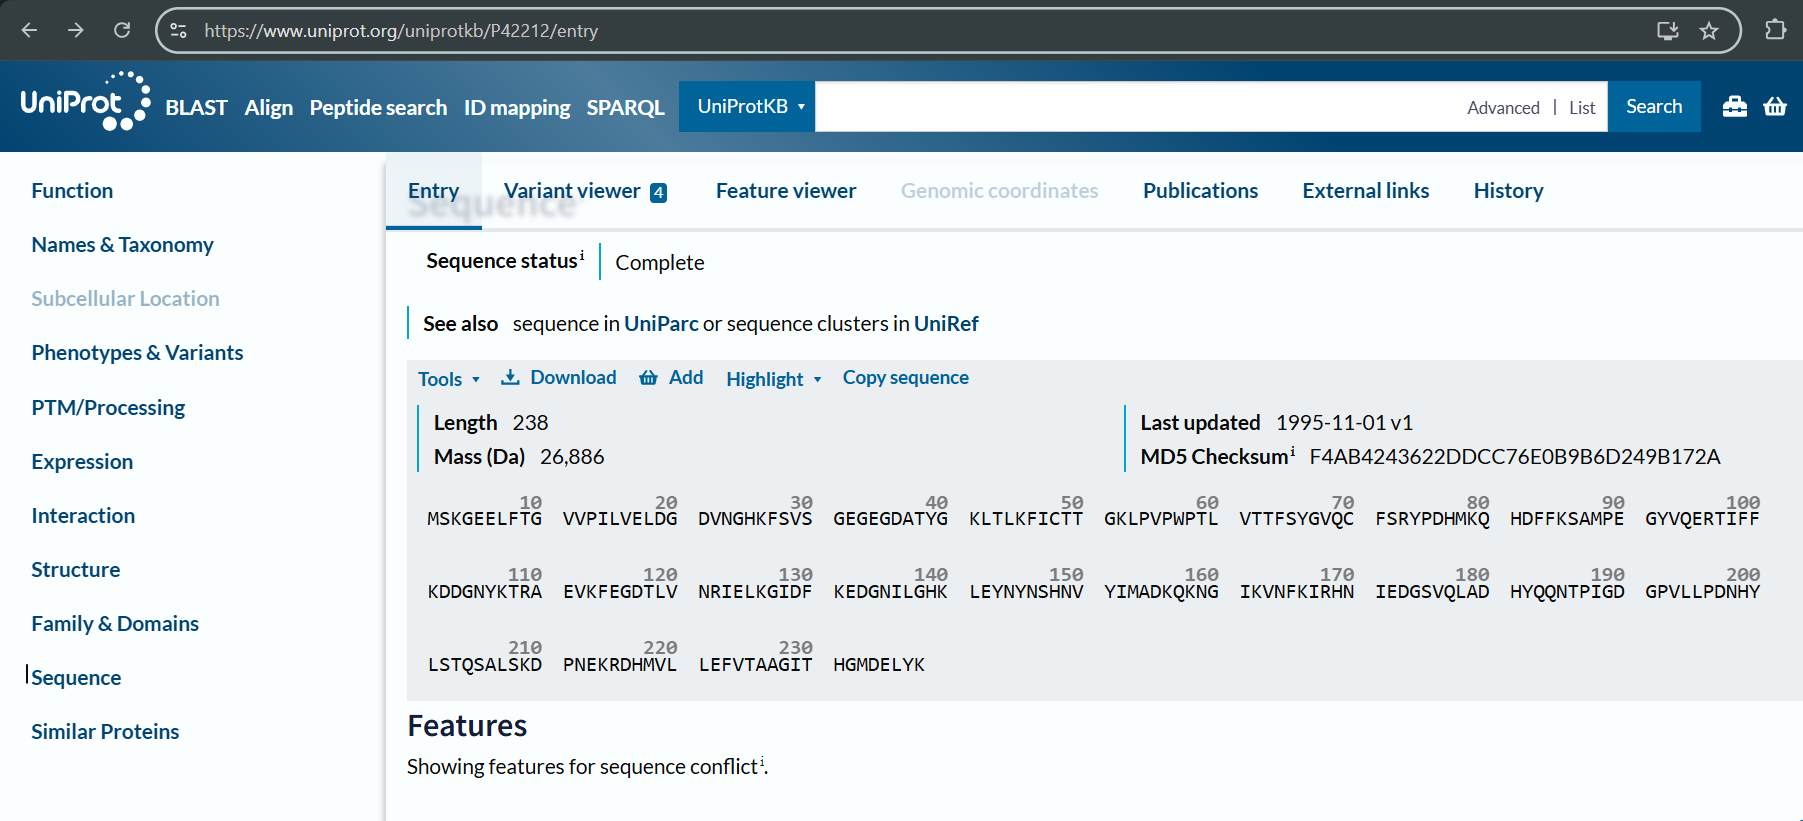
The protein sequence for GFP (I used UniProt to get it):
>sp|P42212|GFP_AEQVI Green fluorescent protein OS=Aequorea victoria OX=6100 GN=GFP PE=1 SV=1
MSKGEELFTGVVPILVELDGDVNGHKFSVSGEGEGDATYGKLTLKFICTTGKLPVPWPTL
VTTFSYGVQCFSRYPDHMKQHDFFKSAMPEGYVQERTIFFKDDGNYKTRAEVKFEGDTLV
NRIELKGIDFKEDGNILGHKLEYNYNSHNVYIMADKQKNGIKVNFKIRHNIEDGSVQLAD
HYQQNTPIGDGPVLLPDNHYLSTQSALSKDPNEKRDHMVLLEFVTAAGITHGMDELYK
3.2. Reverse Translate: Protein (amino acid) sequence to DNA (nucleotide) sequence.
The nucleotide sequence is:
>reverse translation of sp|P42212|GFP_AEQVI Green fluorescent protein OS=Aequorea victoria OX=6100 GN=GFP PE=1 SV=1 to a 714 base sequence of most likely codons. atgagcaaaggcgaagaactgtttaccggcgtggtgccgattctggtggaactggatggc gatgtgaacggccataaatttagcgtgagcggcgaaggcgaaggcgatgcgacctatggc aaactgaccctgaaatttatttgcaccaccggcaaactgccggtgccgtggccgaccctg gtgaccacctttagctatggcgtgcagtgctttagccgctatccggatcatatgaaacag catgatttttttaaaagcgcgatgccggaaggctatgtgcaggaacgcaccatttttttt aaagatgatggcaactataaaacccgcgcggaagtgaaatttgaaggcgataccctggtg aaccgcattgaactgaaaggcattgattttaaagaagatggcaacattctgggccataaa ctggaatataactataacagccataacgtgtatattatggcggataaacagaaaaacggc attaaagtgaactttaaaattcgccataacattgaagatggcagcgtgcagctggcggat cattatcagcagaacaccccgattggcgatggcccggtgctgctgccggataaccattat ctgagcacccagagcgcgctgagcaaagatccgaacgaaaaacgcgatcatatggtgctg ctggaatttgtgaccgcggcgggcattacccatggcatggatgaactgtataaa
I used Bioinformatics.org Reverse Translation tool to reverse translate the AA sequence to the DNA sequence.
3.3. Codon optimization.
I would optimize the codon usage for E.coli because it grows fast, it is well-researched. The thing about GFP is that it will not be the main protein of interest but rather it’ll be used to study one. So if I have a protein that I have expressed in a certain microorganism, then I will have to optimize the codon according to that.
About why do we optimize codons, I know this! I once had a question in my mind that why is thermos thermophilus heat resistant. Why can it live in such high temperatures? I basically went on a bioinformatics quest. To answer the question so I. First, my hypothesis was that maybe it has more GC content because GC has three hydrogen bonds and just having overall more hydrogen bonds would make it more heat stable. Then to validate my hypothesis, I had to see what genes it had and I had to compare it genes with. E coli. I saw that the codons with GC were preferred more. (Codon Bias) https://www.youtube.com/watch?v=1Jrawq9fnMs&t=1791s
The reason that we optimize codons is because certain microorganisms have their own preferences of codons to use. It could be so that if the organism has a preference of a certain codon then that tRNA which is required for the protein expression is in abundance and if you pick a codon whose tRNA is not readily available in that organism, then there is a chance that because of the lack of the tRNA the protein might not be expressed. Therefore in order to increase the chances of expression we have to optimize the codons for our nucleotide sequence.
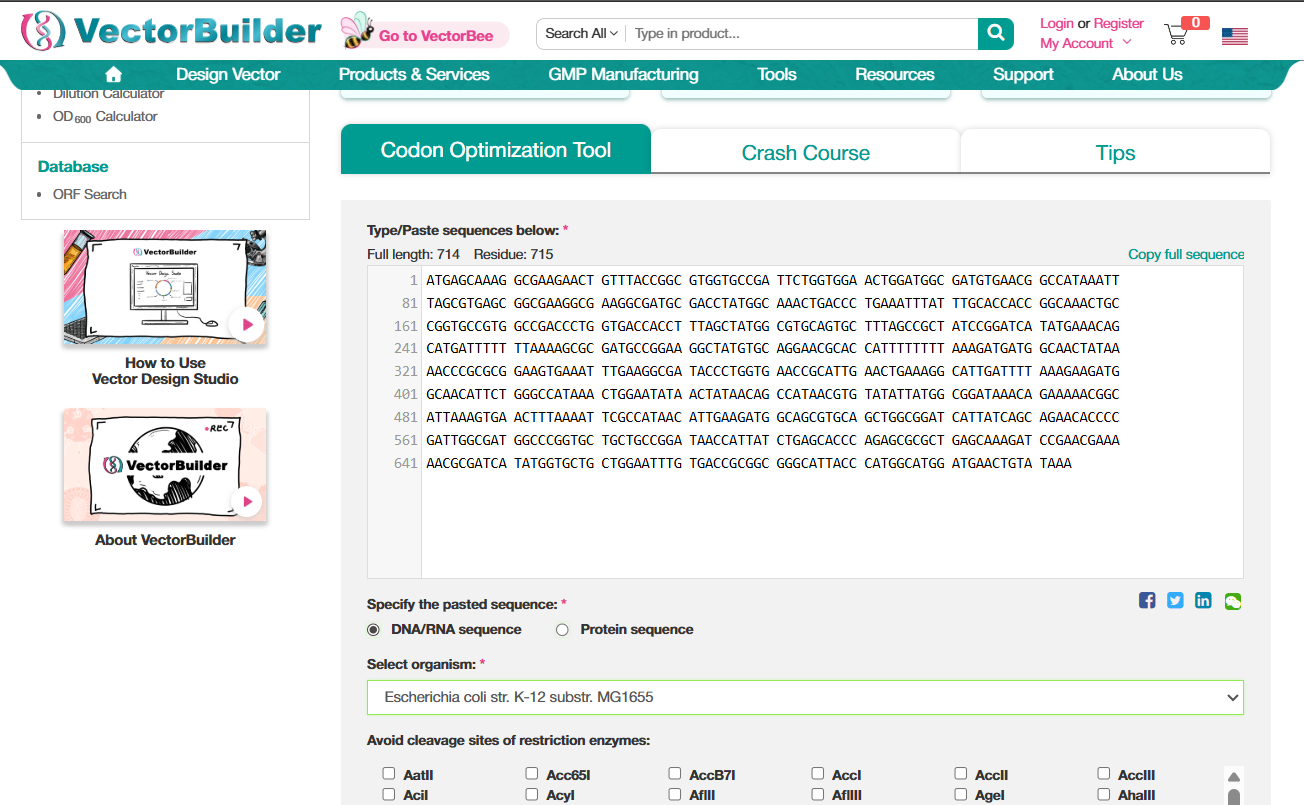
I used VectorBuilder to optimize the codons. The interface is pretty intuitive. Just paste your sequence, select the organism. (There was also an option to avoid sites for certain restriction enzymes, I think that is to avoid having the sites of the enzymes that we might work with, so that our DNA doesn’t get damaged while working with something else?)
GFP protein DNA sequence with codons optimized for E.Coli ATGAGCAAAGGCGAAGAACTGTTTACCGGCGTGGTGCCGATTCTGGTGGAACTGGATGGCGATGTGAATGGCCATAAATTTAGCGTGAGCGGCGAAGGTGAAGGCGATGCGACCTATGGCAAACTGACCCTGAAATTTATCTGCACCACCGGTAAACTGCCGGTGCCGTGGCCGACCCTGGTGACCACCTTCAGCTACGGCGTGCAGTGTTTTAGCCGCTACCCGGATCATATGAAACAGCATGATTTTTTTAAAAGCGCGATGCCGGAAGGCTATGTGCAGGAACGCACCATTTTTTTCAAAGATGATGGCAATTACAAAACCCGTGCCGAAGTGAAATTCGAAGGCGATACCCTGGTGAATCGCATTGAACTGAAAGGCATTGATTTTAAAGAAGATGGTAACATTCTGGGCCACAAACTGGAATACAACTATAACAGCCATAACGTGTACATTATGGCGGATAAACAGAAAAATGGCATTAAAGTGAACTTTAAAATTCGCCATAACATTGAAGATGGCTCAGTGCAGCTGGCGGATCACTATCAGCAGAACACCCCGATTGGCGATGGCCCGGTTCTGCTGCCGGATAACCACTATCTGAGCACCCAGAGCGCGCTGTCGAAAGATCCGAACGAAAAACGCGATCACATGGTGCTGCTGGAATTTGTGACCGCCGCGGGCATCACCCATGGTATGGATGAACTGTATAAA
3.4. What do we do with the sequence?
The sequence can be used to chemically synthesize the DNA and then be put into a plasmid. The plasmid can then be inserted into our host organism (via electroporesis?) and then our protein can be expressed.
3.5.
Describe how a single gene codes for multiple proteins at the transcriptional level.
A single gene can code for multiple proteins via something called ‘Alternative Splicing’. Different combinations of exons are joined together from same pre-mRNA, to create varied mRNA molecules, this allows one gene to produce multiple protein isoforms (variants).
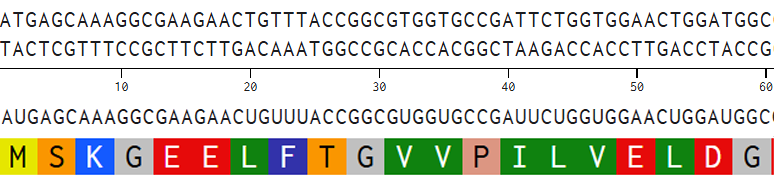
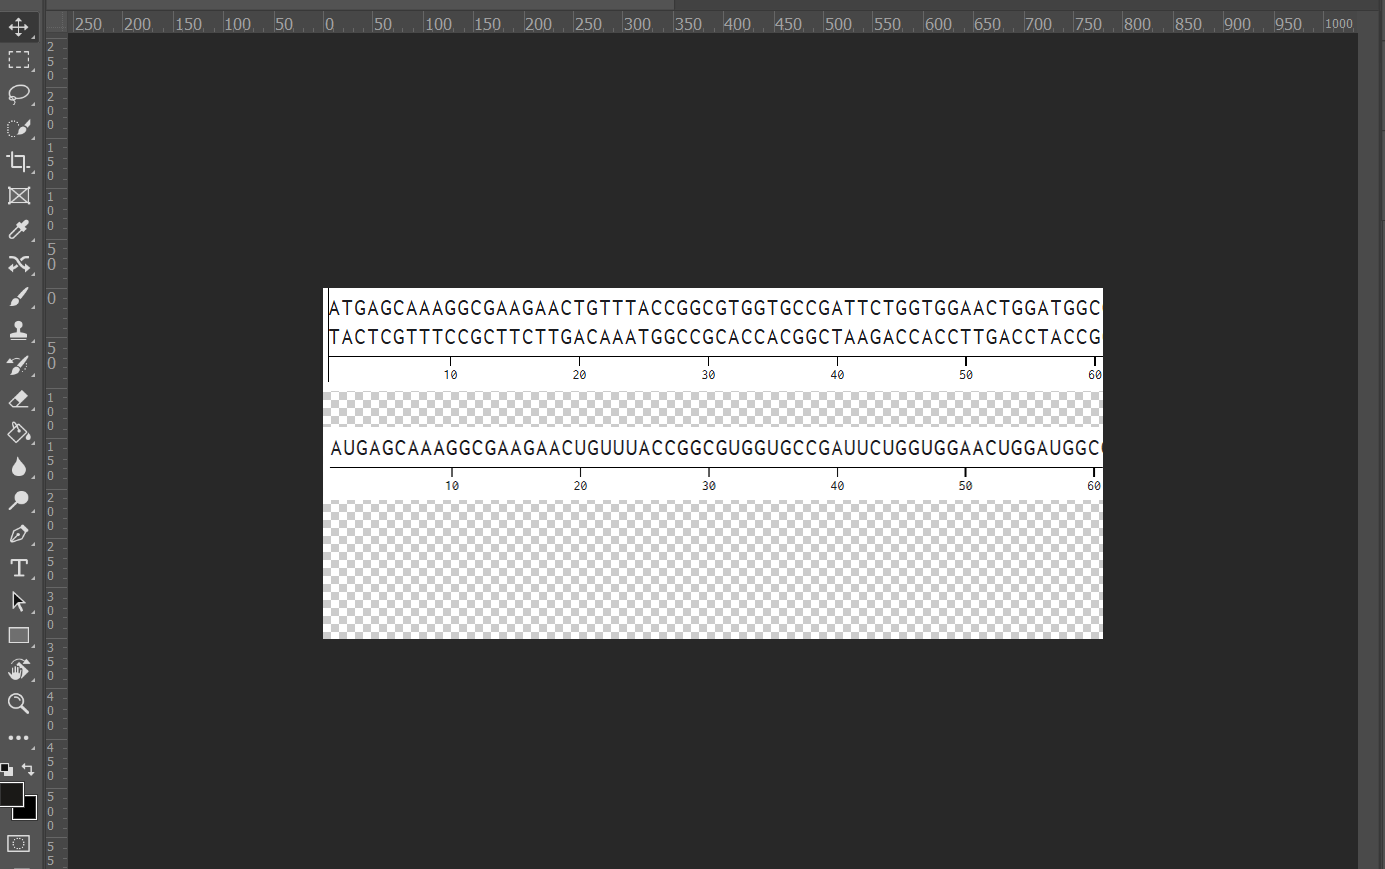
I aligned the DNA sequence, the transcribed RNA, and also the resulting translated Protein!!! (Using Photoshop, stitching together screenshots from Benchling)
BTS: Aligning Sequences in Photoshop
Part 4 : Fake Twist DNA Synthesis Order
I just created a account using the ‘Sign Up’ Button. Pretty simple stuff really. Just add details, set a password. In the organization field I added HTGAA and Lab = 2026. I didn’t really think too much. I verified my email and I was in! I didn’t have to create a Benchling account as getting through Part 1 of the HW required using Benchling, so I already had an account.
4.2. Build Your DNA Insert Sequence
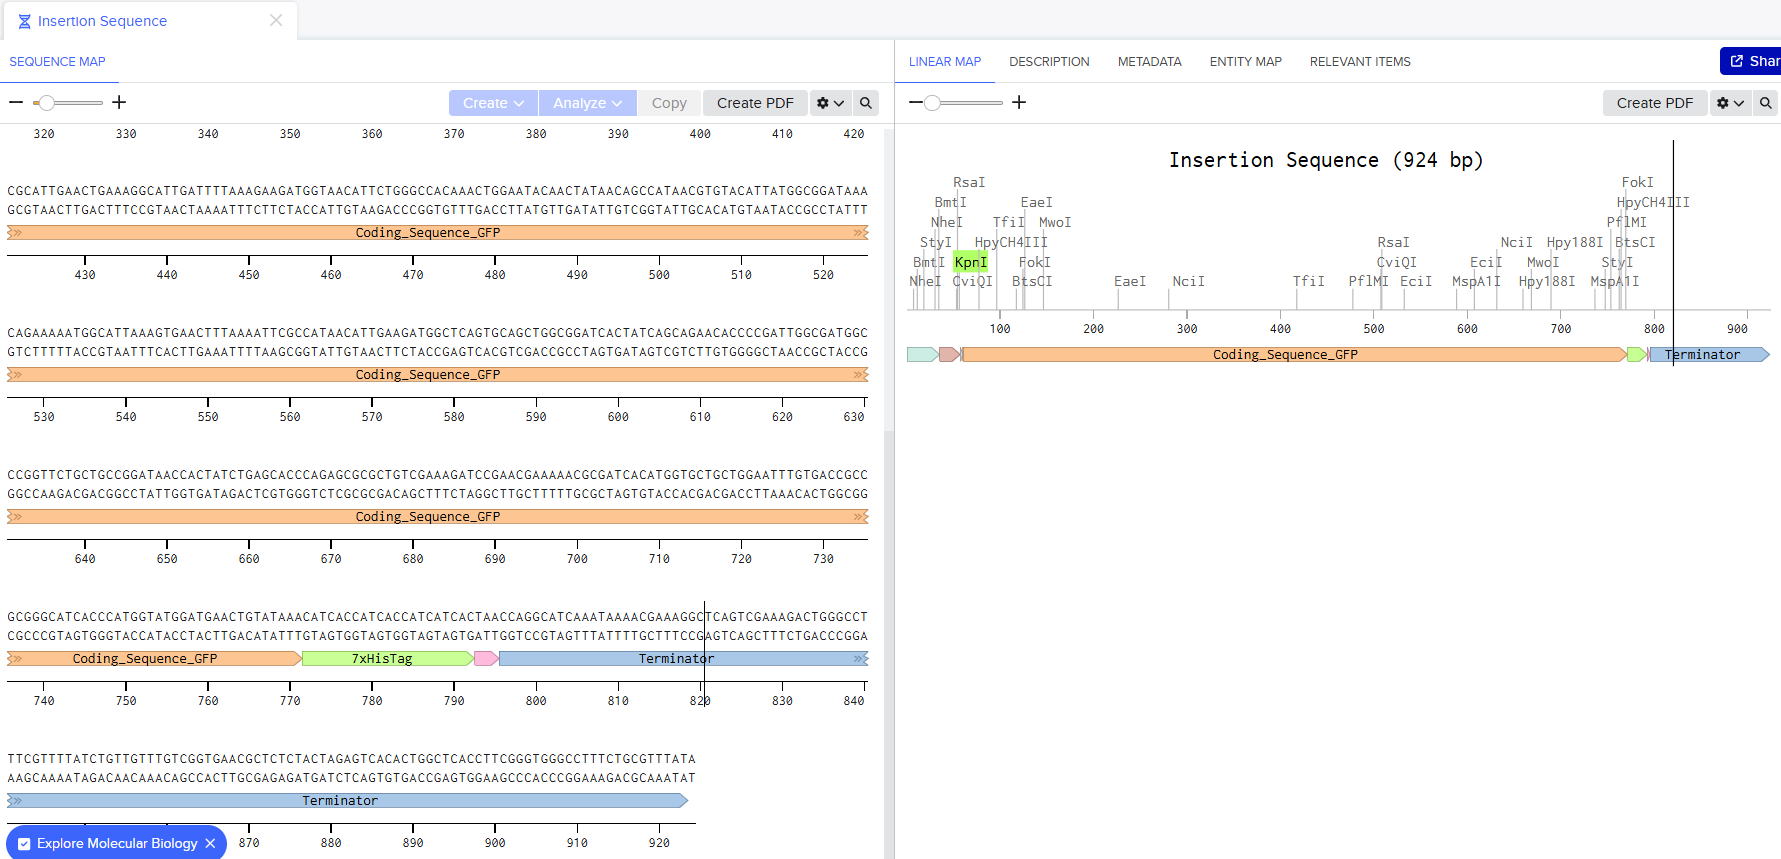
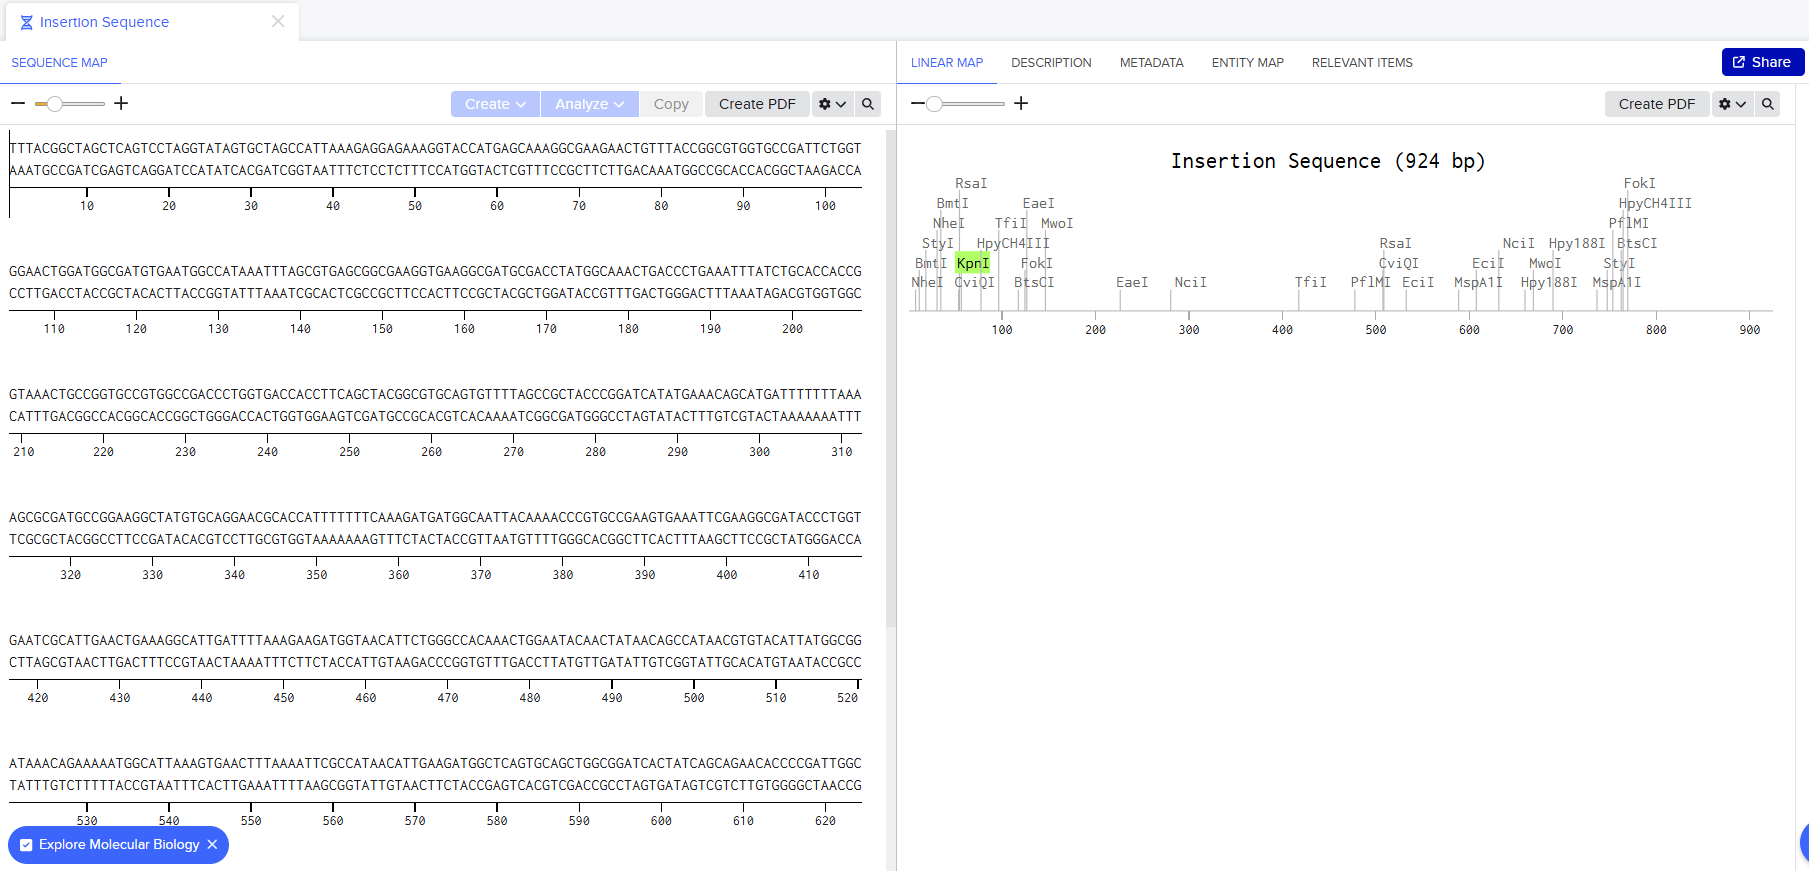
I imported the DNA Sequence into Benchling, just like from Part 1. Selected Linear topology as this is meant to be inserted into a circular vector of our choice. As I was going ahead, i realized that the exercise is already making use of GFP as an example. (well, good for me :))
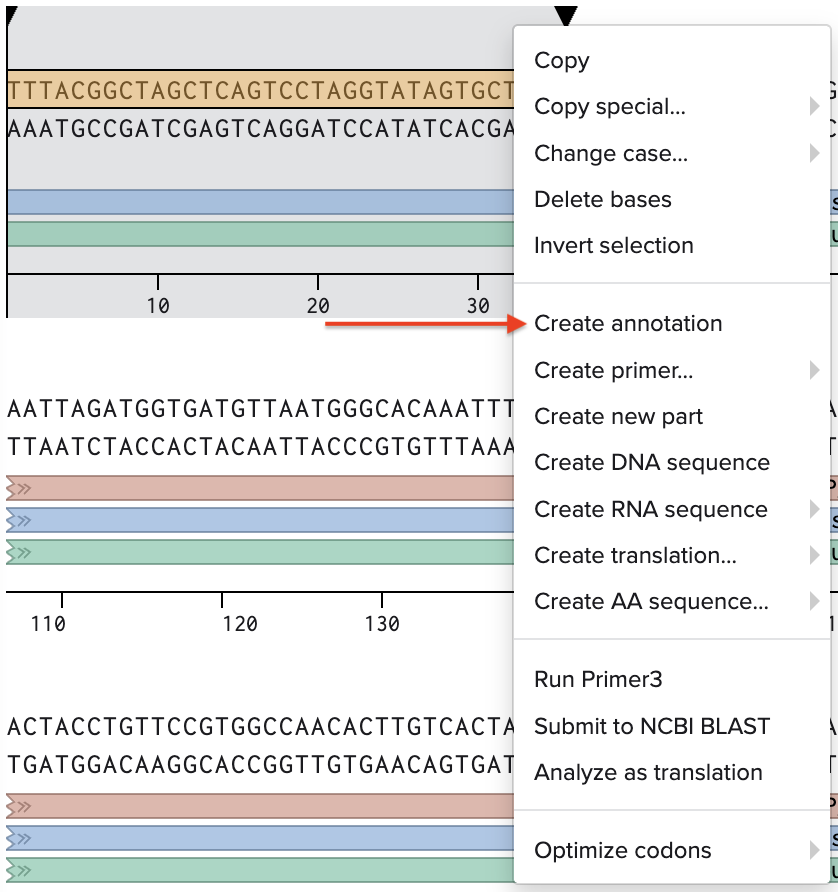
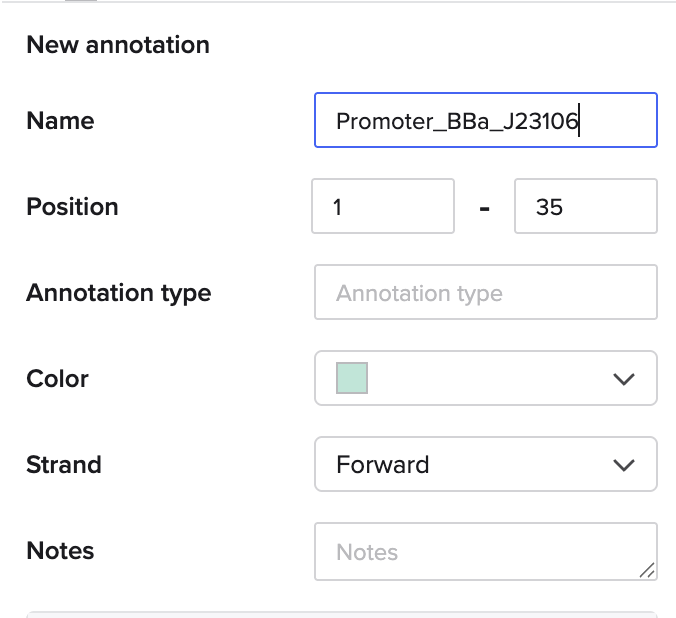
I went through the sequences given in the HW document and then pasted the sequences into the Benchling file one after the other (Just the way we imported a sequence in Part 1, but here I had to copy everything one by one and then paste). I annotate the sequences based on the information in the HW document. (screenshots below on how, from the HW Doc)
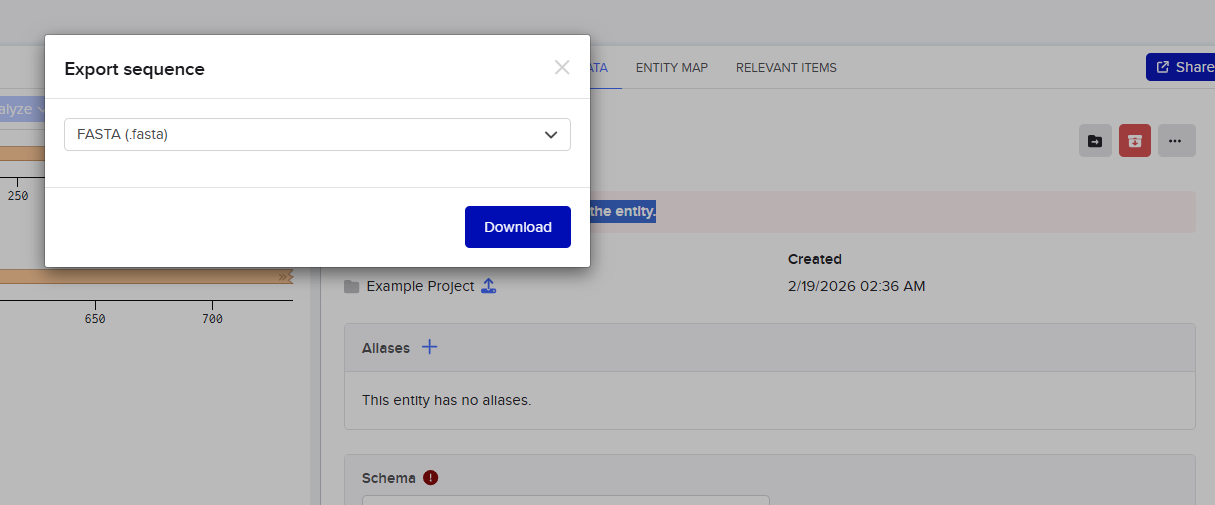
I then went and exported the sequence, by clicking on the metadata tab and then clicking on the three dots and selecting export sequence, I selected FASTA format to export.
4.3. Benchling to Twist: continuing with our fake order
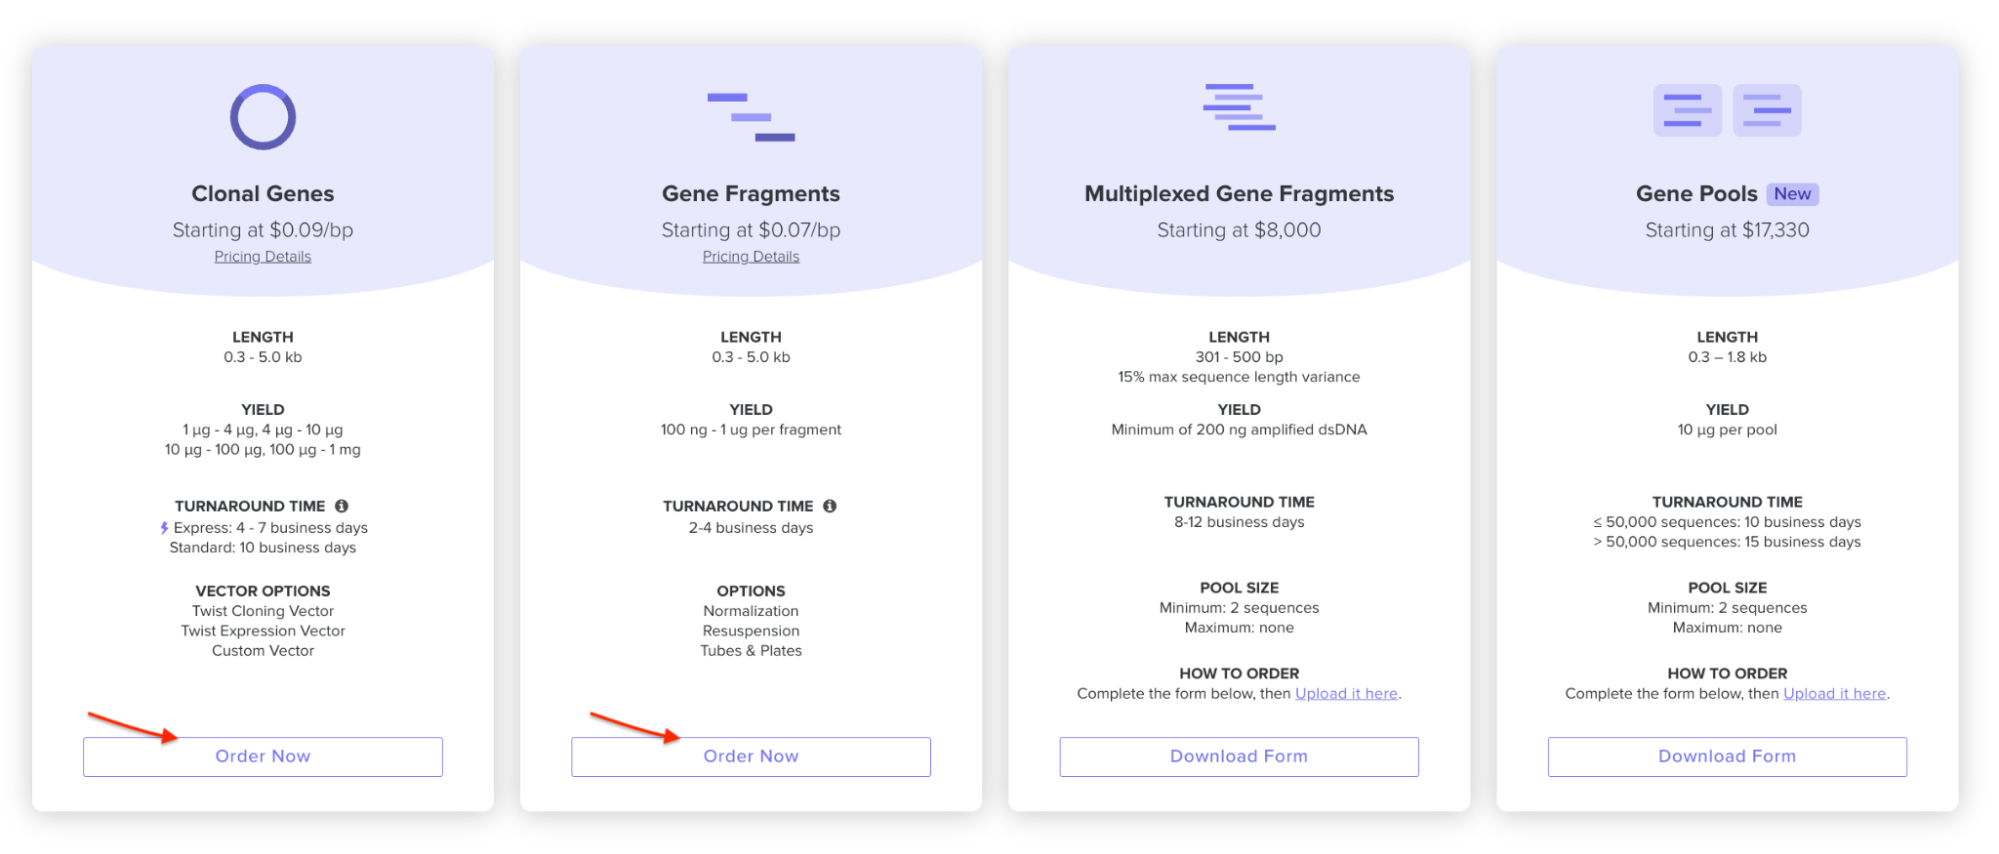
On the Twist E-commerce platform, I went and selected Genes -> Clonal Genes. (Screenshot from HW Doc)
Then I had to import my sequence, I drag and dropped the FASTA file that I downloaded from Benchling.
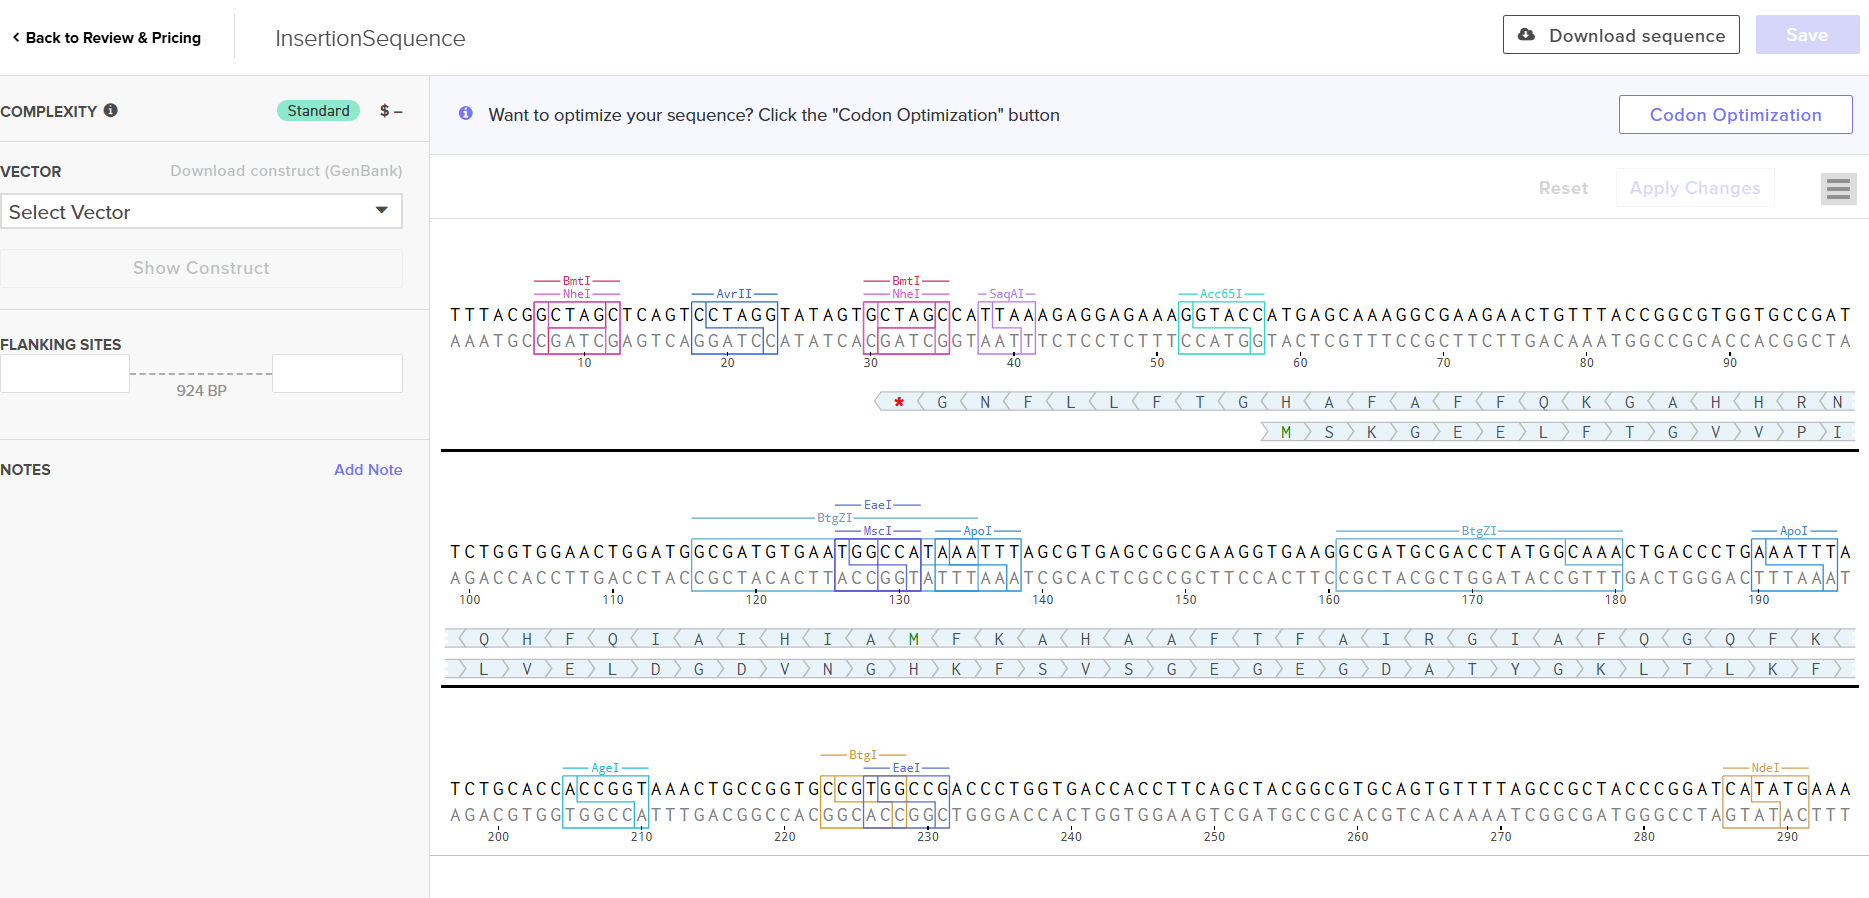
After the sequence had been uploaded successfuly, I clicked on the sequence and I saw this screen. (the twist platform also allows you to do codon optimization, niceee!)
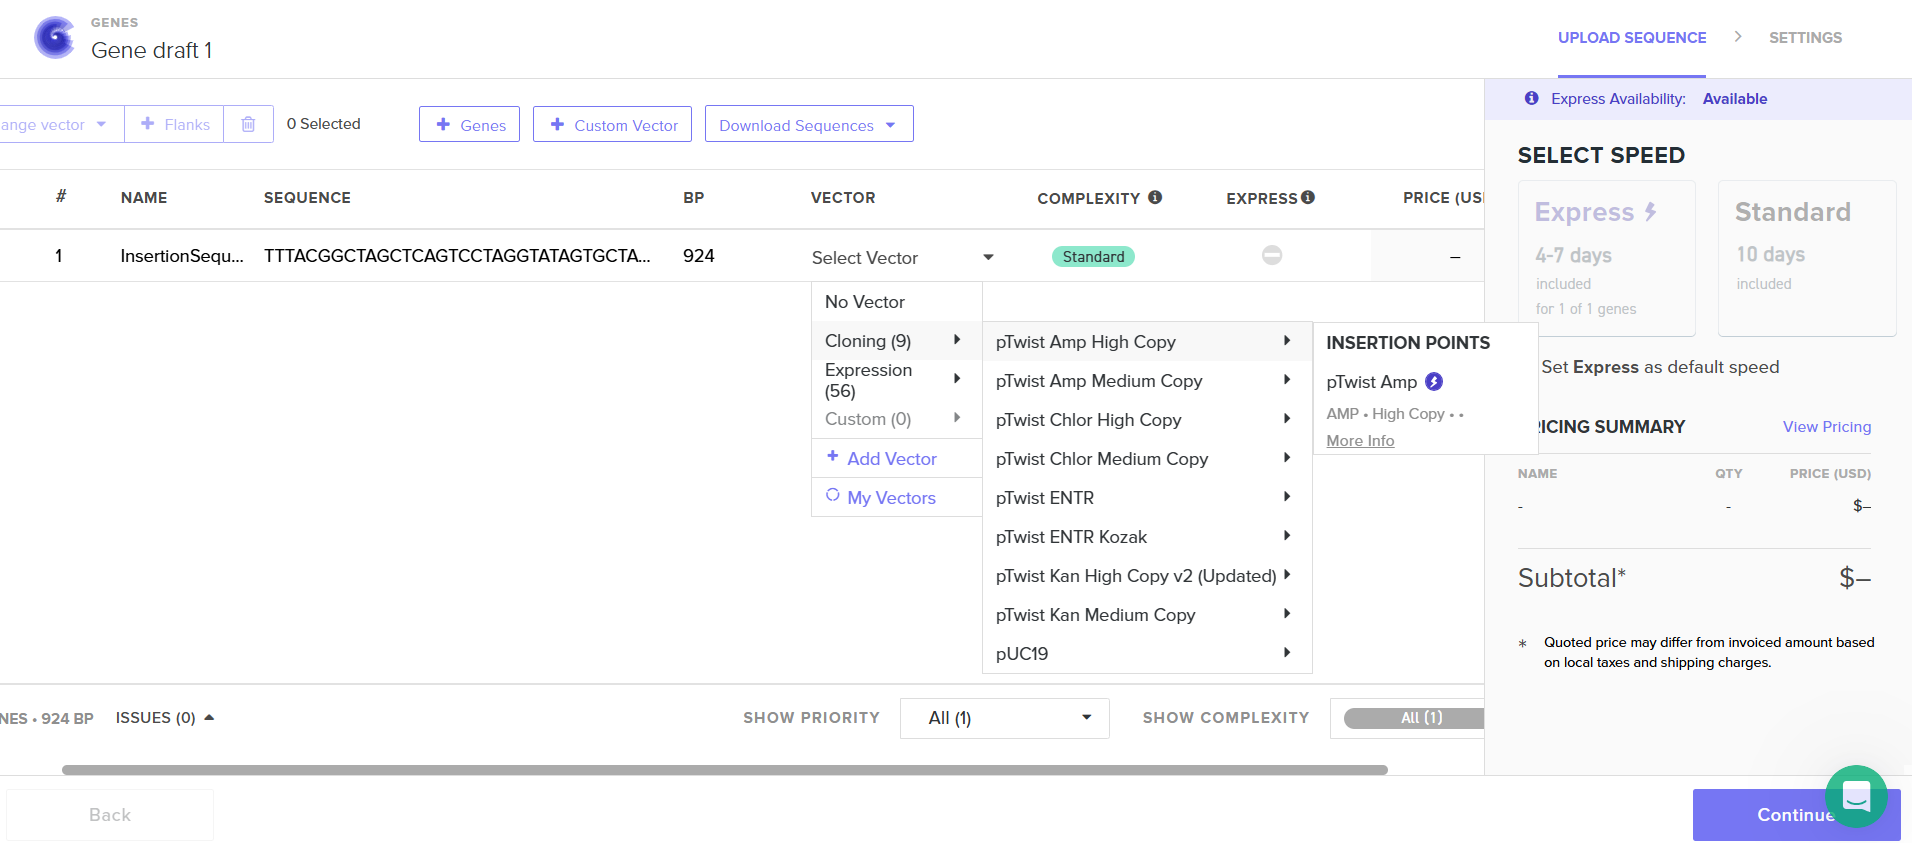
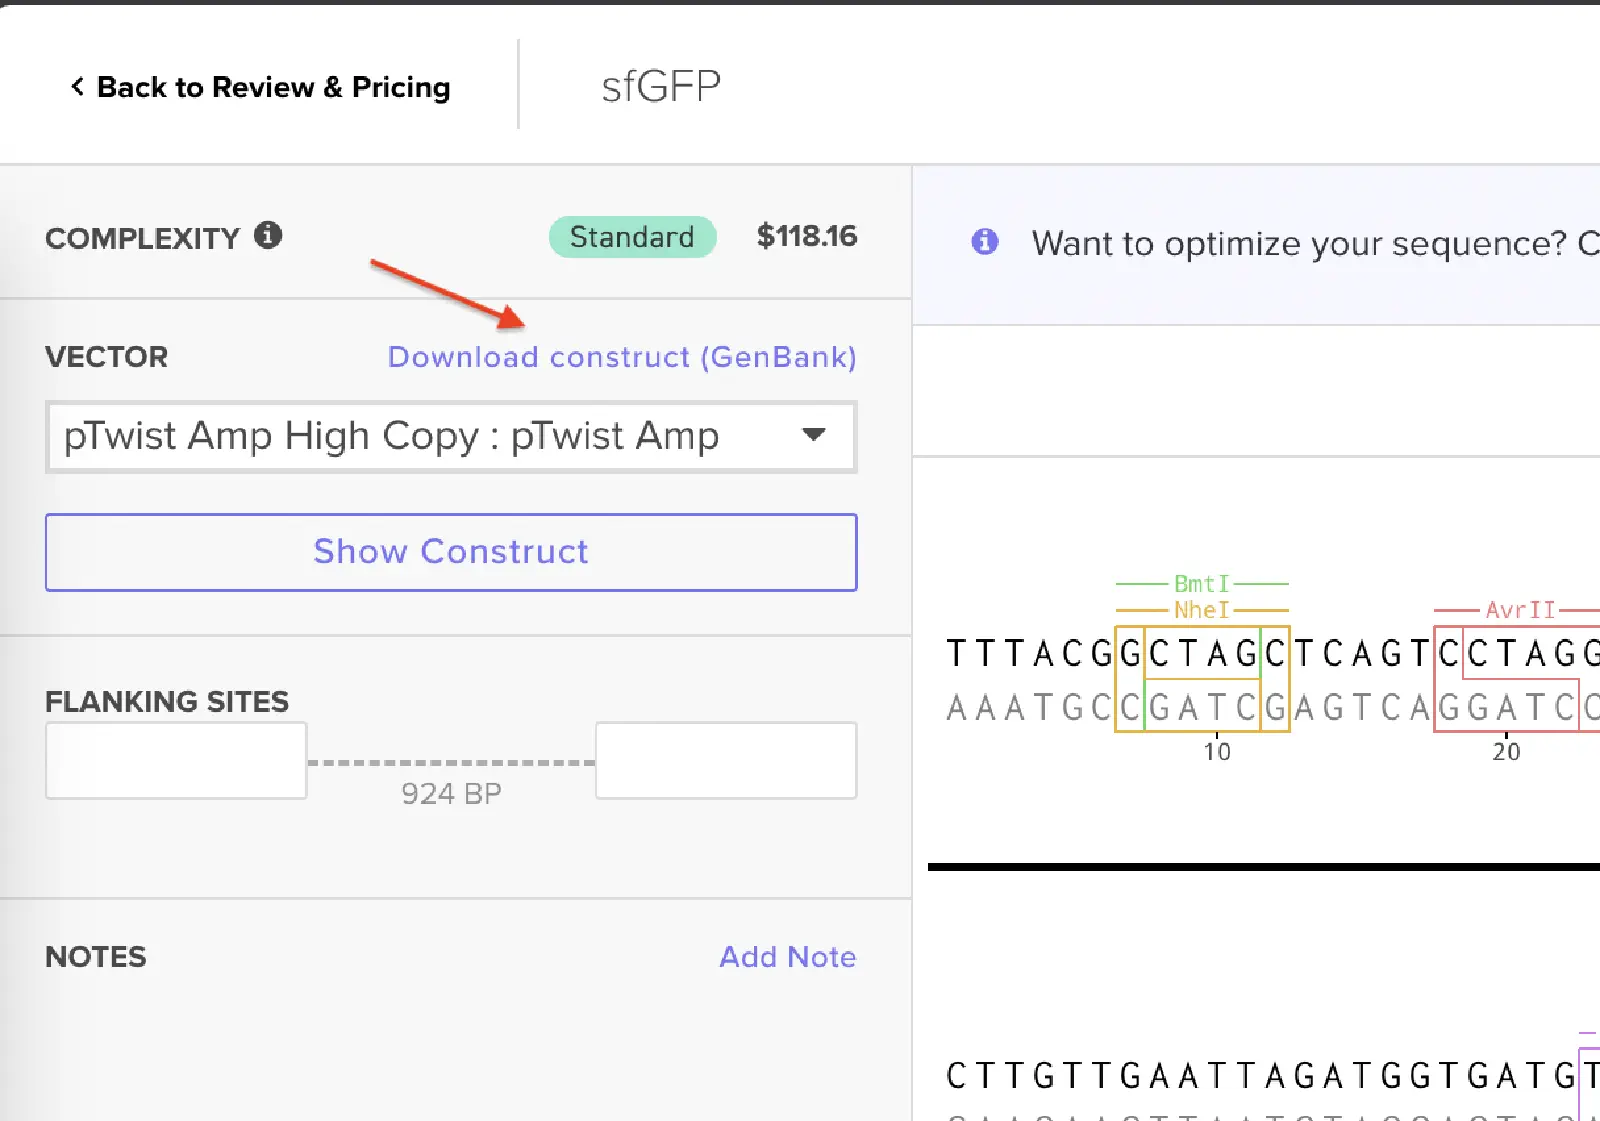
I had to refer to the HW Doc to know what was next. Turns out I had to select a vector, I did that by clicking on select vector option on the sequence, a drop-down dialog allowed me to choose a vector in ‘Cloning’. I chose pTwist Amp High Copy based on the HW Doc.
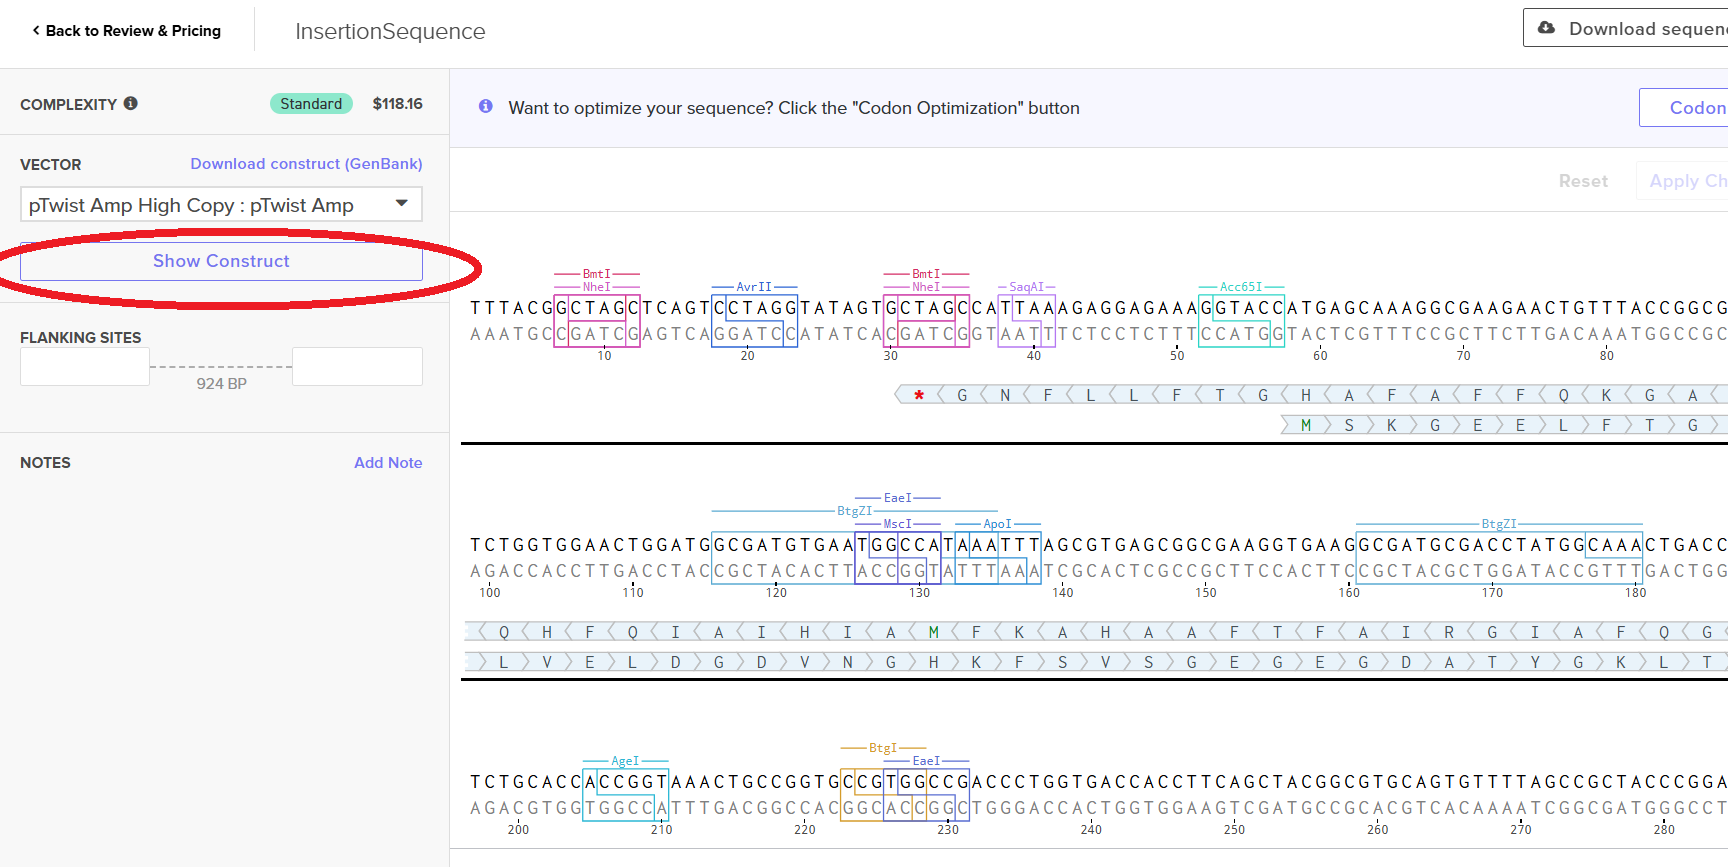
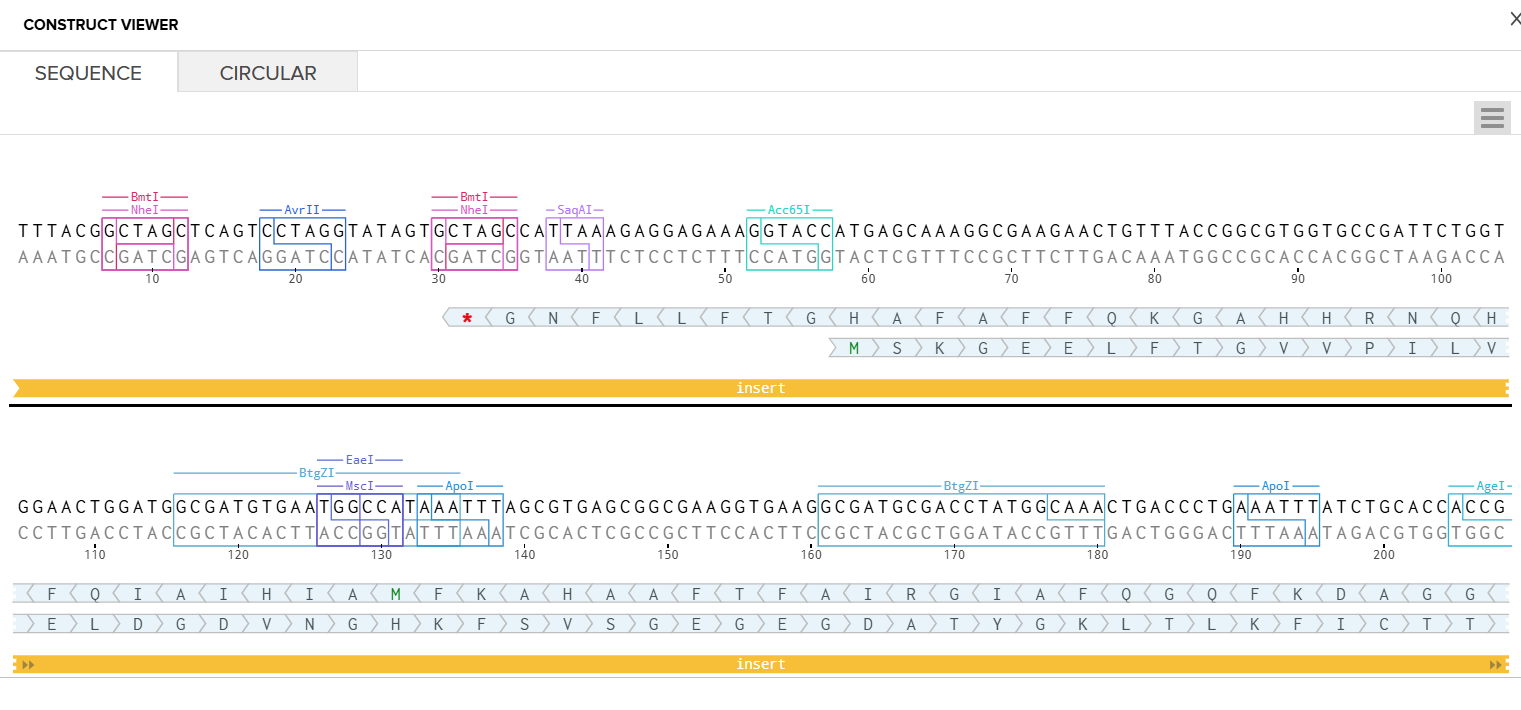
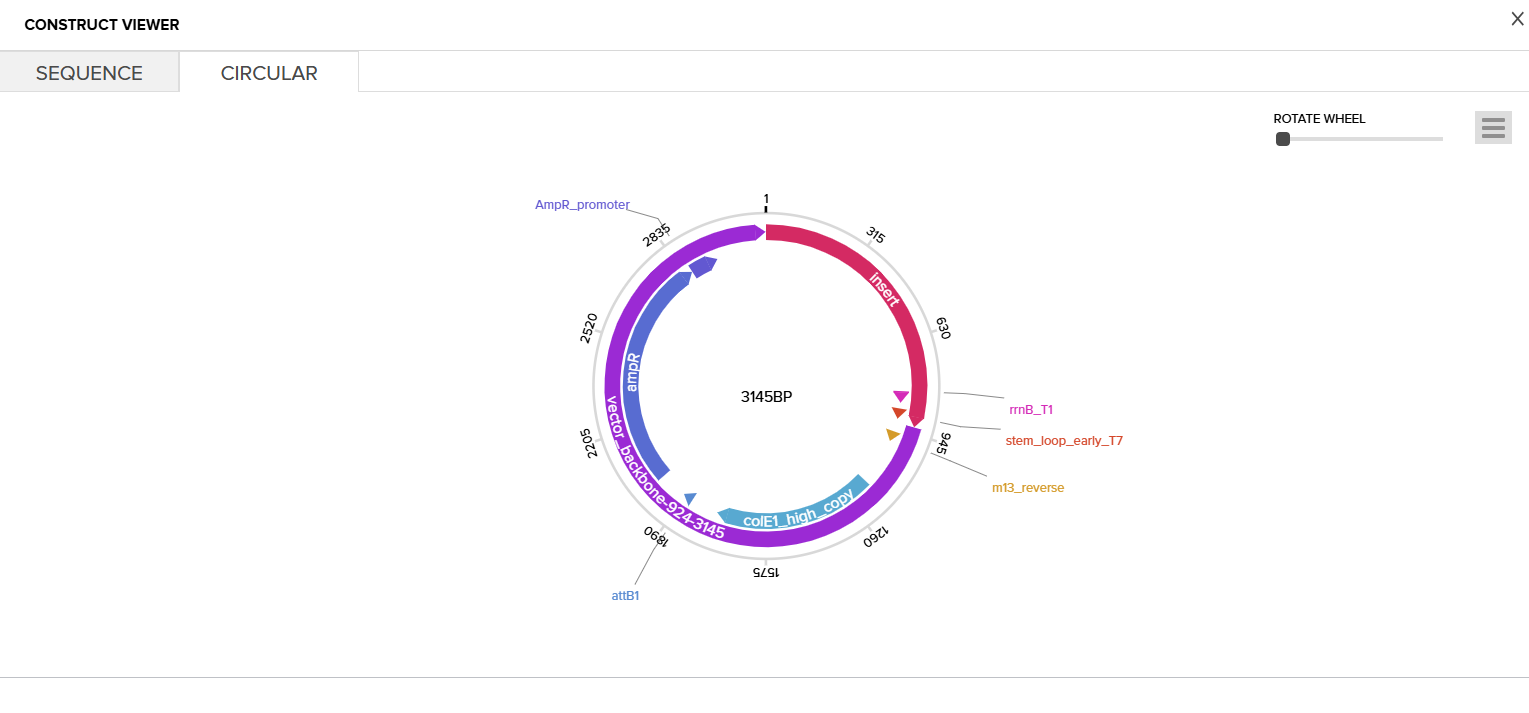
Then I clicked on my sequence again to see the ‘construct’. I pressed the ‘Show Construct’ button to view the construct and I was able to see two different tabs.
Sequence
Circular
Then I clicked on the Download Construct link to download the GenBank file to my construct. (screenshot below, from HW Doc)
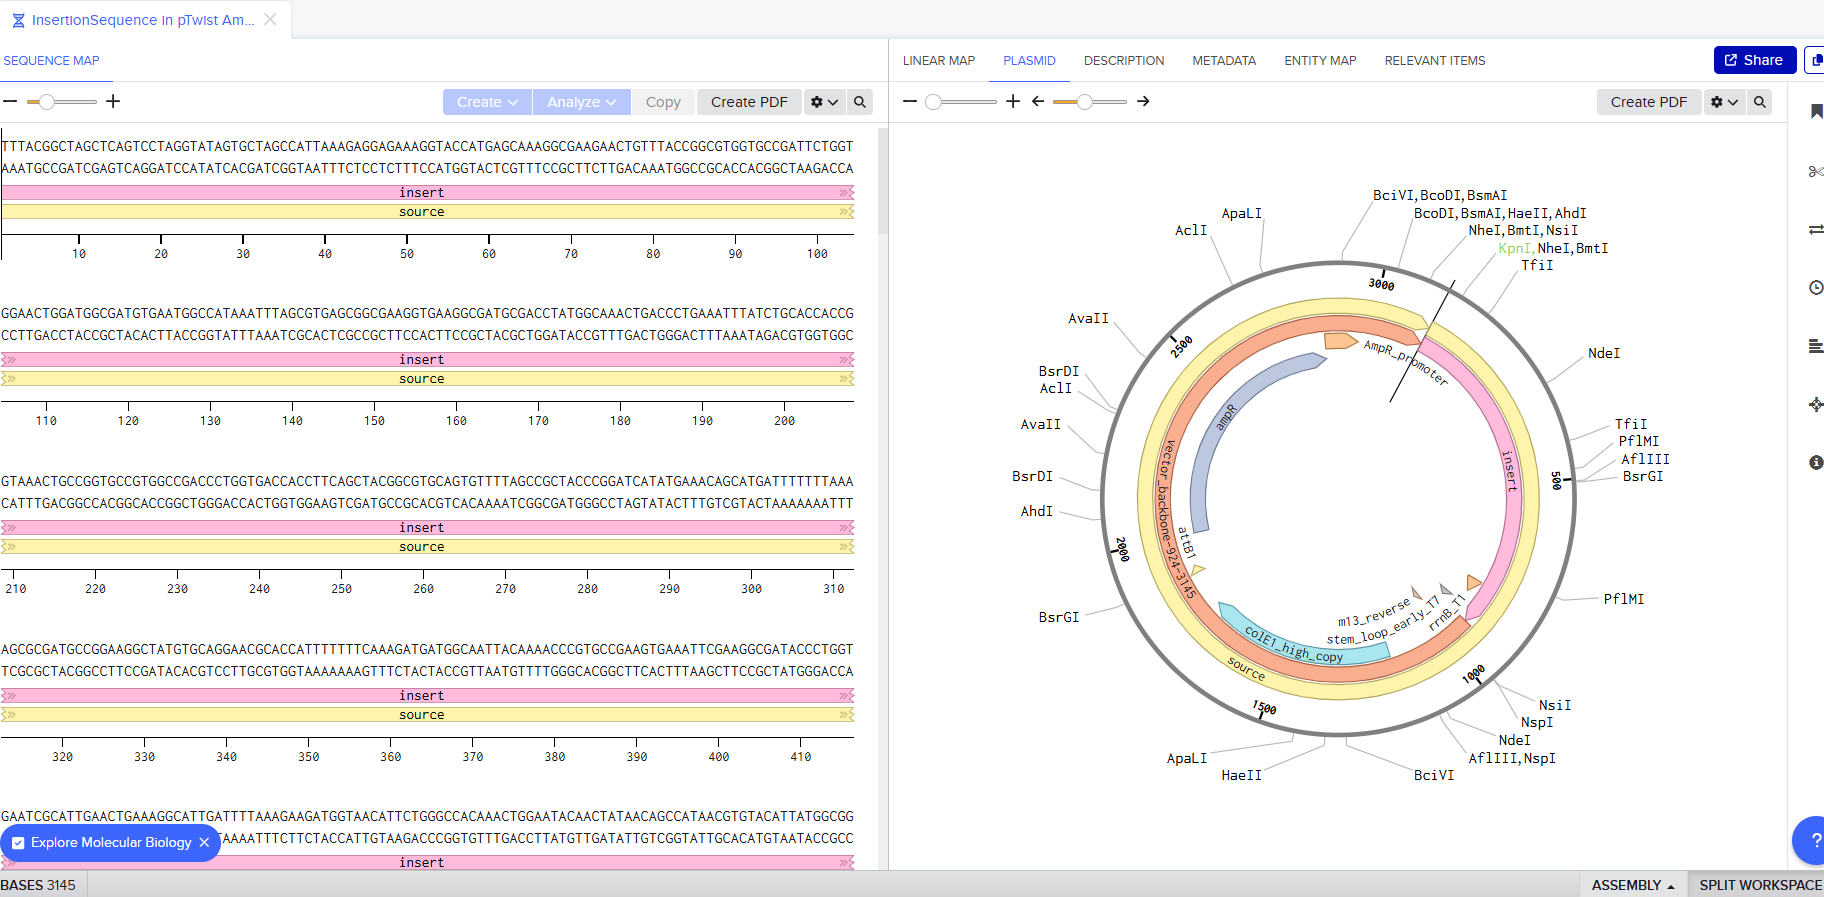
I downloaded the GenBank file of my construct and imported it to Benchling.
Part 4: Done! I built a plasmid with my own DNA of choice that is ready to insert! exhilirating feeling!
Part 5: DNA RW+
5.1 DNA Read
(i) What DNA would you want to sequence (e.g., read) and why?
I would want to sequence my own DNA. I’ve wanted to understand for a long while, what makes me, ‘ME’. What is my ancestry, what genes have I carried. Why am I naturally strong but fat? Why can I conserve muscle by little workout but fat just never budges? It might seem a bit small but yes I would want to read my own DNA first. (priority-wise)
(ii) In lecture, a variety of sequencing technologies were mentioned. What technology or technologies would you use to perform sequencing on your DNA and why?
I would use WGS (Whole Genome Sequencing) using Illumina (Next-Gen Sequencing) as to analyze my genome, I would requite a method that covers the entire genome with high accuracy. Illumina’s NGS offers that high capability.
Is your method first-, second- or third-generation or other? How so?
The method is second generation as first generation methods like Sanger sequencing make use of chain-termination methods to sequence DNA and the third generation methods provide single molecule real time reading. WGS uses parallel sequencing.
What is your input? How do you prepare your input (e.g. fragmentation, adapter ligation, PCR)? List the essential steps.
The input would be a DNA Sample of mine (blood/saliva). The steps to prepare would include fragmentation, (breaking the DNA down using enzymes) attaching adapters to allow primers to bind and if the sample is little, then PCR (to amplify the DNA, to make sure there’s enough to sequence)
What are the essential steps of your chosen sequencing technology, how does it decode the bases of your DNA sample (base calling)?
The fragments of DNA attach to the flow cell and undergo bridge amplification to create clusters of identical strands. The fluoroscently labeled reversible terminator nucleotides are added and then the polymerase adds a single matching base to the growing strand. (Thus this method is also called Sequencing by Synthesis) then a sensor captures the fluoroscent signal to identify which base was added, the terminator and dye are cleaved off, then next cycle begins.
What is the output of your chosen sequencing technology?
The output of this sequencing method is FASTQ files. They are like FASTA files but in FASTQ files theres also a Q (quality score) for every base, indicating how confident the machine is.
5.2 DNA Write
(i) What DNA would you want to synthesize (e.g., write) and why?
I would want to synthesize the PprI gene from Deinococcus radiodurans. Ever since I heard about a bacterium, surviving Chernobyl levels of radiation. I was pretty fascinated by it. I would want it synthesize its DNA and study it further, perhaps the genes for radiation resistance can be expressed in other organisms to help them operate in radiation heavy environments.
(ii) What technology or technologies would you use to perform this DNA synthesis and why?
I would use the phosphoramidite oligonucleotide synthesis method for DNA synthesis as to I would need accurate synthesis to create gene sequences to insert in other organisms.
What are the essential steps of your chosen sequencing methods?
The first step is In-Silico Design, breaking down the gene of interest into shorter chunks. Removing the chemical cap from previous base to make it reactive then add the next nucleotide to the growing chain. Blocking strands that didn’t accept the new base then oxidation to make the bases stable. Once all the short fragments are made on the silicon chip, they are released and then stitched together to form the full length genes.
What are the limitations of your sequencing method (if any) in terms of speed, accuracy, scalability?
High GC sequences are difficult to synthesize because they form secondary structures and they also have high melting temperatures, which can cause synthesis to fail or introduce errors.
5.3 DNA Edit
(i) What DNA would you want to edit and why?
This might be a bit controversial but I would want to edit my MSTN gene and try and tweak the gene for lower myostatin expression. I would want to make myself more muscular. I am aware however that the cascading effects could be unwelcome and lead to disorders. That is why this is just hypothetical.
(ii) What technology or technologies would you use to perform these DNA edits and why?
The best method I know of CRISPR. CRISPR is the most programmable and efficient method to edit specific genes.
How does your technology of choice edit DNA? What are the essential steps?
CRISPR makes use of a Guide RNA (gRNA) that binds to the Cas9 protein and directs it to the specific DNA sequence in the MSTN gene that matches the guide. The Cas9 nuclease creates a Double-Strand Break at that precise location. The cell then repairs the breakage. If we want to add a gene we provide a template, and the cell uses homology-directed repair to copy the new sequence into the DNA.
What preparation do you need to do (e.g. design steps) and what is the input (e.g. DNA template, enzymes, plasmids, primers, guides, cells) for the editing?
We have to design the sgRNA to ensure it specifically targets the gene of interest with minimal off-target effect potential. Input materials are Cas9 nuclease, gRNA, Template DNA
What are the limitations of your editing methods (if any) in terms of efficiency or precision?
Off-target effects- the nuclease might accidentally cut similar sequences elsewhere and cause mutations.
Getting the gRNA and Cas9 into the cell is difficult.
Not all cells get edited.
Week 3 HW: Lab Automation
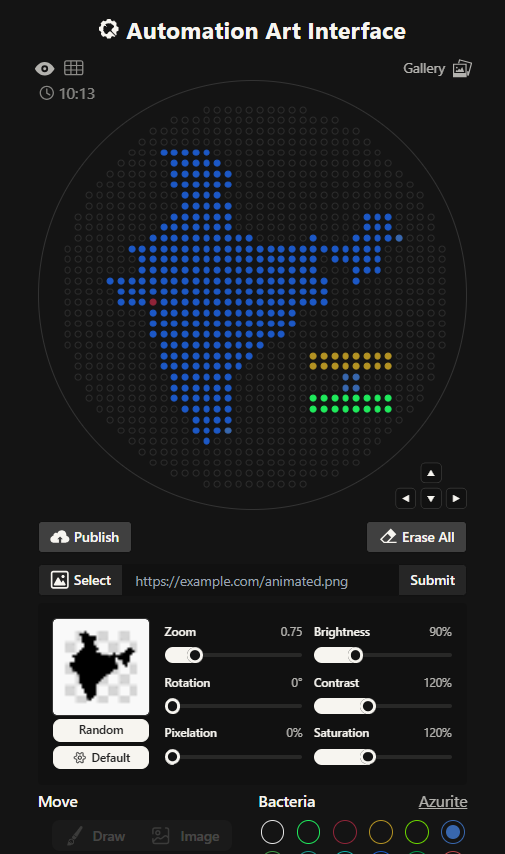
Assignment : Python Script for Opentrons Artwork
I had to write a Python script for a art design. I chose to create a silhouette of the Indian subcontinent, with my city being highlighted. I did that using the Opentrons Artwork website. I thought I will make a pattern of sorts with code but I realized that would time consuming and not very symbolic as such. I got a clipart of India from google and cropped it and then used that too generate my artwork. It didn’t look very good, I had to fiddle around with the contrast, brightness and other values to make it work. It still wasn’t looking how I’d expected it too. I decided to redo it.
This is the India 2.0 Art (image below), I like this one much better. The green outline in the previous one was not a very good design choice. I don’t know what I was thinking. I created this one by editing my original clipart then striking a balance in the contrast, brightness values. This one look much better in my opinion.
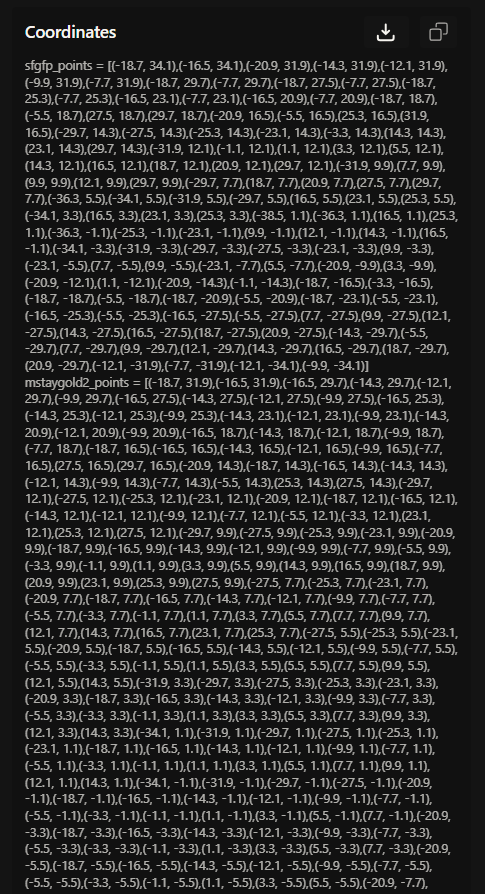
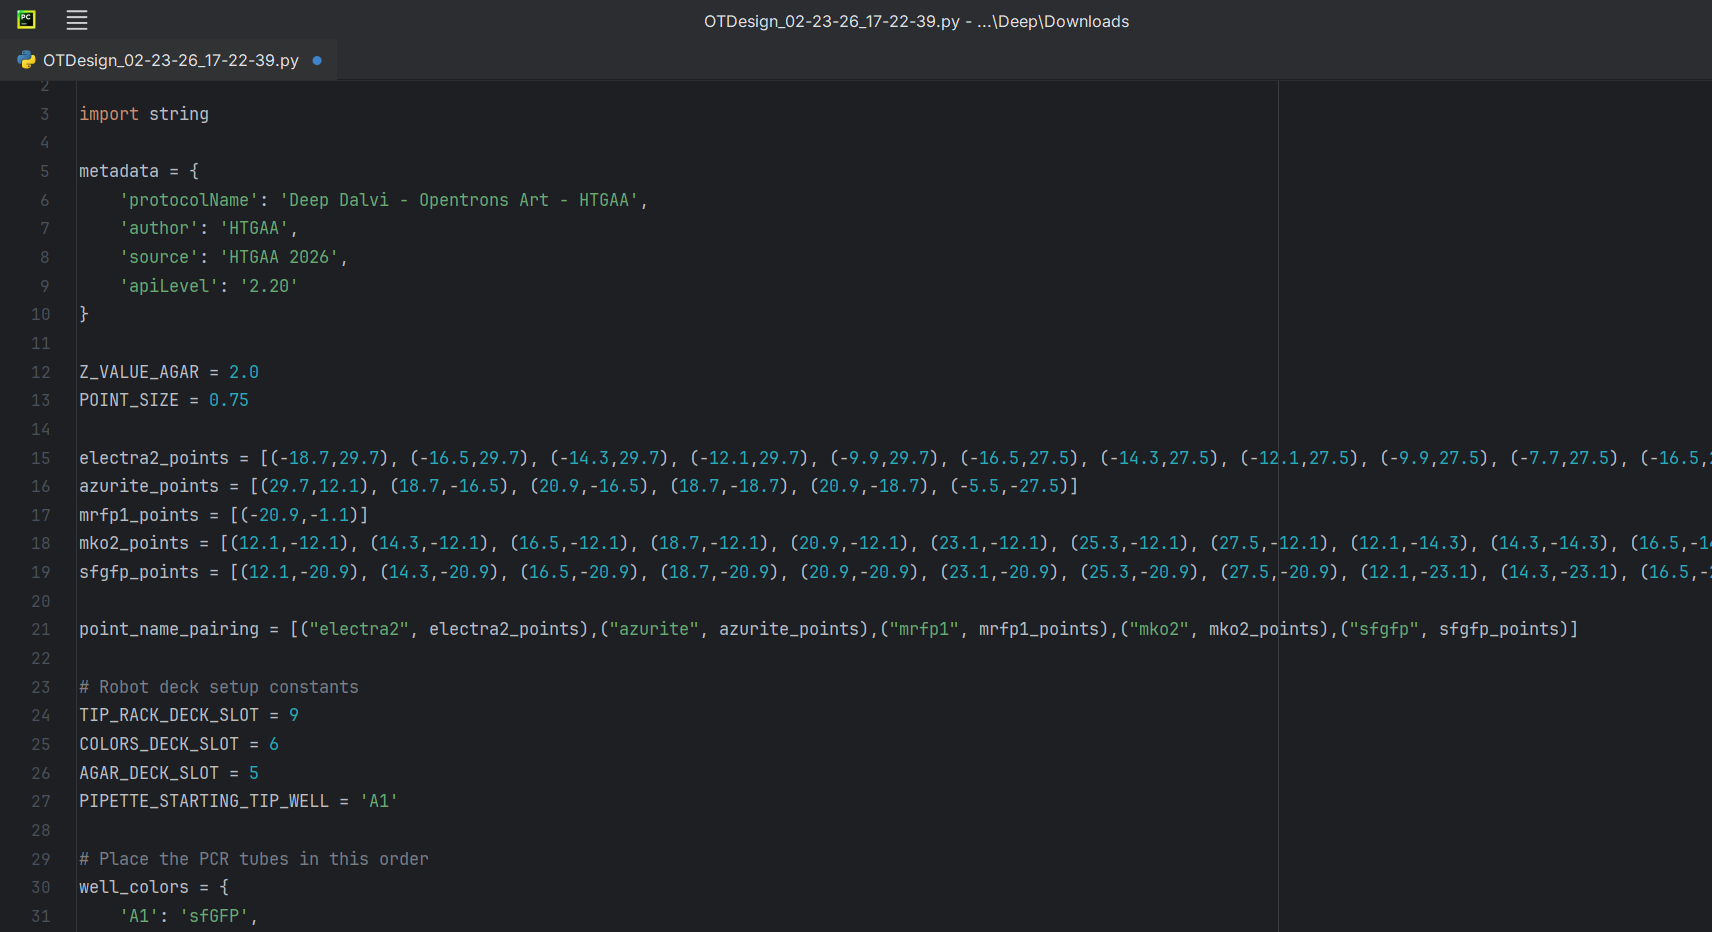
The coordinates were right below my art on the opentrons art website, I just decided to download the script. I edited the script a bit in the PyCharm (adding my name).
Reading further, I found out that I didn’t even need to download my script. I could just publish my design on the opentrons art website and then share the link. I did exactly that and submitted my script to the google form. But in case, Murphy’s Law decides to apply, here’s my code:
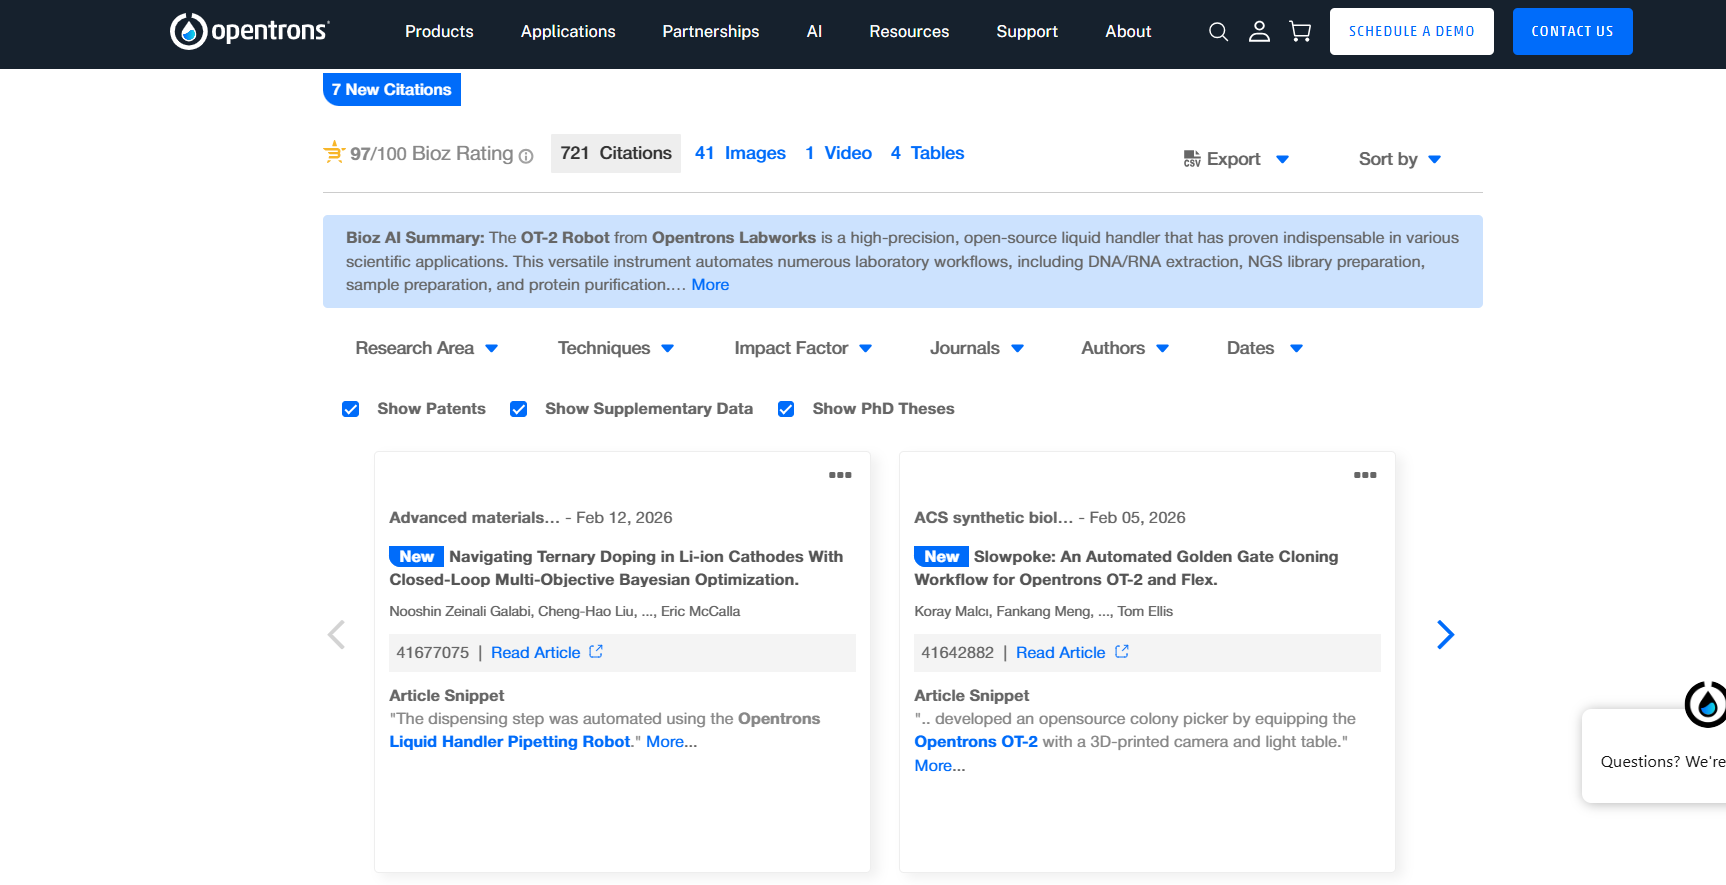
Question 1. Find and describe a published paper that utilizes the Opentrons or an automation tool to achieve novel biological applications.
I thought that I will need to put in effort to find a paper but the Opentrons website has its own embedded search box thingie to find papers. I just selected the area of my preference and then got a paper I liked.
The paper I chose was titled “Optimizing automated layer‑by‑layer deposition of engineered ECM‑like microenvironments for mammalian cell culture” I chose the paper because last year I’d attended a workshop on 3D Bioprinting and I’d learnt about organoid cultures and replication of the ECM-like conditions for better cell cultures, so I was aware about the what the paper was about. Here’s a link to the paper. https://doi.org/10.1557/s43579-025-00912-9
Question 1 Detour: Reading a Paper and Consolidation.
Back in my graduate coursework, I didn’t have to read a lot of papers but my final dissertation did require me to read a lot of papers. I’d chosen a broad topic “Machine Learning in Life Sciences” There were a lot of papers to be read and a lot of distillation to be done. I used to read papers like header-to-footer but I realized that it was not an optimal approach. The very act of reading 30+ papers for my bachelor’s dissertation led me to evolve, iterate on my paper reading method. So now what I do is this.
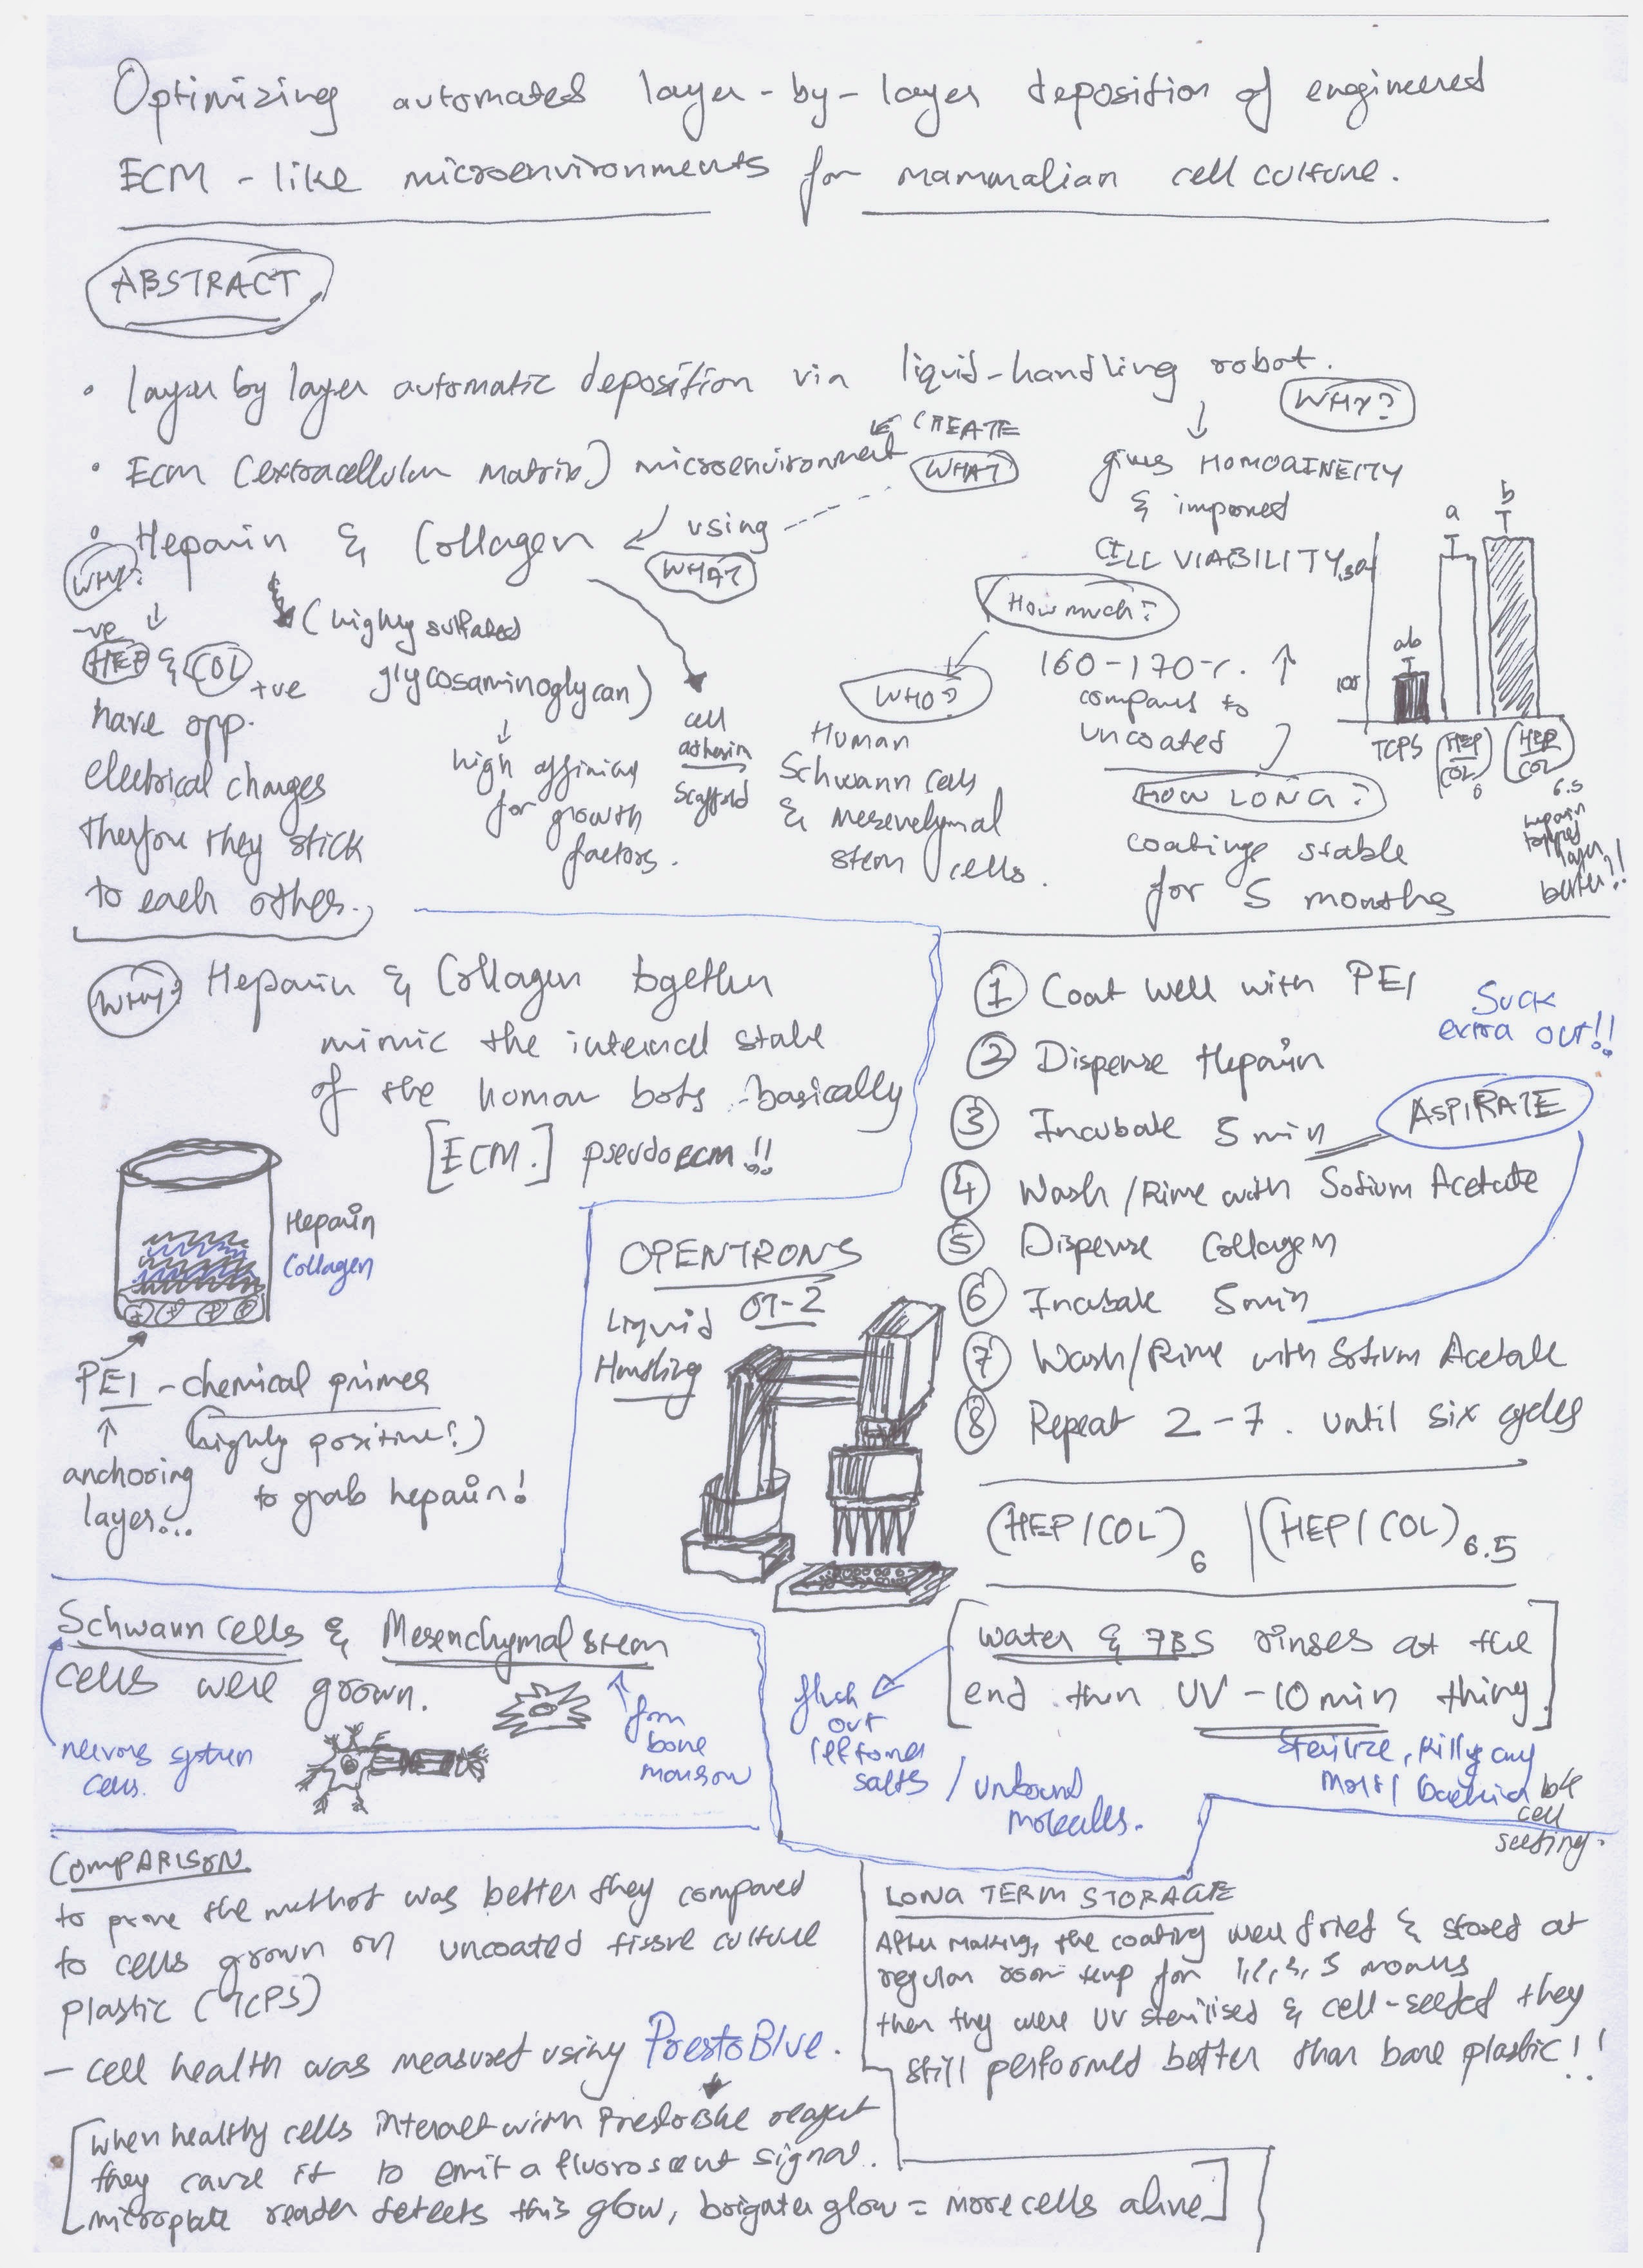
ABSTRACT! I read the abstract to get a basic idea of what the paper is about. If I don’t get it, perhaps because of a lot of jargons. I search up on the jargons, revisit the fundamentals and then read the abstract again. I write it all down (what I understood from the abstract)
QUESTIONS! I try and see the abstract as a summary of the paper and the expectations I can make, then I skim the paper looking for the references to the abstract. For example, in this case the abstract talked about using heparin and collagen, I skimmed and found out the information related to it, WHY they were using it, WHAT were they creating. I try to connect the components via questions (you can see what I mean in my distillation sheet of sorts)
SKETCHES and FLOWS! I make a lot of sketches where there’s methods/compositions involved. I also try to properly write workflows in a sequence as it aids in a narratively coherent understanding. I DO NOT try to polish it, nobody else has to understand it, only me. I try to not be a perfectionist as then looking of a proper sketch/metaphor often leads to time wasting. (In case, I am making some kind of content, I use this sheet as a start and polish it further. NEVER try to be clean while understanding especially if your sheet isn’t going to be used by someone else!)
DATA! I have an inherent problem with graphs (I am actively trying to mitigate it) so I spend a lot of time, trying to understand graphs and then convert them into legit statements (for my ease, graphs don’t instantly make sense to me for some reason) I verify if the data makes sense with respect to the abstract, how they’ve validated the results, the metrics they’ve chosen (this part can take some time, but with exposure to more papers, it starts getting efficient as validation methods/approaches often follow a core principle that can repeat (it’s like a six basic plots type thing))
I don’t try to make it clean. This is one might seem clean but as I’ve read a lot of papers before this and iterated on my method, I have sort of gained a knowledge of what to write, where and what can be expected so due to prior experience/iterations, the running clutter is naturally reduced.
My distillation sheet for the paper:
Question 2. Write a description about what you intend to do with automation tools for your final project. You may include example pseudocode, Python scripts, 3D printed holders, a plan for how to use Ginkgo Nebula, and more.
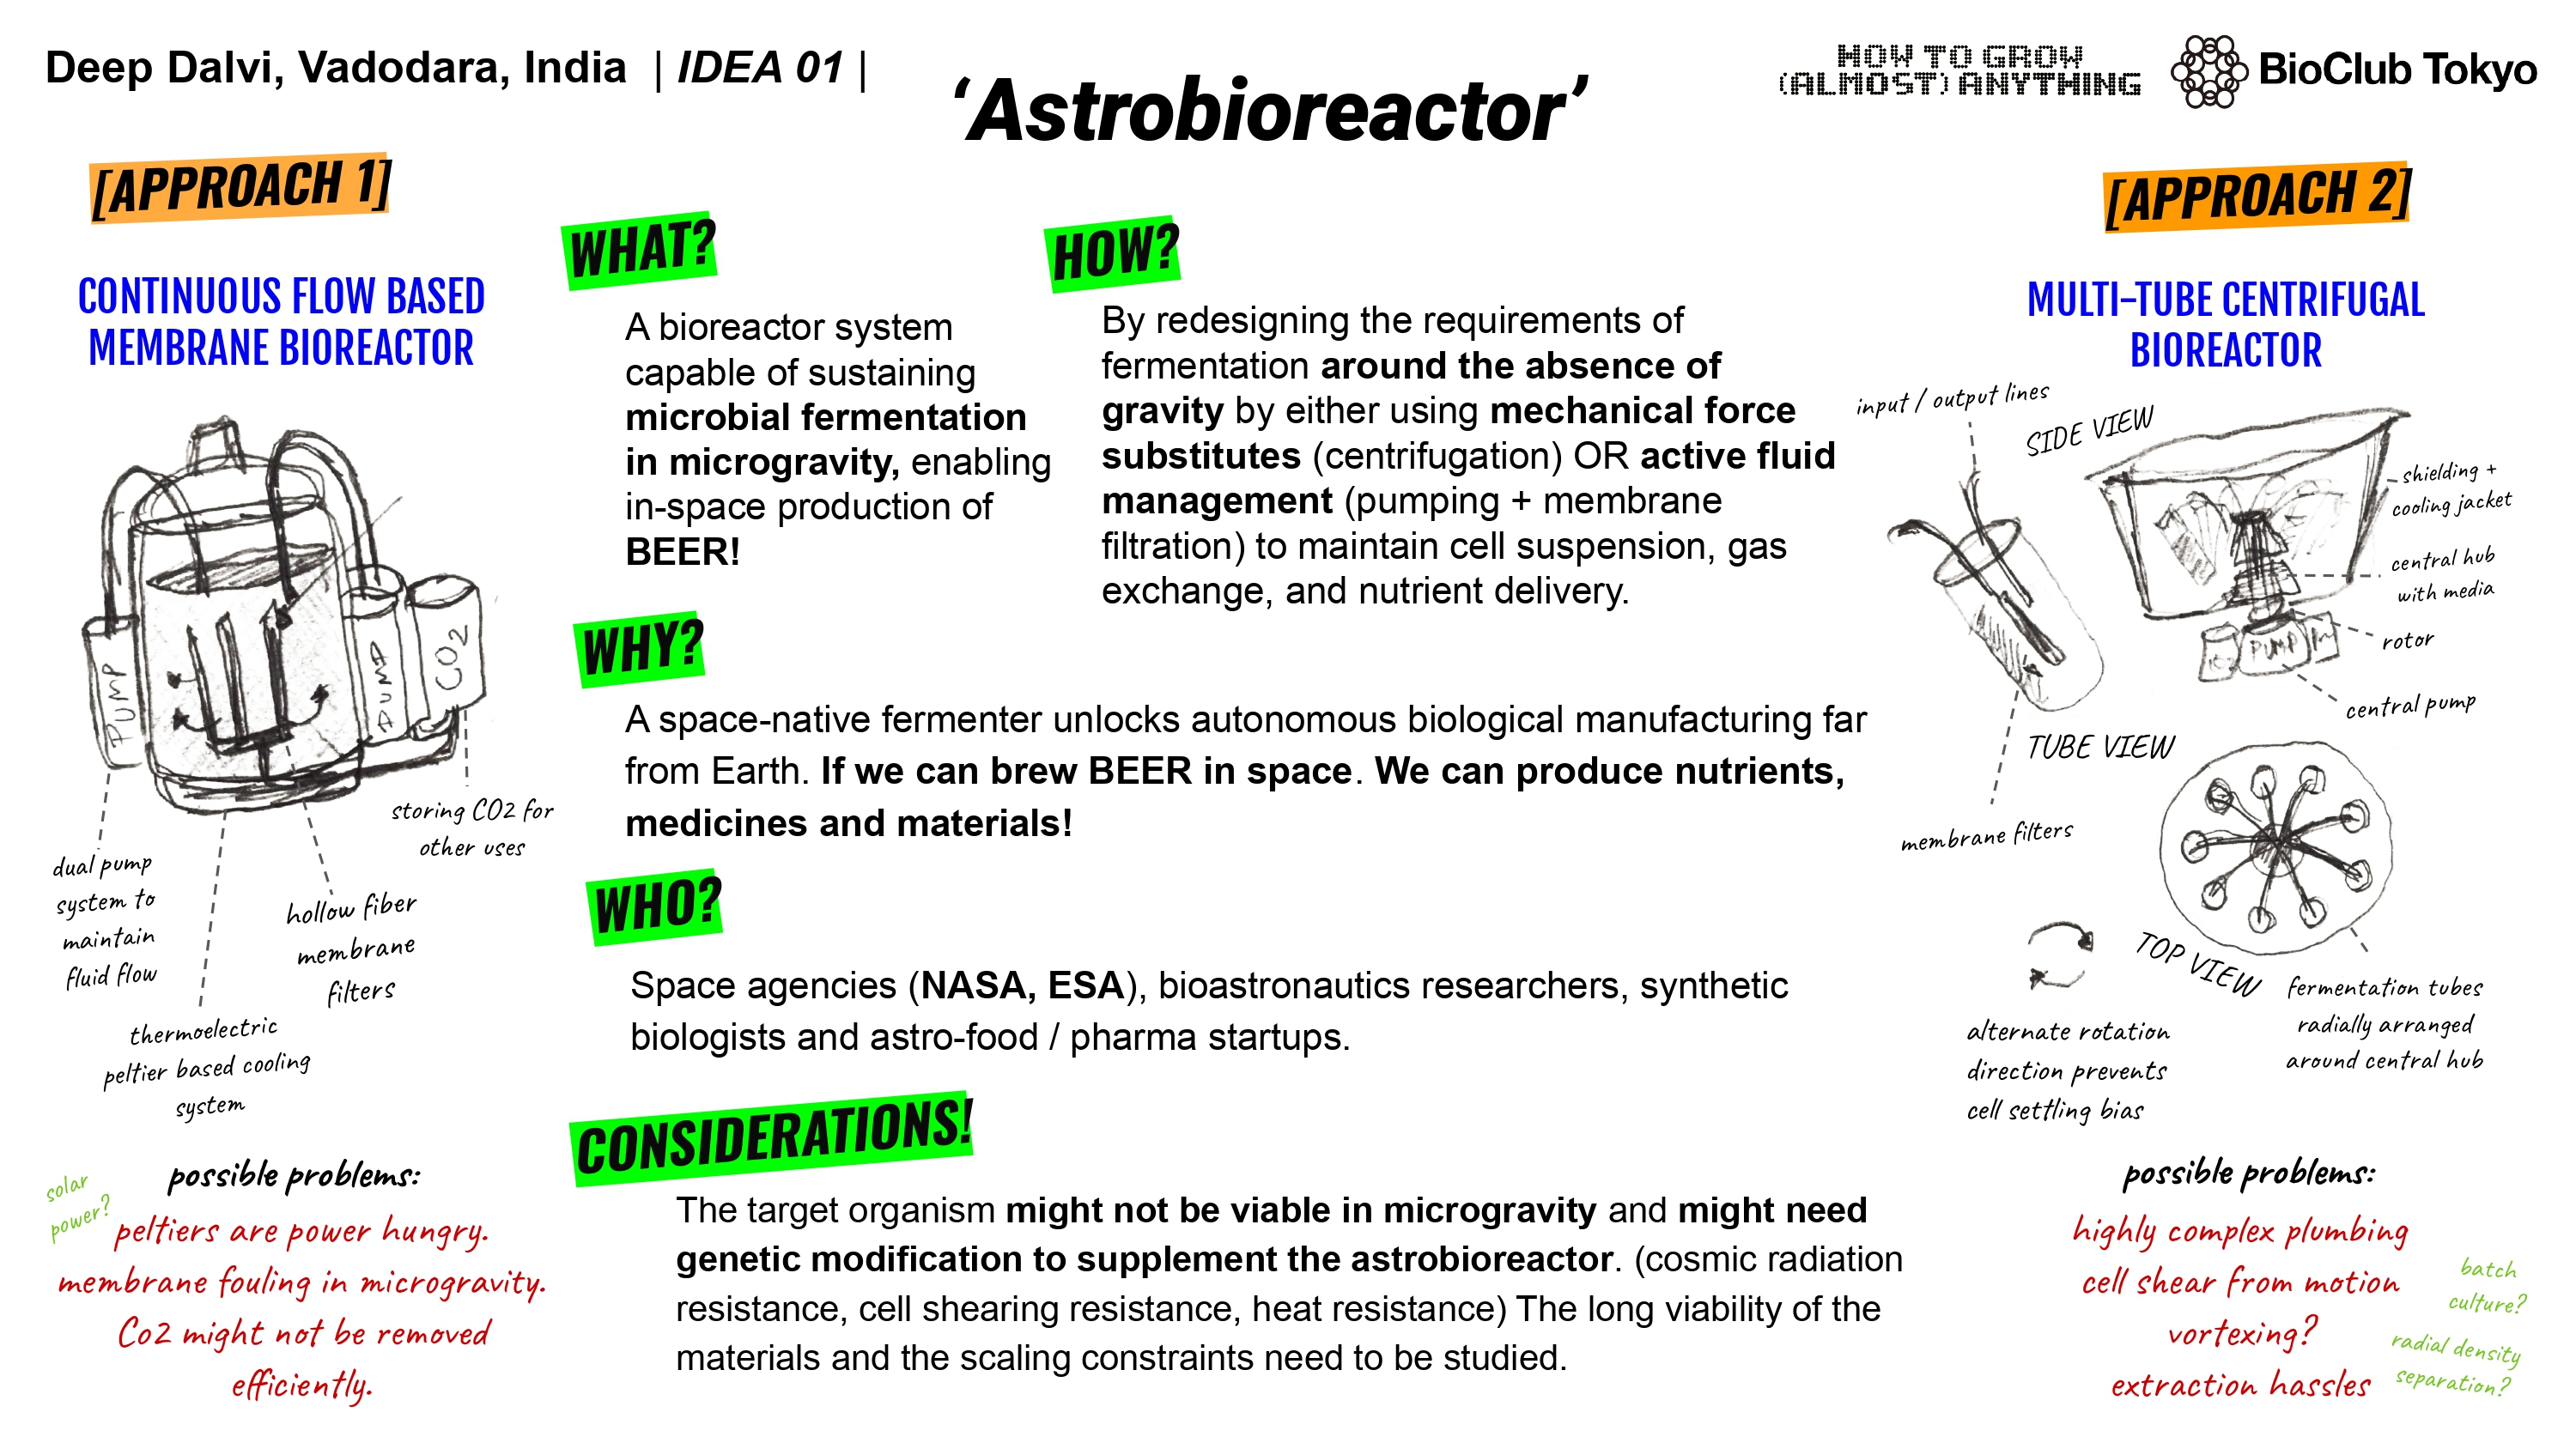
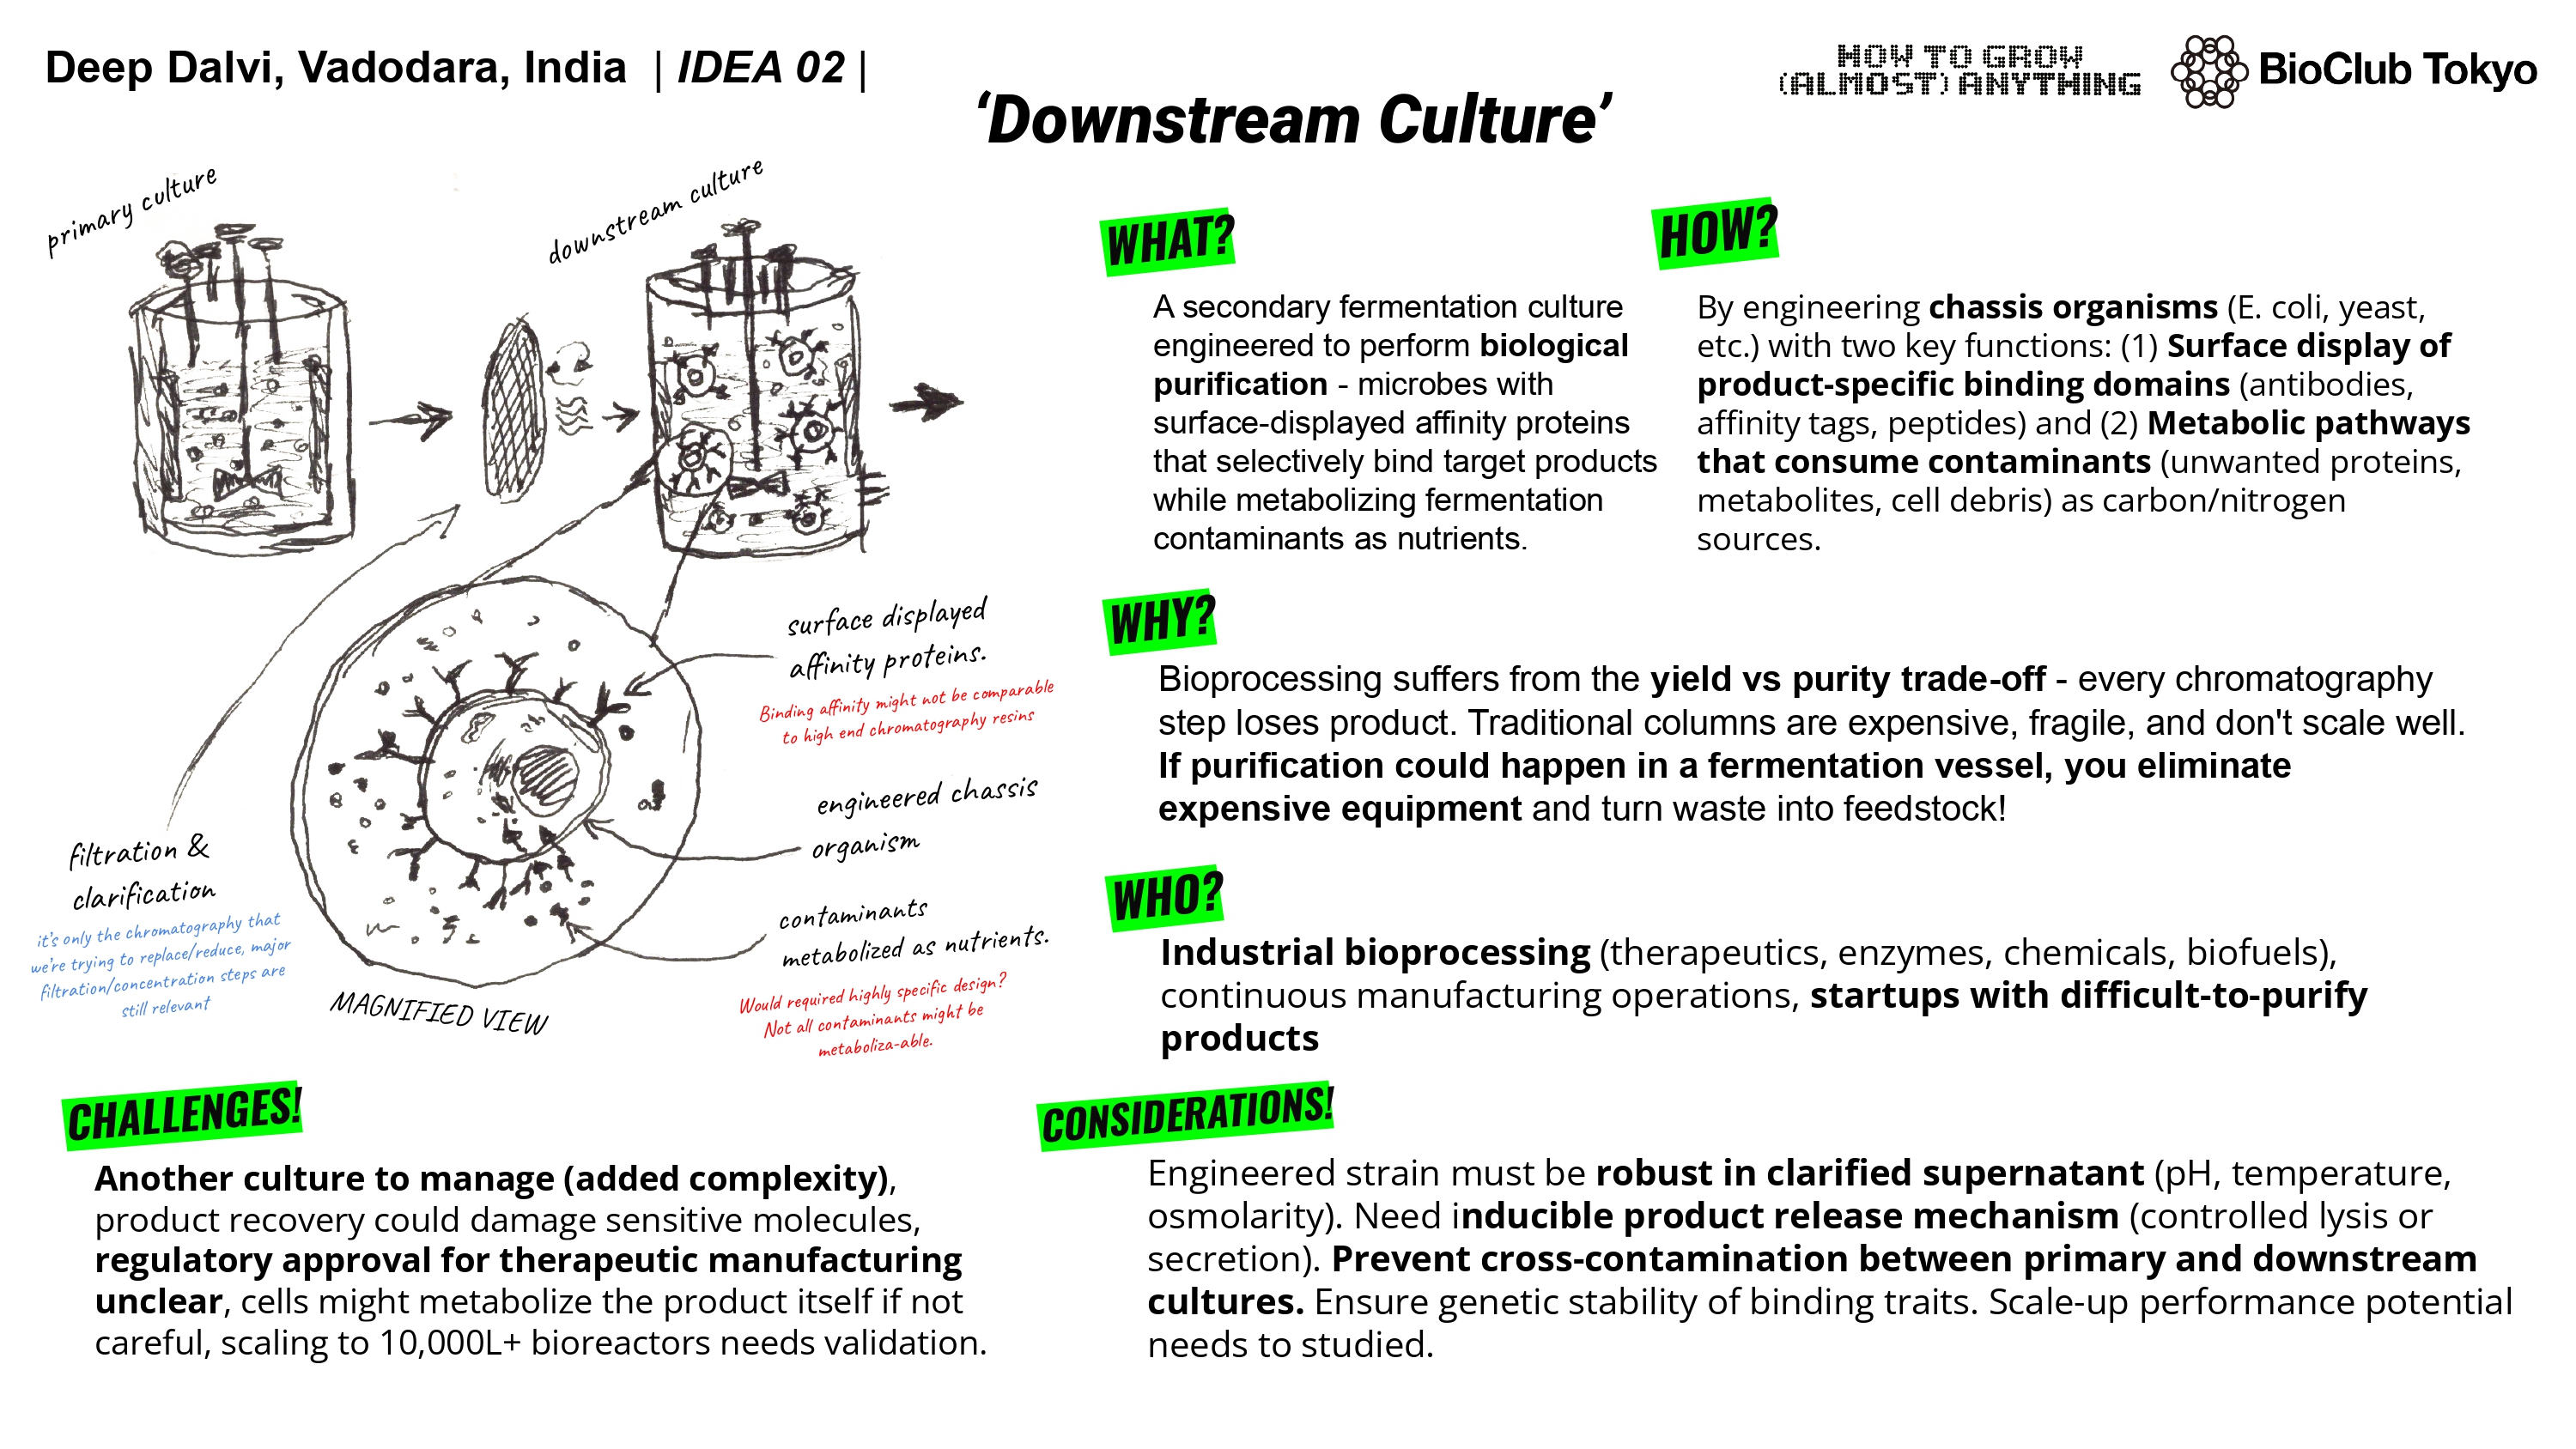
For my final project, I have multiple ideas. I could use lab automation to help me perfect the accessory/secondary culture for the second step. Allow me to test various strains of bacteria with the clarified broth from a benchtop bioreactor. The benchtop reactor would contain the target culture producing our product and then I could use multiple engineered cultures with different affinity proteins and test their efficiency in binding to the product, allowing to perfect the downstream culture. this would only leave the engineering / design part to the scientists and take away the tedious repetition.
The lab automations could also help me in testing out an engineered yeast culture for my astrobioreactor. Also if the opentrons could also have a custom automated temperature controlled centrifuge then I could test and iterate on the creation of modified yeast for better shear durability and heat resistance to support fermentation in space.
Final Project Ideas
Week 4 HW: Protein Design I
Part A : Conceptual Questions
1. How many molecules of amino acids do you take with a piece of 500 grams of meat? (on average an amino acid is ~100 Daltons)
Amino Acids are protein building blocks, so whatever percent of protein the meat contains is technically the AA content. A quick google search tells me that most cooked meats contain 20%-30% protein by weight. I’ll take 25% as my number. Now, 25% of 500g is 125g. (500/4)
Amount of protein = 125g
Now, 1 AA avg. = 100 Daltons. but 1 Dalton = 1 g/mol
so 1 AA = 100g/mol. To find the amount of moles = mass / molar mass
therefore, No. of moles of amino acids = 125 / 100 = 1.25 moles
number of molecules = moles x Avogadro’s Number = 1.25 x 6.022 x 10^23
= 7.527 x 10^23 molecules of amino acids per 500 grams of meat.
2. Why do humans eat beef but do not become a cow, eat fish but do not become fish?
The proteins from other animals are built out of the same universal building blocks and the process of digestion breaks food down into the building blocks. (catabolism) These building blocks are then used to make YOUR own proteins using YOUR DNA. (metabolism) Basically:
When humans eat cow, human body not take cow protein. Human body break down protein into free amino acids. Free amino acid used by human body to make its own protein. Free amino acid not make a human a cow or fish.
3. Why are there only 20 natural amino acids?
They’re basically evolution-wise frozen in place. Early life settled on 20 AA that were chemically diverse enough to build different functional proteins. Once the genetic code was ’locked’ There was no way that evolution could now swap it, it would break everything. 20 amino acids have enough chemical variety to accomplish the protein goal.
4. Can you make other non-natural amino acids? Design some new amino acids.
Yes, it is possible to make new amino acids, labs do this using engineered tRNAs that insert a non-natural AA at the stop codon. An example of a new amino acid created by modifying the side chain is ‘fluorophenylalanine’ - it is basically a phenylalanine with a fluorine atom, making it more stable and UV trackable.
5. Where did amino acids come from before enzymes that make them, and before life started?
The Miller-Urey experiment has shown that lightning + early earth atmosphere could form amino acids spontaneously. Also amino acids have been found in meteorites like the Murchison meteorite, which could indicate that amino acids could’ve come from space. Amino acids aren’t strictly a product of life, but rather a tool life used.
6. If you make an α-helix using D-amino acids, what handedness (right or left) would you expect?
Naturally, α-helixes made from L-amino acids have right handed turns. So logically if we were to use D- amino acids to make α-helixes then they should have left-handed turns.
7. Can you discover additional helices in proteins?
Skipped. (The HW said I could skip two questions so this is the first)
8. Why are most molecular helices right-handed?
Most molecular helices are right handed because the life uses L-AAs. the geometry of L-AAs favors right handed twisting when they form hydrogen bods along a backbone. It is just like the answer of Q.3, L-AAs dominated in the early life and that dominance carried over.
9.Why do β-sheets tend to aggregate? What is the driving force for β-sheet aggregation?
β-sheets have exposed hydrogen bond donors and acceptors along their edges. So when 2 β-sheets meet edge to edge, they form hydrogen bonds with each other and grow in to ordered stacks. The driving forces of this bonding are 1. Hydrogen bonding 2. Van der Waals interactions between sheets 3. Hydrophobic effect - water shoves the sheets together to get those nonpolar faces out of its way.
10. Why do many amyloid diseases form β-sheets? Can you use amyloid β-sheets as materials?
Once a protein misfolds, it can cause other copies of the same protein to misfold in the same way. In cases of misfolds, sometimes a β-strands edge can get exposed, this edge then acts like a template and causes the other proteins to misfold the same way and forms a stack, the stack keeps growing. The result is insoluble amyloid fibrils. Diseases like Alzheimer’s (Aβ plaques), Parkinson’s (α-synuclein), all involve this.
The same reason why amyloid diseases are pathological make them useful. Aggregate materials can be incredibly stable and heat resistant. They’re perfectly ordered. They are self-propagating/assembling.
11. Design a β-sheet motif that forms a well-ordered structure.
Skipped. (This is the second skipped question)
Part B : Protein Analysis and Visualization
Briefly describe the protein you selected and why you selected it.
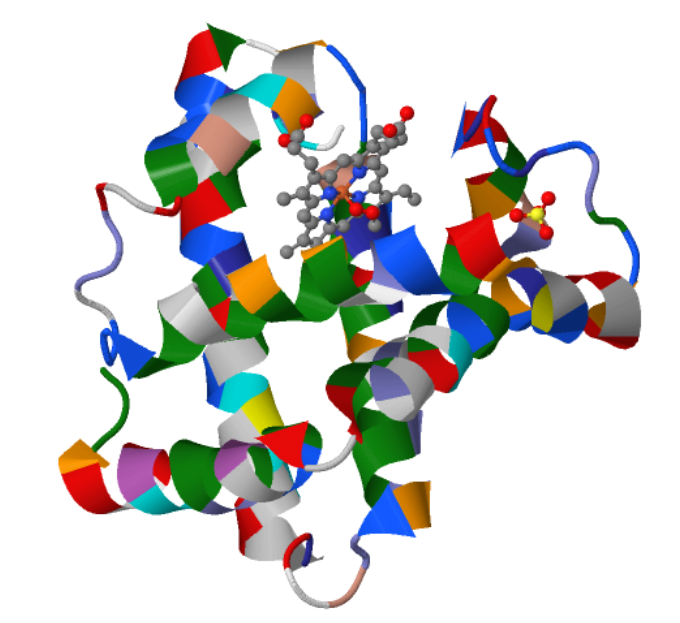
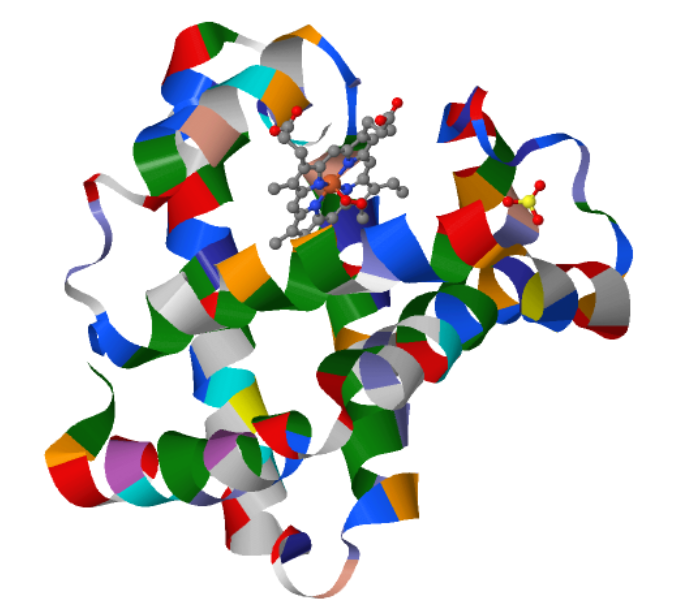
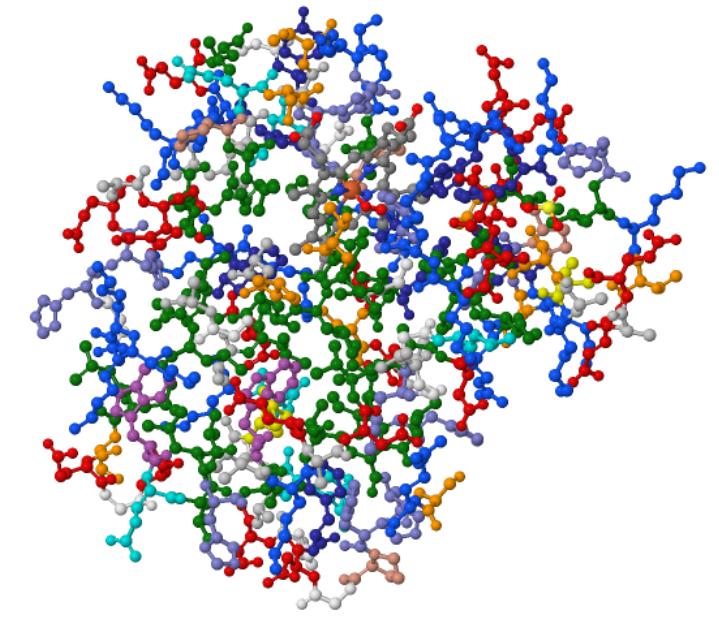
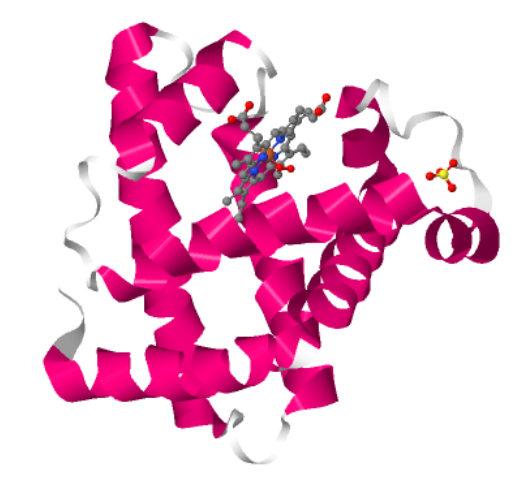
I choose the protein “myoglobin”. I selected it as I know from pop sci that it is responsible for keeping muscles well-oxygenated. It is also the reason why meat is red in color. It has a higher affinity for oxygen than hemoglobin. The protein is a simple single poly peptide chain wrapped around an iron-containing heme group which holds and physically grabs an oxygen molecule. It is different from it’s well known elder cousin hemoglobin in the way that myoglobin is a tertiary monomer consisting of a single polypeptide chain while hemoglobin is a quaternary tetramer made of four polypeptide subunits.
Identify the amino acid sequence of your protein.
Here’s the amino acid sequence: MGLSDGEWQLVLNVWGKVEADIPGHGQEVLIRLFKGHPETLEKFDKFKHLKSEDEMKASEDLKKHGATVLTALGGILKKKGHHEAEIKPLAQSHATKHKIPVKYLEFISECIIQVLQSKHPGDFGADAQGAMNKALELFRKDMASNYKELGFQG
The total length of human myoglobin is 154 amino acids. The molecular weight is 17.8 kDa. The most frequent amino acid is Leucine. It appears 19 times.
Homologs :Hemoglobin α and β subunits (most famous), neuroglobin, cytoglobin, and plant leghemoglobin, they all share the same globin fold.
It belongs to the globin superfamily.
Identify the structure page of your protein in RCSB
1MBO (PDB ID for Myoglobin) was solved by S. E. Phillips in 1980, It was the first solved protein structure. It was published as “Structure and refinement of oxymyoglobin at 1.6 Å resolution.” At 1.6 Å, this is an exceptionally high-quality structure, well below the 2.70 Å “good” threshold, meaning the atomic positions are resolved with outstanding precision. This is one of the most accurately determined protein structures in the entire PDB.
Yes, There are three types of non-protein molecules are present in 1MBO beyond the protein chain itself: HEM: the heme group. The iron atom at its center is what physically binds oxygen. OXY: a molecular oxygen (O₂) molecule, bound directly to the iron atom inside the heme pocket. SO4: a sulfate ion from the crystallization buffer, sitting on the protein surface.
Yes. In SCOP, myoglobin is classified as: -
Class a: All alpha proteins
Fold a.1: Globin-like
Superfamily a.1.1: Globin-like
Family a.1.1.2: Myoglobin
Open the structure of your protein in any 3D molecule visualization software:
I just used RCSB PDB Viewer. It was online, easy and direct.
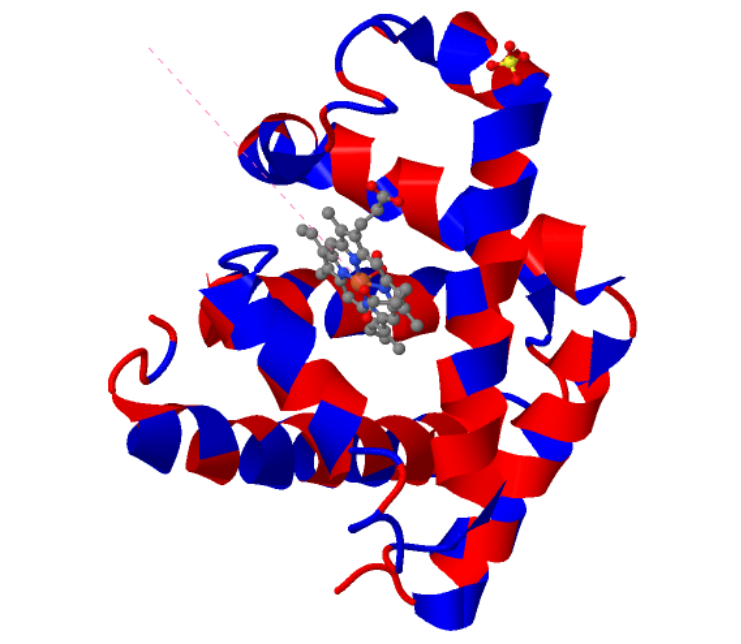
Cartoon: (Color by Amino Acid)
Ribbon: (Color by Amino Acid)
Ball and Stick (Color by Amino Acid)
When I colored the protein by secondary structure, I found out that it has more helices.
The Jsmol based viewer didn’t have an option to color by residue type but it had the option of color by hydrophobicity. Red means hydrophobic, Blue means hydrophilic.
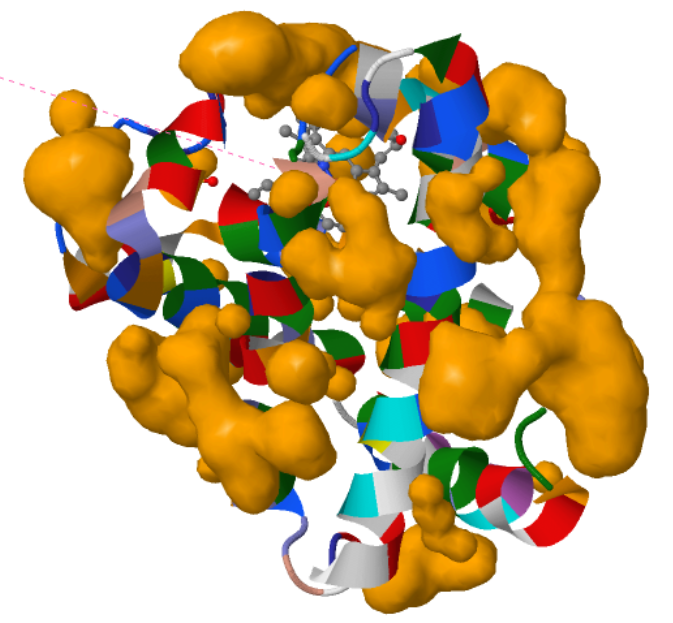
I visualized the surface for Cavities and this is what I got.
The visualization shows that the protein indeed has cavities that act as binding pockets and it makes perfect sense that a protein like myoglobin would have cavities for binding.
Part C : Using ML-Based Design Tools
I set up a Colab instance and copied the Protein Design Notebook from HTGAA. I chose Myoglobin again for this.
C1: Protein Language Modelling
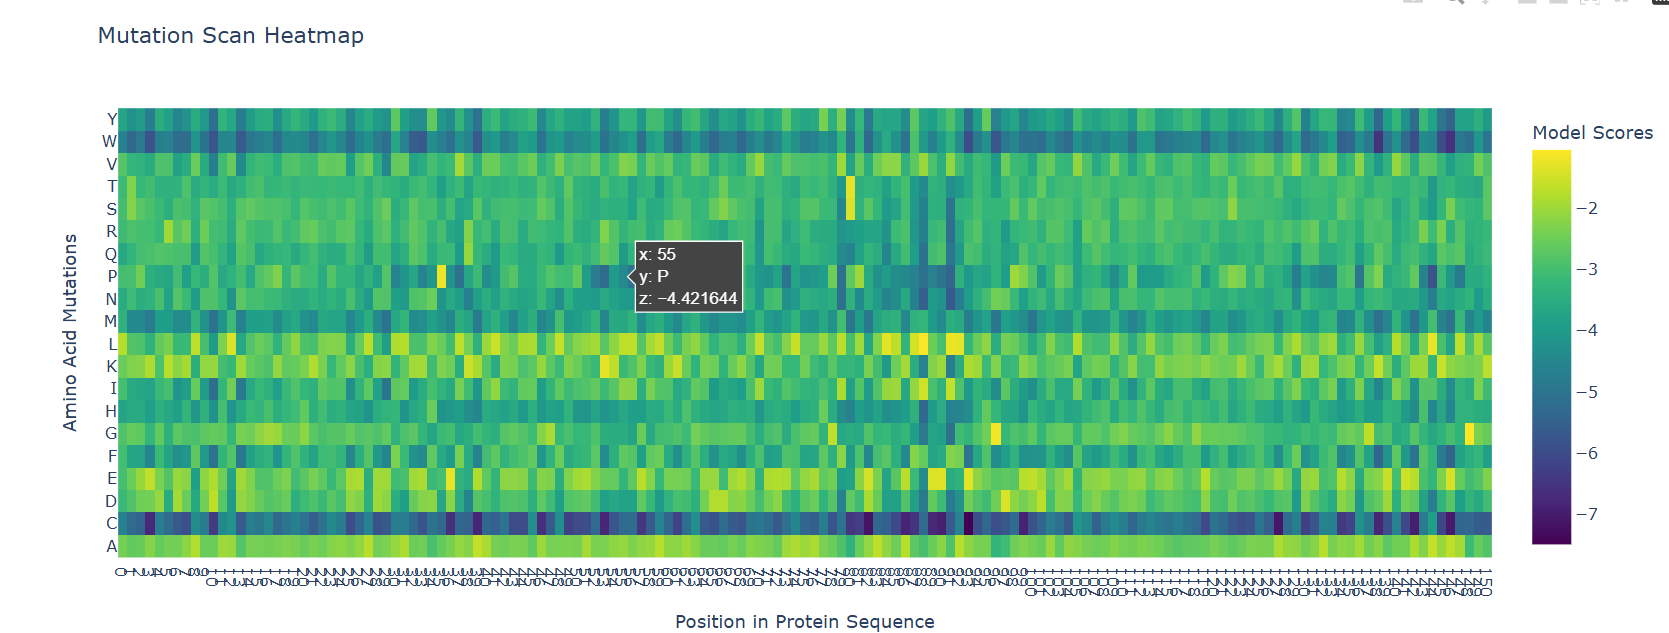
C1.1 Deep Mutational Scans
I had to use ESM2 to generate an unsupervised deep mutational scan of my protein (myoglobin). I just opened the provided Colab notebook and replaced the protein sequence in there.
The most striking pattern visible is the bottom C row and the top W row. I do not know the reason behind the C row but as for W, tryptophan is the bulkiest amino acid and it wouldn’t fit the dense helical packaging of globin fold without causing problems to neighbouring residues.
As for the latent space analysis, I tried to use the default dataset from the notebook but it wasn’t loading correctly in the notebook. The issue was in the dataset URL itself, it was returning a corrupted FASTA file with comments. I tried to download the dataset manually but that wasn’t working either, the page didn’t open. If the code worked as expected, I would have added my myoglobin sequence to the sequences list and compared it to its neighbors. I think it would’ve been closer to other globin like proteins.
C2. Protein Folding
C2.1 Folding a protein
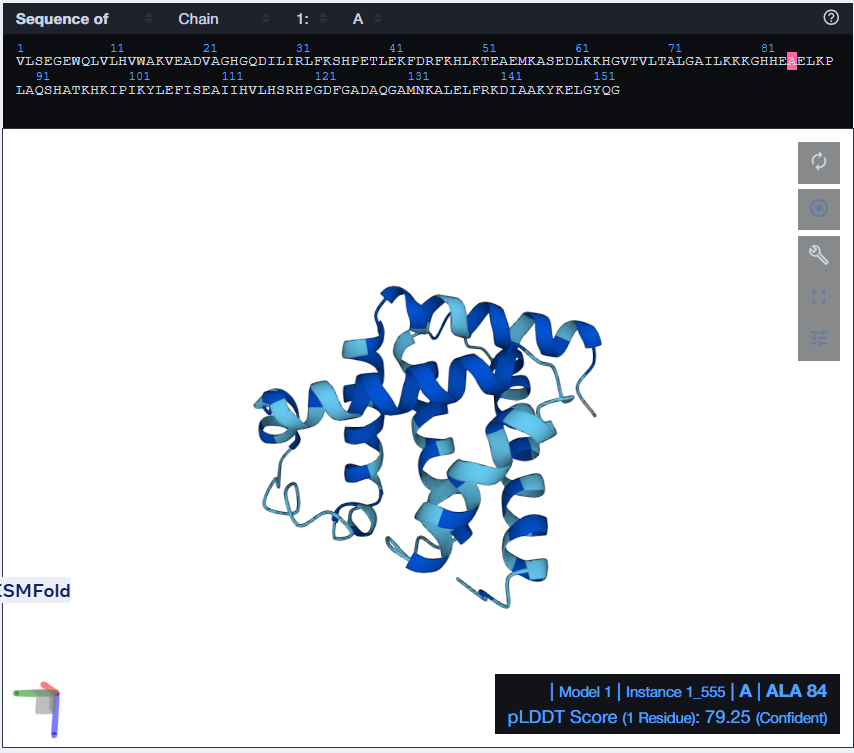
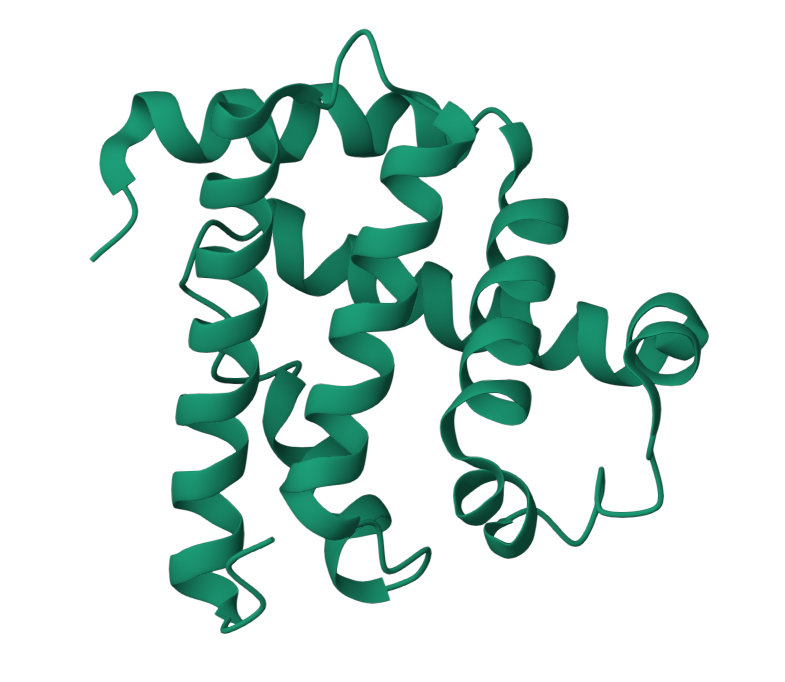
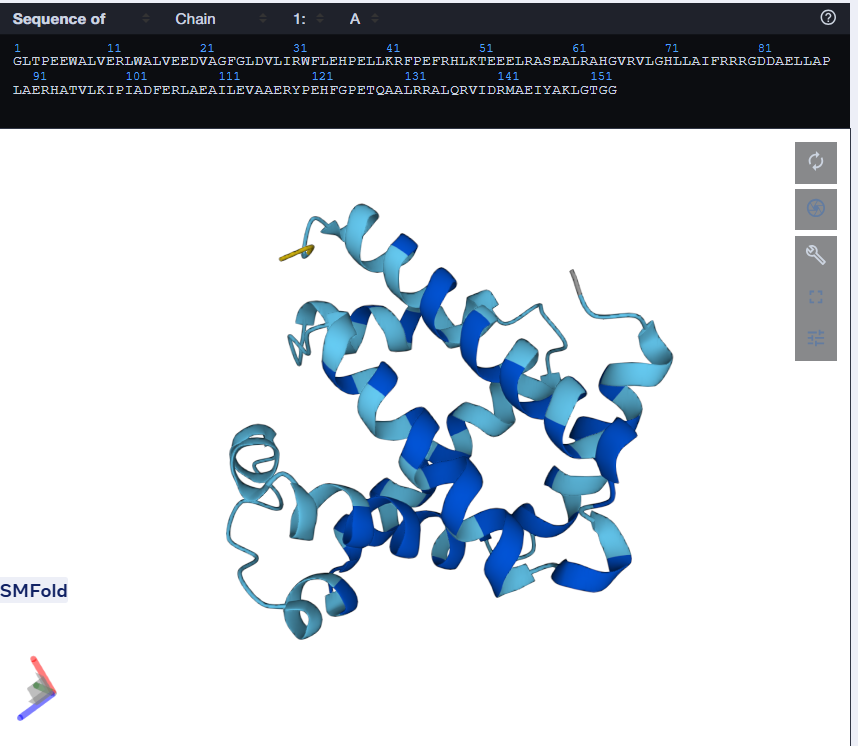
I tried using the given Colab Notebook for folding a protein with ESMFold, but the visualization part didn’t work. It said Py3dmol not found. I even tried to install it before that cell but even that didn’t work. I found an Web Interface for ESMFold, I decided to use that for the folding. Here’s what I got.
The predicted structure with ESMFold (Left) next to the original structure (right)
The predicted structure matches the original structure, but it isn’t very surprising as myoglobin is a well studied protein. Next up I had to try changing the sequence and see if the protein is resilient to mutations.
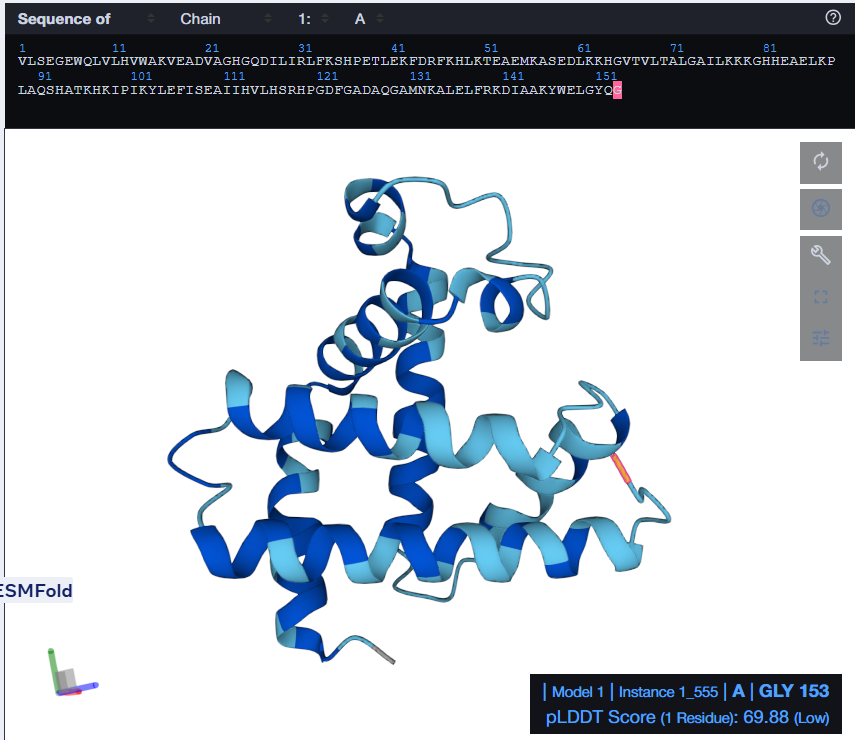
At first, I tried changing the K at 147th position to a W, then I folded the sequence. The overall structure remained the same but it introduced a region of low confidence into the structure.
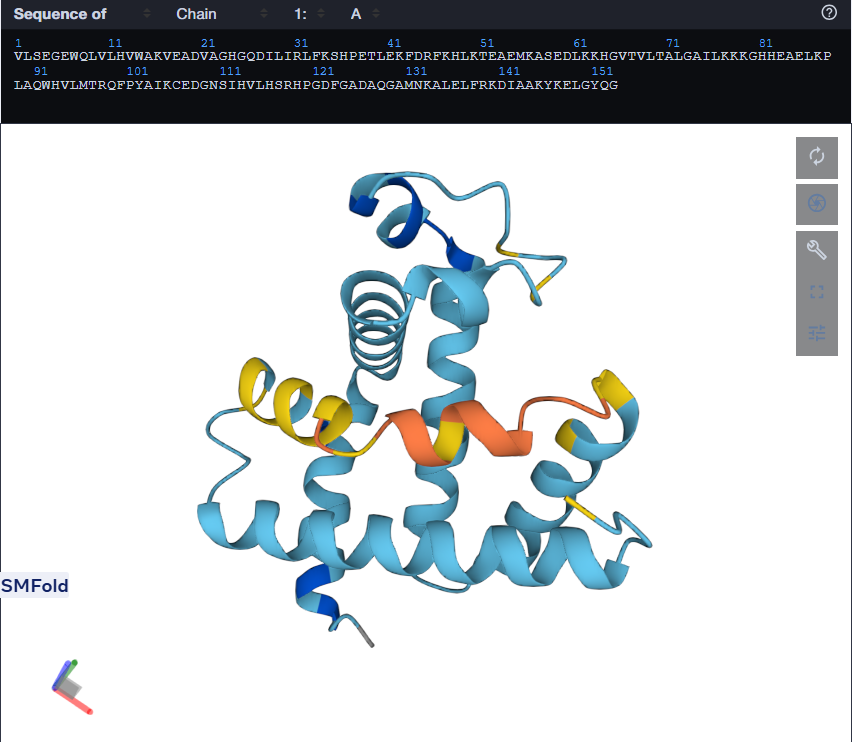
Mutant 1 (left), Mutant 2 (Right)
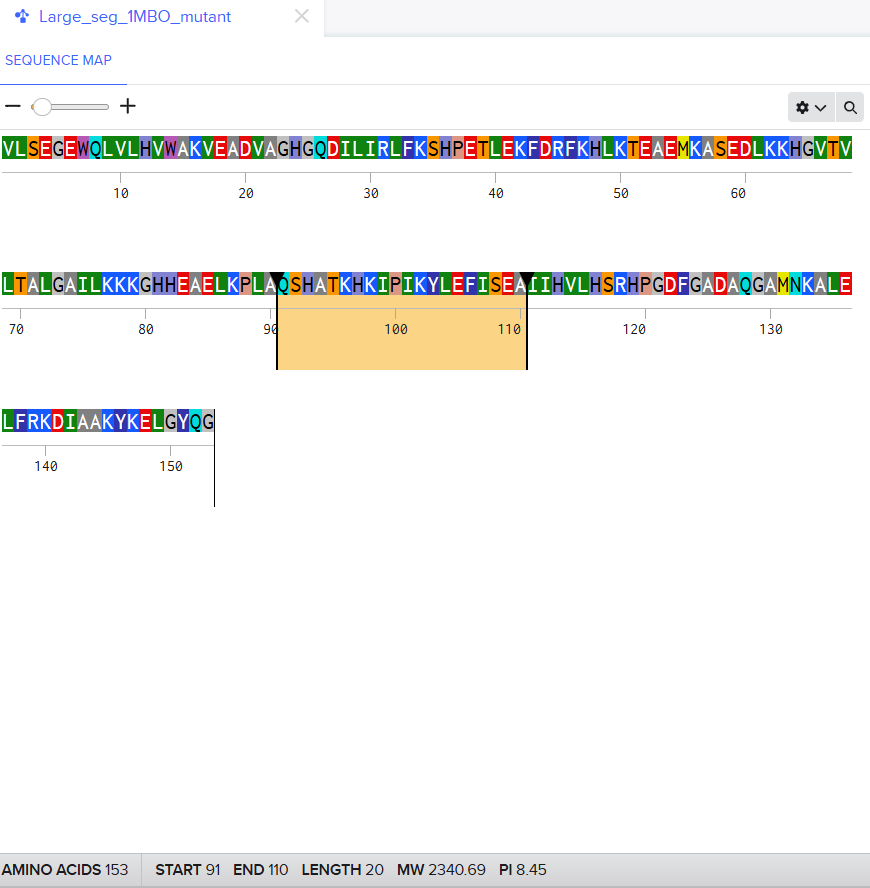
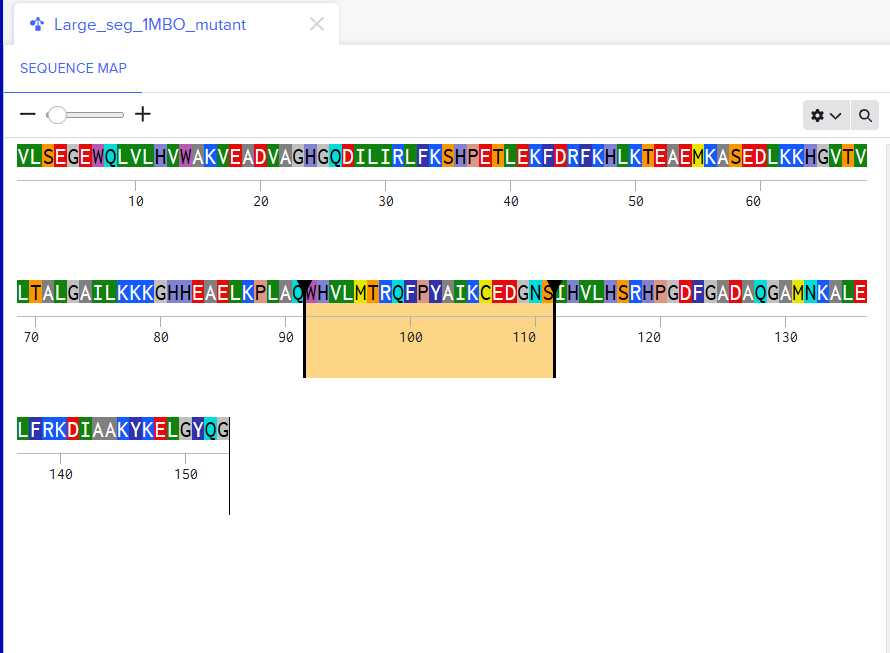
For the second mutant, changing a large segment. I switched a 20 amino acid sequence at 92-111 and replaced it with a random 20 amino acid string: W H V L M T R Q F P Y A I K C E D G N S. I lobotomized my protein. It was funny to see how a 20AA change really reduced the confidence score of the model. A lot of the structure was still conserved but the protein was certainly affected. I think the model tried to model it based on the training it had and globins are well-studied. Fun to see. I might play around more with other proteins. I used Benchling to do the mutation. (I got the random sequence via Google’s AI Mode)
C3. Protein Generation
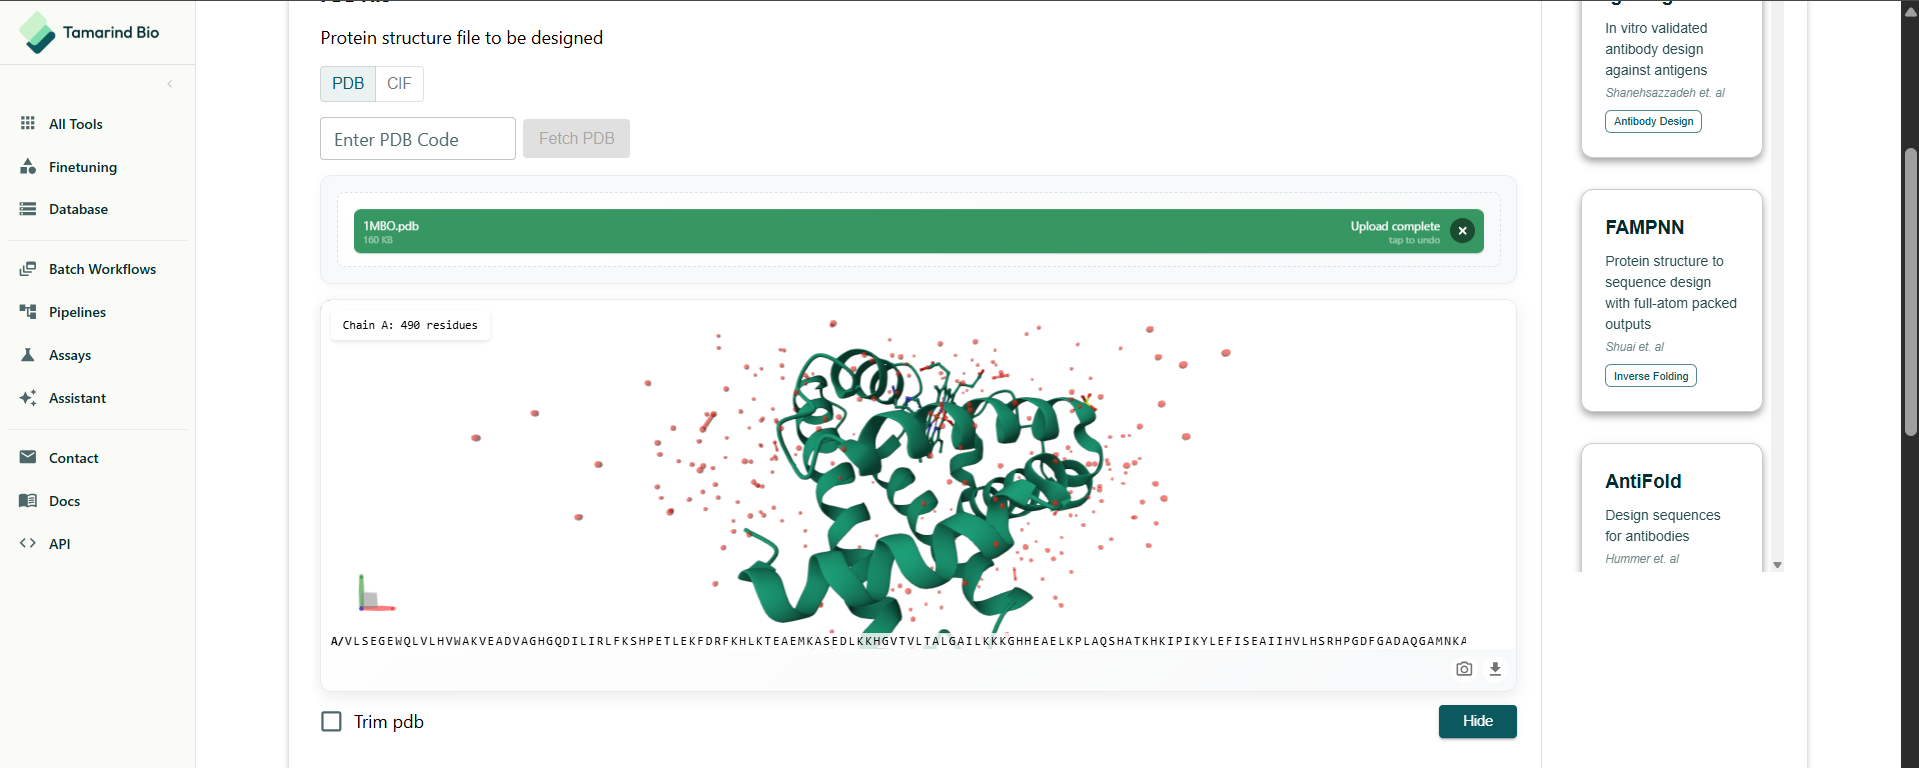
The notebook really has it’s issues. Even MPNN wasn’t working so I had to find an alternative, I found Tamarind Bio had a online tool. I used that. There are so many tools being made. This is making me aware of my obliviousness to computational biology.
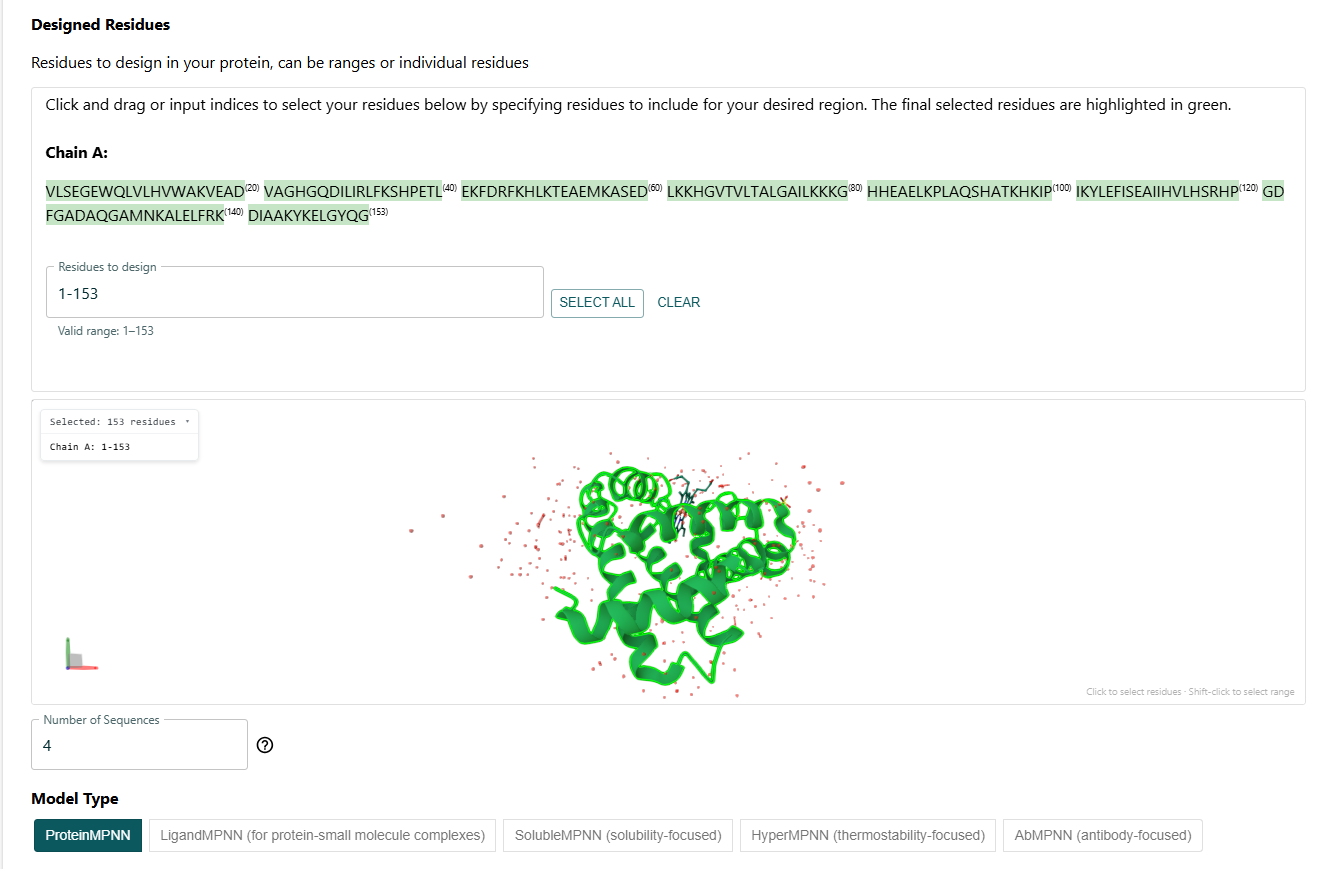
I had to select the residues to design. I decided to do a full redesign.
I got this sequence after the full redesign via ProteinMPNN:
One can tell by just looking that it is quite different from the original sequence. The length is same but the amino acids are different. But the Histindines on Position 64 and 93 have been recovered. I then proceeded to predict the structure for this via ESMFold.
Using only the myoglobin backbone structure (153 residues, chain A), ProteinMPNN designed a new sequence with ~38–45% identity to the native protein. But, His64 and His93, the two histidines crucial for heme binding were independently recovered without any sequence information. This suggests that the geometry of the heme-binding pocket strongly constrains these positions to histidine. Other than that, a lot of surface residues were varied from the original sturcture. Predicting the structure of the redesigned sequence via ESMFold had conserved the characteristic globin helix bundle, with high-confidence pLDDT scores across the helical core. This shows that the designed sequence is structurally compatible with the myoglobin fold. Overall, ProteinMPNN generated a realistic globin-like sequence rather than simply reproducing the native one.
Week 5 HW: Protein Design II
Part A: SOD1 Binder Peptide Design
Part 1:
The first step was retrieving human SOD1 sequence from Uniprot and introducing the A4V mutation. Here’s the SOD1 sequence:
I used the PepMLM Colab to generate the 4 peptides of length 12 as specified in the homework. I selected the length to be 12 and I chose 4 binders as I had to generate 4 peptides. This was the result.
Binder
Sequence
Pseudo Perplexity
0
FLYRWLPSRRGG
This is the known binder that the homework said to add in the list
1
SRWDEYTAVVAWARK
9.686584
2
SWYGEYTGVVAWRKK
14.675614
3
AHWPEYVVVVEWKKK
20.736155
4
SRVDEYTVRKKWARK
15.232643
Part 2: Evaluate Binders with AlphaFold3
Next step was to evaluate the binders. I went to alphafoldserver.com, logged in with my google account and then I was greeted by this screen.
For each peptide, I pasted the mutant SOD1 sequence followed by the peptide sequence as separate chains to model the protein-peptide complex. There were 5 total jobs. to be submitted.
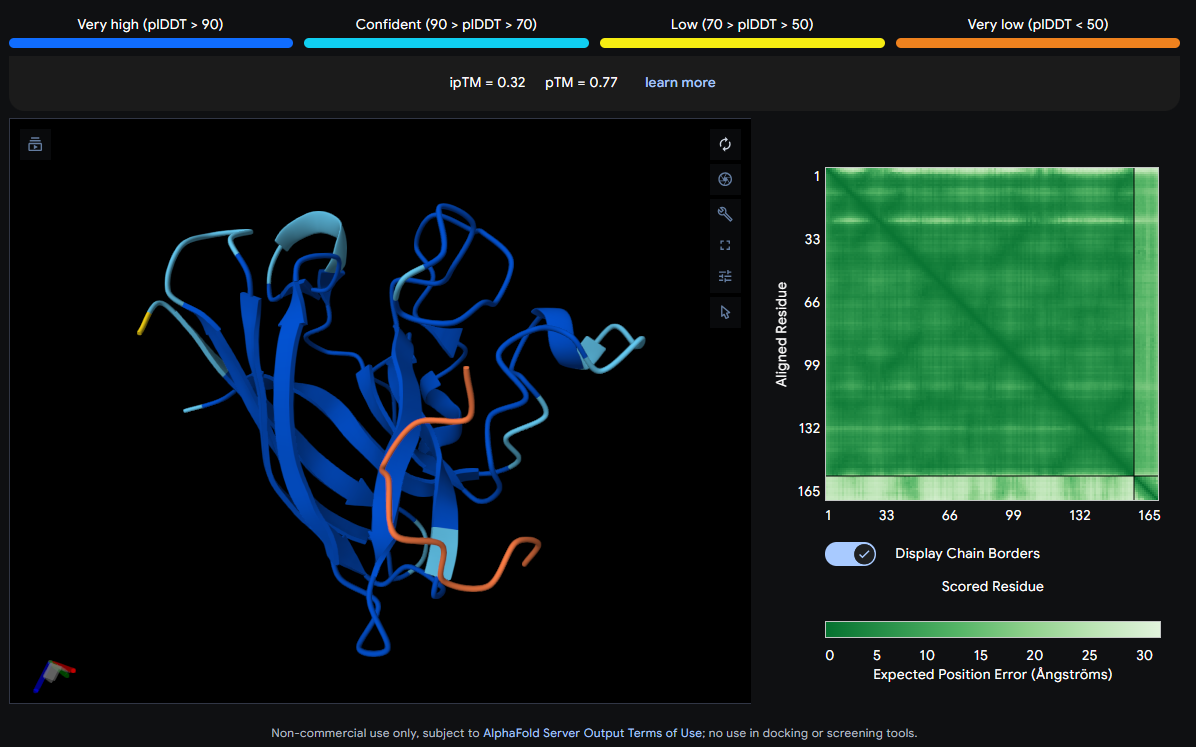
Job 0: The Mutated SOD1 and the known binder: FLYRWLPSRRGG
The peptide (shown in orange/red) visually wraps around one face of the β-barrel, appearing partially surface-bound. It does not appear to penetrate deeply. Its position is consistent with engagement near the loop regions connecting β-strands rather than strictly at the N-terminus where A4V (position 4) sits.
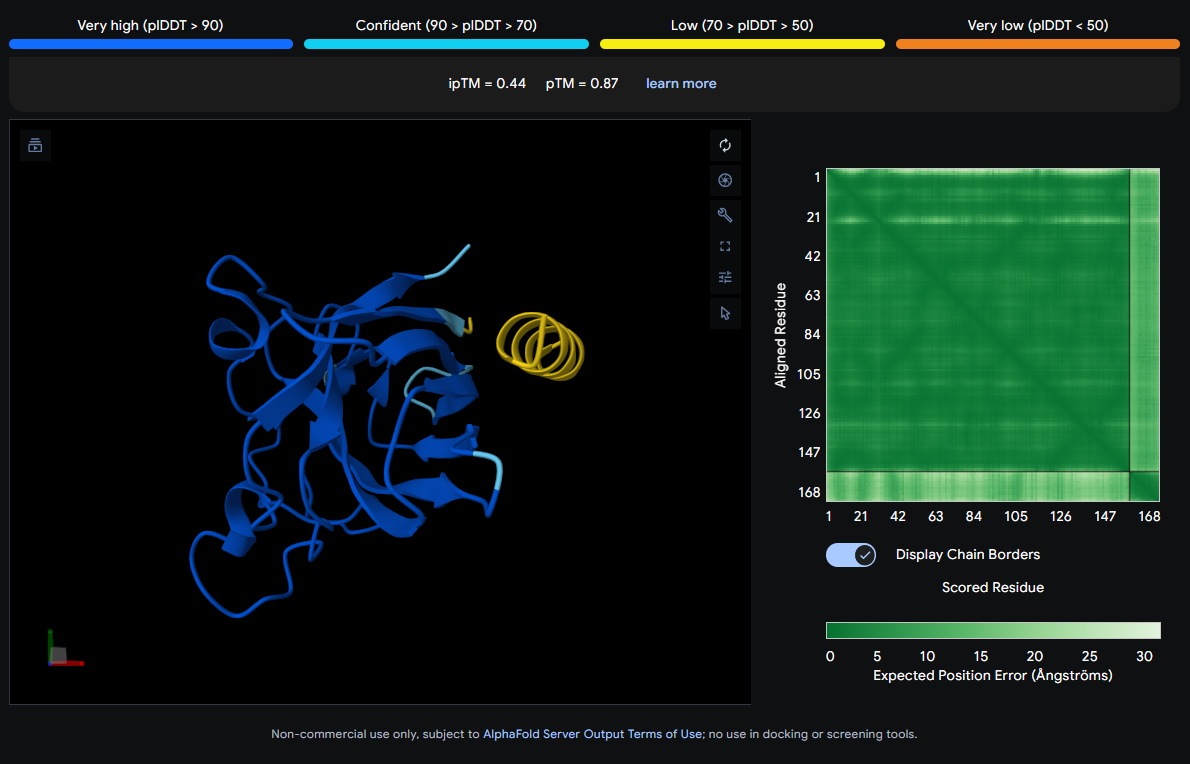
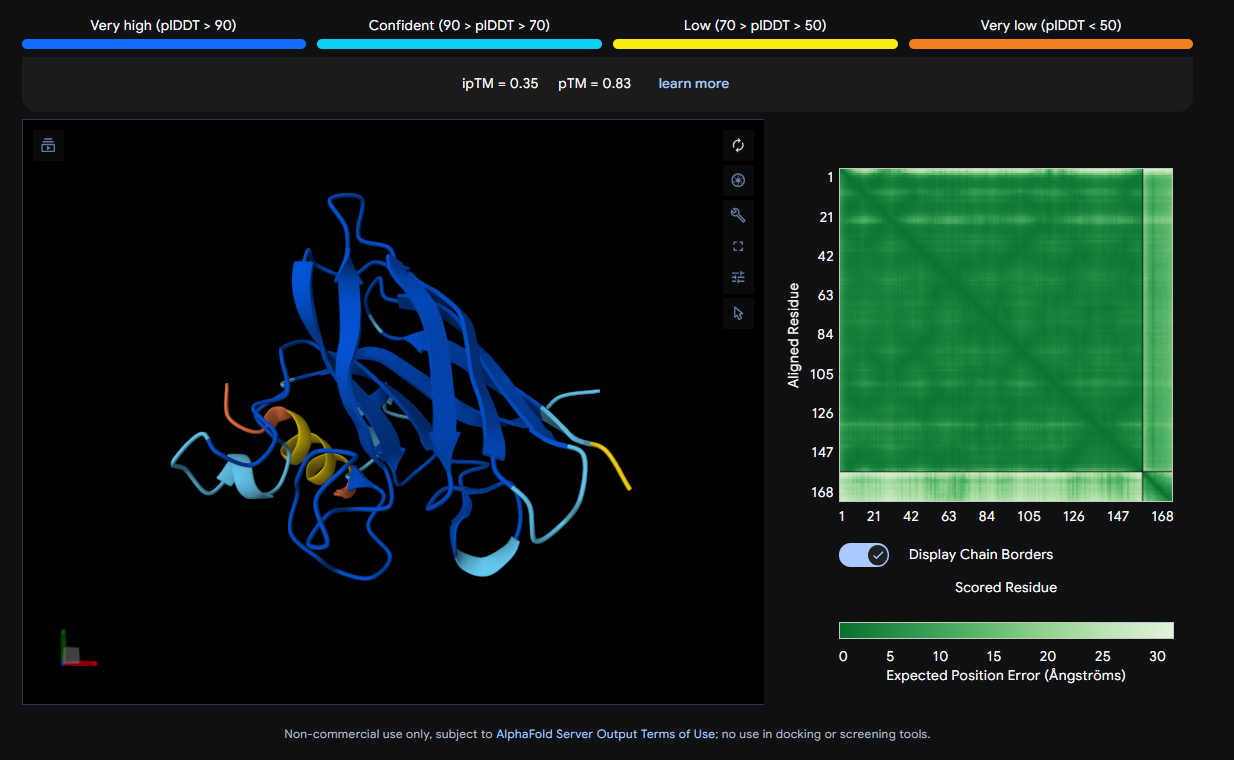
Job 2: Mutated SOD1 and Binder 1: SRWDEYTAVVAWARK
The peptide (visible as a yellow coil) appears to dock away from the main β-barrel body — positioned more distally and looking loosely tethered. It does not appear buried and likely represents a surface-level interaction, possibly near an external loop rather than the A4V mutation site directly.
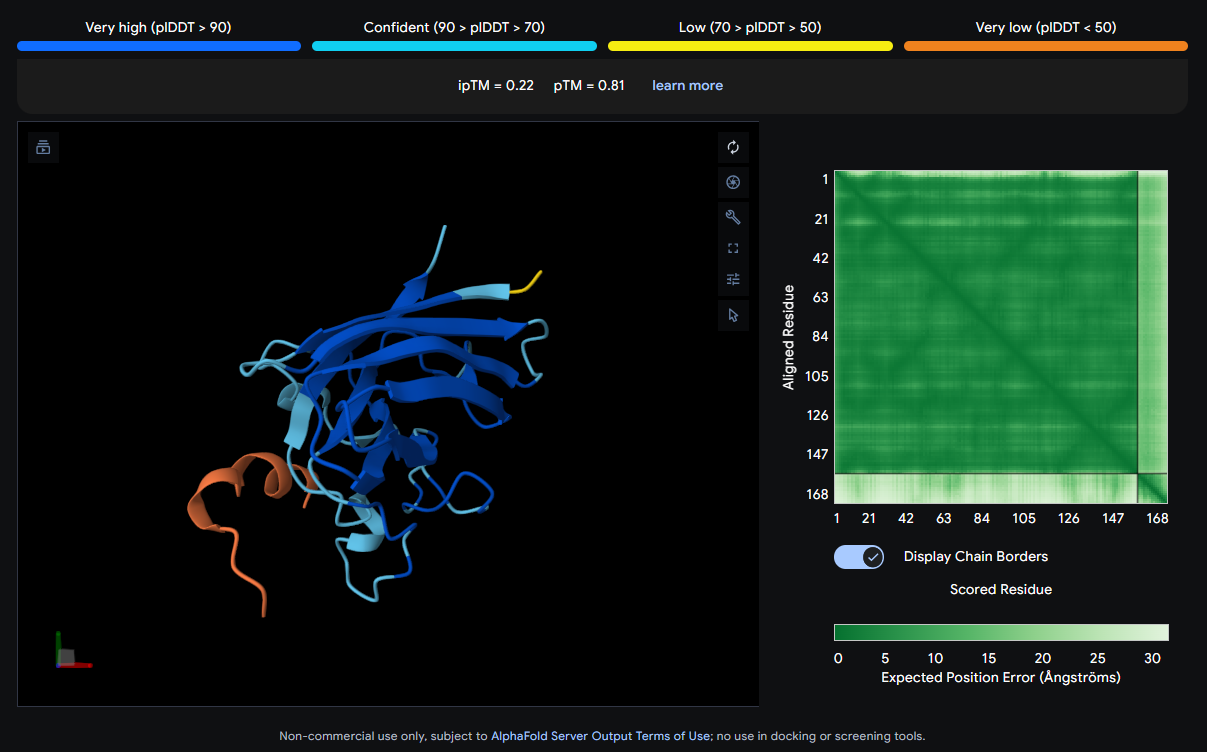
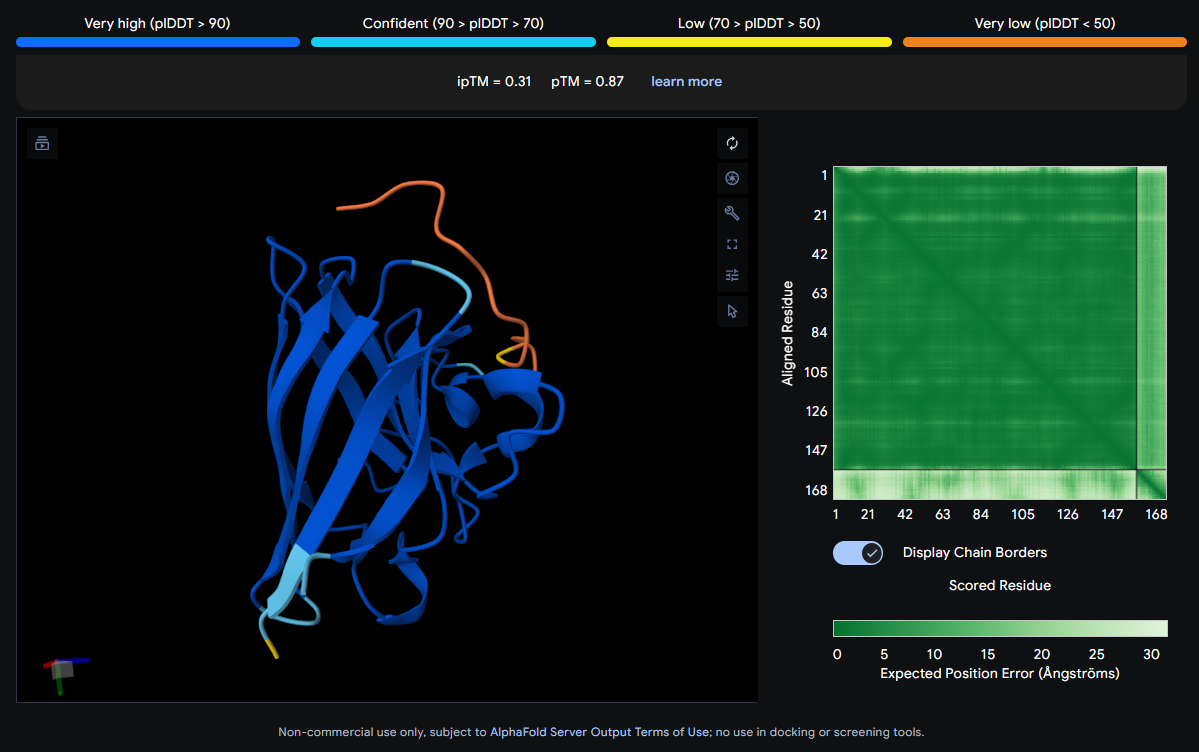
Job 3: Mutated SOD1 and Binder 2: SWYGEYTGVVAWRKK
The peptide (orange/red loop) appears to contact the β-barrel on a lateral face and partially approaches what could be the dimer interface region. It sits more surface-exposed rather than buried.
Job 4: Mutated SOD1 and Binder 3: AHWPEYVVVVEWKKK
The peptide (yellow, compact) appears to bind near the front face of the β-barrel and shows relatively close association with the protein body. It could be engaging a region near the electrostatic loop or β-barrel surface, though not deeply buried.
Job 5: Mutated SOD1 and Binder 4: SRVDEYTVRKKWARK
The peptide (orange/red) drapes along one edge of the SOD1 structure, appearing surface-bound. Its positioning is loosely consistent with an approach toward the N-terminal β-strand region where A4V resides, though definitive localization is limited without residue-level contact maps.
ipTM Scores and Binding Description
Binder
Sequence
ipTM
pTM
0 (Known)
FLYRWLPSRRGG
0.32
0.77
1
SRWDEYTAVVAWARK
0.44
0.87
2
SWYGEYTGVVAWRKK
0.22
0.81
3
AHWPEYVVVVEWKKK
0.35
0.83
4
SRVDEYTVRKKWARK
0.31
0.87
None of the peptides show convincing deep burial, suggesting predominantly surface-level or shallow groove engagement with the β-barrel exterior.
The ipTM scores across all five complexes range from 0.22 to 0.44, values that collectively sit in the low-to-moderate confidence range for inter-chain interaction quality. The known binder (FLYRWLPSRRGG) achieves an ipTM of 0.32, which serves as the reference benchmark. Notably, Binder 1 (SRWDEYTAVVAWARK) is the only PepMLM-generated peptide to exceed this, reaching an ipTM of 0.44. A meaningful improvement of ~0.12 over the known binder. Binder 1 stands out as the most structurally promising among the generated candidates.
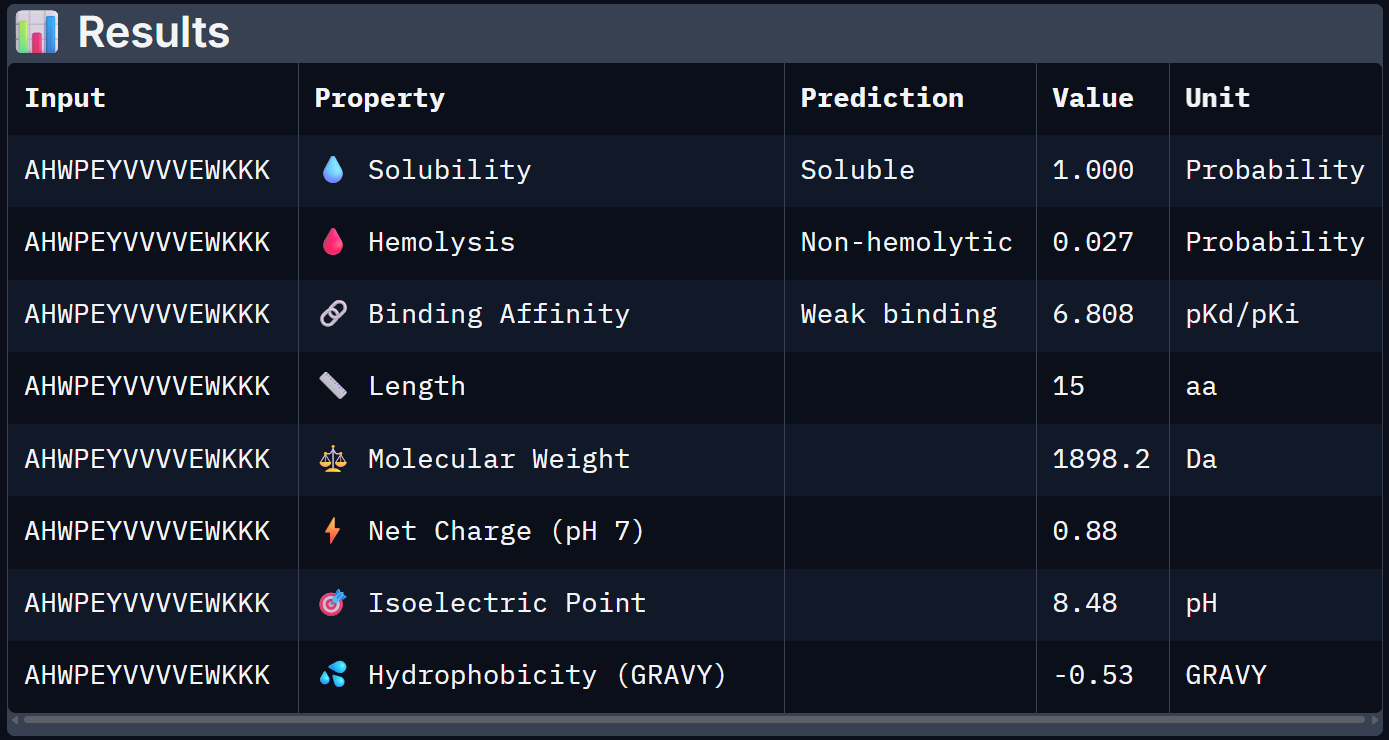
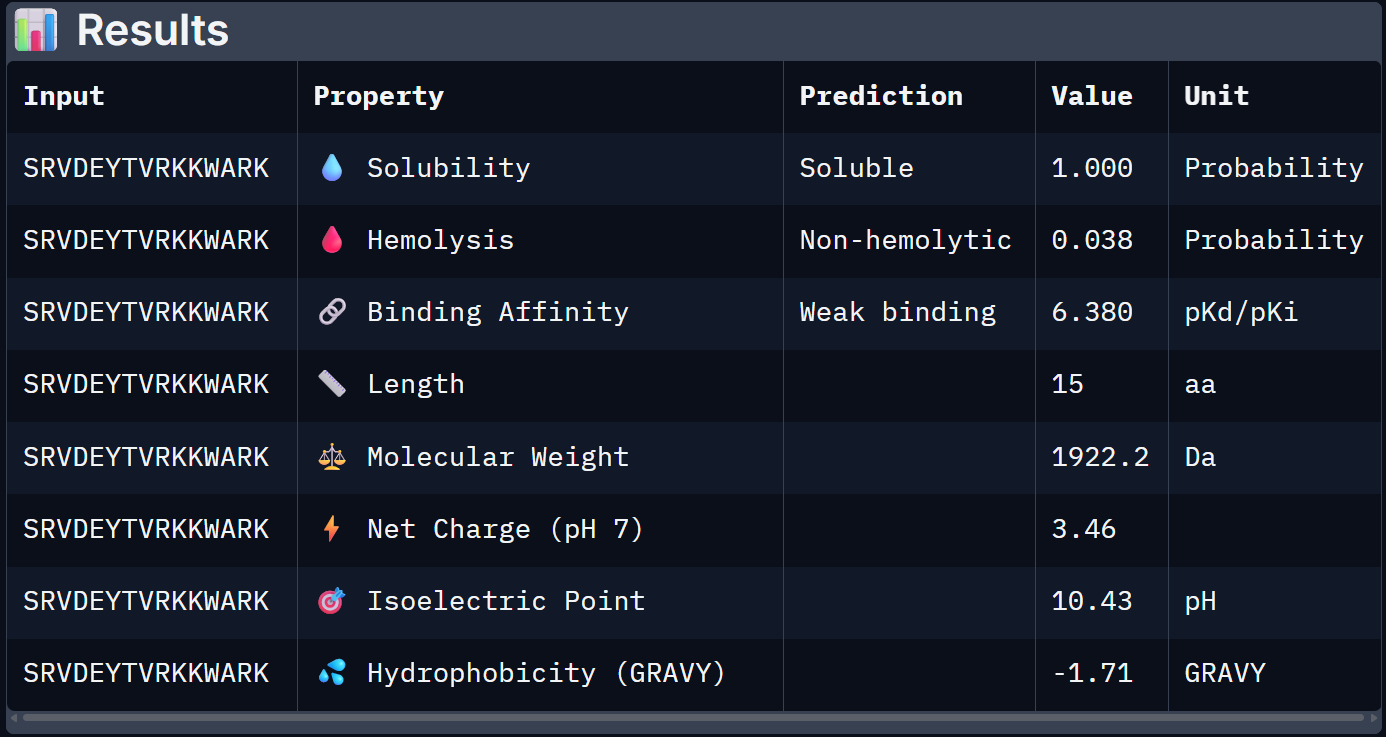
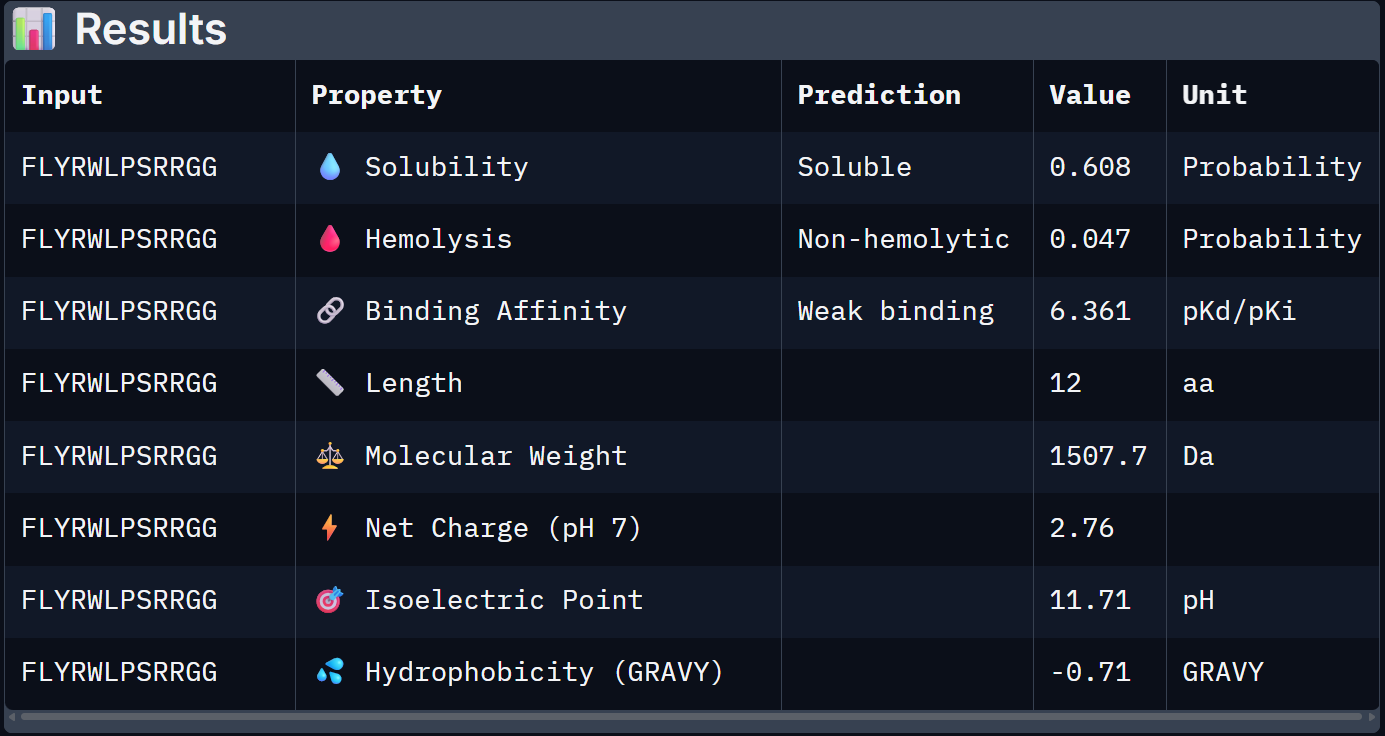
Part 3: Evaluate Properties of Generated Peptides in the PeptiVerse
Now we had to evaluate the properties of the generated peptides, we use PeptiVerse for this.
The workflow was simple, paste the peptide seq and paste mutated SOD1 seq, check the boxes according to the homework: Predicted binding affinity, Solubility, Hemolysis probability, Net charge (pH 7), Molecular weight. Here are the results.
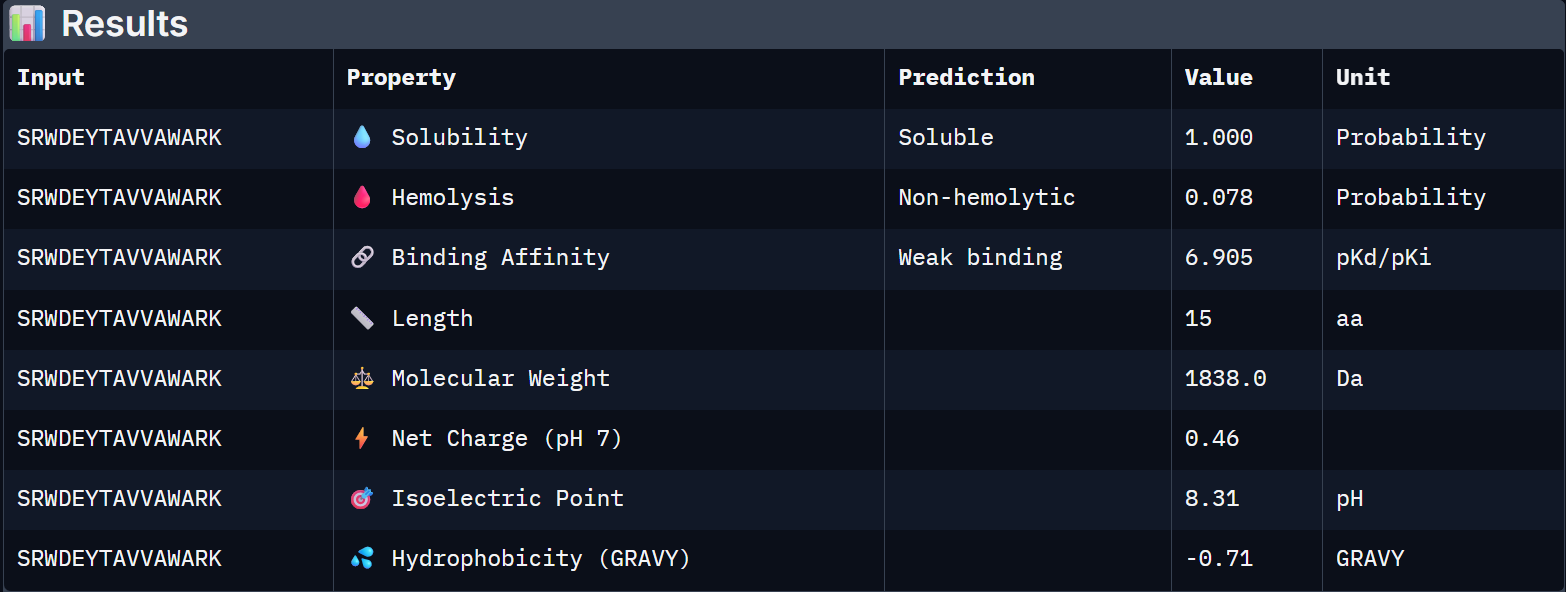
For Peptide 1: SRWDEYTAVVAWARK
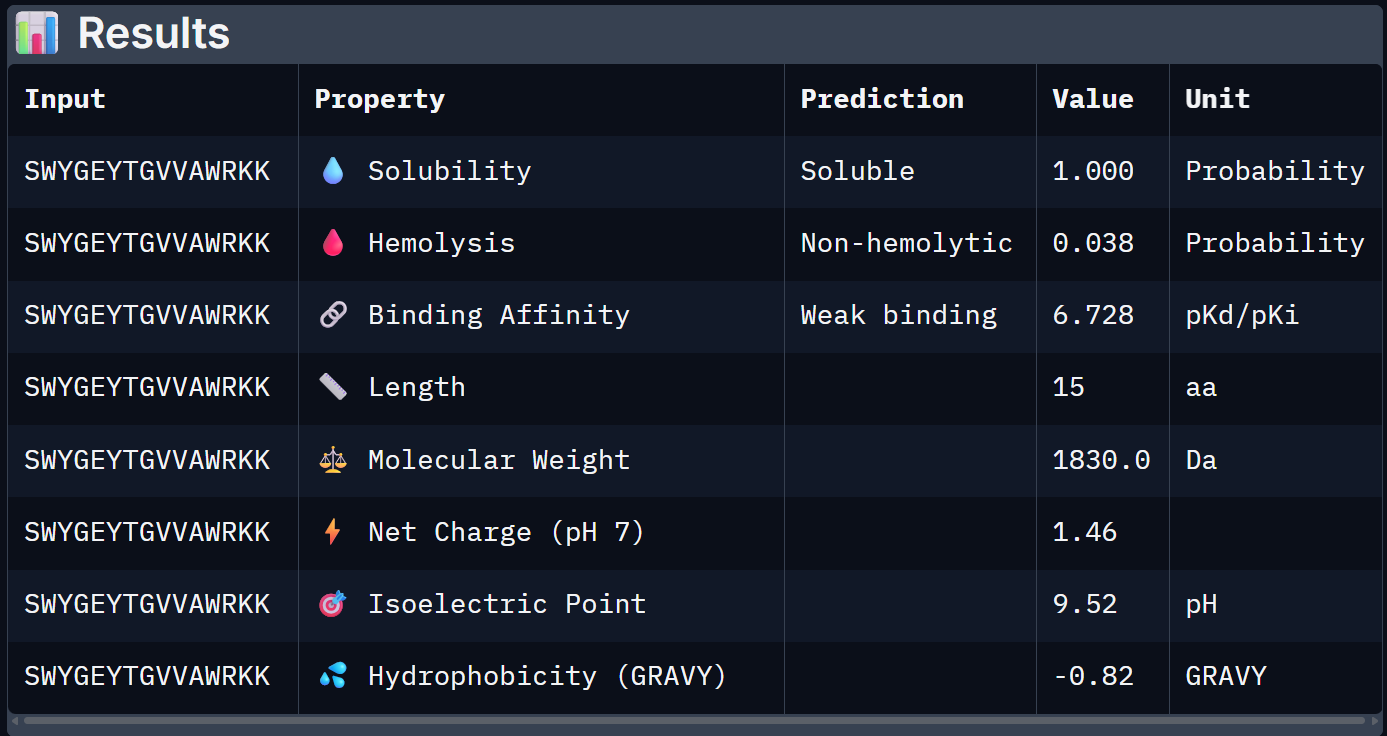
For Peptide 2: SWYGEYTGVVAWRKK
For Peptide 3: AHWPEYVVVVEWKKK
For Peptide 4: SRVDEYTVRKKWARK
For Peptide 0, not generated but known: FLYRWLPSRRGG
Binder
Solubility
Hemolysis Prob.
Binding Affinity (pKd)
Net Charge (pH 7)
MW (Da)
0 – FLYRWLPSRRGG
0.608
0.047
6.361
+2.76
1507.7
1 – SRWDEYTAVVAWARK
1.000
0.078
6.905
+0.46
1838.0
2 – SWYGEYTGVVAWRKK
1.000
0.038
6.728
+1.46
1830.0
3 – AHWPEYVVVVEWKKK
1.000
0.027
6.808
+0.88
1898.2
4 – SRVDEYTVRKKWARK
1.000
0.038
6.380
+3.46
1922.2
When the PeptiVerse predictions are overlaid with the AlphaFold3 structural data, a reasonably coherent picture emerges. Binder 1 (SRWDEYTAVVAWARK) leads on both fronts. The highest ipTM (0.44) and the strongest predicted binding affinity (6.905 pKd), suggesting that the structural confidence in its interface correlates with a tighter predicted binding interaction. This is the clearest case of structural and biochemical agreement. Binder 3 (AHWPEYVVVVEWKKK) also performs consistently. It has a moderate ipTM of 0.35 pairs with an affinity of 6.808 pKd and the lowest hemolysis probability (0.027), making it the safest therapeutic candidate on safety metrics.
Binder 1 is the clear choice to advance. It uniquely leads on the structural confidence metric (ipTM = 0.44, the only one to exceed the known binder), has the highest predicted binding affinity (6.905 pKd), is perfectly soluble (1.000), and is non-hemolytic. Its near-neutral net charge (+0.46) is also favorable.
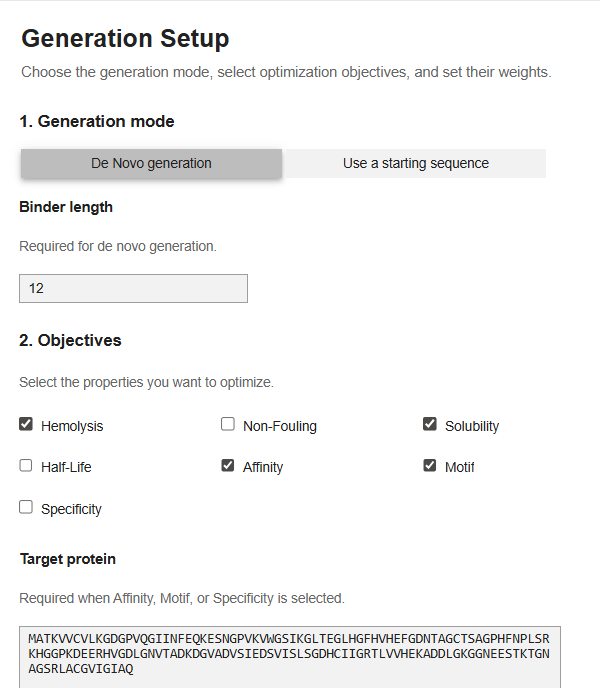
Part 4: Generate Optimized Peptides with moPPIt
Now for the last part, I was supposed to generate better and optimized peptides using moPPit Colab . I copied the Colab notebook. After running the first two cells, to clone the Github repo and install requirements. I found the cell with the generation setup, I chose ‘de-novo synthesis’ pasted my mutated SOD1 sequence in the target protein sequence. The target protein box opens up when you select motif/affinity guidance. I chose residues 1-10 and set the peptide length to 12. I enabled motif and affinity guidance and generated the peptides.
My parameters.
This was the point upto which the code functioned. I tried my best to run the code but on the Colab there was always an error repeated, I tried in a new runtime, I tried all kinds of hacks using Gemini but it didn’t work. I tried finding an alternative access platform for moppit but it wasn’t available. I decided to just see the generated peptides of other people. I noticed that the moppit generated proteins are actually more optimized to the specific goal that we are trying to achieve, based on the weights, I think. (solubility, hemolysis etc.)
As about the evaluation prior to clinical studies, I would do more in-silico binding simulations, then screen the successful candidates to in-vitro binding assays like ELISA, then look for real hemolytic, cytotoxic property and then possibly move on to animal studies.
Part C L-Protein Mutants
Option 1: Mutagenesis
I used the Colab Notebook, provided in the pdf. Notebook I pasted in the L-Protein sequence and ran the notebook to get the per-substitution LLR scores and then I got a list top 20 mutations with positive score mutations.
Position
Wild_Type_AA
Mutation_AA
LLR_Score
50
K
L
2.561468
29
C
R
2.395427
39
Y
L
2.24178
29
C
S
2.04315
9
S
Q
2.014325
29
C
Q
1.997049
29
C
P
1.971029
29
C
L
1.960646
50
K
I
1.928801
53
N
L
1.864932
61
E
L
1.818098
52
T
L
1.813968
50
K
F
1.802069
29
C
T
1.797247
29
C
K
1.795878
5
F
Q
1.795244
5
F
R
1.659717
29
C
A
1.648656
27
Y
R
1.628061
22
F
R
1.602028
5
F
P
1.596891
50
K
V
1.594576
50
K
S
1.574557
5
F
T
1.559024
5
F
S
1.556417
45
A
L
1.539248
39
Y
S
1.517457
27
Y
S
1.497053
40
V
L
1.47763
27
Y
L
1.474637
22
F
S
1.423358
29
C
E
1.383281
39
Y
A
1.364999
29
C
N
1.362601
50
K
A
1.357795
29
C
I
1.344121
5
F
L
1.332615
17
N
R
1.323651
39
Y
I
1.320103
39
Y
T
1.302804
26
D
R
1.268762
29
C
H
1.246107
39
Y
F
1.245851
39
Y
V
1.24439
23
K
R
1.236555
25
E
R
1.22935
24
H
R
1.227779
50
K
T
1.222131
27
Y
Q
1.218851
27
Y
T
1.215567
Cross-checking this with the experimental data provided along with the homework. I found out that there are only two overlapping mutations.
Position 29: C→R Experimental Lysis=0 LLR Score=2.3954
. Position 50: K→I Experimental Lysis=0 LLR Score=1.9288
Now. categorizing beneficial mutations by region. I found out that
19 mutations improved lysis (Lysis=1)
63 mutations impaired lysis (Lysis=0)
Regional Distribution
Region
Positions
Beneficial Mutations
Transmembrane
35–59
3
Soluble
1–34, 60–75
16
84% of beneficial mutations occur in soluble regions.
Top Beneficial Experimental Mutations
Soluble Region
Position
Mutation
Effect
13
P→L
Improved lysis
15
S→A
Improved lysis
18
R→G
Improved lysis
18
R→I
Improved lysis
19
R→S
Improved lysis
Transmembrane Region
Position
Mutation
Effect
44
L→P
Improved lysis
45
A→P
Improved lysis
46
I→F
Improved lysis
Top Language Model Predictions
Position
Mutation
LLR Score
Region
50
K→L
2.5615
Transmembrane
29
C→R
2.3954
Soluble
39
Y→L
2.2418
Transmembrane
29
C→S
2.0431
Soluble
9
S→Q
2.0143
Soluble
Selection of 5 Candidate Mutations
The criteria for selection was:
Prioritized high LLR scores
Considered experimental evidence
Maintained regional balance (TM + soluble)
Avoided redundant positions
Focused on mutations supported by both datasets
Here’s a list of selected Candidate Mutations
Mutation
Region
LLR Score
Key Rationale
K50L
Transmembrane
2.5615
Highest-scoring mutation; increases TM hydrophobicity and may improve membrane insertion
Y39L
Transmembrane
2.2418
Enhances hydrophobic packing within TM helix
C29R
Soluble
2.3954
High-scoring mutation that may improve oligomerization despite weak experimental support
S9Q
Soluble
2.0143
Likely enhances hydrogen bonding and N-terminal stability
A45P
Transmembrane
1.5392
Experimentally validated (Lysis=1); may improve pore geometry via helix kink formation
Week 6 HW: Genetic Circuits I
DNA Assembly
What are some components in the Phusion High-Fidelity PCR Master Mix and what is their purpose?
The Phusion Hi-Fi PCR Master Mix has multiple components like the Phusion Hot Start II DNA Polymerase is the central enzyme. It is a polymerase enzyme with 3’ to 5’ exonuclease activity that corrects mismatched bases and therefore has low error rates than Taq polymerase. The ‘Hot Start’ part in the name refers to the modification done to enzyme to keep it inactive until the initial denaturation step so that the polymerase doesn’t amplify some other DNA at room temperature. The mix also contains dNTPs which is a given as the nucleotides are the building blocks used for extension. Another component is MgCl2 which is a cofactor required for polymerase activity, The magnesium ion helps in catalysis of the phosphodiester bond formation between nucleotides. Magnesium ions are also important to form active substrate from dNTPs which is recognized by polymerase. (The magnesium ions neutralize some of the charge of the triphosphate group so they can fit into the active site of the polymerase without hindrance) Other components in the mix are Reaction Buffer and Stabilizers. The buffer maintains the optimal pH and Ionic strength for enzyme activity.
What are some factors that determine primer annealing temperature during PCR?
The annealing temperature is usually set 5 degree celsius below the melting temperature of the primer. (The melting temperature is the temperature at which half the DNA is separated and half is still attached ) The factors that dictate the melting temperature (and anneling temperature as it is set 5 degrees below Tm) are:
primer length (longer primer = higher melting temperature)
There are two methods from this class that create linear fragments of DNA: PCR, and restriction enzyme digests. Compare and contrast these two methods, both in terms of protocol as well as when one may be preferable to use over the other.
The two methods do create DNA fragments but their uses are very different. PCR amplifies existing DNA and creates new fragments. Restriction enzymes cut existing DNA and form fragments, shredding existing into pieces, not creating new DNA.
PCR amplifies a specific sequence via the use of primers and a polymerase whereas Restriction enzymes cut a DNA at specific sites, separating fragments from an existing DNA molecule. PCR only requires knowledge of primers to create a specific fragment, using RE requires knowledge of existing restrictions sites in the DNA.
PCR is preferably when a sequence needs to be amplified and doesn’t exist as an isolated fragment or if you want to work with complex DNA and fragment it fro better study. RE digestion is preferrable, when the DNA contains compatible restriction sites.
PCR can generate any fragment with primer design but RE digestion is limited by where restriction sites naturally occur.
How can you ensure that the DNA sequences that you have digested and PCR-ed will be appropriate for Gibson cloning?
Gibson Assembly requires that the insert and vector share 15-30 base pairs of overlapping homologous sequence at their junctions. PCR fragments can be ensured to be Gibson-compliant by designing primers with 5’ overhangs that are homologous to the adjacent sequence in the vector. After the PCR, the overlaps will be built into the ends.
As for RE-digested fragments, they are less commonly used in Gibson Assembly as restriction sites rarely leave exact overlapping sequences. But we can try and verify that the sequences left after digestion are compatible with the adjacent vector. Tools like Snapgene/Benchling can be used for In-Silico verification and confirm that the overlaps are 15-30 bp and contain no repetitive sequences.
How does the plasmid DNA enter the E. coli cells during transformation?
The most common lab method is heat-shock transformation using chemically competent Escherichia coli cells. Cells are treated with cold Calcium Chloride. This helps plasmid DNA stick closer to the cell surface by reducing charge repulsion between the negatively charged DNA and the negatively charged cell membrane. Then the cells are briefly warmed (usually 42°C for 30–45 seconds). This sudden temperature change temporarily makes the membrane more permeable, allowing some DNA to enter the cell. After entering, the Plasmid must remain intact and begin replicating using its own origin of replication.
Another method is Electroporation: A short high-voltage pulse creates temporary pores in the membrane, allowing DNA to enter. This is usually more efficient than heat shock, but it requires special equipment and specially prepared cells.
Describe another assembly method in detail (such as Golden Gate Assembly) in 5-7 sentences with diagrams.
Credits to SnapGene for Diagram
Golden Gate Assembly is a cloning method used to join DNA fragments in a chosen order in one reaction. It uses a Type IIS restriction enzyme such as BsaI, which cuts outside its recognition site and creates custom-designed overhangs. These overhangs allow DNA fragments and the vector to fit together specifically and directionally. The reaction contains both BsaI and T4 DNA Ligase, so cutting and joining happen in the same tube during temperature cycling. Incorrect products are cut again, while correct assemblies remain intact. This makes the method efficient for assembling multiple fragments at once. Golden Gate Assembly is popular because it is fast, accurate, and leaves no unwanted extra sequence at the junctions.
Modelling a Golden Gate Assembly in Benchling is fairly easy. I downloaded the sequences, I wanted to assemble together. I use PUC19 Plasmid as the backbone. I used Benchling’s Assembly feature and selected Golden Gate assembly. Benchling calculated the primer pairs and everything else.
Asimov Kernel
I logged in with the credentials from the BioClub Tokyo Chat then according to the homework, I created a repository for my work. (pretty simple)
Next step was to create a blank Notebook entry to document the homework, I created it and saved it to the same repository.
Next up is some exploration! I had to explore the the devices in the Bacterial Demos Repo. I found it in all repositories. Time to explore!
There were a lot of things to see. I had to see the ‘Repressilator’ specifically according to the homework brief.
So this was the repressilator that I was supposed to recreate. I was fascinated by the sheer amount of data being thrown at me. I wanted to know what this exactly was, I found some info in the info tab. duh.
I ran the simulation and I got a bunch of graphs.
Now the next step according to the homework was recreating the Repressilator. I made a list of the parts from the time I opened the Repressilator. Then I went an recreated it.
Created an empty construct
Now into the empty construct, I’ll find the parts according to the Repressilator screenshot and recreate the Repressilator.
I don’t know if this is cheating, am I supposed to recreate it from memory? but yeah this is how I did it. Side by Side. Drag and Drop. I like the interface, it’s clean and intuitive. It feels like MS Word for Constructs.
Done, matching perfect! The Repressilator has been recreated. The parts library is huge. I really don’t have metric of comparison so I could be wrong, but searching for parts made me see the various parts they have and maybe in the future, Asimov Kernel will be for Synthetic Biology like Blueprints is for Unreal Engine. Now only recreating won’t do. I have to test if it works like the original.
While I waited for the simulation to finish, (I had to choose the same parameters that I did with the original so that I can compare properly) I searched up on what Asimov Kernel was and damn, it has so many features! It really could be the drag & drop for strain / plasmid design, for synbio. It surely would help students a lot. I went on to see pricing but lol, they don’t have anything like that. I am glad I got to use this. I’m excited to see where this goes. The simulation was done and the graphs match the Original Repressilator simulation outputs. RECREATION SUCCESSFUL!
Now we create 3 of my own constructs using the parts in the characterized bacterial parts repo.
Construct 1:
For the first construct, I tried to make this transcriptional NOT gate. high TerR will lead to low AmeR output.
I expect that the AmeR protein level should be inversely correlated to TetR
The simulation results. I added aTc at hour 0 in the first simulation, and therefore AmeR reached steady state almost immediately. In the second simulation, I added aTc at hour 24, where the difference was visible.
Run 1
Run 2
For the other two constructs, I just tried swapping out stuff and experimenting.
Construct 2:
For the second construct, I just replaced pTet with pBad.
I changed the ligand in the simulation from aTc to Arabinose. I expected the same behaviour like Construct 1 but maybe the shape of curve would be different.
The pBad curve was indistinguishable from pTet.
Construct 3:
For the third construct, I replaced AmeR with LacI as LacI is a larger protein then AmeR, I wanted to see if that would affect anything.
RNA transcript plateaus at ~2.0 vs ~3.5 for AmeR which is noticeably lower
Protein steady state looks similar but the RNAP flux bars appear slightly lower (~2.3 vs ~4.3)
Week 7 HW: Genetic Circuits II
What advantages do IANNs have over traditional genetic circuits, whose input/output behaviors are Boolean functions?
Traditional genetic circuits are boolean, like the question says. Therefore, they can be either ‘on’ or ‘off’ and only can compute boolean functions. Limiting the cell’s computational ability. IANNs are different in the way that they produce continuos signals, they can take in multiple inputs. I think the benefits of IANNs over conventional genetic circuits are synonymous to the benefits of a neural network over a hard-coded solution. IANNs can react to novel inputs whereas the conv. genetic circuits can only respond to the input they were designed for.
Describe a useful application for an IANN; include a detailed description of input/output behavior, as well as any limitations an IANN might face to achieve your goal.
A cell engineered with an IANN to continuously monitor the biomarkers of active demyelination, which is a common symptom in grave condtions like MS or Alzheimers. The input could be the MBP (myelin basic protein) fragment concentration (direct readout of myelin dmg) , neurofilament light chain (direct readout of axon dmg) and local ROS (indicator of inflammatory stress) and the output could be a fluoroscent compound or a peptide showing the stage of demyelination.
Below is a diagram depicting an intracellular single-layer perceptron where the X1 input is DNA encoding for the Csy4 endoribonuclease and the X2 input is DNA encoding for a fluorescent protein output whose mRNA is regulated by Csy4. Tx: transcription; Tl: translation. Draw a diagram for an intracellular multilayer perceptron where layer 1 outputs an endoribonuclease that regulates a fluorescent protein output in layer 2.
Diagram made in Photoshop.
Assignment 2
What are some examples of existing fungal materials and what are they used for? What are their advantages and disadvantages over traditional counterparts?
Some existing fungal materials are mycelium composites that use dense hyphal network of fungi like Ganoderma grown on agricultural waste to form rigid, foam like structures. They are used for packaging and thermal insulation. The advantages they have are that they are fully biodegradable, the production method is carbon sequestering and they can be grown into arbitrary molds with minimal energie. The disadvantages are that they have lower compressive strength & impact resistance than plastics. They are also very sensitive to moisture and the growth conditions need to sterile which can be tough to maintain in large scale operations. There are also mycoprotein foods that are used as meat substitutes. They are nutritionally well built and do far fewer pollution and can be produced continuously in bioreactors. Fungi have also been used to produce dyes and pigments. They have lower color permanence than their synthetic counterparts.
What might you want to genetically engineer fungi to do and why? What are the advantages of doing synthetic biology in fungi as opposed to bacteria?
The reasonable and next best thing to do would be to engineer fungus to produce materials with more tensile strength and water resistance than the current ones. Fungi can be used as biosensors to express certain colored reporters in responses to environmental pollution. The advantages of fungi over bacteria are that they are eukaryotes therefore closer to human cells. They possess the post-translational modification machinery that is need to produce complex mammalian proteins. Fungi naturally forms large 3D structures making it suitable for large scale production.
Week 9 HW:Cell-Free Systems
Homework Part A: General and Lecturer-Specific Questions
General homework questions
Explain the main advantages of cell-free protein synthesis over traditional in vivo methods, specifically in terms of flexibility and control over experimental variables. Name at least two cases where cell-free expression is more beneficial than cell production.
Cell-free protein synthesis is an open system that enables you to directly add, remove or titrate any reaction without the constraints of using a living system. Reaction conditions can be freely manipulated and this is special because a living system with cellular homeostasis resists such changes. CFPS provides advantages over cell-based production in scenarios like toxic protein production. Many protein that are lethal to the host cell when expressed in vivo. In a cell-free system, there is no host, so the reaction can pump out higher yields. Another case where CFPS fares better than cell-based approach is experimentation, CFPS can be used to test gene variants, enzymes, tweak pathways without waiting for or managing a living system.
Describe the main components of a cell-free expression system and explain the role of each component.
A CFPS system contains following components:
Cell extract
The central component of the system. It is prepared by lysing cells and removing cell debris. It contains ribosomes, Translation factos, tRNA synthesases, chaperones, RNA Polymerase and tRNAs. It is the entire transcription and translation machinery.
DNA Template
This is the gene of interest with a promoter that is compatible with the machinery in the cell extract.
Amino Acids
These are the substrates/building blocks for the translation. All amino acids are provided at saturating concentrations.
Energy Regeneration Systems
The system provides and recycles ATP and GTP. common systems include phoshpocreatine/creatine kinase, PEP etc. This system ensure that the translation doesn’t stall.
Buffer and Salts
Usually Tris buffer at neutral pH with Mg2+ and K+ concentrations optimized for the reaction. Mg2+ is critical for ribosome stability.
Cofactors
The cofactors like NAD, CoA etc. support enzyme activity, protein folding and reaction stablity.
Why is energy provision regeneration critical in cell-free systems? Describe a method you could use to ensure continuous ATP supply in your cell-free experiment.
A cell-free extract is not a living system, therefore it doesn’t actively generate ATP through processes like oxidative phosphorylation/glycolysis. A cell-free extract is a closed system in which ATP is consumed irreversibly unless actively replenished. ATP is important to the entire system as ATP drives AA activation by aminoacyl-tRNA synthases and fuels the GTPase driven translocation on the ribosome. So a continuous regen system becomes crucial to the process. A method for ensuring a continuous supply of ATP is using Phosphocreatine/Creatine Kinase system. Phosphocreatine donates its phosphate group to ADP, regenerating ATP via the enzyme creatine kinase. This is a standard system used in E.coli based CFPS systems.
Compare prokaryotic versus eukaryotic cell-free expression systems. Choose a protein to produce in each system and explain why.
Diagram created Via ChatGPT-Image2 Model.
A protein for the prokaryotic system would be GFP (Green Fluoroscent Protein)
GFP is a simple protein that doesn’t need any post-translational modification for fluorescence, therefore it folds correctly in an E.coli system.2 It is an ideal candidate for rapid prokaryotic cell-free expression. It’s is frequently used in E.coli as a reporter.
A protein for the eukaryotes would be erythropoietin, which is a human glycoprotein hormone, it is a complex protein. Producing it in E.coli would produce a non-glycosylated product as E.Coli lacks the machinery for post-translational modifications. Using a eukaryotic system like HeLa with the necessary ER machinery to glycosylate the protein will produce a better product.
How would you design a cell-free experiment to optimize the expression of a membrane protein? Discuss the challenges and how you would address them in your setup.
Membrane proteins are amphipathic in nature and due to the transmembrane domains being hydrophobic, they will aggregate in aqueous conditions. This will lead to precipitation of the target protein before it can fold properly in a standard CFPS reaction, reducing the amount of protein product. One approach to solve this would be to incorporate the reaction with liposomes or some type of a scaffold that bypasses aggregation of the product. In order to supplement this approach, reducing the Mg2+ concentration and thus reducing the translation rate would slow the reaction, giving the product time to properly engage with the scaffold/liposome.
Imagine you observe a low yield of your target protein in a cell-free system. Describe three possible reasons for this and suggest a troubleshooting strategy for each.
The cell-free system hinges mainly on three main components; The template, the energy system and the product. The problems could be in any of these three components. One of the reasons for a low yield would be the template instability, the template might be getting degraded quickly or the design of the template makes it tough to be expressed. Another reason for low yield could be the energy system, if the energy system in non-functional or sub-optimal in function (there are inhibitory byproducts etc.) then the reaction will stall before the yield can peak. Aggregation of the product protein could make it invisible to the western blot, this could also be one of the reasons.
Homework question from Kate Adamala
1a. What would your synthetic cell do? What is the input and what is the output?
The synthetic cell is a low-cost arsenic contamination sensor for drinking water. Arsenic poisoning via contaminated groundwater harms a considerable amount of people every year. Working in an environmental testing lab, I know the level of contamination that exists in rural water bodies. The synthetic cell would have the arsenite dissolved in the water as the input. The output would be a visible blue color produced inside the vesicle by the chromoprotein amilCP. If the water sample turns the synthetic cell suspension blue, arsenic is present above the detection threshold.
1b. Could this function be realized by cell-free Tx/Tl alone, without encapsulation?
Yes, a bulk cell-free reaction with the same ArsR circuit and amilCP reporter would also produce color in the presence of arsenite. But encapsulation would provide benefits like protection of the cell machinery from other contaminants in the water that could possibly inhibit the reaction. Also encapsulation, adds stability to the entire system, making it possible to be dried, stored, shipped making it viable for low resource regions of the world.
1c. Could this function be realized by a genetically modified natural cell?
Yes, possibly E. coli engineered with the same ArsR-pArs-amilCP circuit would function as a whole-cell biosensor and has been demonstrated in the literature. (Chen, S., Zhang, Y., Li, R., Wang, B., & Ye, B. (2022). De Novo Design of the ArsR Regulated Pars Promoter Enables a Highly Sensitive Whole-Cell Biosensor for Arsenic Contamination. Analytical Chemistry, 94, 7210 - 7218. https://doi.org/10.1021/acs.analchem.2c00055.) However, using living GMO cells for field water testing carries biosafety concerns (containment, environmental release), requires special handling procedures and might invite ethical concerns. The synthetic cell is non-living, non-replicating, and contains no viable organism, which makes it simpler to use.
1d. Describe the desired outcome of your synthetic cell operation.
When a water sample containing arsenic above the threshold (~10–50 µg/L, the WHO guideline limit) is added to a vial of synthetic cells, arsenite diffuses across the membrane, binds the ArsR repressor inside, de-represses the arsenic-responsive promoter, and the cell-free system produces amilCP. The suspension turns visibly blue within 4–6 hours, readable by eye with no equipment. Clean water samples produce no color change.
2a. What would the membrane be made of?
POPC and cholesterol in a 4:1 molar ratio. POPC provides a stable, fluid bilayer at room temperature. No special modifications are needed. The key property required is that the membrane is permeable to small neutral molecules, which POPC:cholesterol bilayers naturally are. Arsenite at physiological-range pH exists primarily as arsenious acid (H₃AsO₃), an uncharged small molecule that crosses lipid bilayers by passive diffusion without any transporter.
2b. What would you encapsulate inside?
Bacterial cell-free Tx/Tl system (E. coli S30 extract)
DNA construct: amilCP (blue chromoprotein) under the arsenic-responsive promoter pArs, with ArsR binding operator
ArsR protein: either purified and added directly, or encoded on the same DNA under a constitutive promoter so it is expressed first and accumulates before any arsenite arrives
Phosphocreatine (40 mM) + creatine kinase for ATP regeneration
2c. Which organism will the Tx/Tl system come from?
Bacterial (E. coli S30 extract). ArsR is a native E. coli regulator, the pArs promoter functions in E. coli-based cell-free systems, and amilCP expresses well in prokaryotic extract.
2d. How will the synthetic cell communicate with the environment?
Only in one direction, and passively. Arsenite (H₃AsO₃) diffuses across the POPC membrane without any transporter, driven by its concentration gradient from the water sample into the vesicle interior. Once inside, it binds ArsR. There is no output molecule that needs to cross the membrane, amilCP stays inside the vesicle and is visible as a blue color through the transparent bilayer. The system requires zero membrane proteins.
arsR (E. coli K-12, UniProt P0AE18) — under constitutive promoter J23101; encodes the arsenic-responsive repressor that sits on the pArs operator and is displaced by As³⁺
amilCP (blue chromoprotein from Acropora millepora, Addgene) — under pArs promoter with ArsR operator; produces visible blue color without UV light, no cofactor required
3b. How will you measure the function of your system?
Visual readout (primary): Add synthetic cells to water samples spiked with 0, 10, 50, 100, and 500 µg/L arsenite. Incubate at room temperature for 6 hours. Score color development by eye; blue = arsenic detected. This is the intended end-use readout requiring no instruments.
Controls:
Positive control: synthetic cells + 100 µg/L arsenite → should turn blue
Negative control: synthetic cells + clean water → no color
Specificity control: synthetic cells + other heavy metals (lead, cadmium, mercury at equivalent concentrations) → should produce no color, confirming ArsR specificity for arsenic
Homework question from Peter Nguyen
Write a one-sentence summary pitch sentence describing your concept.
“Pollumin” A biosensor paint embedding freeze-dried cell-free reactions is applied to industrial smokestack exits, producing a vivid, indelible color change visible from a distance whenever emissions exceed a regulatory threshold. It creates a passive, tamper-evident public record of pollution events.
How will the idea work, in more detail? Write 3-4 sentences or more.
The paint would be a two-component formulation. The first component is a durable, microporous binder matrix — a silicone-based paint maybe with high surface porosity to allow gas and moisture exchange with the exhaust. We then embed trehalose-stabilized freeze-dried cell-free Tx/Tl pellets (E. coli S30 extract). Each pellet contains a DNA construct encoding a high-yield chromoprotein (e.g., amilCP for deep blue) under the control of a promoter that responds to the pollutant. In the case of SO₂ a commonly known industrial pollutant, we can use a sulfite-responsive promoter (e.g., derived from the sox regulon of Paracoccus pantotrophus) that drives chromoprotein expression above a defined concentration threshold. For NOₓ, a nitric-oxide-sensitive promoter (e.g., norV from E. coli, activated by the NorR transcription factor) could be used instead, or both encoded in a single construct for a multi-pollutant readout. The exhaust from a smokestack would carry significant moisture and heat. This moisture would be the activation trigger, it would rehydrate the freeze-dried cell-free pellets embedded in the paint surface. If the SO₂ or NOₓ concentration simultaneously exceeds the promoter activation threshold, gene expression initiates and chromoprotein accumulates within the paint matrix over several hours, developing a vivid color patch visible from hundreds of meters. Identifiable by satellite imaging or public observers. Once triggered, the chromoprotein is permanently fixed within the crosslinked polymer matrix and cannot be washed away. The facility must repaint with fresh biosensor paint to reset the monitoring cycle, and the repainting itself is a documentable event. (Controlling the access to the paint would make sure there’s no illicit cover-ups) also attempting to cover the color change with ordinary paint would be visibly obvious against the textured smokestack surface.
What societal challenge or market need will this address?
Working at a environmental testing lab, I know that a lot of industrial emission monitoring is currently self-reported or requires expensive on-site sensors that are rarely audited. Companies with facilities in low-oversight regions often exceed limits without consequence for extended periods. This paint turns every smokestack into a passive, publicly legible pollution record, one that cannot be selectively deleted, readable by anyone with eyes or a camera, requiring no infrastructure beyond the paint itself. The accountability mechanism derives from the indelible ink used in elections: the point is not just detection, but the social and legal weight of a visible, persistent, non-removable signal that was not there before the violation. Environmental regulators, satellite-monitoring NGOs, and local communities all become distributed inspectors without any specialized equipment.
How do you envision addressing the limitation of cell-free reactions (e.g., activation with water, stability, one-time use)?
The design tries to turn the limitations into a a feature, the activation via water property turns into an actual trigger feature that activates the paint naturally. In the case of dry stacks, maybe using a secondary layer can work as a latent trigger. In order to keep the system stable, lyophilizing the cell-free extract with the trehalose will provide desiccation protection and spraying the paint with a desiccant overcoat also provides more stability. Batch codes on each cartridge allow traceability of manufacture date, so facilities cannot apply expired paint and claim it as a functioning sensor. The one-time use limitation actually serves as a stellar feature as a triggered patch is a permanent record of a threshold, patterned boxes like 12 patches might serve as a yearly record that can be annually cleaned. The facility’s obligation to repaint with fresh certified biosensor paint (sourced from a controlled regulated supplier, with batch traceability) creates a documented compliance cycle.
Poster-generated via ChatGPT Image-2 Model.
Homework question from Ally Huang
One of my final project ideas is the Astrobioreactor, a bioreactor redesigned to work in space but building for the absence of gravity as gravity is one of the major driving forces in earthly fermentation. One of the challenges that the project might face is the necessity of modifying strains for surviving physical forces as one of the approaches for the Astrobioreactor is using centrifugal force, the cells might not be able to withstand that and as a result might need to be modified but in space, microorganisms face cosmic radiation and it may mutate the organisms mid-mission in turn compromising their viability and performance. Studying how cosmic radiation affects microorganisms can help better plan the modifications.
Provide background information that describes the space biology question or challenge you propose to address. Explain why this topic is significant for humanity, relevant for space exploration, and scientifically interesting. (Maximum 100 words)
Prolonged spaceflight exposes microorganisms to cosmic radiation (galactic cosmic rays and solar energetic particles) at doses higher than on Earth. This radiation induces double-strand DNA breaks and oxidative lesions that can accumulate in fermentation cultures, causing loss of productivity, phenotypic instability, or outright culture collapse on long-duration missions. Monitoring microbial DNA integrity in real time is impossible with current ISS capabilities. A rapid, equipment-light diagnostic for radiation-induced genomic stress would enable astronauts to assess fermentation health and make timely decisions about culture maintenance or replacement.
Name the molecular or genetic target that you propose to study. Examples of molecular targets include individual genes and proteins, DNA and RNA sequences, or broader -omics approaches.
The SOS regulon transcriptional response, specifically the promoter activity of recA and sulA genes, as biomarkers of active DNA damage and repair stress in Saccharomyces cerevisiae or E. coli fermentation cultures.
Describe how your molecular or genetic target relates to the space biology question or challenge your proposal addresses.
The SOS response is the conserved bacterial stress-signaling network activated when DNA damage exceeds the cell’s baseline repair capacity. Elevated recA expression is a direct, real-time proxy for double-strand break frequency and replication fork collapse the precise damages caused by cosmic ionizing radiation. In yeast, the homologous RAD51 regulon serves the same function. By measuring SOS/RAD51 promoter-driven reporter protein expression in samples drawn from a space bioreactor culture, astronauts gain quantitative insight into the cumulative genomic stress state of their fermentation organism without requiring sequencing or microscopy.
Clearly state your hypothesis or research goal and explain the reasoning behind it.
Hypothesis: Freeze-dried BioBits cell-free reactions can be used as a quick, portable test for radiation stress in space-grown microbes or cells. The system (BIoBits Bright) uses a luciferase reporter linked to the DNA-damage response genes recA (in bacteria) or RAD51 (in yeast/eukaryotes). When these stress-response mRNAs are present in a culture sample, the reaction produces light, and brighter light means higher DNA damage stress. Reasoning: The BioBits system only needs water to activate. After adding a lysed culture sample, the reaction can produce a measurable glow within a few hours. Since recA and RAD51 are activated during DNA damage responses, higher radiation exposure should lead to more of their mRNA being present. This results in stronger luciferase production and a brighter signal, giving a simple readout of culture health in about 2–4 hours.
Outline your experimental plan - identify the sample(s) you will test in your experiment, including any necessary controls, the type of data or measurements that will be collected, etc.
Samples: (1) Unirradiated fermentation culture lysate (negative control), (2) UV-irradiated culture lysate (positive control, known SOS induction), (3) Simulated cosmic-radiation-exposed culture lysate (experimental condition, irradiated via ISS radiation phantom data-matched dose).Procedure: Pellet cells from 1 mL samples, lyse by freeze-thaw, add 5 µL lysate to rehydrated BioBits pellet containing PrecA-luciferase construct. Incubate 3 hours at 29°C. Read luminescence with P51 Viewer. Data collected:_ Luminescence intensity per sample, normalized to total protein concentration (Bradford assay). Comparison across dose conditions establishes a dose-response curve for SOS induction vs. radiation exposure.
Which genes when transferred into E. coli will induce the production of lycopene and beta-carotene, respectively?
Lycopene synthesis in E. coli requires introducing three genes from Erwinia herbicola: crtE, crtI, and crtB, the three genes work together to redirect farnesyl pyrophosphate (FPP) into lycopene. To extend the pathway toward beta-carotene, a fourth gene, crtY, must also be present, as its enzyme performs the step that converts lycopene into beta-carotene.
Subsections of Labs
Week 1 Lab: Pipetting
Week 12 Lab: Bioproduction
Post Lab Questions (Mandatory for All Students)
1) Which genes when transferred into E. coli will induce the production of lycopene and beta-carotene, respectively?
Lycopene synthesis in E. coli requires introducing three genes from Erwinia herbicola: crtE, crtI, and crtB, the three genes work together to redirect farnesyl pyrophosphate (FPP) into lycopene. To extend the pathway toward beta-carotene, a fourth gene, crtY, must also be present, as its enzyme performs the step that converts lycopene into beta-carotene.
2) Why do the plasmids that are transferred into the E. coli need to contain an antibiotic resistance gene?
Without a selectable marker, there is no reliable way to distinguish cells that took up the plasmid from those that did not. By including an antibiotic resistance gene, only the cells that successfully incorporated the plasmid will survive when the culture is grown on antibiotic-containing media, making selection easy and efficient.
3) What outcomes might we expect to see when we vary the media, presence of fructose, and temperature conditions of the overnight cultures?
Nutrient rich media would mostly lead to higher cell densities. Fructose may redirect carbon flux in ways that favor carotenoid precursor availability, reduce acetate accumulation, and support better recombinant gene expression whether this would lead to higher pigment per cell would need to be confirmed by normalizing absorbance values against OD600. Temperature changes involve a trade-off: 37°C promotes faster growth but may increase metabolic stress, while lower temperatures may slow growth but allow better enzyme function or pathway performance.
4) Generally describe what “OD600” measures and how it can be interpreted in this experiment.
OD600 is a measure of optical density at 600 nanometers. When light passes through a bacterial suspension, cells scatter it, and denser cultures scatter more light, resulting in a higher absorbance reading. The 600 nm wavelength is a practical choice because it estimates cell number without overlapping significantly with most biological pigments. In this experiment, raw pigment absorbance values cannot be compared directly across conditions without accounting for how many cells are present. A tube with twice as many cells might appear more pigmented simply because there is more biomass. Dividing the pigment signal by OD600 normalizes production on a per-cell basis, making comparisons between conditions more meaningful.
5) What are other experimental setups where we may be able to use acetone to separate cellular matter from a compound we intend to measure?
Acetone is broadly useful whenever the target molecule is hydrophobic and can be dissolved away from polar cellular components. Examples include extracting chlorophyll or carotenoids from plant. Acetone also works as a protein precipitation agent, so it can double as a cleanup step to remove enzyme and membrane debris before measuring small organic compounds by absorbance or fluorescence.
6) Why might we want to engineer E. coli to produce lycopene and beta-carotene pigments when Erwinia herbicola naturally produces them?
E. coli grows rapidly, is easy to transform and culture, and is well studied that it’s associated genetic parts have been well characterized. Introducing the carotenoid pathway into E. coli isolates it from the complex environment of Erwinia, making it easier to study and optimize each step independently. E. coli is also far more receptive to changes on every iteration, allowing tweaking with every observation.
Post Lab Questions (For Committed Listeners)
1.1) What are the enzymes of the carotene pathway?
Enzyme
Gene
Role
GGPP synthase
crtE
Converts FPP into geranylgeranyl diphosphate (GGPP)
Phytoene synthase
crtB
Condenses two GGPP molecules to produce phytoene
Phytoene desaturase
crtI
Carries out sequential desaturation steps to convert phytoene into lycopene
Lycopene cyclase
crtY
Cyclizes lycopene to produce beta-carotene
1.2) Within this pathway, which is the rate-determining step? Which enzyme is responsible?
The most likely rate-limiting step is the conversion of phytoene to lycopene, performed by CrtI. This reaction is more complex than the upstream steps: while CrtE and CrtB each carry out relatively concise reactions to build phytoene, CrtI must perform multiple sequential desaturation events, each requiring cofactors and oxidative chemistry. This multi-step nature makes it a strong candidate for the slowest point in the pathway. The pathway bottlenecks extend beyond a single enzyme, but CrtI remains the most plausible enzymatic rate-limiting step.
2.1) E. coli or S. cerevisiae — which would you choose for production?
E. coli would be my choice for this application. While Yeast has real advantages as a eukaryotic system, it is slower to grow and generally requires more elaborate engineering strategies than E. coli for a prokaryotic pathway like carotenoid biosynthesis.
Criterion
E. coli
S. cerevisiae
Growth rate
Rapid; shortens experimental timelines
Notably slower
Transformation
Simple and efficient with well-established plasmid systems
Achievable but typically more involved
Pathway prototyping
Excellent for quick iteration and testing
More suited to long-term strain development
Production platform
Directly used in the referenced literature with pAC-LYC and pAC-BETA
Would require complete redesign of the expression strategy
Metabolic context
Straightforward bacterial chassis for heterologous pathway expression
Useful when eukaryotic organelles or metabolism are relevant
Literature precedent
Papers cited directly test carotenoid and fructose effects in E. coli
Not tested in these studies
2.2) Construct design for crtI expression I would design an expression construct around crtI, as it encodes phytoene desaturase and represents a key control point in lycopene accumulation.
Construct part
Choice
Function
Promoter
pBAD or lac-based inducible promoter (Used in Week 6 Construct Making)
Drives transcription of crtI in a controlled manner
Operator
araBAD/AraC or lacO/LacI regulatory elements
Enables inducible regulation
RBS
Bacterial ribosome binding site
Controls translation initiation efficiency
Coding sequence
crtI
Encodes the phytoene desaturase enzyme
Terminator
Strong bacterial terminator
Ends transcription and prevents read-through
Origin of replication
Medium-copy bacterial ori
Maintains plasmid at moderate copy number to limit burden
Antibiotic resistance marker
Chloramphenicol or kanamycin resistance
Selects for transformed cells
Minimum functional design: ori → resistance marker → promoter → operator → RBS → crtI → terminator. For complete lycopene synthesis, crtE and crtB would also need to be expressed; adding crtY extends the pathway to beta-carotene.
2.3.i.1.a.i) What is the function of a promoter?
A promoter is the DNA sequence that positions RNA polymerase at the correct location and strand to begin transcription. It is the primary determinant of when, in which conditions, and at what level a gene is expressed.
2.3.i.1.a.ii) What types of promoters do we have?
Promoter type
Description
Mechanism
Examples
Constitutive
On continuously; no induction required
RNA polymerase binds and initiates transcription without regulatory input
T7, Sp6 (T7 requires T7 RNAP)
Inducible
Expression increases upon addition of an inducer
Inducer either removes repressor or activates a transcriptional activator
A co-repressor or metabolite enables repressor binding at the operator
trp promoter (repressed by tryptophan)
Info table via Google+ChatGPT
2.3.i.1.a.iii) Turning transcription off vs. on in response to a metabolite — which promoter type for each?
To reduce transcription when a metabolite accumulates, a repressible promoter is the right tool. for example, the trp promoter, which is shut down when tryptophan levels rise. To increase transcription in the presence of a metabolite, an inducible promoter is appropriate, such as araBAD, where arabinose binding to AraC activates transcription, or the lac promoter, where IPTG relieves LacI-mediated repression.
2.3.i.1.a.iv) Promoter choice for crtI expression
For the same reasons outlined in section 2.2, I would use an inducible promoter, specifically pBAD/araBAD, for crtI. A constitutive strong promoter risks forcing excessive metabolic burden from the moment of transformation, before growth conditions have been optimized. An inducible promoter lets me turn expression on after sufficient biomass has accumulated and allows me to titrate crtI expression to find the level that maximizes lycopene output without impairing cell health. The minimal cassette would be: pBAD promoter → RBS → crtI → terminator.
3.1.i) What is the origin of replication?
The origin of replication is the specific DNA sequence at which plasmid replication initiates inside the host cell. Replication machinery recognizes this sequence and begins duplicating the plasmid from this point.
3.1.ii) What types of origins of replication do we have?
Origin / replicon
Approx. copy number
Replication control
Compatibility group
Notes
pUC / pMB1 derivative
~500–700
Relaxed
A
High-copy; good for DNA prep but can burden cells
pBR322 / pMB1
~15–20
Relaxed
A
Medium-copy; more balanced expression
ColE1
~15–20
Relaxed
A
Standard E. coli cloning origin
p15A / pACYC
~10
Relaxed
B
Lower-copy; compatible with ColE1/pMB1
pSC101
~5
Stringent
C
Low-copy; good when stability and low burden are priorities
R6K
~15–20
Stringent
C
Requires the pir gene product
CloDF13 / pCDF
~20–40
Relaxed
D
Useful in multi-plasmid systems
Tabular Info via Deep Research in ChatGPT
3.1.iii) What are compatibility groups?
Two plasmids are compatible if they can both be stably maintained in the same bacterial cell over many generations. Plasmids sharing the same replication and partitioning machinery compete for the same cellular resources, and one tends to be displaced over time, they are called incompatible.
Compatibility groups categorize plasmids by their replication systems, and choosing plasmids from different groups is essential when building strains that carry more than one construct simultaneously. For instance, pUC, pBR322 belong to group A and cannot be stably co-maintained, whereas pairing one of these with a p15A-based plasmid (group B) is generally stable.
3.1.iv) Origin of replication choice for the crtI construct
A medium-copy origin such as pBR322/pMB1 or p15A would be most appropriate. High-copy origins like pUC would amplify metabolic burden from overexpression, which is counterproductive when the goal is to optimize lycopene yield relative to cell health. If the crtI plasmid needs to coexist with another pathway plasmid for example, one carrying crtE and crtB then origins from different compatibility groups must be chosen to ensure both are stably maintained.
4. Elaboration on other bioparts for correct design and further bioproduction
Beyond the promoter and gene of interest, a functional construct needs a few other key elements.
The RBS sits upstream of crtI and controls translation initiation. Stronger RBS means more protein, though I’m not yet sure how much this needs to be optimized versus just using a reliable standard sequence to start. A terminator after the coding sequence stops transcription and prevents read-through. I know this matters for construct stability, but which specific terminator to pick is something I’d need to look into more carefully.
The operator is less of a separate design decision and more of a consequence of whichever promoter system you choose, with pBAD, the AraC regulatory elements come as part of that system already.For assembly, using Gibson or Golden Gate junctions from the start makes sense because swapping parts during optimization becomes much easier later. This seems like the kind of thing that saves a lot of work down the line.
I’ve come across insulators and spacers in reading but I’m genuinely unsure when they make a meaningful difference in practice versus being more of a precaution. Including a GFP reporter in an early version of the construct seems like a reasonable way to confirm everything is working before troubleshooting the full carotenoid pathway though I suspect in a real production context people might skip straight to measuring pigment output instead.
Questions 5,6,78 were marked bonus so I skipped them. :)
🌸 Litmusanthemum A Living pH Indicator Plant
Deep Dalvi — Vadodara, India
🧠 Concept Overview Litmusanthemum is a genetically engineered ornamental plant with pH-sensitive flower petals that function as biological litmus paper.
Instead of using disposable chemical strips, users can simply dip petals into a solution and observe color changes; creating a renewable, zero-waste pH testing system.
Litmusanthemum is a genetically engineered ornamental plant with pH-sensitive flower petals that function as biological litmus paper.
Instead of using disposable chemical strips, users can simply dip petals into a solution and observe color changes; creating a renewable, zero-waste pH testing system.
❓ What
A bioengineered flowering plant with:
Petals rich in anthocyanins
Visible color shifts across pH ranges
Direct usability as a natural pH indicator
👉 Think: Litmus paper, but grown in a pot.
⚙️ How
The system combines plant biology with controlled genetic optimization:
1. 🌈 Enhanced Pigment Expression
Increase anthocyanin concentration in petals
Use natural biosynthetic pathways (no unnatural chemistry)
Target broad and visible pH response range
2. 🌼 Sterile Flower Engineering
Prevent reproduction to allow:
Safe petal harvesting
Controlled cultivation
Avoid ecological spread
3. 🔁 Continuous Flowering
Engineer everblooming traits or manipulate:
Photoperiod response
Flowering gene regulation
Ensures year-round supply
🎯 Why
Problems with current litmus systems:
❌ Single-use
❌ Chemical waste generation
❌ Recurring cost
❌ No aesthetic or educational engagement
What Litmusanthemum solves:
✅ Renewable and biodegradable
✅ Zero-waste pH testing
✅ Lower long-term cost
✅ Visually engaging learning tool
This isn’t just a tool—it’s a living interface between biology and chemistry.