The Biological Engineering Tool Tool: Portable Cell-Free Allergen Biosensor.
Description: A single-use, portable reaction unit containing shelf-stable biological sensing reagents.
Mechanism: The user introduces a small sample of food (solid or liquid) into the unit. The device initiates a biochemical reaction that specifically recognizes the molecular signature of a target allergen (e.g., peanut or soy). If the target is detected, the device triggers a distinct visual signal (such as a color change or fluorescence) within minutes.
DNA Design Challenge Chosen Protein: I chose GFP because it serves as a robust reporter that could be used for my allergen biosensor. The goal of the device is to turn a biological detection (sensing peanut DNA) into a signal the user can see. GFP spontaneously fluoresces green when exposed to UV or blue light (like a simple black light LED). By designing the system so that GFP is activated only when the allergen is detected (or shut off in the presence of the allergen), I can create an intuitive user interface.
Project Overview: Cell-Free Allergen Biosensor I am hoping to develop a rapid, consumer-grade biosensor designed to detect trace allergens like peanut or soy in a restaurant setting. To prioritize speed and accuracy, I will use a DNA-to-RNA detection circuit.
The workflow consists of three main stages:
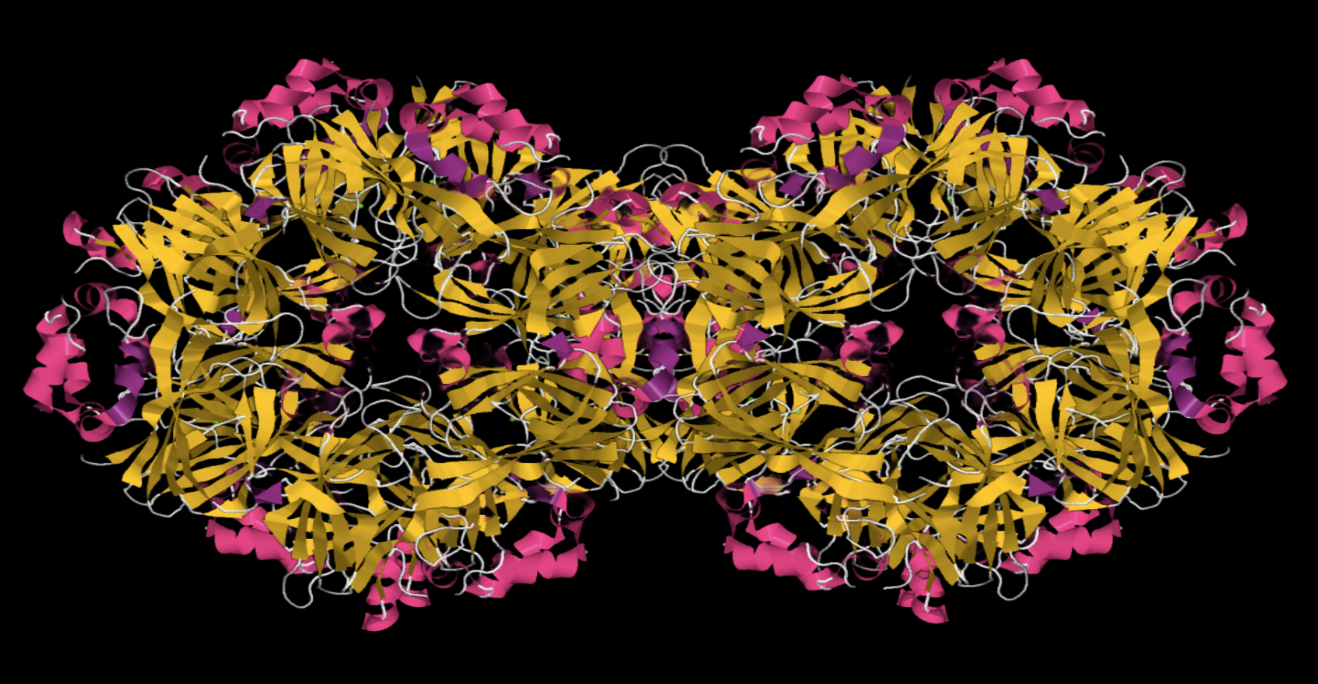
Extraction and Amplification: I could use RPA (Recombinase Polymerase Amplification) to exponentially copy target DNA (like the Ara h 1 gene) at a constant 37°C. Transcription: T7 RNA polymerase can concurrently convert that DNA into Trigger RNA. RNA Toehold Detection: This Trigger RNA can bind to a synthetic Toehold Switch, and unzip an RNA hairpin to allow the translation of a reporter protein. This can create a visible color change or induce luminescence in under 20 minutes. By using a cell-free protein synthesis system, the entire reaction is shelf-stable and functions without the need for a traditional lab environment.
HW Questions: How many molecules of amino acids do you take with a piece of 500 grams of meat? (on average an amino acid is ~100 Daltons)
Meat is roughly 20% protein by mass, so there’s ~100g of protein in 500g of meat. Average amino acid molecular weight is ~110 Da. 100 g ÷ 110 g/mol ≈ 0.91 mol of amino acid residues × Avogadro’s number: 0.91 × 6.022 × 10²³ ≈ ~5.5 × 10²³ amino acid residues Why do humans eat beef but do not become a cow, eat fish but do not become fish?
Part A: SOD1 Binder Peptide Design sequences, scores, structure, and properties for all peptides
PepMLM binder generation Perplexity scores for known and generated peptides: Alphafold binder evaluation ipTM Values and Comparison to Known Binder The ipTM values across all peptides are low, ranging from 0.27 to 0.43, and none exceed 0.5 — the general threshold for confident protein-peptide interaction prediction. Notably, two PepMLM-generated peptides (Sequence_0 at 0.40 and Sequence_1 at 0.43) actually exceed the known binder (Sequence_4 at 0.32), suggesting the model produced candidates with comparable or slightly better predicted interface confidence. However, all predictions share the same binding
HW Questions What are some components in the Phusion High-Fidelity PCR Master Mix and what is their purpose? Phusion DNA Polymease, which synthesized new DNA by adding new nucleotides to the template DNA during PCR dNTPs, which are the nucleotide building blocks (dATP, dGTP, dCTP, and dTTP) reaction buffer, which acts as a chemical stabilizer that maintains the ideal pH and salt balance so the enzyme stays active and can accurately build new DNA strands. What are some factors that determine primer annealing temperature during PCR? Melting temperature of the primer, which is the temperature at which half of the DNA complex dissociates Primer length, since longer primers usually require higher annealing temperatures GC content, since higher GC content typically increases the primer melting temperature Salt concentration, since higher salt concentrations can stabilize the DNA and thus may require higher annealing temperatures There are two methods from this class that create linear fragments of DNA: PCR, and restriction enzyme digests. Compare and contrast these two methods, both in terms of protocol as well as when one may be preferable to use over the other. Feature PCR (Polymerase Chain Reaction) Restriction Enzyme Digest Mechanism Enzymatic Synthesis: Building new strands from primers. Enzymatic Cleavage: Cutting phosphodiester bonds at specific sites. Protocol Thermal Cycling: Repeated steps of denaturation (95°C), annealing (55-65°C), and extension (72°C). Isothermal Incubation: DNA and enzymes are mixed in a buffer and held at a constant temp (usually 37°C). Reagents DNA template, Primers, dNTPs, Taq Polymerase, MgCl2, Buffer. DNA template, Restriction Enzymes, specific BSA/Salt Buffer, Water. Pros High sensitivity; amplifies DNA; creates specific fragments without needing existing cut sites. Simple setup; highly reproducible; great for verifying known sequences or circular DNA. Cons Prone to contamination; requires known flanking sequences; potential for polymerase errors. Does not amplify DNA; limited by the location of natural recognition sites. When to Use When you have minimal DNA, need a custom fragment, or want to add “tails” for cloning. When linearizing plasmids, performing diagnostic checks, or subcloning existing inserts. How can you ensure that the DNA sequences that you have digested and PCR-ed will be appropriate for Gibson cloning? Both the PCR and digested fragments must share identical overlapping terminal sequences (15–40 bp) with their neighboring fragments to allow for seamless homology-directed assembly. How does the plasmid DNA enter the E. coli cells during transformation? Membrane pores open due to a thermal pressure imbalance during the heat shock, allowing the plasmid DNA (which has been neutralized by calcium ions) to be pulled into the cell. Describe another assembly method in detail (such as Golden Gate Assembly) Golden Gate Assembly is a highly efficient “one-pot” cloning method that allows you to join multiple DNA fragments together simultaneously using Type IIS restriction enzymes and T4 DNA ligase. Unlike standard enzymes, Type IIS enzymes like BsaI bind to a specific recognition sequence but cut the DNA several nucleotides away, creating custom 4-base overhangs. By strategically designing these overhangs to be complementary, you can ensure that multiple fragments assemble in a specific, directional order. During the reaction, you cycle the temperature to repeatedly cut and ligate the DNA until the fragments are perfectly joined. A key advantage is that the enzyme’s recognition sites are positioned to be “cut off” and removed during the process, meaning the final product cannot be re-cut. This makes the reaction irreversible and drives the assembly toward the final, seamless circular plasmid. Because of this precision, Golden Gate is the gold standard for modular cloning and building complex multi-gene constructs. Simulating Golden Gate using AddGene’s tool
Part 1: Intracellular Artificial Neural Networks (IANNs) What advantages do IANNs have over traditional genetic circuits, whose input/output behaviors are Boolean functions? Traditional genetic circuits can only read a signal as ON/OFF, even though molecules inside a cell exist at all kinds of intermediate concentrations. To build something complex out of ON/OFF switches, you have to layer many of them together, and each added layer introduces new opportunities for components to accidentally influence each other or fall out of sync. IANNs instead pass graded responses between nodes. Each node receives an actual concentration value, weighs it, and passes a continuous output forward. This means a single node carries far more information than an ON/OFF switch, so you need fewer of them to represent something complex, and there are fewer points at which things can go wrong.
General Cell-Free Homework Questions Main advantages of cell-free protein synthesis over in vivo methods Cell-free systems offer direct access to the reaction environment — you can adjust pH, redox conditions, cofactor concentrations, and template DNA without having to engineer a living cell to tolerate those changes. You’re also not constrained by what the cell needs to survive; toxic proteins, non-natural amino acids, and unstable intermediates can all be produced because there’s no membrane to cross and no cellular fitness cost.
Final Project Measurement Plans: Aspects to be Measured:
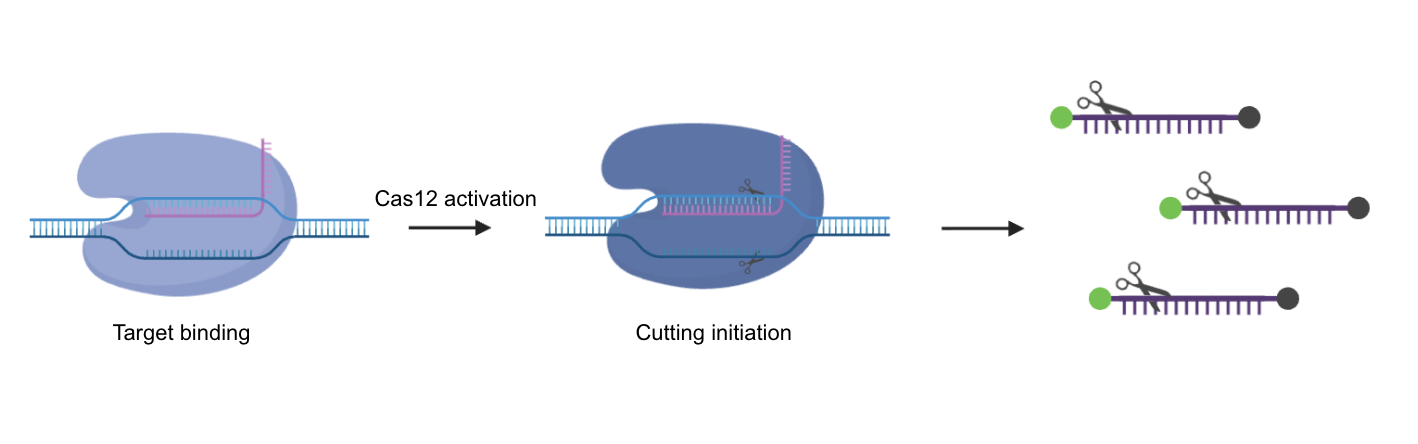
Please identify at least one (ideally many) aspect(s) of your project that you will measure. It could be the mass or sequence of a protein, the presence, absence, or quantity of a biomarker, etc. What: FAM fluorophore release from cleaved reporter molecules Units: Relative Fluorescence Units (RFU) or fold-change over baseline Purpose: Quantifies Cas12a trans-cleavage activity indicating target DNA presence Range: Expected 1.0× (baseline) to 8-12× (strong positive) fluorescence increase Please describe all of the elements you would like to measure, and furthermore describe how you will perform these measurements. Primary Detection Technology: qPCR Fluorescence Monitoring Instrument: Bio-Rad CFX series or equivalent real-time PCR machine with FAM detection capability Detailed methodology:
Question 1: Component Roles in the NMP-Ribose Cell-Free Reaction
E. coli Lysate — BL21 (DE3) Star Lysate (includes T7 RNA Polymerase) This is the core catalytic engine of the reaction — it provides ribosomes, translation factors, chaperones, tRNA synthetases, and metabolic enzymes needed for protein synthesis. The BL21 (DE3) strain specifically expresses T7 RNA Polymerase, which is required to transcribe genes under T7 promoter control.
Salts/Buffer
Potassium Glutamate: Provides the primary ionic environment for the reaction, mimicking intracellular potassium concentrations that support ribosome stability and translation fidelity. HEPES-KOH pH 7.5: Maintains a stable physiological pH throughout the reaction, preventing enzyme inactivation and ensuring optimal ribosome function. Magnesium Glutamate: Magnesium is critical for ribosome assembly and stability, as well as for stabilizing nucleotide triphosphates used in transcription and translation. Potassium Phosphate monobasic/dibasic (1.6:1): Acts as a secondary buffer and provides inorganic phosphate, which is important for nucleotide regeneration and energy metabolism in the ribose-based system. Energy / Nucleotide System
Subsections of Homework
Week 1 HW: Principles and Practices
The Biological Engineering Tool
Tool: Portable Cell-Free Allergen Biosensor.
Description:
A single-use, portable reaction unit containing shelf-stable biological sensing reagents.
Mechanism:
The user introduces a small sample of food (solid or liquid) into the unit. The device initiates a biochemical reaction that specifically recognizes the molecular signature of a target allergen (e.g., peanut or soy). If the target is detected, the device triggers a distinct visual signal (such as a color change or fluorescence) within minutes.
Why:
To increase food confidence and reduce anxiety for people with dietary restrictions. While the primary function is to prevent anaphylaxis, the secondary goal is to validate “mystery foods” (like sauces or baked goods) in social settings, allowing users to eat with peace of mind rather than fear.
Governance & Policy Goals
Primary Goal: Non-Malfeasance (Preventing Harm via Rigorous Safety)
Sub-Goal A (Reliability & Trust): The tool must provide high confidence in negative results (telling a user a food is safe). If a user trusts the device and eats a “safe” food that is actually contaminated (False Negative), the physical harm is severe. Conversely, if the device constantly cries “wolf” (False Positive), the user loses confidence and stops using it, returning to a state of anxiety.
Sub-Goal B (User Safety & Disposal): Ensure that the device—which may contain chemical neutralizing agents or biological waste—is safe to handle during use and safe to dispose of, without introducing new chemical hazards to the user.
Governance Actions (The Options)
Option 1: The “Matrix Stress Test” Certification
Purpose: Mandates that the sensor must be proven to work in “Worst Case Matrices” (foods high in fat, sugar, or acidity) to prevent false negatives caused by complex food chemistry interfering with the sensor.
Actor: FDA / Food Safety Regulators.
Option 2: The “Fail-Safe” Internal Control
Purpose: Every unit must contain a secondary “Positive Control” mechanism that signals if the biological reagents are functional. If this control signal is missing, the user knows the test is broken/expired. This is critical for confidence: a user needs to know the difference between “This food is safe” and “The test didn’t work.”
Purpose: If the device uses a chemical “kill switch” (e.g., a bleaching agent or strong acid) to neutralize the biological components before disposal, strict regulations must govern the containment of these hazardous materials.
Key Policy: Mandate “Child-Resistant” sealing mechanisms and clear, high-contrast warning labels (e.g., “CAUTION: CORROSIVE CONTENTS”) to prevent users from accidentally exposing themselves to the neutralizing chemicals inside.
Scoring Matrix
Scoring Key:
1 = Strong Positive Impact (Best Outcome)
2 = Moderate Impact / Minor Trade-off
3 = Weak Impact / Negative Trade-off / Not Applicable
Does the option:
Option 1 (Matrix Stress)
Option 2 (Fail-Safe)
Option 3 (Safe Containment)
Enhance Biosecurity
N/A
N/A
1
• By preventing incidents
3
3
1
• By helping respond
3
3
3
Foster User Safety
1
1
3
• By preventing incident (False Negatives)
1 (High)
1 (High)
3
• By helping respond (Minimizing harm)
3
1
3 (Risk of Leaks)
Protect the environment
3
3
1
• By preventing incidents
3
3
1
• By helping respond
3
3
3
Other considerations
• Minimizing costs and burdens to stakeholders
2 (Dev Cost)
2 (Complexity)
2 (Packaging Cost)
• Feasibility?
2
1
1
• Not impede research
2
2
1
• Promote constructive applications
1
1
2
Recommendation & Prioritization
Recommendation:
I would prioritize Option 2 (The Fail-Safe Internal Control), followed by Option 1.
Reasoning:
Why Option 2 First? To build confidence in “mystery foods,” ambiguity is the enemy. If the device fails silently (e.g., due to storage conditions), the user may assume the food is safe. Establishing a positive indication of functionality is the only way to give the user the peace of mind they are looking for.
The Trade-off of Option 3: While neutralizing biological waste is important for environmental governance, introducing a toxic, neutralizing chemical creates a new chemical safety hazard for the user. If the containment fails, the user could be burned or injured. Therefore, regulations on how that chemical is contained (Warning Labels, Shatter-proof casing) are critical, but the risk of injury might outweigh the benefit of neutralizing trace amounts of biological material.
Reflection
In class, we discussed the ‘Responsibility of the Toolmaker.’ If I build a tool that claims to detect peanuts, I am effectively taking responsibility for that person’s life for that meal. The ethical weight of a ‘False Negative’ here is far heavier than in other biodesign projects. This made me realize that ‘Accuracy’ isn’t just a technical spec; it’s an ethical requirement. If I can’t guarantee >99% accuracy across all food types, is it ethical to release the product at all?
Proposed Governance:
We might need a ‘Beta Testing Transparency’ law. Startups often release ‘beta’ products to iterate quickly. However, for safety diagnostics, ‘Beta’ labels are insufficient. There should be governance prohibiting the release of ‘beta’ medical/safety diagnostics to consumers until they are fully validated.
Pre-Lecture Questions
1. The biological synthesis of DNA using an error-correcting polymerase has an error rate of 1 * 10^6 (one error for every million base pairs added). The human genome is 3.2 Gbp (3.2 billion base pairs). 3,200,000,000 * (1 error)/(1,000,000 bases) = 3,200 errors per cell division. The cell would accumulate thousands of mutations every time it divides, which is too high for a complex organism to survive. Biology resolves this discrepancy by employing a post-replication “spell check” mechanism known as the MutS repair system. This system uses specific proteins (MutS, MutL, and MutH) to scan the DNA for mismatches that the polymerase missed. To ensure it fixes the right letter, the system distinguishes the correct “template” strand from the error-prone “new” strand by looking for methylation markers; the old strand is methylated, while the newly made strand is not. The system then cuts the new strand, removes the section containing the error using exonucleases, and fills in the correct sequence.
2. The number of different ways to code for an average human protein is very large. The average human protein coding sequence is approximately 1,036 bp long, which is roughly 345 amino acids. Because the genetic code is redundant (multiple three-letter DNA codons for most amino acids), there are on average about three different options for every single position in the protein chain. To find the total number of combinations, you would multiply these options for every amino acid (3 times 3 times 3… for 345 times), resulting in approximately 10 to the power of 164 different DNA sequences capable of making the same protein.
In practice, however, the vast majority of these theoretical codes will not work inside a cell due to several biological and physical constraints. One major issue is RNA folding, or secondary structure; as shown in the NUPACK analysis slides, specific nucleotide sequences can twist into tight knots or hairpins based on their “Minimum Free Energy”. If the code you choose creates a tight structure near the start of the molecule, the ribosome may be unable to latch on, preventing the protein from ever being made. Additionally, cells possess “cleanup” enzymes like RNase III that hunt for specific sequence patterns or structures to destroy old or foreign RNA. If your engineered sequence accidentally creates one of these cleavage targets, the cell’s own immune-like system will chop up the instructions before they can be used. Finally, sequences that are extremely repetitive or have difficult chemical properties (such as improper GC content) can be nearly impossible to synthesize or assemble reliably in the lab without introducing errors.
3. The standard method for oligonucleotide synthesis is the phosphoramidite cycle, a solid-phase chemical process that builds DNA strands one base at a time through a repeating four-step sequence. The cycle begins with deprotection, where a blocking group is removed from the sugar of the previous nucleotide, followed by coupling to attach a new building block. This is followed by a capping step to block any unreacted chains from continuing with an incorrect sequence, and finally, oxidation to stabilize the newly formed phosphate linkage.
4. The difficulty in synthesizing oligos longer than 200 nucleotides arises from the cumulative effect of yield decay and chemical imperfections. Even with a highly efficient coupling rate of 99%, the percentage of sequence-perfect, full-length product decreases exponentially with every added base, leaving a mixture dominated by truncated “failure” sequences. Furthermore, as the strand grows, the likelihood of the DNA forming secondary structures increases, which can physically shield the growing end of the chain from the incoming chemicals and prevent successful reactions.
5. It is impossible to make a 2000bp gene through direct synthesis because no chemical process is accurate enough to maintain high fidelity over thousands of consecutive steps. Instead, large genes are produced using a hierarchical assembly approach where shorter, high-quality oligonucleotides are synthesized first and then “stitched” together. These overlapping fragments are joined using enzymatic methods such as Polymerase Chain Reaction (PCR) or Gibson Assembly, allowing for the construction of long, complex sequences while providing opportunities to filter out errors that occurred during the initial oligo printing.
6. In most animals, there are 10 essential amino acids that they simply can’t make themselves and have to get from food. These are Phenylalanine, Valine, Threonine, Tryptophan, Isoleucine, Methionine, Histidine, Arginine, Leucine, and Lysine. In biology, we look at these as the fundamental code—the “basepair code” and ribosomal translation that turns 4 RNA bases into 20+ amino acids to build life.
When you look at the “Lysine Contingency” from Jurassic Park through this lens, the logic is actually pretty weak. Since lysine is already an essential amino acid for almost all animals, every creature in the wild is technically already on a “lysine contingency”. If an engineered animal escaped, it would just find lysine by eating natural plants or other animals.
Modern tech, like the Genomically Recoded Organisms (GROs) mentioned in the slides, takes this concept much further. Instead of relying on something common like lysine, scientists are swapping out codons to create “metabolic isolation”. They engineer life to require Non-Standard Amino Acids (NSAAs)—synthetic building blocks that don’t exist in nature. If these organisms don’t get their specific lab-made “fuel,” their proteins won’t fold, and they won’t survive.
We’re even looking at “Mirror World” life, where the chirality of DNA and proteins is flipped. Since natural life uses L-amino acids and B-DNA, a “mirror” organism would be totally invisible to natural viruses and couldn’t exchange nutrients with the wild. It’s a much more secure “lock” than just hoping the dinosaurs don’t find a snack.
Week 2 HW: DNA Read Write and Edit
DNA Design Challenge
Chosen Protein: I chose GFP because it serves as a robust reporter that could be used for my allergen biosensor. The goal of the device is to turn a biological detection (sensing peanut DNA) into a signal the user can see. GFP spontaneously fluoresces green when exposed to UV or blue light (like a simple black light LED). By designing the system so that GFP is activated only when the allergen is detected (or shut off in the presence of the allergen), I can create an intuitive user interface.
Amino Acid Sequence:
sp|P42212|GFP_AEQVI Green fluorescent protein OS=Aequorea victoria OX=6100 PE=1 SV=1
MSKGEELFTGVVPILVELDGDVNGHKFSVSGEGEGDATYGKLTLKFICTTGKLPVPWPTLVTTFSYGVQCFSRYPDHMKQHDFFKSAMPEGYVQERTIFFKDDGNYKTRAEVKFEGDTLVNRIELKGIDFKEDGNILGHKLEYNYNSHNVYIMADKQKNGIKVNFKIRHNIEDGSVQLADHYQQNTPIGDGPVLLPDNHYLSTQSALSKDPNEKRDHMVLLEFVTAAGITHGMDELYK
Codon optimization:
Codon optimization is necessary because the genetic code is redundant; while multiple codons can specify the same amino acid, different organisms utilize these codons with varying frequencies. By rewriting the sequence to use the host’s “preferred” codons, we ensure that the corresponding tRNA molecules are readily available, which prevents ribosomal stalling and significantly accelerates protein synthesis. Additionally, optimization allows for the removal of inhibitory mRNA secondary structures and “unfavorable” sequences that could lead to premature degradation of the genetic instructions, ultimately ensuring a more robust and rapid visual signal for the user
For this assignment, I have chosen to optimize the sequence for Escherichia coli. As the most well-characterized model organism in synthetic biology, E. coli provides a reliable and standard baseline for protein expression with highly optimized commercial algorithms available for sequence design.
While E. coli is the selected host due to the robust, pre-set optimization tools available on platforms like Twist Bioscience, it serves as a functional baseline for standardization and ease of integration into common laboratory workflows. However, the ideal biological choice for a timely sensor would be Vibrio natriegens (TaxID: 1219067), which possesses a doubling time of under 10 minutes and a significantly higher ribosomal density. Utilizing E. coli for this optimization ensures a high Codon Adaptation Index (CAI) and reliable synthesis, though a custom-optimized Vibrio sequence would remain the preferred engineering solution for achieving maximum metabolic speed in a real-world application.
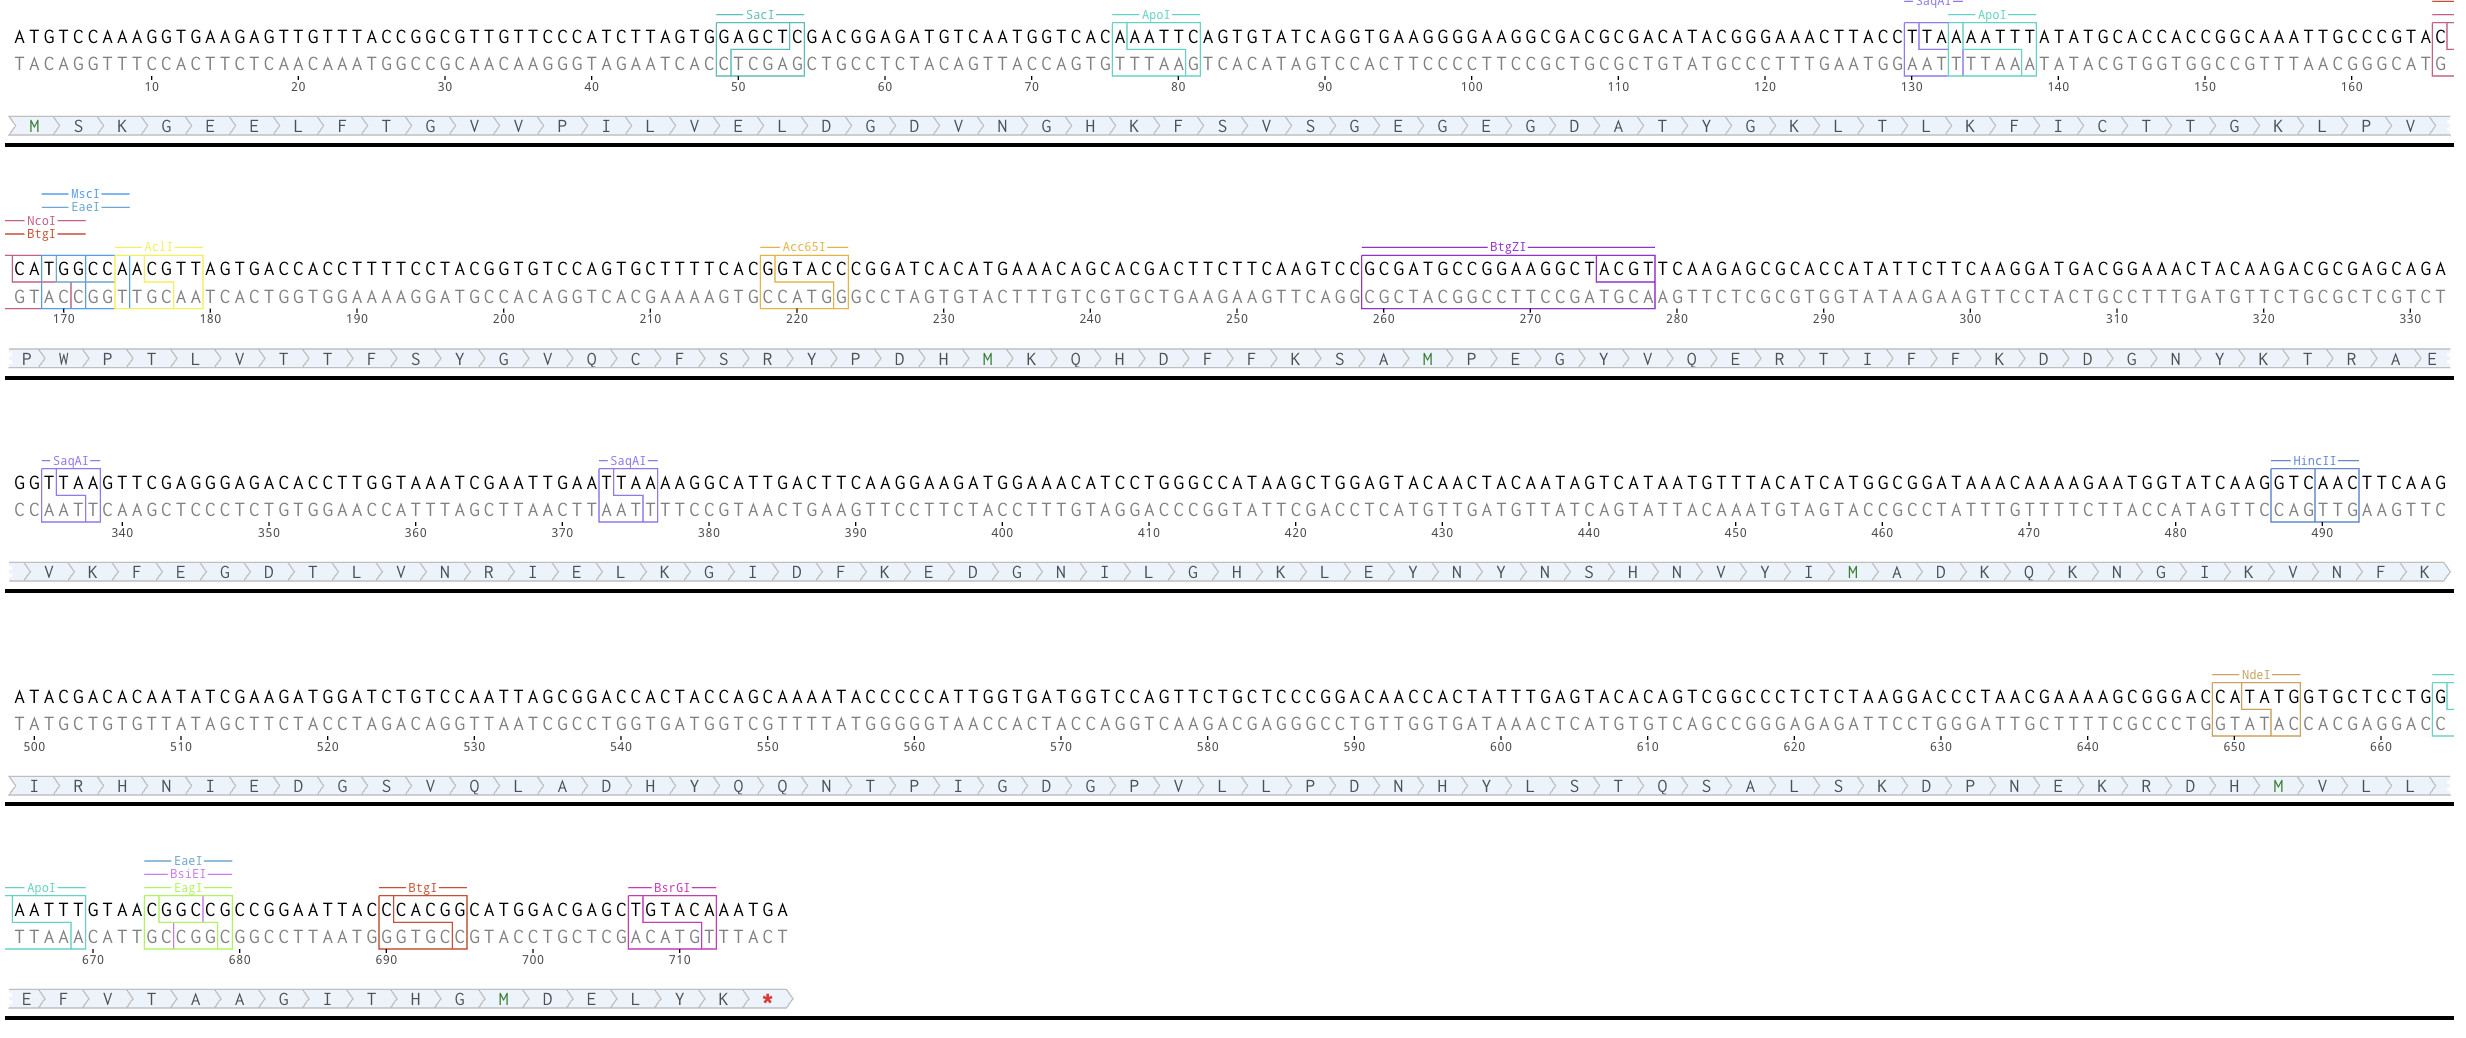
Optimized using Twist’s Codon optimization tool for E. Coli, avoiding EcoRI, BamHI, XhoI, HindIII, BasI, and BbsI cut sites.
ATGTCCAAAGGTGAAGAGTTGTTTACCGGCGTTGTTCCCATCTTAGTGGAGCTCGACGGAGATGTCAATGGTCACAAATTCAGTGTATCAGGTGAAGGGGAAGGCGACGCGACATACGGGAAACTTACCTTAAAATTTATATGCACCACCGGCAAATTGCCCGTACCATGGCCAACGTTAGTGACCACCTTTTCCTACGGTGTCCAGTGCTTTTCACGGTACCCGGATCACATGAAACAGCACGACTTCTTCAAGTCCGCGATGCCGGAAGGCTACGTTCAAGAGCGCACCATATTCTTCAAGGATGACGGAAACTACAAGACGCGAGCAGAGGTTAAGTTCGAGGGAGACACCTTGGTAAATCGAATTGAATTAAAAGGCATTGACTTCAAGGAAGATGGAAACATCCTGGGCCATAAGCTGGAGTACAACTACAATAGTCATAATGTTTACATCATGGCGGATAAACAAAAGAATGGTATCAAGGTCAACTTCAAGATACGACACAATATCGAAGATGGATCTGTCCAATTAGCGGACCACTACCAGCAAAATACCCCCATTGGTGATGGTCCAGTTCTGCTCCCGGACAACCACTATTTGAGTACACAGTCGGCCCTCTCTAAGGACCCTAACGAAAAGCGGGACCATATGGTGCTCCTGGAATTTGTAACGGCCGCCGGAATTACCCACGGCATGGACGAGCTGTACAAATGA
Now what?:
8The Transcription and Translation Process
The process occurs in two stages. First, transcription happens when RNA Polymerase binds to the promoter and creates a messenger RNA (mRNA) strand. Next, translation begins as ribosomes dock onto the mRNA at the Ribosome Binding Site. The ribosome “reads” the mRNA codons and recruits tRNA molecules to assemble amino acids—starting at your M (Methionine) and ending at the TAA stop codon—folding the chain into a functional protein.
Cell-Dependent Production
In cell-dependent systems, the DNA is inserted into a plasmid and transformed into a living host like E. coli or V. natriegens. The host’s metabolism provides the energy (ATP) and raw amino acids needed for synthesis. While highly scalable for mass production, this method requires significant time for cell growth and complex purification steps to separate your target protein from the host’s cellular components.
Cell-Free Production
A cell-free (TX-TL) system mixes the linear DNA fragment directly with a lysate containing ribosomes and enzymes harvested from broken-open cells. This might be the ideal “timely” choice for a sensor because it eliminates the need to wait for living cultures to grow. It allows for immediate protein production and is more resilient to the lysis buffers used in food testing, though it is generally more expensive for large-scale use.
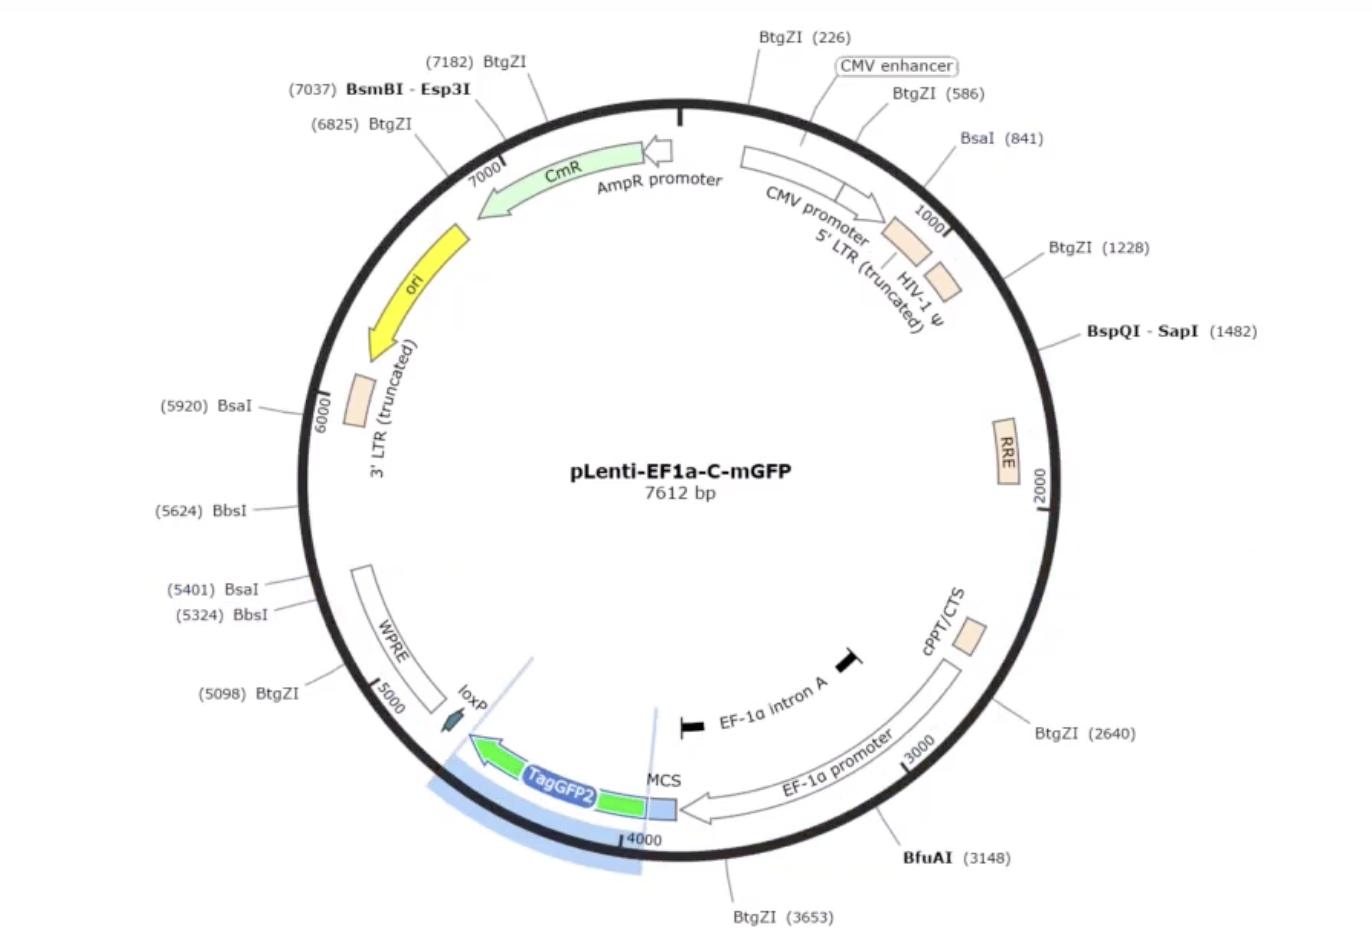
Prepare a Twist DNA Synthesis Order
Linear Map (Annotated)
Twist Cloning Vector
DNA Read/Write/Edit
Read
What DNA would you want to sequence (e.g., read) and why? I would sequence the metagenomic DNA from the human gut microbiome of patients with neurodegenerative diseases like Alzheimer’s. Research into the “gut-brain axis” suggests that microbial diversity and specific bacterial metabolites (such as short-chain fatty acids) directly influence neuroinflammation. By reading the entire microbial community, we can identify specific species that are neuroprotective or neurotoxic, providing a non-invasive way to discover early biomarkers for brain health.
In lecture, a variety of sequencing technologies were mentioned. What technology or technologies would you use to perform sequencing on your DNA and why?
I would use Illumina Next-Seq because it offers the optimal balance of accuracy and throughput required for complex microbiome analysis. When sequencing a fecal sample to understand the gut-brain axis, we are looking at a soup of DNA from thousands of different bacterial species. To detect rare but potentially influential neuro-active microbes, we need deep sequencing, meaning we must read the sample millions of times. Illumina’s second-generation technology is the industry leader for this because its cost per base is significantly lower than third-generation methods (like Nanopore) and its base-calling accuracy is higher (99.9%), ensuring that we don’t misidentify a bacterial species due to a sequencing error.
This is a second-generation technology. It is defined by its “sequencing-by-synthesis” (SBS) method, which uses massive parallelism to read millions of short DNA fragments simultaneously with extremely high accuracy.
The input is high-quality genomic DNA extracted from fecal samples. The essential preparation steps are fragmentation, adapter ligation, and PCR amplification
The sequencer adds fluorescently labeled nucleotides one at a time. Each time a base is incorporated, it emits a specific color. A high-resolution camera records these flashes, and the software performs base calling by converting the sequence of colors into a digital string of A, C, G, and T.
The output is a FASTQ file containing millions of short, highly accurate “reads” which are then computationally assembled to map the microbial species present in the gut.
Write
What DNA would you want to synthesize (e.g., write) and why? I would synthesize a closed-loop genetic logic gate circuit for use in iPSC-derived human microglia. This circuit would be designed to sense high levels of pro-inflammatory cytokines (like IL-1β) or Amyloid-beta and respond by triggering the production of a therapeutic anti-inflammatory protein (like IL-10) or a fluorescent reporter like mCherry for real-time monitoring of disease state in the lab. This would be useful because current drugs for Alzheimer’s are always on, leading to side effects. A synthetic circuit in iPSC-derived microglia could trigger a therapeutic response (like releasing a clearing enzyme) only when it senses high levels of Amyloid-beta or inflammatory cytokines.
What technology or technologies would you use to perform this DNA synthesis and why?
I would use Twist Bioscience’s silicon platform because synthetic genetic circuits require the writing of many different regulatory parts (promoters, insulators, and reporters) that must work with each other. Twist’s technology is superior for this because it uses a semiconductor-based approach to synthesize thousands of Gene Fragments in parallel on a single silicon chip. For a BME project, this allows me to multiplex. I can order 50 variations of my Alzheimer’s-sensing circuit with slightly different promoter strengths to see which one has the best signal-to-noise ratio in my iPSC-derived microglia.
Twist utilizes a semiconductor-based silicon platform to perform traditional phosphoramidite chemistry in miniature. The process involves a four-step cycle: De-protection (removing a blocking group), Coupling (adding the next nucleotide), Capping (preventing incorrect chains from growing), and Oxidation (stabilizing the bond). This is repeated for each base until the custom sequence is complete.
Limitations:
Speed: Synthesis and shipping typically take 5–10 days, which is slower than biological replication.
Accuracy: Chemical synthesis has a small error rate that compounds with length; therefore, sequences longer than 2kb must be built by stitching together smaller, verified fragments.
Scalability: While the silicon platform allows for synthesizing thousands of different genes at once, the cost per base remains higher than large-scale natural DNA replication.
Edit
What DNA would you want to edit and why? I would want to edit the human APOE gene to convert the high-risk APOE4 allele into the protective APOE2 allele. APOE4 is the strongest genetic risk factor for late-onset Alzheimer’s, while APOE2 is known to be neuroprotective. Making this switch in human neural stem cells could fundamentally change a person’s risk profile and slow the progression of neurodegeneration.
What technology or technologies would you use to perform these DNA edits and why?
I would choose CRISPR Base Editing specifically because of its safety profile in post-mitotic or sensitive cells like those found in the brain. Standard CRISPR-Cas9 (first-generation editing) creates Double-Strand Breaks, which can trigger a p53-mediated toxicity response or cause large, unintended deletions that could be catastrophic in a neural environment. Base Editing is the superior choice for a therapeutic application in Alzheimer’s research because it performs a search and replace at the single-atom level. By chemically converting the target nucleotide without ever cutting the DNA backbone, we minimize the risk of genomic instability while achieving the precise C -> T flip needed to convert the APOE4 risk allele into the protective APOE2 variant
Base editing uses a “deactivated” Cas9 (dCas9) or a nickase (nCas9) fused to a deaminase enzyme. Unlike standard CRISPR, it does not cut the DNA backbone. The process begins with targeting, where a custom-designed guide RNA leads the Base Editor complex to the precise location of the APOE SNP within the genome. Once the target is reached, the Cas9 domain performs unzipping, pulling the DNA strands apart to create a localized window of single-stranded DNA. Finally, the chemical conversion occurs; the fused deaminase enzyme physically rearranges the atoms of a specific base—for instance, converting a Cytosine into a Uracil. The cell’s natural repair machinery then recognizes this change and converts it into a Thymine (C -> T), effectively flipping the genetic switch from a risk allele to a protective one without ever creating a double-strand break.
For preparation, we must design a guide RNA with a 20bp spacer that is unique to the APOE locus. The input is typically the Base Editor protein (or mRNA) and the synthetic gRNA, delivered via lipid nanoparticles or viral vectors.
Despite its precision, the method faces a significant challenge in efficiency, as not every target cell will successfully receive the editor or undergo the chemical conversion. This results in mosaicism, a state where only a fraction of the neural population is corrected while others remain in the high-risk state. Furthermore, the technology is limited by its precision regarding bystander editing. If other identical bases (such as multiple Cytosines) are located within the narrow activity window of the deaminase enzyme, the editor may unintentionally change those nearby bases as well, potentially leading to unintended genetic modifications.
Week 3 HW: Lab Automation
Project Overview: Cell-Free Allergen Biosensor
I am hoping to develop a rapid, consumer-grade biosensor designed to detect trace allergens like peanut or soy in a restaurant setting. To prioritize speed and accuracy, I will use a DNA-to-RNA detection circuit.
The workflow consists of three main stages:
Extraction and Amplification: I could use RPA (Recombinase Polymerase Amplification) to exponentially copy target DNA (like the Ara h 1 gene) at a constant 37°C.
Transcription: T7 RNA polymerase can concurrently convert that DNA into Trigger RNA.
RNA Toehold Detection: This Trigger RNA can bind to a synthetic Toehold Switch, and unzip an RNA hairpin to allow the translation of a reporter protein. This can create a visible color change or induce luminescence in under 20 minutes.
By using a cell-free protein synthesis system, the entire reaction is shelf-stable and functions without the need for a traditional lab environment.
Automation Stack
Nebula: I could use this for computational modeling to predict the thermodynamic stability ($\Delta G$) of different toehold designs. It can help me pick sequences that are stable at room temperature but unzip quickly when triggered.
Opentrons OT-2: This is a good tool for kinetic screening. I can use it to automate the distribution of reagents and synchronize the start of up to 96 reactions across a plate, ensuring my “time-to-detection” data is precise.
Ginkgo: I can look to foundry-scale automation for validating my optimized sensors against complex food matrices (oils, acids, salts) to minimize false negatives.
Kinetic Screening Pseudo-code
This protocol could be used to screen my Nebula-designed candidates to find the one with the fastest response time.
# SENSOR OPTIMIZATION PROTOCOL# REAGENTSSETDesigns=[Nebula_A,Nebula_B,Nebula_C,Nebula_D]SETConcentrations=[0,10,50,100]# ppm of Ara h 1 DNA# 1. REAGENT DISTRIBUTIONFOREACHwellINplate:DISPENSE10uLCell-Free/RPAMasterMix# 2. SENSOR LOADINGFORi,designINenumerate(Designs):DISPENSE2uLdesignINTOColumn(i)# 3. SYNCHRONIZED REACTION START# Using multichannel to eliminate timing offsetsFORj,concINenumerate(Concentrations):MULTICHANNEL_DISPENSEconcINTORow(j)# 4. KINETIC DATA COLLECTIONWHILEtime<20minutes:READ_ABSORBANCE(570nm)EVERY30secondsLOG_DATA(well_id,time,signal_intensity)# 5. ANALYSISRANKdesignsBY(Signal-to-NoiseRatio)AND(Time-to-Threshold)
Novel Lab Automation for Brain Organoids
Overview
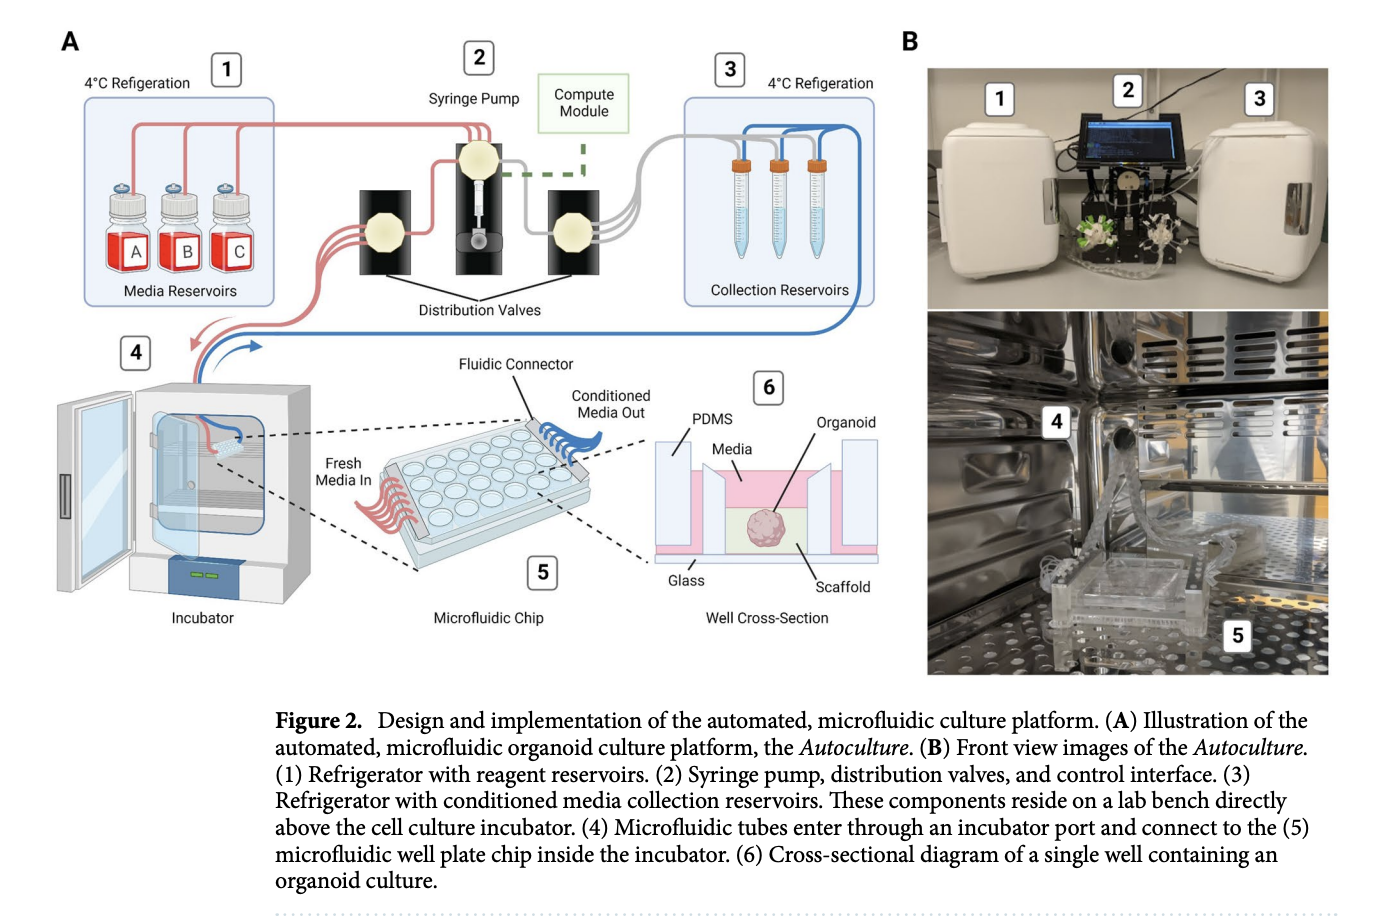
Organoids are 3D in vitro models that closely replicate the biology and physiology of their in vivo counterparts, making them highly valuable for developmental research and disease modeling. However, traditional manual cell culture protocols often lack consistency and expose these complex models to erratic swings in nutrient availability and the buildup of toxic metabolites, which can lead to cellular stress.
To address these limitations, researchers developed the “Autoculture” platform, a modular, automated microfluidic system designed to optimize 3D organoid growth. This Internet of Things (IoT)-enabled system uses a custom 24-well polydimethylsiloxane (PDMS) chip to house individual organoids in isolated microenvironments. The platform automatically delivers precisely scheduled media and removes waste without the need to take the cultures out of the incubator, offering high spatiotemporal resolution and customizable feeding schedules.
Findings
When tested on cerebral cortex organoids over an 18-day period, the Autoculture platform supported robust growth and accurate neural differentiation comparable to conventional orbital shaker suspension methods. Crucially, RNA sequencing revealed that the automated microfluidic environment significantly reduced markers of cellular stress. Specifically, organoids grown in the automated system showed a marked downregulation in genes associated with canonical glycolysis and endoplasmic reticulum (ER) stress when compared to those maintained in traditional suspension cultures.
Why do humans eat beef but do not become a cow, eat fish but do not become fish?
During digestion, proteases break down the cow/fish proteins down into their constituent free amino acids and small peptides. These are then
absorbed as monomers. Your ribosomes then reassemble them according to your own mRNA instructions.
Why are there only 20 natural amino acids?
Likely a combination of three things. First, once the genetic code co-evolved around these 20 amino acids, any change would catastrophically
mis-translate the entire proteome, so those 20 were ’locked in’. Second, the 20 cover the necessary chemical space (charged, polar,
hydrophobic, aromatic, etc). Third, the simplest amino acids (Gly, Ala, Asp, Glu, Val…) are exactly the ones most readily produced
abiotically, so the code evolved around what was chemically accessible early on. Selenocysteine and pyrrolysine as the “21st and 22nd” amino
acids show the code can expand, but only under very constrained circumstances.
Where did amino acids come from before enzymes that make them, and before life started?
They form spontaneously from simple chemistry. Amino acids are thermodynamically reasonable products.
The Miller-Urey experiment showed electric discharge through CH₄, NH₃, H₂O and H₂ produces Gly, Ala, Asp and others.
Hydrothermal vents provide mineral catalysts and redox gradients. Meteorites (like Murchison) contain over 70 amino acids synthesized in
space, confirming abiotic production is universal wherever C, N, O, H and energy coexist.
If you make an α-helix using D-amino acids, what handedness (right or left) would you expect?
The 3₁₀-helix is tighter (i→i+3 H-bonds), more strained, and common at helix termini.
The π-helix is wider (i→i+5 H-bonds) and surprisingly prevalent at functional sites — maybe 15% of proteins contain at least one π-turn.
The polyproline II (PPII) helix has no intramolecular H-bonds at all, is left-handed, and is extremely common in disordered regions,
collagen, and signaling domains (SH3 recognition).
The collagen triple helix is three intertwined PPII-like chains stabilized by interchain H-bonds.
New folds continue to emerge from cryo-EM and AlphaFold-era structural biology, so the catalogue is probably not closed.
Why are most molecular helices right-handed?
Most molecular helices are right-handed because all biological amino acids are L-form, so their bond geometry naturally favors coiling
clockwise when chained together.
Why do β-sheets tend to aggregate?
Edge strands have unpaired backbone NH and C=O groups pointing outward (they’re basically unsatisfied H-bond donors and acceptors, which
makes them inherently “sticky.”)
Flat hydrophobic surfaces on sheet faces also drive stacking through the hydrophobic effect.
Side chains interdigitate into a tight steric zipper, which is favorable in both enthalpy and entropy, and thus very hard to prevent without
chaperones or proline residues.
Why do many amyloid diseases form β-sheets? Can you use amyloid β-sheets as materials?\
For many disease-associated sequences (Aβ in Alzheimer’s, α-synuclein in Parkinson’s, IAPP in type II diabetes), the amyloid state is
actually thermodynamically more stable than the native fold. Stress, concentration increases, mutations, or metal ions can nucleate
conversion, after which elongation proceeds rapidly like crystal growth. The resulting cross-β architecture is extraordinarily stable,
resistant to heat, detergent, and proteases.
As materials, amyloid fibrils are definitely useful. They can have a Young’s modulus of 1–20 GPa (similar to silk), high aspect ratio,
and nanoscale precision. Functional amyloids already exist naturally (curli fibers in bacterial biofilms, yeast prions as regulatory
switches). Proposed applications include conductive nanowires (metallized with silver or gold), hydrogels for drug delivery, tissue
engineering scaffolds, and even food technology(whey protein amyloids are already used commercially as emulsifiers).
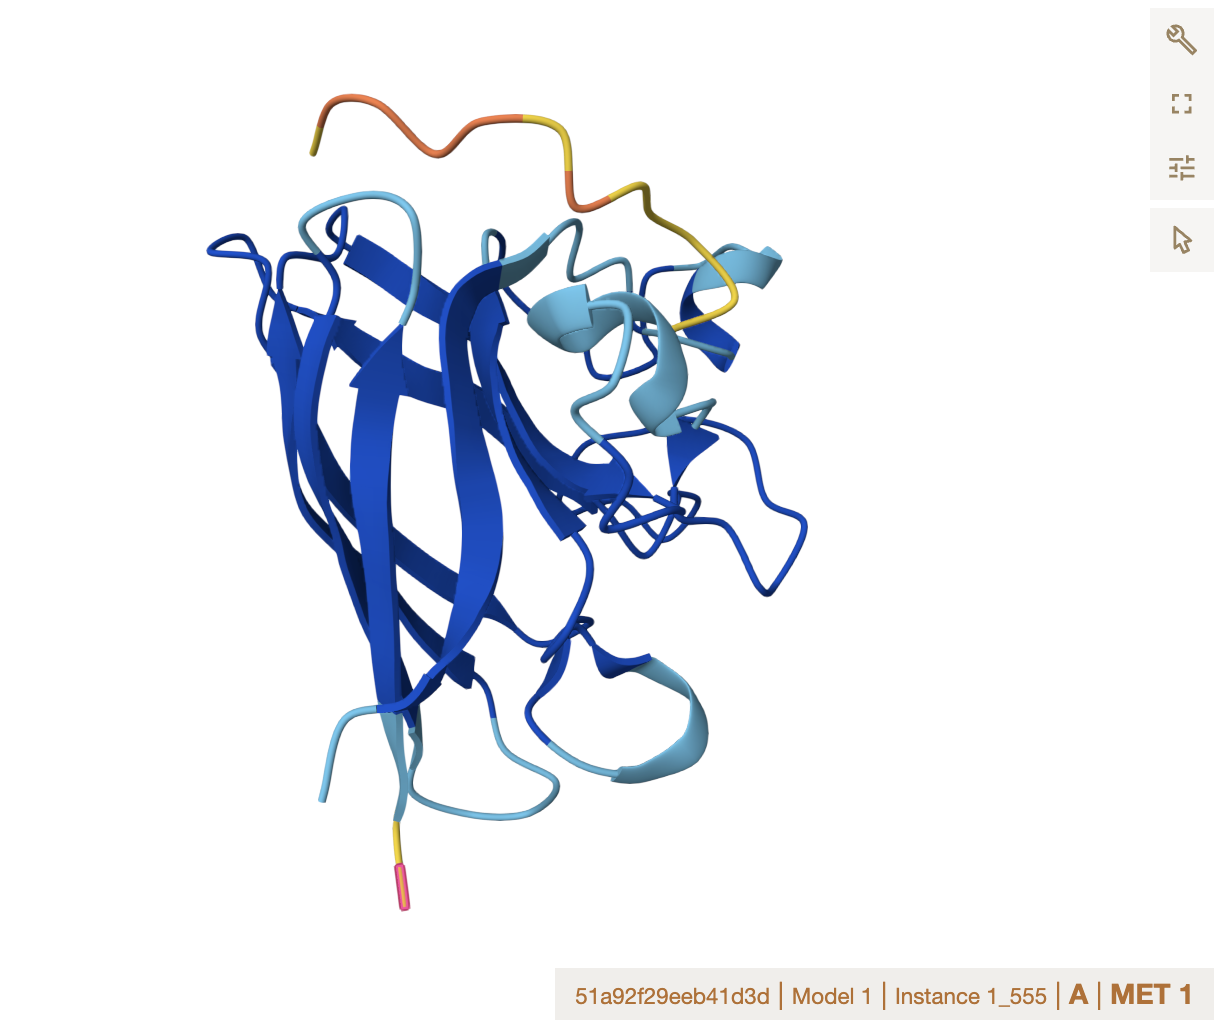
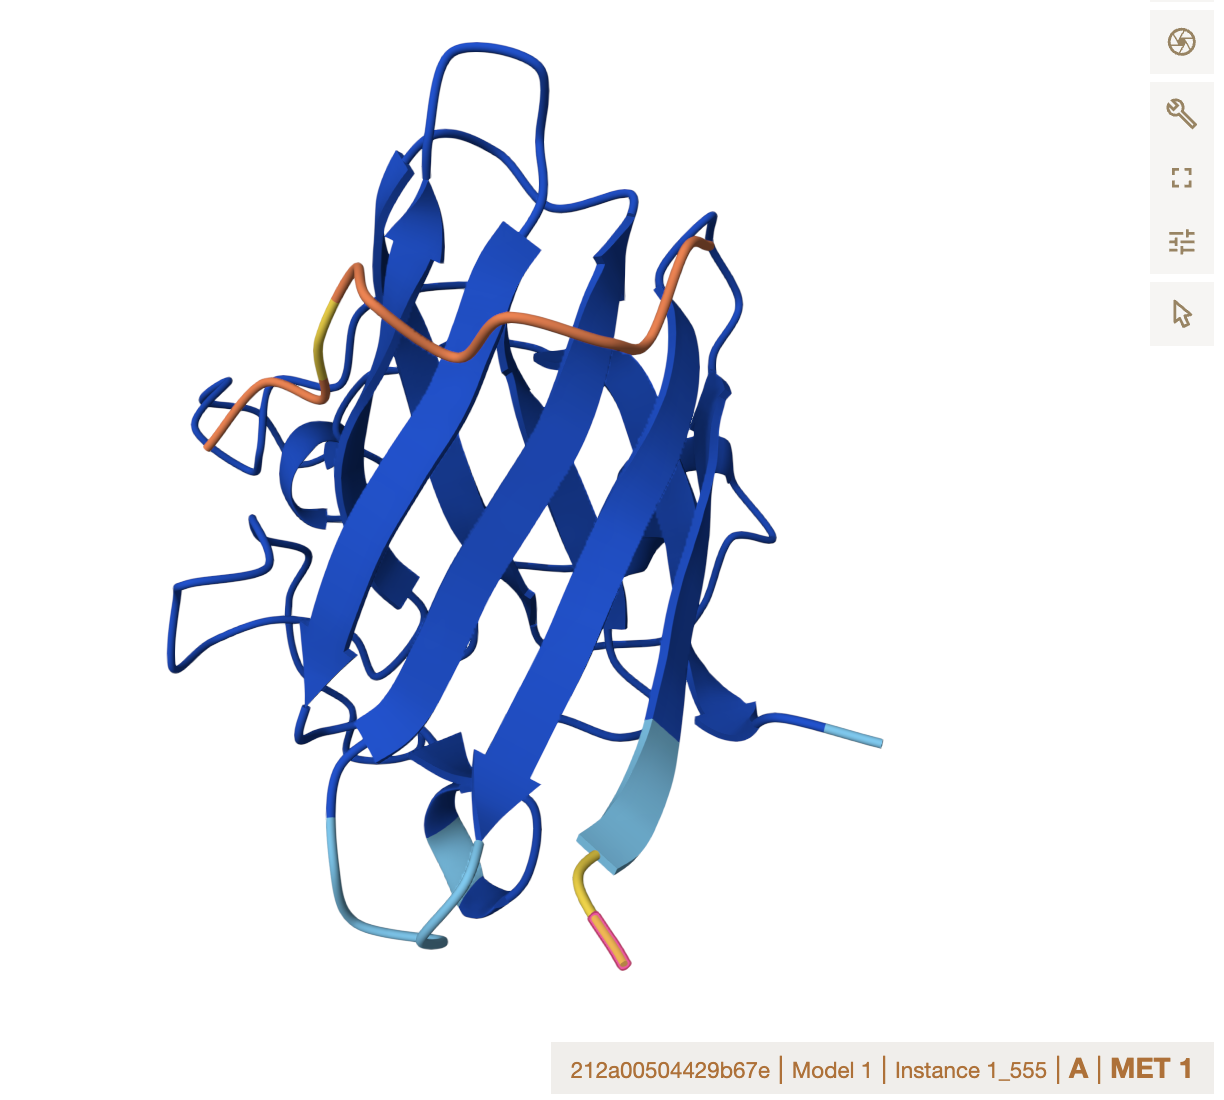
Protein Analysis and Visualization
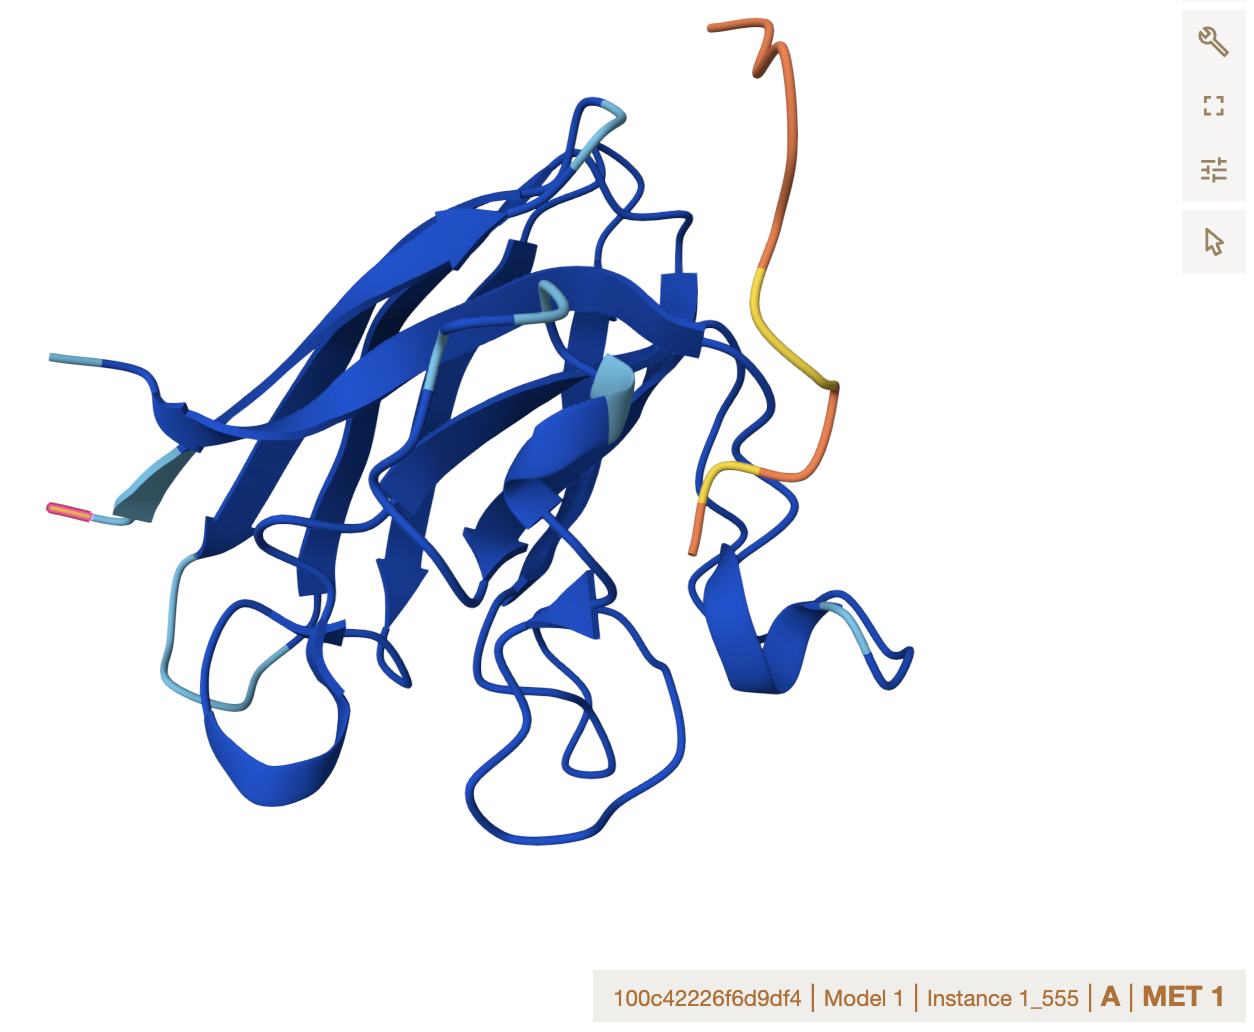
Insulin is a small hormone produced by the pancreas that regulates blood glucose levels. I chose it because of its fascinating history as a therapeutic protein. Decades of protein engineering have produced analogs like insulin lispro and glargine, where just one or two amino acid changes dramatically alter how the drug behaves in the body. I wanted to explore the structure underlying a protein that has been so deliberately and successfully redesigned.
most common residues are C and L, which appear 6 times each
this protein has 228 homologs
this specific insulin protein is in the broader insulin family
Protein Structure Page
The structure was released on February 24, 2009. (Note: While the very first insulin structure was solved in 1969, this version (3E7Y) is
the modern high resolution reference for the native human protein).
The quality is excellent - 1.60 Å
There are other molecules in the solved structure of the protein, as this classic structure represents the storage form (hexamer). It
contains zinc ions, chloride ions, and water molecules
This protein is the defining member of the Insulin-like superfamily.
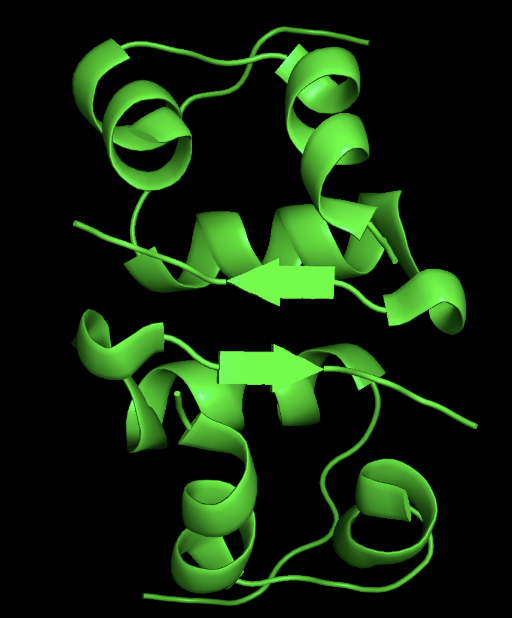
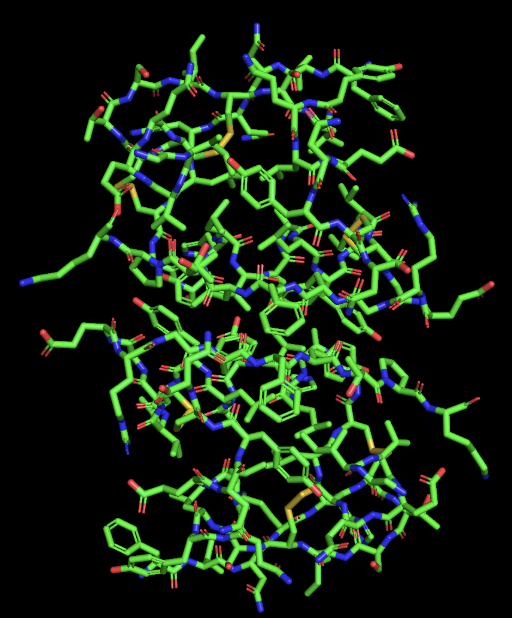
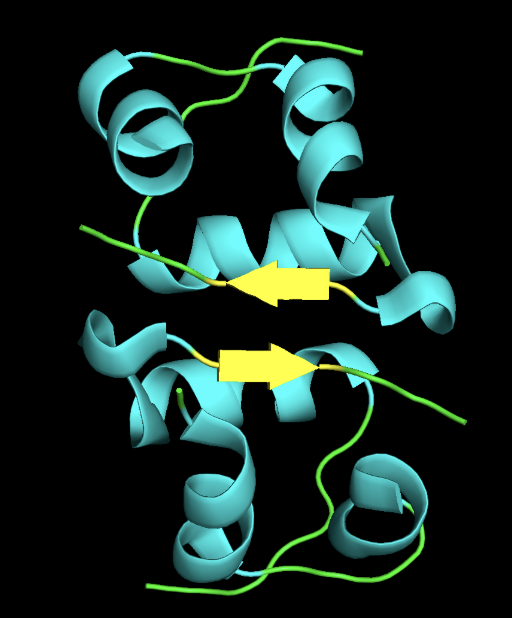
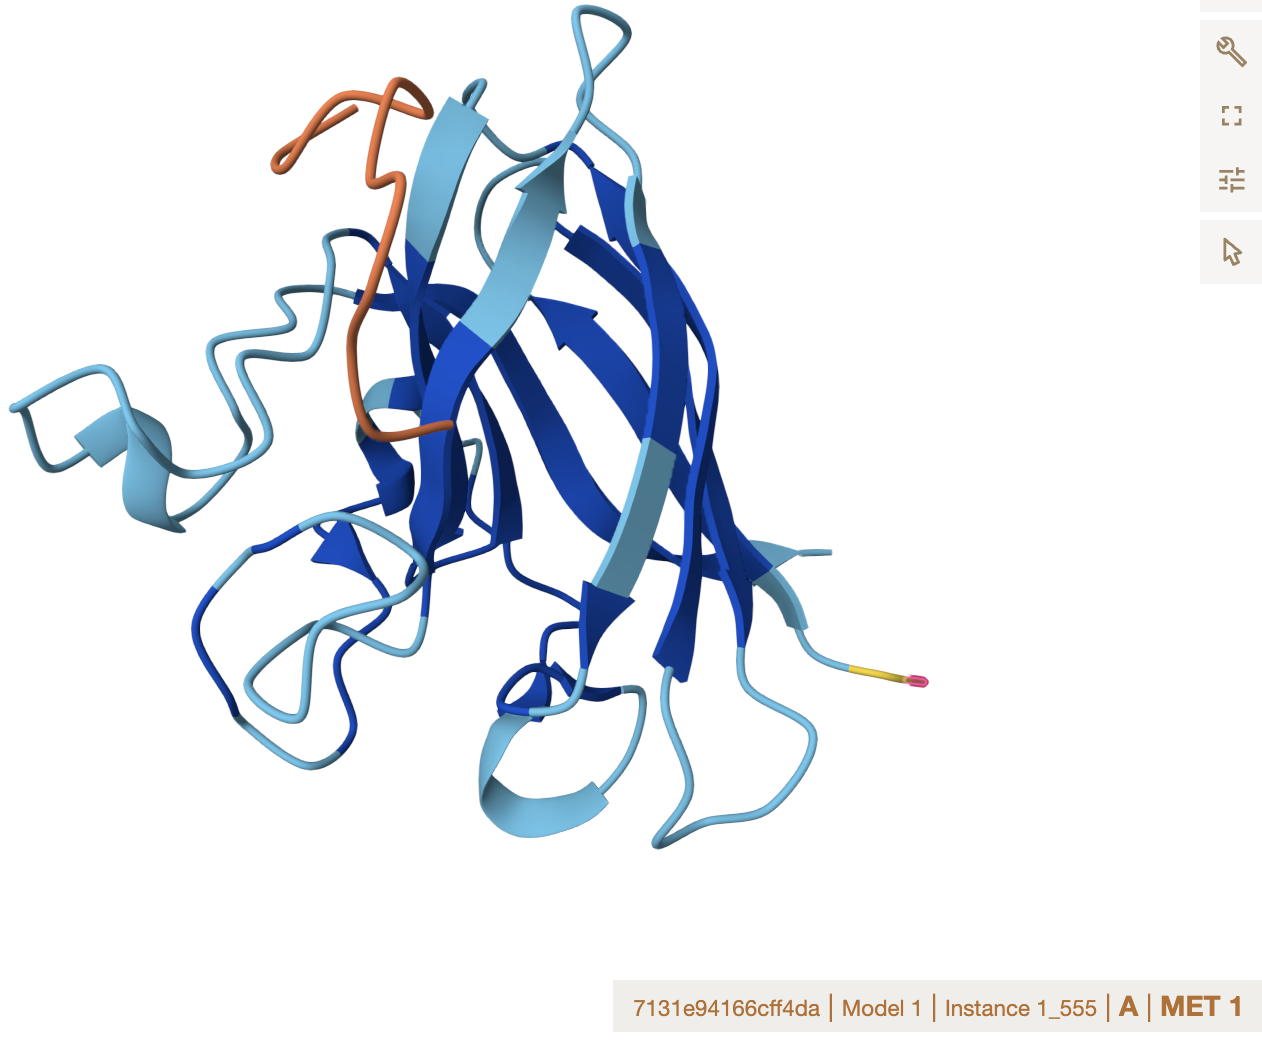
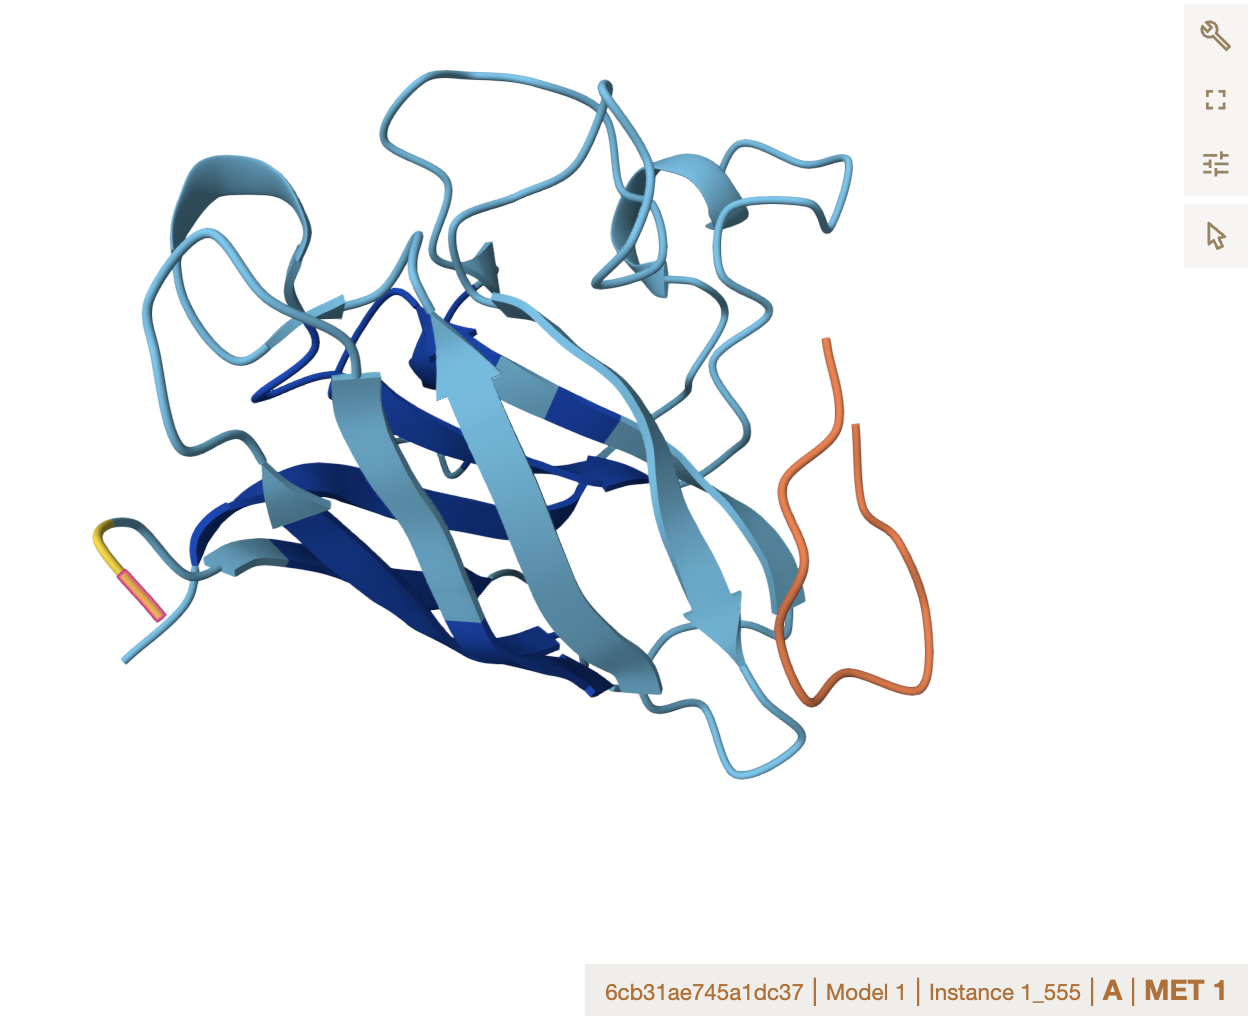
3D Structure
cartoon
ribbon
sticks
secondary structure: the protein has more helices than sheet
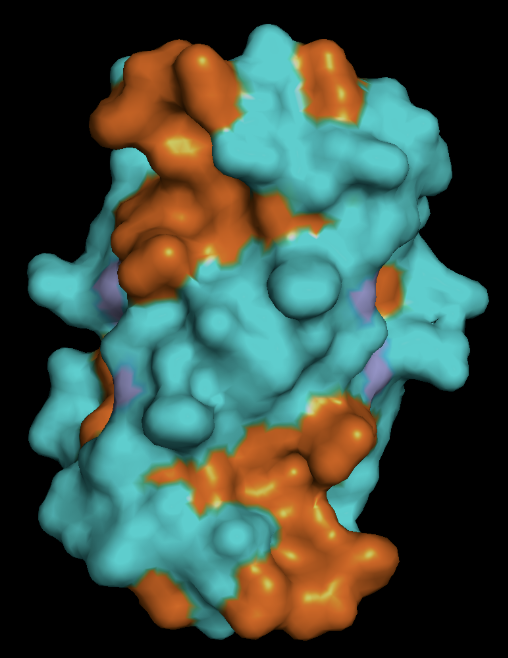
protein surface: the distribution of hydrophobic (orange) vs hydrophillic (cyan) residues follows as expected. Most of the surface residues are hydrophillic, and the hydrophobic residues line the binding pockets
Using ML-Based Protein Design Tools
For this section, I will be using the same Insulin protein from the prior section.
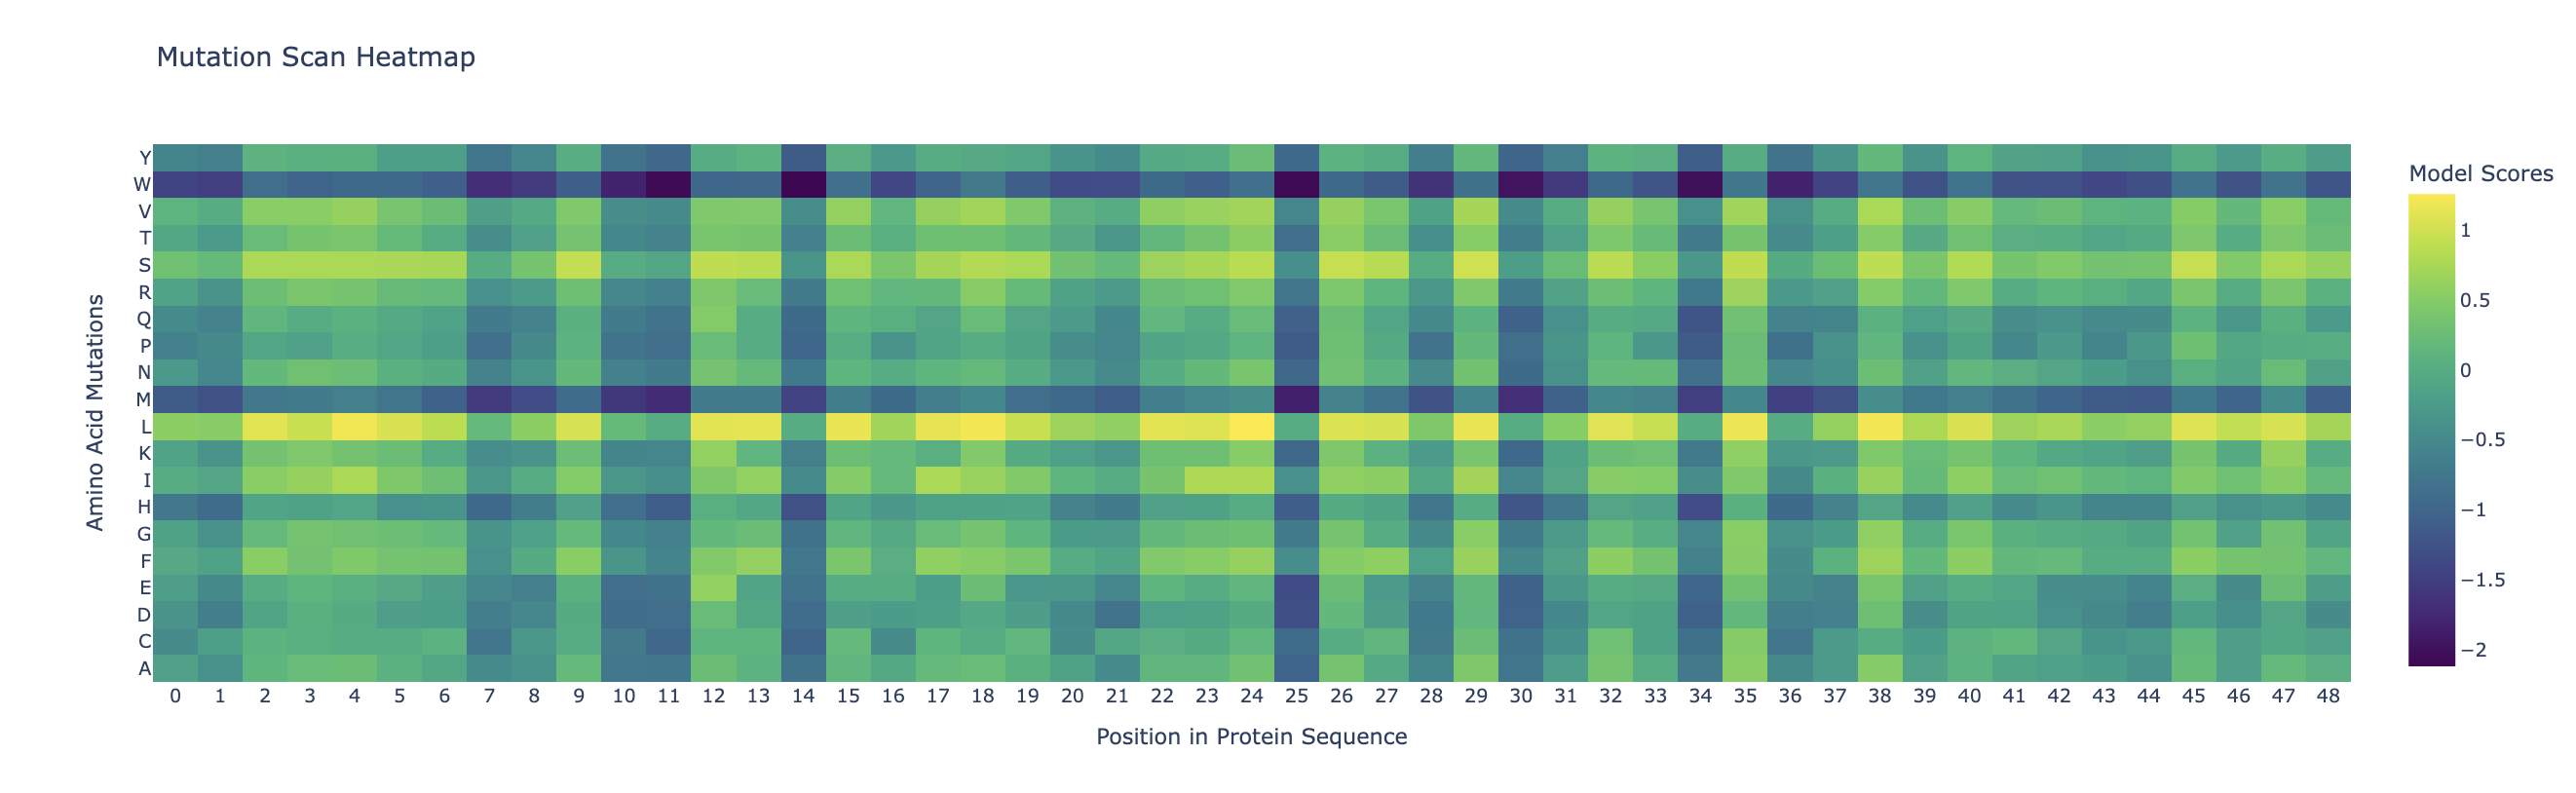
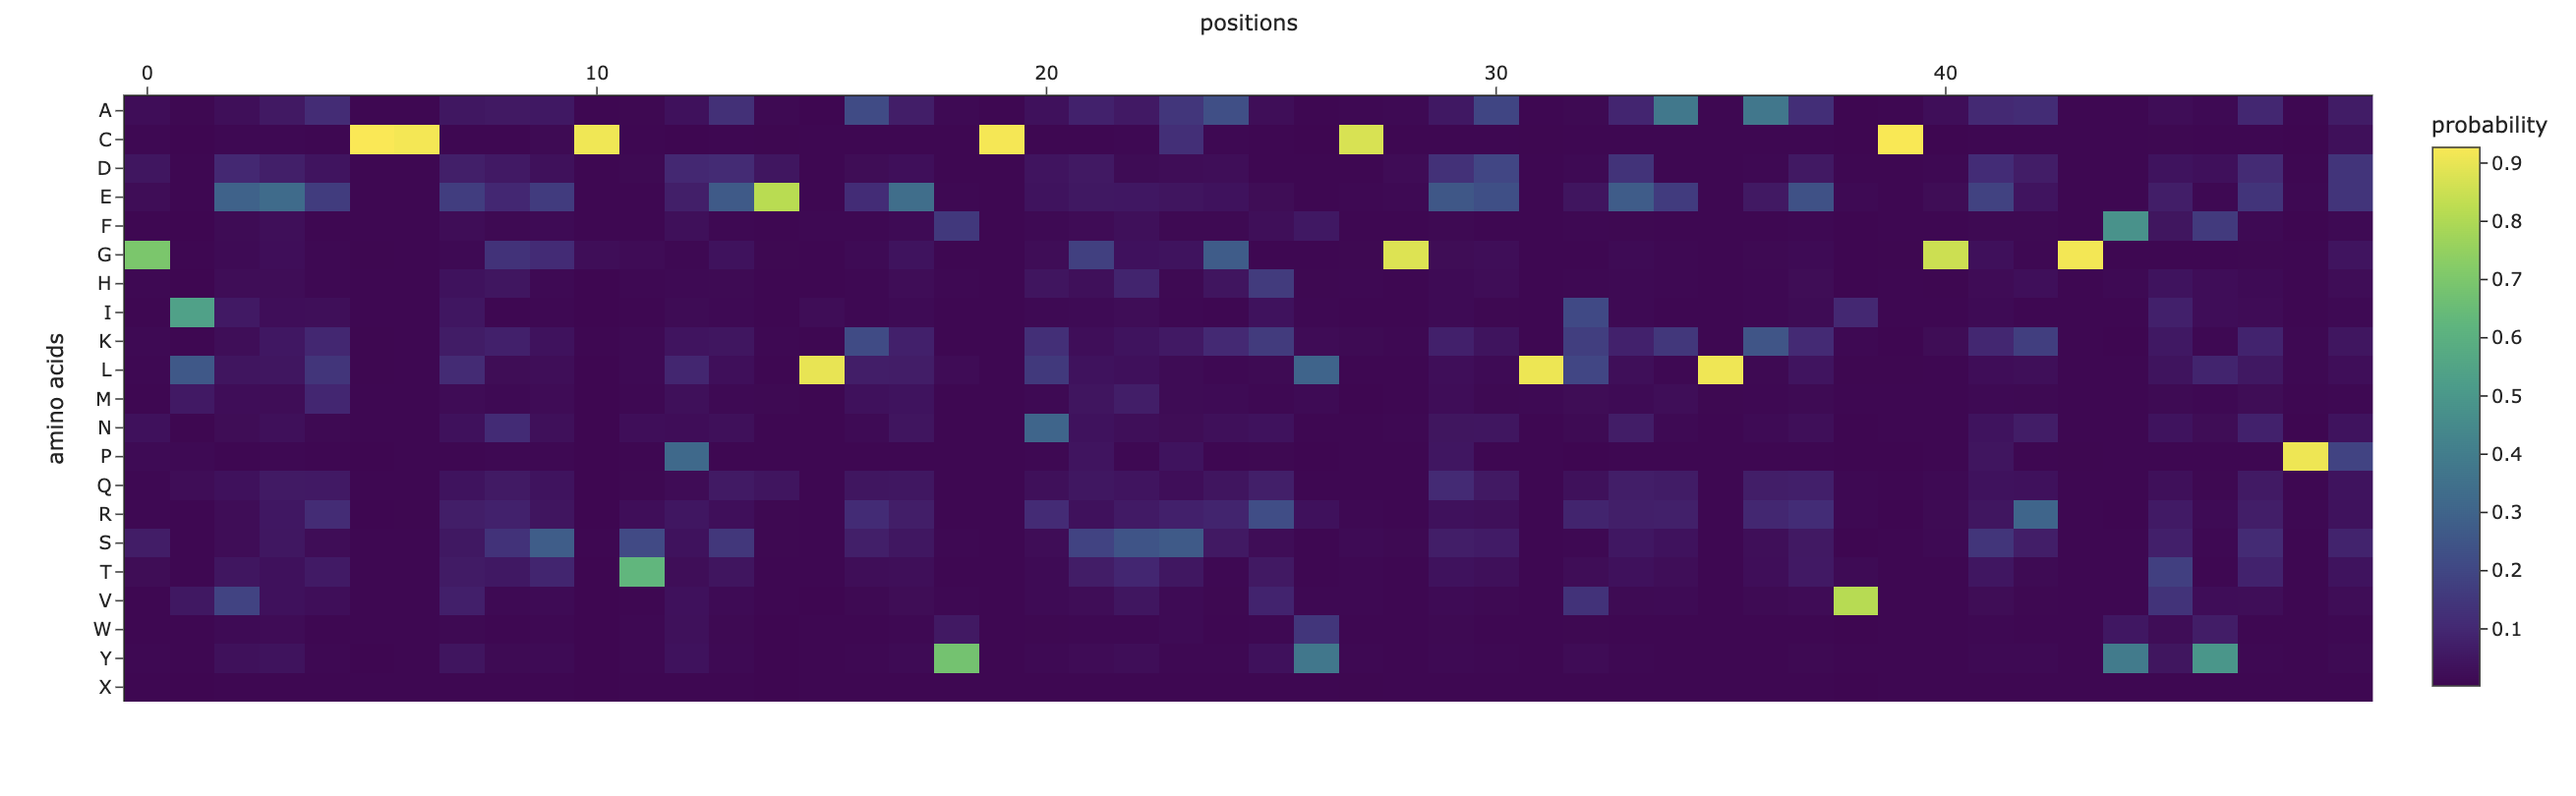
Darker columns (low probablities mean mutations are unlikely) indicate more conserved residues (wild-type is strongly preffered). Likely, these are amino acids which are most crucial to the protein’s structure and function.
C1.2. Latent Space Analysis
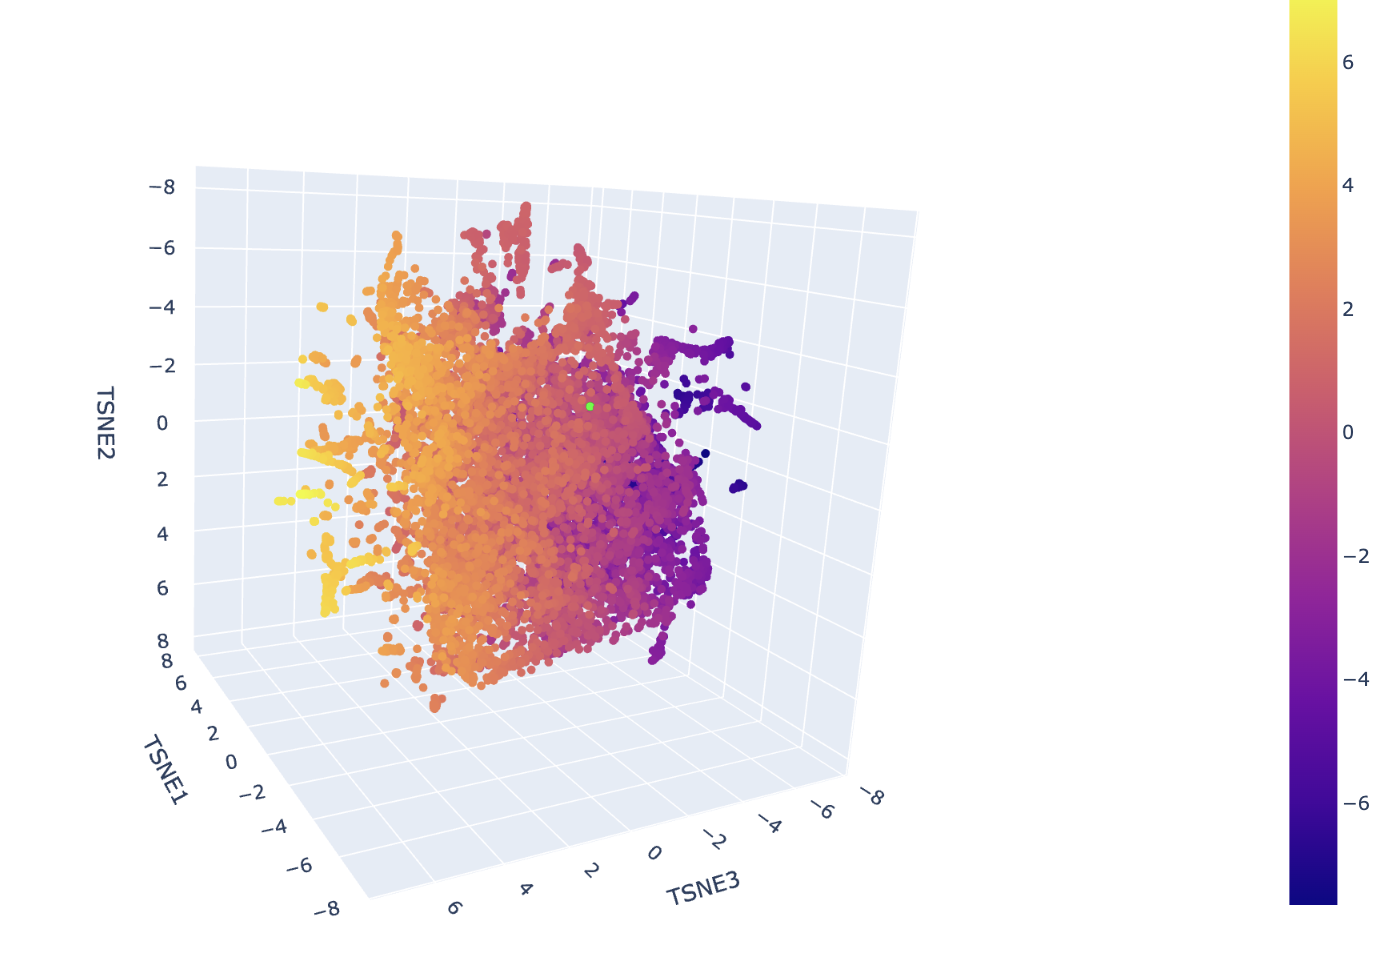
The neighborhoods in this map are determined by the high-dimensional proximity of ESM-2 embeddings, which represent the structural and evolutionary patterns of the sequences. In the ASTRAL SCOP dataset used here, these spatial clusters correspond to specific protein superfamilies and folds. Hovering over any cluster confirms that neighbors share identical or closely related SCOP classification codes, verifying that the visualization effectively approximates biological and structural similarity.
The insulin protein is represented by the lime green dot situated within a dense cluster of other signaling proteins. It is positioned in this specific neighborhood because the ESM-2 model identified its sequence signature, particularly the conserved cysteine motif, as being highly similar to the other sequences in that region. The predominant identities of its closest neighbors are other human and mammalian insulins, as well as members of the Insulin/IGF/Relaxin superfamily like IGF-1 and IGF-2. This proximity indicates that the model recognizes your protein as sharing the same disulfide-rich fold that defines the structural template for this entire cluster.
C2.1
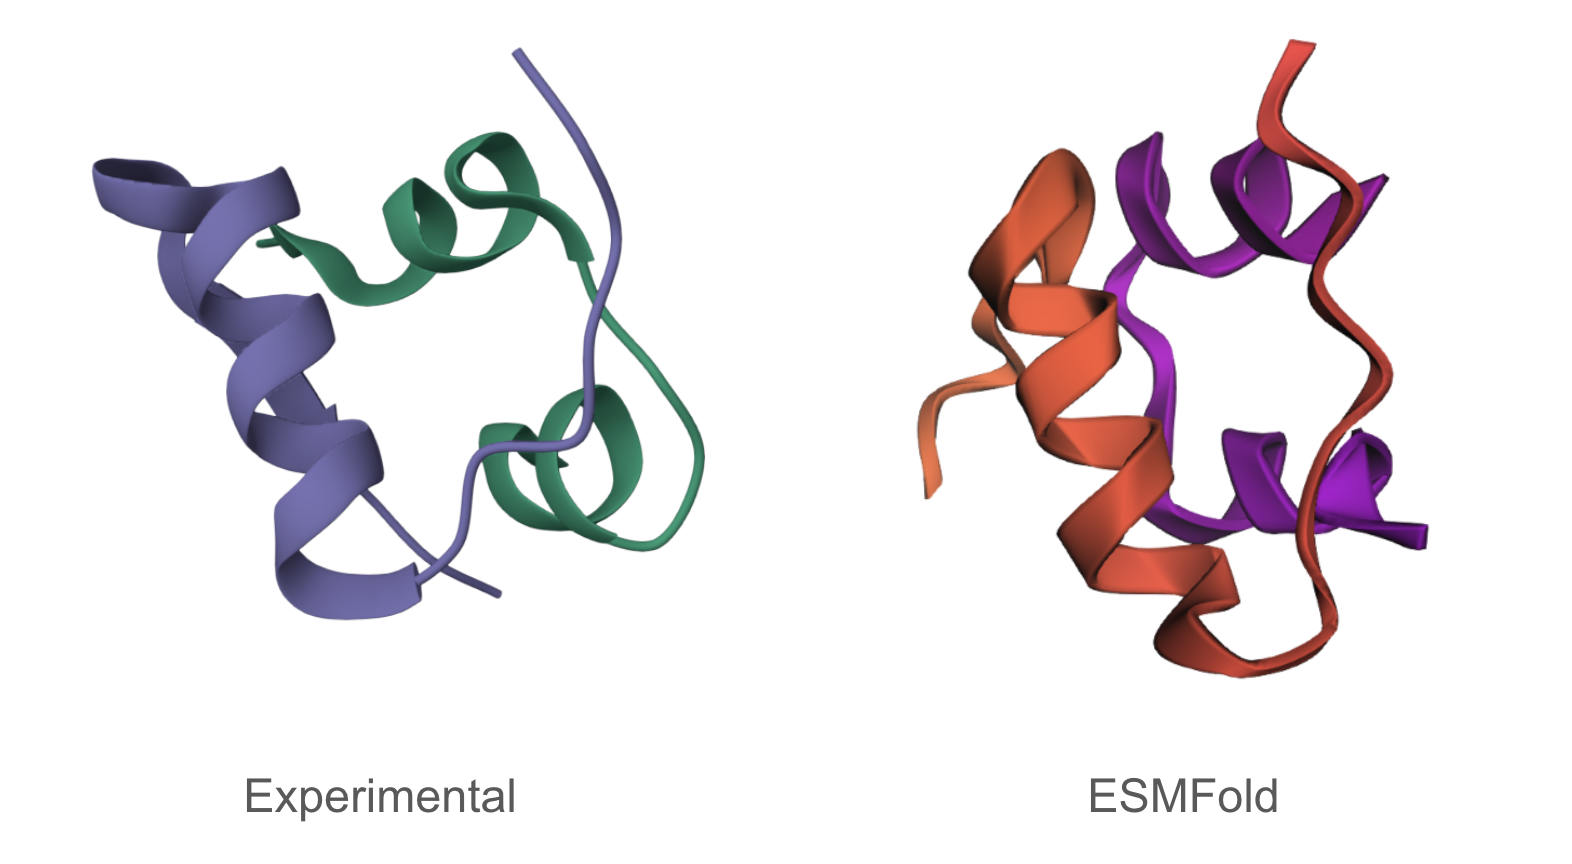
The predicted structure matches the experimentally determined structure.
C2.2
Mutating some portions had minimal impact on predicted structure, while mutations/deletions in other portions (the beginning for instance) meaningfully altered the predicted structure.
C3.1
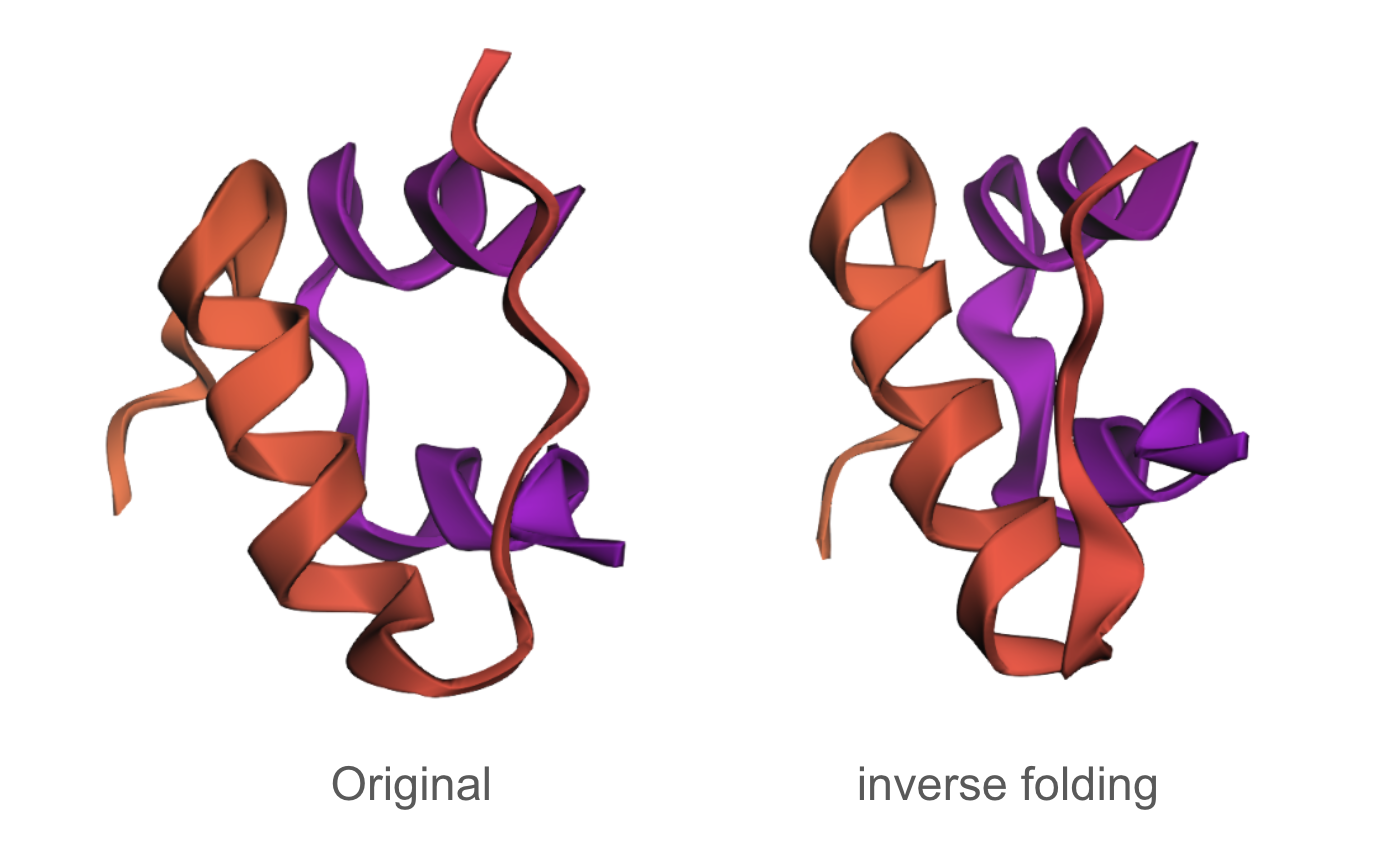
The designed sequence obtained using inverse folding was:
The inverse folding analysis of the 3E7Y backbone yielded a native sequence score of 1.6521 and a ProteinMPNN-designed score of 0.9312, where the lower value for the design indicates a higher model-perceived likelihood that the new sequence will stabilize the target structure. This optimization is reflected in a sequence recovery of 0.5200, suggesting that while the model preserved 52% of the original residues to maintain the structural core, it proposed alternative mutations for the remaining 48% to improve the fit. The amino acid probability chart supports these scores by revealing that the model’s high confidence is concentrated at key positions like the cysteines, which are essential for the disulfide-rich insulin fold, while the lower scores for the redesign likely stem from the model finding more energetically favorable residues for the flexible, darker-colored regions on the heatmap.
C3.2
The predicted structure of the inverse-folding result was extremely similar to the ESMFold result of the original sequence.
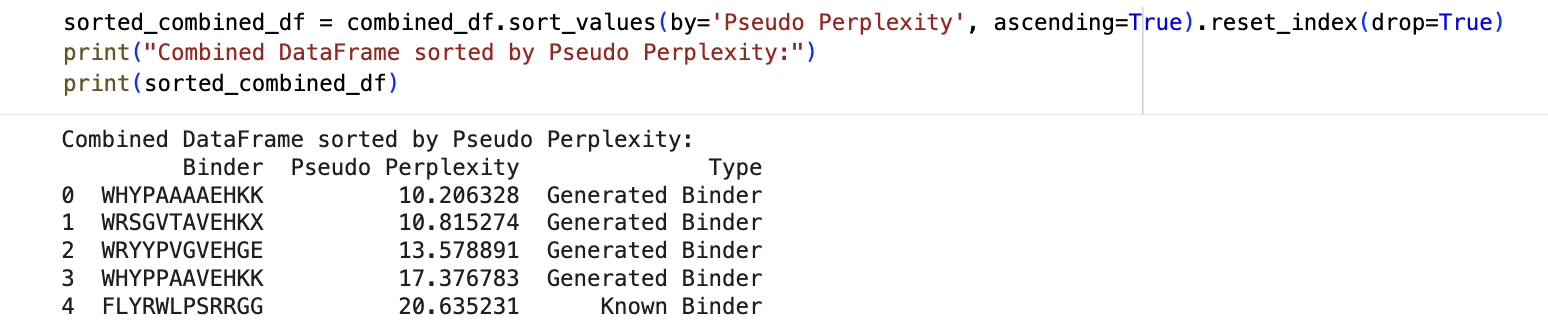
Perplexity scores for known and generated peptides:
Alphafold binder evaluation
ipTM Values and Comparison to Known Binder
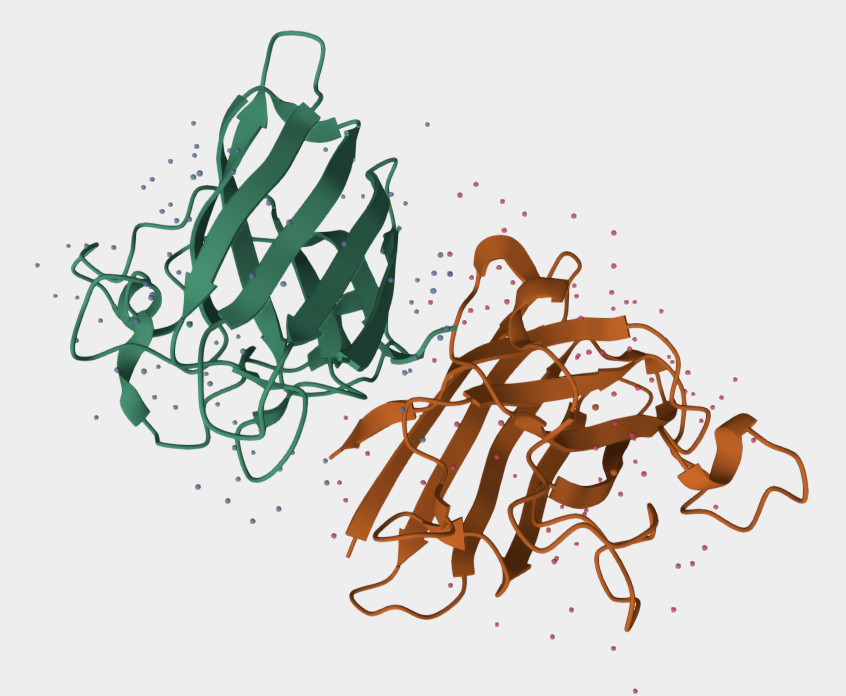
The ipTM values across all peptides are low, ranging from 0.27 to 0.43, and none exceed 0.5 — the general threshold for confident protein-peptide interaction prediction. Notably, two PepMLM-generated peptides (Sequence_0 at 0.40 and Sequence_1 at 0.43) actually exceed the known binder (Sequence_4 at 0.32), suggesting the model produced candidates with comparable or slightly better predicted interface confidence. However, all predictions share the same binding
Location note: surface-exposed, near the dimer interface, and not near the A4V mutation site.
Important caveat: none of these peptides, including the known binder, appear to engage the mutation directly, which limits their utility for direct mutant stabilization.
Peptiverse property evaluation
Peptiverse vs. AlphaFold3 Structural Predictions
There is no consistent correlation between ipTM and predicted binding affinity. Sequence_1 has the highest ipTM (0.43) but one of the weaker affinities (5.183 pKd/pKi), while the known binder has a modest ipTM (0.32) yet the strongest predicted affinity (5.968 pKd/pKi) — suggesting the two metrics are capturing different aspects of binding. Encouragingly, all peptides are fully soluble (P=1.00) and non-hemolytic, presenting clean safety profiles. The known binder is the closest to a hemolysis concern (P=0.047) and carries a high positive charge (+2.76), raising off-target interaction risk. Sequence_0 best balances the available metrics — strong ipTM among generated candidates (0.40), highest predicted affinity of the PepMLM sequences (5.624 pKd/pKi), full solubility, low hemolysis risk (P=0.034), and near-neutral charge (−1.14).
Peptide to Advance: Sequence_0 (WRYYPVGVEHGE)
I would advance Sequence_0. It offers the best combination of structural confidence, predicted affinity, and therapeutic safety among the generated candidates, and compares favorably to the known binder on hemolysis and charge. Crucially, like all candidates here, it binds near the dimer interface rather than the mutation site directly — meaning the likely mechanism of action would be dimer stabilization rather than direct rescue of the A4V destabilization. This is still therapeutically meaningful, since SOD1 A4V toxicity is closely linked to aberrant monomerization and aggregation, and stabilizing the dimer interface could slow that cascade. That mechanistic framing should be explicitly tested in follow-up biochemical and cell-based assays, but Sequence_0 represents the strongest starting point for that line of investigation.
Week 6 HW: Genetic Circuits
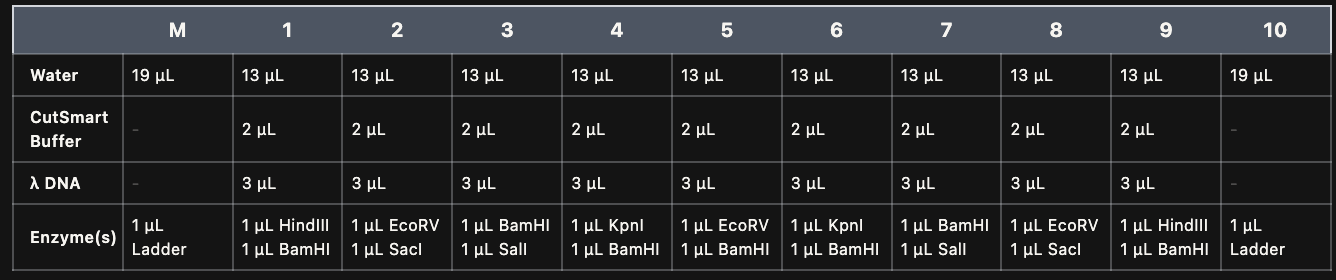
HW Questions
What are some components in the Phusion High-Fidelity PCR Master Mix and what is their purpose?
Phusion DNA Polymease, which synthesized new DNA by adding new nucleotides to the template DNA during PCR
dNTPs, which are the nucleotide building blocks (dATP, dGTP, dCTP, and dTTP)
reaction buffer, which acts as a chemical stabilizer that maintains the ideal pH and salt balance so the enzyme stays active and can accurately build new DNA strands.
What are some factors that determine primer annealing temperature during PCR?
Melting temperature of the primer, which is the temperature at which half of the DNA complex dissociates
Primer length, since longer primers usually require higher annealing temperatures
GC content, since higher GC content typically increases the primer melting temperature
Salt concentration, since higher salt concentrations can stabilize the DNA and thus may require higher annealing temperatures
There are two methods from this class that create linear fragments of DNA: PCR, and restriction enzyme digests. Compare and contrast these two methods, both in terms of protocol as well as when one may be preferable to use over the other.
Feature
PCR (Polymerase Chain Reaction)
Restriction Enzyme Digest
Mechanism
Enzymatic Synthesis: Building new strands from primers.
Enzymatic Cleavage: Cutting phosphodiester bonds at specific sites.
Protocol
Thermal Cycling: Repeated steps of denaturation (95°C), annealing (55-65°C), and extension (72°C).
Isothermal Incubation: DNA and enzymes are mixed in a buffer and held at a constant temp (usually 37°C).
Reagents
DNA template, Primers, dNTPs, Taq Polymerase, MgCl2, Buffer.
DNA template, Restriction Enzymes, specific BSA/Salt Buffer, Water.
Pros
High sensitivity; amplifies DNA; creates specific fragments without needing existing cut sites.
Simple setup; highly reproducible; great for verifying known sequences or circular DNA.
Cons
Prone to contamination; requires known flanking sequences; potential for polymerase errors.
Does not amplify DNA; limited by the location of natural recognition sites.
When to Use
When you have minimal DNA, need a custom fragment, or want to add “tails” for cloning.
When linearizing plasmids, performing diagnostic checks, or subcloning existing inserts.
How can you ensure that the DNA sequences that you have digested and PCR-ed will be appropriate for Gibson cloning?
Both the PCR and digested fragments must share identical overlapping terminal sequences (15–40 bp) with their neighboring fragments to allow for seamless homology-directed assembly.
How does the plasmid DNA enter the E. coli cells during transformation?
Membrane pores open due to a thermal pressure imbalance during the heat shock, allowing the plasmid DNA (which has been neutralized by calcium ions) to be pulled into the cell.
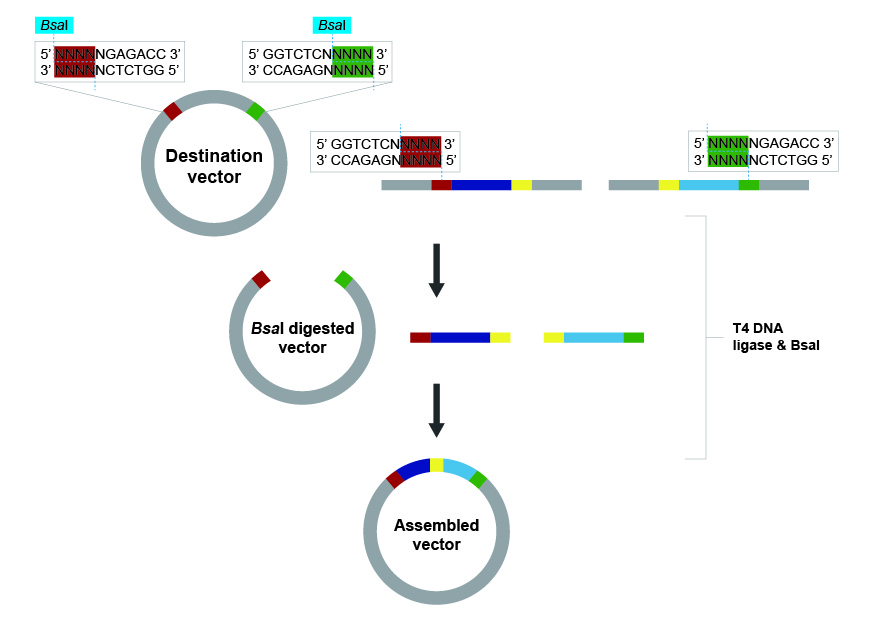
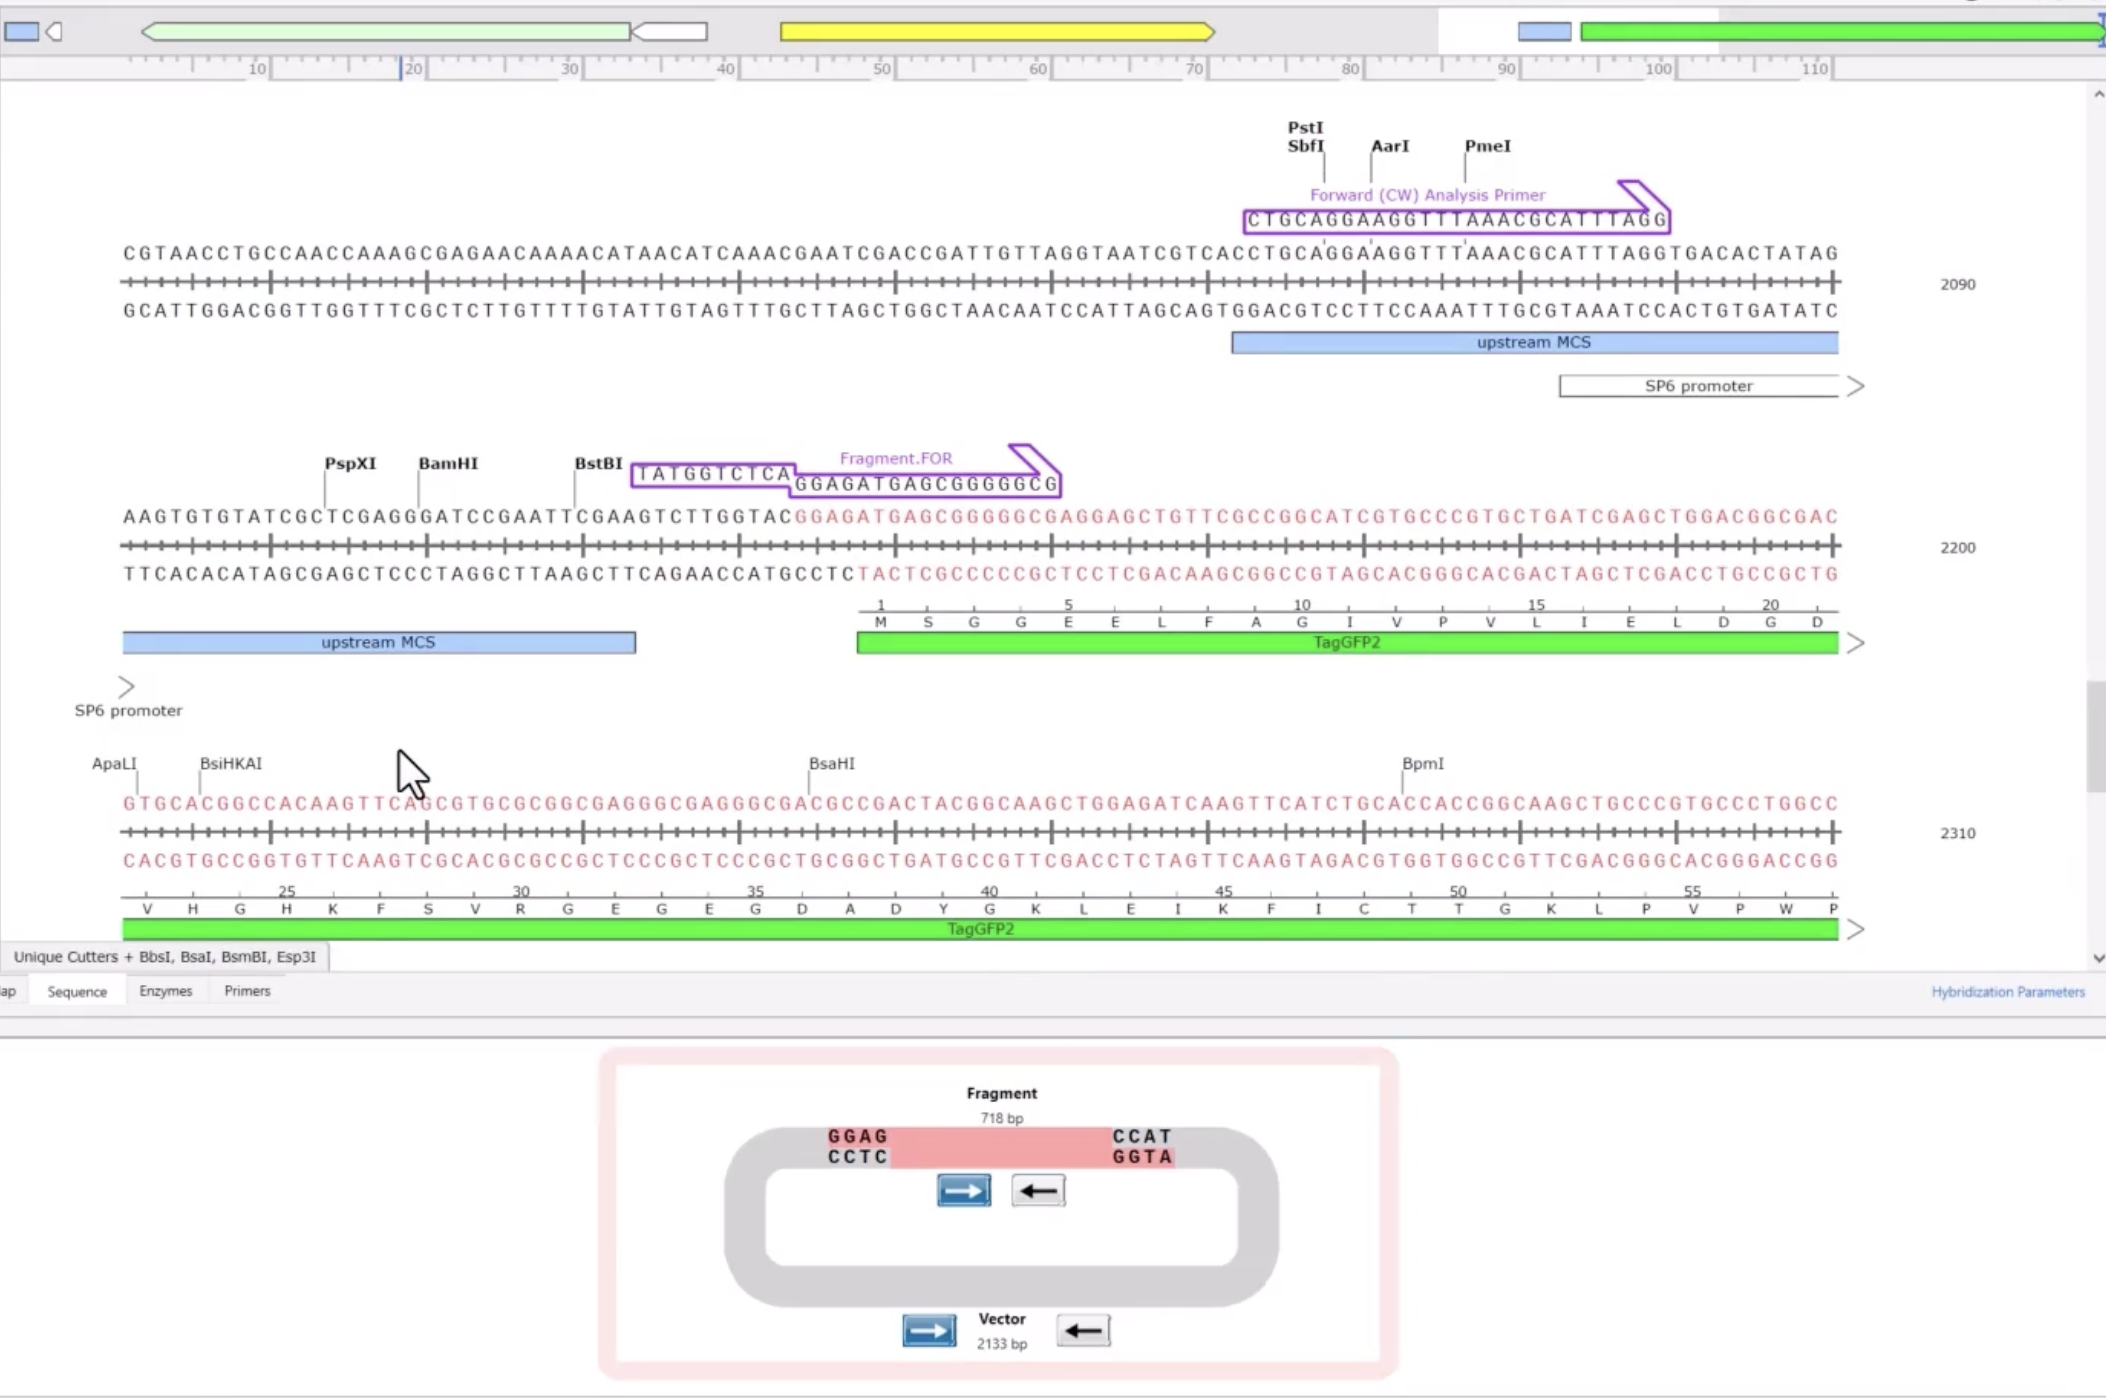
Describe another assembly method in detail (such as Golden Gate Assembly)
Golden Gate Assembly is a highly efficient “one-pot” cloning method that allows you to join multiple DNA fragments together simultaneously using Type IIS restriction enzymes and T4 DNA ligase. Unlike standard enzymes, Type IIS enzymes like BsaI bind to a specific recognition sequence but cut the DNA several nucleotides away, creating custom 4-base overhangs. By strategically designing these overhangs to be complementary, you can ensure that multiple fragments assemble in a specific, directional order. During the reaction, you cycle the temperature to repeatedly cut and ligate the DNA until the fragments are perfectly joined. A key advantage is that the enzyme’s recognition sites are positioned to be “cut off” and removed during the process, meaning the final product cannot be re-cut. This makes the reaction irreversible and drives the assembly toward the final, seamless circular plasmid. Because of this precision, Golden Gate is the gold standard for modular cloning and building complex multi-gene constructs.
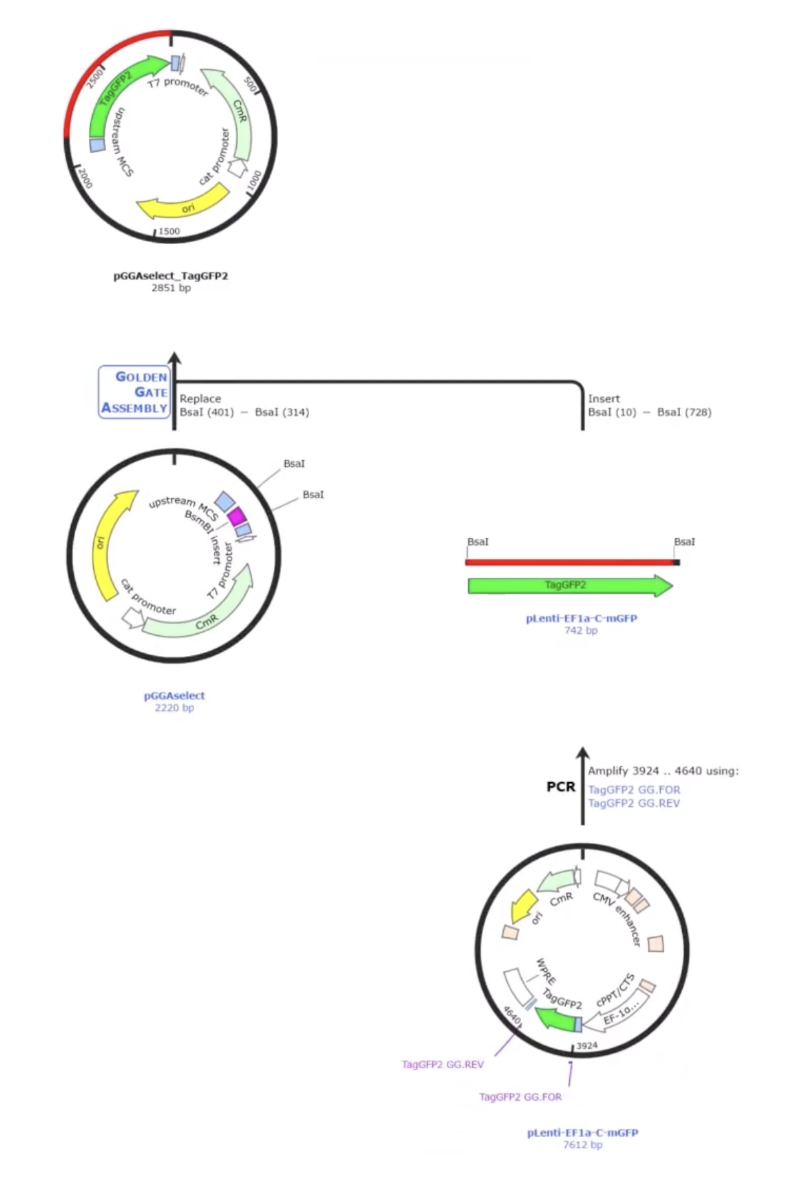
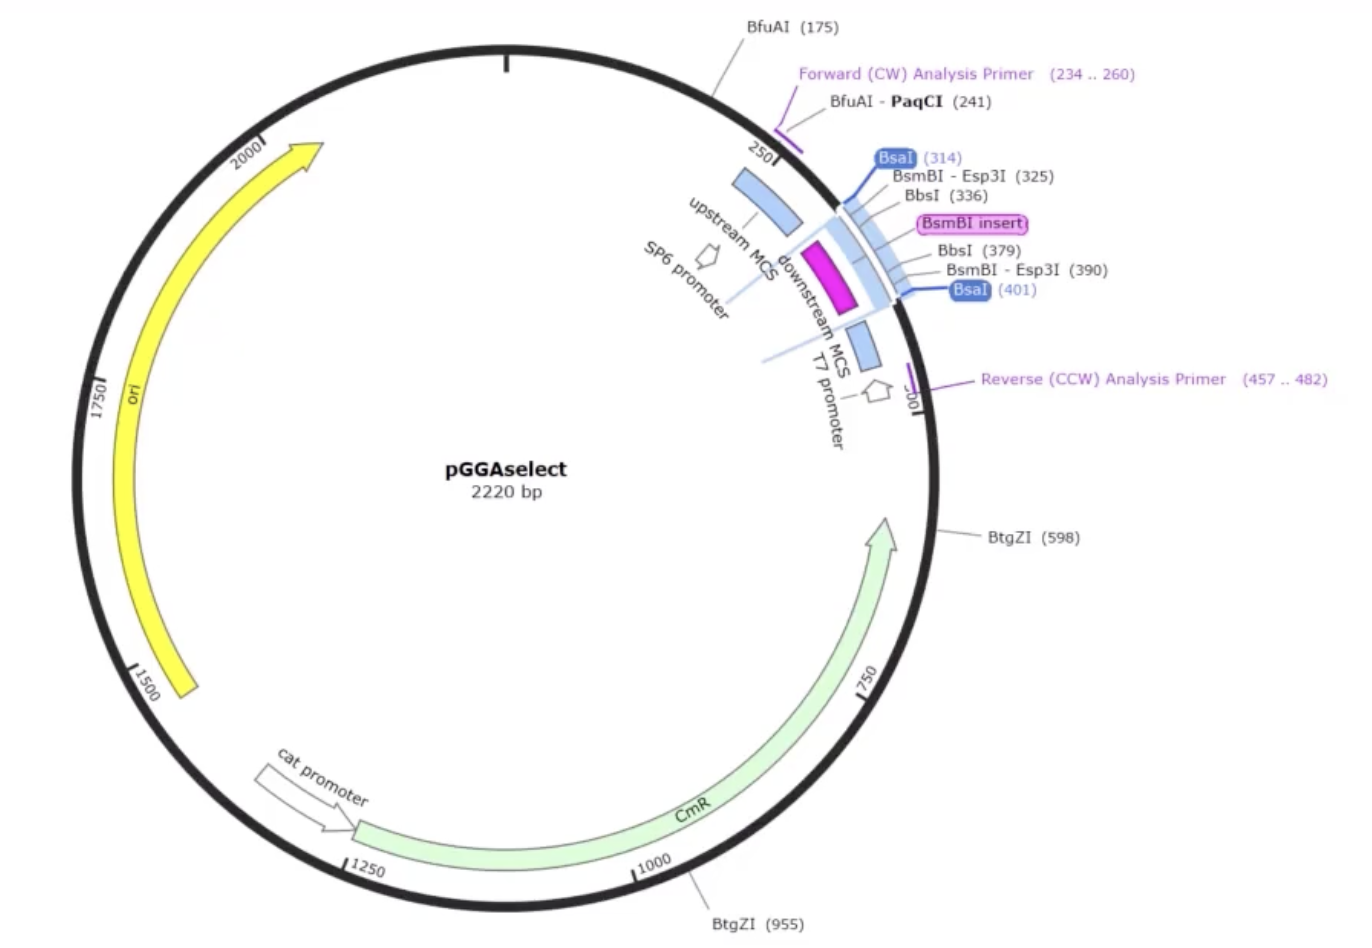
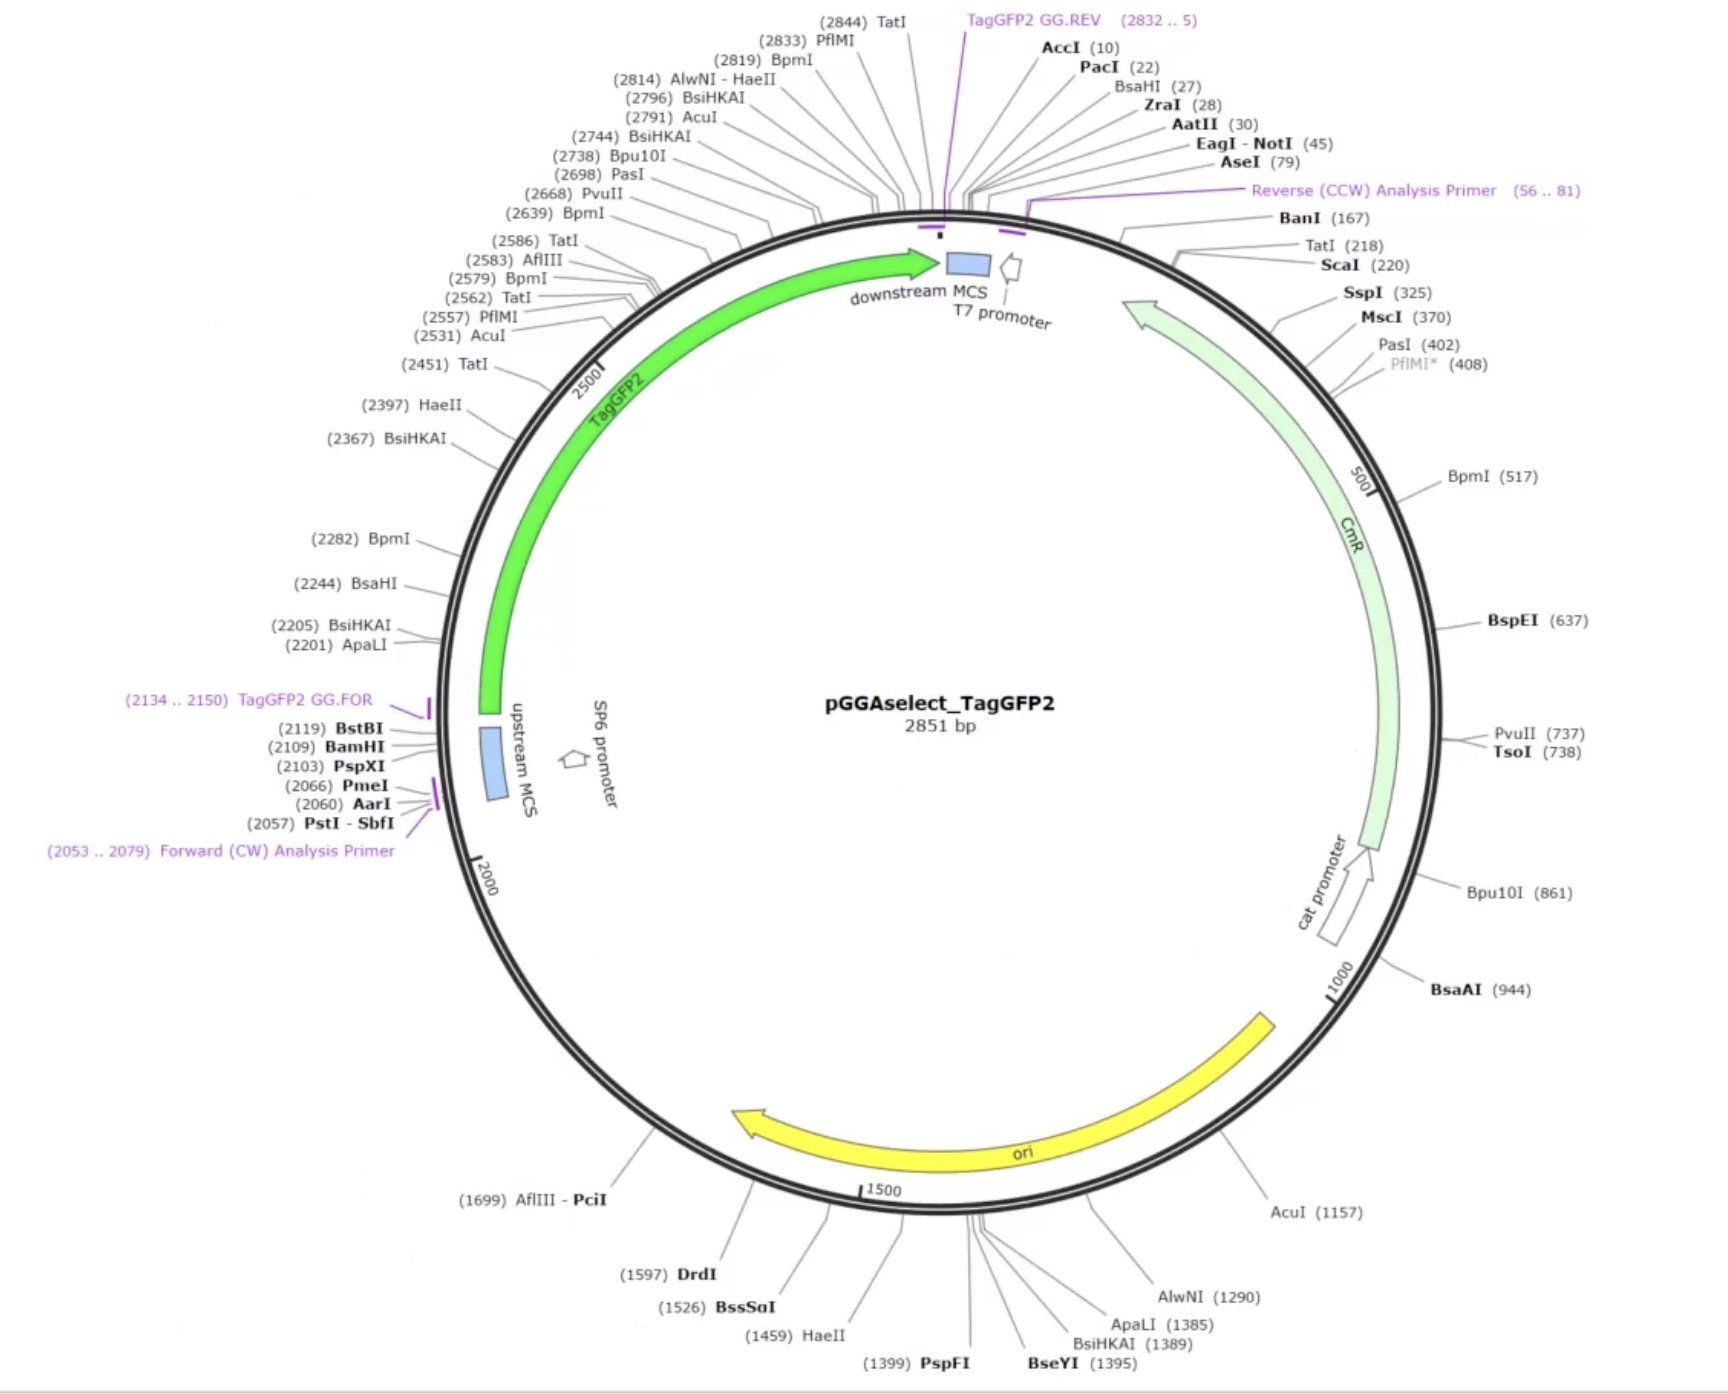
Simulating Golden Gate using AddGene’s tool
AddGene’s tool allows you to work with either a single insert or multiple fragments (up to 100), and it handles both vectors that already have Type IIS restriction sites and those that don’t. When sites are missing, it automatically designs the PCR primers needed to add them. You can also set your preferred PCR primer Tm. The tool selects the appropriate enzyme recognition sites, predicts how overhangs will interact, and flags any potential mis-ligation issues through an assembly fidelity score. Once you’re happy with the design, it simulates the full digest-and-ligate reaction and generates the predicted product sequence, which you can inspect at the fusion points to confirm everything is in frame and in the right order. It also exports your primer sequences ready to order.
select your vector
insert fragment
check the vector digest
review the predicted product
adjust overhangs
assemble
Asimov Kernel
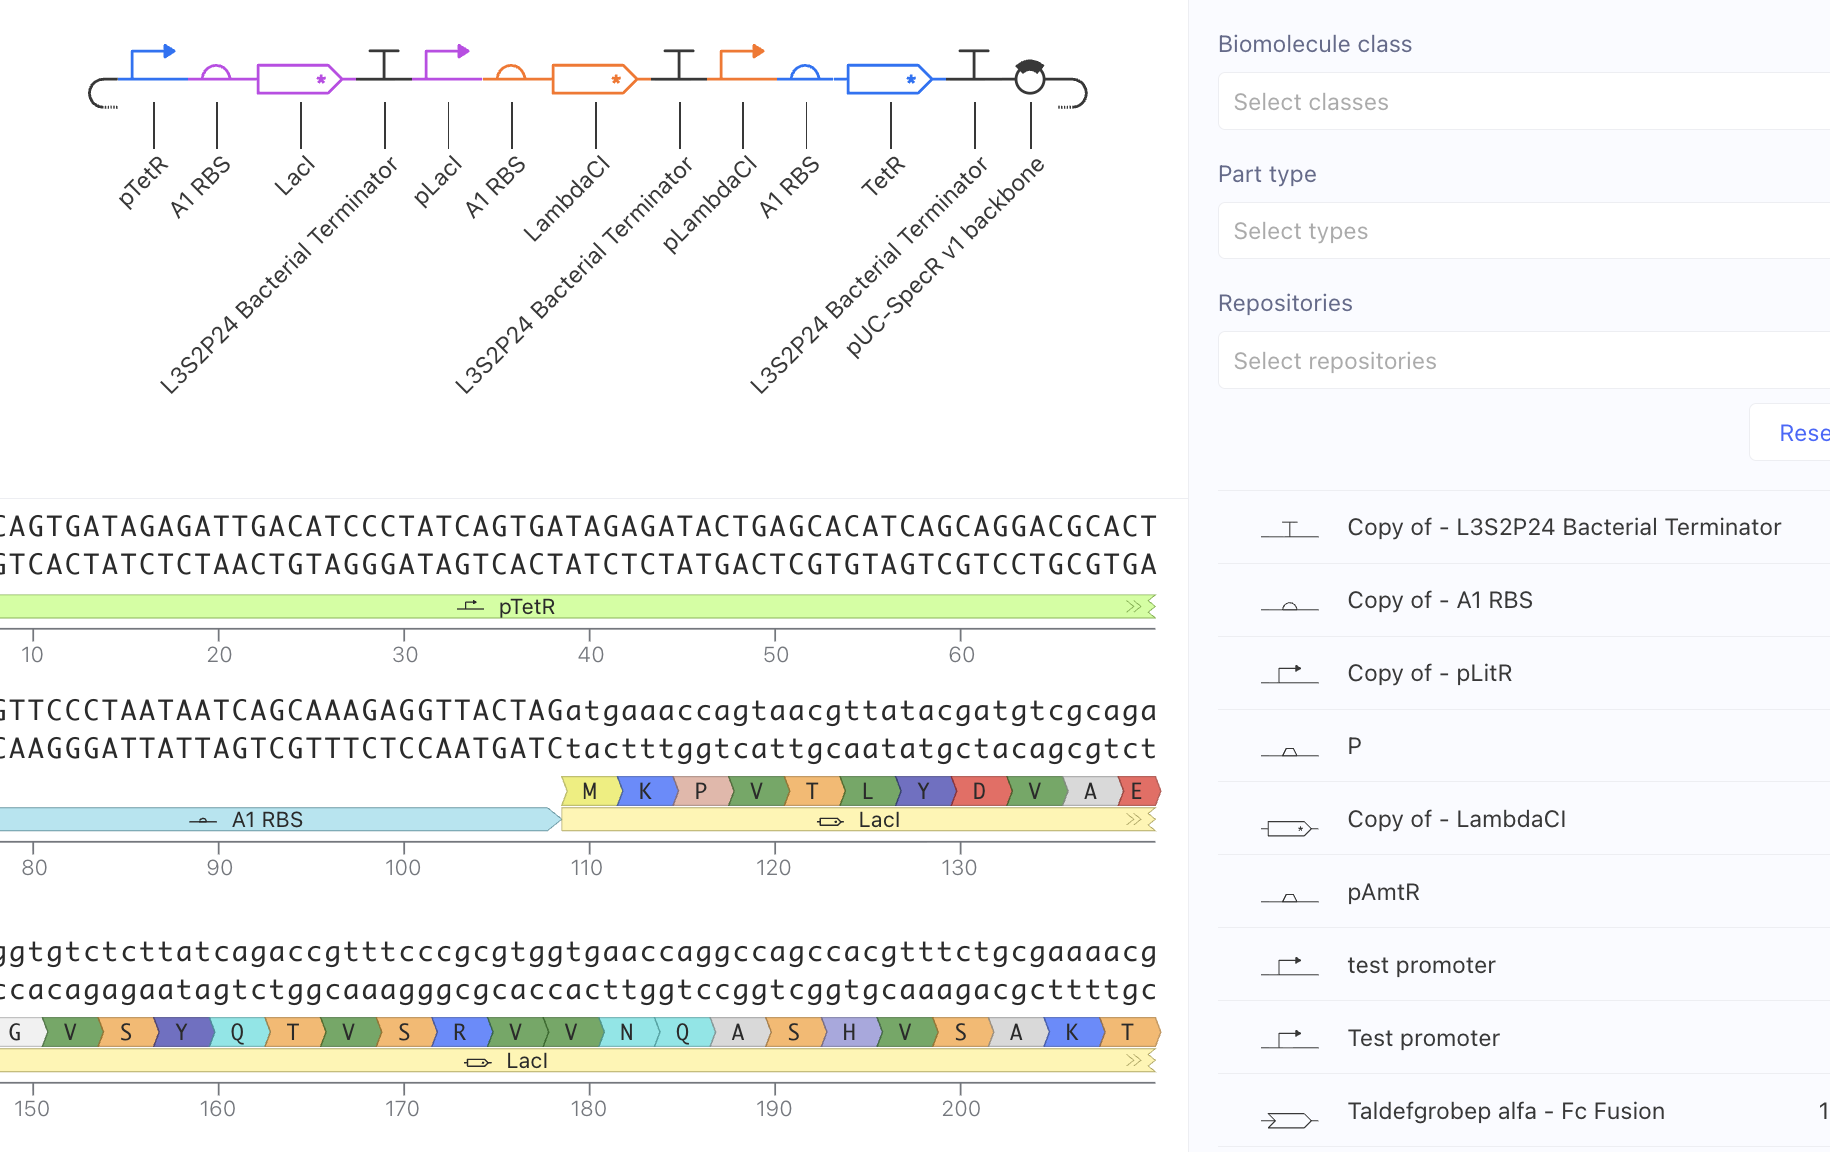
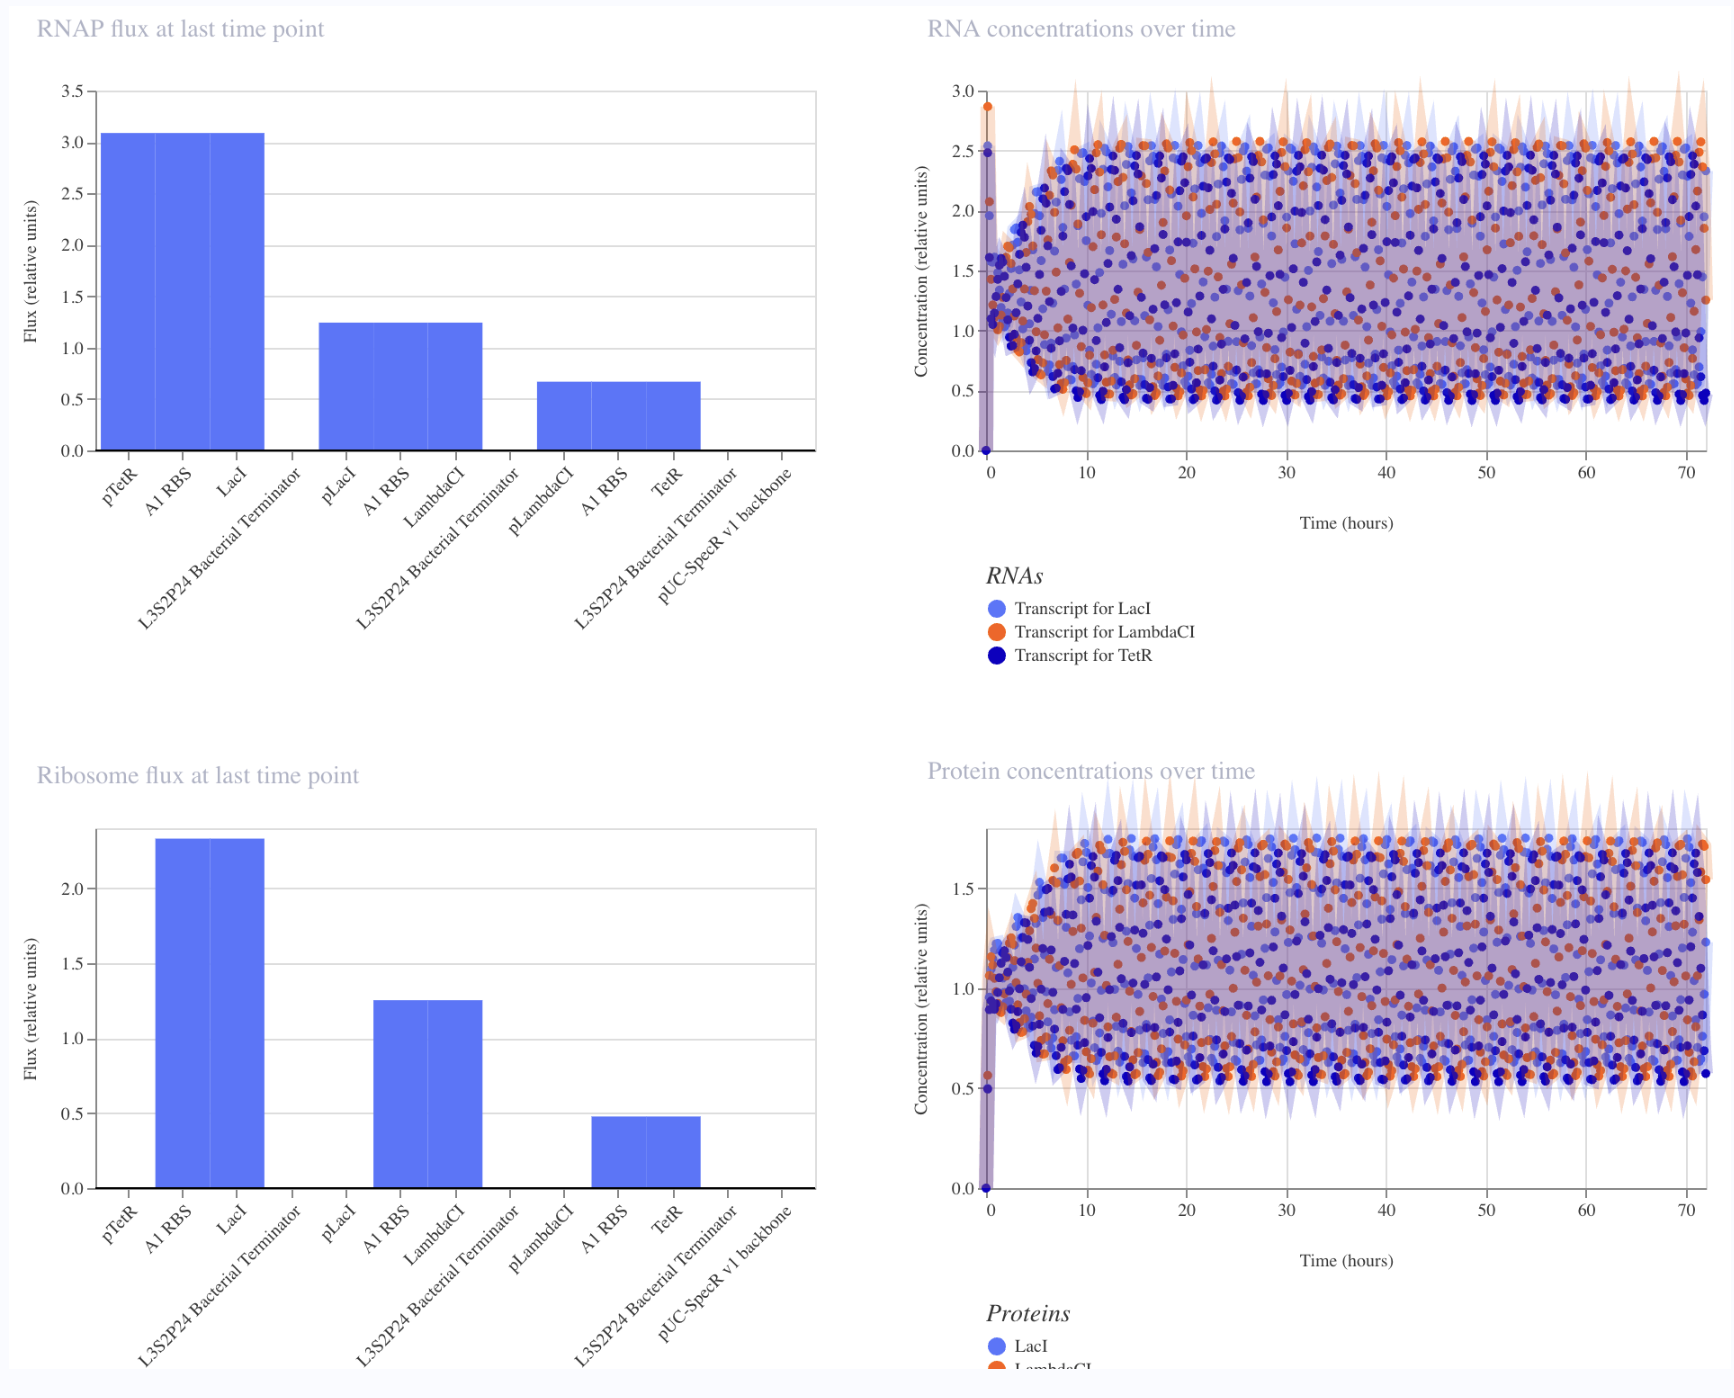
Repressilator
I reacreated the represillator by searching dragging parts one by one from the Parts Search.
The results of the simulation were similar to the simulation of the original represillator. The simulation shows oscillations in expression levels for all three proteins.
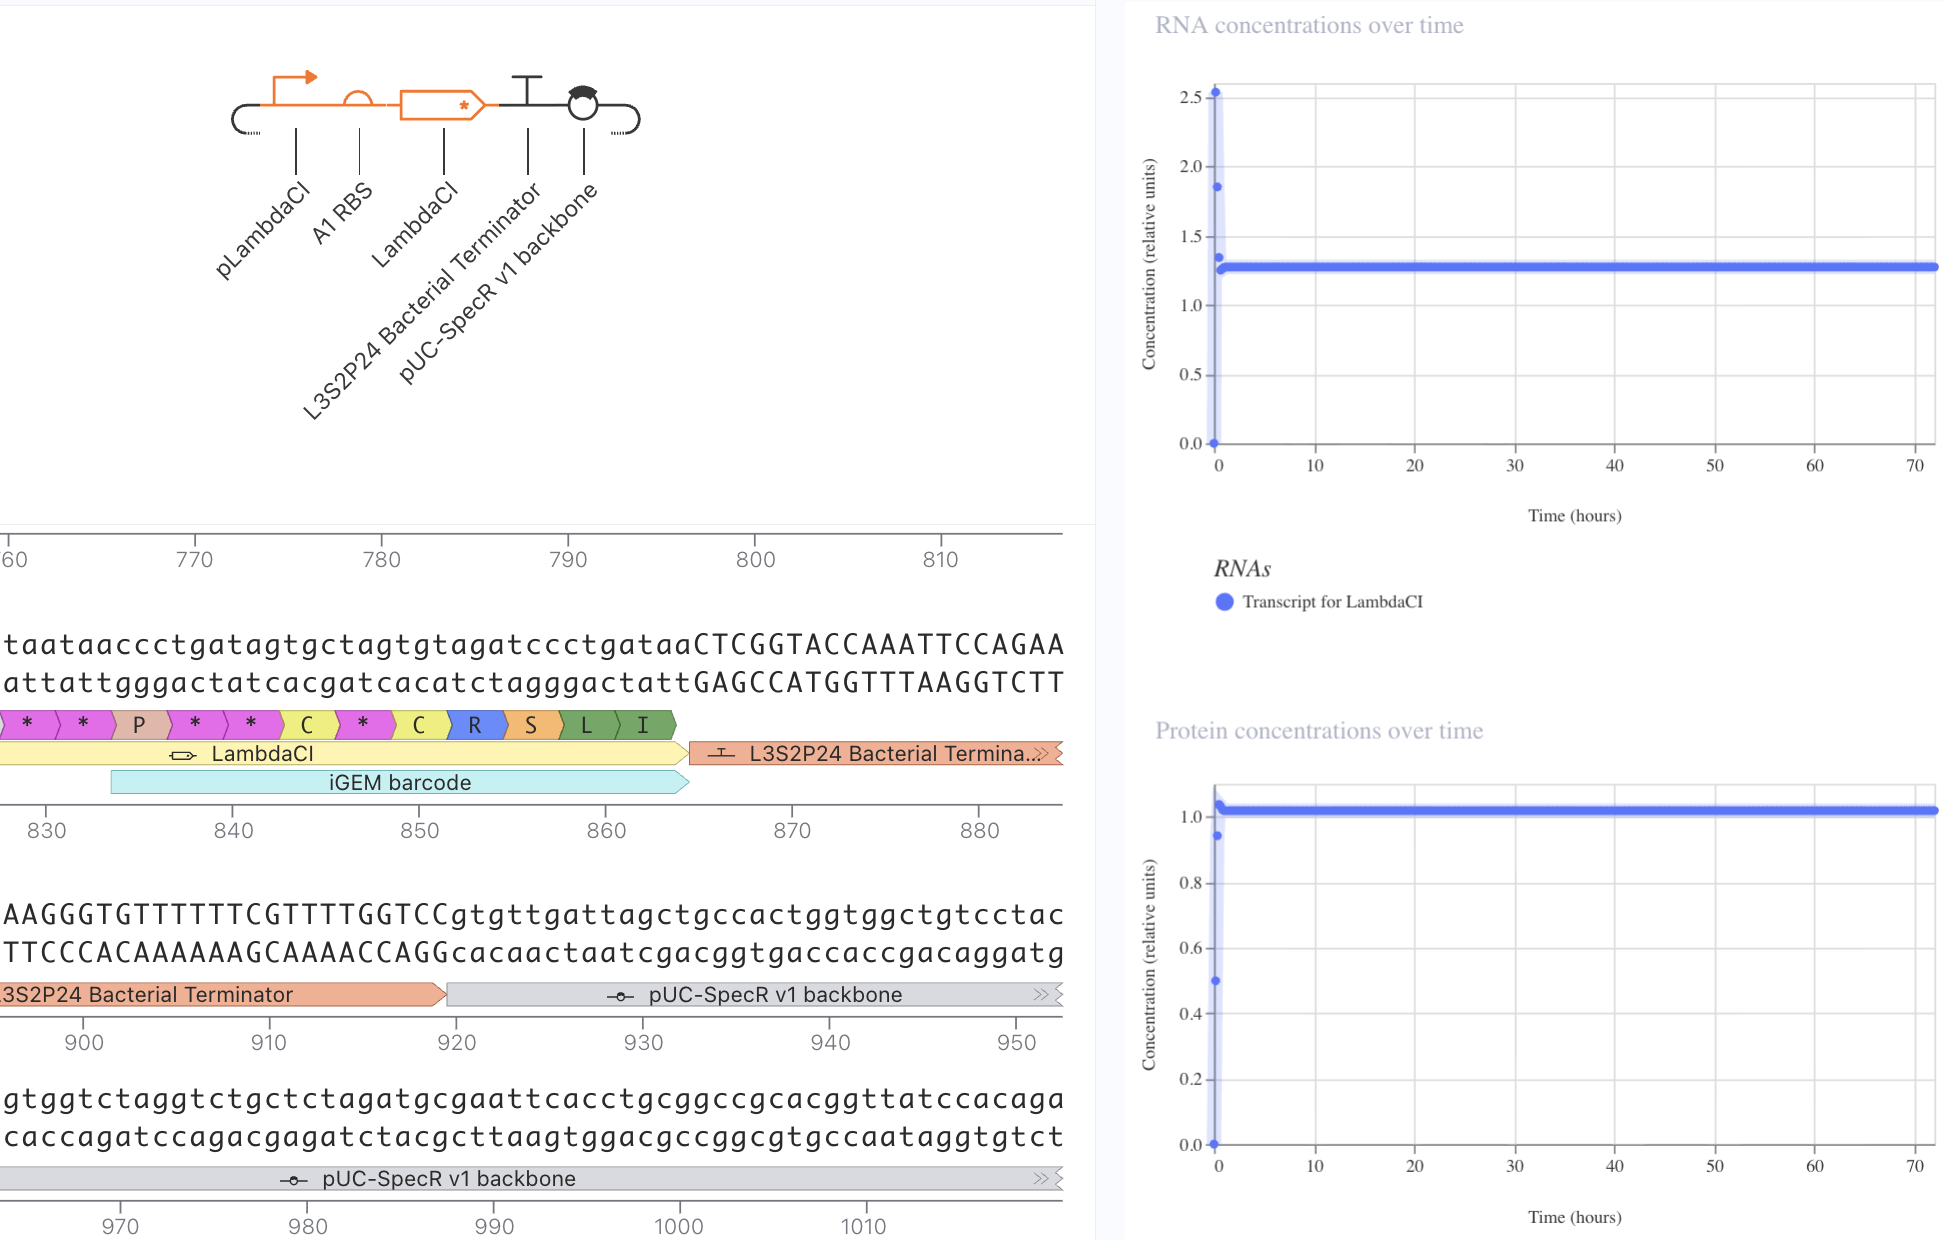
Original Constructs
I first started with a simple construct consisting of a LambdaCI promoter, an A1 RBS, the LambdaCI CDS, a bacterial terminator, and a backbone. Simulating showed constant concentration of RNA, and highly expressed protein levels.
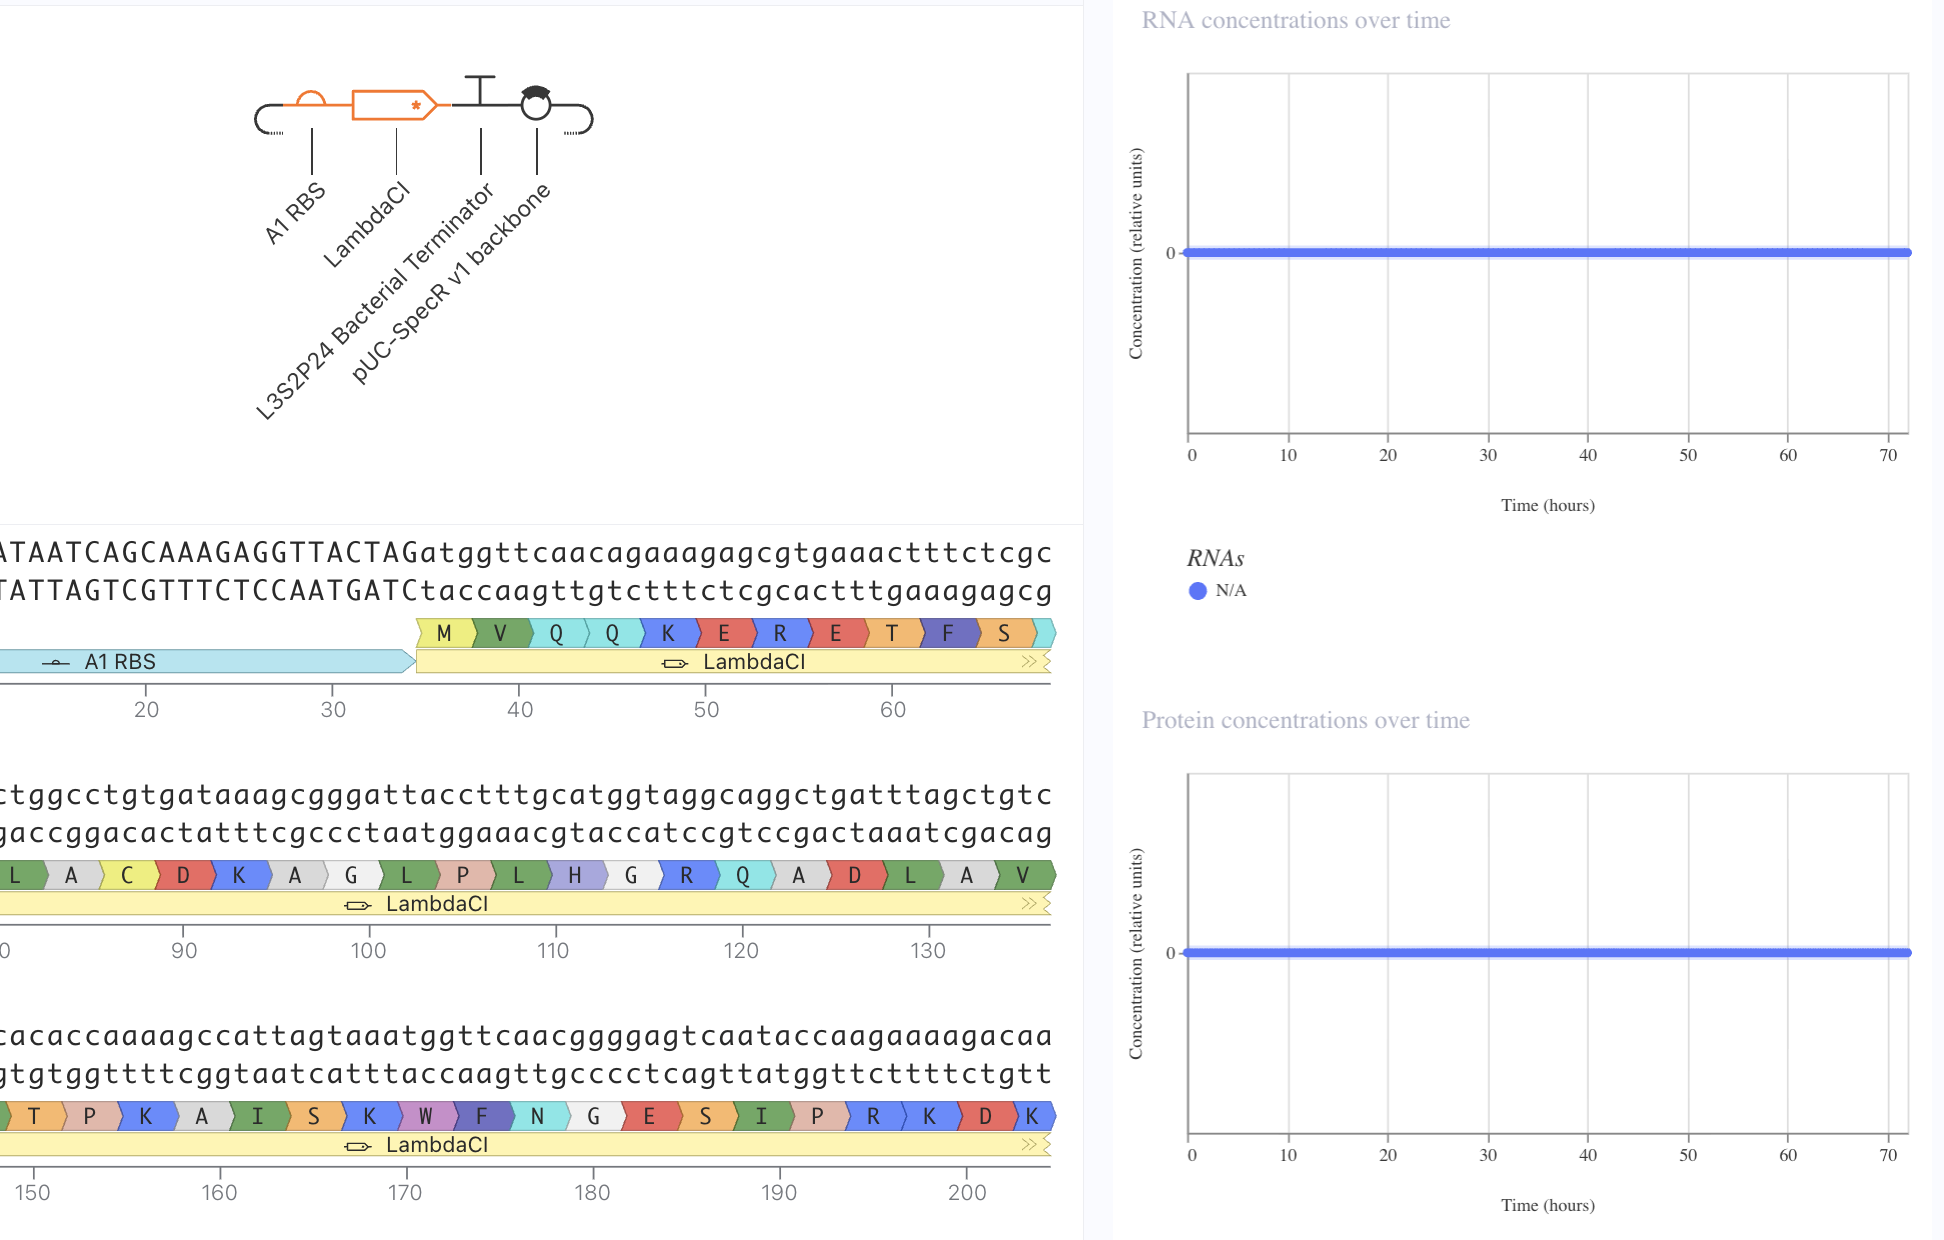
Next, I removed the promoter. This meant that no presence of RNA or protein expression were predicted.
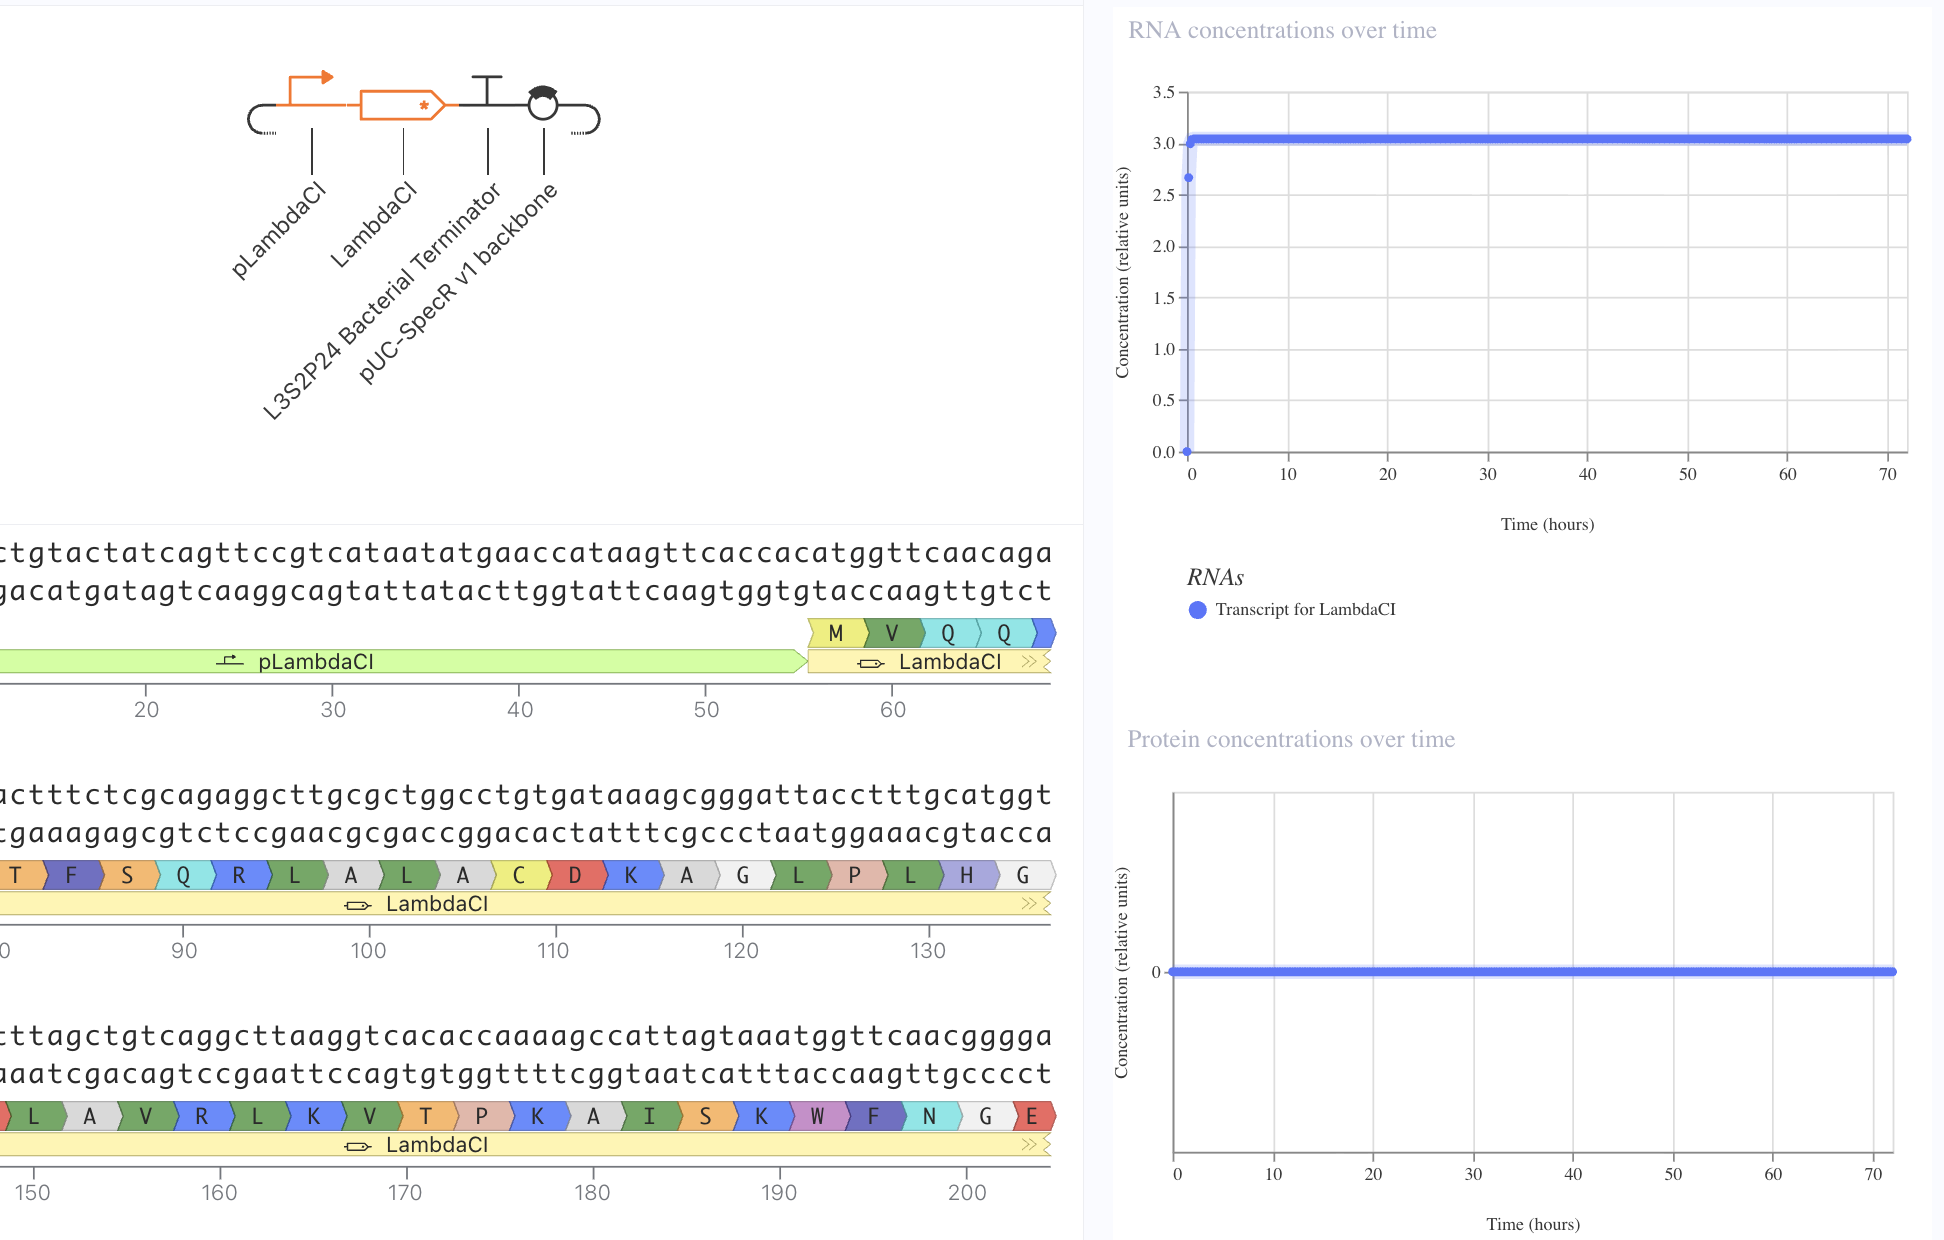
Lastly, I removed the RBS. Here, despite predicted presence of RNA, there was no protein expression. This reveals the necessity of the RBS for protein epression.
week 7 HW: genetic circuits part II
Part 1: Intracellular Artificial Neural Networks (IANNs)
What advantages do IANNs have over traditional genetic circuits, whose input/output behaviors are Boolean functions?
Traditional genetic circuits can only read a signal as ON/OFF, even though molecules inside a cell exist at all kinds of intermediate concentrations. To build something complex out of ON/OFF switches, you have to layer many of them together, and each added layer introduces new opportunities for components to accidentally influence each other or fall out of sync. IANNs instead pass graded responses between nodes. Each node receives an actual concentration value, weighs it, and passes a continuous output forward. This means a single node carries far more information than an ON/OFF switch, so you need fewer of them to represent something complex, and there are fewer points at which things can go wrong.
Describe a useful application for an IANN; include a detailed description of input/output behavior, as well as any limitations an IANN might face to achieve your goal.
A good use case is engineering bacteria to produce a drug. The bacteria need to balance how much raw material is available against how much final product has built up, since overproduction can stall or kill the cells. A Boolean circuit can only respond to whether the product level is above or below a fixed cutoff, shutting production on or off entirely. An IANN can instead read both signals as continuous values and smoothly adjust enzyme production in response, the same way a thermostat gradually responds to temperature rather than just cutting the heat off when a room gets warm.
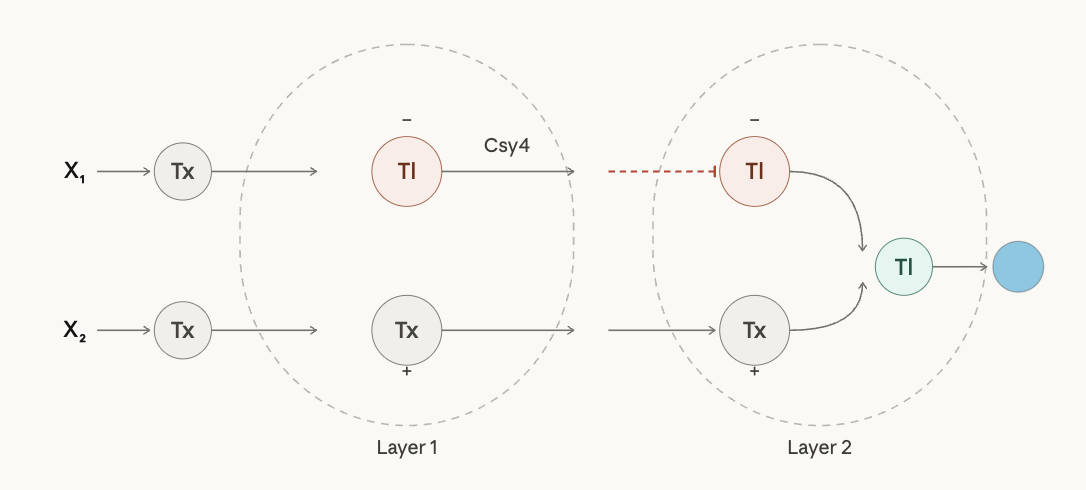
Draw a diagram for an intracellular multilayer perceptron where layer 1 outputs an endoribonuclease that regulates a fluorescent protein output in layer 2.
Layer 1 takes X₁ and X₂ as DNA inputs, each transcribed outside the cell. Inside, X₁ is translated into Csy4 (the inhibitory node, red) and X₂ is transcribed into FP mRNA. Both exit Layer 1 and enter Layer 2, where Csy4 represses translation of the FP mRNA while the mRNA itself drives it. The surviving signal is then translated by the output Tl node into the fluorescent protein.
Part 2: Fungal Materials
What are some examples of existing fungal materials and what are they used for? What are their advantages and disadvantages over traditional counterparts?
Packaging: Mycelium grown on agricultural waste like straw can be molded into compostable styrofoam alternatives, but costs more to produce and is harder to manufacture consistently at scale.
Insulation: Mycelium panels outperform synthetic foam on fire resistance and sound absorption and are fully biodegradable, but absorb moisture easily and aren’t strong enough for load-bearing applications.
What might you want to genetically engineer fungi to do and why? What are the advantages of doing synthetic biology in fungi as opposed to bacteria?
If I were engineering fungi for materials, the highest-leverage targets would be:
Hyphal architecture and growth uniformity. Wild-type mycelium grows in directions determined by nutrient gradients and available space, producing a material with inconsistent density. Engineering transcription factors that control hyphal branching frequency — likely homologs of the stuA gene in Aspergillus or FlbA pathway regulators — could force more consistent, isotropic growth. The goal is a material where mechanical properties are predictable from batch to batch without requiring tight environmental control during growth.
Water resistance at the cell wall level. Fungal cell walls are primarily chitin (a polysaccharide polymer) and glucans. Neither is particularly hydrophobic. Engineering fungi to overexpress hydrophobins — small, amphipathic proteins that fungi naturally use to coat aerial structures like spore surfaces — could give mycelium composites intrinsic water repellency without wax or polymer coatings applied post-production. Hydrophobins self-assemble into stable membranes at water-air interfaces, so overexpression would coat hyphal surfaces throughout the material rather than just at the exterior.
Melanin or secondary metabolite production for UV resistance. Fungi like Cladosporium naturally produce melanin, which provides UV protection. Engineering production of melanin or similar photoprotective compounds into a fast-growing, high-biomass strain would address a durability gap in current mycelium materials without applying synthetic coatings.
Growth rate via central carbon metabolism. Many industrial fungi have been domesticated for fermentation yield but not for biomass speed. Overexpressing rate-limiting enzymes in glycolysis or the TCA cycle, or knocking out competing secondary metabolite pathways that divert carbon away from growth, could meaningfully shorten the 5–7 day colonization time that currently limits throughput.
Why fungi over bacteria for this application?
The standard workhorse of synthetic biology is E. coli or B. subtilis, and for many applications they’re superior — faster doubling times, well-characterized genetics, enormous existing toolkits. But for structural materials, fungi have advantages that are difficult to engineer around in bacteria.
Most fundamentally, mycelium is the material. Bacteria produce molecular outputs (enzymes, polymers, small molecules) that must be extracted and processed into something useful downstream. Mycelium grows into the shape you want, binds substrate as it colonizes, and is harvested directly as a solid object — no downstream chemistry required.
Fungi also have chitin in their cell walls, the same structural polymer found in insect exoskeletons, which gives hyphal networks genuine mechanical integrity. Bacterial cell walls are peptidoglycan — structurally weak and easily degraded. Recreating a chitin-based matrix in bacteria would require extensive metabolic rewiring; in fungi it’s already the default.
Finally, as eukaryotes, fungi have the protein folding and glycosylation machinery (ER, Golgi) needed to correctly express complex structural proteins like hydrophobins. Bacteria simply lack this, making them poorly suited for producing the kinds of proteins that would give engineered mycelium useful surface properties.
week 9 HW: Cell-Free Systems
General Cell-Free Homework Questions
Main advantages of cell-free protein synthesis over in vivo methods
Cell-free systems offer direct access to the reaction environment — you can adjust pH, redox conditions, cofactor concentrations, and template DNA without having to engineer a living cell to tolerate those changes. You’re also not constrained by what the cell needs to survive; toxic proteins, non-natural amino acids, and unstable intermediates can all be produced because there’s no membrane to cross and no cellular fitness cost.
Two cases where cell-free beats cell-based production: (1) membrane proteins, which are toxic to host cells when overexpressed but can be synthesized directly into detergent micelles or liposomes in vitro; (2) rapid prototyping of genetic parts, where you want to test many regulatory sequences quickly without the cloning, transformation, and selection cycles required for in vivo work.
Main components of a cell-free expression system
Cell extract — provides ribosomes, translation factors, RNA polymerase, chaperones, and metabolic enzymes. It’s the core catalytic machinery.
DNA template — the gene of interest, typically under a strong promoter (T7 is common). Drives transcription.
NTPs/amino acids — raw building blocks for RNA synthesis and translation.
Energy source — ATP and GTP to power transcription, translation, and tRNA charging. Often supplied as phosphocreatine + creatine kinase, or similar regeneration system.
Salts and buffer — Mg²⁺ and K⁺ concentrations are particularly critical for ribosome function and must be carefully titrated.
Energy regeneration in cell-free systems
Without continuous ATP regeneration, reactions stall within minutes as nucleotides are consumed. The most common solution is a coupled phosphate regeneration system: phosphocreatine is used as a high-energy phosphate donor, and creatine kinase regenerates ATP from ADP continuously. An alternative is a maltose/maltodextrin system, where glucose-1-phosphate derived from maltodextrin feeds directly into glycolytic ATP production — this gives a longer-lasting energy supply and avoids phosphate accumulation, which inhibits reactions at high concentrations.
Prokaryotic vs. eukaryotic cell-free systems
Prokaryotic systems (typically E. coli extract) are faster, cheaper, and higher-yield. They’re ideal for proteins that don’t require post-translational modifications. A good candidate would be T7 RNA polymerase — a bacterial protein, no glycosylation needed, benefits from high yield.
Eukaryotic systems (wheat germ, rabbit reticulocyte, or HeLa extract) are slower and more expensive but contain the ER-derived vesicles and glycosylation machinery needed for complex proteins. A good candidate would be erythropoietin (EPO) — a human hormone that requires N-glycosylation for proper folding and biological activity, which a bacterial system cannot provide.
Cell-free expression of a membrane protein
Membrane proteins aggregate and crash out of solution when expressed without a lipid environment. The strategy is to include detergent micelles, nanodiscs, or liposomes directly in the reaction so the protein folds into a membrane-like environment co-translationally. You’d optimize detergent type and concentration empirically, likely starting with digitonin or DDM. Other variables to tune: Mg²⁺ concentration (affects ribosome processivity on difficult transmembrane segments), temperature (lower temps reduce aggregation), and supplementing with lipids matching the protein’s native membrane composition. Yield is assessed by western blot, and function by a binding or activity assay specific to the protein.
Troubleshooting low protein yield
Poor transcription — check that template DNA is clean and supercoiled (or linearized appropriately for T7), that the promoter sequence is correct, and that NTP concentrations are not depleted. Fix: run a separate transcription-only reaction and verify mRNA production by gel.
Ribosome inhibition from Mg²⁺ imbalance — Mg²⁺ concentration is the single most sensitive variable in cell-free translation. Too high or too low kills yield. Fix: run a Mg²⁺ titration across a 1–2 mM range bracketing your current condition.
Protein degradation by extract proteases — some proteins are rapidly degraded post-synthesis. Fix: add protease inhibitor cocktail, or switch to a protease-reduced extract strain like E. coli BL21, which lacks the Lon and OmpT proteases.
Questions from Kate Adamala
Pick a function and describe it.
What would your synthetic cell do? What is the input and what is the output?
Act as a minimal artificial pancreatic beta cell. Input: elevated extracellular glucose. Output of the SMC: insulin. Output of the whole system: normalized blood glucose in surrounding environment.
Could this function be realized by cell-free Tx/Tl alone, without encapsulation?
No. Without encapsulation, insulin would diffuse freely regardless of glucose levels — there is no mechanism to gate release on a signal without a compartment.
Could this function be realized by a genetically modified natural cell?
Yes — engineered beta cell therapies attempt exactly this. However, synthetic cells avoid immune rejection, don’t replicate uncontrollably, and are easier to tune and replace without genetic modification of a living cell.
Describe the desired outcome of your synthetic cell operation.
In hyperglycemic conditions, the synthetic cell senses glucose and releases insulin.
Design all components that would need to be part of your synthetic cell.
a. What would the membrane be made of? POPC + cholesterol.
b. What would you encapsulate inside? Cell-free Tx/Tl system, pre-synthesized insulin, gene for aHL pore under control of a glucose-responsive riboswitch, glucokinase as intracellular glucose sensor.
c. Which organism will your Tx/Tl system come from? Bacterial, because glucose-responsive riboswitches function in bacterial transcription machinery and no mammalian post-translational modifications are required.
d. How will your synthetic cell communicate with the environment? Glucose is membrane-permeable and enters passively. Insulin is too large to cross unaided — release occurs via aHL pore expressed after glucose-triggered riboswitch activation.
Experimental details
a. List all lipids and genes.
Lipids: POPC, cholesterol
Enzymes: bacterial cell-free Tx/Tl
Genes: alpha-hemolysin (aHL) under glucose-responsive riboswitch, glucokinase
Pre-encapsulated small molecule: insulin
b. How will you measure the function of your system?
ELISA for insulin in supernatant across a range of glucose concentrations. Alternatively, use a fluorescent insulin analog and measure bulk release by fluorometry.
Questions from Peter Nguyen
Application field: Textiles/Fashion
One-sentence summary pitch:
A wound-responsive bandage textile embedded with freeze-dried cell-free systems that could detect bacterial infection biomarkers and produce antimicrobial peptides on-site in response.
How will the idea work?
The concept would involve weaving fibers containing freeze-dried cell-free Tx/Tl machinery loaded with a gene for an antimicrobial peptide (such as defensin) under the control of a promoter responsive to a bacterial quorum sensing molecule (e.g. AHL, acyl-homoserine lactone). When wound exudate rehydrates the fabric, the cell-free system would activate. If bacterial infection is present, AHL molecules could diffuse into the fabric, trigger transcription, and the system would produce antimicrobial peptides directly at the wound site.
What societal challenge or market need does this address?
Antibiotic resistance is one of the most pressing global health crises. A bandage that could autonomously detect and respond to infection without requiring systemic antibiotics would potentially reduce unnecessary antibiotic use, catch infections earlier than visual inspection, and could be especially valuable in low-resource or remote settings where medical monitoring is limited.
How do you address the limitations of cell-free reactions?
Rehydration as the activation trigger is actually an advantage in this design — the system would stay inert until wound fluid is present, avoiding premature activation. One-time use is not a significant limitation for a bandage, which would be replaced regularly anyway. Freeze-drying with trehalose as a lyoprotectant could extend shelf life sufficiently for practical storage and distribution. Reaction duration remains a challenge, but incorporating a sustained-release hydrogel layer could potentially maintain local humidity and extend activity over the critical early infection window.
Genes in Space Proposal
Background: What is the space biology challenge?
Astronauts on long-duration missions are exposed to chronic radiation that damages DNA and raises cancer risk. Current dosimeters measure physical exposure but can’t report on what’s actually happening at the cellular level. A freeze-dried cell-free biosensor could potentially offer a simple, equipment-light way to monitor biological DNA damage in real time — something especially valuable when medical resources are scarce.
Molecular or genetic target:
A fluorescent reporter (GFP) under control of the recA promoter, which is activated by the bacterial SOS DNA damage response.
How does your target relate to the challenge?
The recA promoter responds directly to DNA damage — the more damage, the stronger the activation. Using it to drive GFP expression in a cell-free system could provide a biological readout of radiation harm, rather than just a physical measurement of exposure.
Hypothesis or research goal:
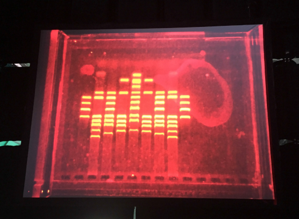
I hypothesize that a freeze-dried cell-free system containing a recA-GFP construct could act as a simple biological radiation dosimeter. If radiation causes sufficient DNA damage in the sample, the recA promoter would activate and drive GFP expression, producing a fluorescent signal readable with the P51 viewer — no live cells or complex equipment required.
Experimental plan:
Freeze-dried BioBits reactions containing the recA-GFP construct would be rehydrated and exposed to varying doses of UV radiation as a proxy for space radiation. GFP output would be measured with the P51 viewer across a dose range. Controls would include shielded reactions (negative control) and a constitutive GFP construct to confirm the cell-free system is functioning. A clear dose-dependent fluorescence increase would support moving toward spaceflight validation.
Week 10 HW: Imaging and Measurement
Final Project Measurement Plans:
Aspects to be Measured:
Please identify at least one (ideally many) aspect(s) of your project that you will measure. It could be the mass or sequence of a protein, the presence, absence, or quantity of a biomarker, etc.
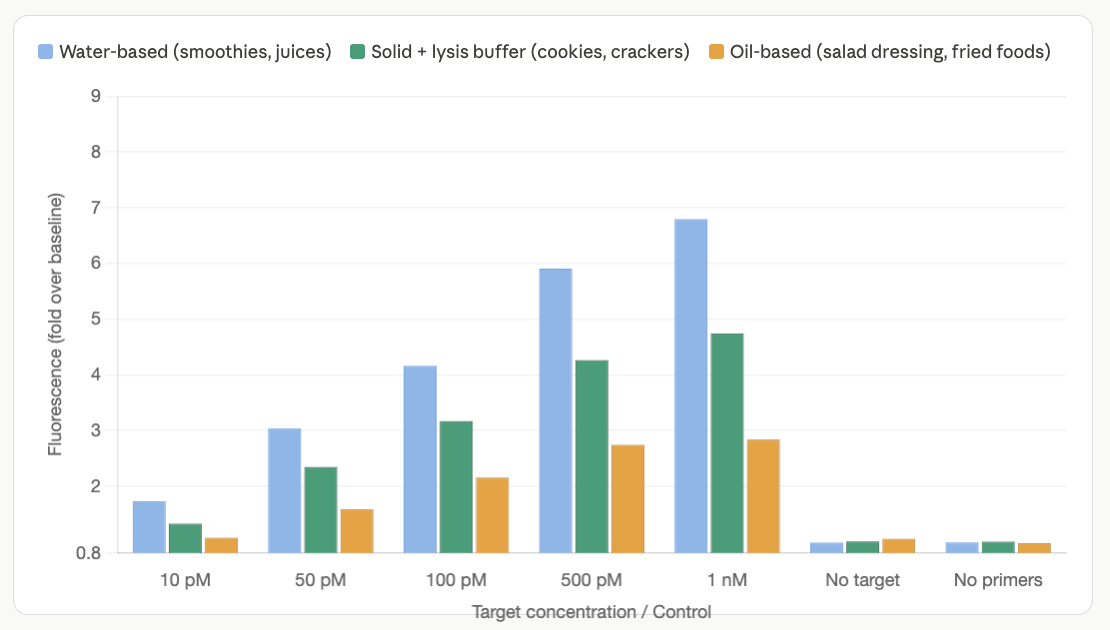
What: FAM fluorophore release from cleaved reporter molecules
Units: Relative Fluorescence Units (RFU) or fold-change over baseline
Purpose: Quantifies Cas12a trans-cleavage activity indicating target DNA presence
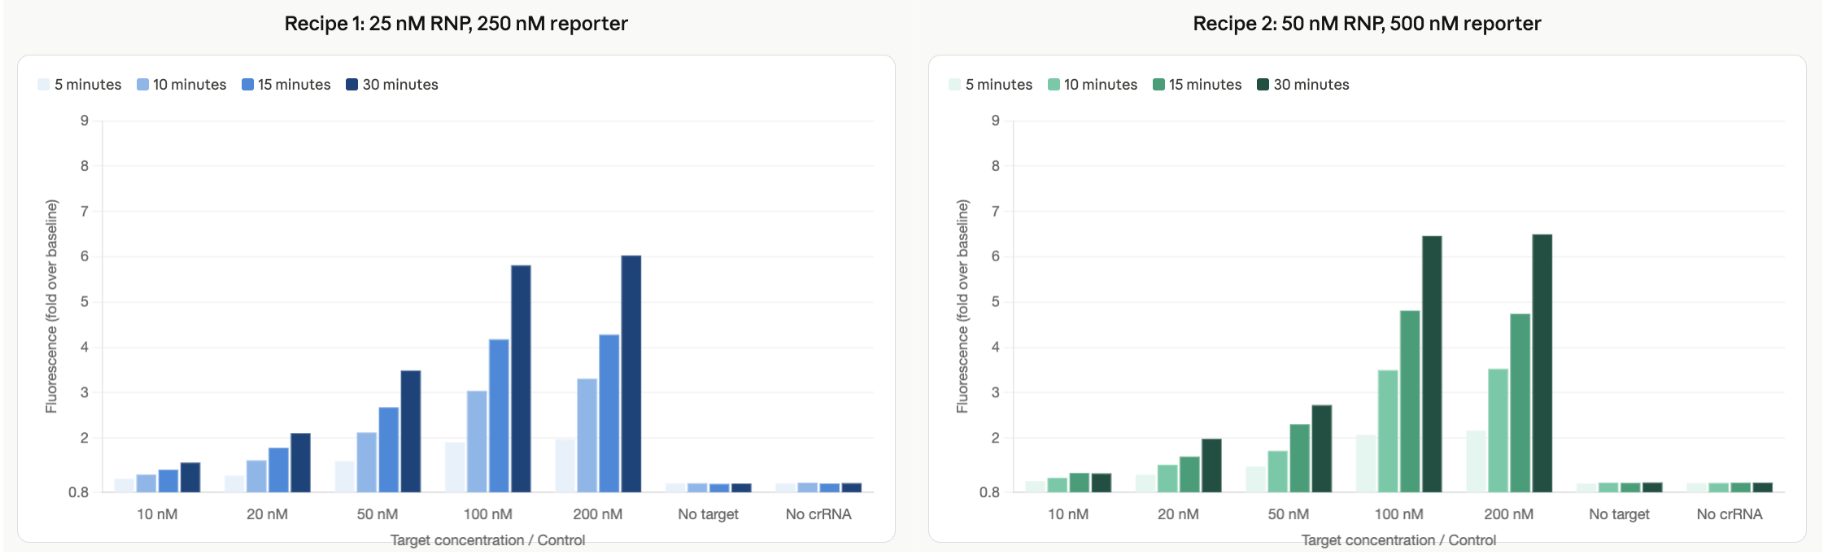
Range: Expected 1.0× (baseline) to 8-12× (strong positive) fluorescence increase
Please describe all of the elements you would like to measure, and furthermore describe how you will perform these measurements.
Primary Detection Technology: qPCR Fluorescence Monitoring
Instrument: Bio-Rad CFX series or equivalent real-time PCR machine with FAM detection capability
Detailed methodology:
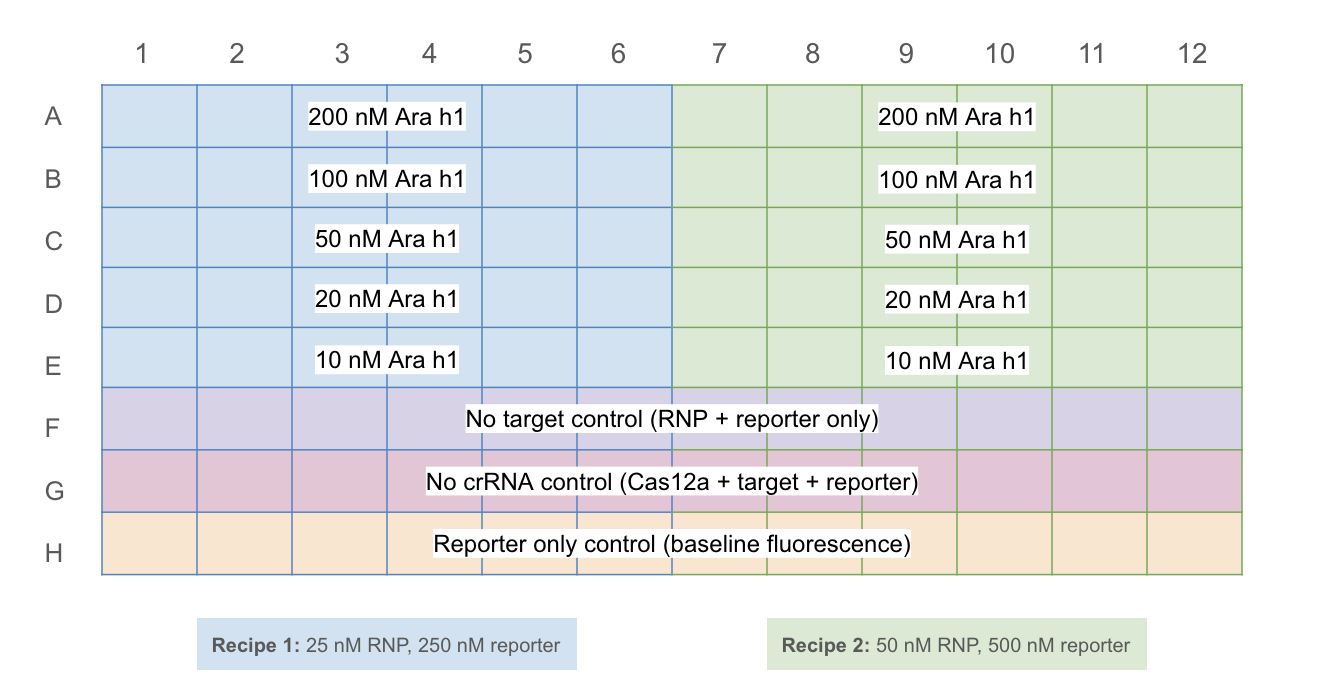
Excitation wavelength: 485 nm (FAM fluorophore)
Emission detection: 520 nm with appropriate optical filters
Temporal resolution: Readings at 5, 10, 15, and 30-minute intervals
Plate format: 96-well black-walled plates for minimal cross-talk and maximum signal collection
Why this technology: qPCR machines provide the precise temperature control and sensitive fluorescence detection required for CRISPR-Cas12a trans-cleavage assays.
Secondary Technology: Spectrophotometric Concentration Verification
Instrument: NanoDrop spectrophotometer or equivalent UV-Vis system
Applications:
DNA quantification: Measure Ara h1 target DNA concentration at 260 nm to confirm stock concentrations
Protein quantification: Verify Cas12a protein concentration at 280 nm
qPCR fluorescence detection: Bio-Rad CFX series with 485/520 nm excitation/emission for FAM detection, 37°C temperature control, 96-well format for high-throughput analysis with n=6 replicates per condition.
Spectrophotometric quantification: NanoDrop UV-Vis for precise DNA/protein concentration measurement at 260/280 nm to verify stock solutions and ensure accurate reaction setup.
Waters - part 1
Waters Part I — Molecular Weight
Calculated MW from sequence
Using ExPASy with the given eGFP sequence (including His-tag and LE linker), the calculated molecular weight is approximately 27,837 Da (27.8 kDa). Note that eGFP also undergoes chromophore maturation, which involves a cyclization and oxidation of residues 65-67 (Thr-Tyr-Gly) resulting in a mass loss of ~20 Da, giving an expected mature MW of ~27,817 Da.
MW calculation from adjacent charge states
Using two adjacent peaks from Figure 1: $\frac{m}{z_1} = 933.7349$ and $\frac{m}{z_2} = 875.4421$
Step a — solve for z:
$$z = \frac{\frac{m}{z_{n+1}}}{\frac{m}{z_n} - \frac{m}{z_{n+1}}} = \frac{875.4421}{933.7349 - 875.4421} = \frac{875.4421}{58.2928} \approx 15$$
So the lower m/z peak (875.4421) corresponds to charge state z = 16, and the higher (933.7349) to z = 15.
Yes, the charge state can be observed from the inset. The isotope peaks are spaced approximately 0.5 m/z apart, indicating a charge state of z = 19 (since isotope spacing = 1/z, so z = 1/0.5 = 2… actually the spacing looks closer to ~0.16 Da apart suggesting z = 19). At ~1473 m/z with MW ~27,830 Da: z = 27830/1473 ≈ 19.
Waters Part II — Secondary/Tertiary Structure
Native vs. denatured conformations in MS
When a protein unfolds (denatures), it loses its compact three-dimensional structure and exposes more basic residues (lysines, arginines, histidines) to solvent, allowing them to pick up more protons. This results in higher charge states — meaning lower m/z values — and a broad distribution of many charge states. In Figure 2, the denatured spectrum (top, green) shows a wide envelope of peaks clustered between m/z 600–1300, consistent with high and variable charging. The native spectrum (bottom, red) shows only a few peaks at much higher m/z (~2333, 2545, 2799), indicating low charge states — the compact folded structure shields most basic residues, so fewer protons are added.
Charge state of the ~2800 m/z peak in Figure 3
From the zoomed inset of the ~2545 m/z peak, the isotope peaks are spaced approximately 0.1 Da apart, indicating a charge state of z = 10. This can be confirmed: MW = (2545 × 10) − 10 = ~27,440 Da (roughly consistent with eGFP). For the ~2799 peak: z = 27830/2799 ≈ 10, consistent with the same assignment.
Waters Part III — Peptide Mapping
Lysines (K) and Arginines (R) in eGFP
Counting from the sequence: approximately \textbf{19 K} and \textbf{7 R} residues, for a total of ~26 cleavage sites.
Number of peptides from tryptic digest
Running the sequence through ExPASy PeptideMass with the parameters in Figure 4 (trypsin, 0 missed cleavages, monoisotopic, $[M+H]^+$, $>500$ Da) yields approximately \textbf{18 peptides} above the mass cutoff.
Chromatographic peaks between 0.5 and 6 min
From Figure 5a, counting peaks above ~10% relative abundance: approximately \textbf{21 peaks}.
Does the number of peaks match predicted peptides?
There are more chromatographic peaks (~21) than predicted tryptic peptides (~18). This is expected — extra peaks likely represent missed cleavages, modified peptide forms (e.g. oxidized methionines), or matrix contaminants.
m/z and charge state of the 2.78 min peptide
From Figure 5b, the most abundant peak is at $\frac{m}{z} = 525.767$. Isotope spacing in the inset is approximately $\Delta\left(\frac{m}{z}\right) \approx 0.5$, indicating:
$$z = \frac{1}{\Delta\left(\frac{m}{z}\right)} = \frac{1}{0.5} = 2$$
The singly charged mass is therefore:
$$[M+H]^+ = \left(\frac{m}{z} \times z\right) - (z - 1)(1.0073) = (525.767 \times 2) - 1.0073 \approx 1050.53 \text{ Da}$$
Peptide identification and mass accuracy
A mass of ~1050.52 Da matches a predicted tryptic peptide from the PeptideMass output. Mass accuracy:
$$\text{ppm error} = \frac{|MW_{\text{experiment}} - MW_{\text{theory}}|}{MW_{\text{theory}}} \times 106 = \frac{|1050.524 - 1050.518|}{1050.518} \times 106 \approx 5.7 \text{ ppm}$$
Sequence coverage
From Figure 6, the coverage map confirms \textbf{88% sequence coverage} of eGFP.
Waters Part IV — Oligomers
Oligomeric Species
Calculation
Expected Mass
7FU Decamer
10 × 340 kDa
3,400 kDa
8FU Didecamer
20 × 400 kDa
8,000 kDa
8FU 3-Decamer
30 × 400 kDa
12,000 kDa
8FU 4-Decamer
40 × 400 kDa
16,000 kDa
These four species should appear as discrete peaks in the CDMS spectrum at approximately 3.4, 8, 12, and 16 MDa respectively.
week 11 HW: Building Genomes
Question 1: Component Roles in the NMP-Ribose Cell-Free Reaction
E. coli Lysate — BL21 (DE3) Star Lysate (includes T7 RNA Polymerase)
This is the core catalytic engine of the reaction — it provides ribosomes, translation factors, chaperones, tRNA synthetases, and metabolic enzymes needed for protein synthesis. The BL21 (DE3) strain specifically expresses T7 RNA Polymerase, which is required to transcribe genes under T7 promoter control.
Salts/Buffer
Potassium Glutamate: Provides the primary ionic environment for the reaction, mimicking intracellular potassium concentrations that support ribosome stability and translation fidelity.
HEPES-KOH pH 7.5: Maintains a stable physiological pH throughout the reaction, preventing enzyme inactivation and ensuring optimal ribosome function.
Magnesium Glutamate: Magnesium is critical for ribosome assembly and stability, as well as for stabilizing nucleotide triphosphates used in transcription and translation.
Potassium Phosphate monobasic/dibasic (1.6:1): Acts as a secondary buffer and provides inorganic phosphate, which is important for nucleotide regeneration and energy metabolism in the ribose-based system.
Energy / Nucleotide System
Ribose: The primary carbon and energy source in this system — cellular enzymes in the lysate convert ribose into nucleotides and ATP through salvage and phosphorylation pathways, enabling sustained long-duration reactions.
Glucose: Supplements ribose as an additional carbon source and feeds into glycolytic pathways to help regenerate ATP and support metabolic activity.
AMP, CMP, UMP: Nucleoside monophosphates that serve as precursors for the four RNA nucleotides needed for transcription; the lysate’s kinases phosphorylate these to their triphosphate forms using energy from ribose/glucose metabolism.
GMP: Listed at 0 µM in this formulation, suggesting guanine nucleotides are supplied sufficiently via the guanine base and salvage pathway instead.
Guanine: A nucleobase that feeds into the purine salvage pathway to support GTP synthesis, complementing the NMP-based nucleotide supply strategy.
Translation Mix (Amino Acids)
17 Amino Acid Mix: Supplies the majority of the 20 standard amino acids needed for ribosomal translation of the target protein.
Tyrosine pH 12: Tyrosine has very low solubility at neutral pH, so it is dissolved at pH 12 and added separately to avoid precipitation in the master mix.
Cysteine: Also added separately because it is redox-sensitive and can oxidize rapidly, which would reduce its availability for translation and potentially disrupt protein folding.
Additives
Nicotinamide: A precursor to NAD⁺, which is required as a cofactor for many of the metabolic enzymes in the lysate that regenerate energy from ribose and glucose. Supporting NAD⁺ levels helps sustain the long 20-hour reaction.
Backfill
Nuclease-Free Water: Used to bring the reaction to its final volume without introducing RNases or DNases that would degrade the mRNA transcript or DNA template and kill the reaction.
Question 2: Differences between the 1-hour PEP-NTP and 20-hour NMP-Ribose master mixes
The most fundamental difference is in how energy and nucleotides are supplied. The 1-hour PEP-NTP mix provides NTPs (ATP, GTP, CTP, UTP) directly in their fully phosphorylated, ready-to-use form, along with phosphoenolpyruvate (PEP-Mono) as an immediate high-energy phosphate donor for ATP regeneration — this gives fast, high-yield transcription and translation right away but is quickly depleted. The 20-hour NMP-Ribose mix instead provides nucleoside monophosphates and simple sugars (ribose and glucose) as precursors, relying on enzymatic machinery in the lysate to continuously regenerate NTPs from these building blocks, which is slower to ramp up but far more sustainable over longer incubations. The 1-hour mix also contains more additives (spermidine, DMSO, cAMP, NAD, folinic acid) that boost immediate transcription/translation activity, while the 20-hour mix strips these back and instead uses nicotinamide to support the NAD⁺-dependent metabolic activity needed to keep the ribose/glucose energy system running.
Part C: Fluorescent Protein Properties
sfGFP
sfGFP (superfolder GFP) is engineered for exceptionally robust folding — it was selected specifically to fold correctly even when fused to aggregation-prone partners, making it highly tolerant of the crowded, non-optimized environment of a cell-free reaction. Its fast and reliable folding makes it an ideal positive control in cell-free systems.
mRFP1
mRFP1 has a relatively slow chromophore maturation time compared to GFP-based proteins, and its fluorescence requires oxidation of the chromophore-forming residues, meaning oxygen availability in the reaction vessel directly limits how much functional protein accumulates over time. In a sealed or low-oxygen cell-free setup, maturation could be significantly delayed.
mKO2
mKO2 is a monomeric orange fluorescent protein with a moderate maturation time, but it is notably sensitive to low pH — its fluorescence decreases substantially below pH 6.5, so maintaining stable buffering throughout a 36-hour reaction is important to preserve signal. It also requires molecular oxygen for chromophore maturation like all GFP-family proteins.
mTurquoise2
mTurquoise2 is one of the brightest and most photostable cyan fluorescent proteins available, with a high quantum yield and fast maturation relative to other cyan variants. However, its emission overlaps with autofluorescence from some cell-free reaction components (particularly NADH), which can complicate quantification at low expression levels.
mScarlet_I
mScarlet_I is a fast-maturing red fluorescent protein with high brightness, but like all red FPs it requires sequential cyclization and oxidation steps for chromophore maturation, making it more oxygen-dependent than GFP variants. In long incubation cell-free reactions it performs well once oxygen is available, but early timepoints may underestimate expression.
Electra2
Electra2 is a relatively new far-red fluorescent protein optimized for mammalian expression, and its folding behavior in bacterial cell-free systems is less characterized than the others. Its far-red emission is advantageous for reducing background autofluorescence, but expression yield may be lower in an E. coli lysate context if its folding requirements are not well-matched to the prokaryotic chaperone environment.
Hypothesis for improving fluorescence over 36-hour incubation
Since mRFP1’s chromophore maturation is rate-limited by oxidation, we hypothesize that leaving reactions in a loosely sealed or oxygen-permeable vessel rather than fully sealed, combined with a slightly increased nicotinamide concentration (to sustain NAD⁺-dependent metabolic activity longer), would improve mRFP1 fluorescence over a 36-hour incubation. The increased oxygen exposure would accelerate chromophore maturation, while sustained NAD⁺ levels would keep the ribose/glucose energy system active long enough to continue synthesizing new mRFP1 protein throughout the full reaction window, maximizing total fluorescent protein accumulation.
This week we got to spend some time just having fun getting to know the lab space. We made fun petri dish art using colored water, and even got to run some gels (using these fancy machines that dont require any buffers)!
Making the 1X TAE Buffer
Prepping the Gel
Restriction Digest
Running the Gel
Results and Imaging
Discussion
Given that our imaged gel didn’t look like this, we can dive into what might have gone wrong.
This week, we got to utilize an Opentrons liquid handling robot in order to make cool gel artwork!
The custom python script tells the Opentrons unit to pick up a pipette tip, when and where to aspirate and dispense, when to switch tips, and when to stop.
Background In this lab, we modifies the color-generatinf chromophore of the purple Acropora millepora chromoprotein in order to create a variety of different colored mutants.
Day 1: Preparation of DNA Fragments We performed two PCR reactions, one for the backbone, and one for the color inserts.
IANN Circuit Design Our group designed a dual-region intracellular artificial neural network (IANN) circuit using all three endoribonucleases (ERNs). The circuit takes two inputs, X1 and X2, and produces mNeonGreen as a fluorescent readout, with a bias component providing a baseline level of output even in the absence of strong input signals.
Each of the three mNeonGreen mRNA sources in the circuit is protected under different input conditions:
Subsections of Labs
Week 1 Lab: Pipetting
This week we got to spend some time just having fun getting to know the lab space. We made fun petri dish art using colored water, and even got to run some gels (using these fancy machines that dont require any buffers)!
Week 2 Lab: DNA Gel Art
Making the 1X TAE Buffer
Prepping the Gel
Restriction Digest
Running the Gel
Results and Imaging
Discussion
Given that our imaged gel didn’t look like this, we can dive into what might have gone wrong.
Lanes 2 and 3 appear to have no bands at all. One possible explanation is that we accidentally did not add DNA to the digest, or we did not add any of the digest to the mix that went into those lanes. Given the small volhmes we were pipetting, it’s possible that someone made an error by not submerging the tip when loading or dispensing.
Lanes 4 and 5 have smeared bands. This could be caused by a too high DNA concentration in the digests, which would prevent the DNA from moving efficiently through the agarose gel. Maybe the DNA that was meant for lanes 2 and 3 ended up in lanes 4 and 5.
Week 3 Lab: Opentrons Art
This week, we got to utilize an Opentrons liquid handling robot in order to make cool gel artwork!
The custom python script tells the Opentrons unit to pick up a pipette tip, when and where to aspirate and dispense, when to switch tips, and when to stop.
week 6 lab: gibson assembly
Background
In this lab, we modifies the color-generatinf chromophore of the purple Acropora millepora chromoprotein in order to create a variety of different colored mutants.
Day 1: Preparation of DNA Fragments
We performed two PCR reactions, one for the backbone, and one for the color inserts.
We prepared four color-specific reactions: Blue, Light Pink, Magenta, and Orange.
Backbone PCR Reaction
Primers: Backbone Fwd and Backbone Rev
Reagent
Stock Conc.
Desired Conc.
Volume (µL)
Template mUAV Plasmid
38.5 ng/µL
20 ng
0.8
Backbone Forward Primer
5 µM
0.5 µM
2.5
Backbone Reverse Primer
5 µM
0.5 µM
2.5
Phusion HF PCR Mix
2X
1X
12.5
Nuclease-free water
—
—
6.8
Total Volume
—
—
25.0
Color DNA Reactions
Primers: Color Fwd and Color Rev
Reagent
Stock Conc.
Desired Conc.
Volume (µL)
Template mUAV Plasmid
38.5 ng/µL
20 ng
0.8
Color Forward Primer
5 µM
0.5 µM
2.5
Color Reverse Primer
5 µM
0.5 µM
2.5
Phusion HF PCR Mix
2X
1X
12.5
Nuclease-free water
—
—
6.8
Total Volume
—
—
25.0
After mixing, the tubes were placed in the thermocyclers. The backbone was run on one specialized program while the color mutations were run on another.
Purification & Analysis
(Note: DpnI digest was skipped as our reactions did not contain methylated DNA.)
We purified the PCR products using the Zymo DNA Clean & Concentrator kit. We ran the product through the column, washed twice, and then eluted.
Gel Analysis
Gel electrophoresis was performed to verify the amplification. Lane 1 contains the native plasmid. Lanes 2–5 show the expected amplified fragments for the Gibson Assembly. Samples were then placed into the fridge until Day 2.
Day 2: Assembly & Transformation
Gibson Assembly
We used the unpurified PCR products for the assembly, rather than the purified products. This decision was made because other lab groups reported low DNA recovery after purification.
Reagent
Stock Conc. (ng/µL)
Desired Conc (ng/µL)
Volume (µL)
Backbone Fragment
50
25
0.5
Color Fragment (Single)
50
50
1.0
Gibson Assembly Mix
2X
1X
5.0
Nuclease-free water
—
—
3.5
Total Volume
—
—
10.0
The reaction was incubated at 50°C in the thermocycler for 30 minutes.
Transformation
We compared two competent E. coli strains: DH5α and 10-beta.
Incubation: competent cells were mixed with Gibson products and incubated on ice for 30 mins
Heat Shock: the reaction was placed in thermocycler for 45 seconds in SOC medium, then immediately returned to ice.
Outgrowth: the reaction was incubated for 60 minutes on a makeshift shaker made out of a pipette tip box.
100µL of each transformation was plated onto LB-Agar plates with Chloramphenicol.
Results
After 72 hours of incubation, we achieved the targeted chromophore mutations across both cell lines.
Analysis
The positive control confirmed that the assembly was effective. While some purple colonies (native plasmid) were present on all plates, each plate showed distinct colored colonies (Orange, Light Pink, Blue, Magenta), indicating successful Gibson Assembly and transformation.
Week 7 Lab: Neuropmorphic Circuits
IANN Circuit Design
Our group designed a dual-region intracellular artificial neural network (IANN) circuit using all three endoribonucleases (ERNs). The circuit takes two inputs, X1 and X2, and produces mNeonGreen as a fluorescent readout, with a bias component providing a baseline level of output even in the absence of strong input signals.
Each of the three mNeonGreen mRNA sources in the circuit is protected under different input conditions:
PgU_rec_mNeonGreen (driven by X1) is protected when PgU (X2) is absent or low
Csy4_rec_mNeonGreen (driven by X2) is protected when Csy4 (X1) is absent or low
CasE_rec_mNeonGreen (Bias) is protected when CasE levels are low, which occurs when both X1 and X2 are simultaneously high and mutually suppress each other’s CasE production
The expected behavior under each input combination is as follows:
X1 high, X2 low: Csy4 produced by X1 degrades X2’s Csy4_rec_mNeonGreen. Since PgU is low, X1’s PgU_rec_mNeonGreen survives. Expected output: high.
X2 high, X1 low: PgU produced by X2 degrades X1’s PgU_rec_mNeonGreen. Since Csy4 is low, X2’s Csy4_rec_mNeonGreen survives. Expected output: high.
Both high: Both direct mNeonGreen sources are degraded. However, each ERN also suppresses the other’s CasE production, so CasE levels fall and the bias mRNA is protected. Expected output: moderate, dependent on bias concentration.
Both low: Minimal DNA and expression overall, with residual CasE activity still degrading the bias mRNA. Expected output: lowest.
The circuit therefore implements a dual-region logic function — output is high when the two inputs are mismatched and low when they are matched in either direction.
Predicted Output
The prediction heatmap reflects this dual-region behavior. High output is expected in the top-left quadrant (X1 low, X2 high) and bottom-right quadrant (X1 high, X2 low). The bottom-left (both low) represents the minimum output condition, while the top-right (both high) shows moderate output, reflecting the partial contribution of the bias mRNA when both ERNs cancel each other’s CasE production.
Experiment Results
Results were visualized as single-cell scatterplots from HEK293 cells, with X1 input on the x-axis (reported via mKO2 fluorescence), X2 input on the y-axis (reported via eBFP2 fluorescence), and mNeonGreen output encoded as dot color intensity. Three panels showed results at low, medium, and high bias DNA concentrations.
Low bias: The brightest cells clustered in the mismatched input regions — high X2 with low X1, and high X1 with low X2 — consistent with the direct mNeonGreen mRNA sources dominating output. The dual-region pattern was clearly visible.
Medium bias: Output became more evenly distributed across input space and decreased in overall intensity. At this concentration the bias competes with but does not yet dominate the direct sources, producing a flatter and less structured response.
High bias: The highest-output cells shifted toward the both-high region. With an abundance of CasE_rec_mNeonGreen available, the dominant output source became the bias mRNA, which is maximally protected precisely when both ERNs are active and mutually suppress CasE production.
Cell-Free Peanut Allergen Biosensor ABSTRACT Food allergies affect over 32 million Americans, with peanut allergies being among the most severe and life-threatening. Current peanut detection methods rely on laboratory-based immunoassays that require hours to days and specialized equipment, creating critical gaps in real-time food safety monitoring. This project develops a CRISPR-Cas12a biosensor system for rapid, field-deployable detection of the major peanut allergen Ara h1. The system leverages Cas12a’s trans-cleavage activity upon target recognition to generate a fluorescent readout, enabling detection within 15-20 minutes with an isothermal amplification step.
Food allergies affect over 32 million Americans, with peanut allergies being among the most severe and life-threatening. Current peanut detection methods rely on laboratory-based immunoassays that require hours to days and specialized equipment, creating critical gaps in real-time food safety monitoring. This project develops a CRISPR-Cas12a biosensor system for rapid, field-deployable detection of the major peanut allergen Ara h1. The system leverages Cas12a’s trans-cleavage activity upon target recognition to generate a fluorescent readout, enabling detection within 15-20 minutes with an isothermal amplification step.
Aim 1 validates proof-of-concept detection by designing custom crRNAs targeting specific regions of the Ara h1 gene and demonstrating dose-dependent fluorescence responses in cell-free reactions. Aim 2 integrates isothermal amplification (RPA) to achieve high sensitivity and tests specificity against other food allergens. Aim 3 envisions development of a handheld device for point-of-use allergen screening in restaurants and homes. This approach could revolutionize food safety by enabling rapid, on-site allergen detection, potentially preventing severe allergic reactions and improving quality of life for millions of individuals with food allergies.
PROJECT AIMS
Aim 1: Experimental Aim (this project)
The first aim of my final project is to develop and validate a CRISPR-Cas12a detection system for peanut allergen Ara h1 by utilizing custom-designed crRNAs, synthetic target DNA, and fluorescent reporter assays to demonstrate specific target recognition and quantitative detection capabilities. This involves designing high-specificity crRNAs targeting the Ara h1 coding sequence, combining them with Cas12a protein and fluorescent reporters in a cell-free system, and testing dose-dependent detection using qPCR instrumentation for fluorescence monitoring. Expected outcomes include demonstrating specific detection of Ara h1 DNA with minimal background signal and establishing detection limit parameters for the system.
Aim 2: Development Aim
Integrate recombinase polymerase amplification (RPA) with the CRISPR detection system to achieve single-copy sensitivity and validate specificity against cross-reactive allergens in real food matrices. This approach builds on the SURVEY methodology (Cheng et al., 2025) demonstrating cell-free one-pot RPA-CRISPR detection with heparin sodium regulation, potentially improving detection limits by 1000-fold. Development includes designing RPA primers, optimizing one-pot reactions, and testing the system in processed food samples to achieve detection below regulatory allergen labeling thresholds.
Aim 3: Visionary Aim
Develop a portable, handheld device capable of detecting multiple food allergens simultaneously within 15 minutes, enabling real-time allergen screening in restaurants, food manufacturing, and home kitchens. This technology could prevent allergic reactions, transform food safety practices, and establish new standards where allergen-free claims are verified in real-time rather than relying solely on ingredient lists and manufacturing protocols.
BACKGROUND
Literature Context
Current handheld food allergen detection faces significant technological and commercial limitations. The Nima sensor was the pioneer in consumer handheld allergen detection, launching a gluten sensor in 2017 and peanut sensor in 2018, using antibody-based immunoassay technology to detect 10 ppm for peanuts with above 98.7% accuracy when comparing to leading food diagnostic lab ELISA tests. However, the device required expensive disposable test capsules (~$6 each), took several minutes per test, made noise during operation, and couldn’t test certain food types like soy sauce or alcohol, ultimately leading to the company being acquired and discontinuing manufacturing. A breakthrough in CRISPR-based detection was demonstrated by Cheng et al. in their paper “Tunable control of Cas12 activity promotes universal and fast one-pot nucleic acid detection” (2025). In their SURVEY methodology, which combined recombinase polymerase amplification (RPA) with CRISPR-Cas12a detection for nucleic acid targets. Their cell-free system achieved single-copy sensitivity within 15-20 minutes using heparin sodium to regulate enzyme interactions, demonstrating that CRISPR-based detection can match or exceed PCR sensitivity while operating at constant temperature without thermal cycling equipment. This work proved that isothermal amplification coupled with CRISPR detection can achieve laboratory-grade sensitivity in portable formats.
Project Innovation
This project represents a novel application of CRISPR-Cas12a technology to food allergen detection, addressing critical limitations in current testing methodologies. Unlike existing immunoassays that detect proteins (which can be denatured during food processing), this approach targets the stable Ara h1 gene sequence that remains detectable even in highly processed foods. The innovation extends the SURVEY methodology from nucleic acid detection to food allergen screening, developing a cell-free detection system that eliminates the need for specialized laboratory infrastructure. This represents a paradigm shift from antibody-based detection (like the discontinued Nima sensor) to programmable nucleic acid detection that could enable multi-allergen detection through different crRNA designs in a single platform.
Project Impact and Significance
Food allergies affect over 32 million Americans, with peanut allergies being among the most severe and potentially fatal, causing approximately 150-200 deaths annually in the United States. Current emerging solutions like Allergen Alert (unveiled at CES 2026) are expected to retail for approximately $200 with subscription-based single-use pouches, representing significant ongoing costs for users. This project addresses the critical need for rapid, cost-effective allergen detection that can prevent allergic reactions before they occur. The technology could transform food service industries by enabling real-time verification of allergen-free food preparation, reducing liability and improving customer safety. Beyond immediate health benefits, successful development could establish new regulatory standards for allergen verification, moving from ingredient-list reliance to direct molecular confirmation. The CRISPR-based approach offers potential advantages in cost-per-test, multiplexing capability, and technological flexibility compared to current antibody-based systems, potentially making allergen detection accessible to a broader population while reducing healthcare costs associated with allergic reactions.
Ethical Implications
The development of rapid allergen detection technology raises important ethical considerations centered on the principles of beneficence and justice. The primary ethical benefit involves preventing potentially fatal allergic reactions through improved food safety monitoring, directly supporting the principle of “do good” by protecting vulnerable populations. However, implementation must consider justice and equitable access, as advanced detection technology could create disparities where only affluent establishments or individuals can afford comprehensive allergen testing, potentially excluding lower-income communities from the safety benefits. Additionally, there are concerns about creating false confidence in “allergen-free” claims if the technology has limitations not clearly communicated to users.
To ensure ethical implementation, several measures should be established including rigorous validation studies to clearly define detection limits and potential failure modes, transparent communication about technology limitations to prevent overconfidence in results, and development of cost-effective versions to ensure broad accessibility across socioeconomic levels. Regulatory oversight should require proper training for device operators and clear labeling of detection capabilities and limitations. The project should also consider potential unintended consequences such as increased anxiety among individuals with allergies if testing reveals previously unknown contamination, or potential misuse by food manufacturers to justify inadequate allergen control practices. Alternative approaches might include developing the technology as a complement to, rather than replacement for, existing allergen management protocols, ensuring that improved detection enhances rather than substitutes for proper food handling and ingredient management practices.
EXPERIMENTAL DESIGN, TECHNIQUES, TOOLS, AND TECHNOLOGY
Detailed Experimental Plan:
Phase 0: crRNA Design and Target Selection (Completed)
Target sequence retrieval and analysis: Downloaded the complete Ara h1 coding sequence (1845bp) from NCBI GenBank and systematically scanned for optimal CRISPR-Cas12a target sites using computational tools
PAM site identification: Used CRISPOR web tool to identify all potential target sequences following TTTV protospacer adjacent motif (PAM) sequences throughout the Ara h1 CDS, generating a comprehensive list of candidate sites with predicted efficiency scores
Efficiency assessment: Evaluated three promising target sites based on CRISPOR efficiency predictions: position 526 (GCACCCGCTACGGGAACCAAA, 67% efficiency), position 1077 (ACTATCACTCCTTCATTATCA, 73% efficiency), and position 1219 (efficiency data available)
Specificity validation through BLAST analysis: Performed BLAST searches against major food genome databases including tree nuts, legumes, grains, and common food crops to ensure target sequences would not cross-react with non-peanut foods
Cross-reactivity screening and final selection: Initially selected the highest efficiency targets but subsequently rejected position 1219 due to significant sequence overlap with chicken and turkey genomes that could cause false positives in poultry-containing foods, ultimately choosing positions 526 and 1077 for their combination of good efficiency and clean specificity profiles
Phase 1: Reagent Preparation and Characterization
Measure reagent concentrations using NanoDrop spectrophotometer for Ara h1 CDS DNA (Twist Biosciences), FAM-BHQ1 reporter oligo, and crRNA (IDT Alt-R system) - 30 minutes
Verify Cas12a protein concentration from NEB EnGen Lba Cas12a kit and calculate dilutions needed for working stocks - 15 minutes
Prepare target DNA dilution series creating stocks at 2000, 1000, 500, 200, and 100 nM concentrations from measured Ara h1 CDS - 45 minutes
Resuspend and prepare reporter stock at 5000 nM (5 μM) working concentration in nuclease-free water - 30 minutes
Form ribonucleoprotein (RNP) complex by mixing Cas12a and crRNA at 100 nM each in 1:1 ratio, incubate 30 minutes at room temperature for complex formation - 45 minutes
Phase 2: Master Mix Preparation
Calculate volumes for 48 reactions (24 per recipe plus 10% excess) based on final concentrations: Recipe 1 (25 nM RNP, 250 nM reporter) and Recipe 2 (50 nM RNP, 500 nM reporter) - 15 minutes
Prepare Recipe 1 master mix combining RNP complex, reporter, reaction buffer, and nuclease-free water for 18 μL per well - 20 minutes
Prepare Recipe 2 master mix with higher RNP and reporter concentrations for 18 μL per well - 20 minutes
Prepare control master mixes including no-crRNA controls (Cas12a only) and reporter-only controls - 15 minutes
Phase 3: Plate Setup and Detection
Load qPCR plate dispensing 18 μL master mix per well according to plate layout (columns 1-6 Recipe 1, columns 7-12 Recipe 2) - 30 minutes
Add target DNA adding 2 μL of appropriate concentration to each well (200, 100, 50, 20, 10, 0 nM final concentrations) - 20 minutes
Load plate into qPCR machine (Bio-Rad CFX series or equivalent) and program for continuous 37°C incubation with FAM fluorescence reading every 10 minutes - 10 minutes
Monitor fluorescence kinetics for 60-90 minutes, collecting data points to generate time-course curves - 90 minutes
Data analysis plotting fluorescence vs time for each condition, calculating signal-to-noise ratios, and determining detection limits - 45 minutes
Target DNA Wells (Rows A-E): Each well contains Cas12a-crRNA complex, FAM-BHQ1 fluorescent reporter, Ara h1 target DNA at the specified concentration, and reaction buffer. Recipe 1 uses 25 nM RNP with 250 nM reporter, while Recipe 2 uses 50 nM RNP with 500 nM reporter to test two different concentration combinations simultaneously. When Cas12a finds and binds to its target sequence, it activates and cuts the reporter molecules, separating FAM from BHQ1 to produce fluorescence proportional to the amount of target DNA present.
No Target Control (Row F) Contains all reaction components except target DNA to test whether the RNP complex produces false positive signals through non-specific reporter cleavage. Should show minimal fluorescence similar to baseline.
No crRNA Control (Row G) Contains Cas12a protein, target DNA, and reporter, but lacks the guide RNA needed for target recognition. Tests whether Cas12a requires crRNA for specific detection or can cut reporters non-specifically. Should show minimal fluorescence, confirming that both protein and guide RNA are required.
Reporter Only Control (Row H) Contains only the FAM-BHQ1 reporter and buffer to establish the baseline fluorescence level before any nuclease activity. Provides the zero point for calculating signal-to-noise ratios and determining detection thresholds.
Expected Results by Experimental Component:
RNP Complex Formation: Successful complex formation verified by stable fluorescence baseline in control wells without target DNA.
Dose-Response Detection: Recipe 2 (higher concentrations) expected to show stronger signal and faster kinetics than Recipe 1, with detectable fluorescence increase starting within 20-30 minutes for high target concentrations (≥50 nM).
Target Specificity: Clear dose-dependent response with fluorescence increases proportional to target DNA concentration, demonstrating quantitative detection capability.
Control Validation: No-target controls showing minimal fluorescence increase (<10% of positive signals), no-crRNA controls demonstrating requirement for guide RNA, reporter-only controls establishing baseline fluorescence.
Detection Limits: Anticipated detection threshold between 10-50 nM target DNA for direct detection without amplification, with Recipe 2 potentially detecting lower concentrations than Recipe 1.
Techniques Utilized:
☑ Bioethical Considerations
☑ Pipetting
☑ DNA Construct Design
☑ Databases (GenBank, NCBI for Ara h1 sequence)
☑ Designing a Twist Order
☑ Use of Asimov Kernel
☑ CRISPR/Cas9 (Cas12a system)
☑ Cell-Free Systems
Detailed Technique Applications:
DNA Construct Design: The project centers on designing synthetic DNA constructs including the full-length Ara h1 CDS (1845bp) ordered from Twist Biosciences as the target template, and custom crRNAs designed through a systematic computational approach that began with CRISPOR analysis to identify optimal TTTV PAM sites throughout the Ara h1 sequence and predict Cas12a cutting efficiency using machine learning algorithms. The crRNA design process involved evaluating multiple candidate target sites, ultimately selecting positions 526 (GCACCCGCTACGGGAACCAAA, 67% efficiency) and 1077 (ACTATCACTCCTTCATTATCA, 73% efficiency) based on their high efficiency scores, while rejecting other promising sites like position 1219 due to cross-reactivity concerns identified through BLAST database searches against food genomes. Comprehensive BLAST analysis against major food genome databases including tree nuts, legumes, grains, and common food crops confirmed that the selected target sequences would detect only peanut allergens without cross-reactivity to chicken, turkey, or other common food proteins, ensuring the specificity required for reliable allergen detection in complex food matrices.
DNA construct design was central to the validation, involving computational design of both the target Ara h1 sequence and the guide RNA spacer sequences using bioinformatics tools like CRISPOR and BLAST to ensure optimal targeting efficiency and specificity. The crRNA design process specifically utilized CRISPOR’s machine learning algorithms to predict Cas12a cutting efficiency while BLAST database searches against food genomes confirmed that selected targets would detect only peanut allergens without cross-reactivity to chicken, turkey, or other common food proteins.
Cell-Free Systems: The experimental approach utilizes a completely cell-free detection system, eliminating the need for bacterial cultures or living cells. This cell-free approach enables rapid detection (1-2 hours vs days for cell-based assays) and simplifies the workflow for potential field deployment. The system combines purified Cas12a protein, synthetic crRNAs, target DNA, and fluorescent reporters in optimized buffer conditions, allowing direct measurement of CRISPR activity through trans-cleavage of reporter molecules. This cell-free design is inspired by recent advances in portable diagnostics and aligns with the goal of developing field-deployable allergen detection systems.
Industry Council Companies Associated with Project:
Twist Biosciences - DNA synthesis for Ara h1 target gene
New England Biolabs - Cas12a enzyme
Asimov - Project planning and DNA sequence management
Ginkgo Bioworks - Potential partnership for automated assay development
RESULTS AND QUANTITIVE EXPECTATIONS
What aspect of your final project did you choose to validate?
I chose to validate the core CRISPR-Cas12a detection mechanism by designing custom crRNAs targeting the Ara h1 peanut allergen gene and testing their ability to guide Cas12a for specific DNA detection with fluorescent readout. This validation demonstrates the fundamental detection principle underlying the entire biosensor system, proving that programmable nucleic acid recognition can generate measurable signals for allergen identification.
Detailed validation protocol:
Target sequence analysis: Retrieved Ara h1 CDS from NCBI GenBank and used CRISPOR to identify optimal target sites with TTTV PAM sequences
Specificity validation: Performed BLAST searches against food genome databases to confirm target sequences are peanut-specific
crRNA design: Selected position 526 target sequence (GCACCCGCTACGGGAACCAAA) with 67% efficiency score and clean specificity profile
Reagent preparation: Ordered synthetic Ara h1 CDS from Twist Biosciences, custom crRNA from IDT Alt-R system, and Cas12a protein from NEB
RNP complex formation: Combined Cas12a protein with crRNA at 1:1 ratio, incubated 30 minutes at room temperature
Detection assay setup: Prepared two recipe formulations (25 nM vs 50 nM RNP concentrations) with FAM-BHQ1 fluorescent reporters
Kinetic analysis: Tested target concentrations from 10-200 nM with measurements at 5, 10, 15, and 30-minute intervals
Control validation: Included no-target and no-crRNA controls to verify signal specificity
Data collection: Used qPCR fluorescence detection to monitor trans-cleavage activity over time
Synthetic biology techniques utilized:
DNA construct design was central to the validation, involving computational design of both the target Ara h1 sequence and the guide RNA spacer sequences using bioinformatics tools like CRISPOR and BLAST to ensure optimal targeting efficiency and specificity. Cell-free systems development enabled the entire detection mechanism to operate using purified components rather than living cells, combining Cas12a protein, synthetic crRNAs, target DNA, and fluorescent reporters in optimized buffer conditions. CRISPR/Cas12a programming involved designing guide sequences that direct the nuclease to recognize specific DNA targets, utilizing the programmable nature of CRISPR systems where changing the 20-nucleotide spacer sequence redirects the enzyme to new targets. Database utilization was essential for target validation, using NCBI resources for sequence retrieval and BLAST analysis against multiple food genomes to confirm the designed system would detect only peanut allergens without cross-reactivity.
Data presentation and analysis:
Due to reagent ordering delays, I was unable to perform the experimental validation and instead generated theoretical data based on expected CRISPR detection performance to demonstrate anticipated results and data analysis approaches. The simulated data shows quantitative fluorescence kinetics with dose-dependent responses from 10-200 nM target concentrations and time-dependent signal development over 30 minutes, with Recipe 1 achieving detection from 20-100 nM (2.1× to 6.2× baseline fluorescence) and Recipe 2 showing enhanced sensitivity down to 10 nM with maximum signals reaching 8.1× baseline. This theoretical framework establishes the expected experimental outcomes and analysis methods that would validate the CRISPR detection system’s functionality, providing a foundation for future experimental work when reagents become available.
Challenges and limitations encountered:
The primary challenge was that reagent orders (Twist DNA synthesis, IDT crRNA synthesis, and NEB protein) did not arrive in time for experimental validation, requiring the use of simulated data based on literature expectations rather than actual laboratory results. This highlighted the importance of earlier reagent ordering and longer lead times for custom DNA synthesis and specialized molecular biology reagents in future project planning. Beyond logistical challenges, the designed system faces technical limitations including the detection limit of 10-20 nM being insufficient for real-world food samples without amplification, and potential optimization needs for balancing signal strength versus background fluorescence in different recipe formulations. Future strategies to overcome these limitations include implementing isothermal amplification (RPA) to achieve single-copy sensitivity, testing alternative reporter designs to improve signal-to-noise ratios, and developing robust supply chain planning to ensure reagent availability aligns with experimental timelines for reliable project execution.
ADDITIONAL INFORMATION
References
Cheng et al. (2025). SURVEY methodology: Cell-free one-pot RPA-CRISPR detection with heparin sodium regulation for isothermal amplification and nucleic acid detection
Nima sensor development and commercial history (2017-2018): Pioneer handheld allergen detection device using antibody-based immunoassay technology Nut Free WokWikipedia
Allergen Alert (2026): Next-generation portable allergen detection device unveiled at CES 2026, developed by bioMérieux spinout company
Certified Laboratories: Description of the current challenges in allergen detection
Integration of biosensing technologies and portable detection devices for reliable on-site food allergen detection ScienceDirect
Recent advances in CRISPR-Cas biosensors for food safety applications and aflatoxin detection
NCBI GenBank database: Ara h1 gene sequence retrieval and analysis
CRISPOR web tool: Guide RNA design and efficiency scoring for Cas12a targeting
BLAST database: Specificity analysis and cross-reactivity screening against food genomes
Claude: for documentation drafting and hypothetical data generation/presentation
Supply list and budget for project
Core Reagents:
Synthetic Ara h1 target DNA (Twist Biosciences): $110.70