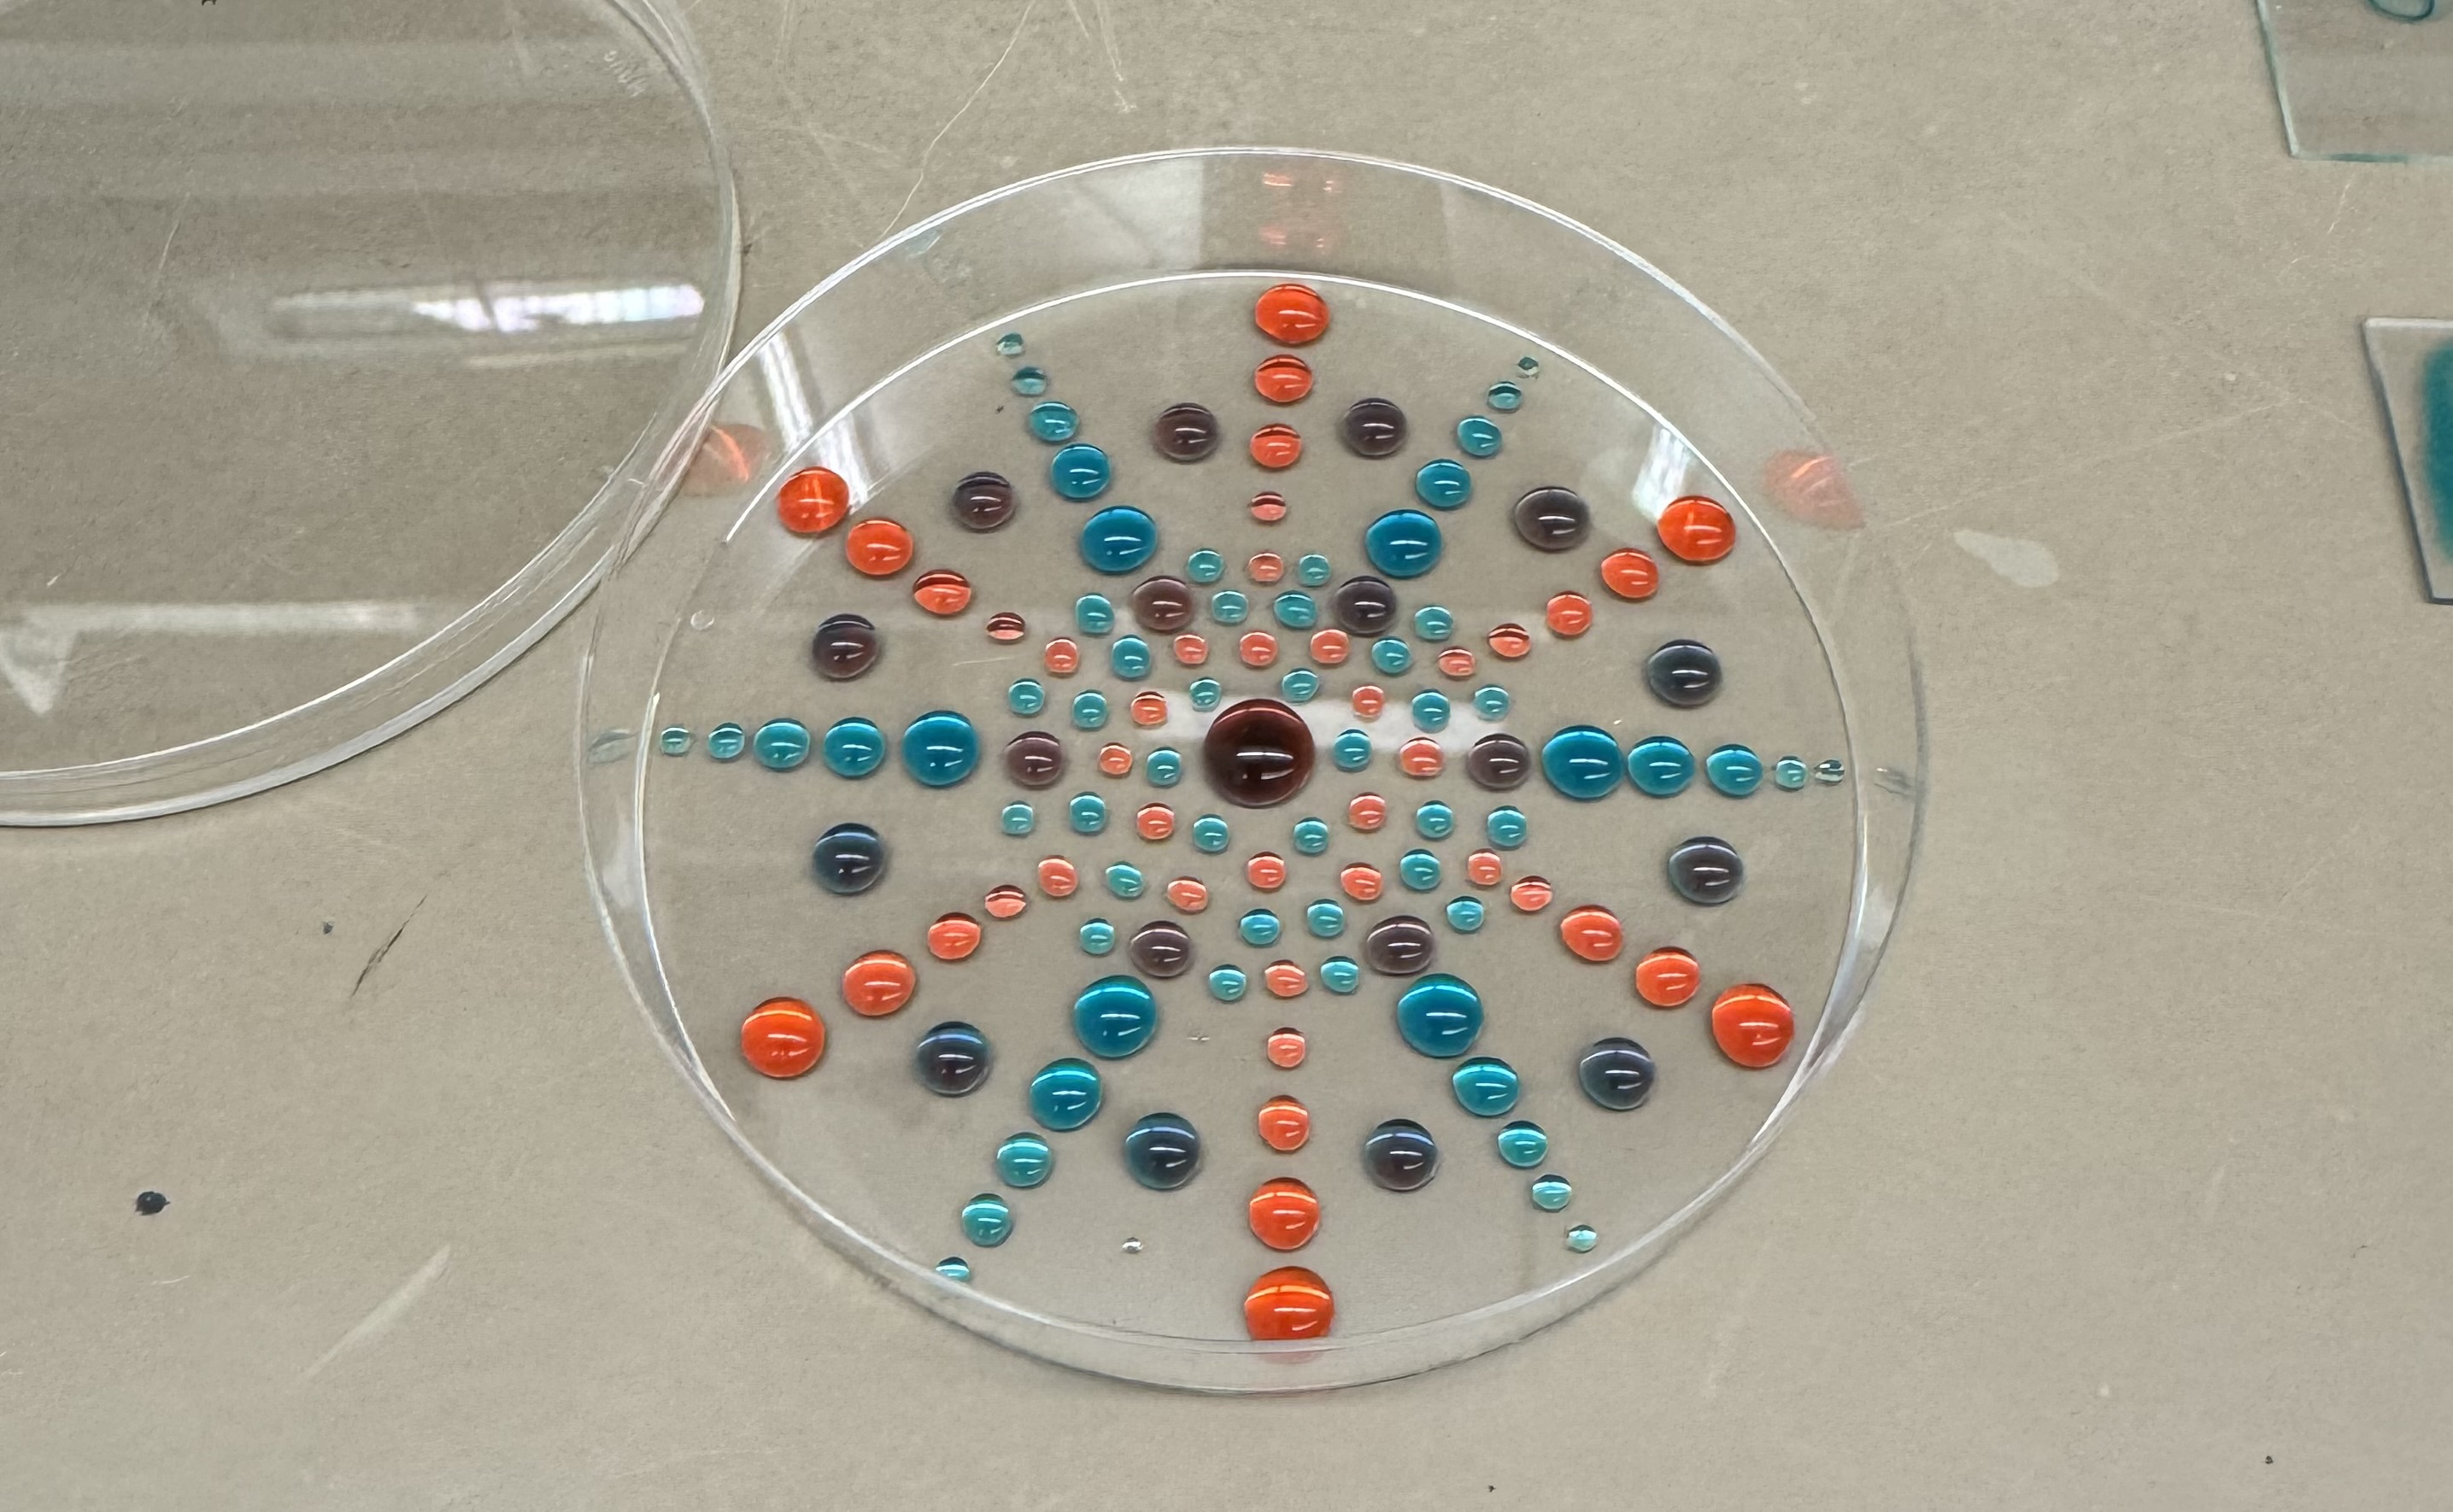
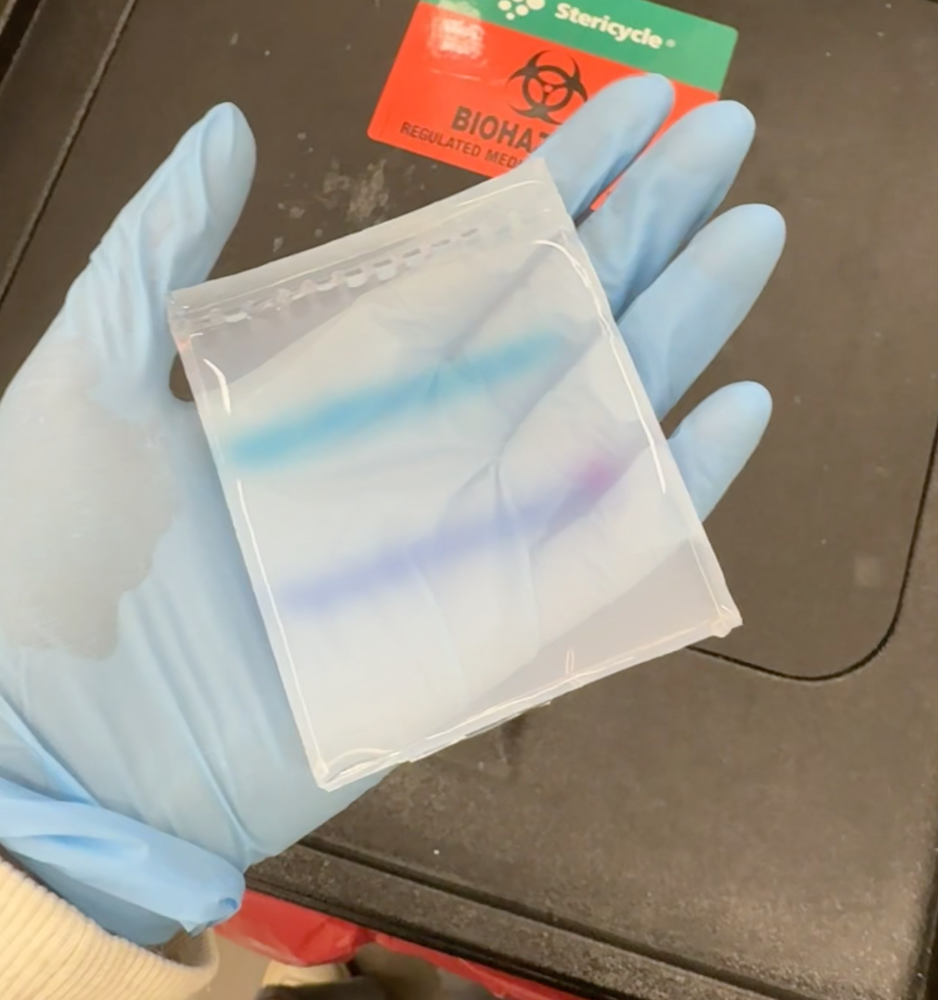
This week we got to spend some time just having fun getting to know the lab space. We made fun petri dish art using colored water, and even got to run some gels (using these fancy machines that dont require any buffers)!
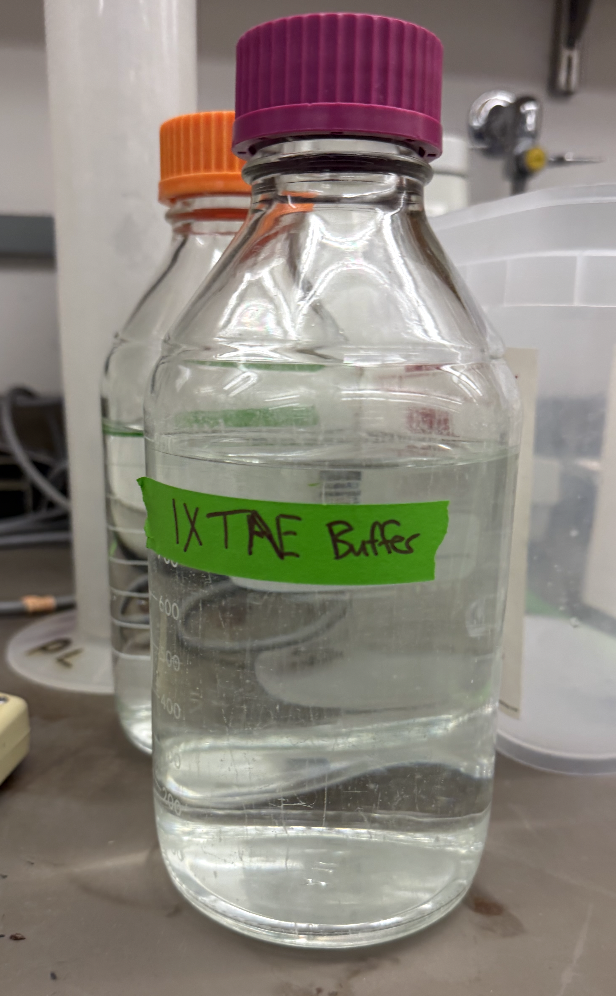
Making the 1X TAE Buffer
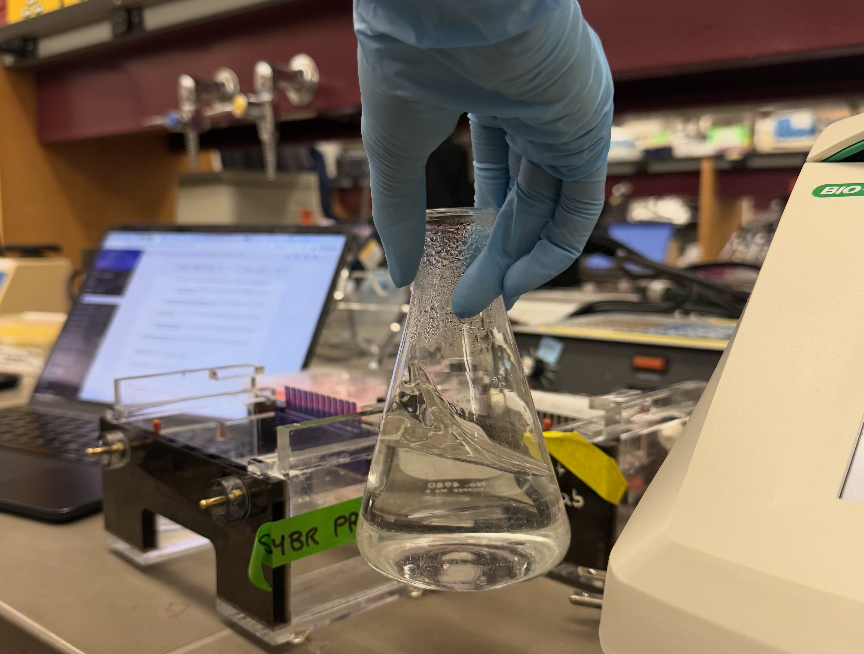
Prepping the Gel
Restriction Digest
Running the Gel
Results and Imaging
Discussion
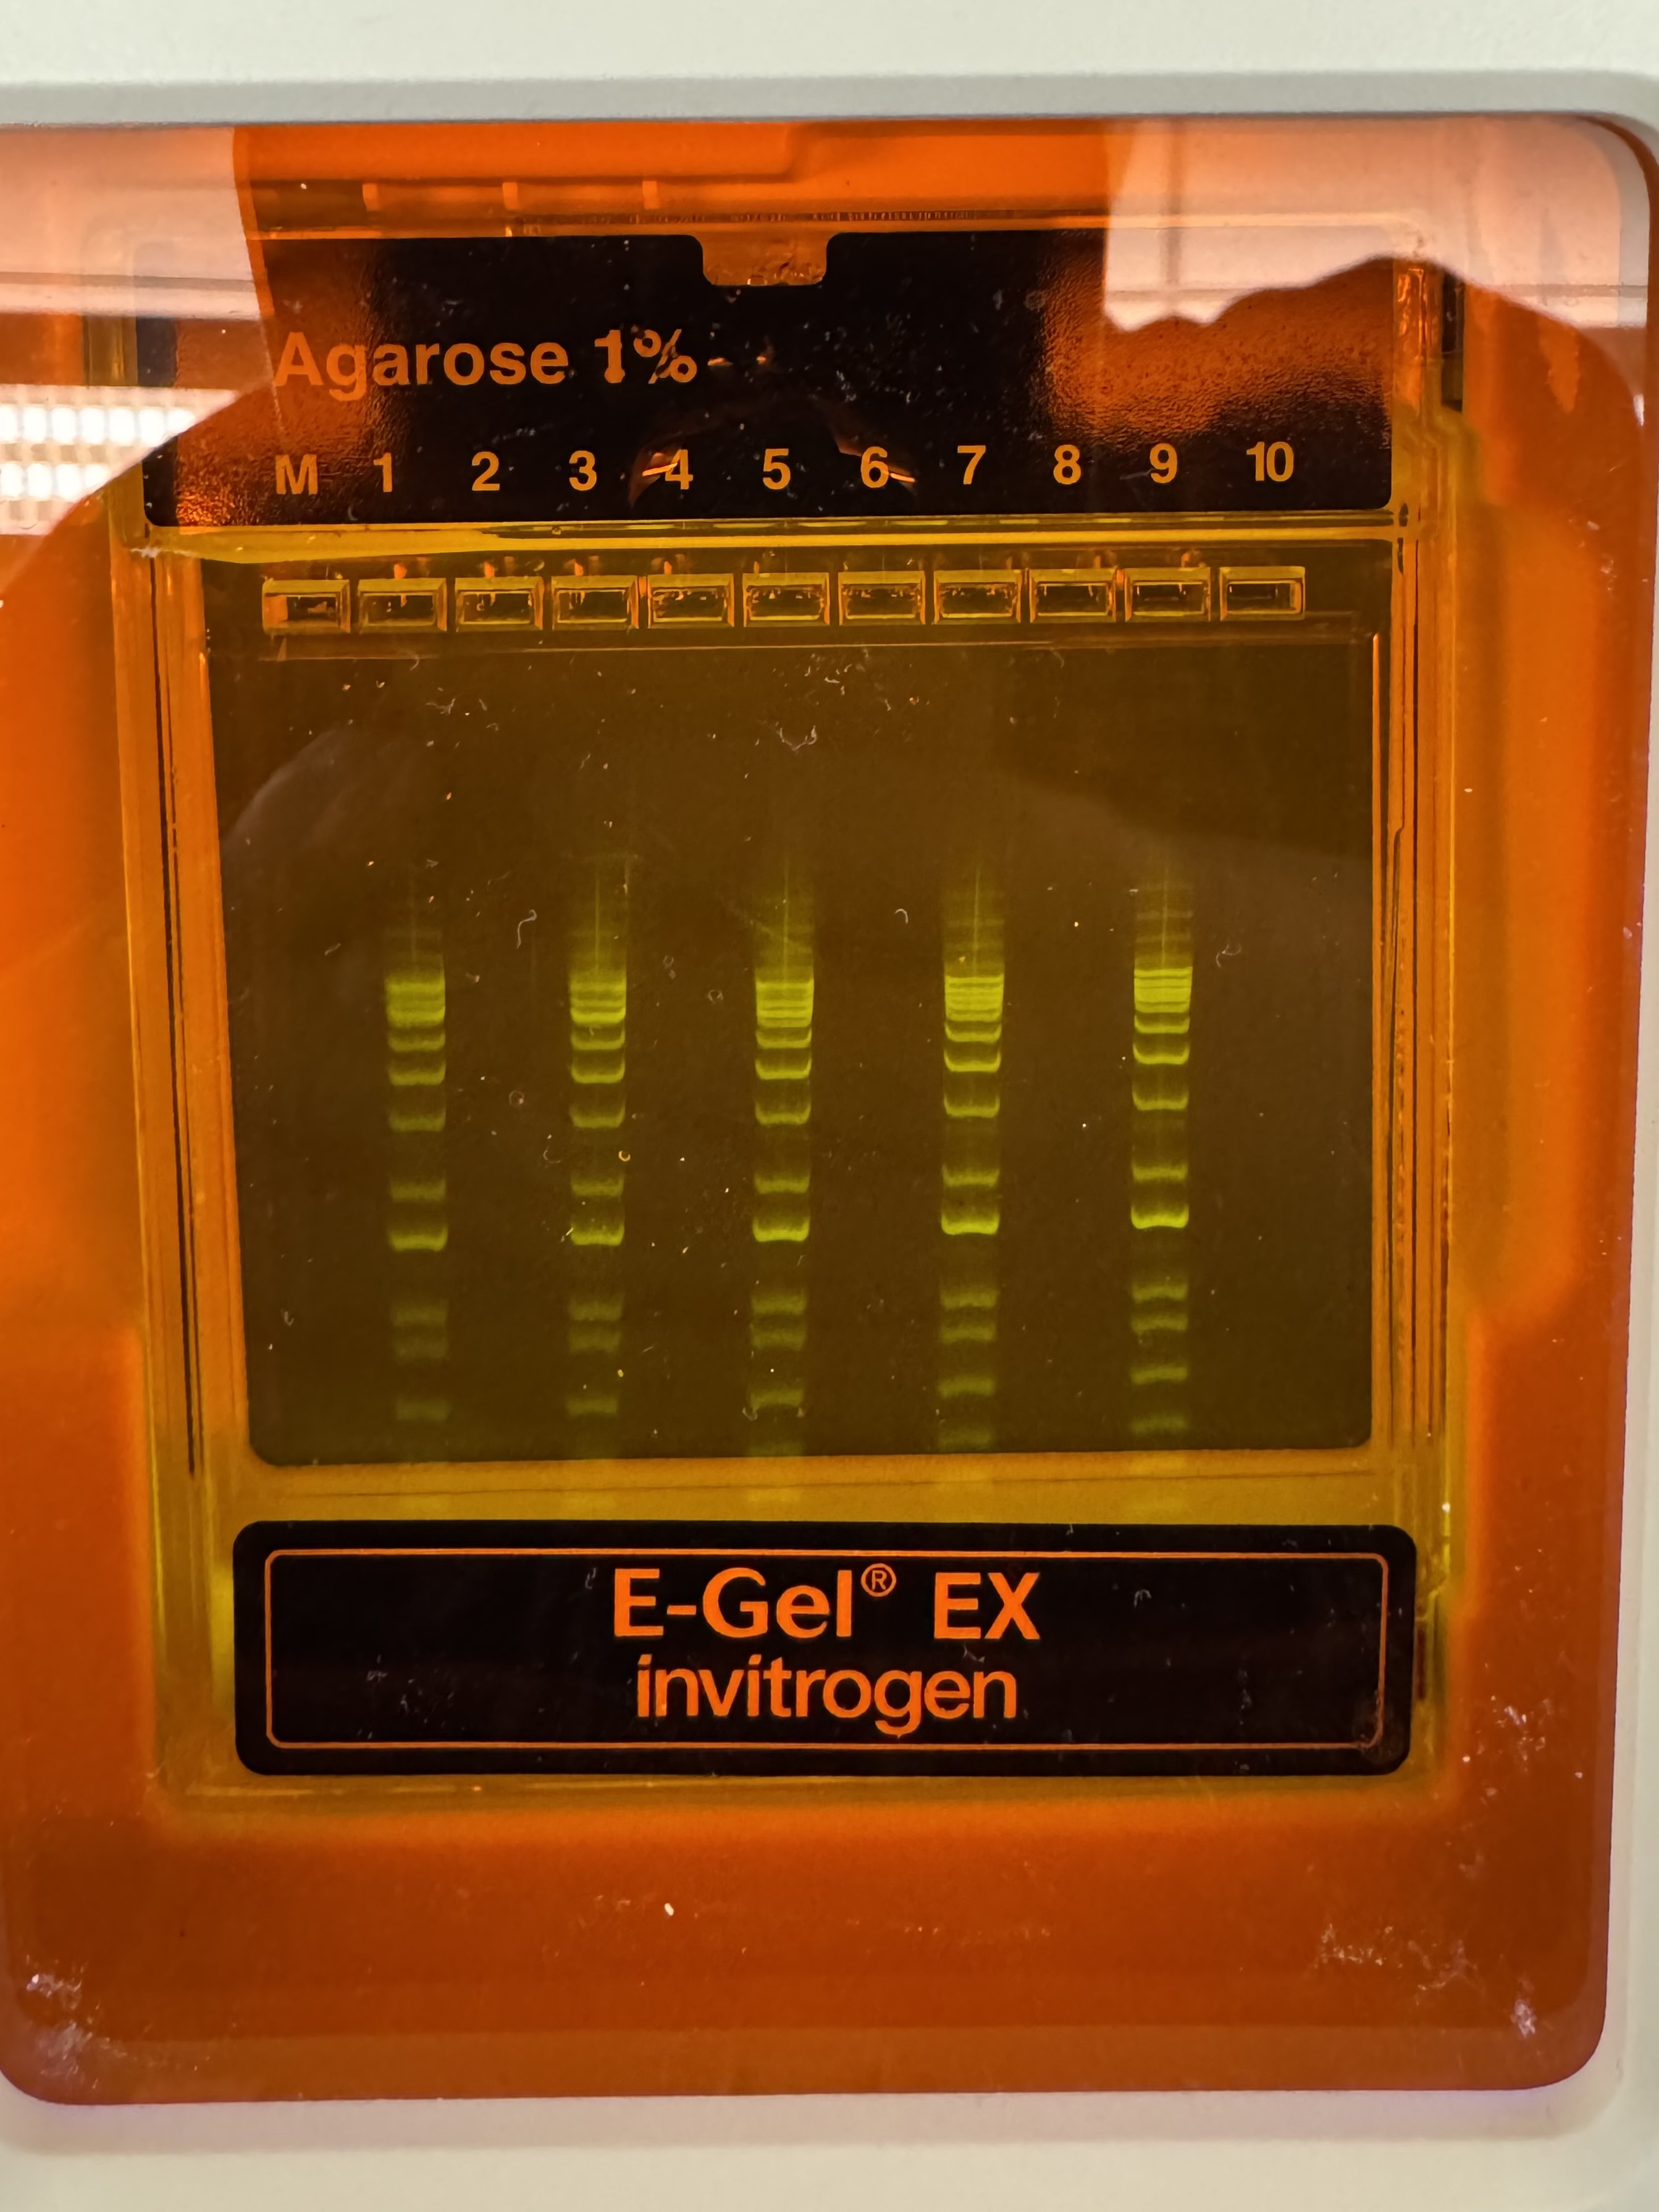
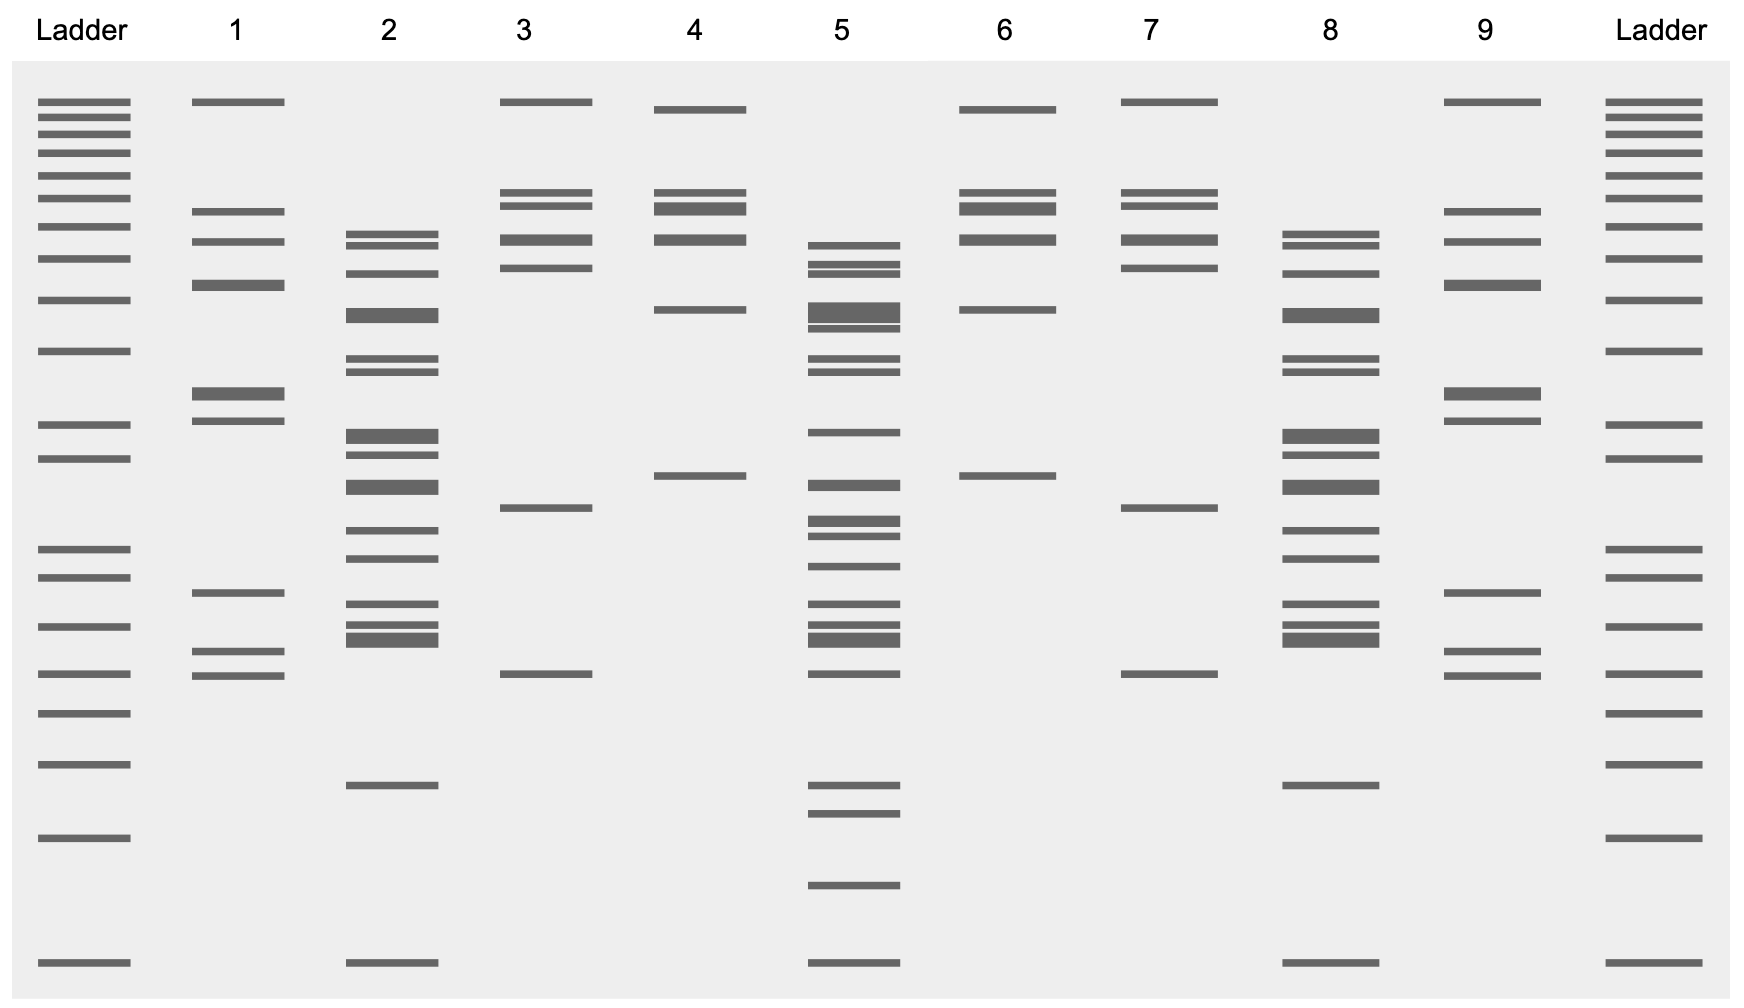
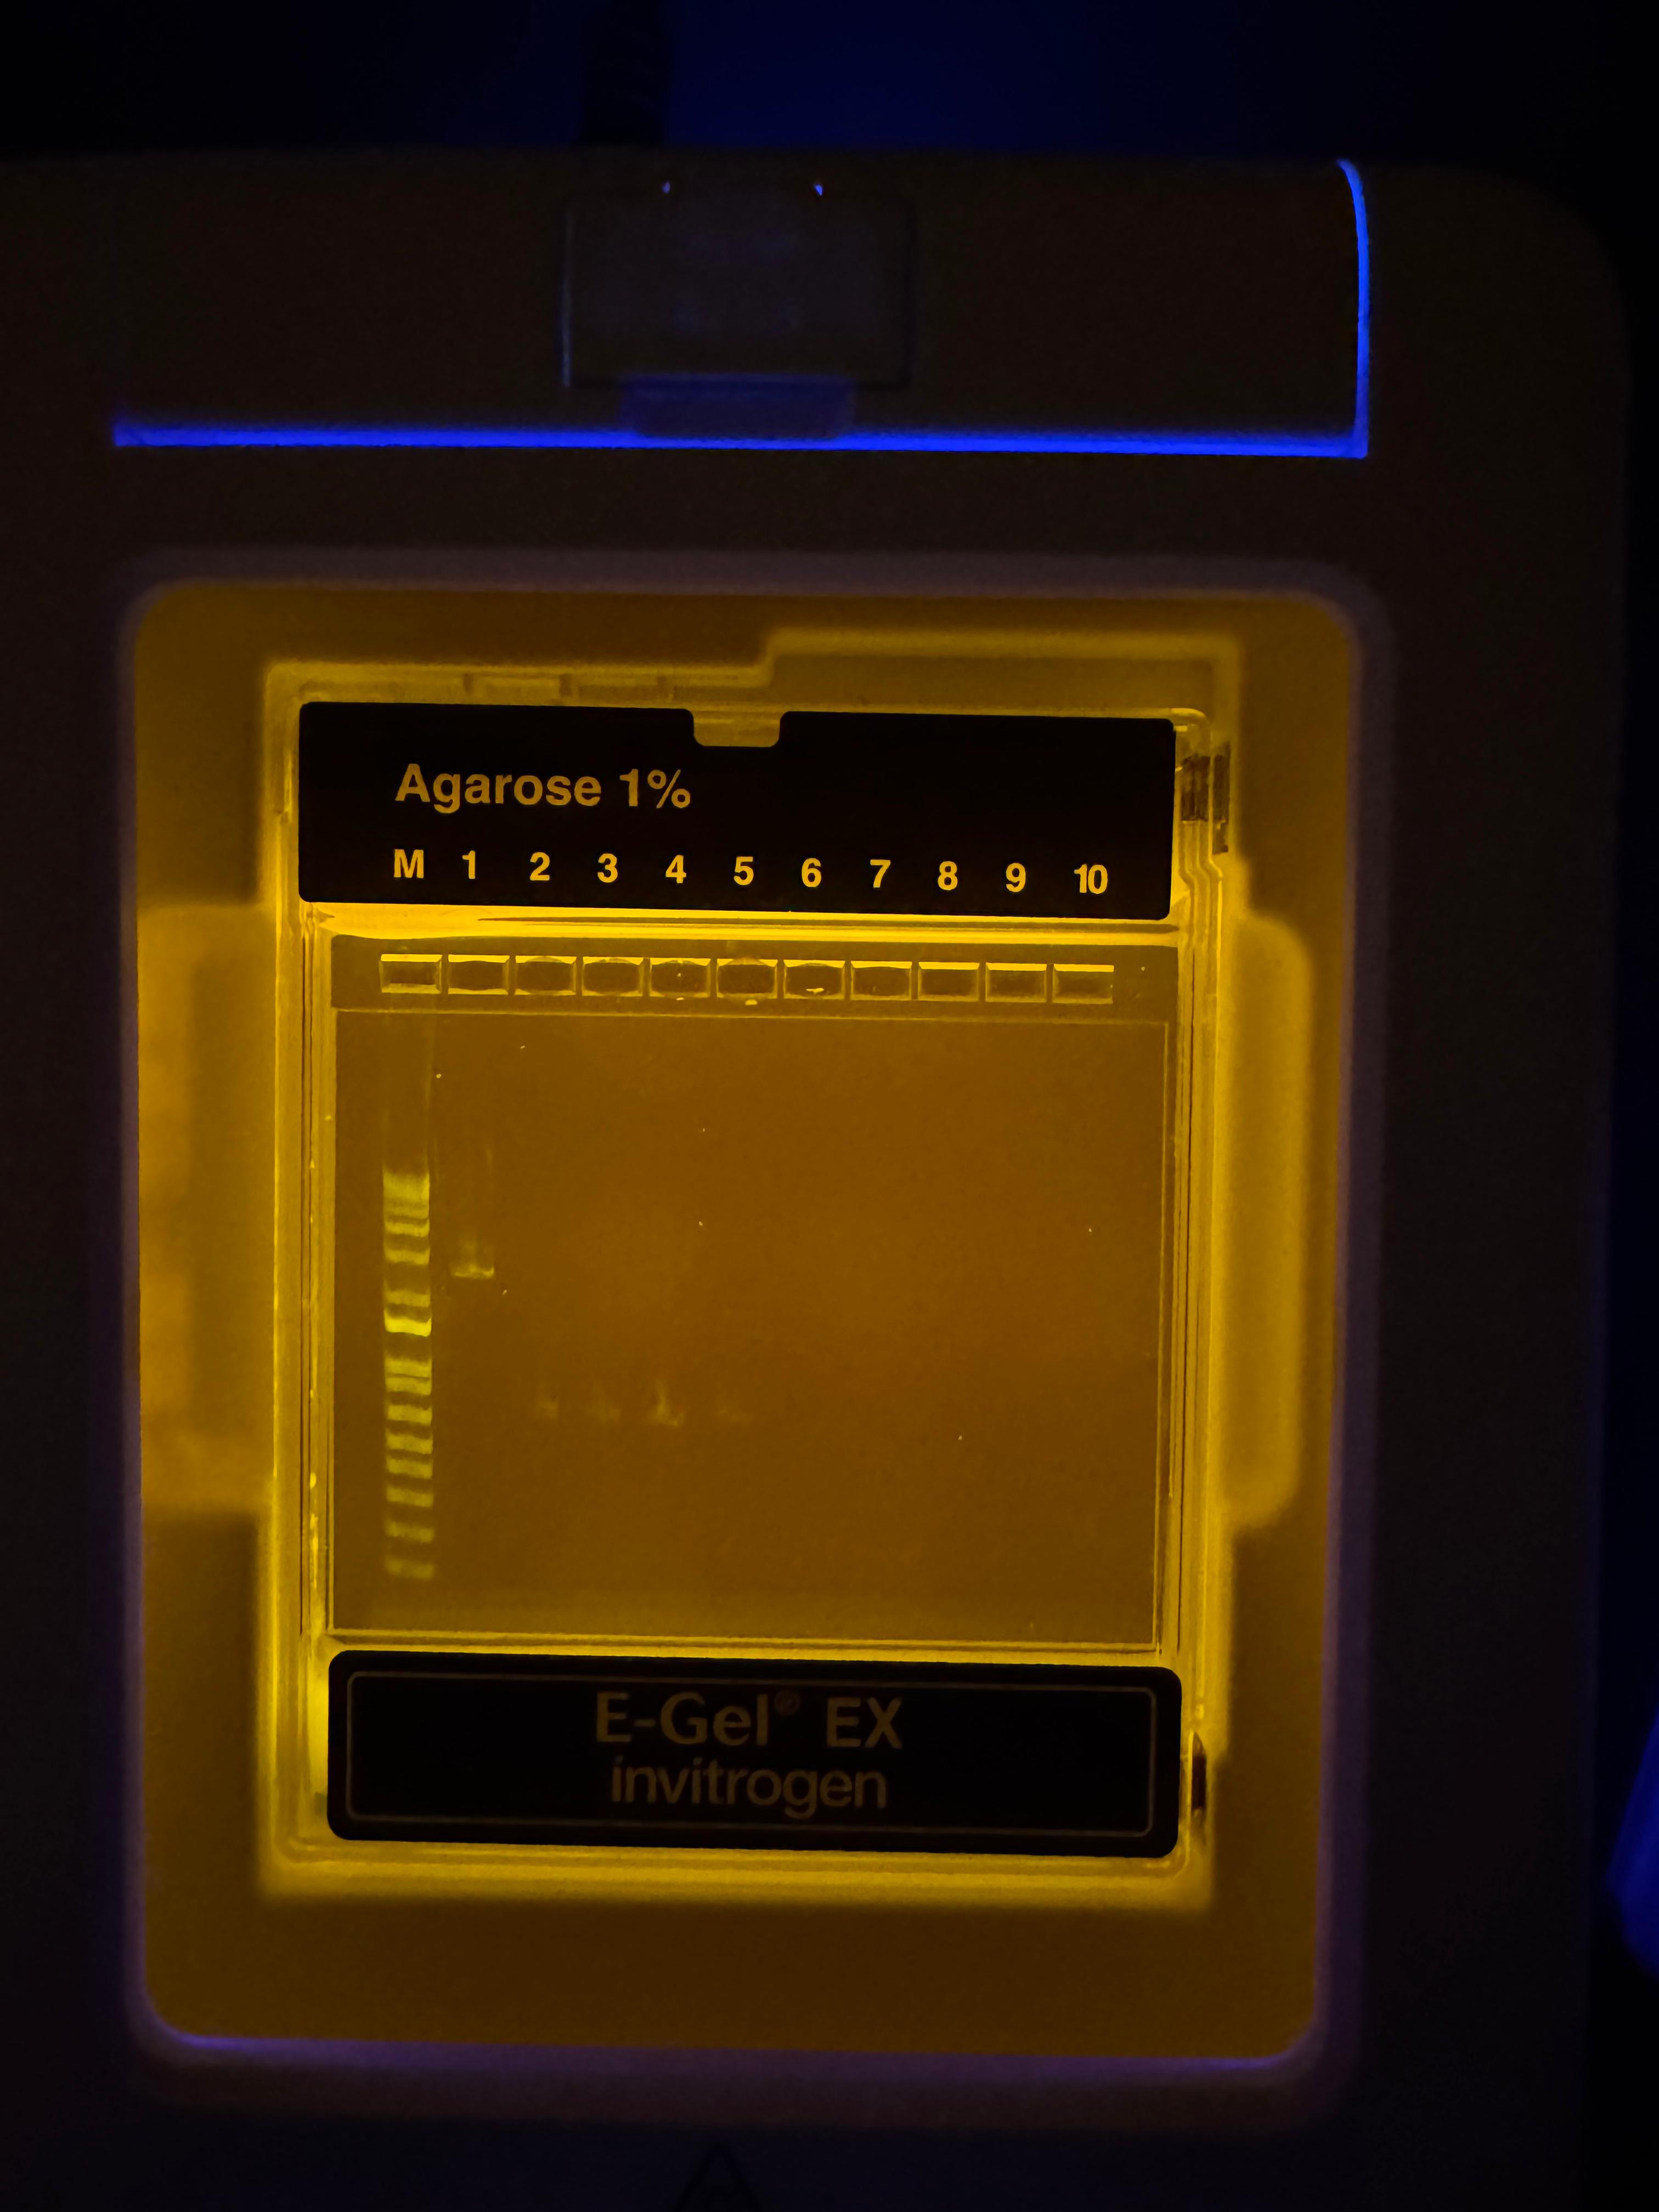
Given that our imaged gel didn’t look like this, we can dive into what might have gone wrong.
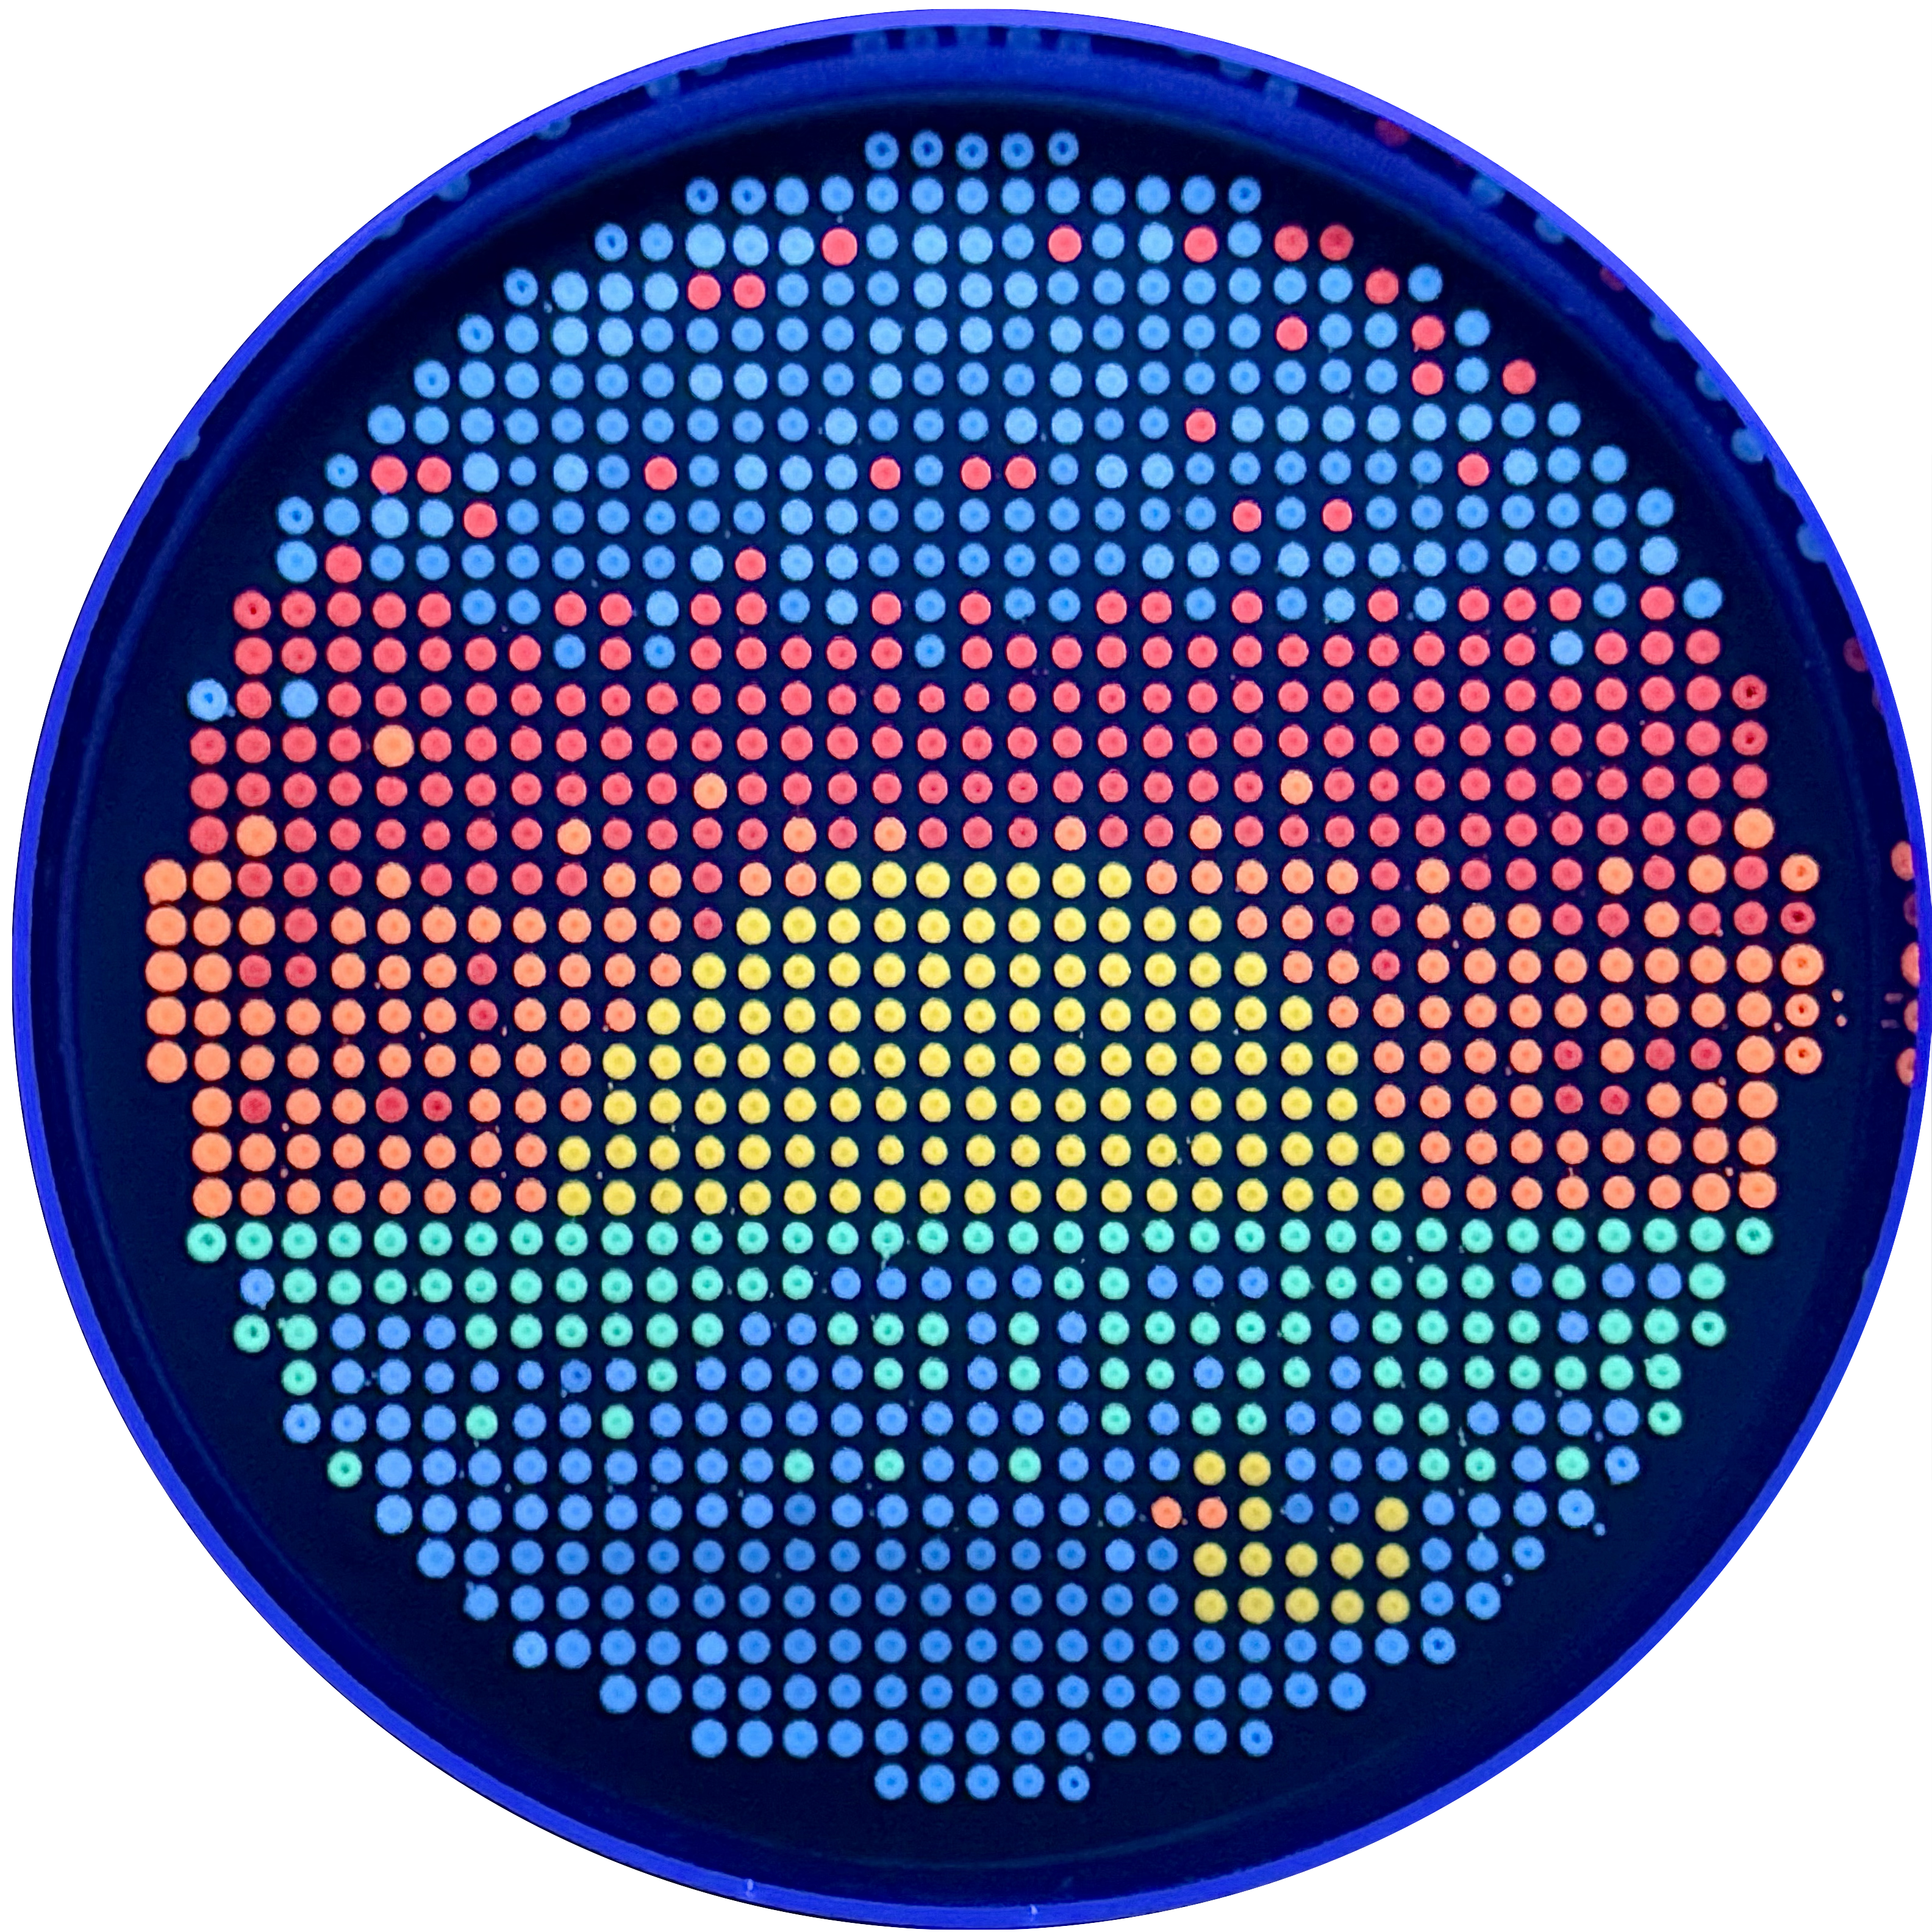
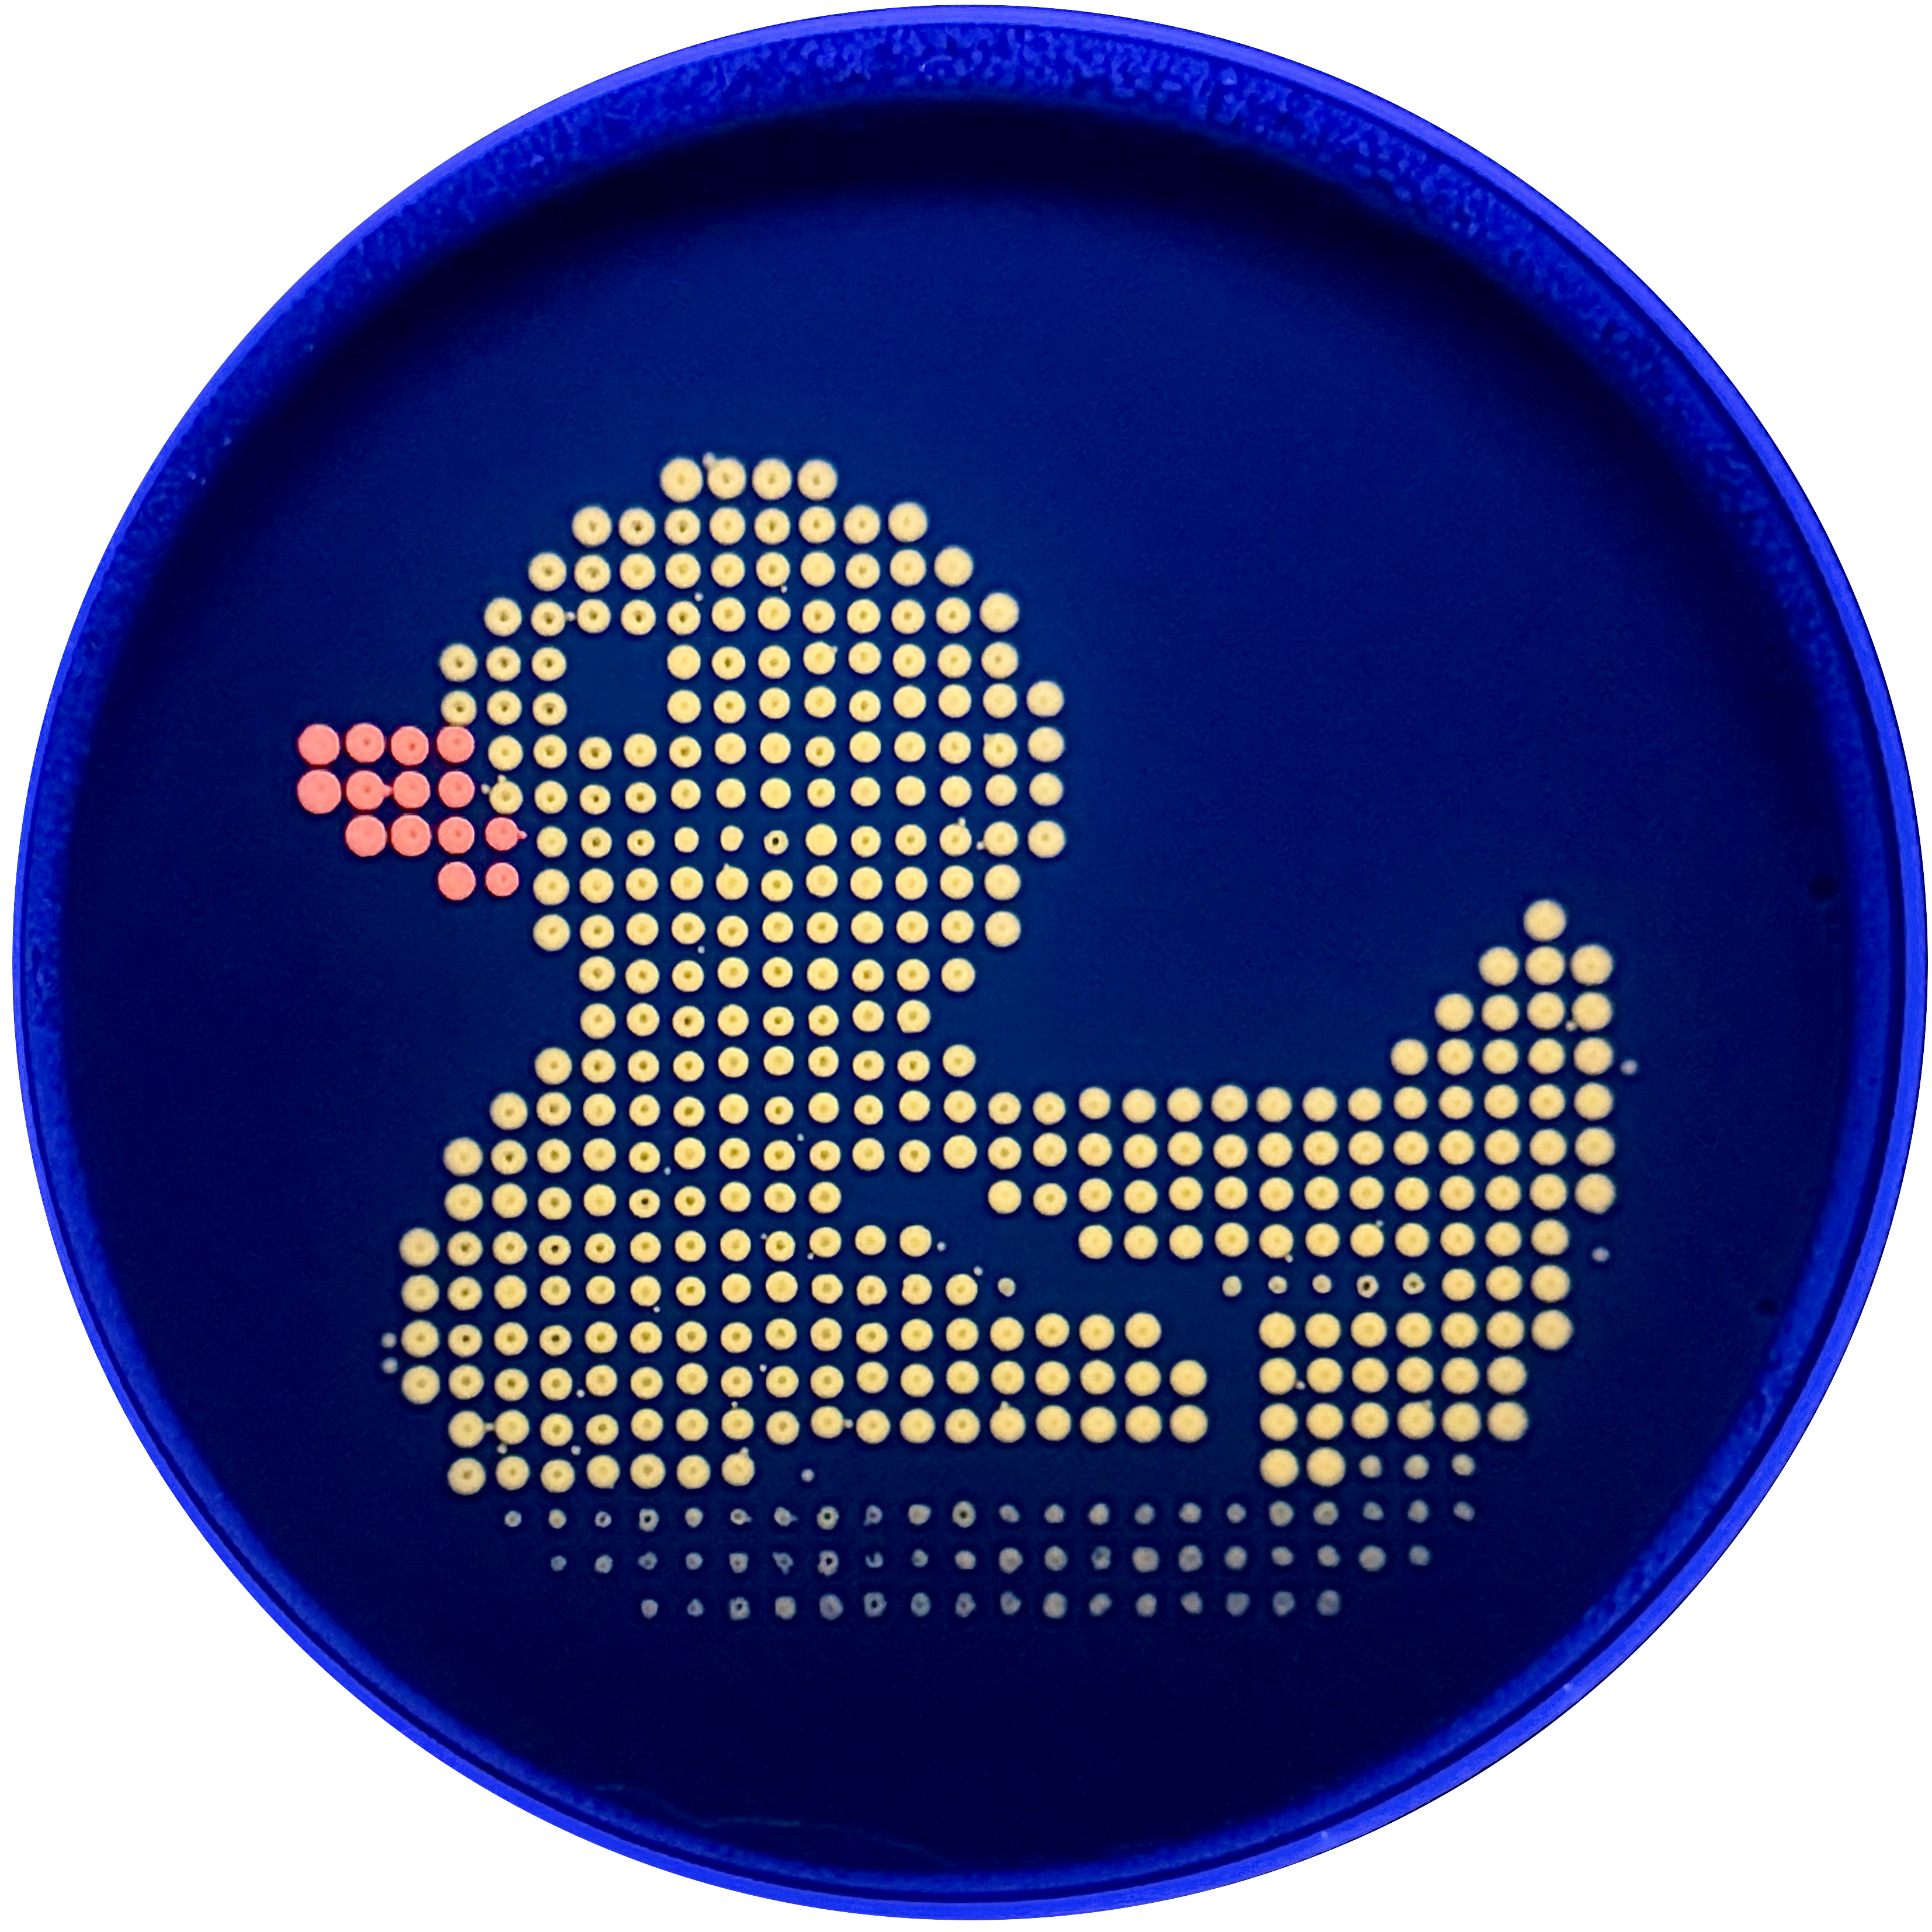
This week, we got to utilize an Opentrons liquid handling robot in order to make cool gel artwork!
The custom python script tells the Opentrons unit to pick up a pipette tip, when and where to aspirate and dispense, when to switch tips, and when to stop.
Background In this lab, we modifies the color-generatinf chromophore of the purple Acropora millepora chromoprotein in order to create a variety of different colored mutants.
Day 1: Preparation of DNA Fragments We performed two PCR reactions, one for the backbone, and one for the color inserts.
IANN Circuit Design Our group designed a dual-region intracellular artificial neural network (IANN) circuit using all three endoribonucleases (ERNs). The circuit takes two inputs, X1 and X2, and produces mNeonGreen as a fluorescent readout, with a bias component providing a baseline level of output even in the absence of strong input signals.
Each of the three mNeonGreen mRNA sources in the circuit is protected under different input conditions:
Subsections of Labs
Week 1 Lab: Pipetting
This week we got to spend some time just having fun getting to know the lab space. We made fun petri dish art using colored water, and even got to run some gels (using these fancy machines that dont require any buffers)!
Week 2 Lab: DNA Gel Art
Making the 1X TAE Buffer
Prepping the Gel
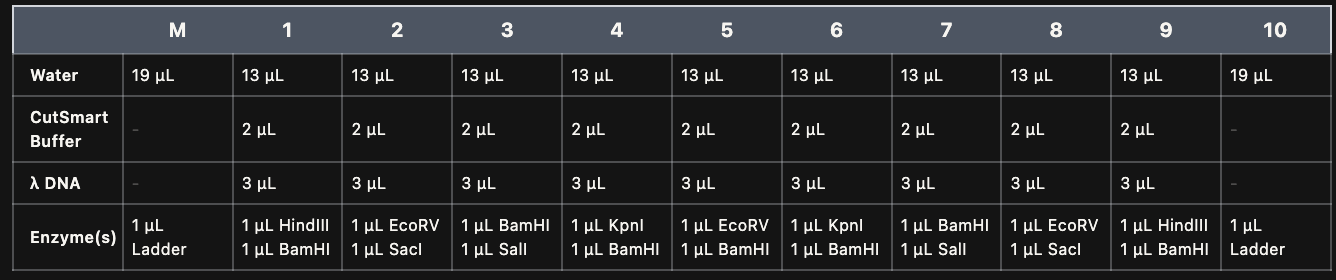
Restriction Digest
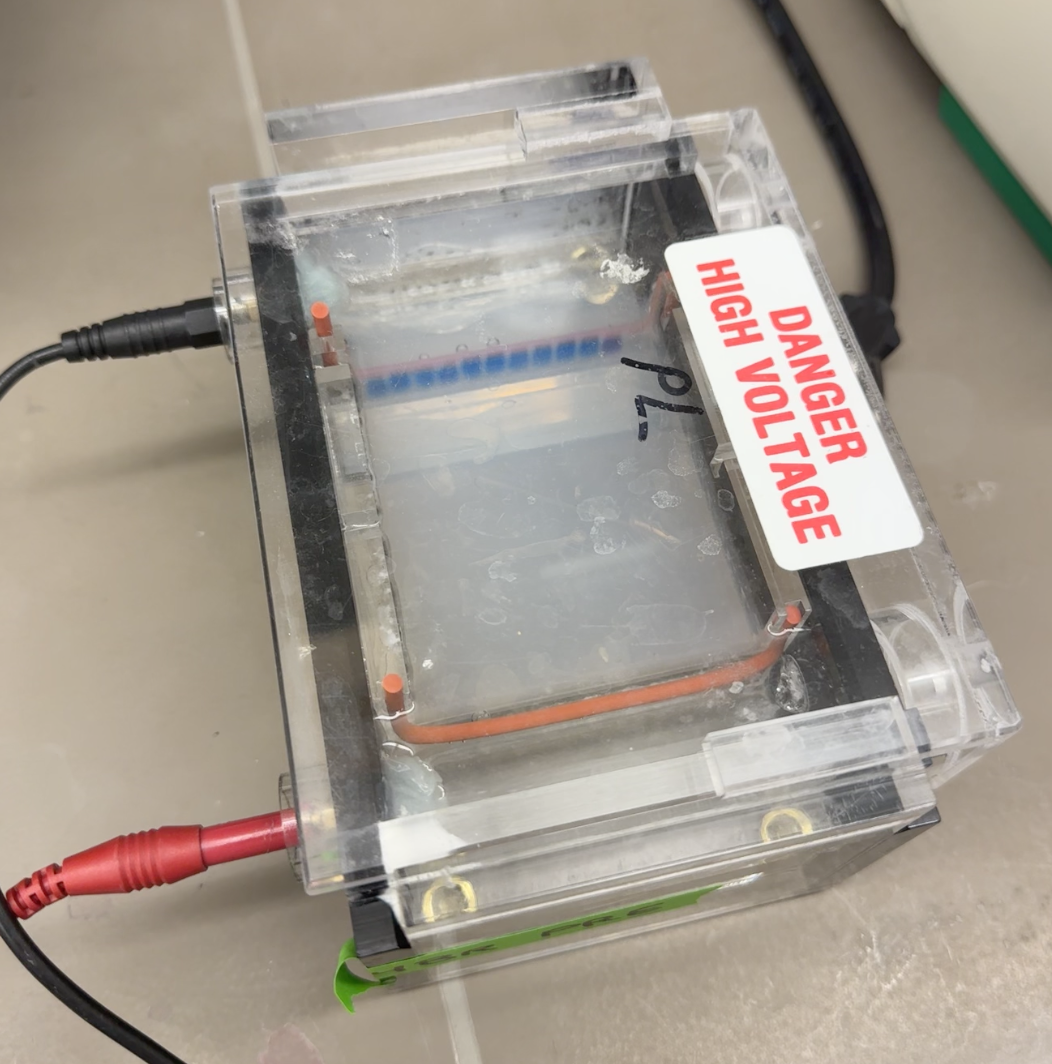
Running the Gel
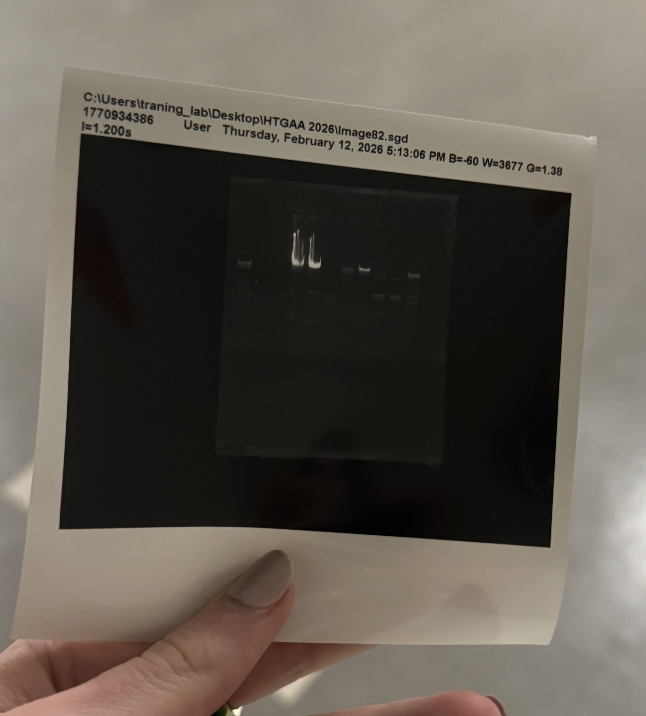
Results and Imaging
Discussion
Given that our imaged gel didn’t look like this, we can dive into what might have gone wrong.
Lanes 2 and 3 appear to have no bands at all. One possible explanation is that we accidentally did not add DNA to the digest, or we did not add any of the digest to the mix that went into those lanes. Given the small volhmes we were pipetting, it’s possible that someone made an error by not submerging the tip when loading or dispensing.
Lanes 4 and 5 have smeared bands. This could be caused by a too high DNA concentration in the digests, which would prevent the DNA from moving efficiently through the agarose gel. Maybe the DNA that was meant for lanes 2 and 3 ended up in lanes 4 and 5.
Week 3 Lab: Opentrons Art
This week, we got to utilize an Opentrons liquid handling robot in order to make cool gel artwork!
The custom python script tells the Opentrons unit to pick up a pipette tip, when and where to aspirate and dispense, when to switch tips, and when to stop.
week 6 lab: gibson assembly
Background
In this lab, we modifies the color-generatinf chromophore of the purple Acropora millepora chromoprotein in order to create a variety of different colored mutants.
Day 1: Preparation of DNA Fragments
We performed two PCR reactions, one for the backbone, and one for the color inserts.
We prepared four color-specific reactions: Blue, Light Pink, Magenta, and Orange.
Backbone PCR Reaction
Primers: Backbone Fwd and Backbone Rev
Reagent
Stock Conc.
Desired Conc.
Volume (µL)
Template mUAV Plasmid
38.5 ng/µL
20 ng
0.8
Backbone Forward Primer
5 µM
0.5 µM
2.5
Backbone Reverse Primer
5 µM
0.5 µM
2.5
Phusion HF PCR Mix
2X
1X
12.5
Nuclease-free water
—
—
6.8
Total Volume
—
—
25.0
Color DNA Reactions
Primers: Color Fwd and Color Rev
Reagent
Stock Conc.
Desired Conc.
Volume (µL)
Template mUAV Plasmid
38.5 ng/µL
20 ng
0.8
Color Forward Primer
5 µM
0.5 µM
2.5
Color Reverse Primer
5 µM
0.5 µM
2.5
Phusion HF PCR Mix
2X
1X
12.5
Nuclease-free water
—
—
6.8
Total Volume
—
—
25.0
After mixing, the tubes were placed in the thermocyclers. The backbone was run on one specialized program while the color mutations were run on another.
Purification & Analysis
(Note: DpnI digest was skipped as our reactions did not contain methylated DNA.)
We purified the PCR products using the Zymo DNA Clean & Concentrator kit. We ran the product through the column, washed twice, and then eluted.
Gel Analysis
Gel electrophoresis was performed to verify the amplification. Lane 1 contains the native plasmid. Lanes 2–5 show the expected amplified fragments for the Gibson Assembly. Samples were then placed into the fridge until Day 2.
Day 2: Assembly & Transformation
Gibson Assembly
We used the unpurified PCR products for the assembly, rather than the purified products. This decision was made because other lab groups reported low DNA recovery after purification.
Reagent
Stock Conc. (ng/µL)
Desired Conc (ng/µL)
Volume (µL)
Backbone Fragment
50
25
0.5
Color Fragment (Single)
50
50
1.0
Gibson Assembly Mix
2X
1X
5.0
Nuclease-free water
—
—
3.5
Total Volume
—
—
10.0
The reaction was incubated at 50°C in the thermocycler for 30 minutes.
Transformation
We compared two competent E. coli strains: DH5α and 10-beta.
Incubation: competent cells were mixed with Gibson products and incubated on ice for 30 mins
Heat Shock: the reaction was placed in thermocycler for 45 seconds in SOC medium, then immediately returned to ice.
Outgrowth: the reaction was incubated for 60 minutes on a makeshift shaker made out of a pipette tip box.
100µL of each transformation was plated onto LB-Agar plates with Chloramphenicol.
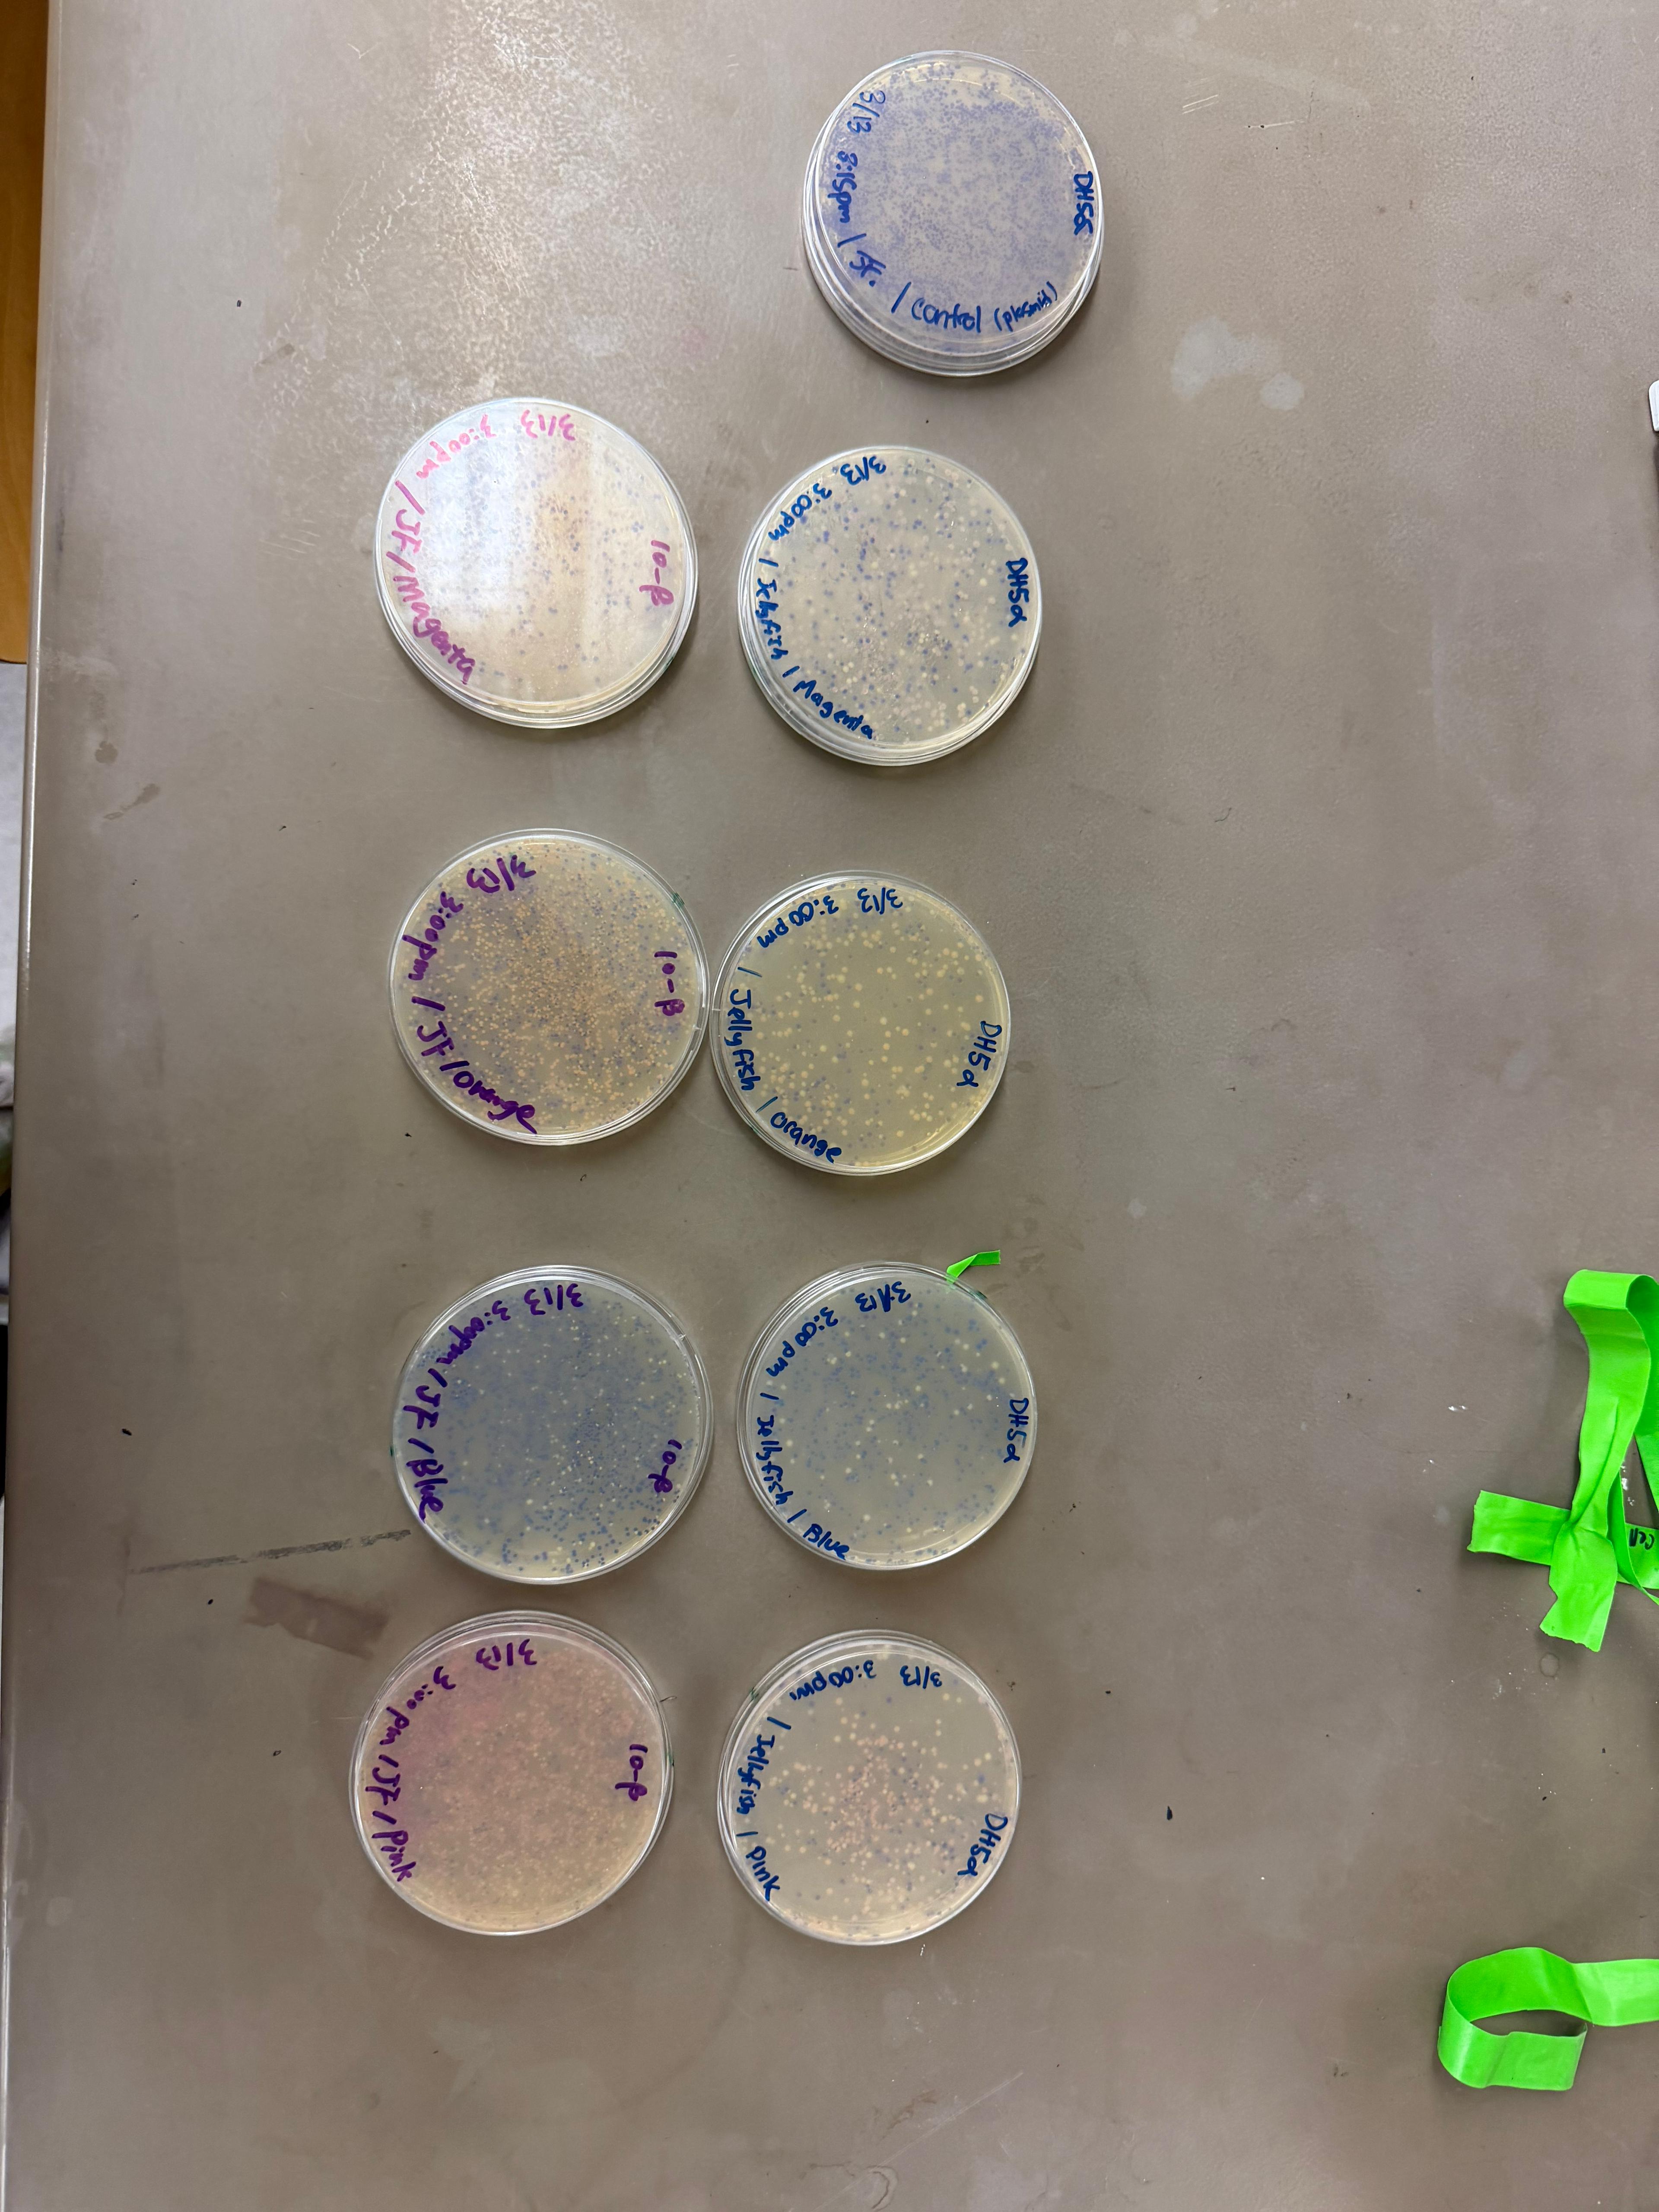
Results
After 72 hours of incubation, we achieved the targeted chromophore mutations across both cell lines.
Analysis
The positive control confirmed that the assembly was effective. While some purple colonies (native plasmid) were present on all plates, each plate showed distinct colored colonies (Orange, Light Pink, Blue, Magenta), indicating successful Gibson Assembly and transformation.
Week 7 Lab: Neuropmorphic Circuits
IANN Circuit Design
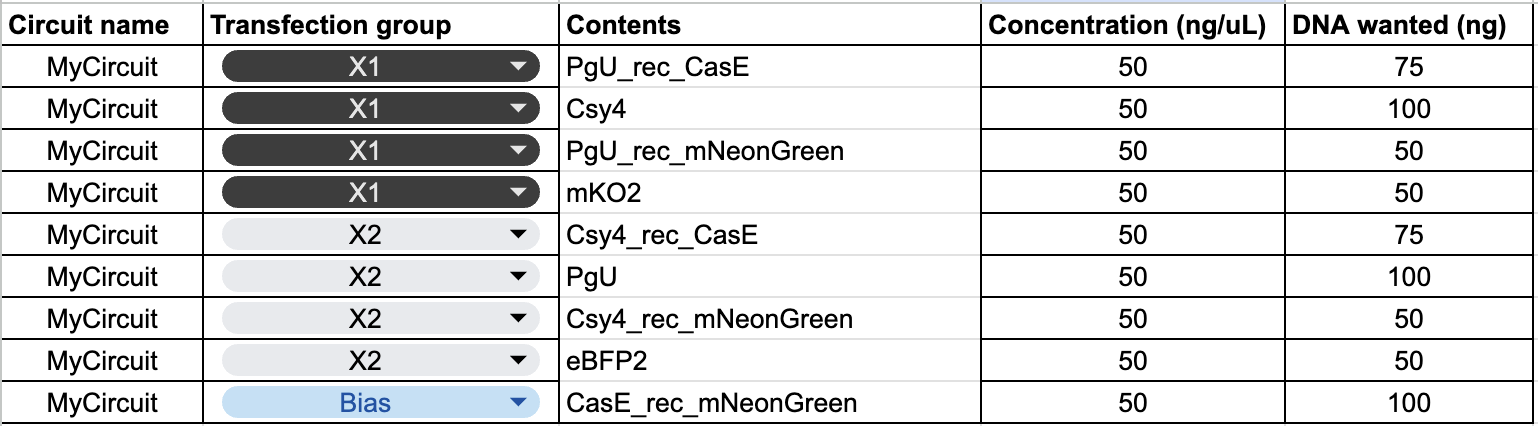
Our group designed a dual-region intracellular artificial neural network (IANN) circuit using all three endoribonucleases (ERNs). The circuit takes two inputs, X1 and X2, and produces mNeonGreen as a fluorescent readout, with a bias component providing a baseline level of output even in the absence of strong input signals.
Each of the three mNeonGreen mRNA sources in the circuit is protected under different input conditions:
PgU_rec_mNeonGreen (driven by X1) is protected when PgU (X2) is absent or low
Csy4_rec_mNeonGreen (driven by X2) is protected when Csy4 (X1) is absent or low
CasE_rec_mNeonGreen (Bias) is protected when CasE levels are low, which occurs when both X1 and X2 are simultaneously high and mutually suppress each other’s CasE production
The expected behavior under each input combination is as follows:
X1 high, X2 low: Csy4 produced by X1 degrades X2’s Csy4_rec_mNeonGreen. Since PgU is low, X1’s PgU_rec_mNeonGreen survives. Expected output: high.
X2 high, X1 low: PgU produced by X2 degrades X1’s PgU_rec_mNeonGreen. Since Csy4 is low, X2’s Csy4_rec_mNeonGreen survives. Expected output: high.
Both high: Both direct mNeonGreen sources are degraded. However, each ERN also suppresses the other’s CasE production, so CasE levels fall and the bias mRNA is protected. Expected output: moderate, dependent on bias concentration.
Both low: Minimal DNA and expression overall, with residual CasE activity still degrading the bias mRNA. Expected output: lowest.
The circuit therefore implements a dual-region logic function — output is high when the two inputs are mismatched and low when they are matched in either direction.
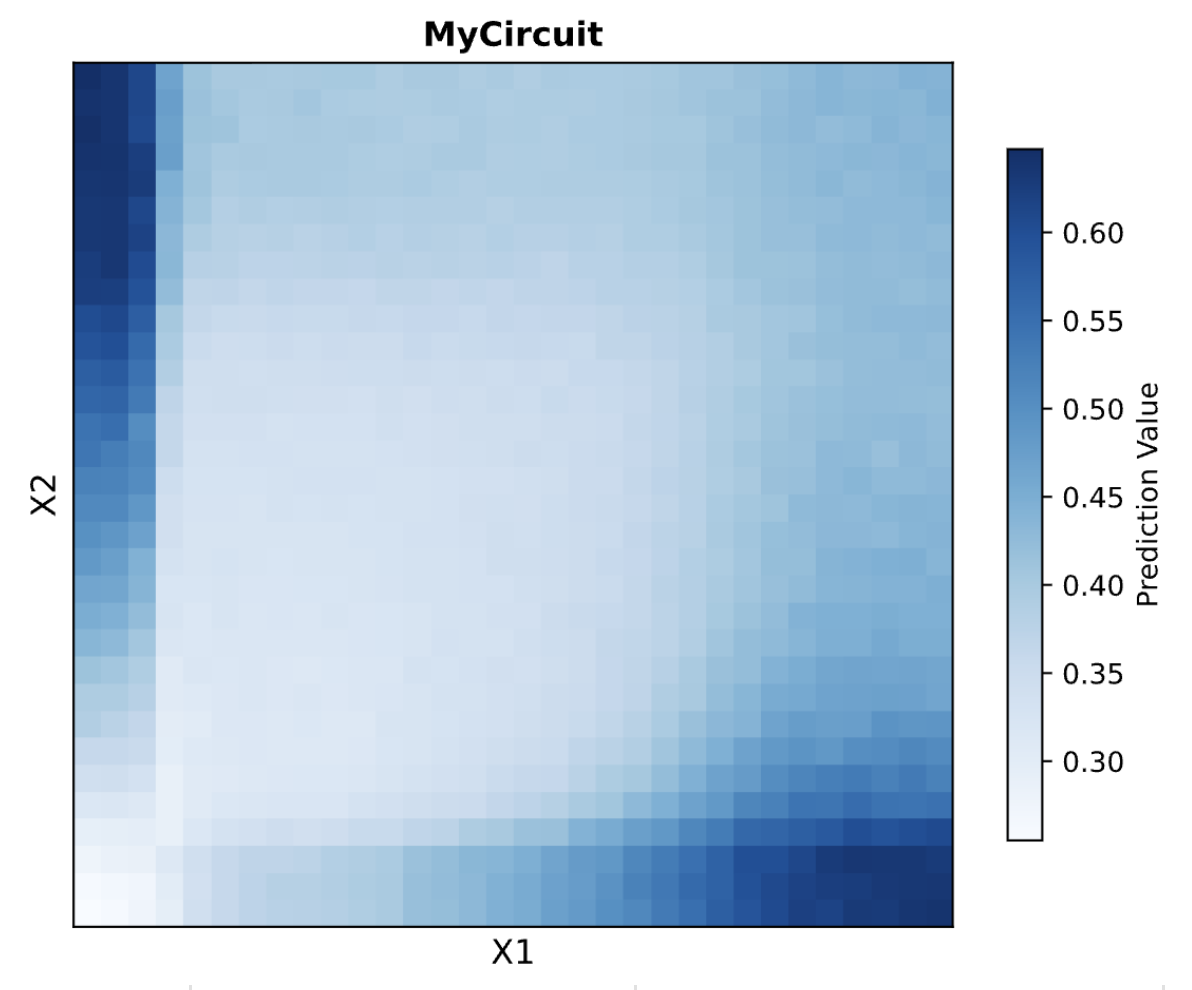
Predicted Output
The prediction heatmap reflects this dual-region behavior. High output is expected in the top-left quadrant (X1 low, X2 high) and bottom-right quadrant (X1 high, X2 low). The bottom-left (both low) represents the minimum output condition, while the top-right (both high) shows moderate output, reflecting the partial contribution of the bias mRNA when both ERNs cancel each other’s CasE production.
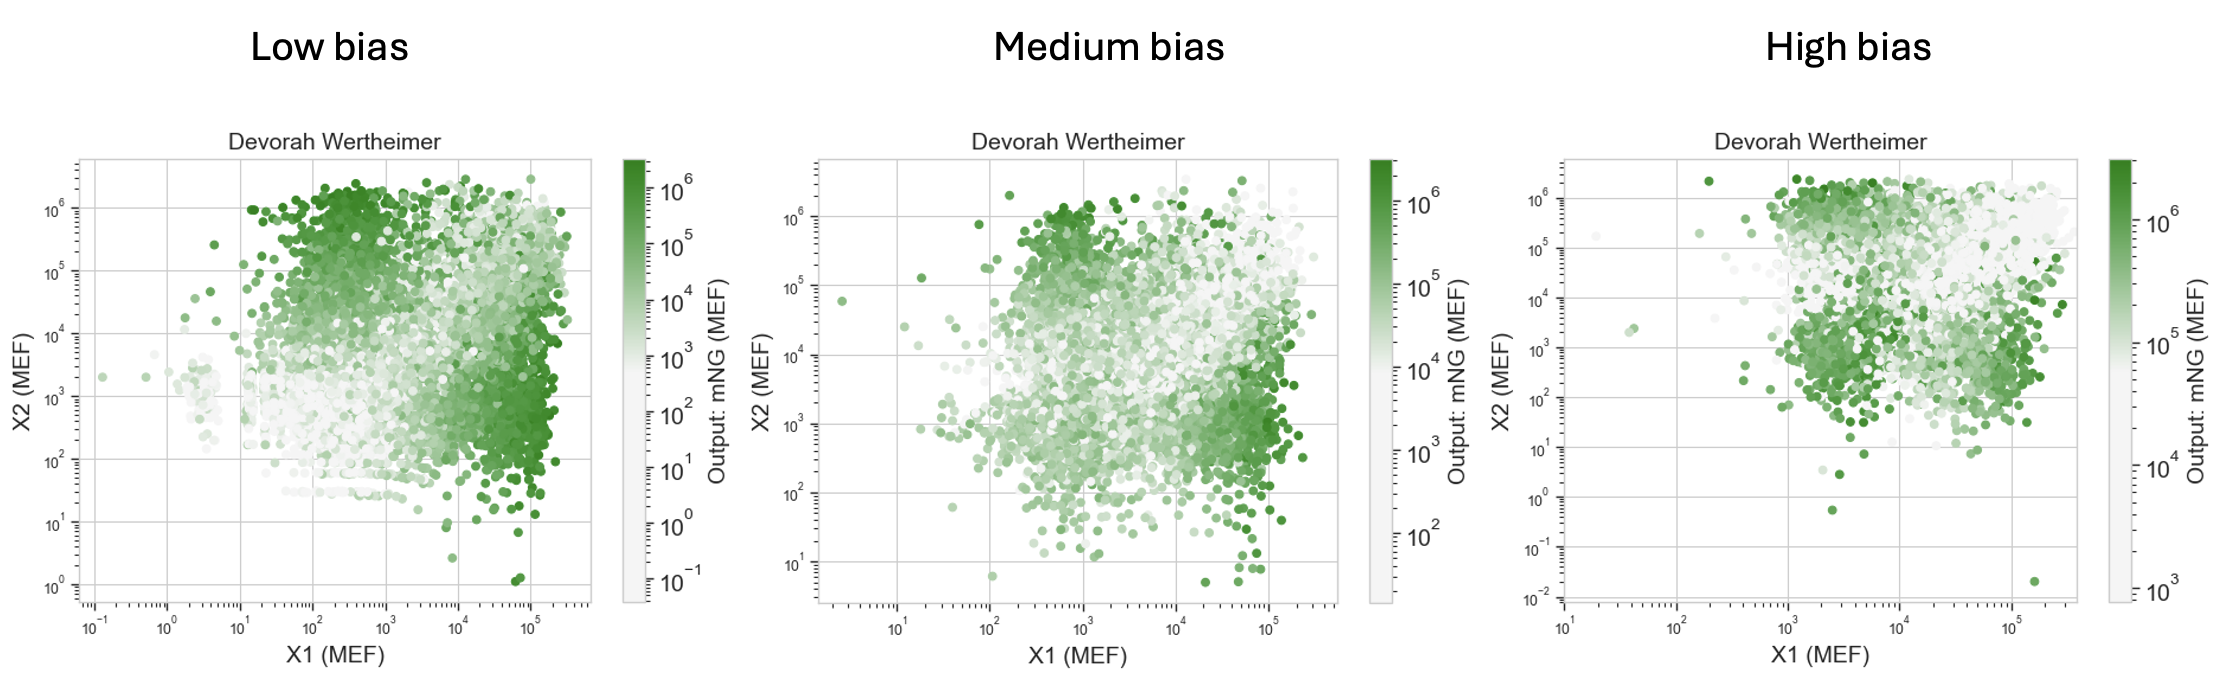
Experiment Results
Results were visualized as single-cell scatterplots from HEK293 cells, with X1 input on the x-axis (reported via mKO2 fluorescence), X2 input on the y-axis (reported via eBFP2 fluorescence), and mNeonGreen output encoded as dot color intensity. Three panels showed results at low, medium, and high bias DNA concentrations.
Low bias: The brightest cells clustered in the mismatched input regions — high X2 with low X1, and high X1 with low X2 — consistent with the direct mNeonGreen mRNA sources dominating output. The dual-region pattern was clearly visible.
Medium bias: Output became more evenly distributed across input space and decreased in overall intensity. At this concentration the bias competes with but does not yet dominate the direct sources, producing a flatter and less structured response.
High bias: The highest-output cells shifted toward the both-high region. With an abundance of CasE_rec_mNeonGreen available, the dominant output source became the bias mRNA, which is maximally protected precisely when both ERNs are active and mutually suppress CasE production.