Week 7 Lab: Neuropmorphic Circuits
IANN Circuit Design
Our group designed a dual-region intracellular artificial neural network (IANN) circuit using all three endoribonucleases (ERNs). The circuit takes two inputs, X1 and X2, and produces mNeonGreen as a fluorescent readout, with a bias component providing a baseline level of output even in the absence of strong input signals.
Each of the three mNeonGreen mRNA sources in the circuit is protected under different input conditions:
- PgU_rec_mNeonGreen (driven by X1) is protected when PgU (X2) is absent or low
- Csy4_rec_mNeonGreen (driven by X2) is protected when Csy4 (X1) is absent or low
- CasE_rec_mNeonGreen (Bias) is protected when CasE levels are low, which occurs when both X1 and X2 are simultaneously high and mutually suppress each other’s CasE production
The expected behavior under each input combination is as follows:
X1 high, X2 low: Csy4 produced by X1 degrades X2’s Csy4_rec_mNeonGreen. Since PgU is low, X1’s PgU_rec_mNeonGreen survives. Expected output: high.
X2 high, X1 low: PgU produced by X2 degrades X1’s PgU_rec_mNeonGreen. Since Csy4 is low, X2’s Csy4_rec_mNeonGreen survives. Expected output: high.
Both high: Both direct mNeonGreen sources are degraded. However, each ERN also suppresses the other’s CasE production, so CasE levels fall and the bias mRNA is protected. Expected output: moderate, dependent on bias concentration.
Both low: Minimal DNA and expression overall, with residual CasE activity still degrading the bias mRNA. Expected output: lowest.
The circuit therefore implements a dual-region logic function — output is high when the two inputs are mismatched and low when they are matched in either direction.
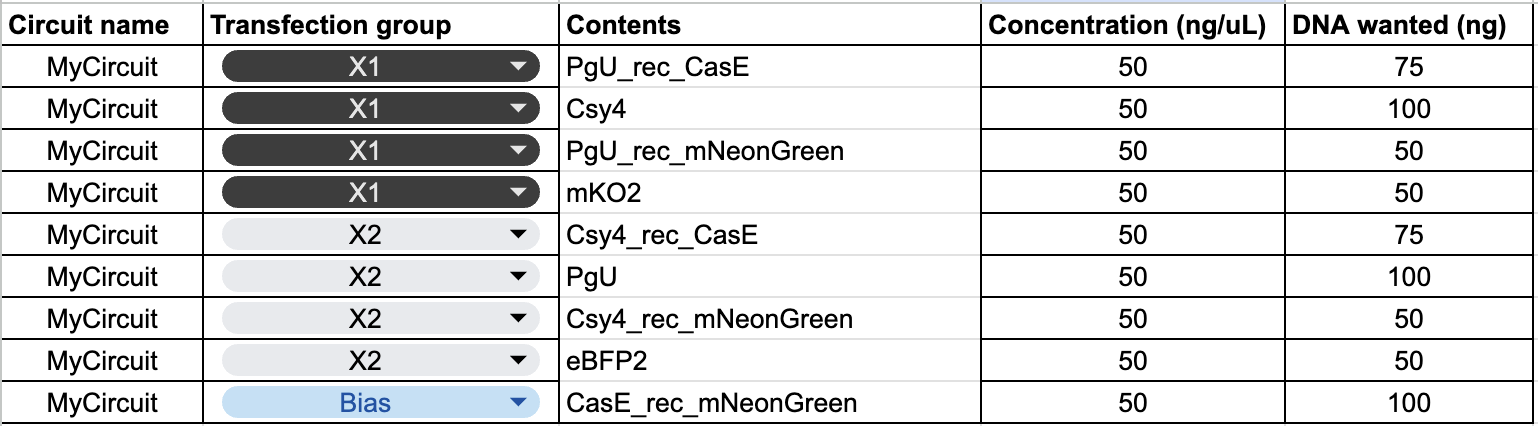
Predicted Output
The prediction heatmap reflects this dual-region behavior. High output is expected in the top-left quadrant (X1 low, X2 high) and bottom-right quadrant (X1 high, X2 low). The bottom-left (both low) represents the minimum output condition, while the top-right (both high) shows moderate output, reflecting the partial contribution of the bias mRNA when both ERNs cancel each other’s CasE production.
Experiment Results
Results were visualized as single-cell scatterplots from HEK293 cells, with X1 input on the x-axis (reported via mKO2 fluorescence), X2 input on the y-axis (reported via eBFP2 fluorescence), and mNeonGreen output encoded as dot color intensity. Three panels showed results at low, medium, and high bias DNA concentrations.
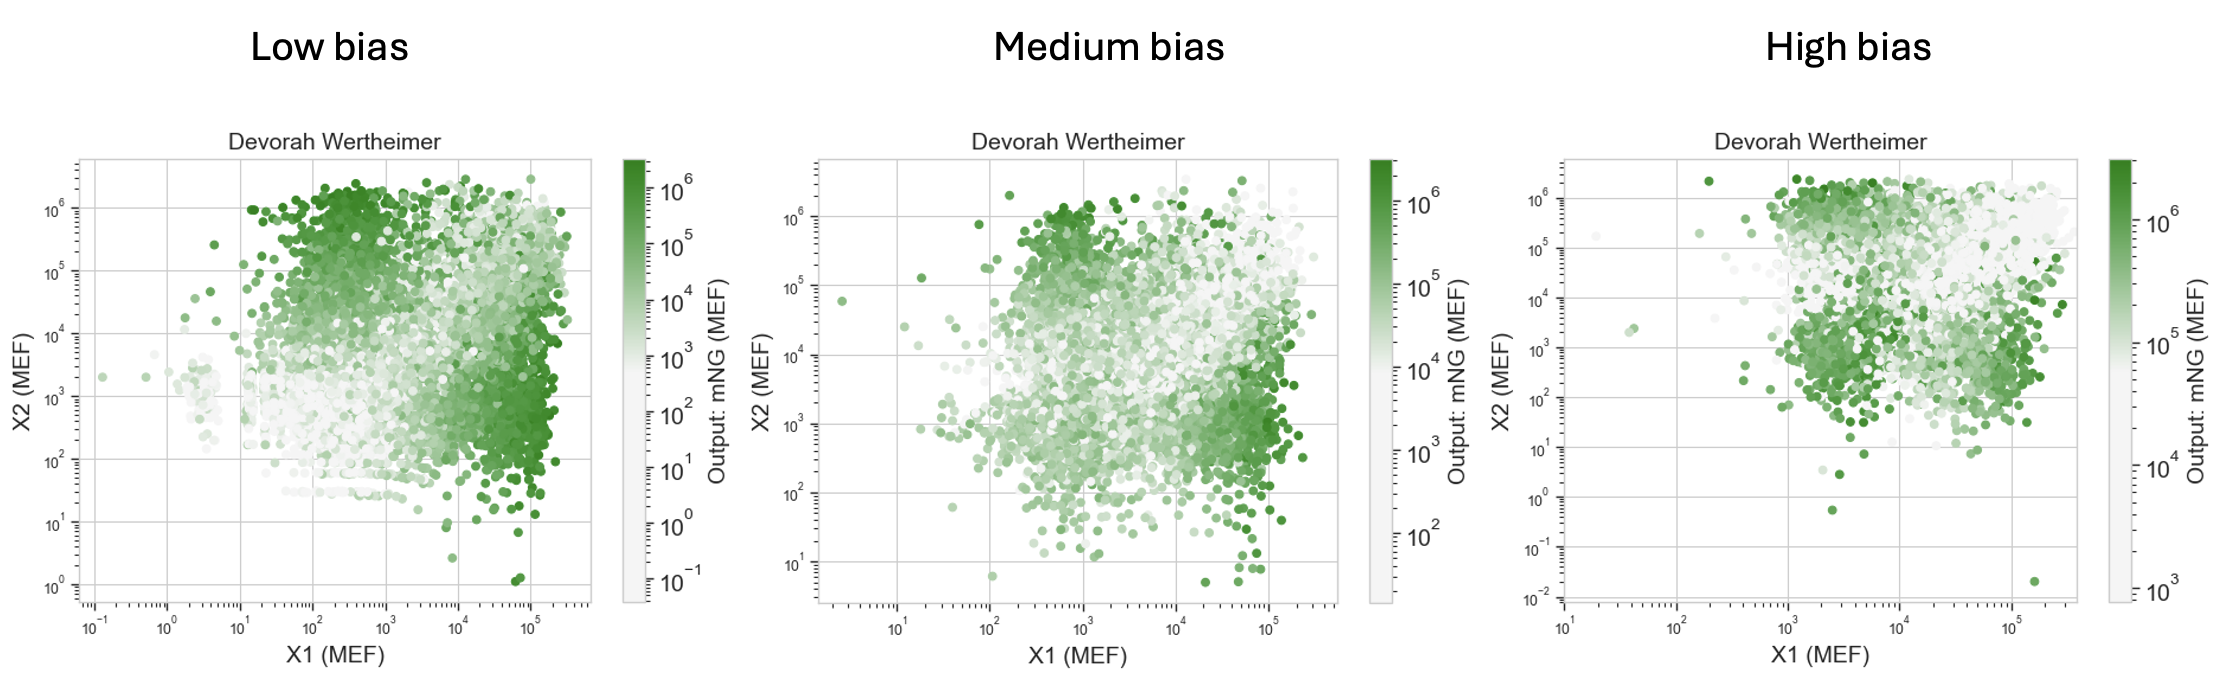
Low bias: The brightest cells clustered in the mismatched input regions — high X2 with low X1, and high X1 with low X2 — consistent with the direct mNeonGreen mRNA sources dominating output. The dual-region pattern was clearly visible.
Medium bias: Output became more evenly distributed across input space and decreased in overall intensity. At this concentration the bias competes with but does not yet dominate the direct sources, producing a flatter and less structured response.
High bias: The highest-output cells shifted toward the both-high region. With an abundance of CasE_rec_mNeonGreen available, the dominant output source became the bias mRNA, which is maximally protected precisely when both ERNs are active and mutually suppress CasE production.