Week 10 HW: Imaging and Measurement

cover image cover image

Homework: Final Project

My project will measure several aspects related to the behavior of pure chlorophyll versus when bound to water-soluble chlorophyll-binding proteins (WSCPs). The main goal is to determine whether WSCP binding changes light sensitivity, photodegradation behavior, and its subsequent reaction with iron. For this end the following measurements will be needed:

1. Correct expression of the WSCPs

First of all, to check for the expression of WSCPs, a gel electrophoresis analisys would be conducted, this would be done after purification of the protein using a platform like Revvity LabChip (as used at Ginkgo Bioworks). The preparation steps for the electrophoresis input go as follows:

  • Prepare Denaturing Solution: Prepare a mixture of Protein Express Sample Buffer and a reducing agent (if needed, such as BME, DTT, or TCEP).
  • Mix Sample with Buffer: Add 2 µL of protein sample to 7 µL of the denaturing solution in a 96-well PCR plate or 0.6 mL centrifuge tube.
  • Heat Denature: Seal the plate or tube and heat to 100°C for 5 minutes to denature the proteins.
  • Dilute and Mix: After cooling, add 35 µL of molecular biology grade water (or 32 µL for High Sensitivity) to each sample and mix by pipetting up and down.
  • Remove Bubbles: Centrifuge the sample plate at 3000 rpm for 5 minutes to eliminate bubbles, which can cause erratic results. The expected output would be 20-22 kDa per subunit. This would allow for a first assessment of correct protein expression.
2. Absorbance spectrum of chlorophyll vs chlorophyll-bound WSCPs

The next measurement I would take would be a uv–vis absorbance spectrum analisys, comparing the pure chlorophyll vs the chlorophyll-bond WSCPs. In this case I believe absorbance would be enough to determine if there was a correct folding of WSCPs and consequent binding to chlorophylls since the main absorption bands of chlorophyll, including the Soret and Qy bands, will be compared in terms of peak position, intensity, and shape. Binding to WSCP is expected to induce shifts in absorption maxima and produce sharper, more defined peaks due to the organized protein environment.

  • To prepare the samples a chlorophyll stock solution would be prepared in a suitable solvent and diluted into buffer to generate the free chlorophyll sample. The purified WSCP–chlorophyll complex would be prepared in the same buffer conditions and adjusted to comparable chlorophyll concentrations.
  • Important to understand how WSCPs influence the absorbance spectrum of chlorophyll and check if WSCPs are correctly folded and bond to chlorophyll
3. Reaction with iron of exposed chlorophyll vs exposed chlorophyll-bound WSCPs

Third, I would measure the reaction with iron after light exposure in free chlorophyll compared with chlorophyll-bound WSCPs. This is central to the photographic concept, because chlorophyll is expected to degrade under illumination into derivatives capable of chelating iron and forming a darker final product. To test this, I would expose both samples to controlled light conditions for defined times, then add iron salts under standardized conditions and monitor the reaction. This could be achieved in solution and measured by UV–Vis spectroscopy to detect changes in absorbance associated with iron complex formation, or by embedding the two different samples in polymer and performing a visual test on the change of color after reaction with iron.

  • This will indicate how the degradation of chlorophyll is carried out in pure chlorophyll vs chlorophyll-bound WSCPs
  • It will also be important to understand the differences of light sensitivity in the two samples

Homework: Waters Part I — Molecular Weight

1. Based on the predicted amino acid sequence of eGFP (see below) and any known modifications, what is the calculated molecular weight?

According to Expasy Compute pI/Mw tool the molecular weight of eGFP with added linker and His-tag is 28006.60 Da

2. Calculate the molecular weight of the eGFP using the adjacent charge state approach described in the recitation. Select two charge states from the intact LC-MS data (Figure 1)

image image 
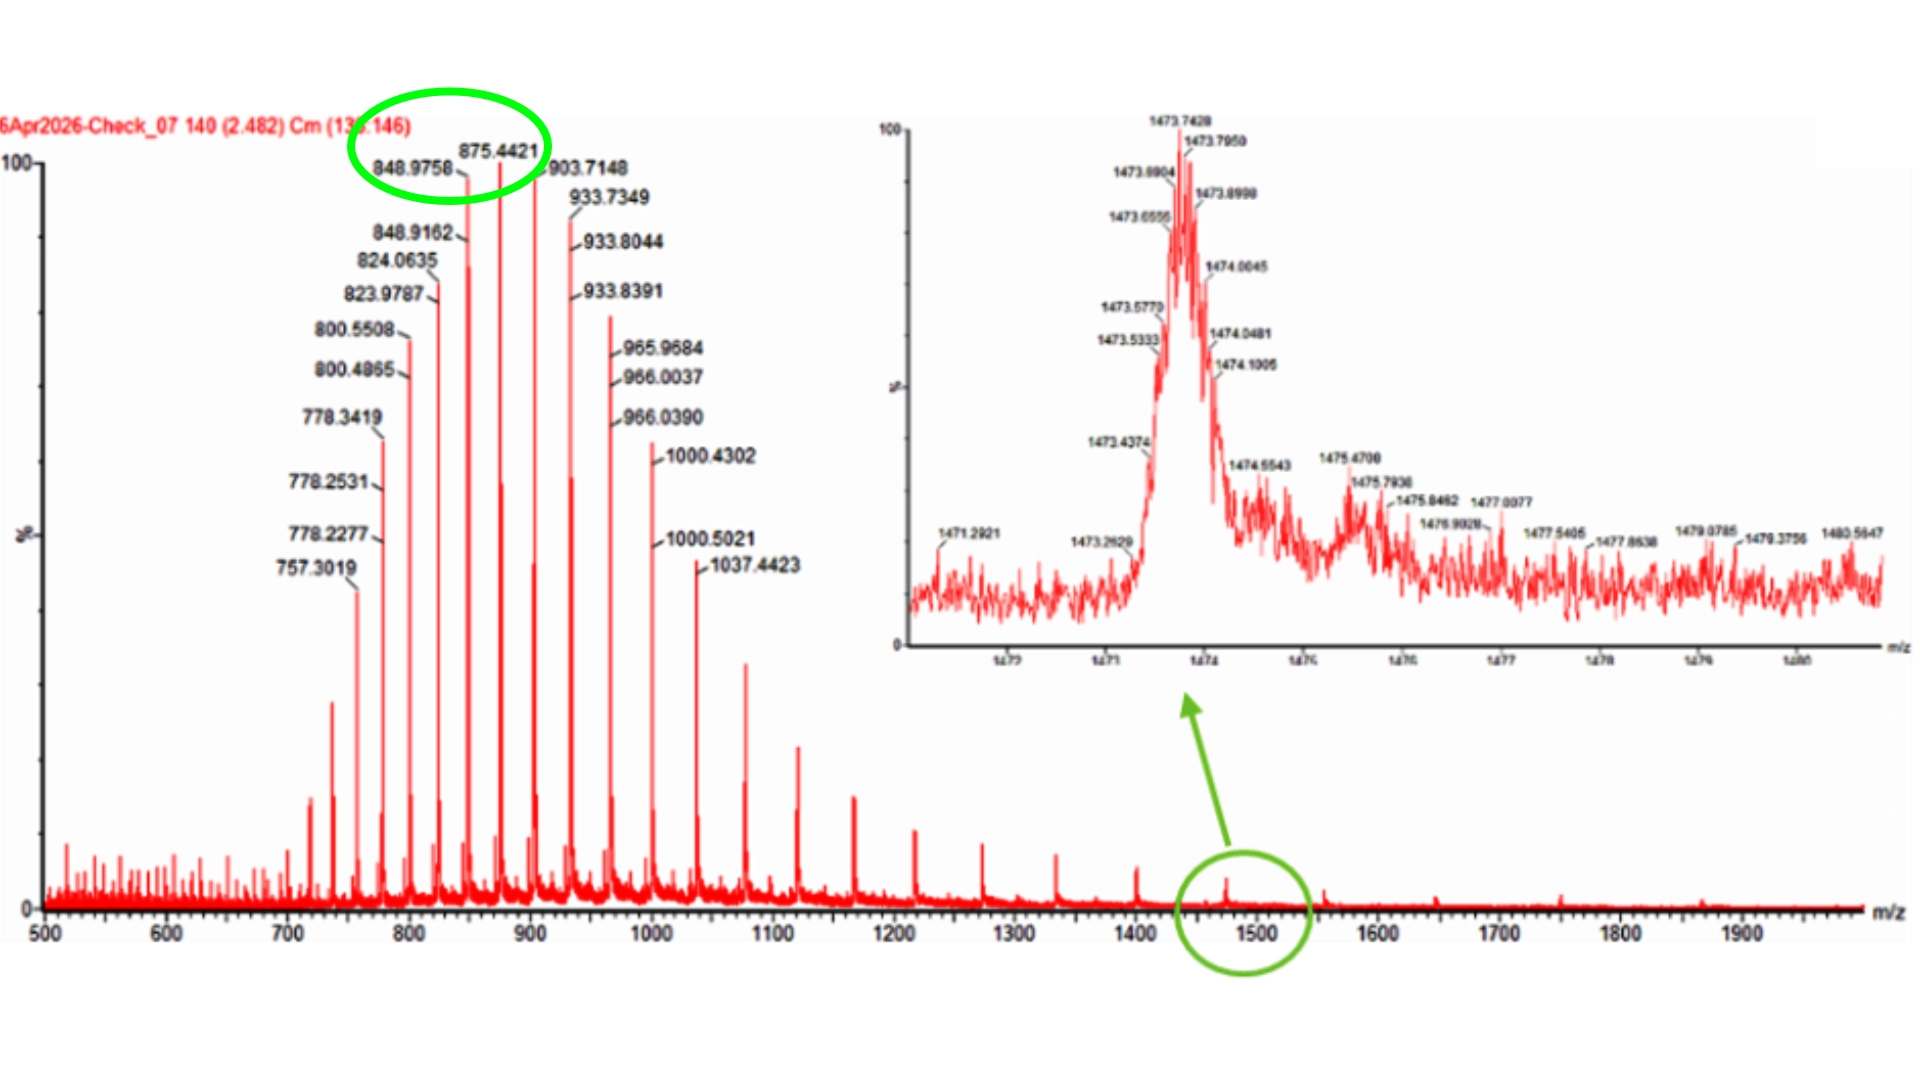
I chose to work with the two peaks circled in green

$$ \begin{aligned} z &= \frac{m/z_{n+1}}{(m/z_n - m/z_{n+1})} \ z &= \frac{848.9758}{875.4421 - 848.9758} \ z &= \frac{848.9758}{26.4663} = 32.08 \end{aligned} $$

Using the 875.4421 peak with $z = 32$:

$$ MW = 32(875.4421 - 1.0073) $$

$$ MW = 32(874.4348) $$

$$ MW \approx 27981.9\ \text{Da} $$

Check with the second peak:

$$ MW = 33(848.9758 - 1.0073) $$

$$ MW = 33(847.9685) $$

$$ MW \approx 27982\ \text{Da} $$

So the protein molecular weight is:

$$ MW \approx 27982\ \text{Da} $$

Using:

$$ \text{Accuracy} = \frac{|MW_{\text{experiment}} - MW_{\text{theory}}|}{MW_{\text{theory}}} $$

Assuming the theoretical MW of eGFP of 28006 Da, then:

$$ \text{Accuracy} = \frac{|27982 - 28006|}{28006} $$

$$ \text{Accuracy} = \frac{24}{28006} = 8.5 \times 10^{-4} $$

$$ \text{Accuracy} \approx 0.00085 $$

3. Can you observe the charge state for the zoomed-in peak in the mass spectrum for the intact eGFP? If yes, what is it? If no, why not?

No, the charge state cannot be determined for the zoomed-in peak from this figure alone. Determining the charge state requires at least two adjacent peaks, so their spacing can be used to calculate z. In the zoomed region, only a single isolated peak is shown and no neighboring charge-state peak is visible. Therefore, there is not enough information to assign its charge state.


Homework: Waters Part III — Peptide Mapping - primary structure

1. How many Lysines (K) and Arginines (R) are in eGFP? Please circle or highlight them in the eGFP sequence given in Waters Part I question 1 above.

There are 20 Lysines (K) and 6 Arginines (R) highlighted bellow:

MVSKGEEL FTG VVPILVELDG DVNGHKFSVS GEGEGDATYG KLTLKFICTT GKLPVPWPTL VTTLTYGVQC FSRYPDHMKQ HDFFKSAMPE GYVQERTIFF KDDGNYKTRA EVKFEGDTLV NRIELKGIDF KEDGNILGHK LEYNYNSHNV YIMADKQKNG IKVNFKIRHN IEDGSVQLAD HYQQNTPIGD GPVLLPDNHY LSTQSALSKD PNEKRDHMVL LEFVTAAGIT LGMDELYKLE HHHHHH

2. How many peptides will be generated from tryptic digestion of eGFP?

image image 
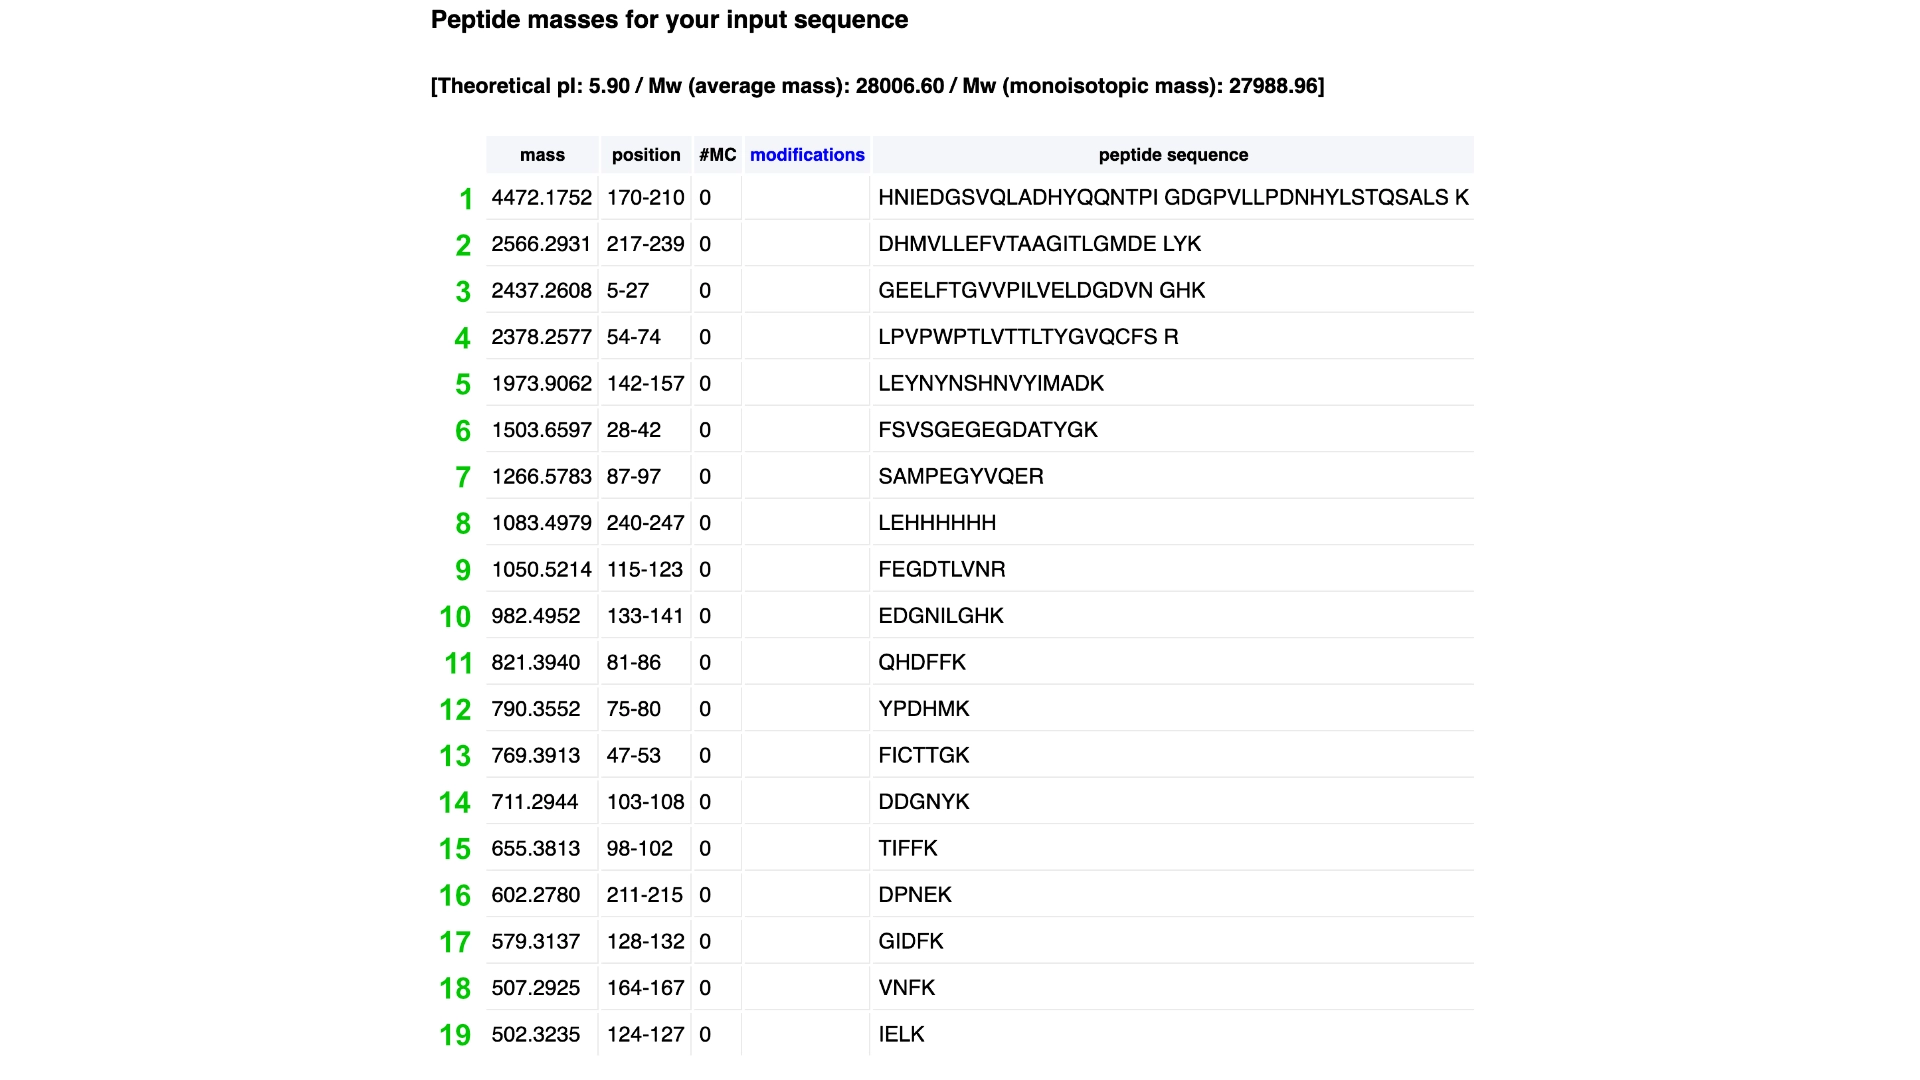
According to the Expasy PeptideMass tool, 19 peptides will be generated

3. Based on the LC-MS data for the Peptide Map data generated in lab (please use Figure 5a as a reference) how many chromatographic peaks do you see in the eGFP peptide map between 0.5 and 6 minutes? You may count all peaks that are >10% relative abundance.
image image

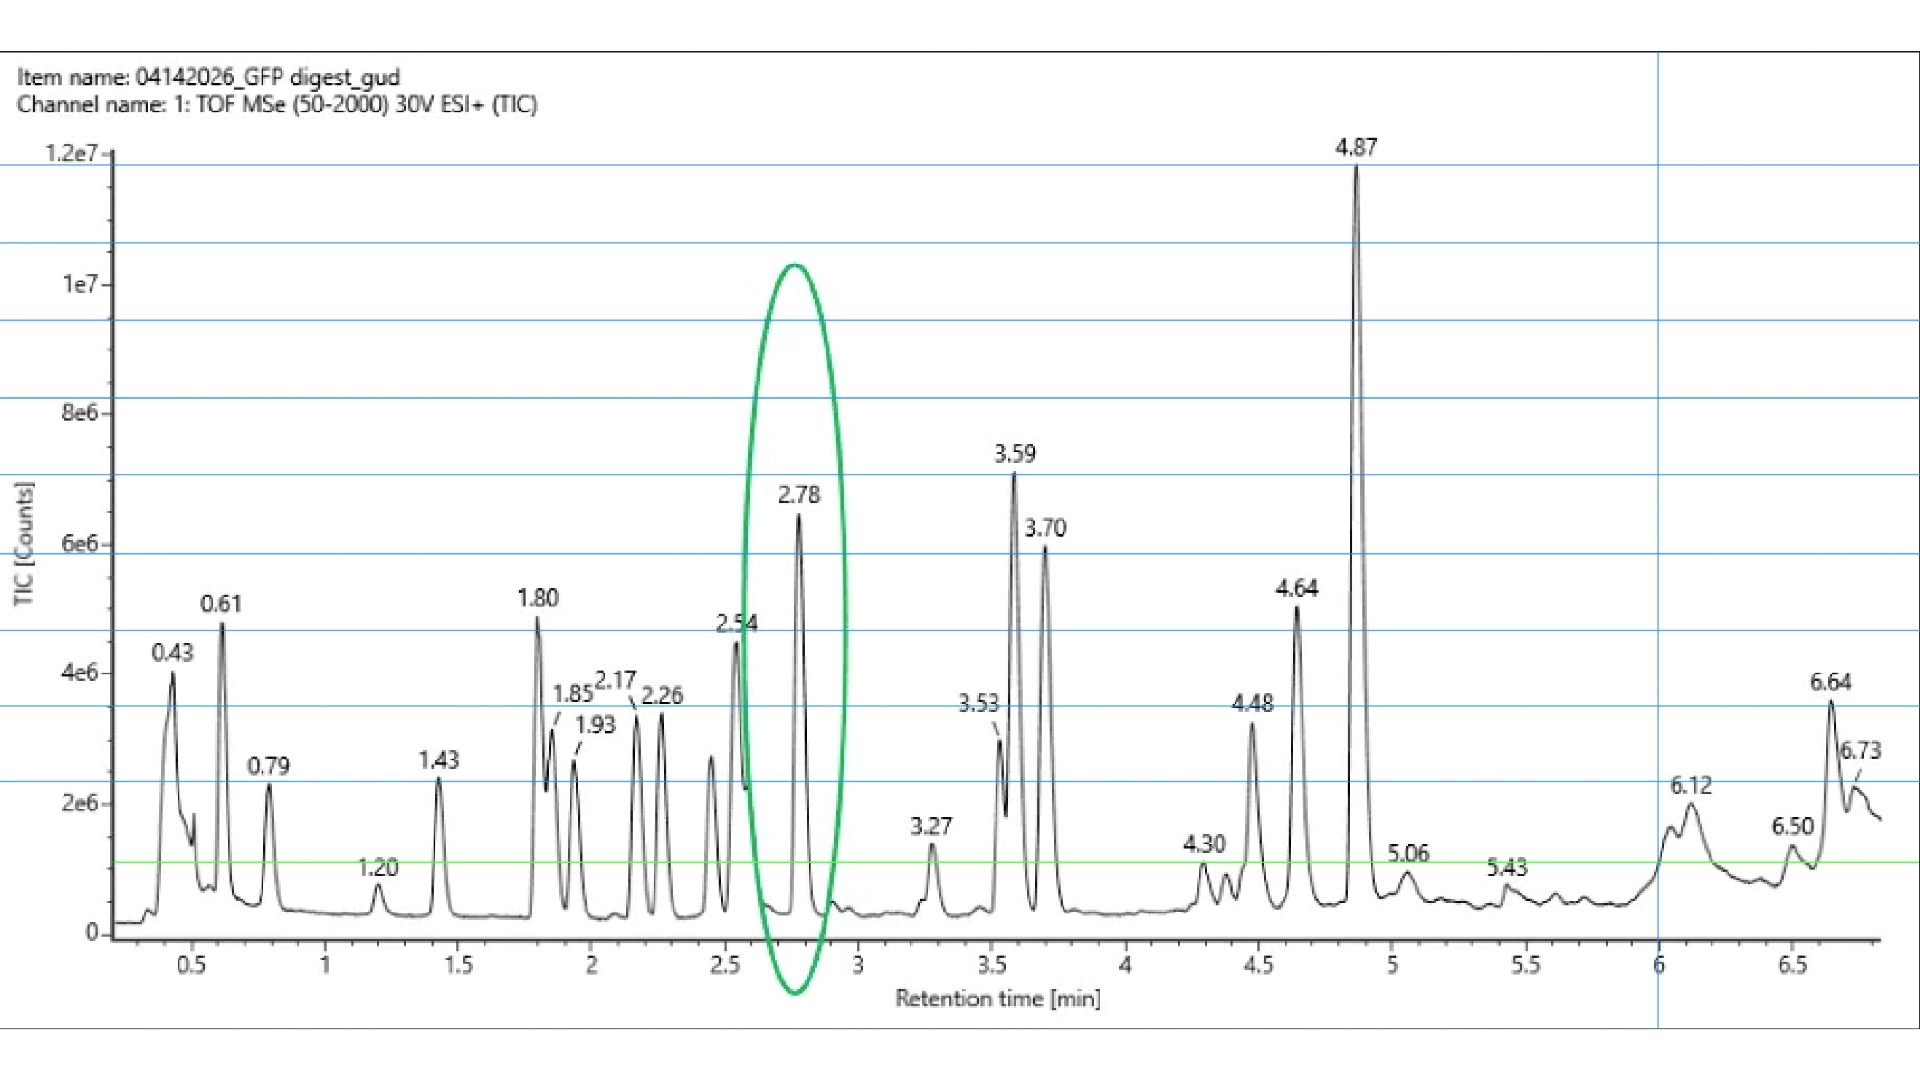
Divided the highest peak in 10

There seem to be 19, which would match the prediction

4. Assuming all the peaks are peptides, does the number of peaks match the number of peptides predicted from question 2 above? Are there more peaks in the chromatogram or fewer?

If all peaks are taken into account then there would be 22 which is more than the prediction

5. Identify the mass-to-charge of the peptide shown in Figure 5b. What is the charge of the most abundant charge state of the peptide (use the separation of the isotopes to determine the charge state). Calculate the mass of the singly charged form of the peptide ([M+H])+ based on its m/z and z.

In mass spectrometry, the instrument measures the mass-to-charge ratio (m/z) of a peptide that carries multiple protons, so to recover the true peptide mass (as the singly charged [M+H]+), we multiply the measured m/z by the charge z to remove the charge scaling and then subtract the mass of the extra proton that was added during ionization.

The most abundant peak is: $$ m/z = 525.76712 $$ Adjacent isotope peaks:

  • (526.25918 - 525.76712 = 0.49206)
  • (526.76845 - 526.25918 = 0.50927)

Average spacing ≈ 0.50 $$ \Delta(m/z) \approx \frac{1}{z} ;\Rightarrow; z \approx \frac{1}{0.5} = 2 $$ Charge state: ( z = 2 ) $$ [M + H]^+ = z(m/z) - (z - 1)\times 1.0073 $$

$$ [M + H]^+ = 2(525.76712) - 1.0073 $$

$$ [M + H]^+ = 1051.53424 - 1.0073 $$

$$ [M + H]^+ \approx 1050.53 $$

6. Identify the peptide based on comparison to expected masses in the PeptideMass tool. What is mass accuracy of measurement? Please calculate the error in ppm.

$$ MW_{\text{experiment}} = 1050.52438 $$

The closest predicted peptide mass from PeptideMass is:

$$ MW_{\text{theory}} = 1050.5214 $$ From peptide FEGDTLVNR

Predicted peptide with theoretical ([M + H]^+)

Mass accuracy calculation

$$ \text{Accuracy} = \frac{|MW_{\text{experiment}} - MW_{\text{theory}}|}{MW_{\text{theory}}} $$

$$ \text{Accuracy} = \frac{|1050.52438 - 1050.5214|}{1050.5214} $$

$$ \text{Accuracy} = \frac{0.00298}{1050.5214} = 2.84 \times 10^{-6} $$ Error in ppm

$$ \text{ppm error} = \text{Accuracy} \times 10^6 $$

$$ \text{ppm error} = 2.84 $$

Final answer

  • Observed peptide mass: 1050.52438
  • Closest predicted peptide mass: 1050.5214
  • Mass error: 2.84 ppm which is well bellow the <10ppm threshold
7. What is the percentage of the sequence that is confirmed by peptide mapping?

It’s 88%


Homework: Waters Part IV — Oligomers

Using the given subunit masses: 7FU = 340 kDa 8FU = 400 kDa

image image

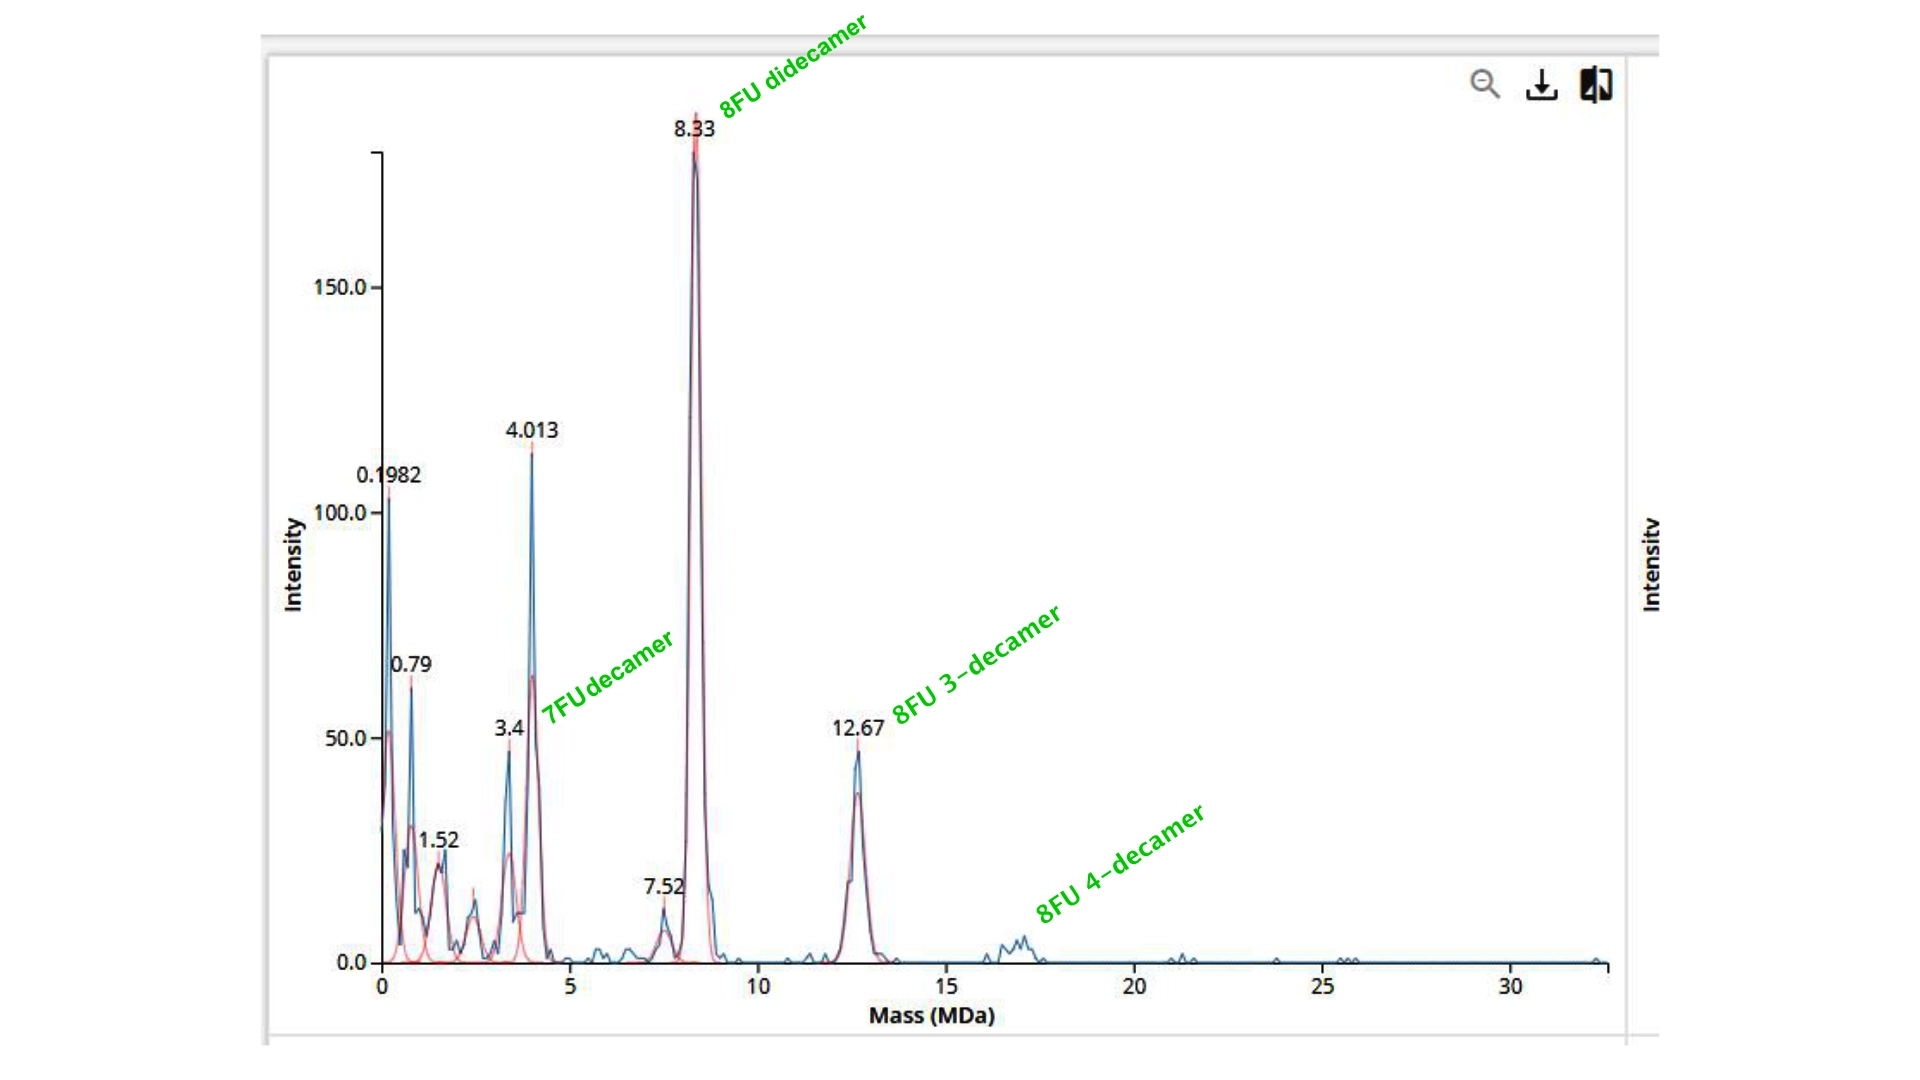
The expected oligomer masses should be:

  • 7FU decamer = 10×340=3400kDa = 3.4 MDa
  • 8FU didecamer = 20×400=8000kDa = 8.0 MDa
  • 8FU 3-decamer = 30×400=12000kDa = 12.0 MDa
  • 8FU 4-decamer = 40×400=16000kDa = 16.0 MDa — not clearly observed

Homework: Waters Part V — Did I make GFP?

Theoretical (kDa)Observed / Measured (kDa)PPM Mass Error
Molecular weight (kDa)28.00627.982857 ppm

A 857ppm error is quite large, so I also tried to predict the molecular weight without the linker and His-tag in case that wasn’t used in the experimental version, but the results would then be even worse (Theoretical (kDa) — 26941.48) with an extremely large 38,600 ppm error, so I assume that can’t be the case.

Given the 857 ppm error and that Proteins are considered confidently identified if the mass accuracy is < 50 ppm, I assume something might be off regarding the theoretical mass probably


References

Revvity LabChip

Fine tuning of chlorophyll spectra by protein-induced ring deformation