Week 9 HW: Advanced Imaging & Measurement Technology
Final Project - Measurements
Please identify at least one (ideally many) aspect(s) of your project that you will measure. It could be the mass or sequence of a protein, the presence, absence, or quantity of a biomarker, etc. Please describe all of the elements you would like to measure, and furthermore describe how you will perform these measurements. What are the technologies you will use (e.g., gel electrophoresis, DNA sequencing, mass spectrometry, etc.)? Describe in detail.
I’ll need to a way to check that the Shewanella host actually carry my modified DNA. I’ll also need to measure the electron output/electrical current produced by the Shewanella (modified and unmodified). In a more basic sense, I’ll need to measure the amount of nitrate that I put in the soil for testing, and also a way to test the nitrate in the soil - to check if it correlates with the changes in electron output by the Shewanella.
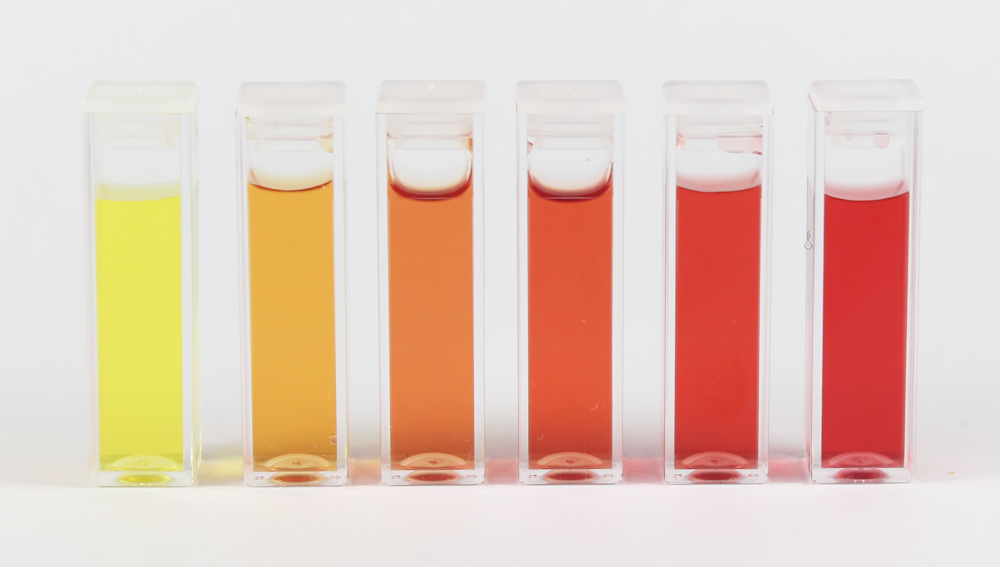
For measuring which Shewanella have been genetically modified I can use Gel Electrophoresis to make sure the DNAs are the lengths they should be, which will tell me that I have the correct DNA. I can also just sequence the DNA using Sanger sequencing to make sure manually that it is thte right DNA. For the electron current measurement I should use a potentiostat which can detect small levels of current. From that I can also calculate the power density. This should give me a good iea of what type of simple circuit could be powered by this. Measuring the nitrate can be done with color-based chemical test kits called “colorimetric nitrate assay kits” that you can easily purchase and is pictured below.
Waters Part I — Molecular Weight
1. Based on the predicted amino acid sequence of eGFP (see below) and any known modifications, what is the calculated molecular weight?
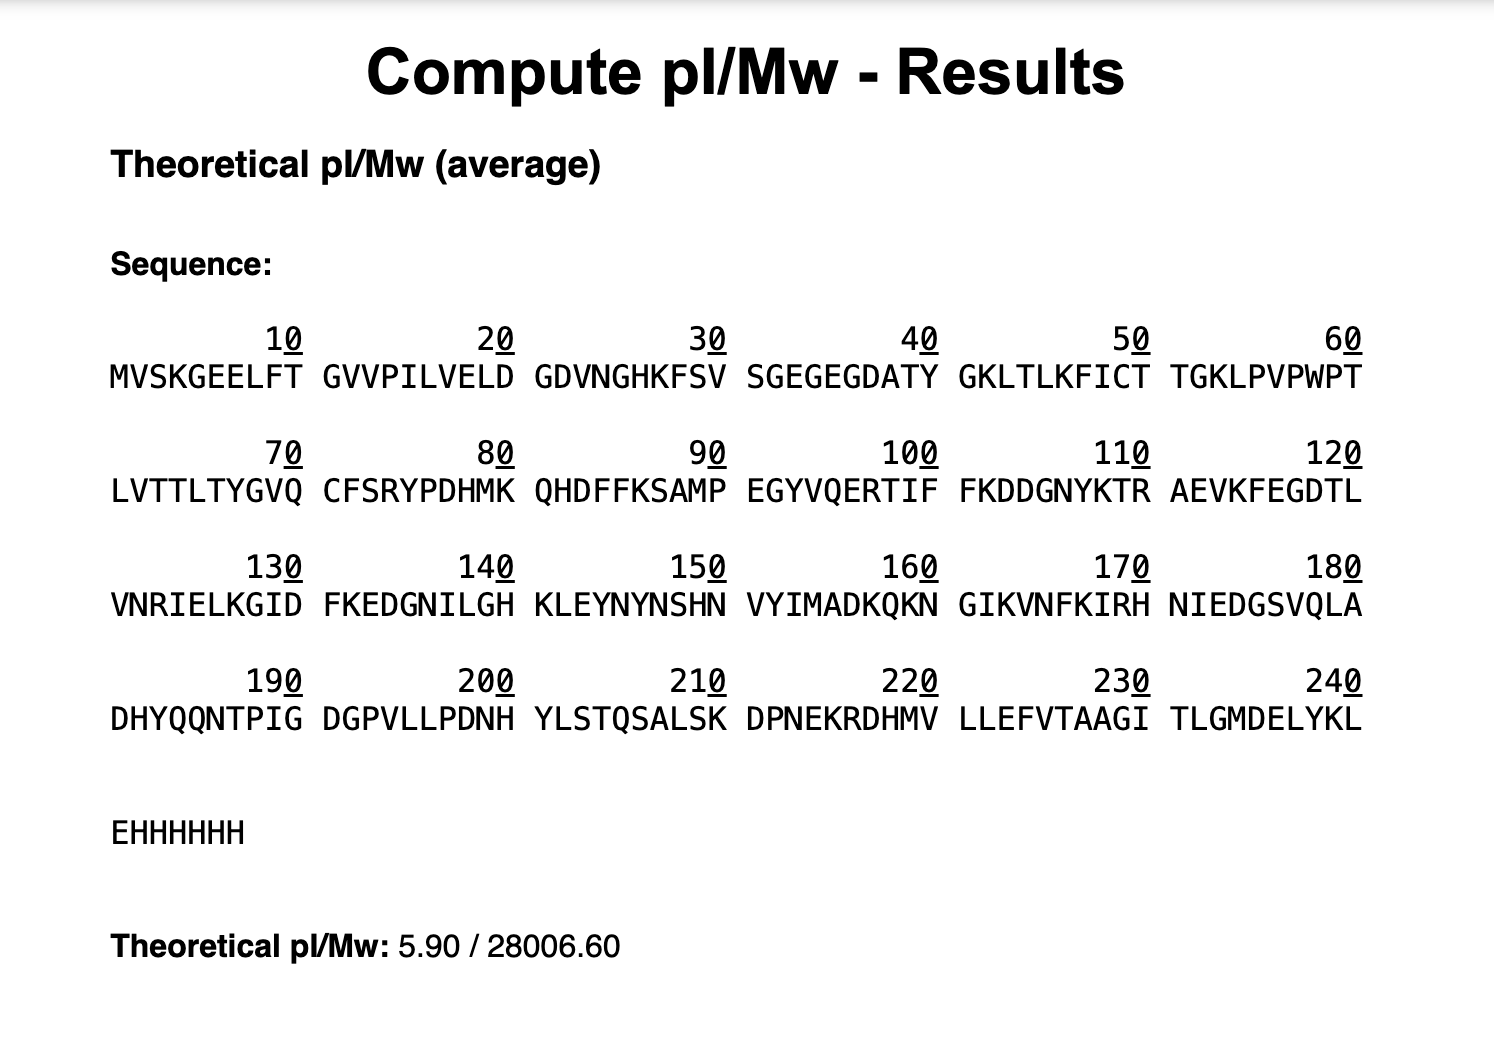
Using the online calculator the theoreatical pI (isoelectric point) is 5.90 and the Theoretical Mw (molecular weight) is 28,006.60 Da.
2. Calculate the molecular weight of the eGFP using the adjacent charge state approach described in the recitation
a. Determine z for each adjacent pair of peaks
I'm going to choose the 2 adjacent peaks:
903.7148 and 933.7349

By plugging that into the formula I get:

z = 903.7148 / (933.7349 − 903.7148)
z = 903.7148 / 30.0201
z = 30.10 ≈ 30
b. Determine the MW of the protein using the relationship between m/zn, MW, and z.
1.008 Da is the mass of a single proton (H+)

So we take this formula: m/zn = (MW + z × 1.008) / z

and then we can rearrange it to get: MW = z × (m/zn) − z × 1.008
30 x 933.7349 - 30 x 1.008MW
= 28,012.05 − 30.24MW
= 27,981.81 Da
c. Calculate the accuracy of the measurement using the deconvoluted MW from 2.2 and the predicted weight of the protein from 2.1 using the formula.
28,006.60 Da from the calculator and 27,981.81 Da from the calculations.

Accuracy = abs(27,981.81 − 28,006.60) / 28,006.60
= 24.79 / 28,006.60
= 0.00089
or 0.089% accuracy.
Waters Part III — Peptide Mapping - primary structure
1. How many Lysines (K) and Arginines (R) are in eGFP? Please circle or highlight them in the eGFP sequence given in Waters Part I question 1 above.
By putting the eGFP sequence into Benchling we can see that there are 20 Lysines (K) and 6 Argine (R):
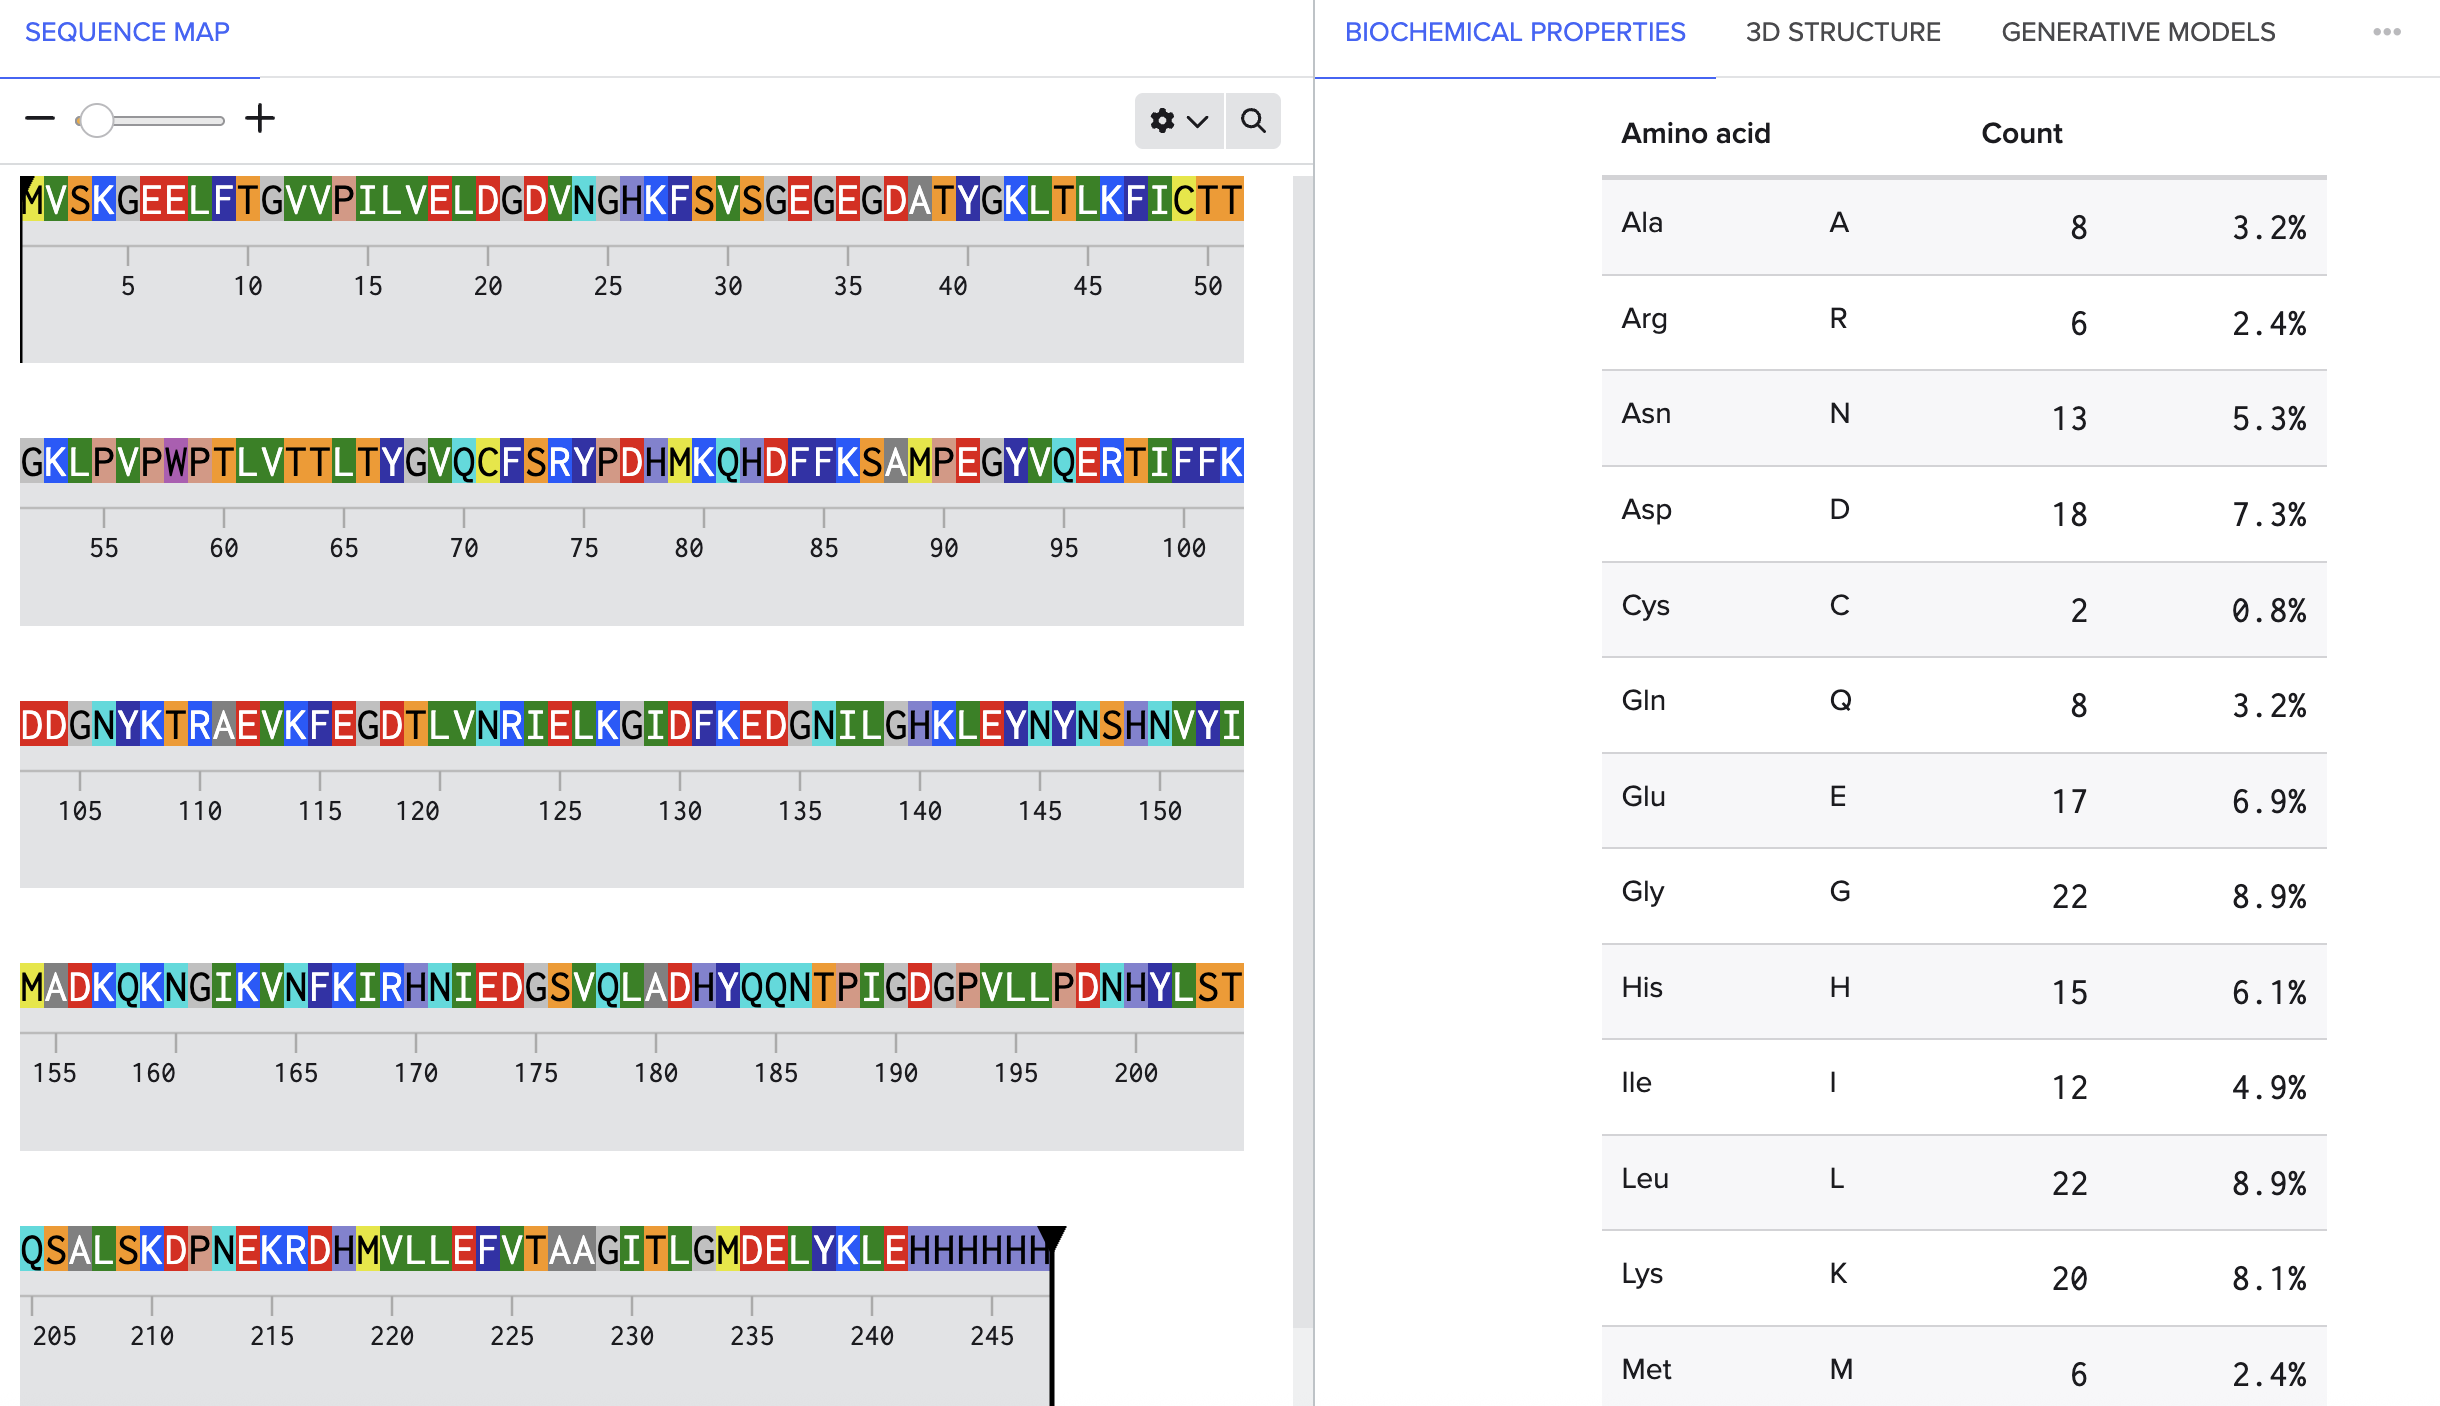
However just by manually counting them I get 16 Lysines (K) and 6 Argine (R)
MVSKGEELFTG VVPILVELDG DVNGHKFSVS GEGEGDATYG KLTLKFICTT GKLPVPWPTL VTTLTYGVQC FSRYPDHMKQ HDFFKSAMPE GYVQERTIFF KDDGNYKTRA EVKFEGDTLV NRIELKGIDF KEDGNILGHK LEYNYNSHNV YIMADKQKNG IKVNFKIRHN IEDGSVQLAD HYQQNTPIGD GPVLLPDNHY LSTQSALSKD PNEKRDHMVL LEFVTAAGIT LGMDELYKLE HHHHHH
2. How many peptides will be generated from tryptic digestion of eGFP?
a. Navigate to https://web.expasy.org/peptide_mass/ b. Copy/paste the sequence above into the input box in the PeptideMass tool to generate expected list of peptides. c. Use Figure 4 below as a guide for the relevant parameters to predict peptides from eGFP. d. Click “Perform the Cleavage” button in the PeptideMass tool and report the number of peptides generated when using trypsin to perform the digest.
Here is the list of generated peptide given by Expasy:
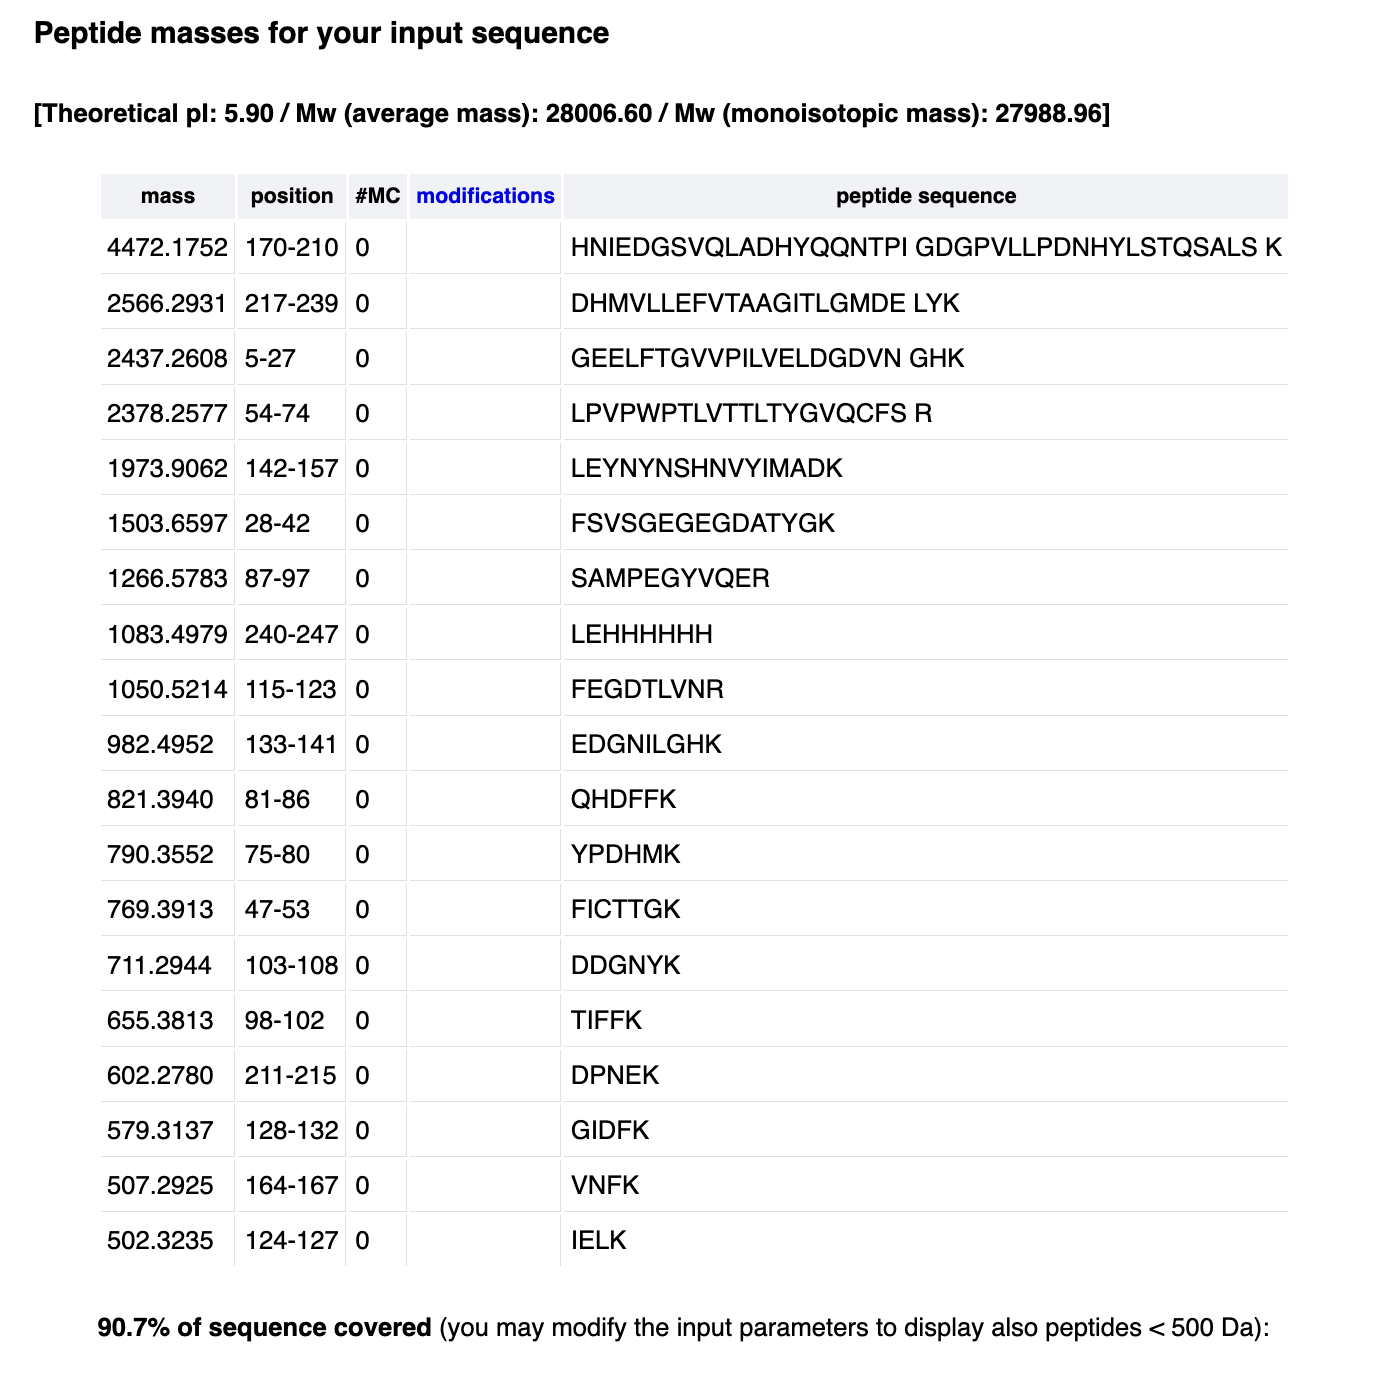
When using trypsin to perform the digest we end up with about 19 peptides.
Based on the LC-MS data for the Peptide Map data generated in lab (please use Figure 5a as a reference) how many chromatographic peaks do you see in the eGFP peptide map between 0.5 and 6 minutes? You may count all peaks that are >10% relative abundance.
There are about 23 chromatogrphic peaks in the eGFP peptide map (between 0.5 and 6 minutes).
Assuming all the peaks are peptides, does the number of peaks match the number of peptides predicted from question 2 above? Are there more peaks in the chromatogram or fewer?
There are slightly more peaks than peptides! But this might also be because I counted a cluster of peaks as multiple separate peaks. If I didn’t do that and clumped them into one peak it would be a similar number to the count of peptides.
Identify the mass-to-charge (m/2) of the peptide shown in Figure 5b. What is the charge (z) of the most abundant charge state of the peptide (use the separation of the isotopes to determine the charge state). Calculate the mass of the singly charged form of the peptide (|M+H|+) based on it’s m/2 and z.
The tallest peak (and therefore most abundant charge state) is at m/z = 525.76712.
Calculating the mass of the singly charged form of the peptide is a bit trickier.
(|M+H|+) is basically just describing the peptide if it carried just one charge (the +).
Okay this is a bit confusing but basically in the zoomed in part of the graph we can see that the graphs are approximately ~0.5 units apart from each other. And the spectrum shows these units at 1/z apart.
We can then solve this equation by doing:
Identify the peptide based on comparison to expected masses in the PeptideMass tool. What is mass accuracy of measurement? Please calculate the error in ppm.
I found the closest matching peptide based on calculated mass:
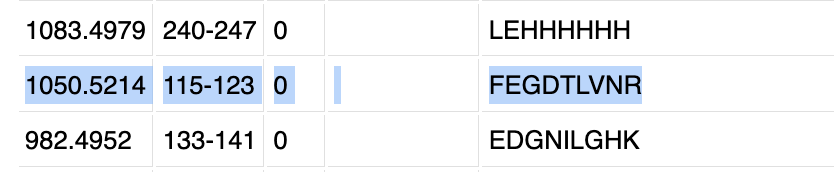
From the fragmentation spectrum we have MW_Experiment = 1050.52438
From the PeptideMass tool we have MW_Theory = 1050.5214
By plugging it into the formula we get:
In ppm that would be 9.5 ppm!
What is the percentage of the sequence that is confirmed by peptide mapping? (see Figure 6)
According to Figure 6 the percentage sequence that was detected by the peptide mapping is 88%. So basically this means that the peptide mapping detected about 216 of 246 total amino acids that make up eGFP.
Waters Part IV — Oligomers
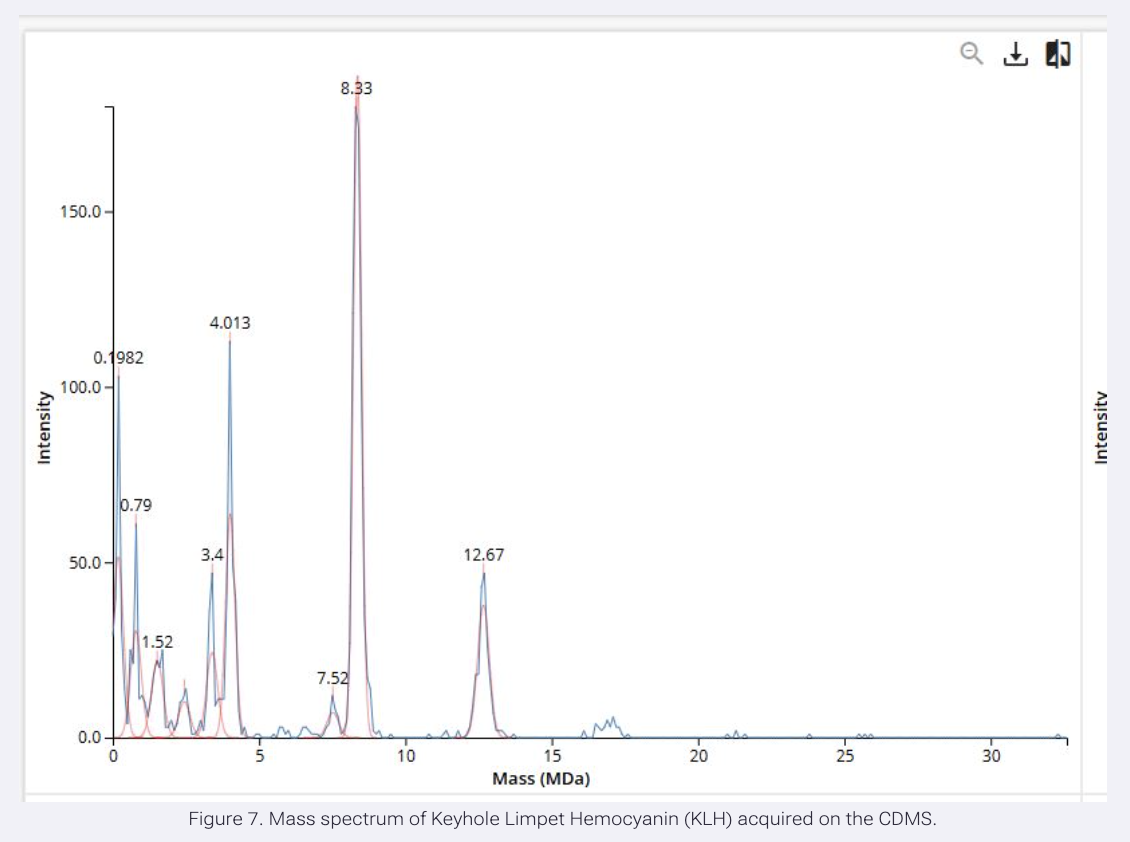
We will determine Keyhole Limpet Hemocyanin (KLH)’s oligomeric states using charge detection mass spectrometry (CDMS). CDMS single-particle measurements of KLH allow us to make direct mass measurements to determine what oligomeric states (that is, how many protein subunits combine) are present in solution. Using the known masses of the polypeptide subunits (Table 1) for KLH, identify where the following oligomeric species are on the spectrum shown below from the CDMS (Figure 7):
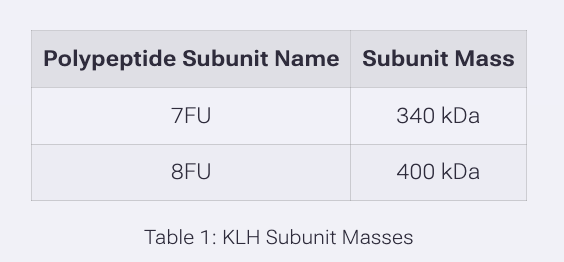
7FU Decamer
The 7FU subunit has a mass of 340 kDa Decamer refers to 10 units so you multiple 340 kDa by 10. Which is 3,400 kDa or 3.4 MDa.
So it’s at intensity 50 on the graph.
8FU Didecamer
The 8FU has a mass of 400 kDa Didecamer refers to 20 units so multiply 20 x 400kDA 20 × 400 kDa = 8,000 kDa = 8.0 MDa
Which roughly correspond to the tallest peak in the graph
8FU 3-Decamer
400 kDA x 30 = 12,000 kDa = 12.0 MDa
Which corresponds to the 12.67 peak one of the last ones on the graph.
8FU 4-Decamer
400 kDA x 40 16,000 kDa = 16.0 MDa
It’s not labeled on the graph but I’m pretty sure you can see this on the graph it’s the last visible peak.
Waters Part V — Did I make GFP?
Please fill out this table with the data you acquired from the lab work done at the Waters Immerse Lab in Cambridge, or else the data screenshots in this document if you were unable to have lab work done at Waters.
| Theoretical | Observed/measured on the Intact LC-MS | PPM Mass Error | |
|---|---|---|---|
| Molecular weight (Da) | 27,988.96 | 27,981.81 | ~255 ppm |
From Expasy I can see that the (monoisotopic mass) = 27,988.96
From Question 2 I calculated: 27,981.81 Da so that’s what I’m using for observed since I didn’t get the lab work done at Waters.