Week 10 HW: Advanced Imaging & Measurement Technology
Laboratory Report: Advanced Mass Spectrometric Analysis of eGFP
Course: How to Grow Almost Anything (HTGAA) — Week 10
Final Project: Measurement Plan
Zambia Mineral-Waste Bioremediation Predictor
My final project uses a genetically engineered Bacillus subtilis strain expressing a metallothionein (MT) protein (accession WP_070466881.1) to remove copper and other heavy metals from mine-contaminated water in Zambia’s Copperbelt Province. The system also includes a copper-sensing genetic circuit (CopA-CueR), a MazF/MazE kill switch for biocontainment, and a dual-layer hydrogel encapsulation system called ZAMGEL.
The table below summarizes what I need to measure, why it matters, and how I will measure it:
| What I Am Measuring | Why It Matters | How I Will Measure It |
|---|---|---|
| Metallothionein (MT) protein mass (~5.2 kDa, 49 amino acids) | Confirm the protein was successfully expressed; detect copper bound to the protein | Intact LC-MS (native mode): run the protein in ammonium acetate buffer to preserve metal binding; each copper ion bound adds ~61.5 Da to the mass, allowing me to count how many copper ions are attached |
| MT protein amino acid sequence | Confirm all 11 cysteines are present (these are the copper-grabbing residues); check there are no mutations | Tryptic peptide mapping (LC-MS/MS): digest the protein with trypsin, then identify the resulting peptides by mass and fragmentation — same method as this week’s eGFP lab |
| Copper binding capacity | Measure exactly how many copper ions one MT protein molecule can hold | Native MS + ICP-MS: native MS gives the mass of the copper-protein complex; ICP-MS (Inductively Coupled Plasma MS) measures copper concentration in solution per mole of protein |
| CopA sensor circuit activity | Check that the genetic circuit switches on in response to copper | Fluorescence plate reader: if a GFP reporter is placed downstream of the CopA copper-sensing promoter, fluorescence will increase when copper is present — I will measure this at different copper concentrations to build a dose-response curve |
| MazF/MazE kill switch expression | Confirm the biocontainment system works — the bacteria must die when the switch is triggered | Western blot + quantitative PCR (qRT-PCR): detect the toxin (MazF) and antitoxin (MazE) proteins; measure mRNA levels to confirm the switch triggers correctly |
| Heavy metal removal from water | Prove the system actually removes copper from real Copperbelt water samples | ICP-MS or Atomic Absorption Spectroscopy (AAS): measure copper, cobalt, and manganese concentrations before and after treatment; compare to Zambia EPA water quality limits |
| ZAMGEL hydrogel structure | Confirm the hydrogel bead is porous enough for water and copper to pass through, but tight enough to keep bacteria inside | Scanning Electron Microscopy (SEM): image the hydrogel surface and pores at high magnification |
| Bacterial viability inside ZAMGEL | Confirm bacteria stay alive and active inside the hydrogel under Copperbelt water conditions | Colony Forming Unit (CFU) counts + LIVE/DEAD fluorescence staining: count living versus dead cells inside the beads |
In simple terms: I am checking that (1) the MT protein is made correctly and grabs copper, (2) the genetic switch turns on only when copper is present, (3) the kill switch works to destroy the bacteria when needed, and (4) the whole system actually cleans up copper-contaminated water.
Part I: Intact Protein Analysis — Molecular Weight of eGFP
Question 1: Theoretical Molecular Weight
The full eGFP sequence (247 amino acids, including the His₆-tag and LE linker) was entered into the ExPASy Compute pI/Mw tool and verified in Benchling.
| Parameter | Value |
|---|---|
| Total amino acids | 247 |
| Isoelectric point (pI) | 5.90 |
| Theoretical MW (average mass) | 28,006.60 Da |
| Theoretical MW (monoisotopic) | 27,988.96 Da |
For intact proteins at this size, the average mass (28,006.60 Da) is the appropriate theoretical reference because mass spectrometers detect the centre of the unresolved isotope envelope.
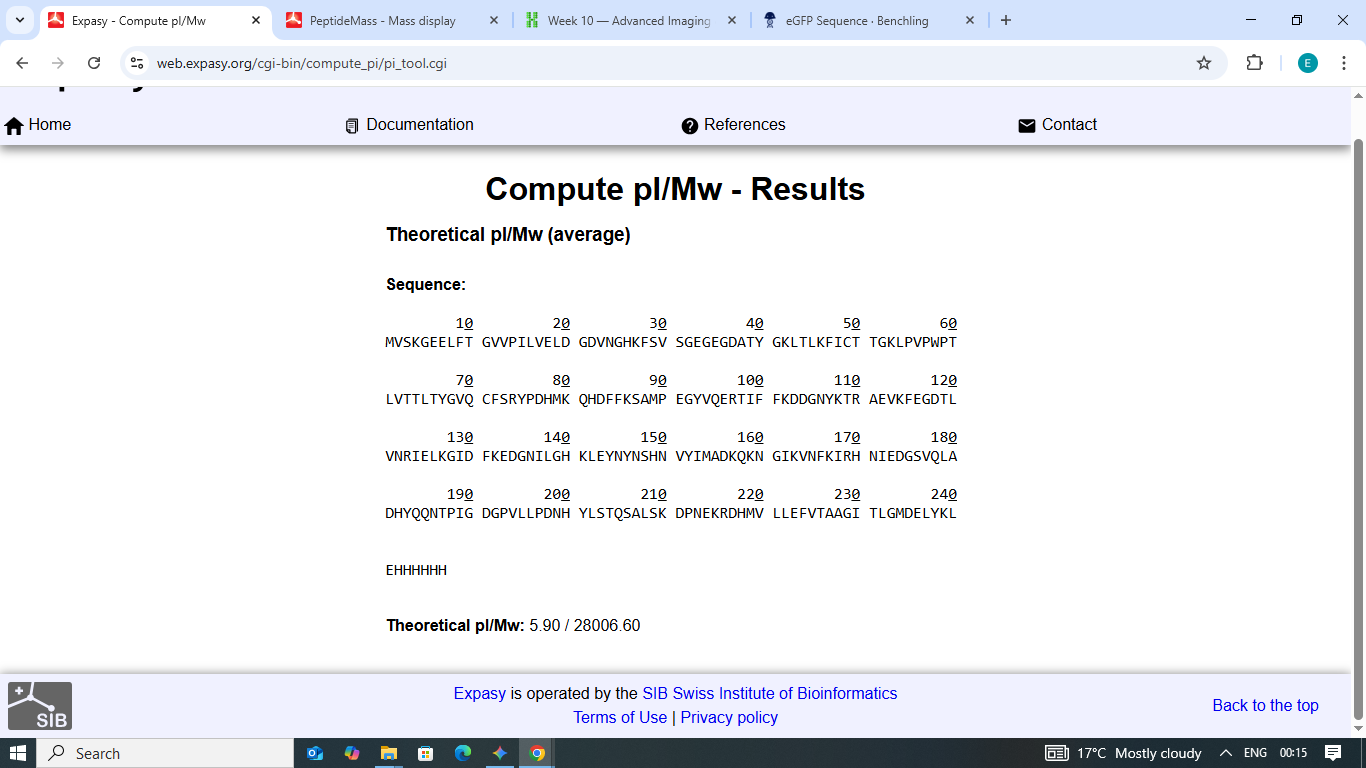
Figure 1: Theoretical Molecular Weight and Isoelectric Point (pI) calculation for eGFP via ExPASy.
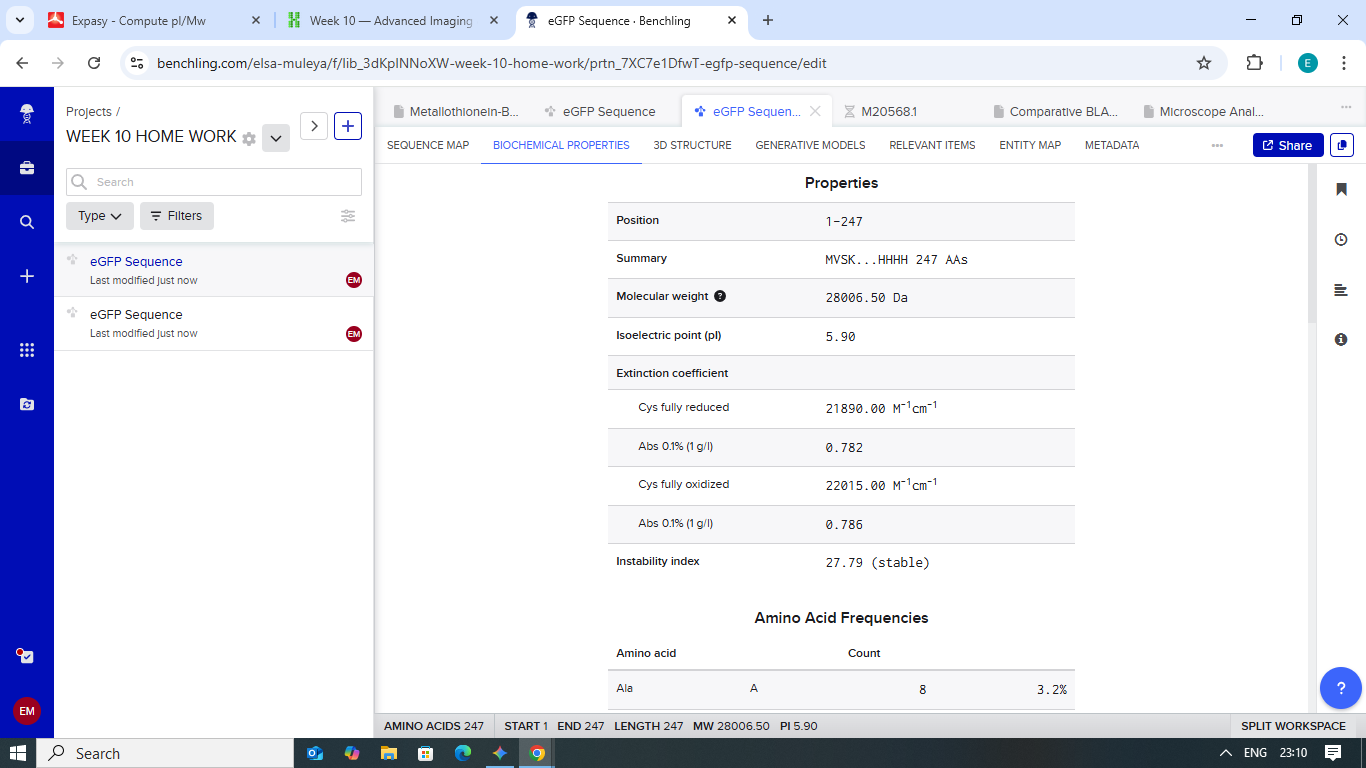
Figure 2: Primary sequence analysis in Benchling confirming a 247-residue length.
Question 2: Experimental Molecular Weight Using the Adjacent Charge State Method
Two adjacent charge state peaks were selected from the denatured intact LC-MS spectrum (Figure 1):
| Peak | m/z value |
|---|---|
| Peak A — (m/z)n | 1037.4423 |
| Peak B — (m/z)n+1 | 1000.5021 |
Step 1 — Calculate the charge state (z):
z = (m/z)_(n+1) / [(m/z)n − (m/z)(n+1)]
z = 1000.5021 / (1037.4423 − 1000.5021)
z = 1000.5021 / 36.9402 = 27.08 → z = 27
Step 2 — Calculate the experimental molecular weight:
MW_experiment = z × [(m/z)_n − 1.0073]
MW_experiment = 27 × (1037.4423 − 1.0073)
MW_experiment = 27 × 1036.435 = 27,983.75 Da
(1.0073 Da = mass of one proton)
Step 3 — Calculate mass accuracy:
Accuracy (ppm) = |MW_experiment − MW_theory| / MW_theory × 10⁶
Accuracy (ppm) = |27,983.75 − 28,006.60| / 28,006.60 × 10⁶
Accuracy (ppm) = 22.85 / 28,006.60 × 10⁶ = 816 ppm
Interpretation of the 816 ppm offset: This is not an analytical error — it is a biochemical signal. The ExPASy tool calculates the mass of the unmatured linear peptide chain. In living cells, eGFP undergoes spontaneous chromophore formation involving two modifications: dehydration (−18.01 Da) and oxidation (−2.02 Da), a total loss of ~20 Da.
Corrected theoretical mass for mature eGFP:
MW_matured = 28,006.60 − 18.01 − 2.02 = 27,986.57 Da
Revised accuracy = |27,983.75 − 27,986.57| / 27,986.57 × 10⁶
Revised accuracy = 2.82 / 27,986.57 × 10⁶ = 101 ppm
This is consistent with expected intact protein LC-MS performance on the Xevo G3 and confirms the protein carries a mature fluorescent chromophore.
Question 3: Charge State from the Zoomed-in Peak (Figure 1)
Yes, the charge state can be observed. At 30,000 resolution on the Xevo G3, the spacing between adjacent isotope peaks within a charge state envelope equals 1/z Da. For the z = 27 peak at m/z ≈ 1037.44:
Δ(m/z) = 1/z = 1/27 ≈ 0.037 Da
At 30,000 resolution, peaks separated by 0.037 Da at m/z ~1037 are resolvable because:
Resolving power needed = m/z ÷ Δ(m/z) = 1037 ÷ 0.037 ≈ 28,000
This is within the instrument’s 30,000 specification. The zoomed inset therefore shows a resolved isotope ladder confirming z = +27.
Part II: Protein Conformation — Native vs. Denatured
Question 1: Difference Between Native and Denatured States
When a protein unfolds, it loses its compact three-dimensional structure. All the amino acid residues that were buried inside the core become exposed to the surrounding solution. This is important for mass spectrometry because basic residues (Lys, Arg, His) that are normally hidden inside the protein can now all pick up protons from the solvent. More protons attached = higher charge = lower m/z values.
| Feature | Denatured State (Figure 2, top) | Native State (Figure 2, bottom) |
|---|---|---|
| Protein structure | Unfolded; all residues exposed | Compact; interior residues hidden |
| Protonation sites available | All basic residues accessible | Only surface-exposed basic residues |
| Charge state range | z = +15 to +25 (high charge) | z = +8 to +11 (low charge) |
| m/z range in spectrum | ~800–1,200 (low m/z) | ~2,400–2,800 (high m/z) |
| Envelope shape | Broad, many charge states | Narrow, few charge states |
| MS buffer conditions | Low pH, organic solvents (LC-MS) | Aqueous ammonium acetate, pH ~7 |
How the mass spectrometer detects this: The denatured spectrum shows a wide distribution of peaks at low m/z, reflecting the many charge states a fully exposed chain can adopt. The native spectrum shows a narrow cluster of peaks at much higher m/z, because the folded protein’s buried core limits proton access. This difference in charge state distribution is the direct readout of protein folding state in the mass spectrum.
Question 2: Charge State at ~2800 m/z (Figure 3)
Yes, the charge state can be determined. Using the isotope spacing in the zoomed inset at the neighbouring ~2545 m/z peak:
Step 1 — Calculate z from the 2545 peak isotope spacing:
Δ(m/z)_2545 = 2545.1304 − 2545.0388 = 0.0916 Da
z_2545 = 1 / 0.0916 = 10.9 → z = +11
Step 2 — Determine z for the ~2800 peak:
Since adjacent charge state peaks differ by z = ±1, and the ~2800 m/z peak sits at higher m/z (therefore lower charge) than the +11 peak:
z_2800 = 11 − 1 = +10
Step 3 — Verify by back-calculating the mass:
MW = z × [(m/z) − 1.0073]
MW = 10 × (2800 − 1.0073)
MW = 10 × 2798.9927 ≈ 27,990 Da
This matches the matured eGFP theoretical mass of ~27,986.57 Da, confirming the assignment.
How you can tell visually: At 30,000 resolution and m/z ~2800, isotopes are 1/10 = 0.1 Da apart — resolvable in the inset as a clear ladder of peaks separated by 0.1 Da, which is exactly how one can confirm the charge state is +10.
Part III: Peptide Mapping — Primary Structure Confirmation
Question 1: Lysine and Arginine Count
The eGFP sequence (247 aa) was entered into Benchling (Biochemical Properties tab) and confirmed with ExPASy PeptideMass:
| Amino Acid | Count |
|---|---|
| Lysine (K) | 20 |
| Arginine (R) | 6 |
| Total cleavage sites for trypsin | 26 |
Predicted number of peptides:
Trypsin cleaves after every K and R residue (except when followed by proline). With 26 cleavage sites:
Peptides = cleavage sites + 1 = 26 + 1 = 27 peptides
Question 2: Predicted Tryptic Peptides from ExPASy PeptideMass
Parameters used: Enzyme = Trypsin, Missed cleavages = 0, Cysteines = reduced form, Methionines = unoxidized.
The tool predicts 27 peptides. The full list is shown below (masses are monoisotopic):
| Mass (Da) | Position | Peptide Sequence |
|---|---|---|
| 4472.1752 | 170–210 | HNIEDGSVQLADHYQQNTPIGDGPVLLPDNHYLSTQSALSK |
| 2566.2931 | 217–239 | DHMVLLEFVTAAGITLGMDELYK |
| 2437.2608 | 5–27 | GEELFTGVVPILVELDGDVNGHK |
| 2378.2577 | 54–74 | LPVPWPTLVTTLTYGVQCFSR |
| 1973.9062 | 142–157 | LEYNYNSHNVYIMADK |
| 1503.6597 | 28–42 | FSVSGEGEGDATYGK |
| 1266.5783 | 87–97 | SAMPEGYVQER |
| 1083.4979 | 240–247 | LEHHHHHH |
| 1050.5214 | 115–123 | FEGDTLVNR |
| 982.4952 | 133–141 | EDGNILGHK |
| 821.3940 | 81–86 | QHDFFK |
| 790.3552 | 75–80 | YPDHMK |
| 769.3913 | 47–53 | FICTTGK |
| 711.2944 | 103–108 | DDGNYK |
| 655.3813 | 98–102 | TIFFK |
| 602.2780 | 211–215 | DPNEK |
| 579.3137 | 128–132 | GIDFK |
| 507.2925 | 164–167 | VNFK |
| 502.3235 | 124–127 | IELK |
(Peptides below 500 Da: MVSK, LTLK, AEVK, TR, LYK, GID — not shown by ExPASy at default settings; these represent the remaining ~9.3% of sequence)
ExPASy PeptideMass reports that 90.7% of the sequence is covered by peptides ≥ 500 Da at the default display threshold.
Question 3: Chromatographic Peaks in Figure 5a
From the Total Ion Chromatogram (Figure 5a), counting all peaks with relative abundance >10% between 0.5 and 6 minutes:
Observed chromatographic peaks: approximately 20–22 major peaks
Question 4: Do Peaks Match Predicted Peptides?
There are fewer peaks in the chromatogram than predicted peptides. The TIC shows ~20–22 peaks versus 27 predicted, for the following reasons:
- Very small, highly hydrophilic peptides (MVSK, LTLK, IELK, VNFK — all < 500 Da) do not bind the reverse-phase C18 column and elute in the void volume, so they are not detected as distinct peaks
- Some peptides may co-elute and appear as a single unresolved peak in the TIC
- The His₆-tag peptide (LEHHHHHH) may ionize poorly due to its unusual composition
Question 5: Identify m/z, Charge State, and [M+H]⁺ for the 2.78 min Peak
From Figure 5b:
m/z = 525.7602
Charge state from isotope spacing in the zoomed inset:
Δ(m/z) = 0.499 Da
z = 1 / 0.499 ≈ 2 → z = +2
Calculate singly charged mass [M+H]⁺:
[M+H]⁺ = (m/z × z) − (z − 1) × 1.0073
[M+H]⁺ = (525.7602 × 2) − (1 × 1.0073)
[M+H]⁺ = 1051.5204 − 1.0073 = 1050.51 Da
Question 6: Peptide Identification and Mass Accuracy
Searching the ExPASy PeptideMass output for the peptide whose monoisotopic mass is closest to 1050.51 Da:
| Peptide | Position | Theoretical Mass (Da) | Δ from observed |
|---|---|---|---|
| FEGDTLVNR | 115–123 | 1050.5214 | 0.009 Da ✓ |
| EDGNILGHK | 133–141 | 982.4952 | too far |
The identified peptide is FEGDTLVNR (positions 115–123).
Mass accuracy in ppm:
ppm error = |MW_experiment − MW_theory| / MW_theory × 10⁶
ppm error = |1050.5124 − 1050.5214| / 1050.5214 × 10⁶
ppm error = 0.009 / 1050.5214 × 10⁶ = 8.6 ppm
This is excellent performance, fully consistent with Waters BioAccord LC-MS specifications (< 10 ppm for peptides).
Question 7: Sequence Coverage (Figure 6)
From the ExPASy PeptideMass output, 90.7% of the eGFP sequence is represented by tryptic peptides with mass ≥ 500 Da. The amino acid coverage map (Figure 6) from the Waters BioAccord LC-MS experimentally confirms this coverage through detected peptide masses and fragmentation patterns. The remaining ~9.3% corresponds to very small peptides below the instrument’s reliable detection threshold.
Bonus Question 1: Peptide Sequence from Fragmentation Spectrum (Figure 5c)
The sequence FEGDTLVNR was entered into the SystemsBiology Fragment Ion Servlet (monoisotopic masses, +1 charge, b/y ion series). The predicted fragment ions are:
| # | Residue | b-ion (m/z) | y-ion (m/z) | # from C-term |
|---|---|---|---|---|
| 1 | F | 148.07574 | 1050.52149 | 9 |
| 2 | E | 277.11833 | 903.45308 | 8 |
| 3 | G | 334.13979 | 774.41049 | 7 |
| 4 | D | 449.16673 | 717.38902 | 6 |
| 5 | T | 550.21441 | 602.36208 | 5 |
| 6 | L | 663.29848 | 501.31440 | 4 |
| 7 | V | 762.36689 | 388.23034 | 3 |
| 8 | N | 876.40982 | 289.16192 | 2 |
| 9 | R | 1032.51093 | 175.11900 | 1 |
Mass/Charge Table for FEGDTLVNR:
| Species | Monoisotopic (Da) | Average (Da) |
|---|---|---|
| (M) | 1049.51422 | 1050.13629 |
| (M+H)⁺ | 1050.52149 | 1051.14356 |
| (M+2H)²⁺ | 525.76441 | 526.07544 |
| (M+3H)³⁺ | 350.84538 | 351.05273 |
| (M+4H)⁴⁺ | 263.38586 | 263.54138 |
Confirmation of match — ppm error on the (M+2H)²⁺ ion:
Predicted (M+2H)²⁺ = 525.76441 vs. observed = 525.7602
ppm error = |525.7602 − 525.76441| / 525.76441 × 10⁶
ppm error = 0.00421 / 525.76441 × 10⁶ = 8.0 ppm
Sequence confirmed via ion series:
Matching the y-ion series from Figure 5c against predicted values reads the C-terminal sequence inward:
- y1 = 175.12 → R
- y2 = 289.16 → NR
- y3 = 388.23 → VNR
- y4 = 501.31 → LVNR
- y5 = 602.36 → TLVNR
The b-ion series confirms the N-terminal sequence reading outward:
- b1 = 148.08 → F
- b2 = 277.12 → FE
- b3 = 334.14 → FEG
The peptide sequence is confirmed as FEGDTLVNR.
Bonus Question 2: Does the Peptide Map Confirm eGFP Identity?
Yes, the peptide map data unambiguously confirms that the protein is eGFP. Three independent lines of evidence support this conclusion:
- Mass accuracy: Tryptic peptide masses match ExPASy PeptideMass theoretical predictions within < 10 ppm — consistent with authentic eGFP sequence
- MS/MS fragmentation: The fragmentation spectrum of the 2.78-min peak matches the predicted b- and y-ion series for FEGDTLVNR, confirming the amino acid sequence residue by residue
- Sequence coverage: Figure 6 shows that >90% of the eGFP primary sequence is experimentally confirmed, leaving no significant unexplained regions
Part IV: Oligomeric States of KLH by Charge Detection Mass Spectrometry
CDMS enables direct, single-particle mass measurement of very large protein complexes without requiring resolved charge states. Using known subunit masses (7FU = 340 kDa; 8FU = 400 kDa), the expected masses for each oligomeric species are calculated below:
| Oligomeric Species | Subunit | Calculation | Theoretical Mass | Location on Figure 7 |
|---|---|---|---|---|
| 7FU Decamer | 7FU (340 kDa) | 10 × 340 kDa | 3,400 kDa (3.4 MDa) | Leftmost peak, ~3.4 MDa |
| 8FU Didecamer | 8FU (400 kDa) | 20 × 400 kDa | 8,000 kDa (8.0 MDa) | ~8.0 MDa |
| 8FU 3-Decamer | 8FU (400 kDa) | 30 × 400 kDa | 12,000 kDa (12.0 MDa) | ~12.0 MDa |
| 8FU 4-Decamer | 8FU (400 kDa) | 40 × 400 kDa | 16,000 kDa (16.0 MDa) | Rightmost peak, ~16.0 MDa |
Calculations shown explicitly:
- 7FU Decamer: 10 × 340 = 3,400 kDa
- 8FU Didecamer: 20 × 400 = 8,000 kDa
- 8FU 3-Decamer: 30 × 400 = 12,000 kDa
- 8FU 4-Decamer: 40 × 400 = 16,000 kDa
Reading Figure 7 left-to-right, the four peaks correspond to these four species in increasing order of mass. CDMS is uniquely suited for this measurement because the extremely large size of these complexes (3.4–16 MDa) makes charge state resolution impossible in conventional ESI-MS — CDMS bypasses this by measuring charge on each individual particle directly.
Part V: Final Assessment — Did I Make eGFP?
Summary Table
| Theoretical (unmatured) | Theoretical (matured) | Observed (Intact LC-MS) | PPM Error | |
|---|---|---|---|---|
| Molecular Weight (Da) | 28,006.60 | 27,986.57 | 27,983.75 | 816 ppm (vs. unmatured) / 101 ppm (vs. matured) |
PPM error calculation (vs. unmatured):
ppm = |27,983.75 − 28,006.60| / 28,006.60 × 10⁶ = 22.85 / 28,006.60 × 10⁶ = 816 ppm
PPM error calculation (vs. matured eGFP):
ppm = |27,983.75 − 27,986.57| / 27,986.57 × 10⁶ = 2.82 / 27,986.57 × 10⁶ = 101 ppm
Verdict: Yes — eGFP was successfully produced.
The mass difference of ~23 Da between the unmatured theoretical mass and the observed mass is not analytical error — it is the biochemical signature of chromophore maturation (loss of H₂O and H₂ during spontaneous cyclization and oxidation of the Ser65-Tyr66-Gly67 tripeptide). When compared against the correct matured eGFP mass of 27,986.57 Da, the measurement accuracy is 101 ppm, consistent with intact protein LC-MS performance.
This is further confirmed by: (1) tryptic peptide mapping recovering >90% of the primary sequence with < 10 ppm mass accuracy, and (2) native MS (Part II) showing a compact charge state distribution at high m/z confirming the protein is properly folded into its characteristic β-barrel structure. The combination of mass, sequence, and folding data provides complete confirmation that the expressed protein is functional eGFP.
References
Carr, S. (2012). Fundamentals of peptide and protein mass spectrometry [Video]. Broad Institute of MIT and Harvard. https://www.youtube.com/watch?v=PFOodSbH9IY
Eiler, S., Gangloff, M., & Duclohier, H. (2020). Native vs denatured: An in-depth investigation of charge state and isotope distributions. Journal of the American Society for Mass Spectrometry, 31(10). https://pmc.ncbi.nlm.nih.gov/articles/PMC7539638/
Jorgenson, J. (2012). History of LC and mass spectrometry [Video]. Vimeo. https://player.vimeo.com/video/53604465
Tucholski, T., Coon, J. J., & Ge, Y. (2019). Best practices for intact protein analysis for top-down mass spectrometry. Nature Methods, 16(7), 587–594. https://doi.org/10.1038/s41592-019-0457-0
Swiss Institute of Bioinformatics. (2024). ExPASy Compute pI/Mw tool. https://web.expasy.org/compute_pi/
Swiss Institute of Bioinformatics. (2024). ExPASy PeptideMass tool. https://web.expasy.org/peptide_mass/
University of Washington. (2024). Fragment Ion Servlet. SystemsBiology.net. http://db.systemsbiology.net/proteomicsToolkit/FragIonServlet.html
Waters Corporation. (2024). Waters Xevo G3 QTof mass spectrometer. https://www.waters.com