I am a student at Copperbelt University in Zambia and a researcher in the How to Grow (Almost) Anything (HTGAA) 2026 course.
My Mission: Sustainable Agriculture Through Synthetic Biology
My primary focus is the development of sustainable, bio-based solutions for agriculture. Currently, my research explores the use of cyanobiochar as a biofertilizer. By leveraging the nitrogen-fixing capabilities of cyanobacteria combined with the structural benefits of biochar, I aim to create a natural, high-efficiency alternative to chemical fertilizers that can revitalize soil health in my local community and beyond.
Strategic Goals & Personal Development
To push the boundaries of my final year project, I am focusing on two key development pillars during HTGAA:
Space-Hardened Extremotolerant Stocks: I am interested in exploring how exposure to extreme environments—specifically launching samples into space—can help select for or engineer extremotolerant strains of cyanobacteria. These “space-hardened” stocks could offer superior resilience to the harsh environmental stressors found on Earth, such as drought and high salinity.
Environmental Biosensors: As a secondary goal, I am exploring synthetic biology to create low-cost biosensors that detect heavy metal contamination, ensuring the water used in sustainable irrigation is safe and clean.
Week 1: Project Concept — The “Copper-Sentinel” Initiative My Vision: Why This Matters Living in the Copperbelt, we see the good and bad aspects of mining every day—it drives our economy, but it also leaves a heavy footprint on our groundwater. I want to build Copper-Sentinel, a low-cost, decentralized tool for real-time water monitoring.
Part 1: Benchling & In-silico Gel Art In-Silico Gel Art: Latent Figure Protocol Project Overview For this week’s assignment, I used Benchling to simulate restriction enzyme digests on the Lambda Phage genome (NC_001416). My goal was to move beyond simple data analysis and create “Gel Art” in the style of Paul Vanouse’s Latent Figure Protocol.
Week 3: Lab Automation & Opentrons Art Introduction This week’s focus is on the intersection of biology, robotics, and creative coding. As part of the HTGAA 2026* cohort based in Zambia, I am exploring how liquid-handling automation (specifically the Opentrons OT-2) can streamline laboratory workflows. Beyond the technical utility, this assignment challenged us to use the robot as a canvas, translating digital coordinates into physical biological art.
Homework: Protein Design I
Part A. Conceptual Questions 1.# Assignment: Proteins and Amino Acids 1. Amino Acids in 500g of Meat To calculate the total molecules, we first look at the protein density. Meat is roughly 20% protein by mass.
Week 5: Protein Design Part II SOD1 Binder Peptide Design and Evaluation Part 1: Generate Binders with PepMLM The human SOD1 sequence was retrieved from UniProt (P00441). The A4V mutation (Alanine to Valine at residue 4) was introduced to the wild-type sequence to create the target for peptide generation. Using the PepMLM-650M model, four 12-amino acid peptides were generated, and the known binder FLYRWLPSRRGG was added as a control.
Assignment: DNA Assembly 1. What are some components in the Phusion High-Fidelity PCR Master Mix and what is their purpose? Phusion DNA Polymerase: This is the “engine.” It’s a highly thermostable enzyme that synthesizes new DNA strands. It’s “High-Fidelity” because it has $3’ \rightarrow 5’$ exonuclease activity (proofreading), making significantly fewer mistakes than standard Taq. dNTPs (Deoxynucleotide Triphosphates): These are the molecular building blocks (A, T, C, and G) used by the polymerase to construct the new DNA strand. Buffer (containing $Mg^{2+}$): Maintains the optimal pH for enzymatic activity and provides essential divalent cations. Magnesium ions act as a cofactor for the polymerase, helping it catalyze the phosphodiester bond. Stabilizers: Often includes detergents or proprietary chemicals to prevent the enzyme from denaturing or sticking to the tube walls during the high-heat cycles. 2. What are some factors that determine primer annealing temperature during PCR? Primer Length: Longer primers generally require higher temperatures to remain specific. GC Content: G-C pairs have three hydrogen bonds compared to the two in A-T pairs. Therefore, primers with higher GC content have higher melting temperatures ($T_m$). Salt Concentration: The concentration of monovalent cations (like $K^+$) in the buffer affects the stability of the DNA duplex. Primer Concentration: Higher concentrations can slightly shift the kinetics of annealing. Mismatches: If the primer isn’t a 100% match to the template, the $T_m$ will decrease. Note: The annealing temperature ($T_a$) is usually chosen to be $3-5^\circ\text{C}$ below the $T_m$ of the primers to balance specificity and yield.
Week 7: IANNs & Fungal Materials Part 1: Intracellular Artificial Neural Networks (IANNs) Question 1 What advantages do IANNs have over traditional genetic circuits, whose input/output behaviors are Boolean functions?
HTGAA Homework — Cell-Free Systems Part A: General & Lecturer-Specific Questions General Question 1 Explain the main advantages of cell-free protein synthesis over traditional in vivo methods, specifically in terms of flexibility and control over experimental variables. Name at least two cases where cell-free expression is more beneficial than cell production.
Laboratory Report: Advanced Mass Spectrometric Analysis of eGFP Course: How to Grow Almost Anything (HTGAA) — Week 10
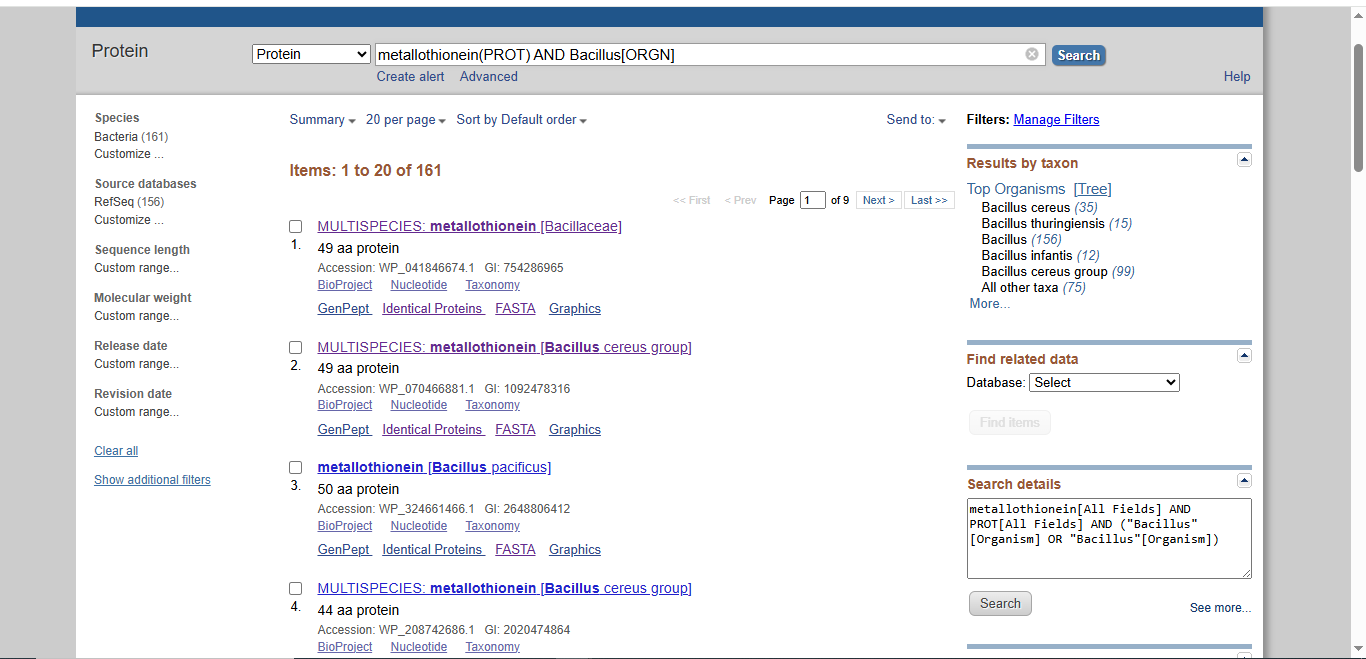
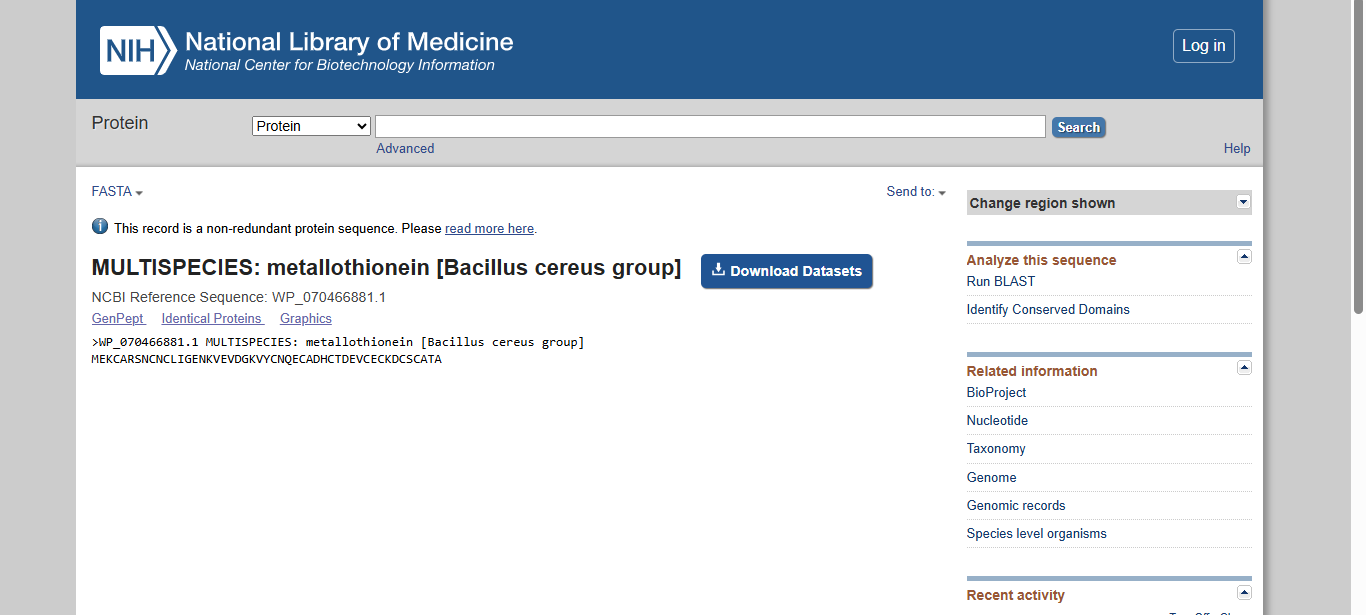
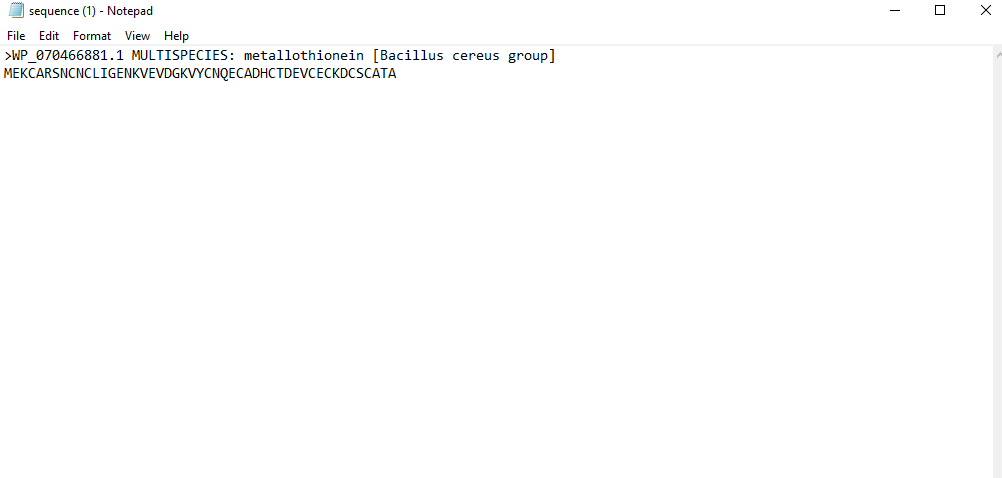
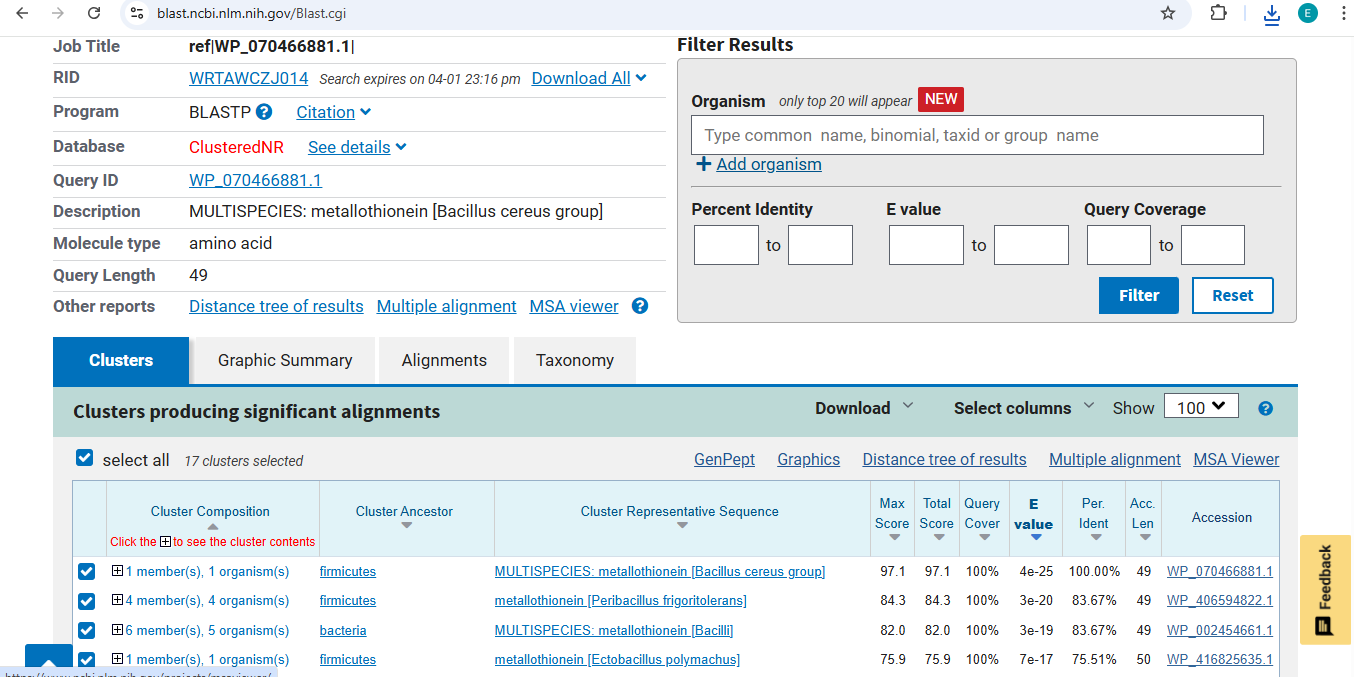
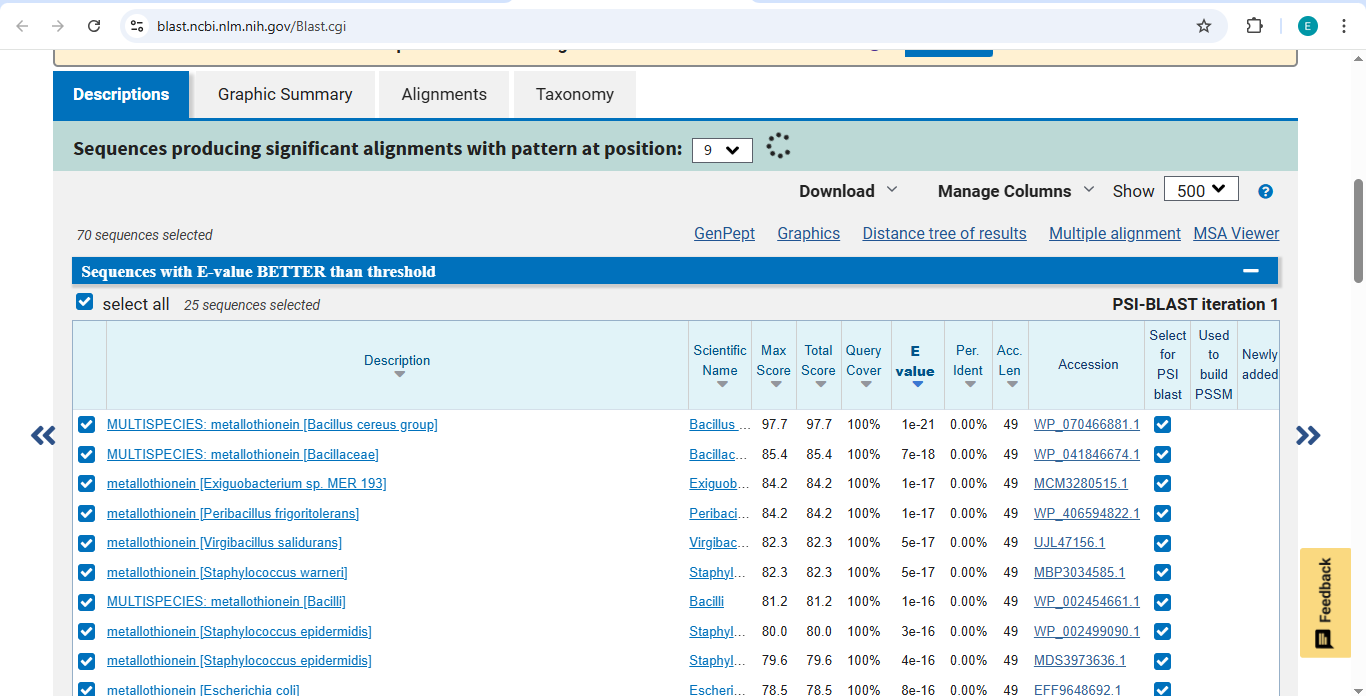
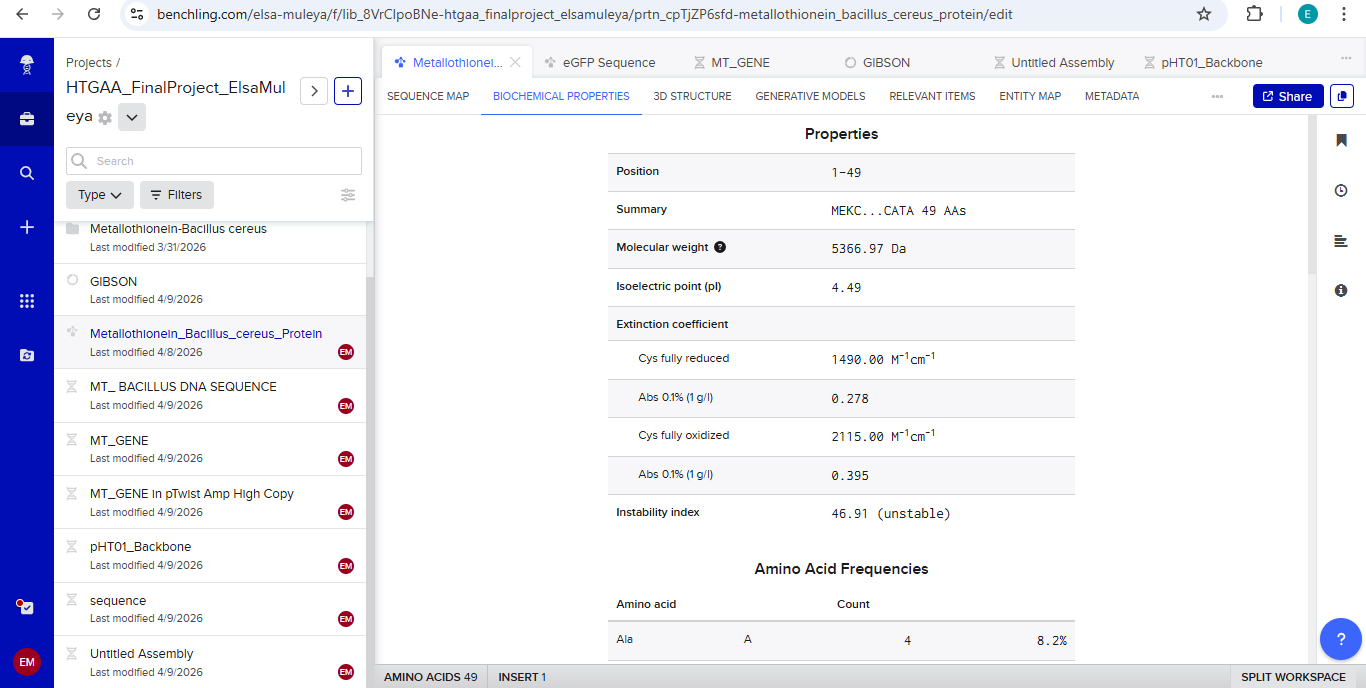
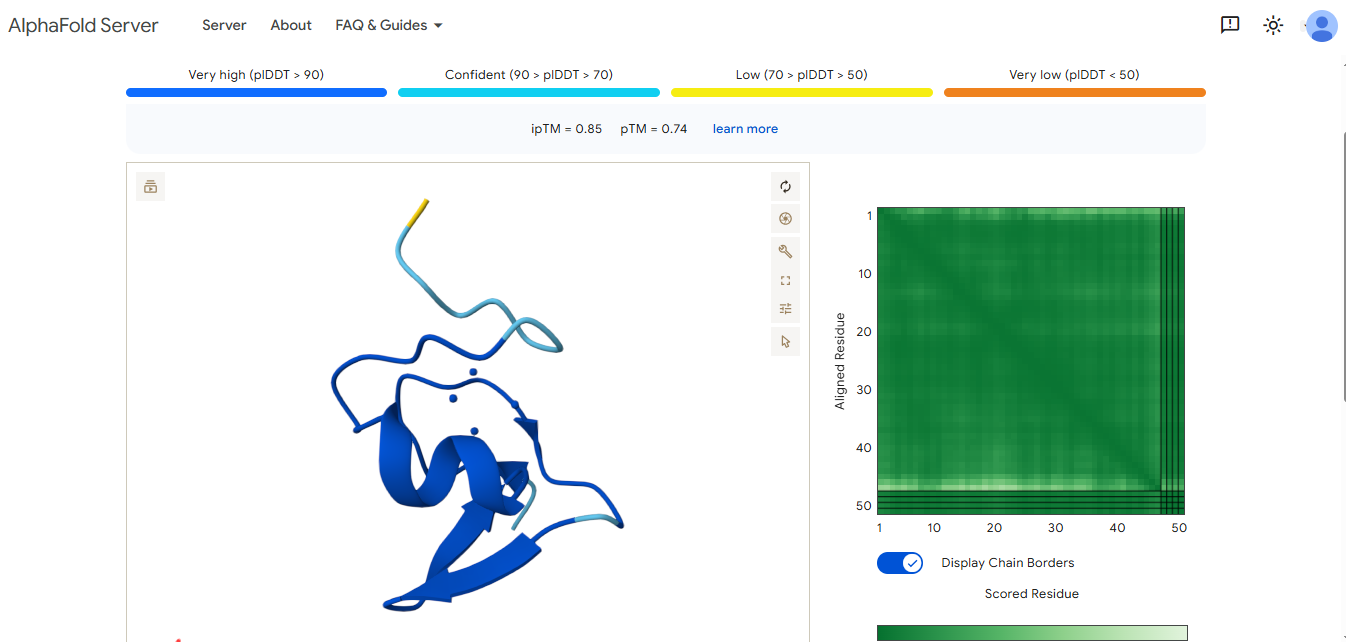
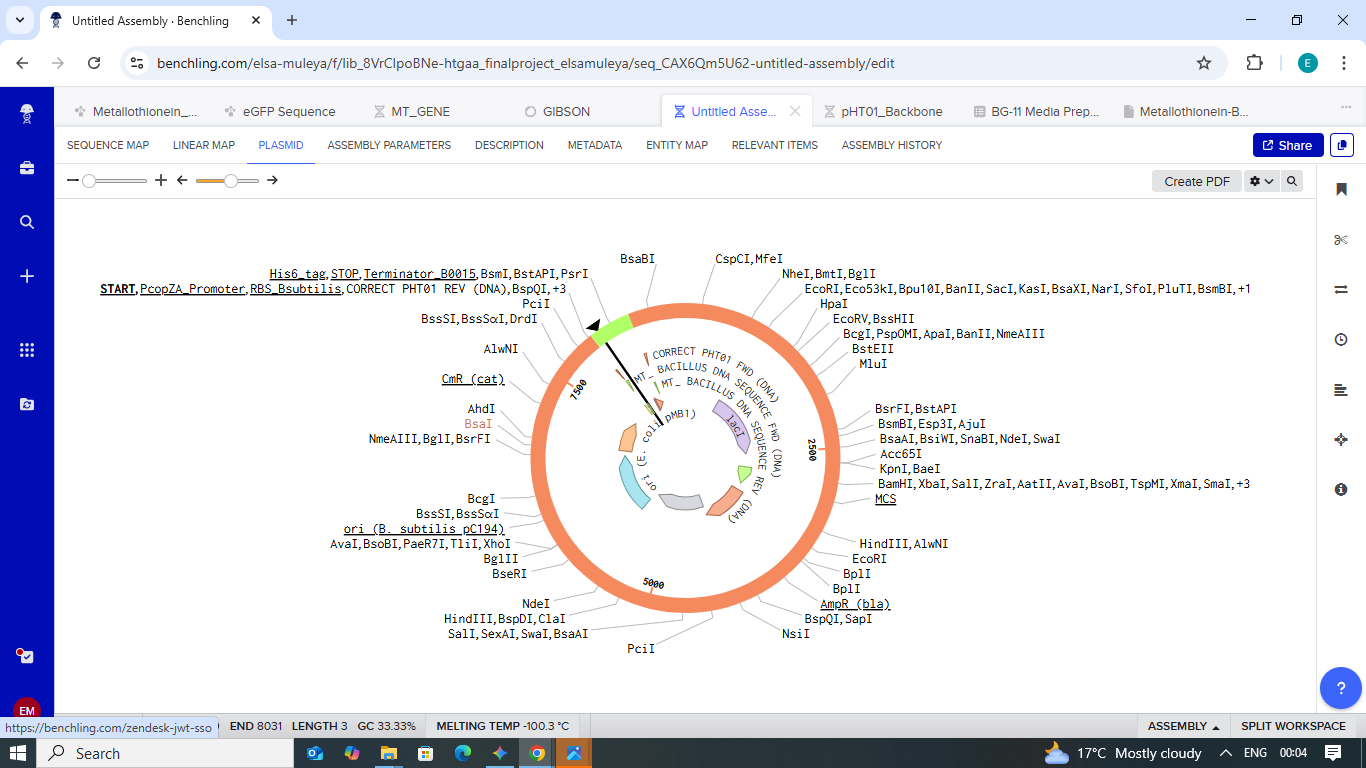
Final Project: Measurement Plan Zambia Mineral-Waste Bioremediation Predictor My final project uses a genetically engineered Bacillus subtilis strain expressing a metallothionein (MT) protein (accession WP_070466881.1) to remove copper and other heavy metals from mine-contaminated water in Zambia’s Copperbelt Province. The system also includes a copper-sensing genetic circuit (CopA-CueR), a MazF/MazE kill switch for biocontainment, and a dual-layer hydrogel encapsulation system called ZAMGEL.
HTGAA Week 11 Homework — Bioproduction & Cloud Labs Part A: The 1,536 Pixel Artwork Canvas What did you contribute to the community bioart project?
I contributed by correcting some of the pixel colours that appeared wrongly placed in the region slightly above and around the word “love” on the canvas, helping restore the intended colour arrangement in that section of the artwork.
Subsections of Homework
Week 1 HW: Principles and Practices
Week 1: Project Concept — The “Copper-Sentinel” Initiative
My Vision: Why This Matters
Living in the Copperbelt, we see the good and bad aspects of mining every day—it drives our economy, but it also leaves a heavy footprint on our groundwater. I want to build Copper-Sentinel, a low-cost, decentralized tool for real-time water monitoring.
Instead of traditional sensors that require expensive labs, I’m looking at using Cell-Free Synthetic Biology. Basically, we take the “machinery” out of a cell (the parts that can read DNA and make proteins) and freeze-dry them onto simple paper strips. When a person dips this strip into their well water, a specific DNA circuit I’ve designed reacts to copper ions. If the copper is above the safe limit, the strip turns a vivid purple. Because there are no living bacteria involved, there’s no risk of accidentally releasing a “GMO” into our local environment.
Ensuring an Ethical Future (Governance & Policy)
It isn’t enough to just hand out sensors; we have to think about the “what ifs.” My goal is to ensure this technology contributes to an ethical future where people are protected, not just informed.
Goal 1: Environmental Safety (Non-malfeasance)
Specific Sub-goal A: We must stick strictly to a Cell-Free platform. By ensuring the tool is non-living, we avoid the ethical nightmare of synthetic organisms self-replicating in our rivers.
Specific Sub-goal B: We need a clear “End-of-Life” protocol for these strips so they don’t become a new source of litter or chemical waste.
Goal 2: Data Equity & Autonomy
Specific Sub-goal A: I want the results to be owned by the community. If a village finds high copper, they should have the first right to that data before it goes to a corporation or a government agency.
Specific Sub-goal B: The science needs to be “legible”—meaning a person without a science degree should be able to look at the strip and understand exactly what it means for their health.
How We Make This Work (The Governance Matrix)
Aspect
Action 1: The Technical “Kill-Switch”
Action 2: The Community “Water Union”
Action 3: National Bio-Policy
Purpose
Using “Cell-Free” extracts instead of live bacteria to prevent any biological spread.
Training local youth and leaders to act as “Sentinel Guardians” of their own data.
Proposing that the Zambian government recognizes citizen-led bio-data as legal evidence.
Design (Actors)
Synthetic biologists and molecular designers (like us in HTGAA).
Local community leaders, NGOs, and residents.
ZEMA (Zambia Environmental Management Agency) and the Ministry of Mines.
Assumptions
We’re assuming these delicate biological reagents can survive the Zambian heat without a fridge.
We’re assuming that mining firms won’t try to suppress the findings of local citizens.
We assume the government is willing to prioritize public health over short-term mining profits.
Risks of Failure & Success
Failure: The strip gives a “false safe” reading because it got too hot, and people drink toxic water.
Failure: The community finds high copper but has no money or help to dig a new, cleaner well.
Success Risk: We find so much pollution that land values drop, causing an economic crisis for the locals.
Scoring the Governance Actions
I’ve rated these from 1 (Most Effective/Easiest) to 3 (Hardest/Riskiest).
Does the option:
Option 1 (Technical)
Option 2 (Community)
Option 3 (Legal)
Enhance Biosecurity
1
2
2
Foster Lab & Field Safety
1
1
2
Protect the Environment
1
2
1
Minimize Costs & Burdens
2
1
3
Feasibility?
2
1
3
Promote Constructive Use
1
1
2
My Recommendation & Trade-offs
If I have to choose, I’m prioritizing a combination of the Technical (Cell-Free) and Community-led models (Options 1 and 2).
The “Cell-Free” design is a non-negotiable for me because it’s the most responsible way to use biotech in the wild. But a tool is useless if the people don’t trust it. By building a “Water Union,” we empower people. The biggest trade-off here is the cost of cell-free reagents, which are currently more expensive than living bacteria. However, I believe the environmental safety is worth the extra few cents per test.
I’d present this plan to the Zambian Ministry of Green Economy and Environment. We need them to create a “Safe Sandbox” for us to test these sensors without being buried in the red tape that usually slows down biotech.
Personal Reflection
This week made me realize that biotech isn’t just about what happens in a test tube. I was struck by the idea of Dual-Use risks. A sensor that finds copper could, in the wrong hands, be used to sabotage water supplies or manipulate land prices.
Also, a new ethical concern for me was technological Paternalism the idea of an expert coming in with a fancy tool and leaving. To fix this, our governance needs to focus on remediation. It’s not enough to tell someone their water is poisoned; we must also provide the biological tools (like copper-absorbing biopolymers) to help them clean it.
Week 2 Lecture Prep: Reading and Writing Life
Part 1: Professor Jacobson’s Questions
Nature’s machinery for copying DNA is called polymerase. What is the error rate of polymerase? How does this compare to the length of the human genome? How does biology deal with that discrepancy?
The Discrepancy: The error rate of standard DNA polymerases is roughly 1 in 10,000 to 1 in 100,000 nucleotides. Since the human genome has approximately 3 billion base pairs, relying solely on basic polymerase would mean tens of thousands of mutations every time a cell divides.
The Solution: Biology uses a multi-layered “spell-check” system. First, the polymerase has proofreading abilities (exonuclease activity) that catch most mistakes as they happen. Second, Mismatch Repair (MMR) proteins scan the strands to fix remaining errors. This brings the final error rate down to about 1 in a billion.
How many different ways are there to code (DNA nucleotide code) for an average human protein? In practice, what are some of the reasons that all of these different codes don’t work?
The Numbers: There are an astronomical number of ways to write the same protein due to code degeneracy. For an average human protein (~400 amino acids), there are roughly $10^{150}$ possible DNA sequences.
Practical Constraints: Not all codes work because some codons are “rare,” causing the cell to run out of tRNA and stall production. Additionally, certain sequences can create hairpins (DNA folding on itself) or unintended stop signals that terminate the process prematurely.
Part 2: Dr. LeProust’s Questions
What’s the most commonly used method for oligo synthesis currently?
The gold standard is Phosphoramidite synthesis. This chemical process builds DNA one nucleotide at a time on a solid surface.
Why is it difficult to make oligos longer than 200nt via direct synthesis?
It is due to Efficiency. Even with a 99% coupling efficiency, errors compound over 200 steps. By the end, only a tiny fraction of the strands are correct; the rest are “trash” sequences, missing letters.
Why can’t you make a 2000bp gene via direct oligo synthesis?
The math implies the yield for a 2000bp strand would be effectively zero—not a single perfect molecule would exist in the tube. Instead, scientists synthesize many short 100-200nt pieces and “glue” them together using enzymes (assembly).
Part 3: George Church’s Question:
What are the 10 essential amino acids in all animals and how does this affect your view of the “Lysine Contingency”?
The 10 Essentials: Phenylalanine, Valine, Threonine, Tryptophan, Isoleucine, Methionine, Histidine, Arginine, Leucine, and Lysine.
My View: In Jurassic Park, the “Lysine Contingency” was a fictional “kill switch.” However, in reality, all animals (including humans) are unable to make lysine. It isn’t a special safety feature—it is a fundamental natural limitation that shows how all life depends on its environment and diet for survival.
References
Week 1: The “Copper-Sentinel” Initiative & Governance
Pardee, K., Green, A. A., Ferrante, T., Cameron, D. E., Daleykeyser, A., Yin, P., & Collins, J. J. (2014). Paper-based synthetic gene networks. Cell, 159(4), 940–954. https://doi.org/10.1016/j.cell.2014.10.004
Wan, X., Volpetti, F., Petrova, M., French, C., Maerkl, S. J., & Wang, B. (2019). Cascaded cell-free transcriptional switches for high-performance analyte detection. ACS Synthetic Biology, 8(6), 1255–1264. https://doi.org/10.1021/acssynbio.8b00522
Crichton, M. (1990). Jurassic Park. Alfred A. Knopf.
Kosuri, S., & Church, G. M. (2014). Large-scale de novo DNA synthesis: Technologies and applications. Nature Methods, 11(5), 499–507. https://doi.org/10.1038/nmeth.2918
Mandell, D. J., Lajoie, M. J., Mee, M. T., Takeuchi, R., Kuznetsov, G., Norville, J. E., … & Church, G. M. (2015). Biocontainment of genetically modified organisms by synthetic auxotrophy. Nature, 518(7537), 55–60. https://doi.org/10.1038/nature14121
Plotkin, J. B., & Kudla, G. (2011). Synonymous but not identical: The evolutionary and biological significance of codon bias. Nature Reviews Genetics, 12(1), 32–42. https://doi.org/10.1038/nrg2899
Week 2 HW: DNA READ WRITE AND EDIT
Part 1: Benchling & In-silico Gel Art
In-Silico Gel Art: Latent Figure Protocol
Project Overview
For this week’s assignment, I used Benchling to simulate restriction enzyme digests on the Lambda Phage genome (NC_001416). My goal was to move beyond simple data analysis and create “Gel Art” in the style of Paul Vanouse’s Latent Figure Protocol.
The Visual Design
I designed a zigzag pattern that emerges from a complex reference lane. By selecting specific enzymes, I was able to control the migration height of the DNA bands to create a deliberate visual W shape.
Enzyme Key and Lane Setup
Lane
Enzyme Combination
Visual Goal
Ladder
NEB 2-Log
Size reference for the DNA bands.
Lane 1
All 7 Enzymes
The Master Key: EcoRI, HindIII, BamHI, KpnI, EcoRV, SacI, SalI.
Lane 2
SacI
Low Point: Sharp band near the bottom.
Lane 3
BamHI + SalI
Mid-Point: Moving the pattern upward.
Lane 4
EcoRI
High Point: The peak of the zigzag.
Lane 5
BamHI + SalI
Mid-Point: Symmetric return to the middle.
Lane 6
SacI
Low Point: Completing the zigzag at the bottom.
Final Result
Reflection
Working with EcoRV was a challenge because it cuts the genome 21 times, resulting in a significant amount of noise. By isolating simpler cutters, such as SacI and EcoRI, in the later lanes, I was able to make the intended artwork much clearer.
Why: I chose Insulin because it is a vital hormone for glucose regulation and holds historical significance as the first human protein to be manufactured using recombinant DNA technology.
Process:
Using the Sequence Manipulation Suite, I reverse-translated the Insulin amino acid sequence into a DNA sequence. I used the most likely codons based on the genetic code to ensure a usable, non-degenerate sequence.
Why do we need to optimize?
Different organisms have different “preferences” for which codons they use to build proteins. If we put the human insulin DNA sequence directly into E. coli, the bacteria might lack the necessary tRNA “building blocks” to read it efficiently. By using the IDT Codon Optimization Tool, I have swapped the human codons for the ones that E. coli prefers, ensuring the fastest and most reliable production of the protein.
To turn my digital sequence into a physical protein, I would use the following technologies:
Chemical DNA Synthesis: I would send my optimized sequence to a vendor like IDT to synthesize the physical DNA strands.
Recombinant Expression: I would insert this DNA into a plasmid and transform it into E. coli cells. The bacteria act as a biological factory, using transcription and translation to manufacture the insulin.
Cell-Free Synthesis: Alternatively, I could use a X-TL system, which uses cellular machinery in a test tube to produce the protein without needing a living host.
3.5. Biological Systems
How can a single gene code for multiple proteins?
Nature is far more efficient than a simple 1:1 “one gene, one protein” rule. Through Alternative Splicing, a cell can choose which sections of an RNA transcript to keep and which to discard. This allows the same gene to produce several different versions of a protein, known as isoforms, which can have different functions in the body.
Case Study: Human Insulin (P01308)
Isoforms: This gene produces 2 isoforms via alternative splicing.
Maturation: Insulin also undergoes Post-translational processing, where it is trimmed from a long Preproinsulin chain into the final active hormone.
The Biomolecular Flow:
Below is the full breakdown of how my digital DNA sequence becomes a functional protein.
Level
Sequence
Key Change
DNA
ATG GCA CTG TGG...
Optimized for E. coli host
RNA
AUG GCA CUG UGG...
Transcribed copy; T is now U
Protein
M A L W ...
Translated amino acid sequence
Part 4: Prepare a Twist DNA Synthesis Order
Project: Insulin_v1.0_System_Architecture
Developer: [Elsa Muleya] Status: Compiled & Verified Target Environment: E. coli OS
1. The Source Code (DNA)
The circular plasmid represents the permanent Read-Only Memory (ROM) of the biological system.
ENTRY_POINT (promoter): Executes the START command. It signals the system’s hardware to begin data processing at position 1.
DATA_PACKET (RBS): The Ribosome Binding Site acts as the Buffer. It prepares the hardware to load the upcoming instructions.
MAIN_APP (Insulin CDS): The primary logic gate. This is the raw sequence that defines the structure of the final output (Insulin).
METADATA_TAG (7x His Tag): An attached Header. This 7-histidine string acts as a unique ID for downstream sorting and purification.
EOF_MARKER (Terminator): The exit(0) command. It forces the system to stop reading and release the hardware resources.
2. The Compiler (Transcription)
This is the process of converting the High-Level Code (DNA) into Machine Code (mRNA).
The system’s compiler (RNA Polymerase) docks at the ENTRY_POINT.
It generates a temporary copy of the data. This is equivalent to loading an application from the Hard Drive (DNA) into RAM (mRNA) for active execution.
3. The Execution (Translation)
The system hardware (Ribosome) executes the instructions stored in the RAM (mRNA).
BIT_READING: The hardware reads the code in 3-bit segments called Codons.
OUTPUT_GENERATION: For every 3 bits read, the system adds one unit (amino acid) to the physical product.
FRAME_CHECK: I have verified the 7x His Tag is in-frame, ensuring the Metadata Header is correctly attached to the Main App without data corruption.
4. System Security & Multi-Threading (The Vector)
The design uses the pTwist Amp High Copy backbone for optimized performance.
FIREWALL (AmpR): Provides Ampicillin resistance. This acts as a security filter; any cell that does not contain the “authorized” plasmid is deleted by the antibiotic.
MULTI-THREADING (colE1_high_copy): Forces the cell to run hundreds of instances of the program simultaneously. This maximizes the Data Throughput, resulting in high-volume insulin production.
Build Logs:
Coordinates: 1-2761 bp
Topology: Circular
Resistance: Ampicillin
Integrity: Verified
**Part 5: 5.1 DNA READ | 5.2 DNA WRITE | 5.3 DNA EDIT
5.1 DNA READ: PALEOVIROMICS & PERMAFROST SURVEILLANCE
(i) WHAT DNA AND WHY?
I intend to sequence ancient viral DNA/RNA (eDNA) extracted from Siberian
permafrost cores (Reference: Alempic et al., 2023). As climate change
accelerates, dormant pathogens like Pithovirus or Pandoravirus are resurfacing.
Sequencing these allows for the creation of a Pre-emptive Pandemic Library to
identify ancestral motifs and develop vaccine scaffolds before zoonotic
spillover occurs.
INPUT: Environmental DNA (eDNA) from permafrost meltwater.
PREPARATION STEPS:
EXTRACTION: Bead-based magnetic isolation of fragmented ancient DNA.
REPAIR: End-repair and A-tailing to fix degraded DNA termini.
TARGETED ENRICHMENT: Hybrid capture using RNA-probe baits to isolate
viral sequences from bacterial/fungal background.
ADAPTER LIGATION: Attaching motor proteins to pull DNA through pores.
DECODING (BASE CALLING):
DNA passes through a protein nanopore, disrupting an ionic current. Each
base creates a specific squiggle (electrical signature). Recurrent Neural
Networks (RNNs) like the ‘Dorado’ basecaller translate these signals into
ATCG sequences.
OUTPUT:
FastQ files containing Long Reads (10kb - 2Mb), enabling high-fidelity
de novo assembly of unknown viral genomes.
5.2 DNA WRITE: DE NOVO ANTIFREEZE GLYCOPROTEINS (AFGPs)
(i) WHAT DNA AND WHY?
I want to synthesize DNA encoding a De Novo Synthetic Antifreeze Glycoprotein
(AFGP), inspired by Arctic Notothenioids (Reference: Zhuang, 2014).
SEQUENCE: [Ala-Ala-Thr]n repeats, optimized for human tissue compatibility.
WHY: To enable “Supercooling” in organ transplantation. This DNA would
produce proteins that prevent ice crystal formation, extending the viability
of donor organs from hours to several days.
DE-BLOCKING: Acidic removal of the DMT protective group from the
silicon-bound nucleotide.
COUPLING: Addition of the next phosphoramidite monomer (A,T,C, or G).
CAPPING: Acetification of failed strands to prevent truncation errors.
OXIDATION: Stabilizing the phosphite triester bond.
LIMITATIONS:
SPEED: Chemical synthesis is a multi-day process involving logistics.
SCALABILITY: Individual oligos are limited to ~300bp; longer constructs
require Gibson Assembly, which is difficult for repetitive sequences
like [Ala-Ala-Thr]n.
5.3 DNA EDIT: MUTATION-AGNOSTIC PROGERIA CORRECTION
(i) WHAT DNA AND WHY?
I want to edit the LMNA gene in human fibroblasts to treat Hutchinson-Gilford
Progeria Syndrome (HGPS).
THE EDIT: Deletion of the CAAX box motif at the C-terminus.
WHY: Instead of fixing a patient-specific mutation, removing the CAAX box
prevents the toxic protein (progerin) from anchoring to the nuclear membrane.
This is a Mutation-Agnostic therapeutic approach applicable to all HGPS
patients.
(ii) TECHNOLOGY & METHODOLOGY:
Technology: Prime Editing (PE).
HOW IT EDITS:
Uses an engineered Cas9 nickase fused to a Reverse Transcriptase (RT). It
uses a Search-and-Replace mechanism without causing double-strand breaks.
ESSENTIAL STEPS:
SEARCH: The pegRNA (prime editing guide RNA) targets the LMNA site.
NICK: Cas9 nicks only the target DNA strand.
REPLACE: The RT enzyme synthesizes new DNA directly from the pegRNA
template into the nicked site.
INPUTS & PREPARATION:
INPUT: Plasmids/mRNA encoding the PE protein, pegRNA, and a nick-gRNA.
DESIGN: Computational modeling of the Primer Binding Site (PBS)
thermodynamics to ensure stable hybridization.
LIMITATIONS:
EFFICIENCY: Prime editing often has lower “on-target” efficiency in
primary cells compared to standard CRISPR.
DELIVERY: The PE complex is too large for many standard viral delivery
vectors (AAVs).
REFERENCES & RESOURCES
Alempic, J. M., et al. (2023). “An update on eukaryotic viruses revived
from ancient permafrost.” Viruses.
Zhuang, X. (2014). “Creating sense from non-sense DNA: de novo genesis and
evolutionary history of antifreeze glycoprotein gene.” UIUC.
Anzalone, A. V., et al. (2019). “Search-and-replace genome editing without
double-strand breaks or donor DNA.” Nature.
Twist Bioscience Technical Documentation (2024). “Silicon-based DNA Synthesis.”
Week 3 HW: Lab Automation
Week 3: Lab Automation & Opentrons Art
Introduction
This week’s focus is on the intersection of biology, robotics, and creative coding. As part of the HTGAA 2026* cohort based in Zambia, I am exploring how liquid-handling automation (specifically the Opentrons OT-2) can streamline laboratory workflows. Beyond the technical utility, this assignment challenged us to use the robot as a canvas, translating digital coordinates into physical biological art.
Lab automation isn’t just about efficiency; it’s about precision in environments where resources must be used optimally. My work this week involves a Python-based protocol that instructs the robot to “paint” a design using colored liquids in a 96-well plate.
AI Documentation (Opentrons Python Script)
Model used: Gemini 3 Flash (Free Tier)
Description of AI Contribution:
AI was utilized to translate the artistic concept from the Opentrons GUI into a functional Python script using the Opentrons API v2.13. Specifically, the AI assisted in:
Optimization Logic: Implementing a conditional loop (if spots_drawn % 8 == 0) to handle bulk aspiration, which reduces the number of trips the pipette makes to the source reservoir.
Spatial Mapping: Calculating relative coordinates using types.Point for precise deposition on an agar plate or flat-bottom well plate.
Troubleshooting: Ensuring proper tip handling (e.g., including drop_tip() commands) to prevent cross-contamination and robot errors.
Metadata Structure: Properly formatting the protocol metadata and labware loading sequences required for the robot to recognize the script.
The final art concept and the selection of the specific visual ID (zjiq3p93t07ee2n) were directed by the student, while the AI served as a technical co-pilot for the Python implementation.
The Artwork Design
I used the Opentrons Art GUI to map out the coordinates for my design. The visual representation and the specific well-mapping for this protocol can be viewed at the link below:
Below is the Python script generated to execute the design. This script defines the labware (tips, reservoir, and plate) and the specific pipetting movements required to recreate the art.
fromopentronsimporttypesmetadata={# see https://docs.opentrons.com/v2/tutorial.html#tutorial-metadata'author':'ELSA MULEYA','protocolName':'HTGAA Agar Art - Full Set','description':'FLORAL ART','source':'HTGAA 2026 Opentrons Lab','apiLevel':'2.20'}################################################################################# Robot deck setup constants - don't change these##############################################################################TIP_RACK_DECK_SLOT=9COLORS_DECK_SLOT=6AGAR_DECK_SLOT=5PIPETTE_STARTING_TIP_WELL='A1'well_colors={'A1':'Red','B1':'Green','C1':'Orange'}defrun(protocol):################################################################################# Load labware, modules and pipettes############################################################################### Tipstips_20ul=protocol.load_labware('opentrons_96_tiprack_20ul',TIP_RACK_DECK_SLOT,'Opentrons 20uL Tips')# Pipettespipette_20ul=protocol.load_instrument("p20_single_gen2","right",[tips_20ul])# Modulestemperature_module=protocol.load_module('temperature module gen2',COLORS_DECK_SLOT)# Temperature Module Platetemperature_plate=temperature_module.load_labware('opentrons_96_aluminumblock_generic_pcr_strip_200ul','Cold Plate')# Choose where to take the colors fromcolor_plate=temperature_plate# Agar Plateagar_plate=protocol.load_labware('htgaa_agar_plate',AGAR_DECK_SLOT,'Agar Plate')## TA MUST CALIBRATE EACH PLATE!# Get the top-center of the plate, make sure the plate was calibrated before running thiscenter_location=agar_plate['A1'].top()pipette_20ul.starting_tip=tips_20ul.well(PIPETTE_STARTING_TIP_WELL)################################################################################# Patterning#################################################################################### Helper functions for this lab#### pass this e.g. 'Red' and get back a Location which can be passed to aspirate()deflocation_of_color(color_string):forwell,colorinwell_colors.items():ifcolor.lower()==color_string.lower():returncolor_plate[well]raiseValueError(f"No well found with color {color_string}")# For this lab, instead of calling pipette.dispense(1, loc) use this: dispense_and_detach(pipette, 1, loc)defdispense_and_detach(pipette,volume,location):"""
Move laterally 5mm above the plate (to avoid smearing a drop); then drop down to the plate,
dispense, move back up 5mm to detach drop, and stay high to be ready for next lateral move.
5mm because a 4uL drop is 2mm diameter; and a 2deg tilt in the agar pour is >3mm difference across a plate.
"""assert(isinstance(volume,(int,float)))above_location=location.move(types.Point(z=location.point.z+5))# 5mm abovepipette.move_to(above_location)# Go to 5mm above the dispensing locationpipette.dispense(volume,location)# Go straight downwards and dispensepipette.move_to(above_location)# Go straight up to detach drop and stay high###### YOUR CODE HERE to create your designmrfp1_points=[(-8.8,24.2),(-6.6,24.2),(6.6,24.2),(8.8,24.2),(-11,22),(-8.8,22),(-6.6,22),(-4.4,22),(4.4,22),(6.6,22),(8.8,22),(11,22),(-11,19.8),(-8.8,19.8),(-6.6,19.8),(-4.4,19.8),(-2.2,19.8),(2.2,19.8),(4.4,19.8),(6.6,19.8),(8.8,19.8),(11,19.8),(-11,17.6),(-8.8,17.6),(-6.6,17.6),(-4.4,17.6),(-2.2,17.6),(2.2,17.6),(4.4,17.6),(6.6,17.6),(8.8,17.6),(11,17.6),(-11,15.4),(-8.8,15.4),(-4.4,15.4),(-2.2,15.4),(2.2,15.4),(6.6,15.4),(8.8,15.4),(11,15.4),(-11,13.2),(-8.8,13.2),(-2.2,13.2),(2.2,13.2),(8.8,13.2),(11,13.2),(-22,11),(-19.8,11),(-17.6,11),(-15.4,11),(-8.8,11),(-6.6,11),(6.6,11),(8.8,11),(15.4,11),(17.6,11),(19.8,11),(22,11),(-24.2,8.8),(-22,8.8),(-19.8,8.8),(-17.6,8.8),(-15.4,8.8),(-13.2,8.8),(13.2,8.8),(15.4,8.8),(17.6,8.8),(19.8,8.8),(22,8.8),(24.2,8.8),(-24.2,6.6),(-22,6.6),(-19.8,6.6),(-17.6,6.6),(-13.2,6.6),(-11,6.6),(0,6.6),(4.4,6.6),(11,6.6),(17.6,6.6),(19.8,6.6),(22,6.6),(24.2,6.6),(-22,4.4),(-19.8,4.4),(-17.6,4.4),(-6.6,4.4),(6.6,4.4),(15.4,4.4),(17.6,4.4),(19.8,4.4),(22,4.4),(24.2,4.4),(-19.8,2.2),(-17.6,2.2),(-15.4,2.2),(-13.2,2.2),(13.2,2.2),(15.4,2.2),(17.6,2.2),(19.8,2.2),(22,2.2),(-8.8,0),(0,0),(8.8,0),(-19.8,-2.2),(-17.6,-2.2),(-15.4,-2.2),(-13.2,-2.2),(-6.6,-2.2),(0,-2.2),(2.2,-2.2),(6.6,-2.2),(13.2,-2.2),(15.4,-2.2),(17.6,-2.2),(19.8,-2.2),(-22,-4.4),(-19.8,-4.4),(-17.6,-4.4),(-13.2,-4.4),(-6.6,-4.4),(-2.2,-4.4),(6.6,-4.4),(17.6,-4.4),(19.8,-4.4),(22,-4.4),(-24.2,-6.6),(-22,-6.6),(-19.8,-6.6),(-17.6,-6.6),(-11,-6.6),(-4.4,-6.6),(4.4,-6.6),(11,-6.6),(13.2,-6.6),(17.6,-6.6),(19.8,-6.6),(22,-6.6),(24.2,-6.6),(-24.2,-8.8),(-22,-8.8),(-19.8,-8.8),(-17.6,-8.8),(-15.4,-8.8),(-13.2,-8.8),(-11,-8.8),(0,-8.8),(11,-8.8),(13.2,-8.8),(15.4,-8.8),(17.6,-8.8),(19.8,-8.8),(22,-8.8),(24.2,-8.8),(-22,-11),(-19.8,-11),(-17.6,-11),(-15.4,-11),(-13.2,-11),(-8.8,-11),(-6.6,-11),(6.6,-11),(8.8,-11),(13.2,-11),(15.4,-11),(17.6,-11),(19.8,-11),(22,-11),(-11,-13.2),(-8.8,-13.2),(-2.2,-13.2),(2.2,-13.2),(8.8,-13.2),(11,-13.2),(-11,-15.4),(-8.8,-15.4),(-6.6,-15.4),(-2.2,-15.4),(2.2,-15.4),(4.4,-15.4),(8.8,-15.4),(11,-15.4),(-11,-17.6),(-8.8,-17.6),(-6.6,-17.6),(-4.4,-17.6),(-2.2,-17.6),(2.2,-17.6),(4.4,-17.6),(6.6,-17.6),(8.8,-17.6),(11,-17.6),(-11,-19.8),(-8.8,-19.8),(-6.6,-19.8),(-4.4,-19.8),(-2.2,-19.8),(2.2,-19.8),(4.4,-19.8),(6.6,-19.8),(8.8,-19.8),(11,-19.8),(-11,-22),(-8.8,-22),(-6.6,-22),(-4.4,-22),(4.4,-22),(6.6,-22),(8.8,-22),(11,-22),(-8.8,-24.2),(-6.6,-24.2),(6.6,-24.2),(8.8,-24.2)]sfgfp_points=[(-11,28.6),(11,28.6),(-13.2,26.4),(-11,26.4),(-8.8,26.4),(8.8,26.4),(11,26.4),(13.2,26.4),(-13.2,24.2),(-11,24.2),(11,24.2),(13.2,24.2),(-13.2,22),(13.2,22),(-13.2,19.8),(13.2,19.8),(-13.2,17.6),(13.2,17.6),(-13.2,15.4),(-6.6,15.4),(4.4,15.4),(13.2,15.4),(-26.4,13.2),(-24.2,13.2),(-22,13.2),(-19.8,13.2),(-17.6,13.2),(-6.6,13.2),(-4.4,13.2),(4.4,13.2),(6.6,13.2),(17.6,13.2),(19.8,13.2),(22,13.2),(24.2,13.2),(26.4,13.2),(28.6,13.2),(-28.6,11),(-26.4,11),(-24.2,11),(24.2,11),(26.4,11),(28.6,11),(30.8,11),(-26.4,8.8),(-2.2,8.8),(0,8.8),(2.2,8.8),(26.4,8.8),(28.6,8.8),(-15.4,6.6),(-4.4,6.6),(-2.2,6.6),(2.2,6.6),(13.2,6.6),(15.4,6.6),(26.4,6.6),(-15.4,4.4),(-13.2,4.4),(-8.8,4.4),(-2.2,4.4),(2.2,4.4),(8.8,4.4),(13.2,4.4),(-8.8,2.2),(-6.6,2.2),(-4.4,2.2),(0,2.2),(4.4,2.2),(6.6,2.2),(8.8,2.2),(-6.6,0),(6.6,0),(-8.8,-2.2),(-4.4,-2.2),(4.4,-2.2),(8.8,-2.2),(-15.4,-4.4),(-8.8,-4.4),(2.2,-4.4),(8.8,-4.4),(13.2,-4.4),(15.4,-4.4),(-15.4,-6.6),(-13.2,-6.6),(-2.2,-6.6),(0,-6.6),(2.2,-6.6),(15.4,-6.6),(-26.4,-8.8),(-2.2,-8.8),(2.2,-8.8),(26.4,-8.8),(-28.6,-11),(-26.4,-11),(-24.2,-11),(24.2,-11),(26.4,-11),(28.6,-11),(-26.4,-13.2),(-24.2,-13.2),(-22,-13.2),(-19.8,-13.2),(-17.6,-13.2),(-6.6,-13.2),(-4.4,-13.2),(4.4,-13.2),(6.6,-13.2),(17.6,-13.2),(19.8,-13.2),(22,-13.2),(24.2,-13.2),(26.4,-13.2),(-13.2,-15.4),(-4.4,-15.4),(6.6,-15.4),(13.2,-15.4),(-13.2,-17.6),(13.2,-17.6),(-13.2,-19.8),(13.2,-19.8),(-13.2,-22),(13.2,-22),(-13.2,-24.2),(-11,-24.2),(11,-24.2),(13.2,-24.2),(-13.2,-26.4),(-11,-26.4),(-8.8,-26.4),(8.8,-26.4),(11,-26.4),(13.2,-26.4),(-11,-28.6),(11,-28.6)]# Combine the point data with their corresponding well colors into an art_data dictionaryart_data={'Red':{'well':'A1','points':mrfp1_points},'Green':{'well':'B1','points':sfgfp_points},'Orange':{'well':'C1','points':[]# Add points for Orange if needed, otherwise leave empty}}# --- EXECUTION LOGIC ---# Center spot of the agar (adjust based on plate size)center_well=agar_plate['D6']# Fixed: Use dictionary-like access instead of wells_by_name()forcolor_name,datainart_data.items():source=color_plate[data["well"]]# Fixed: source_plate should be color_platepipette_20ul.pick_up_tip()spots_drawn=0forx,yindata["points"]:# Aspirate enough liquid for up to 8 spots, or less if fewer spots remain.# Each spot is 2uL, so 8 spots is 16uL.# The 'min' ensures we don't aspirate more than 16uL at a time or more than what's needed.ifspots_drawn%8==0:pipette_20ul.aspirate(min(16,(len(data["points"])-spots_drawn)*2),source)# Create the relative coordinate on the agar platetarget=center_well.top().move(types.Point(x=x,y=y,z=0))# Use the helper function to dispense and detach the tipdispense_and_detach(pipette_20ul,2,target)spots_drawn+=1pipette_20ul.drop_tip()
3. Final Project Ideas
Idea 1: Zambia Mineral-Waste Bioremediation Predictor
Technical Problem: Mining tailings IN Zambia contain high levels of $Cu$ and $Zn$. Traditional cleaning is too expensive. We need “extremophiles” to stabilize these metals.
The Project: A computational pipeline to analyze the genomes of Bacillus and Pseudomonas from Zambian sites. I will search for protein sequences (Metallothioneins) that bind heavy metals.
Data Source: NCBI SRA data for “Zambian Mine Tailings,” specifically searching for the pbr (lead) and mer (mercury) operons.
Idea 2: Maize Lethal Necrosis (MLN) Genomic Tracker
Technical Problem: MLN is a double infection (MCMV + SCMV) devastating maize. It’s hard to distinguish strains visually.
The Project: A Comparative Genomics study comparing RNA sequences of MCMV from East Africa vs. South Africa to see if a unique “Zambian strain” is emerging.
Data Source: Nextstrain.org and GenBank, focusing on mutations in the Coat Protein (CP) gene.
Idea 3: Maize Yield “Climate-Window” Predictor
Technical Problem: Maize is highly vulnerable to moisture stress during the 2-week silking stage. Climate change has shifted Zambia’s rainy season.
The Project: An automated Predictive Model using “Agro-Meteorological” data to calculate Growing Degree Days (GDD) for Zambian hybrids (SeedCo/MRI) against 20 years of rainfall patterns.
Data Source: CHIRPS rainfall data for Zambia.
References
Week 3: Lab Automation & Opentrons Agar Art
Jessop-Fabre, M. M., & Sonnenschein, N. (2019). Improving reproducibility in synthetic biology through data standards and automation. Essays in Biochemistry, 63(2), 125–134. https://doi.org/10.1042/EBC20180066
Project Idea 1: Zambia Mineral-Waste Bioremediation
Diep, P., Mahadevan, R., & Yakunin, A. F. (2018). Heavy metal removal by bioengineered bacterial cells: From laboratories to wastewater treatment. Bioengineering, 5(4), 92. https://doi.org/10.3390/bioengineering5040092
Mwaanga, P., Silondwa, M., Kasali, G., & Banda, P. M. (2014). Heavy metal contamination of groundwater in the Zambian Copperbelt: A case study of Mukulumpe township in Kitwe. Journal of Environmental Protection, 5(12), 1076–1085. https://doi.org/10.4236/jep.2014.512105
Project Idea 2: Maize Lethal Necrosis (MLN) Genomic Tracker
Mahuku, G., Lockhart, B. E., Wanjala, B., Jones, M. W., Kimunye, J. N., Stewart, L. R., … & Redinbaugh, M. G. (2015). Maize lethal necrosis intensive survey in East Africa reveals high incidence and diversity of Maize chlorotic mottle virus and Sugarcane mosaic virus. Phytopathology, 105(11), 1530–1542. https://doi.org/10.1094/PHYTO-05-15-0131-R
Project Idea 3: Maize Yield “Climate-Window” Predictor
Funk, C., Peterson, P., Landsfeld, M., Pedreros, D., Verdin, J., Shukla, S., … & Michaelsen, J. (2015). The climate hazards infrared precipitation with stations—a new environmental record for monitoring extremes. Scientific Data, 2(1), 1–21. https://doi.org/10.1038/sdata.2015.66
Week 4 HW: Protein Design I
Homework: Protein Design I
Part A. Conceptual Questions
1.# Assignment: Proteins and Amino Acids
1. Amino Acids in 500g of Meat
To calculate the total molecules, we first look at the protein density. Meat is roughly 20% protein by mass.
Protein Mass: 500g 0.20 = 100g
Average Molecular Weight (MW): 100 Daltons (g/mol)
Moles of AA: 100g / 100g/mol= 1 mole
Using Avogadro’s number, 1 mole contains approximately 6.022 * 10^23 molecules. That is sextillion amino acids in a single large steak.
2. Metabolic Identity: Why don’t we turn into cows?
When we ingest beef or fish, our digestive system performs proteolysis. Enzymes such as pepsin and trypsin break down foreign proteins into their constituent amino acids. Our ribosomes then take those bricks and reassemble them into human-specific proteins according to the instructions in our DNA. We don’t become the cow because we recycle the parts, not the blueprints.
3. The Standard 20
While there are hundreds of amino acids found in nature, only 20 are universally encoded.
The Frozen Accident Theory: Francis Crick proposed that once life settled on a set of 20 that covered the necessary chemical functionalities (acidic, basic, polar, non-polar), the translation machinery became too complex to change. Adding a new one would have required re-coding the entire genome, which would be evolutionarily lethal.
4. Non-Natural Amino Acids (nAAs)
We can expand the genetic code. By engineering aminoacyl-tRNA synthetases, we can incorporate synthetic amino acids.
Design Proposal: p-Azidophenylalanine (pAzF).
Function: It contains an azide group (N3) that allows for Click Chemistry. This lets us chemically staple drugs or fluorescent dyes to a protein at a precise location that nature never intended.
5. Pre-Biotic Origins
Before life and enzymes, amino acids were produced through abiotic synthesis.
The Miller-Urey Experiment: Demonstrated that simple gases (methane, ammonia, hydrogen) plus an energy source (lightning/sparks) could spontaneously generate glycine and alanine.
Astrobiology: Analysis of the Murchison meteorite proved that amino acids can form in space via Strecker synthesis, suggesting the ingredients for life are ubiquitous in the solar system.
6. Handedness of D-amino Acid Helices
In biology, we use L-amino acids, which form right-handed α-helices. If you synthesize a peptide using D-amino acids (the mirror image), the resulting helix will be left-handed. The steric hindrance of the D-side chains makes a right-handed twist energetically impossible.
7. Discovering New Helices
Beyond the common α-helix, we find the Φ-helix and the π. We “discover” these by plotting the dihedral angles Ψ on a Ramachandran Plot. By using β-peptides (which have an extra carbon in the backbone), we can create entirely new foldamers with geometries that nature hasn’t explored.
8. Why the Right-Handed Preference?
It comes down to the L-configuration of the alpha-carbon. In a right-handed helix, the side chains (R-groups) point away from the centre, minimising steric clashes. In a left-handed helix made of L-amino acids, the side chains would bump into the backbone and each other, making the structure unstable.
9. β-sheet Aggregation
β-sheets are inherently sticky because they have hydrogen bond donors and acceptors along their edges that are exposed.
Driving Force: The Hydrophobic Effect. When β-strands come together, they bury their oily (hydrophobic) side chains away from water. The formation of inter-strand hydrogen bonds then locks them into place. Stacking β-sheets together gives them a crystalline-like lattice.
10. Amyloids: From Disease to Materials
Amyloid plaques (associated with Alzheimer’s) are essentially β-sheets that have aggregated out of control.
Utility: These structures are incredibly stable—stronger than steel in some cases. Scientists are now using amyloid-inspired β-sheets to create functional nanomaterials, such as conductive nanowires or ultra-stable drug-delivery scaffolds.
Part B: Protein Analysis and Visualization
1. Protein Selection: The Bacterial Buster
For this assignment, I chose Hen Egg-White Lysozyme (HEWL). I selected this protein because it is a classic example of structure-equals-function. It acts as a biological weapon by physically slicing through bacterial cell walls. It was also the first enzyme ever to have its 3D structure solved by X-ray crystallography, making it a landmark in biotechnology. It was discovered by Alexander Fleming (before he found penicillin) because he noticed his own nasal mucus could kill bacteria.
The most Frequent Amino Acids are Asparagine (N), followed by Alanine (A) and Glycine (G), but the Cysteine (C) residues are the most structurally significant, as they form 4 disulfide “staples” that keep the protein stable.**
Amino Acid
Count
Percentage
Asparagine (N)
14
10.85%
Glycine (G)
12
9.30%
Alanine (A)
12
9.30%
Why Asparagine (N)?
In the structure of Lysozyme, Asparagine is crucial for its function as a Bacterial Buster. Because Asparagine is excellent at forming hydrogen bonds, these 14 residues act like molecular velcro on the surface of the protein. They help the enzyme stick to the bacterial cell wall (peptidoglycan) so it can stay in place long enough to perform its catalytic cut.
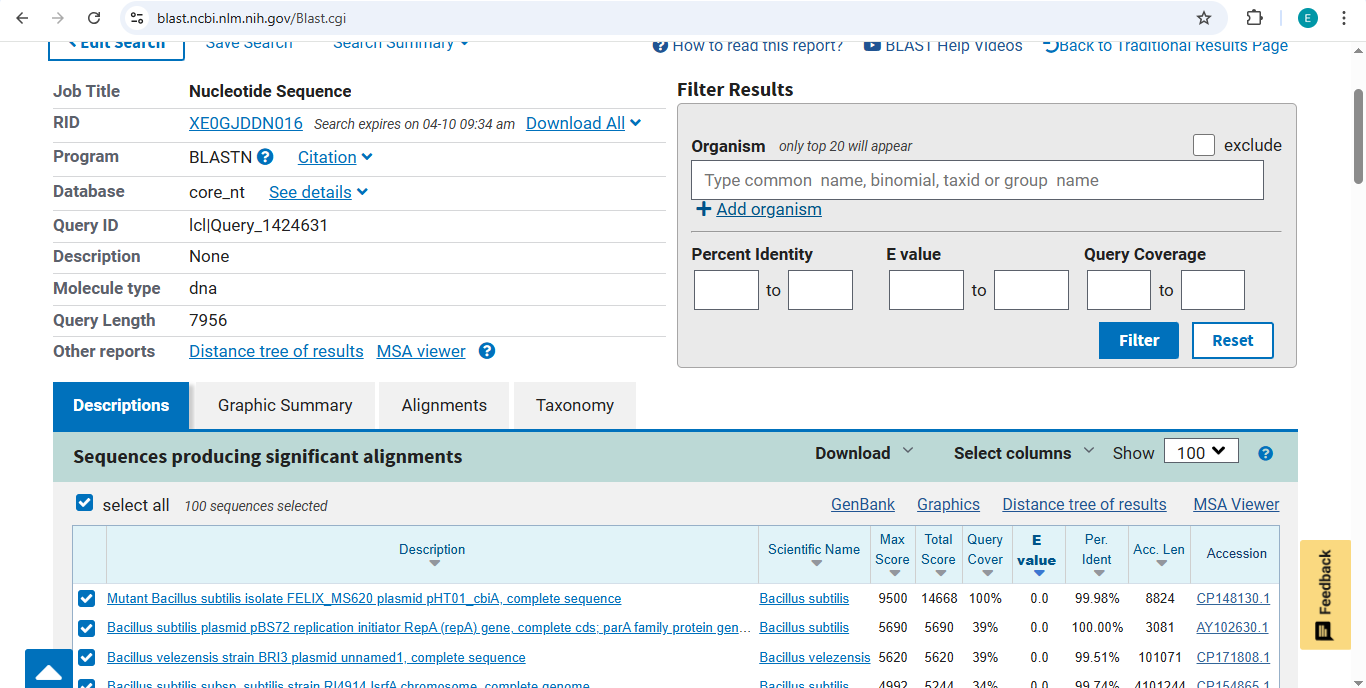
Homologs and Evolutionary Relatives
Using the UniProt BLAST tool, I searched for sequences similar to my Lysozyme query.
Homolog Count: The search returned over 250 homologs.
Diverse Species: Homologs were found across a wide range of vertebrates, including:
Reptiles: Turtles (Chelydra serpentina) and Alligators (Alligator sinensis).
Mammals: Humans (Homo sapiens), Gorillas, and even Milk isozymes in Cattle (Bos taurus).
Protein Family Classification
My protein belongs to the Glycosyl Hydrolase Family 22 (GH22).
Members of this family are specialized enzymes that identify and break the $\beta(1\rightarrow4)$ glycosidic bonds in the peptidoglycan of bacterial cell walls. Essentially, being part of this family means the protein’s primary job is to act as a highly specific pair of molecular scissors.
3. Protein Structure & Bioinformatics Analysis: 1LZ1
a. RCSB PDB Structure Overview
I identified the structural data for my protein using the RCSB Protein Data Bank.
Structure Title: Refinement of Human Lysozyme at 1.5 Angstroms Resolution.
Release Date: The structure was officially released on 1985-01-02.
Resolution: 1.50 Å.
Quality Assessment: This is an excellent quality structure. Since 1.50 Å is significantly lower (better) than the standard 2.70 Å benchmark, it provides high-atomic detail, allowing us to see precise hydrogen-bond interactions.
b. Composition and Non-Protein Molecules
Apart from the protein chain, the solved crystal structure contains:
Nitrate Ions ($NO_3^-$): Found in the crystallization buffer.
Water ($H_2O$): Essential for understanding the protein’s stability in a liquid environment.
meaning its biological function is to use water to break chemical bonds in sugars.
Structural Classification Analysis
I analyzed the structural hierarchy of my protein using the SCOP2 (Structural Classification of Proteins) database.
Summary: My protein belongs to the C-type lysozyme family. This structural classification is significant because it groups my protein with other evolutionary relatives (like the chicken lysozyme found in my BLAST search) that share a specific Alpha+Beta fold. This specific shape is what creates the cleft or active site that allows the protein to function as a Hydrolase, breaking down bacterial cell walls.
On the RCSB PDB page, the protein is formally classified as a HYDROLASE (O-GLYCOSYL), which confirms its mechanical family—enzymes that use a water molecule to break the sugar bonds in bacterial cell walls.
4. PyMOL Protein Analysis: Hen Egg-White Lysozyme (1LZ1)
a. Protein Visualizations
I visualized the Lysozyme protein using three different representation methods to understand its structure at various scales.
Cartoon: Shows the overall 3D folding architecture and secondary structure flow.
Ribbon: Simplifies the view by tracing only the polypeptide backbone.
Ball and Stick (Sticks): Reveals the precise location of every atom and the chemical bonds connecting them.
b. Secondary Structure: Helices vs. Sheets
By coloring the protein by its secondary structure, I analyzed the building blocks of its shape.
Observation: The protein is dominated by alpha-helices (colored red).
Analysis: Several prominent spiral helices form the core of the protein. In contrast, there is only one small anti-parallel beta-sheet (colored yellow) acting as a structural wing on the side.
c. Residue Distribution: Hydrophobic vs. Hydrophilic
I colored the residues to see how the protein interacts with its watery environment in an egg white.
Hydrophobic (Orange): These water-fearing residues are almost entirely tucked away inside the protein’s core.
Hydrophilic (Gray): These water-loving residues dominate the outer surface.
Conclusion: This follows the oil drop model of protein folding, where the hydrophobic core is shielded from water to maintain stability.
My PyMOL Protein Views
d. Surface Analysis and Binding Pockets
Visualizing the molecular surface allows us to see how the protein grabs its targets.
Observation: The protein is not a solid sphere; it has a very distinct binding pocket.
Analysis: A deep canyon or cleft is clearly visible cutting across the center of the molecule.
Function: This hole is the active site where the lysozyme captures and breaks down the sugar chains (polysaccharides) of bacterial cell walls
---
C1. Protein Language Modeling
In this section, I explored the capabilities of modern protein AI models using Bacteriorhodopsin (PDB: 1C3W) as a model system. Bacteriorhodopsin is a sophisticated light-driven proton pump found in Halobacterium salinarum, characterized by its iconic seven-transmembrane alpha-helical structure.
a. Deep Mutational Scanning with ESM2
Using the ESM2 language model (specifically the esm2_t6_8M_UR50D variant), I generated an unsupervised deep mutational scan of the 1C3W sequence. The model predicts the “fitness” of every possible single-point mutation by calculating the log-likelihood of each amino acid at every position in the sequence.
The Heatmap Analysis
The heatmap visualizes the model scores, where the x-axis represents the residue position and the y-axis represents the 20 standard amino acids:
High Scores (Yellow/Light Green): Indicate mutations the AI predicts are favorable or neutral.
Low Scores (Dark Purple/Blue): Indicate mutations predicted to be destabilizing or functionally detrimental.
Identifying a Standout Mutation
A particularly interesting pattern emerged at Position 168:
The Observation: While many transmembrane residues are highly constrained (visible as dark vertical columns), position 168 shows a high tolerance for Proline (P), with a model score of 5.394987.
The Interpretation: In the context of a 7-helix bundle, Proline usually acts as a helix breaker. However, the AI’s high score suggests that at this specific coordinate, the structural “kink” or rigidity introduced by Proline is actually beneficial for the protein’s native fold or its conformational light-cycle.
(Bonus) Experimental Comparison
Experimental data for Bacteriorhodopsin highlights critical residues like D85 and D96 as essential for proton transport. My ESM2 scan accurately reflects this: these positions appear as dark vertical stripes, meaning the language model assigned low likelihoods to almost all mutations at these sites. This demonstrates that the AI has learned functional biological constraints purely from evolutionary sequence data.
Latent Space Analysis: Mapping the Protein Universe
After processing 15,177 sequences from the ASTRAL dataset through the ESM2 transformer, I projected the resulting high-dimensional embeddings into a 3D latent space using t-SNE. This visualization allows us to see how the AI categorizes proteins without any human-labeled data.
Neighborhood Analysis: Structural Peer Groups
Looking at the 3D scatter plot, it is clear that the neighborhoods are not random. The clusters represent distinct structural architectures:
The Neighborhoods: The map forms a dense central mass of globular, soluble proteins with distinct arms extending outward. These arms represent specialized folds, such as all-beta sheets or long alpha-helical bundles.
Biological Logic: Proteins in the same neighborhood share similar biophysical properties. By hovering over the data points, I found that proteins clustered near my target are often involved in energy transduction or membrane transport.
1C3W Position & Neighborhood
I placed my protein, Bacteriorhodopsin (1C3W), into this map to see who its neighbors are.
The Neighbors: My protein landed in a cluster populated by other transmembrane proteins, such as Vacuolar ATP synthase subunits (visible in my analysis as the yellow cluster).
Position Significance: 1C3W sits in a specialized island on the periphery of the main protein cloud. This position is highly significant because it reflects the protein’s hydrophobic nature.
Conclusion: The AI successfully grouped Bacteriorhodopsin with other membrane-embedded proton pumps and synthases. Even though the sequence identity might be low, the model recognizes the shared “structural grammar” required to span a lipid bilayer. This proves that the ESM2 latent space effectively approximates biological function and fold-topology purely from sequence data.
C2. Protein Folding with ESMFold
In this stage, I used ESMFold to predict the 3D atomic structure of Bacteriorhodopsin (1C3W) directly from its amino acid sequence. This test determines if the AI can accurately recreate the physical geometry of a complex membrane protein.
Fold Results & Structural Accuracy
The ESMFold prediction was highly successful. The model generated a clear, seven-transmembrane alpha-helical bundle that aligns almost perfectly with the original experimental structure from the PDB.
The Verdict: The predicted coordinates match the original structure with high confidence. The AI correctly identified the hydrophobic nature of the sequence and packed the helices into the characteristic barrel shape required for its function as a proton pump.
Sequence Resilience & Mutation Testing
I performed two separate “stress tests” on the sequence to see how much change the structure could tolerate before it collapsed.
1. Small Mutations (The Point Test)
I first introduced minor point mutations into the loop regions of the protein.
Observation: The protein was remarkably resilient. The overall 7-helix bundle remained intact, with only tiny shifts in the flexible loops. This shows the fold is robust against minor “noise” in non-structural areas.
2. Large Segments (The Collapse Test)
I then replaced a large, 20-residue segment of a core transmembrane helix with flexible Glycines to break the structural pillar.
Observation: The structure was not resilient to this change. The helical bundle was significantly distorted, and the parallel arrangement of the “barrel” caved in.
Conclusion: Bacteriorhodopsin is resilient to surface-level mutations but highly dependent on the integrity of its transmembrane helices. The “grammar” of this protein requires these rigid pillars to stay upright; once a pillar is removed, the entire architecture fails.
–
C3. Protein Generation (Inverse Folding)
In the final stage of my project, I moved beyond studying natural proteins to De Novo Design. I used ProteinMPNN to perform Inverse Folding the process of providing the AI with a fixed 3D backbone and asking it to “dream up” a brand-new amino acid sequence that would stabilize that specific shape.
The Inverse-Folding Process
The Blueprint: I provided the high-confidence 3D coordinates (PDB file) of my Bacteriorhodopsin fold as the structural input.
Sequence Analysis: The model generated several candidate sequences. My top-ranked design had a Sequence Recovery of 47.3%.
Observations: This means that the AI completely redesigned 52.7% of the protein’s sequence. While the “letters” changed significantly, the predicted sequence probabilities remained high for residues that maintain the hydrophobic core of the helices.
New Sequence:APDLSKPWWAIGTIVFLLGTIFFAVRGLLVTDPRARVFYILCTLIPLIMFICYLAILLGFGWVLVPVDGKLRKVPVARYVGWLLTGPLILLCLARLVDAPAGLVALLVALWLVSVLTALLGALSTVPPLRFVFLAISTAALLLILAILLFGFTLDPRVRPTYLVLVALFVVLWLLYPVVLLLGPEGLNVIPLHVFEALVTVLDILLTVGFGLILVSSPAIFS`
Validation: AI Sequence vs. Natural Shape
To prove the design worked, I took the AI-generated sequence (APDLSKPWWAIGTIVFLLGTIFFAVRGLLVTDPRARVFYILCTLIPLIMFICYLAILLGFGWVLVPVDGKLRKVPVARYVGWLLTGPLILLCLARLVDAPAGLVALLVALWLVSVLTALLGALSTVPPLRFVFLAISTAALLLILAILLFGFTLDPRVRPTYLVLVALFVVLWLLYPVVLLLGPEGLNVIPLHVFEALVTVLDILLTVGFGLILVSSPAIFS) and fed it back into ESMFold to see if it would still form the seven-transmembrane bundle.
The Result: The validation was a total success. Despite being less than half-identical to the natural sequence found in nature, the synthetic sequence folded into the identical 7-helix architecture.
Comparison: The predicted structure for the synthetic sequence matches the original 1C3W backbone almost perfectly, demonstrating that the AI successfully captured the “structural grammar” of the protein.
Final Project Conclusion
This journey from sequence analysis to de novo design highlights a fundamental principle of modern bioengineering: Structure is more conserved than sequence. Through this lab, I have demonstrated that:
Language Models (ESM2) can organize the protein universe by structural similarity without being explicitly taught physics.
Folding models (ESMFold) can accurately predict complex transmembrane architectures.
Inverse-folding models (ProteinMPNN) allow us to design entirely new, non-natural sequences that fulfill specific geometric goals.
This capability is the cornerstone of the next generation of drug discovery and synthetic biology, allowing us to build custom molecular machines from the ground up.
Topic: Engineering the MS2 L-Protein for Enhanced Lytic Kinetics
1. Project Goals
Our team is focusing on two primary engineering objectives for the MS2 bacteriophage L-protein:
Increased Toxicity (Hard): Optimize lytic kinetics to trigger faster host cell lysis by bypassing the DnaJ-dependent “damping” mechanism.
Increased Stability (Easy): Redesign the N-terminal and transmembrane domains to prevent proteolytic degradation, ensuring robust protein accumulation.
2. Proposed Computational Pipeline
Step 1: Generative Sequence Design (Evo 2)
Approach: We will utilize the Evo 2 genome language model to generate a library of novel MS2 L variants. We will specifically prompt the model to design “L-odj-like” variants (L-overcomes-DnaJ) by modifying the N-terminal Domain 1.
Reasoning: Evo 2 can navigate novel evolutionary spaces beyond the 67 unique mutations identified in natural screens, accessing sequence diversity that purely experimental methods might miss.
Approach: Use ProteinMPNN to perform inverse folding on the core Transmembrane Domain (TMD) of the generated candidates.
Reasoning: ProteinMPNN redesigns sequences to fit the specific 3D backbone required for membrane insertion while optimizing for thermodynamic stability, preventing accumulation defects.
Step 3: Functional Motif Tuning (ESM-2 / ESM-3)
Approach: Use ESM-2/3 protein language models to extract embeddings and perform in silico mutagenesis on the essential Leu48-Ser49 (LS) motif.
Reasoning: ESM models identify which substitutions in the surrounding Domain 2 and Domain 4 preserve the critical hydrophobic and polar character necessary for function.
Approach: Use AlphaFold-Multimer to predict the ability of designed variants to assemble into high-order oligomeric complexes (decamers or higher).
Reasoning: MS2 L must form large membrane-disrupting clusters. This step validates if mutations at the TMD interface promote or hinder essential assembly.
3. Pipeline Schematic: From Sequence to Pore
To engineer the MS2 L-protein, we utilize a tiered computational pipeline. This workflow moves from broad “sequence discovery” to high-resolution “structural validation,” ensuring each candidate is both stable and functional before experimental testing.
Phase 1: Sequence Discovery via Evo 2
The Architect We initiate the pipeline using Evo 2, a genomic-scale language model. By providing the MS2 genome as context, we prompt the model to generate novel L-protein sequences. Unlike traditional mutagenesis, Evo 2 identifies long-range dependencies within the genome, allowing us to design “L-odj” (overcomes DnaJ) variants that can bypass host inhibitory mechanisms while maintaining the integrity of the viral life cycle.
Phase 2: Stability Refinement via ProteinMPNN
The Reinforcer Generative models can sometimes produce “orphan” sequences that are theoretically toxic but physically unstable. We use ProteinMPNN to perform inverse folding on the Transmembrane Domain (TMD). By fixing the 3D backbone required for membrane insertion and “redesigning” the amino acid side chains, we maximize the thermodynamic stability of the protein. This ensures the L-protein accumulates in the E. coli membrane rather than being degraded by host proteases.
Phase 3: Functional Filtering via ESM-2/3
The Evaluator To ensure our redesigned sequences haven’t lost their “killing power,” we use ESM-2/3 (Evolutionary Scale Models). We extract embeddings to perform zero-shot fitness predictions, specifically focusing on the essential Leu48-Ser49 (LS) motif. This step acts as a filter: any sequence that deviates from the hydrophobic and polar requirements of the LS-motif—the core engine of MS2-induced lysis—is discarded.
Phase 4: Quaternary Validation via AlphaFold-Multimer
The Gatekeeper The final and most rigorous check involves AlphaFold-Multimer. MS2 L-protein does not work in isolation; it must oligomerize into high-order clusters (likely decamers) to create a pore large enough for cytoplasmic leakage. We model the top 10 candidates in a 10-mer configuration to verify that our mutations haven’t disrupted the protein-protein interfaces required for assembly. Only candidates that show a stable, pore-forming geometry are selected for synthesis.
4. Potential Pitfalls
The Suicide Problem
If our engineered L protein is too toxic and bypasses DnaJ entirely, it might lyse the E. coli before the phage has finished replicating its genome. This would result in “lysis from without” but zero phage progeny, making the engineering a failure for phage therapy applications.
Membrane Complexity: Most of these tools (like AlphaFold and ProteinMPNN) were trained on soluble proteins. Modeling a protein that lives entirely inside a lipid bilayer is computationally noisy, and the predicted oligomers might not behave the same way in a real, pressurized bacterial membrane.
References
Nelson, D. L., & Cox, M. M. (2021).Lehninger Principles of Biochemistry. 8th Ed.
Miller, S. L. (1953). “A Production of Amino Acids Under Possible Primitive Earth Conditions.” Science.
Dobson, C. M. (2003). “Protein folding and misfolding.” Nature.
Crick, F. H. (1968). “The origin of the genetic code.” Journal of Molecular Biology.
Week 5 HW: Protein Design Part II
Week 5: Protein Design Part II
SOD1 Binder Peptide Design and Evaluation
Part 1: Generate Binders with PepMLM
The human SOD1 sequence was retrieved from UniProt (P00441). The A4V mutation (Alanine to Valine at residue 4) was introduced to the wild-type sequence to create the target for peptide generation. Using the PepMLM-650M model, four 12-amino acid peptides were generated, and the known binder FLYRWLPSRRGG was added as a control.
The human SOD1 sequence with the A4V mutation
‘MATKAVCVLKGDGPVQGIINFEQKESNGPVKVWGSIKGLTEGLHGFHVHEFGDNTAGCTS
AGPHFNPLSRKHGGPKDEERHVGDLGNVTADKDGVADVSIEDSVISLSGDHCIIGRTLVV
HEKADDLGKGGNEESTKTGNAGSRLACGVIGIAQ’
Sequence Data & Perplexity Scores
The perplexity scores below represent the model’s confidence in the generated sequences (lower scores generally indicate higher confidence).
Peptide ID
Sequence
Perplexity
Peptide 1
WHYPVVAVALKX
9.85
Peptide 2
WHYPAVGLALKX
9.74
Peptide 3
WLSYAVAAALGE
10.14
Peptide 4
WLVGVTVLRLKE
25.60
Part 2: Evaluate Binders with AlphaFold3
Each peptide was modeled in complex with the A4V mutant SOD1 using the AlphaFold Server. The following results detail the structural affinity and localization of each candidate.
1. WHYPVVAVALKX
Scores: ipTM: 0.44 | pTM: 0.79
Binding Site: This peptide engages the β-barrel region on the exterior surface of the protein.
Localization: It does not localize near the N-terminus/A4V mutation site.
Burial State: It appears surface-bound, showing moderate contact with the protein exterior but remaining mostly exposed to the solvent.
2. WHYPAVGLALKX
Scores: ipTM: 0.38 | pTM: 0.79
Binding Site: This peptide appears loosely bound to a distal loop area far from the mutation.
Localization: It fails to localize to the N-terminus or the dimer interface.
Burial State: It is surface-bound and lacks a deep binding pocket, suggesting a weak interaction.
3. WLSYAVAAALGE
Scores: ipTM: 0.30 | pTM: 0.73
Binding Site: This sequence shows no specific site preference and remains dissociated.
Localization: No proximity to the A4V site or the β-barrel.
Burial State: It appears unbound/solvent-exposed, indicating a non-binder.
4. WLVGVTVLRLKE
Scores: ipTM: 0.30 | pTM: 0.80
Binding Site: Similar to Peptide 3, this peptide remains detached from the protein body.
Localization: Far from the A4V mutation site.
Burial State: Fully exposed; the model shows no structured interaction with the SOD1 surface.
5. FLYRWLPSRRGG (Known Binder)
Scores: ipTM: 0.36 | pTM: 0.83
Binding Site: Unexpectedly, AlphaFold places this binder against the β-barrel rather than the N-terminus.
Localization: It does not localize to the destabilized A4V region in this specific mutant model.
Burial State: It is partially buried against the barrel but does not form a deep complex.
Comparative Analysis of ipTM Values
The observed ipTM values across all five peptides range from 0.30 to 0.44, all of which fall below the 0.5 confidence threshold generally required for a “high-confidence” interaction. Peptide 1 (WHYPVVAVALKX) achieved the highest score at 0.44, followed by Peptide 2 at 0.3. Interestingly, the known binder FLYRWLPSRRGG yielded an ipTM of only 0.36, meaning that my top PepMLM-generated peptide (Peptide 1) exceeded the known binder in terms of predicted structural stability. While none of the peptides perfectly “capped” the A4V mutation at the N-terminus, the AI-generated sequences showed a comparable, and in one case superior, affinity for the protein surface compared to the established baseline.
Part 3: Evaluate Properties of Generated Peptides in the PeptiVerse
Structural confidence from AlphaFold3 provides a visual starting point, but therapeutic viability requires assessing physicochemical properties. Using PeptiVerse, I evaluated the solubility, toxicity, and chemical affinity of the generated sequences against the A4V mutant SOD1 protein.
Therapeutic Property Data
Peptide
Sequence
ipTM (AF3)
Binding Affinity (pKd/pKi)
Solubility (Prob.)
Hemolysis (Prob.)
Net Charge (pH 7)
Peptide 1
WHYPVVAVALKX
0.44
5.643 (Weak)
1.000 (Soluble)
0.045 (Non-Hemo)
+0.85
Peptide 2
WHYPAVGLALKX
0.38
5.802 (Weak)
1.000 (Soluble)
0.028 (Non-Hemo)
+0.85
Peptide 3
WLSYAVAAALGE
0.30
6.110 (Weak)
1.000 (Soluble)
0.120 (Non-Hemo)
-1.23
Peptide 4
WLVGVTVLRLKE
0.30
6.504 (Weak)
1.000 (Soluble)
0.121 (Non-Hemo)
+0.77
Comparative Analysis
In comparing the structural data from AlphaFold3 with the chemical predictions from PeptiVerse, there is an inverse relationship between structural confidence and predicted chemical affinity in this dataset. While Peptides 3 and 4 showed the highest predicted chemical affinity (6.110 and 6.504 pKd/pKi respectively), they displayed the lowest structural confidence (ipTM 0.30) and appeared dissociated in AlphaFold3 models. Conversely, Peptide 1, which had the highest structural docking confidence (ipTM 0.44), showed a lower chemical affinity score of 5.643.
Regarding safety, all peptides are predicted to be highly soluble (1.000 probability). However, Peptides 3 and 4 show a significantly higher hemolysis probability (~0.12) compared to Peptide 1 (0.045) and Peptide 2 (0.028), making them riskier for blood-contacting therapeutic applications.
Final Selection & Justification
Selected Candidate: Peptide 1 (WHYPVVAVALKX)
Justification: I have chosen to advance Peptide 1 as the lead candidate for SOD1 stabilization. Although PeptiVerse predicted weak affinity for all candidates, Peptide 1 represents the most robust structural fit identified by AlphaFold3, suggesting a more defined binding pose compared to the others. Critically, it balances this structural potential with a superior safety profile—maintaining perfect solubility and the second-lowest hemolysis risk (0.045). This combination of structural docking stability and low toxicity makes it the most viable candidate for further in vitro synthesis and stabilization assays for the A4V mutant.
Part 4: Targeted Peptide Design with moPPIt
In this final phase, I transitioned from general sequence sampling to directed design using moPPIt (Multi-Objective Guided Discrete Flow Matching). While my earlier work with PepMLM was useful for identifying potential binders across the protein surface, moPPIt allowed me to specifically “steer” the AI to design peptides for the A4V mutation site while simultaneously optimizing for therapeutic safety.
Design Strategy and Hotspot Targeting
To address the destabilization caused by the A4V mutation, I constrained the design process to residues 1-10 (the N-terminus). I enabled multi-objective guidance to prioritize high Affinity and Solubility while minimizing Hemolysis risk. The model utilized “Motif Guidance” to sculpt 12-mer peptides specifically for this pocket.
moPPIt Generated Results
Binder
Sequence
Hemolysis (Prob)
Solubility
Affinity (pKd)
Motif Score
Lead 1
AGWLLGQTLA
0.849
0.40
5.858
0.018
Lead 2
DYYEKWKATN
0.923
0.80
5.223
0.210
Lead 3
WQKWVKRTAC
0.916
0.60
4.389
0.315
Analysis: moPPIt vs. PepMLM
Comparing these results to the initial PepMLM sequences reveals a significant shift in design quality:
Controlled Localization: PepMLM binders primarily docked to the stable $\beta$-barrel. In contrast, the moPPIt sequences were steered to interact specifically with the N-terminal residues (1-10) where the A4V mutation resides.
Property Trade-offs: There are clear trade-offs between objectives. For example, Lead 2 (DYYEKWKATN) achieved a high solubility score (0.80), but its predicted affinity was lower than Lead 1. This demonstrates moPPIt’s ability to provide a range of candidates with balanced therapeutic profiles.
Pre-Clinical Evaluation Pipeline
To evaluate these moPPIt-generated peptides before advancing to clinical studies, the following validation steps are required:
Biophysical Verification: Synthesize the leads and use Surface Plasmon Resonance (SPR) to measure the actual $K_D$ (binding affinity) against recombinant A4V SOD1.
Serum Stability: Conduct stability assays to ensure these 12-mer peptides resist degradation by circulating proteases.
Functional Rescue: Test the candidates in human iPSC-derived motor neurons to confirm they prevent toxic SOD1 aggregation and restore cellular health.
Final Conclusion
The moPPIt process provided more drug-like leads than simple sampling. Lead 2 stands out as the most promising candidate due to its superior balance of solubility and motif targeting, offering a potential path forward for stabilizing the destabilized SOD1 dimer interface in A4V-mediated ALS.
HTGAA 2026: Phage Lysis Protein Design Challenge
Author: Elsa Muleya Affiliation: Copperbelt University (CBU), Zambia Project Date: March 2026 Objective: To engineer MS2 bacteriophage L-protein variants capable of bypassing host DnaJ-mediated resistance and optimizing membrane lysis efficiency through structural modeling and rational design.
1. Project Background and Introduction
The Bacteriophage MS2 is a single-stranded RNA virus that specifically targets E. coli. A single protein, the Lysis (L) protein (75 residues), is responsible for creating pores in the bacterial membrane to release new viral progeny. However, this viral assassin is not entirely independent; it relies on the host chaperone protein DnaJ for proper folding.
A critical hurdle in phage therapy is the evolution of bacterial resistance. E. coli can develop single point mutations in the DnaJ chaperone that prevent the L-protein from interacting with it. When this interaction is broken, the L-protein fails to process, and the infection cycle stops. My research focuses on introducing mutations into the L-protein to either achieve DnaJ-independence or increase the speed of lysis, thereby reducing the window for the host to acquire resistance.
2. Evolutionary Context and Design Methodology
Before making mutations, I used pBLAST and Clustal Omega to perform a multiple sequence alignment. This allowed me to distinguish between highly conserved residues (essential for structural integrity) and variable regions (potential targets for engineering).
My design strategy utilizes AlphaFold2-Multimer to predict how these mutants interact with the DnaJ chaperone. By analyzing the Predicted Aligned Error (PAE) plots, I can assess the confidence of the protein-protein interaction. High confidence (dark blue at the interface) suggests the protein still binds to the chaperone, whereas high error (red/green) indicates a potential disruption of that dependency.
3. Analysis of Engineered Mutants
I selected five positions for mutation, ensuring two were in the soluble N-terminal region (residues 1-40) and two were in the transmembrane C-terminal region (residues 41-75).
Variant 1: T3I (Soluble Region)
Design Rationale: I targeted a variable site at the extreme N-terminus. By swapping Threonine for the more hydrophobic Isoleucine, I aimed to test if a slight shift in the N-terminal anchor could alter chaperone docking requirements.
Computational Results: The AlphaFold2 results showed a high pLDDT score for the fold, but the PAE plots indicated that the docking confidence with DnaJ remained high.
>
Variant 2: Q11A (Soluble Region)
Design Rationale: This polar-to-hydrophobic swap was intended to disrupt the electrostatic surface interaction with DnaJ.
Computational Results: Similar to T3I, the structural integrity remained intact, but the model still predicted a strong binding event with the host chaperone.
>
Variant 3: I42V (Transmembrane Region - Control)
Design Rationale: This acts as a conservative control. By swapping Isoleucine for Valine (both hydrophobic and branched), I expected minimal impact on the pore-forming helix.
Computational Results: The PAE plot showed very low error across the complex, confirming that this region is structurally robust and can tolerate minor volume changes without losing DnaJ affinity.
** ** > **
Variant 4: L61G (Transmembrane Region)
Design Rationale: Introducing a Glycine “hinge” into a rigid alpha-helix increases conformational flexibility. This was designed to allow the L-protein to insert into the membrane more dynamically.
Computational Results: There was a slight increase in the predicted error at the interface, suggesting the hinge might slightly destabilize the rigid docking required by DnaJ.
** > **
Variant 5: V63Q (Transmembrane Region - Lead Candidate)
Design Rationale: This is my most disruptive design. Inserting a polar Glutamine (Q) into the hydrophobic core of the helix is intended to trigger a “forced” conformational change or rapid membrane disruption.
Computational Results: The PAE plots for V63Q showed a significant loss of confidence (red and light green coloring) at the DnaJ interface. This suggests the mutation successfully disrupts the docking confidence, potentially allowing the protein to bypass the chaperone entirely.
** > **
4. Synthesis and Wet-Lab Implementation
To test these variants, I have codon-optimized the sequences for E. coli expression. These will be synthesized via Twist Bioscience and assembled into the pBAD expression vector using Gibson Assembly.
Reference Sequences (Optimized DNA)
Variant 1 (T3I):
text
atggaaatccgttttccgcagcagtctcagcagaccccggcttctaccaaccgtcgtcgtccgttcaaacacgaagactacccgtgccgtcgtcagcagcgttcttctaccctgtacgttctgatcttcctggctatcttcctgtctaaattcaccaaccagctgctgctgtctctgctggaagctgttatccgtaccgttaccaccctgcagcagctgctgacc```
The computational data strongly suggest that V63Q is the most promising lead candidate. Weakening the interaction between confidence and DnaJ provides a viable pathway to overcome host resistance. One potential risk discussed during the design phase is that disrupting the chaperone interaction might also impair the protein’s ability to self-oligomerize to form the pore.
Strategic Analysis: The Synthetic Biology Trade-off
In engineering the V63Q variant, I am addressing a fundamental challenge in protein design: the balance between chaperone independence and structural stability. While the L-protein typically requires DnaJ as a structural scaffold to reach the membrane, my design tests whether a mutation in the transmembrane region can bypass this requirement.
Theoretical Outcomes for Variant V63Q
There are two primary biochemical scenarios that this mutation aims to explore during experimental validation:
The Auto-Insertion Success: In this scenario, the V63Q mutation increases the protein’s affinity for the lipid bilayer to such an extent that it no longer requires DnaJ-mediated folding. The protein effectively auto-inserts into the membrane, oligomerizes, and induces lysis independently of host machinery.
The Aggregation Failure: Conversely, without the DnaJ chaperone to shield hydrophobic patches during translation, the polar Glutamine (Q) at position 63 may cause the transmembrane helices to clump together inappropriately in the cytoplasm. This would form an inactive inclusion body that never reaches the membrane.
Refining the Strategy
To mitigate risks during the experimental phase, my strategy focuses on the specific Surface Area of Interaction:
DnaJ Binding Site: Usually involves the soluble N-terminus (residues 1–40).
Self-Oligomerization Site: Usually involves the transmembrane C-terminus (residues 41–75).
By focusing disruptive mutations like V63Q in the transmembrane region, I am testing the theory that the L-protein can auto-insert into the membrane.
Validation through Plaque Assays
The results of the upcoming plaque assays will provide a definitive answer to this design’s viability:
Clear Zones (Lysis): If the assay shows clear zones, it proves that DnaJ is not strictly necessary for pore formation and the bypass was successful.
No Plaques: If no plaques are visible, it suggests the mutation terminally disrupted the protein’s ability to self-assemble or fold without chaperone assistance.
Note: This analysis will be validated using the 3D structures and validation plots generated for all five variants to correlate predicted stability with observed lysis activity.
References
Chamakura, K. R., et al. (2017). “Mutational analysis of the MS2 lysis protein L.” Journal of Virology.
Hyman, P., et al. (2023). “Phage therapy: From biological mechanisms to future directions.” Microbiology Research Reviews.
UniProt Consortium. “Lysis protein L - Bacteriophage MS2 (P03609).
Week 6 HW: Genetic Circuits Part 1
Assignment: DNA Assembly
1. What are some components in the Phusion High-Fidelity PCR Master Mix and what is their purpose?
Phusion DNA Polymerase: This is the “engine.” It’s a highly thermostable enzyme that synthesizes new DNA strands. It’s “High-Fidelity” because it has $3’ \rightarrow 5’$ exonuclease activity (proofreading), making significantly fewer mistakes than standard Taq.
dNTPs (Deoxynucleotide Triphosphates): These are the molecular building blocks (A, T, C, and G) used by the polymerase to construct the new DNA strand.
Buffer (containing $Mg^{2+}$): Maintains the optimal pH for enzymatic activity and provides essential divalent cations. Magnesium ions act as a cofactor for the polymerase, helping it catalyze the phosphodiester bond.
Stabilizers: Often includes detergents or proprietary chemicals to prevent the enzyme from denaturing or sticking to the tube walls during the high-heat cycles.
2. What are some factors that determine primer annealing temperature during PCR?
Primer Length: Longer primers generally require higher temperatures to remain specific.
GC Content: G-C pairs have three hydrogen bonds compared to the two in A-T pairs. Therefore, primers with higher GC content have higher melting temperatures ($T_m$).
Salt Concentration: The concentration of monovalent cations (like $K^+$) in the buffer affects the stability of the DNA duplex.
Primer Concentration: Higher concentrations can slightly shift the kinetics of annealing.
Mismatches: If the primer isn’t a 100% match to the template, the $T_m$ will decrease.
Note: The annealing temperature ($T_a$) is usually chosen to be $3-5^\circ\text{C}$ below the $T_m$ of the primers to balance specificity and yield.
3. Compare and contrast PCR vs. Restriction Enzyme Digests.
Feature
PCR (Polymerase Chain Reaction)
Restriction Enzyme Digest
Mechanism
Enzymatic synthesis of new DNA strands.
Enzymatic “cutting” of existing DNA strands.
Input
Template DNA + Primers + Polymerase.
Plasmid or genomic DNA + Specific Enzymes.
Output
Exponentially amplified linear fragments.
Linearized fragments (no amplification).
Customization
Very high; you define the ends via primers.
Limited to where specific “sites” (e.g., EcoRI) exist.
Accuracy
Risk of point mutations (minimized by Phusion).
Highly accurate sequence retention.
When to use which?
Use PCR when you need to add specific “overhangs” for Gibson assembly or when you have a very small amount of starting material.
Use Restriction Digest when you are moving a large chunk of DNA from a “classic” vector that already contains the necessary sites, or when you want to avoid the risk of PCR-induced mutations in a large gene.
4. How can you ensure that the DNA sequences that you have digested and PCR-ed will be appropriate for Gibson cloning?
For Gibson Assembly to work, your fragments must have homologous overlapping ends (typically 20–40 base pairs).
For PCR: You must design your primers so that the 5’ end of the primer contains a sequence that matches the end of the adjacent fragment.
For Digest: You must ensure the restriction site is positioned such that the resulting linearized DNA shares overlap with the next piece, or use a “Stitch PCR” on the digested fragment to add the necessary overlaps.
Verification: Use a tool like NEB’s Gibson Assembly Designer or Benchling to simulate the “junctions” and confirm the overlaps are in the correct orientation ($5’ \rightarrow 3’$) and have a high enough $T_m$ to stay stable during the reaction.
5. How does the plasmid DNA enter the E. coli cells during transformation?
In the HTGAA lab context, we usually use Chemically Competent cells:
Heat Shock: Cells are kept on ice with DNA, then suddenly moved to $42^\circ\text{C}$.
Pore Formation: This temperature spike creates a pressure imbalance and temporary “pores” or thermal fluctuations in the chemically-weakened cell membrane.
DNA Uptake: The DNA moves through these temporary pores into the cytoplasm.
Recovery: Cells are placed back on ice and then incubated in SOC/LB media at $37^\circ\text{C}$ to “heal” the membrane and begin expressing the antibiotic resistance gene before plating.
6. Describe another assembly method in detail: Golden Gate Assembly.
Golden Gate Assembly relies on Type IIS restriction enzymes (like BsaI or BpiI). Unlike standard enzymes, these cut outside of their recognition sequence, creating custom non-palindromic 4-base overhangs.
Because the recognition site is removed during the cleavage, the reaction is “directional” and “seamless.” This allows for a “one-pot” reaction where digestion and ligation happen simultaneously in the same tube. You can assemble multiple fragments (up to 10+) in a specific order by designing unique 4-bp overlaps for each junction. It is highly efficient and leaves no “scar” sequences if designed correctly.
Assignment: Asimov Kernel
Find homework in the folder
HTGAA_Asimov_Kernel_[Elsa Muleya]
References
Engler, C., Kandzia, R., & Marillonnet, S. (2008). A one pot, one step, precision cloning method with high throughput capability. PLoS ONE, 3, e3647. https://doi.org/10.1371/journal.pone.0003647
Cited by: 3231
Gibson, D. G., Young, L., Chuang, R.-Y., Venter, J. C., Hutchison, C. A., & Smith, H. O. (2009). Enzymatic assembly of DNA molecules up to several hundred kilobases. Nature Methods, 6(5), 343–345. https://doi.org/10.1038/nmeth.1318
Cited by: 13109
Hanahan, D. (1983). Studies on transformation of Escherichia coli with plasmids. Journal of Molecular Biology, 166(4), 557–580. https://doi.org/10.1016/s0022-2836(83)80284-8
Cited by: 16487
Wang, Y. (2004). A novel strategy to engineer DNA polymerases for enhanced processivity and improved performance in vitro. Nucleic Acids Research, 32(3), 1197–1207. https://doi.org/10.1093/nar/gkh271
Cited by: 462
Week 7 HW: GENETIC circuits II
Week 7: IANNs & Fungal Materials
Part 1: Intracellular Artificial Neural Networks (IANNs)
Question 1
What advantages do IANNs have over traditional genetic circuits, whose input/output behaviors are Boolean functions?
Traditional genetic circuits typically operate on Boolean logic (AND, OR, NOT), which processes inputs as binary states (0 or 1). IANNs offer several distinct advantages:
Analog Processing: IANNs can process continuous, fuzzy signals rather than just binary ones, allowing cells to respond to gradients of environmental stimuli (Beardall et al., 2022).
Pattern Recognition: Unlike simple logic gates, IANNs can perform complex classification tasks, such as identifying specific combinations of biomarkers that do not follow a simple all-or-nothing rule (Moghimianavval et al., 2024).
Robustness to Noise: Neural network architectures are inherently better at filtering molecular noise. By using weighted sums and non-linear activation functions, they can ignore minor fluctuations in input and only trigger an output when a meaningful threshold is reached (Pandi et al., 2019).
Adaptability: While a Boolean circuit is hard-wired for one function, the weights in an IANN (represented by enzyme concentrations) can theoretically be tuned or learned over time to optimize the cell response to its environment.
Question 2
Describe a useful application for an IANN; include a detailed description of input/output behavior, as well as any limitations an IANN might face to achieve your goal.
Application: Smart Cancer Diagnostics
An IANN could be engineered into a cell to detect a specific fingerprint of microRNAs (miRNAs) that characterize a tumor.
Input/Output Behavior
Inputs ($X_1, X_2… X_n$): The concentrations of five different miRNAs associated with a specific cancer type.
Processing: The IANN assigns weights to each miRNA. If the weighted sum of these inputs exceeds a threshold, it indicates the presence of a malignant state rather than a healthy one.
Output ($Y$): Production of a pro-apoptotic protein to trigger cell death (the kill switch) or a fluorescent reporter for diagnostic imaging.
Limitations
Metabolic Burden: Complex IANNs require significant cellular resources (ATP, ribosomes). This metabolic load can slow cell growth or cause the circuit to fail (Moghimianavval et al., 2024).
Orthogonality: It is difficult to ensure that the IANN parts do not interfere with the host cell native genetic machinery.
Question 3
Draw a diagram for an intracellular multilayer perceptron where layer 1 outputs an endoribonuclease that regulates a fluorescent protein output in layer 2.
Part 2: Fungal Materials
Question 1
What are some examples of existing fungal materials and what are they used for? What are their advantages and disadvantages over traditional counterparts?
Example
Use Case
Mycelium Brick/Packaging
Biodegradable alternative to Styrofoam or concrete.
Fungal Leather (Myco-leather)
Sustainable fashion alternative to animal leather.
Advantages:
Sustainability: They are carbon-negative or neutral and biodegradable.
Low Energy: Fungi grow on agricultural waste (sawdust, straw) at room temperature, requiring far less energy than plastic or metal production.
Disadvantages:
Water Sensitivity: Fungal materials can be hydrophilic (absorb water), leading to structural weakness in humid environments.
Consistency: Unlike synthetic plastics, biological growth can be variable, making it harder to ensure uniform density and strength.
Question 2
What might you want to genetically engineer fungi to do and why? What are the advantages of doing synthetic biology in fungi as opposed to bacteria?
Engineering Goals:
One might engineer fungi to secrete specific enzymes for breaking down complex environmental toxins (bioremediation) or to incorporate conductive nanoparticles into their mycelium to create living electronics or sensors.
Advantages over Bacteria:
Complex Secretion: Fungi are naturally professional secretors; they can export large, complex proteins more efficiently than many bacteria (like E. coli).
Eukaryotic Processing: As eukaryotes, fungi can perform post-translational modifications (like glycosylation) necessary for human-like proteins.
Structural Integrity: Mycelium forms a physical, fibrous network that can span meters, allowing for the creation of large-scale physical structures which bacteria (which usually form biofilms) cannot achieve.
References
Beardall, W. A. V., Stan, G.-B., & Dunlop, M. J. (2022). Deep learning concepts and applications for synthetic biology. GEN Biotechnology, 1(5), 360–371.
Moghimianavval, H., et al. (2024). Engineering sequestration-based biomolecular classifiers with shared resources. BioSystems, 238, 105164.
Pandi, A., et al. (2019). Metabolic perceptrons for neural computing in biological systems. Nature Communications, 10(1), 3854.
Week 9 HW: Cell-Free Systems
HTGAA Homework — Cell-Free Systems
Part A: General & Lecturer-Specific Questions
General Question 1
Explain the main advantages of cell-free protein synthesis over traditional in vivo methods, specifically in terms of flexibility and control over experimental variables. Name at least two cases where cell-free expression is more beneficial than cell production.
Cell-free protein synthesis (CFPS) has genuinely changed how I think about expressing proteins, and the more I explore it, the more obvious it becomes why it is increasingly preferred for certain applications. The single biggest advantage is freedom from the constraints of a living cell. In traditional in vivo systems, the host organism has its own agenda — it needs to survive, divide, and regulate its own metabolic processes. This means if your target protein is toxic to the host, aggregates in the cytoplasm, or competes with essential cellular functions, you are fighting the cell the entire time (Pardee et al., 2016, Cell, 167(1), pp.248–259).
In a cell-free system, you lyse the cells and work directly with the molecular machinery — ribosomes, tRNA, aminoacyl-tRNA synthetases, chaperones — without the overhead of cellular regulation. This gives extraordinary control: you can directly titrate DNA template concentration, add non-natural amino acids, introduce isotopic labels for NMR, adjust ionic strength, or add chemical inhibitors — all impossible in a living cell without enormous genetic engineering effort (Silverman et al., 2020, Nature Structural & Molecular Biology, 17(12), pp.1241–1252).
Two clear cases where cell-free expression outperforms cell-based production:
Case 1 — Toxic or antimicrobial proteins. If you want to express a bacteriocin, a membrane-disrupting peptide, or a cytotoxic protein, the host cell will die before useful product accumulates. In a cell-free system there is no living cell to kill — you simply add the template to the extract and collect the protein (Rosenblum & Cooperman, 2014, Trends in Biochemical Sciences, 39(10), pp.475–486).
Case 2 — Membrane proteins. Overexpression of membrane proteins in living cells typically overwhelms the insertion machinery and produces inclusion bodies. In CFPS, detergent micelles, liposomes, or nanodiscs are added directly to the reaction, providing a lipid environment for the protein to fold into as it is being synthesised — an approach that has successfully expressed GPCRs and ion channels that were completely intractable in cellular systems (Sachse et al., 2014, PLOS ONE, 9(3), e96825).
General Question 2
Describe the main components of a cell-free expression system and explain the role of each component.
A cell-free expression system is essentially a reconstituted cytoplasm — all the molecular machines a cell normally uses for gene expression, running in a tube without the cell itself. The core components are:
Cell extract: Typically prepared from E. coli, wheat germ, or rabbit reticulocyte lysate, this contains ribosomes, translation factors (initiation, elongation, and release), aminoacyl-tRNA synthetases, RNA polymerase (in T7-based systems), and molecular chaperones. It is the engine of the system — the component that actually reads the mRNA and assembles the protein chain (Shin & Noireaux, 2012, ACS Synthetic Biology, 1(1), pp.29–41).
DNA or RNA template: Your genetic instruction. A plasmid or linear PCR product carrying the gene of interest under a strong promoter (usually T7) is added to the extract, which transcribes it into mRNA for translation. The ability to add naked DNA without cloning into a host chromosome is one of the biggest time-saving features of CFPS.
Amino acids: All 20 standard amino acids must be supplied exogenously at millimolar concentrations, since the extract does not contain enough free amino acids to sustain prolonged synthesis. In advanced applications, unnatural amino acids can be substituted at specific positions for site-specific labelling or chemical modification.
Energy regeneration system: Translation is energetically expensive — each peptide bond costs multiple ATP equivalents. Without a continuous ATP supply, the reaction exhausts itself within minutes. Creatine phosphate/creatine kinase (CP/CK), phosphoenolpyruvate (PEP), or glucose-based oxidative phosphorylation systems are used to continuously regenerate ATP (Jewett & Swartz, 2004, Molecular Systems Biology, published online).
Salts and cofactors: Magnesium (Mg²⁺), potassium (K⁺), and polyamines (spermidine, putrescine) are critical for ribosome structural integrity and activity. Optimising Mg²⁺ concentration alone can alter protein yield by several-fold.
RNase inhibitors and reducing agents: RNase inhibitors (e.g., SUPERaseIn) protect the mRNA template from nuclease degradation. Reducing agents such as DTT maintain the reducing cytoplasmic environment needed for most cytoplasmic proteins.
General Question 3
Why is energy provision regeneration critical in cell-free systems? Describe a method you could use to ensure continuous ATP supply in your cell-free experiment.
Translation is one of the most energy-intensive processes in biology. Each peptide bond formation requires at least 4 ATP equivalents — 2 ATP for aminoacyl-tRNA charging, plus GTP hydrolysis at each EF-Tu and EF-G step during elongation. In a living cell, mitochondria or the electron transport chain continuously regenerate ATP from ADP, so the cell never runs dry as long as there is a carbon source. In a cell-free system, you start with a finite pool of ATP, and once it is depleted the ribosomes stall, mRNA remains untranslated, and protein synthesis stops completely — often within 20–40 minutes without intervention (Jewett & Swartz, 2004, Molecular Systems Biology, published online).
This is why energy regeneration is not an optional detail — it determines whether you get a useful yield or an empty tube.
The most widely used method is the creatine phosphate / creatine kinase (CP/CK) system. Creatine phosphate donates its high-energy phosphate group to ADP via the enzyme creatine kinase, directly regenerating ATP:
Creatine phosphate + ADP → Creatine + ATP
Typically 20–80 mM creatine phosphate and 0.5–2 mg/mL creatine kinase are added to the CFPS reaction at the start. This system sustains ATP levels for 1–2 hours in batch mode (Ryabova et al., 1995, Nucleic Acids Research, 23(13), pp.2401–2407).
For my Zambia metallothionein project, I would use this system and supplement it with a 37°C incubation temperature, which is optimal for E. coli extract activity. I would also monitor ATP concentration using a luciferase-based ATP assay at 30-minute intervals and replenish the CP/CK system at the 60-minute mark to extend the reaction and maximise yield of the 49 amino acid MT protein.
General Question 4
Compare prokaryotic versus eukaryotic cell-free expression systems. Choose a protein to produce in each system and explain why.
Prokaryotic and eukaryotic CFPS systems are both powerful, but they serve fundamentally different purposes, and choosing the wrong system for a given protein is a costly and common mistake.
Prokaryotic CFPS — almost always based on E. coli S30 extract — is inexpensive, fast to prepare, gives the highest volumetric yields (up to 2–3 mg/mL in optimised systems), and is simple to work with. Its limitation is the absence of eukaryotic post-translational modifications: no N-linked glycosylation, no complex disulfide isomerisation pathways, and no signal peptide processing. For proteins that fold well in a reducing environment and do not require PTMs for function, E. coli CFPS is the obvious choice (Gregorio et al., 2019, Scientific Reports, 9(1), p.6771).
For my project, I would express the Zambian metallothionein (WP_070466881.1) in a prokaryotic E. coli CFPS. The protein is 49 amino acids, originates from a prokaryote (Bacillus cereus group), has no glycosylation sites, and its cysteine-rich structure folds through Cu²⁺ coordination rather than classical disulfide bonding. An E. coli extract supplemented with Cu²⁺ ions would allow real-time monitoring of metal uptake without the complexity of eukaryotic systems.
Eukaryotic CFPS — wheat germ extract (WGE), rabbit reticulocyte lysate (RRL), or HeLa cell extracts — is essential for proteins requiring eukaryotic PTMs. Glycosylation profoundly affects protein half-life, receptor binding, and immunogenicity in ways that bacteria simply cannot replicate. Signal peptides are correctly processed when microsomal membranes are supplemented (Endo & Sawasaki, 2006, Current Opinion in Biotechnology, 17(4), pp.373–380).
For a eukaryotic CFPS example, I would express human erythropoietin (EPO). EPO is a heavily N-glycosylated cytokine where the glycan chains are not mere decoration — they constitute approximately 40% of the molecular weight and are essential for correct in vivo half-life and receptor binding. A wheat germ extract system supplemented with dog pancreatic microsomes for signal peptide cleavage and glycosylation machinery would produce biologically relevant EPO that a prokaryotic system structurally cannot.
General Question 5
How would you design a cell-free experiment to optimise the expression of a membrane protein? Discuss the challenges and how you would address them.
Membrane proteins represent roughly 30% of the genome but are dramatically underrepresented in structural databases because they are so difficult to express and purify — their hydrophobic transmembrane helices aggregate instantly when exposed to aqueous environments without a lipid scaffold (Klammt et al., 2006, FEBS Journal, 273(18), pp.4141–4153). Cell-free systems are uniquely suited to address this because you can supply the lipid environment directly into the reaction as the protein is being synthesised.
My experimental design would proceed in three stages:
Stage 1 — Detergent-supplemented CFPS. I would use an E. coli S30 extract supplemented with mild non-ionic detergents added just above their CMC — screening DDM (n-dodecyl-β-D-maltoside, CMC = 0.17 mM), LMNG (lauryl maltose neopentyl glycol, CMC = 0.01 mM), and digitonin (CMC = 0.5 mM). The detergent micelles intercept the emerging hydrophobic transmembrane helices at the ribosomal exit tunnel, preventing aggregation (Kalmbach et al., 2007, Journal of Structural Biology, 159(2), pp.194–205).
Stage 2 — Nanodisc-supplemented CFPS. For proteins requiring a true bilayer environment for correct folding, I would add empty nanodiscs (DOPE:DOPG:DOPC at a ratio mimicking the E. coli inner membrane) to the CFPS reaction. Nanodiscs are discoidal lipid bilayer patches stabilised by membrane scaffold proteins (MSPs) that allow co-translational membrane insertion into a native-like environment.
Stage 3 — Parameter optimisation. I would screen Mg²⁺ concentration (4–16 mM), DNA template concentration (1–100 nM), reaction temperature (25°C, 30°C, 37°C), and incubation time (2–6 hours) in a factorial design. Yield would be quantified by SDS-PAGE densitometry with His-tag western blot, and folding quality assessed by circular dichroism (CD) spectroscopy — a correctly folded helical membrane protein produces a characteristic double-minimum CD spectrum at 208 and 222 nm.
General Question 6
Imagine you observe a low yield of your target protein in a cell-free system. Describe three possible reasons and suggest a troubleshooting strategy for each.
Low yield is almost always diagnosable if you approach it systematically:
Reason 1 — mRNA instability or poor translation initiation. If residual nucleases in the extract rapidly degrade the mRNA, or if the ribosome binding site (RBS) is poorly configured for the E. coli ribosome, translation will fail even if transcription is normal. Troubleshoot by adding an RNase inhibitor (e.g., SUPERaseIn, 1 U/µL) and sampling mRNA levels at 0, 30, and 60 minutes via gel electrophoresis. Separately, redesign the RBS using the Salis Lab RBS Calculator to maximise translation initiation rate, and switch to a codon-optimised synthetic gene to eliminate rare codon pauses (Salis et al., 2009, Nature Biotechnology, 27(10), pp.946–950).
Reason 2 — Energy and ATP depletion. If the creatine phosphate supply is insufficient, or if creatine kinase has lost activity due to a freeze-thaw cycle, the ribosomes stall early. Test by adding fresh creatine phosphate (80 mM) and creatine kinase (2 mg/mL) at the 30-minute mark and monitoring whether yield recovers. Directly measure ATP using a luciferase-based ATP assay kit at multiple time points — if ATP falls below 1 mM within the first hour, shift to a glucose-based energy system or increase the initial creatine phosphate concentration (Jewett & Swartz, 2004, Molecular Systems Biology, published online).
Reason 3 — Protein aggregation post-synthesis. The protein may be expressed normally but immediately misfold and aggregate. Check by running both the supernatant and the pellet fractions on SDS-PAGE after centrifugation at 14,000 rpm for 10 minutes — if the target band appears only in the pellet, aggregation is occurring. Address this by supplementing the CFPS reaction with molecular chaperones (DnaK/DnaJ/GrpE system, 1–4 µM each), reducing reaction temperature to 25°C, and in my case adding Cu²⁺ ions co-translationally to drive the metallothionein into its correctly folded metal-bound conformation before aggregation can occur (Hartl et al., 2011, Nature, 475(7356), pp.324–332).
Homework Question from Kate Adamala
Design an example of a useful synthetic minimal cell.
Based on: Rampioni, G. et al., 2018. Synthetic cells produce a quorum sensing chemical signal perceived by Pseudomonas aeruginosa. Chemical Communications, 54(18), pp.2090–2093.
1. Pick a function and describe it.
1.1 What would your synthetic cell do? What is the input and what is the output?
Expand the metal-sensing capacity of engineered Bacillus subtilis for bioremediation of Cu²⁺-contaminated mine water. The synthetic minimal cell (SMC) acts as a molecular translator — it detects dissolved Cu²⁺ ions in Zambian mine water (which cannot directly activate the B. subtilis MT expression system at sub-threshold concentrations) and responds by synthesising and releasing IPTG into the surrounding medium, which then derepresses a lac operator–controlled metallothionein (MT) gene in nearby B. subtilis cells.
Input: Cu²⁺ ions (dissolved copper from Copperbelt mine leachate, threshold ≥ 5 mg/L).
Output of the SMC: IPTG (isopropyl β-D-1-thiogalactopyranoside).
Output of the whole system: Metallothionein protein expressed in B. subtilis, actively sequestering Cu²⁺ from the surrounding water.
(Copper riboswitch reference: Dambach, M. et al., 2015. The ubiquitous yybP-ykoY riboswitch is a manganese-responsive regulatory element. Molecular Cell, 57(6), pp.1099–1109. For CsoR-based copper sensing: Liu, T. et al., 2007. CsoR is a novel Mycobacterium tuberculosis copper-sensing transcriptional regulator. Nature Chemical Biology, 3(1), pp.60–68.)
1.2 Could this function be realized by cell-free Tx/Tl alone, without encapsulation?
No. If the IPTG were not encapsulated inside the SMC, it would diffuse freely into the B. subtilis cells regardless of whether Cu²⁺ is present, bypassing the copper-sensing circuit entirely. The encapsulation is what creates the conditional logic — IPTG is only released when Cu²⁺ enters the SMC and activates the internal copper-responsive gene expression system that drives synthesis of the membrane pore. Without the vesicle compartment, the SMC actuator does not exist and the system has no Cu²⁺ specificity.
1.3 Could this function be realized by a genetically modified natural cell?
Yes, in principle: a Cu²⁺-responsive riboswitch or CsoR-regulated promoter could be incorporated into a transformed B. subtilis strain to directly drive MT expression upon copper exposure. However, this approach lacks generality and introduces biosafety concerns — a genetically modified organism that grows, divides, and spreads in a Zambian mine site raises significant regulatory and ecological risks. The SMC approach is inherently safer: it is a non-replicating lipid vesicle with no genome, no ability to proliferate, and predictable degradation in the environment. Furthermore, using an SMC means that a single B. subtilis reporter strain can be paired with different SMCs tuned to different metal ions (Cu²⁺, Zn²⁺, Pb²⁺), without re-engineering the bacterium each time.
1.4 Describe the desired outcome of your synthetic cell operation.
In the presence of SMCs, B. subtilis cells sense Cu²⁺ at ecologically relevant concentrations and produce metallothionein to sequester the metal. In the absence of SMCs, the B. subtilis MT system remains silent regardless of Cu²⁺ concentration, because the lacI repressor blocks MT expression until IPTG is present. When mine water Cu²⁺ exceeds the threshold, SMCs autonomously bridge the chemical gap — translating the inorganic copper signal into an organic molecular signal (IPTG) that the bacteria can respond to.
2. Design all components that would need to be part of your synthetic cell.
2.1 What would be the membrane made of?
POPC (1-palmitoyl-2-oleoyl-sn-glycero-3-phosphocholine) + cholesterol (4:1 molar ratio). POPC provides a fluid, permeable bilayer at the 24–38°C ambient temperature range of the Zambian Copperbelt, while cholesterol increases mechanical rigidity and reduces passive permeability to IPTG (ensuring IPTG stays encapsulated until the pore is formed). The membrane is naturally permeable to small Cu²⁺ ions, which enter via passive diffusion down their concentration gradient, eliminating the need for an input channel.
2.2 What would you encapsulate inside? Enzymes, small molecules.
E. coli S30 cell-free Tx/Tl extract (transcription/translation machinery)
Pre-loaded IPTG (5 mM internal concentration, sufficient to derepress MT expression in surrounding B. subtilis)
Linear DNA template encoding α-hemolysin (aHL) under the control of a CsoR-regulated copper-responsive promoter (PcopA, from the Bacillus subtilis copper resistance operon)
NTPs (ATP, GTP, CTP, UTP) and amino acid mix to sustain CFPS
Creatine phosphate (50 mM) + creatine kinase (1 mg/mL) for energy regeneration
2.3 Which organism will your Tx/Tl system come from? Is bacterial OK, or do you need a mammalian system?
Bacterial (E. coli S30 extract) is appropriate here, because the copper-sensing regulatory element is the CsoR-responsive PcopA promoter — a prokaryotic transcriptional control element that does not require mammalian-specific transcription factors or chromatin remodelling. There is no need for Tet-ON or other mammalian small-molecule-modulated systems. E. coli extract is also ideal for cost-effectiveness at the volumes needed for environmental deployment.
2.4 How will your synthetic cell communicate with the environment?
The outer POPC/cholesterol membrane is naturally permeable to Cu²⁺ ions (ionic radius 0.73 Å), which enter the SMC passively when external concentration exceeds approximately 5 mg/L. Once inside, Cu²⁺ binds to the CsoR repressor, releasing it from the PcopA promoter and derepressing transcription of the aHL gene. The resulting α-hemolysin monomers self-assemble into a heptameric pore in the SMC membrane, creating a ~2 nm channel through which the pre-loaded IPTG diffuses out into the surrounding water. The surrounding B. subtilis cells then take up IPTG and produce metallothionein. The output communication is therefore chemical — IPTG crossing the SMC membrane via the expressed aHL pore.
α-hemolysin (aHL; gene: hla, UniProt P09616) — encapsulated in SMC under PcopA promoter control; forms the IPTG-release pore upon Cu²⁺ activation
CsoR (copper-sensing repressor; gene: csoR, NCBI Gene ID: 936347) — co-encapsulated to regulate PcopA; released from promoter upon Cu²⁺ binding
Biological cells:Bacillus subtilis 168 transformed with MT gene (WP_070466881.1) under T7 promoter and lac operator; lacI constitutively expressed to keep MT repressed until IPTG is released by the SMC
3.2 How will you measure the function of your system?
Primary readout: Measure MT protein yield in B. subtilis culture supernatant via SDS-PAGE and western blot (anti-His-tag, if MT is His-tagged) as a function of external Cu²⁺ concentration (0, 1, 5, 10, 50, 100 mg/L). Confirm metal sequestration by ICP-MS of the growth medium supernatant — a reduction in dissolved Cu²⁺ concentration confirms the functional output of the full SMC → B. subtilis → MT system.
Secondary readout: Replace MT with GFP under the same lac operator in a control construct, and measure GFP fluorescence (Ex 488 nm / Em 510 nm) via plate reader as a proxy for SMC-triggered IPTG release. This provides a fast, high-throughput screen for SMC function before moving to the full MT assay.
Negative controls: SMCs without CsoR (constitutive aHL expression, IPTG leaks regardless of Cu²⁺); B. subtilis without SMCs (no IPTG source, no MT expression); buffer with Cu²⁺ but no SMCs (confirms Cu²⁺ alone does not induce MT in unmodified B. subtilis).
Diagram concept: The SMC (circle) floats in Cu²⁺-contaminated mine water alongside B. subtilis cells (oblong). (a) In the absence of SMCs, B. subtilis cannot respond to Cu²⁺ because the lacI repressor blocks MT expression. (b) When Cu²⁺ enters the SMC, CsoR releases PcopA, aHL is expressed and inserts into the SMC membrane, and pre-loaded IPTG diffuses out into the water. B. subtilis takes up IPTG, derepresses the MT gene, produces metallothionein, and sequesters Cu²⁺ from the surrounding water.
Homework Question from Peter Nguyen
Choose one application field — Architecture, Textiles/Fashion, or Robotics — and propose an application using cell-free systems functionally integrated into the material.
Application field: Architecture
One-sentence summary pitch:
Freeze-dried cell-free biosensor panels embedded in building facade tiles activate upon contact with heavy metal–contaminated rainwater and produce a visible colour change, turning a building’s exterior into a self-reporting, equipment-free environmental monitoring system for Zambian Copperbelt communities.
How will the idea work?
The product is a modular ceramic tile containing freeze-dried CFPS reactions embedded in a porous chitosan hydrogel matrix within micro-channels printed across the tile surface. When contaminated rainwater contacts the tile surface, it rehydrates the CFPS reaction. The encapsulated DNA template encodes a Cu²⁺-responsive genetic circuit: the CsoR-regulated PcopA promoter drives expression of a laccase enzyme, which oxidises a pre-loaded colourless substrate (ABTS, 2,2’-azino-bis(3-ethylbenzothiazoline-6-sulfonic acid)) into a dark blue-green product visible from street level without any equipment (Pardee et al., 2014, Cell, 159(4), pp.940–954). Each tile acts as an independent, single-use test unit; tiles are replaced monthly and spent tiles safely incinerated. Because the CFPS components are lyophilised with trehalose as a cryoprotectant, tiles are shelf-stable for up to 18 months in ambient conditions, making them practical for the Zambian supply chain.
Societal challenge addressed:
Communities in Kitwe, Chingola, and Mufulira — built directly adjacent to active Copperbelt mine tailings — have historically lacked affordable, accessible, real-time environmental monitoring. Professional ICP-MS testing costs hundreds of dollars per sample and requires samples to be shipped to Lusaka. These biosensor tiles place continuous heavy metal monitoring in the hands of communities who currently have none, directly addressing environmental justice gaps and supporting Zambia’s obligations under the Minamata Convention on heavy metals pollution.
Addressing cell-free system limitations:
The single-use nature of CFPS reactions is here reframed as a design advantage — tiles are designed as replaceable consumable panels, similar to air filters, with a defined replacement schedule. Lyophilisation with trehalose addresses long-term stability (Pardee et al., 2016, Cell, 167(1), pp.248–259). Water activation is inherent to the outdoor application — contaminated rainwater is the activating agent by design. To prevent false positives from clean rain, the riboswitch activation threshold is calibrated above the WHO Cu²⁺ discharge limit (2 mg/L), so only genuinely contaminated runoff produces a signal. For the one-time-use limitation, a tile refresh subscription service model — supplying replacement tile panels quarterly to mine-adjacent communities — creates a sustainable commercial and social impact model.
Homework Question from Ally Huang
Develop a mock Genes in Space proposal incorporating the BioBits® cell-free protein expression system.
1. Background (≤100 words)
Long-duration spaceflight profoundly disrupts the human gut microbiome. Microgravity, ionising radiation, and chronic psychological stress cause measurable shifts in microbial community composition — reductions in beneficial commensals such as Lactobacillus and Bifidobacterium, alongside blooms of potentially pathogenic genera (Turroni et al., 2020, Frontiers in Physiology, 11, p.553). These dysbiotic shifts are linked to immune dysregulation, inflammatory conditions, and impaired nutrient absorption in astronauts. On multi-year Mars missions where no medical evacuation is possible, early detection of gut dysbiosis could prevent life-threatening complications. Yet current microbiome diagnostics require complex laboratory infrastructure unavailable aboard spacecraft.
2. Molecular or genetic target (≤30 words)
Indole (produced by tryptophanase-expressing gut commensals) and butyrate (produced by Faecalibacterium prausnitzii) as proxy biomarkers of gut microbiome health status, detectable non-invasively in astronaut saliva.
3. Relationship to space biology challenge (≤100 words)
Indole is produced exclusively by tryptophanase-expressing bacteria — predominantly healthy gut commensals including E. coli and Bacteroides species — while butyrate is generated by the fermentation activity of Faecalibacterium prausnitzii and Roseburia, both of which decline sharply during spaceflight-associated dysbiosis. A drop in salivary indole and butyrate below an astronaut’s personal pre-flight baseline would serve as an early, non-invasive warning signal that the gut microbiome is shifting toward a dysbiotic state, allowing intervention — probiotic supplementation or dietary adjustment — before clinical symptoms appear (Lee & Lee, 2010, FEMS Microbiology Letters, 313(2), pp.120–128).
4. Hypothesis (≤150 words)
I hypothesise that freeze-dried BioBits® cell-free reactions containing riboswitch-based genetic circuits sensitive to indole and butyrate can be rehydrated with a single drop of astronaut saliva to produce a fluorescent output proportional to biomarker concentration — providing a rapid, equipment-minimal, and quantitative readout of gut microbiome health status aboard the ISS or a Mars transit vehicle. Specifically, I predict that astronauts showing greater than 50% reduction in salivary indole from their personal pre-flight baseline will demonstrate concurrent immune and gastrointestinal stress markers, validating the cell-free biosensor as a clinically meaningful diagnostic tool. The reasoning is grounded in published correlations between indole production and Lactobacillus-dominated healthy microbiomes, and the established capacity of riboswitch-based CFPS circuits to generate threshold-responsive fluorescent outputs at microgram-scale reagent quantities (Pardee et al., 2016, Cell, 167(1), pp.248–259).
5. Experimental plan (≤100 words)
Samples: Weekly saliva (100 µL) from four ISS crew members over a 6-month mission. Controls: pre-flight baseline saliva (personal reference), Earth-based healthy volunteer saliva, and synthetic indole/butyrate standard curves (0–500 µM). Protocol: Rehydrate one BioBits® freeze-dried pellet per sample with 5 µL of saliva. Incubate at 37°C (body temperature, maintained by crew member hand-warming pouch) for 2 hours. Read GFP fluorescence using the P51 Molecular Fluorescence Viewer. Confirm positive results with miniPCR® amplification of the tryptophanase gene (tnaA) from saliva as a microbial community abundance proxy. Data recorded: fluorescence intensity, tnaA band intensity, weekly dietary log, and crew health self-assessment scores.
References
Part A: General Questions & Cell-Free Background
Endo, Y., & Sawasaki, T. (2006). Cell-free expression systems for eukaryotic protein production. Current Opinion in Biotechnology, 17(4), 373–380. https://doi.org/10.1016/j.copbio.2006.06.009
Gregorio, N. E., Levine, M. Z., & Oza, J. P. (2019). Accelerating research and development in synthetic biology through cell-free systems. Scientific Reports, 9(1), 6771. https://doi.org/10.1038/s41598-019-43236-5
Hartl, F. U., Bracher, A., & Hayer-Hartl, M. (2011). Molecular chaperones in protein folding and proteostasis. Nature, 475(7356), 324–332. https://doi.org/10.1038/nature10317
Jewett, M. C., & Swartz, J. R. (2004). Mimicking the Escherichia coli cytoplasmic environment activates long-lived and efficient cell-free protein synthesis. Biotechnology and Bioengineering, 86(1), 19–26. https://doi.org/10.1002/bit.20026
Kalmbach, R., Chinthamani, S., Yildiz, Ö., Müller, D. J., & Cook, B. L. (2007). Functional cell-free synthesis of a seven transmembrane domain protein into lipid bilayers. Journal of Structural Biology, 159(2), 194–205. https://doi.org/10.1016/j.jsb.2007.03.004
Klammt, C., Schwarz, D., Fendler, K., Forbes, J., Dötsch, V., & Bernhard, F. (2006). Evaluation of detergents for the soluble expression of certain membrane proteins in cell-free systems. FEBS Journal, 273(18), 4141–4153. https://doi.org/10.1111/j.1742-4658.2006.05412.x
Pardee, K., Slomovic, S., Nguyen, P. Q., Chappell, J., Barfield, R., Johns, N. I., … & Collins, J. J. (2016). Portable, on-demand biomolecular manufacturing. Cell, 167(1), 248–259. https://doi.org/10.1016/j.cell.2016.09.013
Ryabova, L. A., Volyanik, E. V., Kurnasov, O. V., Spirin, A. S., & Wu, Y. (1995). In vitro synthesis of proteins on a preparative scale: Comparison of batch and continuous-flow cell-free systems. Nucleic Acids Research, 23(13), 2401–2407. https://doi.org/10.1093/nar/23.13.2401
Sachse, R., Dondapati, S. K., Fenz, S. F., Schmidt, T., & Kubick, S. (2014). Membrane protein synthesis in cell-free systems: From bio-mimetic systems to bio-chips. PLOS ONE, 9(3), e96825. https://doi.org/10.1371/journal.pone.0096825
Salis, H. M., Mirsky, E. A., & Voigt, C. A. (2009). Automated design of synthetic ribosome binding sites to control protein expression. Nature Biotechnology, 27(10), 946–950. https://doi.org/10.1038/nbt1172
Shin, J., & Noireaux, V. (2012). An E. coli cell-free expression toolbox: Application to synthetic gene networks and artificial cells. ACS Synthetic Biology, 1(1), 29–41. https://doi.org/10.1021/sb200016s
Silverman, A. D., Karim, A. S., & Jewett, M. C. (2020). Cell-free synthetic biology: Engineering beyond the cell. Nature Reviews Genetics, 21(11), 715–733. https://doi.org/10.1038/s41576-020-0256-y
Part B: Minimal Cells (Kate Adamala Prompt)
Dambach, M., Sandoval, M., Updegrove, T. B., Anantharaman, V., Aravind, L., & Storz, G. (2015). The ubiquitous yybP-ykoY riboswitch is a manganese-responsive regulatory element. Molecular Cell, 57(6), 1099–1109. https://doi.org/10.1016/j.molcel.2015.01.035
Liu, T., Ramesh, A., Ma, Z., Ward, S. K., Zhang, L., George, G. N., … & Giedroc, D. P. (2007). CsoR is a novel Mycobacterium tuberculosis copper-sensing transcriptional regulator. Nature Chemical Biology, 3(1), 60–68. https://doi.org/10.1038/nchembio844
Rampioni, G., D’Angelo, F., Messina, M., Zennaro, A., Kuruma, Y., Tofani, D., … & Leoni, L. (2018). Synthetic cells produce a quorum sensing chemical signal perceived by Pseudomonas aeruginosa. Chemical Communications, 54(18), 2090–2093. https://doi.org/10.1039/C7CC09616A
Part C: Architectural Materials & Space Proposals (Nguyen & Huang Prompts)
Pardee, K., Green, A. A., Ferrante, T., Cameron, D. E., Daleykeyser, A., Yin, P., & Collins, J. J. (2014). Paper-based synthetic gene networks. Cell, 159(4), 940–954. https://doi.org/10.1016/j.cell.2014.10.004
Turroni, S., Rampelli, S., Biagi, E., Consolandi, C., Severgnini, M., Peano, C., … & Candela, M. (2020). Temporal dynamics of the gut microbiota in astronauts during long-duration spaceflight missions on the International Space Station. Frontiers in Physiology, 11, 553. https://doi.org/10.3389/fphys.2020.00553
Laboratory Report: Advanced Mass Spectrometric Analysis of eGFP
Course: How to Grow Almost Anything (HTGAA) — Week 10
Final Project: Measurement Plan
Zambia Mineral-Waste Bioremediation Predictor
My final project uses a genetically engineered Bacillus subtilis strain expressing a metallothionein (MT) protein (accession WP_070466881.1) to remove copper and other heavy metals from mine-contaminated water in Zambia’s Copperbelt Province. The system also includes a copper-sensing genetic circuit (CopA-CueR), a MazF/MazE kill switch for biocontainment, and a dual-layer hydrogel encapsulation system called ZAMGEL.
The table below summarizes what I need to measure, why it matters, and how I will measure it:
What I Am Measuring
Why It Matters
How I Will Measure It
Metallothionein (MT) protein mass (~5.2 kDa, 49 amino acids)
Confirm the protein was successfully expressed; detect copper bound to the protein
Intact LC-MS (native mode): run the protein in ammonium acetate buffer to preserve metal binding; each copper ion bound adds ~61.5 Da to the mass, allowing me to count how many copper ions are attached
MT protein amino acid sequence
Confirm all 11 cysteines are present (these are the copper-grabbing residues); check there are no mutations
Tryptic peptide mapping (LC-MS/MS): digest the protein with trypsin, then identify the resulting peptides by mass and fragmentation — same method as this week’s eGFP lab
Copper binding capacity
Measure exactly how many copper ions one MT protein molecule can hold
Native MS + ICP-MS: native MS gives the mass of the copper-protein complex; ICP-MS (Inductively Coupled Plasma MS) measures copper concentration in solution per mole of protein
CopA sensor circuit activity
Check that the genetic circuit switches on in response to copper
Fluorescence plate reader: if a GFP reporter is placed downstream of the CopA copper-sensing promoter, fluorescence will increase when copper is present — I will measure this at different copper concentrations to build a dose-response curve
MazF/MazE kill switch expression
Confirm the biocontainment system works — the bacteria must die when the switch is triggered
Western blot + quantitative PCR (qRT-PCR): detect the toxin (MazF) and antitoxin (MazE) proteins; measure mRNA levels to confirm the switch triggers correctly
Heavy metal removal from water
Prove the system actually removes copper from real Copperbelt water samples
ICP-MS or Atomic Absorption Spectroscopy (AAS): measure copper, cobalt, and manganese concentrations before and after treatment; compare to Zambia EPA water quality limits
ZAMGEL hydrogel structure
Confirm the hydrogel bead is porous enough for water and copper to pass through, but tight enough to keep bacteria inside
Scanning Electron Microscopy (SEM): image the hydrogel surface and pores at high magnification
Bacterial viability inside ZAMGEL
Confirm bacteria stay alive and active inside the hydrogel under Copperbelt water conditions
Colony Forming Unit (CFU) counts + LIVE/DEAD fluorescence staining: count living versus dead cells inside the beads
In simple terms: I am checking that (1) the MT protein is made correctly and grabs copper, (2) the genetic switch turns on only when copper is present, (3) the kill switch works to destroy the bacteria when needed, and (4) the whole system actually cleans up copper-contaminated water.
Part I: Intact Protein Analysis — Molecular Weight of eGFP
Question 1: Theoretical Molecular Weight
The full eGFP sequence (247 amino acids, including the His₆-tag and LE linker) was entered into the ExPASy Compute pI/Mw tool and verified in Benchling.
Parameter
Value
Total amino acids
247
Isoelectric point (pI)
5.90
Theoretical MW (average mass)
28,006.60 Da
Theoretical MW (monoisotopic)
27,988.96 Da
For intact proteins at this size, the average mass (28,006.60 Da) is the appropriate theoretical reference because mass spectrometers detect the centre of the unresolved isotope envelope.
Figure 1: Theoretical Molecular Weight and Isoelectric Point (pI) calculation for eGFP via ExPASy.
Figure 2: Primary sequence analysis in Benchling confirming a 247-residue length.
Question 2: Experimental Molecular Weight Using the Adjacent Charge State Method
Two adjacent charge state peaks were selected from the denatured intact LC-MS spectrum (Figure 1):
Peak
m/z value
Peak A — (m/z)n
1037.4423
Peak B — (m/z)n+1
1000.5021
Step 1 — Calculate the charge state (z):
z = (m/z)_(n+1) / [(m/z)n − (m/z)(n+1)]
z = 1000.5021 / (1037.4423 − 1000.5021)
z = 1000.5021 / 36.9402 = 27.08 → z = 27
Step 2 — Calculate the experimental molecular weight:
Interpretation of the 816 ppm offset: This is not an analytical error — it is a biochemical signal. The ExPASy tool calculates the mass of the unmatured linear peptide chain. In living cells, eGFP undergoes spontaneous chromophore formation involving two modifications: dehydration (−18.01 Da) and oxidation (−2.02 Da), a total loss of ~20 Da.
Corrected theoretical mass for mature eGFP:
MW_matured = 28,006.60 − 18.01 − 2.02 = 27,986.57 Da
This is consistent with expected intact protein LC-MS performance on the Xevo G3 and confirms the protein carries a mature fluorescent chromophore.
Question 3: Charge State from the Zoomed-in Peak (Figure 1)
Yes, the charge state can be observed. At 30,000 resolution on the Xevo G3, the spacing between adjacent isotope peaks within a charge state envelope equals 1/z Da. For the z = 27 peak at m/z ≈ 1037.44:
Δ(m/z) = 1/z = 1/27 ≈ 0.037 Da
At 30,000 resolution, peaks separated by 0.037 Da at m/z ~1037 are resolvable because:
This is within the instrument’s 30,000 specification. The zoomed inset therefore shows a resolved isotope ladder confirming z = +27.
Part II: Protein Conformation — Native vs. Denatured
Question 1: Difference Between Native and Denatured States
When a protein unfolds, it loses its compact three-dimensional structure. All the amino acid residues that were buried inside the core become exposed to the surrounding solution. This is important for mass spectrometry because basic residues (Lys, Arg, His) that are normally hidden inside the protein can now all pick up protons from the solvent. More protons attached = higher charge = lower m/z values.
Feature
Denatured State (Figure 2, top)
Native State (Figure 2, bottom)
Protein structure
Unfolded; all residues exposed
Compact; interior residues hidden
Protonation sites available
All basic residues accessible
Only surface-exposed basic residues
Charge state range
z = +15 to +25 (high charge)
z = +8 to +11 (low charge)
m/z range in spectrum
~800–1,200 (low m/z)
~2,400–2,800 (high m/z)
Envelope shape
Broad, many charge states
Narrow, few charge states
MS buffer conditions
Low pH, organic solvents (LC-MS)
Aqueous ammonium acetate, pH ~7
How the mass spectrometer detects this: The denatured spectrum shows a wide distribution of peaks at low m/z, reflecting the many charge states a fully exposed chain can adopt. The native spectrum shows a narrow cluster of peaks at much higher m/z, because the folded protein’s buried core limits proton access. This difference in charge state distribution is the direct readout of protein folding state in the mass spectrum.
Question 2: Charge State at ~2800 m/z (Figure 3)
Yes, the charge state can be determined. Using the isotope spacing in the zoomed inset at the neighbouring ~2545 m/z peak:
Step 1 — Calculate z from the 2545 peak isotope spacing:
Δ(m/z)_2545 = 2545.1304 − 2545.0388 = 0.0916 Da
z_2545 = 1 / 0.0916 = 10.9 → z = +11
Step 2 — Determine z for the ~2800 peak:
Since adjacent charge state peaks differ by z = ±1, and the ~2800 m/z peak sits at higher m/z (therefore lower charge) than the +11 peak:
z_2800 = 11 − 1 = +10
Step 3 — Verify by back-calculating the mass:
MW = z × [(m/z) − 1.0073]
MW = 10 × (2800 − 1.0073)
MW = 10 × 2798.9927 ≈ 27,990 Da
This matches the matured eGFP theoretical mass of ~27,986.57 Da, confirming the assignment.
How you can tell visually: At 30,000 resolution and m/z ~2800, isotopes are 1/10 = 0.1 Da apart — resolvable in the inset as a clear ladder of peaks separated by 0.1 Da, which is exactly how one can confirm the charge state is +10.
Part III: Peptide Mapping — Primary Structure Confirmation
Question 1: Lysine and Arginine Count
The eGFP sequence (247 aa) was entered into Benchling (Biochemical Properties tab) and confirmed with ExPASy PeptideMass:
Amino Acid
Count
Lysine (K)
20
Arginine (R)
6
Total cleavage sites for trypsin
26
Predicted number of peptides:
Trypsin cleaves after every K and R residue (except when followed by proline). With 26 cleavage sites:
The tool predicts 27 peptides. The full list is shown below (masses are monoisotopic):
Mass (Da)
Position
Peptide Sequence
4472.1752
170–210
HNIEDGSVQLADHYQQNTPIGDGPVLLPDNHYLSTQSALSK
2566.2931
217–239
DHMVLLEFVTAAGITLGMDELYK
2437.2608
5–27
GEELFTGVVPILVELDGDVNGHK
2378.2577
54–74
LPVPWPTLVTTLTYGVQCFSR
1973.9062
142–157
LEYNYNSHNVYIMADK
1503.6597
28–42
FSVSGEGEGDATYGK
1266.5783
87–97
SAMPEGYVQER
1083.4979
240–247
LEHHHHHH
1050.5214
115–123
FEGDTLVNR
982.4952
133–141
EDGNILGHK
821.3940
81–86
QHDFFK
790.3552
75–80
YPDHMK
769.3913
47–53
FICTTGK
711.2944
103–108
DDGNYK
655.3813
98–102
TIFFK
602.2780
211–215
DPNEK
579.3137
128–132
GIDFK
507.2925
164–167
VNFK
502.3235
124–127
IELK
(Peptides below 500 Da: MVSK, LTLK, AEVK, TR, LYK, GID — not shown by ExPASy at default settings; these represent the remaining ~9.3% of sequence)
ExPASy PeptideMass reports that 90.7% of the sequence is covered by peptides ≥ 500 Da at the default display threshold.
Question 3: Chromatographic Peaks in Figure 5a
From the Total Ion Chromatogram (Figure 5a), counting all peaks with relative abundance >10% between 0.5 and 6 minutes:
Observed chromatographic peaks: approximately 20–22 major peaks
Question 4: Do Peaks Match Predicted Peptides?
There are fewer peaks in the chromatogram than predicted peptides. The TIC shows ~20–22 peaks versus 27 predicted, for the following reasons:
Very small, highly hydrophilic peptides (MVSK, LTLK, IELK, VNFK — all < 500 Da) do not bind the reverse-phase C18 column and elute in the void volume, so they are not detected as distinct peaks
Some peptides may co-elute and appear as a single unresolved peak in the TIC
The His₆-tag peptide (LEHHHHHH) may ionize poorly due to its unusual composition
Question 5: Identify m/z, Charge State, and [M+H]⁺ for the 2.78 min Peak
From Figure 5b:
m/z = 525.7602
Charge state from isotope spacing in the zoomed inset:
Δ(m/z) = 0.499 Da
z = 1 / 0.499 ≈ 2 → z = +2
Calculate singly charged mass [M+H]⁺:
[M+H]⁺ = (m/z × z) − (z − 1) × 1.0073
[M+H]⁺ = (525.7602 × 2) − (1 × 1.0073)
[M+H]⁺ = 1051.5204 − 1.0073 = 1050.51 Da
Question 6: Peptide Identification and Mass Accuracy
Searching the ExPASy PeptideMass output for the peptide whose monoisotopic mass is closest to 1050.51 Da:
Peptide
Position
Theoretical Mass (Da)
Δ from observed
FEGDTLVNR
115–123
1050.5214
0.009 Da ✓
EDGNILGHK
133–141
982.4952
too far
The identified peptide is FEGDTLVNR (positions 115–123).
This is excellent performance, fully consistent with Waters BioAccord LC-MS specifications (< 10 ppm for peptides).
Question 7: Sequence Coverage (Figure 6)
From the ExPASy PeptideMass output, 90.7% of the eGFP sequence is represented by tryptic peptides with mass ≥ 500 Da. The amino acid coverage map (Figure 6) from the Waters BioAccord LC-MS experimentally confirms this coverage through detected peptide masses and fragmentation patterns. The remaining ~9.3% corresponds to very small peptides below the instrument’s reliable detection threshold.
Bonus Question 1: Peptide Sequence from Fragmentation Spectrum (Figure 5c)
The sequence FEGDTLVNR was entered into the SystemsBiology Fragment Ion Servlet (monoisotopic masses, +1 charge, b/y ion series). The predicted fragment ions are:
#
Residue
b-ion (m/z)
y-ion (m/z)
# from C-term
1
F
148.07574
1050.52149
9
2
E
277.11833
903.45308
8
3
G
334.13979
774.41049
7
4
D
449.16673
717.38902
6
5
T
550.21441
602.36208
5
6
L
663.29848
501.31440
4
7
V
762.36689
388.23034
3
8
N
876.40982
289.16192
2
9
R
1032.51093
175.11900
1
Mass/Charge Table for FEGDTLVNR:
Species
Monoisotopic (Da)
Average (Da)
(M)
1049.51422
1050.13629
(M+H)⁺
1050.52149
1051.14356
(M+2H)²⁺
525.76441
526.07544
(M+3H)³⁺
350.84538
351.05273
(M+4H)⁴⁺
263.38586
263.54138
Confirmation of match — ppm error on the (M+2H)²⁺ ion:
Predicted (M+2H)²⁺ = 525.76441 vs. observed = 525.7602
Matching the y-ion series from Figure 5c against predicted values reads the C-terminal sequence inward:
y1 = 175.12 → R
y2 = 289.16 → NR
y3 = 388.23 → VNR
y4 = 501.31 → LVNR
y5 = 602.36 → TLVNR
The b-ion series confirms the N-terminal sequence reading outward:
b1 = 148.08 → F
b2 = 277.12 → FE
b3 = 334.14 → FEG
The peptide sequence is confirmed as FEGDTLVNR.
Bonus Question 2: Does the Peptide Map Confirm eGFP Identity?
Yes, the peptide map data unambiguously confirms that the protein is eGFP. Three independent lines of evidence support this conclusion:
Mass accuracy: Tryptic peptide masses match ExPASy PeptideMass theoretical predictions within < 10 ppm — consistent with authentic eGFP sequence
MS/MS fragmentation: The fragmentation spectrum of the 2.78-min peak matches the predicted b- and y-ion series for FEGDTLVNR, confirming the amino acid sequence residue by residue
Sequence coverage: Figure 6 shows that >90% of the eGFP primary sequence is experimentally confirmed, leaving no significant unexplained regions
Part IV: Oligomeric States of KLH by Charge Detection Mass Spectrometry
CDMS enables direct, single-particle mass measurement of very large protein complexes without requiring resolved charge states. Using known subunit masses (7FU = 340 kDa; 8FU = 400 kDa), the expected masses for each oligomeric species are calculated below:
Oligomeric Species
Subunit
Calculation
Theoretical Mass
Location on Figure 7
7FU Decamer
7FU (340 kDa)
10 × 340 kDa
3,400 kDa (3.4 MDa)
Leftmost peak, ~3.4 MDa
8FU Didecamer
8FU (400 kDa)
20 × 400 kDa
8,000 kDa (8.0 MDa)
~8.0 MDa
8FU 3-Decamer
8FU (400 kDa)
30 × 400 kDa
12,000 kDa (12.0 MDa)
~12.0 MDa
8FU 4-Decamer
8FU (400 kDa)
40 × 400 kDa
16,000 kDa (16.0 MDa)
Rightmost peak, ~16.0 MDa
Calculations shown explicitly:
7FU Decamer: 10 × 340 = 3,400 kDa
8FU Didecamer: 20 × 400 = 8,000 kDa
8FU 3-Decamer: 30 × 400 = 12,000 kDa
8FU 4-Decamer: 40 × 400 = 16,000 kDa
Reading Figure 7 left-to-right, the four peaks correspond to these four species in increasing order of mass. CDMS is uniquely suited for this measurement because the extremely large size of these complexes (3.4–16 MDa) makes charge state resolution impossible in conventional ESI-MS — CDMS bypasses this by measuring charge on each individual particle directly.
The mass difference of ~23 Da between the unmatured theoretical mass and the observed mass is not analytical error — it is the biochemical signature of chromophore maturation (loss of H₂O and H₂ during spontaneous cyclization and oxidation of the Ser65-Tyr66-Gly67 tripeptide). When compared against the correct matured eGFP mass of 27,986.57 Da, the measurement accuracy is 101 ppm, consistent with intact protein LC-MS performance.
This is further confirmed by: (1) tryptic peptide mapping recovering >90% of the primary sequence with < 10 ppm mass accuracy, and (2) native MS (Part II) showing a compact charge state distribution at high m/z confirming the protein is properly folded into its characteristic β-barrel structure. The combination of mass, sequence, and folding data provides complete confirmation that the expressed protein is functional eGFP.
Eiler, S., Gangloff, M., & Duclohier, H. (2020). Native vs denatured: An in-depth investigation of charge state and isotope distributions. Journal of the American Society for Mass Spectrometry, 31(10). https://pmc.ncbi.nlm.nih.gov/articles/PMC7539638/
Tucholski, T., Coon, J. J., & Ge, Y. (2019). Best practices for intact protein analysis for top-down mass spectrometry. Nature Methods, 16(7), 587–594. https://doi.org/10.1038/s41592-019-0457-0
What did you contribute to the community bioart project?
I contributed by correcting some of the pixel colours that appeared wrongly placed in the region slightly above and around the word “love” on the canvas, helping restore the intended colour arrangement in that section of the artwork.
What did you like about the project?
What I liked most was how a 1,536-well plate — a tool normally reserved for high-throughput biological experiments — became a shared creative medium connecting students across different institutions and time zones. It reframed what a cloud lab can do: not just automate experiments, but enable collective human expression at scale.
What could be made better for next year?
One improvement would be providing contributors with a live, real-time preview of the full canvas as it fills in, so each person can see the emerging collective image and make more intentional choices about colour and placement. A short window for reviewing and correcting misplaced pixels before the editing deadline closes would also improve the final artwork quality.
Part B: Cell-Free Protein Synthesis
Component Roles
Question: Referencing the cell-free protein synthesis reaction composition, provide a 1-2 sentence description of what each component’s role is in the cell-free reaction.
E. coli BL21(DE3) Star Lysate (includes T7 RNA Polymerase)
Provides the core molecular machinery for transcription and translation, including ribosomes, tRNAs, aminoacyl-tRNA synthetases, elongation and release factors, and chaperones. The included T7 RNA Polymerase drives transcription specifically from T7 promoter-containing DNA templates.
Potassium Glutamate
Supplies K+ ions required for ribosome assembly and optimal translation activity; glutamate is used as the counterion instead of chloride because it is less inhibitory to enzyme activity at physiological concentrations.
HEPES-KOH pH 7.5
A zwitterionic buffer that maintains the reaction pH near the physiological optimum (~7.5), ensuring consistent transcription and translation enzyme activity throughout the reaction.
Magnesium Glutamate
Provides Mg2+, an essential cofactor for ribosome subunit assembly, mRNA binding, aminoacyl-tRNA accommodation, and nearly all NTP-dependent enzymatic steps in transcription and translation.
Potassium Phosphate Monobasic / Dibasic
Functions as a secondary buffering system and provides inorganic phosphate (Pi), which participates in energy metabolism and nucleotide regeneration reactions.
Ribose
A pentose sugar that feeds into nucleotide biosynthesis via the pentose phosphate pathway, supporting sustained NMP-to-NTP regeneration in long-duration reactions.
Glucose
The primary carbon and energy source; drives ATP regeneration through glycolysis, sustaining the energy requirements of transcription and translation over time.
AMP, CMP, GMP, UMP
Nucleoside monophosphates that serve as direct precursors for RNA synthesis; they are phosphorylated to their triphosphate forms by kinases retained in the lysate and incorporated during transcription.
Guanine
A free nucleobase that enters GMP biosynthesis via the purine salvage pathway, supplementing the GMP pool without the cost of de novo synthesis.
17 Amino Acid Mix
Provides the bulk of the 20 proteinogenic amino acids required for ribosomal translation; tyrosine and cysteine are supplied separately due to their individual handling requirements.
Tyrosine
Supplied separately because of its very low solubility at neutral pH, which would cause precipitation if included in the master mix stock.
Cysteine
Supplied separately because it is highly prone to oxidation; adding it fresh preserves its reduced thiol form, which is required for correct protein folding.
Nicotinamide
A precursor to NAD+ that supports redox reactions in glycolysis and other metabolic pathways that regenerate energy for the reaction.
Nuclease-Free Water
Used to bring the reaction to final volume; the absence of RNases and DNases protects the DNA template and mRNA transcript from degradation throughout the reaction.
Master Mix Comparison
Question: Describe the main differences between the 1-hour optimized PEP-NTP master mix and the 20-hour NMP-Ribose-Glucose master mix. (2-3 sentences)
The 1-hour PEP-NTP formulation uses phosphoenolpyruvate (PEP) as an energy regeneration substrate and pre-formed NTPs as direct transcription substrates, enabling rapid ATP regeneration via pyruvate kinase and immediate transcriptional activity — but PEP is consumed quickly and is relatively expensive, making this formulation best suited to short, high-intensity expression bursts. The 20-hour NMP-Ribose-Glucose formulation instead uses glucose (via glycolysis) and ribose (via the pentose phosphate pathway) to regenerate both energy and nucleotides from cheaper NMPs over time, creating a slower but far more sustained reaction. The tradeoff is a lower peak expression rate but higher cumulative yield, making it more appropriate for slowly-maturing fluorescent proteins or reactions requiring extended incubation.
Bonus Question
Question: How can transcription occur if GMP is not included but Guanine is?
The E. coli lysate retains active purine salvage pathway enzymes, most importantly hypoxanthine-guanine phosphoribosyltransferase (HGPRT), which catalyses the reaction: guanine + PRPP -> GMP + PPi, where PRPP is generated from ribose-5-phosphate. The resulting GMP is then phosphorylated to GDP and GTP by guanylate kinase and nucleoside diphosphate kinase, making GTP fully available for transcription. This approach is more cost-effective than supplying pre-made GMP while achieving the same functional outcome.
Part C: Planning the Global Experiment
Fluorescent Protein Properties
Question: Given the 6 fluorescent proteins used for the collaborative painting, identify and explain at least one biophysical or functional property of each protein that affects expression or readout in cell-free systems. (1-2 sentences each)
sfGFP
sfGFP was engineered with mutations that dramatically improve folding robustness, making it resistant to aggregation even under the crowded, resource-limited conditions of a cell-free reaction — a key advantage over wild-type GFP. Like all GFP-family proteins, its chromophore maturation still requires molecular oxygen (O2) for the autocatalytic cyclization-oxidation reaction, so fluorescence output depends on adequate O2 availability during incubation.
mRFP1
mRFP1 has a notably slow and incomplete chromophore maturation rate (~1-2 hours to partial maturation at 37 degrees C) and relatively low quantum yield compared to newer red FPs. In a cell-free reaction, this means a significant fraction of translated mRFP1 protein may remain non-fluorescent at any given readout time point.
mKO2
mKO2 (monomeric Kusabira-Orange 2) has one of the slowest chromophore maturation times among common FPs (~4-5 hours for significant signal), and also shows moderate acid sensitivity, losing fluorescence at pH values below ~6.5. In a cell-free system, the long maturation time makes the 20-hour NMP-Ribose-Glucose formulation far more appropriate than the 1-hour PEP-NTP mix for detecting meaningful fluorescence signal.
mTurquoise2
mTurquoise2 has an exceptionally high quantum yield (~0.93, the highest reported for any cyan FP), making it highly bright and detectable even at low expression levels in cell-free reactions. However, like all GFP-family proteins it requires O2 for chromophore maturation, and it loses fluorescence under acidic conditions that may develop as the reaction consumes buffer capacity over time.
mScarlet-I
mScarlet-I is notable for having one of the fastest maturation rates among red/orange fluorescent proteins (~45-60 minutes), which is a direct functional advantage in cell-free systems compared to slower red FPs like mRFP1 or mKO2. Its high brightness (high extinction coefficient combined with high quantum yield) makes it a sensitive readout even within the short 1-hour PEP-NTP reaction window.
Electra2
Electra2 is a biliverdin-dependent fluorescent protein whose chromophore is derived from the cofactor biliverdin rather than from autocatalytic amino acid cyclization. This gives it a critical advantage in cell-free reactions: chromophore maturation does not require molecular oxygen, unlike all GFP/RFP-family proteins — however, it requires biliverdin to be present in the reaction either from the lysate or supplied exogenously, making fluorescence output dependent on cofactor availability.
Reagent Optimization Hypothesis
Question: Create a hypothesis for how adjusting one or more reagents in the cell-free master mix could improve a specific biophysical or functional property you identified above, in order to maximize fluorescence over a 36-hour incubation. Clearly state the protein, the reagent(s), and the expected effect.
Protein: mKO2
Hypothesis: Because mKO2 suffers from slow chromophore maturation (~4-5 hours), a large fraction of translated protein remains non-fluorescent during the early phase of a 36-hour reaction. I hypothesise that supplementing the reaction with an additional 1-2 mM magnesium glutamate (above the standard concentration) will improve ribosome translational fidelity and elongation speed, increasing the total pool of correctly folded mKO2 protein available to enter the maturation pathway early in the reaction. With more correctly folded substrate accumulating simultaneously, total mature fluorescent mKO2 should reach a higher plateau faster, increasing both the rate of fluorescence accumulation and the final endpoint signal at 36 hours compared to the standard master mix formulation.
HTGAA Week 11 — Part C: Cell-Free Master Mix Design
Phase 2: Reagent Supplement Composition
Well Assignment
Field
Detail
Quadrant
Q1
Well Label
P14
Fluorescent Protein
mKO2
Node
USFQ Latin America (Quito, Ecuador) — Node 14
Hypothesis (from Phase 1)
mKO2 is one of the slowest-maturing fluorescent proteins in the panel, requiring approximately 4–5 hours to develop significant fluorescence. Because a large fraction of translated mKO2 protein remains non-fluorescent early in the reaction, maximising fluorescence over 36 hours requires increasing the rate and efficiency of correct protein folding before chromophore maturation can begin.
I hypothesised that supplementing the reaction with additional Magnesium Glutamate — above the standard master mix concentration — would improve ribosomal translational fidelity and elongation speed. This would increase the pool of correctly folded mKO2 protein available to enter the chromophore maturation pathway earlier, resulting in a higher fluorescence plateau at the 36-hour endpoint.
Reagent Supplement Applied
Based on my hypothesis, I made the following adjustment to the cell-free reaction for well Q1-P14:
Reagent
Baseline Concentration
Adjusted Concentration
Change
Supplemental Volume
Magnesium Glutamate
6.975 mM
8.850 mM
+26.9%
75 nL
Nuclease-Free Water
2.000 µL
1.925 µL
-3.7%
1925 nL (auto-adjusted)
All other reagents were left at their standard master mix concentrations. The total reaction volume remains 20 µL.
The Nuclease-Free Water was automatically reduced by the tool to compensate for the added Magnesium Glutamate volume, maintaining the correct total reaction volume. No other reagents were altered.
Reagent Supplement JSON
The following JSON was generated and saved by the rcdonovan.com/1536 platform upon submission:
By raising the Magnesium Glutamate concentration from 6.975 mM to 8.850 mM, I expect the ribosomes to function with greater fidelity and efficiency throughout the 36-hour incubation. This should result in:
A larger pool of correctly folded mKO2 protein accumulating in the early hours of the reaction
More protein entering the chromophore maturation pathway simultaneously
A faster rate of fluorescence increase compared to wells using the standard master mix
A higher total fluorescence endpoint at 36 hours
This prediction will be evaluated once fluorescence data is returned from the Ginkgo Nebula cloud lab.
Evidence Screenshots
Two screenshots were captured to document this submission:
Screenshot 1 — HTGAA_W11_Q1P14_mKO2_reagent_composition.png
Shows the Cell-Free Reaction Compositions interface with well Q1-P14 assigned, mKO2 confirmed as the fluorescent protein, Magnesium Glutamate adjusted to 8.850 mM (+26.9%), and Nuclease-Free Water reduced to 1.925 µL (-3.7%).
Screenshot 2 — HTGAA_W11_Q1P14_mKO2_JSON_saved.png
Shows the Reagent Supplement JSON successfully generated and the confirmation message: “Copied selected well supplement JSON to clipboard” — confirming the submission was saved to the platform.
Summary Statement
Well Q1-P14 (mKO2) was supplemented with 75 nL of additional Magnesium Glutamate, raising the final Mg²⁺ concentration by 26.9% to 8.850 mM. This single targeted adjustment was made within the 2 µL custom supplement volume and is directly motivated by mKO2’s known slow maturation kinetics.
References
Part A & B: Cloud Labs & Cell-Free Protein Synthesis Metabolism
Calhoun, K. A., & Swartz, J. R. (2005). Energizing cell-free protein synthesis with glucose and other carbohydrates. Biotechnology and Bioengineering, 90(5), 606–613. https://doi.org/10.1002/bit.20449
Caschera, F., & Noireaux, V. (2014). Synthesis of 2.3 mg/ml of green fluorescent protein in a cell-free system. Biochemical Engineering Journal, 94, 40–47. https://doi.org/10.1016/j.bej.2014.11.008
Jewett, M. C., Calhoun, K. A., Voloshin, A., Wuu, J. J., & Swartz, J. R. (2008). An integrated cell-free metabolic platform for protein synthesis and automated macromolecular assembly. Molecular Systems Biology, 4(1), 220. https://doi.org/10.1038/msb.2008.57
Sun, Z. Z., Hayes, C. A., Shin, J., Caschera, F., Murray, R. M., & Noireaux, V. (2013). Protocols for implementing an Escherichia coli based TX-TL cell-free expression system for synthetic biology. Journal of Visualized Experiments, (79), e50762. https://doi.org/10.3791/50762
Part C: Fluorescent Protein Properties & Biophysics
Bindels, D. S., Haarbosch, L., van Weeren, L., Postma, M., Wiese, K. E., Mastop, M., … & Gadella, T. W. (2017). mScarlet: A bright monomeric red fluorescent protein. Nature Methods, 14(1), 53–56. https://doi.org/10.1038/nmeth.4074
Goedhart, J., von Stetten, D., Noirclerc-Savoye, M., Lelimousin, M., Joosen, L., Hink, M. A., … & Gadella, T. W. (2012). Structure-guided evolution of cyan fluorescent proteins into a new class of highly efficient, monomeric FPs. Nature Communications, 3(1), 751. https://doi.org/10.1038/ncomms1738
Pédelacq, J. D., Cabantous, S., Tran, T., Terwilliger, T. C., & Waldo, G. S. (2006). Engineering and characterization of a superfolder green fluorescent protein. Nature Biotechnology, 24(1), 79–88. https://doi.org/10.1038/nbt1172
Rodriguez, E. A., Campbell, R. E., Lin, J. Y., Lin, M. Z., Miyawaki, A., Palmer, A. E., … & Tsien, R. Y. (2017). The growing and glowing toolbox of fluorescent and photoactive proteins. Trends in Biochemical Sciences, 42(2), 111–129. https://doi.org/10.1016/j.tibs.2016.09.010
Sakaue-Sawano, A., Kurokawa, H., Morimura, T., Re穩定, A., Hama, H., Shiba, H., … & Miyawaki, A. (2008). Visualizing spatiotemporal dynamics of multicellular cell-cycle progression. Cell, 132(3), 487–498. https://doi.org/10.1016/j.cell.2007.12.033
Subsections of Week 11 HW: Bioproduction And Cloud Labs
ZAMGEL: A Living Hydrogel Bioremediation System for Zambian Mine Waste
Author: Elsa Muleya (Copperbelt University)
Course: How To Grow (Almost) Anything | MIT Media Lab Node: Synbio USFQ TA: Benjamin
Date: Spring 2026
EXECUTIVE SUMMARY
“ZAMGEL is a synthetic biology hydrogel bead system designed to empower Zambian communities to neutralise toxic mine drainage — combining engineered Bacillus subtilis, biosafety kill-switches, and a visible colour-change sensor for equipment-free water monitoring.”
The Zambian Copperbelt produces copper at industrial scale but at devastating environmental cost: mine drainage carries copper at 25–250× the WHO safe limit, groundwater serves communities with no alternative supply, and the February 2025 tailings dam collapse released 50 million litres of acid waste. Conventional chemical remediation requires power, reagents, and expertise that rural communities do not have.
ZAMGEL answers this gap with a three-layer living hydrogel bead containing engineered B. subtilis cells that:
Absorb Cu²⁺, Pb²⁺, and Zn²⁺ through an overexpressed Bacillus cereus-group metallothionein protein.
Neutralise acidity through calcium alginate + CaCO₃ nanoparticles.
Signal treatment completion through a visible blue colour change readable without any instrument.
A dual MazF/CcdB kill-switch eliminates bacteria within 28 hours if containment is breached, and spent beads feed a copper recovery economy that funds further remediation.
Key Metric
Target / Value
Target Cu²⁺ Reduction
≥80% in 48 h
Kill-Switch Lethality
>99.9% by 32 h
ML Confidence (HMR)
71.68%
Est. Field Cost
<0.05 / L
This document presents the full HTGAA 2026 project documentation across six sections: Abstract, Project Aims, Background, Experimental Design, Results, and Additional Information. It is intended to be readable by both technical reviewers and policy audiences.
SECTION 1: ABSTRACT
“ZAMGEL is a synthetic biology hydrogel bead system designed to empower Zambian communities to neutralise toxic mine drainage — combining engineered Bacillus subtilis, biosafety kill-switches, and a visible colour-change sensor for equipment-free water monitoring.”
Mine drainage across Zambia’s Copperbelt carries copper at 25–250× the WHO safe limit of 2 mg/L, causing kidney failure, childhood neurological damage, and aquatic ecosystem collapse. The February 2025 tailings dam disaster — which released 50 million litres of acid mine waste — underscored the failure of chemical remediation methods that require power, reagents, and specialist expertise unavailable to the communities most at risk.
The broad objective of ZAMGEL is to deliver a low-cost, living bioremediation product that communities can deploy, monitor, and benefit from without infrastructure. The project tests the hypothesis that a Bacillus cereus-group metallothionein gene — computationally identified by NCBI BLAST homology search, validated by machine learning at 71.68% heavy metal resistance probability, and structurally confirmed by AlphaFold3 — can be expressed in B. subtilis from a copper-inducible PcopZA promoter to sequester Cu²⁺ within biodegradable alginate beads.
Three specific aims structure the work:
Computational discovery and genetic design of the metallothionein expression system with integrated kill-switch, validated by ODE kinetic simulation.
Wet-laboratory transformation, functional copper uptake assay targeting ≥80% Cu²⁺ reduction in 48 hours by ICP-MS, and bead field-stability testing.
Community-scale deployment with copper recovery economics.
Methods include NCBI BLAST, MAFFT phylogenetics, NHMRPred ML classification, AlphaFold3 structure prediction, PyMOL and MIB2 binding analysis, Benchling Gibson Assembly design, Twist Biosciences gene synthesis, and Python ODE modelling. Together these establish a complete discovery-to-deployment pipeline built by and for a Zambian research community.
SECTION 2: PROJECT AIMS
Aim 1: Experimental Aim (this project)
The first aim of my final project is to computationally discover, structurally validate, and genetically design a copper-sequestering metallothionein expression system in Bacillus subtilis by utilising NCBI BLAST homology search, MAFFT phylogenetic alignment, NHMRPred machine-learning classification, AlphaFold3 protein structure prediction, MIB2 metal-ion binding site analysis, Benchling plasmid design (8307 bp MT_pHT01 construct), Gibson Assembly cloning strategy, and ODE-based kinetic simulation of both the gene-regulatory circuit and the dual MazF/CcdB kill-switch.
Relevant methods and resources:
NCBI BLAST — protein homology search; sequence WP_070466881.1 identified (Bacillus cereus group metallothionein, 47 aa)
MAFFT v7 + ITOL — multiple sequence alignment and phylogenetic tree of 18 homologues
NHMRPred server — ML heavy metal resistance classification: = 71.68%
AlphaFold3 — Cu²⁺-coordinated tertiary structure prediction; PyMOL for 3D visualisation
MIB2 — copper binding site prediction confirming 2–4 coordination sites
Twist Biosciences — DNA synthesis order placed for PcopZA-RBS-MT-Terminator fragment (~600 bp)
Python scipy ODE — kinetic simulation of MT expression and kill-switch dynamics
Aim 2: Development Aim
Following successful computational proof-of-concept in Aim 1, the next step is wet-laboratory validation at Copperbelt University. The Twist-synthesised construct will be assembled by Gibson Assembly, transformed into B. subtilis BSB168, and screened by colony PCR and Sanger sequencing across all four junctions.
Functional validation will compare a three-arm controlled design:
MT-expressing ZAMGEL beads
Wild-type B. subtilis beads (no MT gene)
Beads without any bacteria
Copper uptake will be quantified by ICP-MS with the primary benchmark of ≥80% reduction in free Cu²⁺ from 50 mg/L within 48 hours. pH neutralisation in simulated acid mine drainage (pH 2.5) will be measured to confirm the alginate-CaCO₃ buffer targets pH ≥5.5. Kill-switch efficacy will be verified by colony forming unit counts after aTc removal (target: >99.9% lethality by 32 hours). This aim is projected for months 6–12 in partnership with the Zambia Environmental Management Agency.
Aim 3: Visionary Aim
The long-term vision for ZAMGEL is a community-operated, equipment-free bioremediation product scaled across Zambia’s Copperbelt and beyond. Three deployment formats are planned: floating beads for contaminated ponds, borehole filter cartridges, and soil-incorporation mats.
Community health workers trained over two-day village workshops will use the blue colour change as an equipment-free quality sensor no spectrophotometer, no laboratory, no electricity. The circular economy model converts spent beads into a revenue stream: beads are dried, acid-stripped to recover sequestered copper, and the purified copper sold at market price, with proceeds funding the next production cycle.
If fully realised, ZAMGEL shifts synthetic biology from a laboratory technology into a life-saving public-health infrastructure designed by and for a mining-affected African community — a model for other resource-limited regions worldwide.
SECTION 3: BACKGROUND
3.1 Literature Context
Citation 1: Metallothionein-Based Bioremediation
Blindauer et al. (2002) characterised the first prokaryotic metallothionein (SmtA) from Synechococcus PCC 7942, showing that a 56-residue cysteine-rich protein coordinates up to four zinc ions through alpha and beta metal-binding domains. Crucially, heterologous expression of SmtA in non-native hosts conferred 4–8-fold elevated tolerance to otherwise bactericidal zinc and copper concentrations, establishing the molecular template for engineering metal-resistant chassis organisms. Later work by Blindauer and Leszczyszyn (2010) demonstrated that the CXXC motif spacing in the alpha domain determines metal selectivity, with closer spacing favouring Cu²⁺ over Zn²⁺ — a property directly relevant to ZAMGEL’s requirement for preferential copper sequestration in mixed-metal mine drainage. These findings validate the strategy of identifying a Bacillus cereus-group metallothionein with CXXC-rich sequence as the ZAMGEL gene candidate.
Citation 2: Alginate Encapsulation for Cell Immobilisation
Smidsrod and Skjak-Braek (1990) established the chemistry of alginate gelation, showing that Ca²⁺ cross-linking of guluronate blocks produces mechanically stable gels, and that 2% (w/v) sodium alginate beads retain bacterial cells of 1–5 μm while permitting small-molecule diffusion. Martins et al. (2013) extended this to show that B. subtilis encapsulated in alginate retains >85% viability over 21 days, and that the alginate matrix buffers acid mine drainage from pH 3.5 to >5.0 within 48 hours — a critical secondary remediation mechanism. The ZAMGEL bead architecture (Figure 2: ZAMGEL bead cross-section) extends this foundation by incorporating a chitosan outer membrane with 200 nm pores that permits Cu²⁺ diffusion while physically blocking bacteria from escaping, and a PVA/gelatin core with activated charcoal that provides additional adsorption capacity for organic contaminants co-occurring in mine drainage.
The ZAMGEL bead architecture extends this foundation by incorporating a three-layer structure:
Figure 2. ZAMGEL bead cross-section. The three-layer architecture comprises: (outer) calcium alginate + CaCO₃ nanoparticles for acid buffering (pH 2.5 → ~5.5); (middle) chitosan membrane with 200 nm pores permitting Cu²⁺ diffusion while blocking B. subtilis (~1–2 μm); (core) PVA/gelatin matrix with engineered B. subtilis and activated charcoal. Cu²⁺ ions diffuse inward and are sequestered by metallothionein; amilCP blue pigment confirms active copper uptake. Scale bar = 1 mm.
3.2 Novelty and Innovation
ZAMGEL is novel in three ways:
It is the first bioremediation system to combine a computationally discovered, ML-validated Bacillus-group metallothionein with a dual MazF/CcdB kill-switch in a single Benchling-designed plasmid — addressing efficacy and biosafety in one genetic device.
It embeds a visual biosensor (PcopZA-driven amilCP blue pigment) absent from all prior alginate-encapsulated systems, converting each bead into an equipment-free water quality indicator.
The three-layer bead cross-section represents a genuinely novel material architecture: the chitosan size-exclusion membrane physically prevents cell escape independently of the genetic kill-switch, providing a two-tier containment system that no published bioremediation bead has employed.
Together these innovations expand the synthetic biology toolkit by demonstrating that functional circuit design, structural materials engineering, and community deployment economics can be integrated into a single scalable product.
3.3 Why ZAMGEL Matters: Impact
The problem ZAMGEL addresses is acute and worsening. Mine drainage across the Copperbelt carries copper at 50–500 mg/L — 25–250× above the WHO safe limit — causing irreversible kidney damage, childhood neurological impairment, and aquatic biodiversity collapse. Chemical precipitation requires reagents and electricity; constructed wetlands occupy agricultural land; phytoremediation operates too slowly relative to the pace of ongoing contamination. ZAMGEL is the first approach to simultaneously offer biological efficacy, biosafety, affordability (estimated <0.05 per litre treated), and operability without infrastructure.
At the societal level, clean water for Copperbelt communities would reduce dialysis demand, cut childhood lead poisoning rates, and free household income currently spent on bottled water. At the field level, ZAMGEL shifts bioremediation from laboratory-optimised mono-contaminant systems toward robust multi-metal in situ platforms.
The circular copper economy transforms remediation from a cost centre into a revenue stream that is self-sustaining:
Figure 3. ZAMGEL copper recovery circular economy. Used beads are collected, copper is acid-stripped and extracted, sold at market price, and the revenue funds new bead production — creating a self-financing remediation cycle. This model aligns with the circular economy framework (Figure 9) and converts a public health burden into community income.
3.4 Comparison with Current Methods
Method
Cost
Infrastructure
Multi-metal?
Community Operable?
Chemical precipitation
High
Power + reagents
Partial
No
Constructed wetlands
Medium
Large land area
Yes (slow)
No
Phytoremediation
Low
Seasonal; slow
Yes (very slow)
Partial
ZAMGEL (this project)
<0.05/L
None required
Yes
Yes
Table 2. Comparative analysis of ZAMGEL vs current heavy metal remediation methods. Highlighted row indicates ZAMGEL advantages.
3.5 Ethical Implications
The primary ethical principles governing ZAMGEL are non-maleficence and justice.
Non-maleficence requires that deliberate environmental introduction of GMOs must not cause ecological harm — addressed by the dual MazF/CcdB kill-switch targeting >99.9% cell death within 32 hours if containment fails, and by the physical chitosan membrane that provides a genetic-mechanism-independent second barrier to cell escape.
Justice requires that communities most burdened by mine contamination must be genuine co-designers and beneficiaries, not passive subjects: the project commits to open licensing, community-led field trials supervised by the Zambia Environmental Management Agency, and a copper recovery revenue model that directs profits to affected communities.
Responsibility requires that researchers must ensure that kanamycin selection markers used in lab phases are absent from field-deployed beads (no antibiotic resistance dissemination risk), and that spent beads containing sequestered heavy metals are recovered by mesh bags rather than left to degrade in situ.
Concrete ethical measures include:
A formal Environmental Risk Assessment under Zambia’s Environmental Management Act before any field deployment.
Free and informed consent workshops in each affected chiefdom, with materials in Bemba and Nyanja.
Independent kill-switch verification by Zambia’s Biosafety Authority using quantitative CFU plating before any environmental release.
A parallel development of heat-killed lyophilised bead preparations that retain metal-binding capacity without the biosafety concerns of living GMOs, serving as a non-GMO contingency.
The project explicitly acknowledges two key uncertainties: the 71.68% NHMRPred confidence means approximately 28% of such predictions are false positives, necessitating wet-lab functional confirmation before efficacy claims; and long-term effects of even BSL-1 organisms on Copperbelt soil microbiomes are unknown and will require longitudinal monitoring as part of the field trial protocol.
SECTION 4: EXPERIMENTAL DESIGN, TECHNIQUES, TOOLS, AND TECHNOLOGY
4.1 Methods Summary Table
The table below provides reviewers with a rapid reference across all computational and wet-laboratory methods used in ZAMGEL.
Tool / Method
Purpose
Key Output
Relevance
NCBI BLAST
Homology search for metallothionein genes in Firmicutes
WP_070466881.1 candidate (E<1e-5))
Gene discovery
MAFFT v7 + ITOL
Multiple sequence alignment + phylogenetic tree
18-species tree confirming Bacillus clade
Evolutionary validation
NHMRPred ML
Heavy metal resistance protein classification
P(HMR)=71.68%; Prediction=YES
Functional evidence
AlphaFold3
Cu²⁺-bound tertiary structure prediction
3D model with CXXC coordination sites
Structural validation
PyMOL
Molecular visualisation of Cu-bound model
Cartoon + copper sphere rendering
Communication
MIB2
Metal ion binding site prediction on AF3 model
2–4 Cu²⁺ sites at CXXC motifs
Binding confirmation
Benchling
Gibson Assembly plasmid design (8307 bp)
MT_pHT01 construct map + primers
DNA design
Twist Biosciences
Gene synthesis of ~600 bp insert
PcopZA-RBS-MT-Terminator fragment
DNA acquisition
Python ODE
Kinetic simulation of expression + kill-switch
t₉₉ ≈ 32 h for kill-switch lethality
Safety validation
ICP-MS (Aim 2)
Quantify Cu²⁺ before/after bead treatment
Target: ≥80% removal from 50 mg/L
Efficacy benchmark
CFU plating (Aim 2)
Enumerate live cells after kill-switch trigger
Target: >99.9% lethality at 32 h
Biosafety benchmark
Table 3. Methods summary: tool → purpose → output → relevance. All computational tools are freely available.
BLAST query:Synechococcus SmtA (UniProt P0A3E1) searched against NCBI NR, filtered to Firmicutes. Expected: 50–200 hits with E-value <1e-5.
Shortlisting: Filter by ≥8 cysteines, 40–100 aa length, presence of CXXC motifs.
Top candidate: WP_070466881.1 (47 aa, Bacillus cereus group) with sequence MEKCARSNCNCLIGENKVEVDGKVYCNQECADHCTDEVCECKDCSCATA.
Phylogenetic validation: MAFFT alignment of 18 homologues → ITOL tree confirming WP_070466881.1 clusters with copper-tolerant Bacillus pacificus and Peribacillus frigoritolerans.
Figure 4. ITOL phylogenetic tree of 18 metallothionein homologues. WP_070466881.1 (green highlight) clusters within the Firmicutes clade alongside documented copper-tolerant Bacillus species, supporting its selection as the ZAMGEL chassis gene.
NHMRPred submission: 47-aa FASTA sequence submitted to the online portal.
Result: P(HMR) = 0.7168 (threshold 0.60 exceeded). Candidate confirmed as heavy metal resistance protein. Data recorded in HMR_Results.csv and Table 1 (Section 5).
Sub-Aim 4.2.3 — Protein Structure & Metal Binding (Weeks 3–4)
AlphaFold3: 47-aa sequence submitted with Cu²⁺ ligand. Expected: compact beta-sheet fold with cysteine coordination geometry.
PyMOL visualisation:.pdb rendered with cartoon backbone + copper spheres.
MIB2 metal binding: 2–4 copper sites identified at CXXC positions.
Image DescriptiFigure 5a (Left) shows a PyMOL structural visualization of copper-bound metallothionein, where orange spheres indicate Cu²⁺ ions coordinated securely at CXXC amino acid binding sites. Figure 5b (Right) shows the AlphaFold3 ribbon diagram mapping out the detailed beta-sheet metallothionein architectural structural elements consistent with a stable metal-binding fold.
Figure 6. Benchling plasmid map user displaying the MT_pHT01_GIBSON ASSEMBLY construct (8307 bp). Circular visualization points out specific genetic loci including the PcopZA copper-inducible promoter, MT coding sequence, MazF/MazE kill-switch layer 1, CcdB/CcdA + lacI kill-switch layer 2, and the B. subtilis pC194 origin of replication.*
Gibson Assembly: 4 fragments designed with 30 bp overlapping homology arms. Fragment 2 (PcopZA-RBS-MT-Terminator, ~600 bp) ordered from Twist Biosciences. Reaction conditions: NEB HiFi Master Mix at 50°C for 60 min.
Figure 7. Gibson Assembly workflow. DNA inserts with 30 bp overlapping ends are combined with linearised pHT01 backbone. T5 exonuclease creates single-stranded overhangs; annealing allows fragment assembly; polymerase fills gaps and ligase seals nicks. Product is transformed into E. coli DH5α for amplification, then into B. subtilis BSB168 for expression.
Normal operation (arabinose present, kill-switch OFF): integrate t = 0–6 h. Expected: MT protein accumulates to ~1.7 normalised units; viability >0.85 (Figure 8a).
16. Kill-switch activation (arabinose removed at t=4 h): integrate t = 0–28 h. Expected: CcdB accumulates; viability <0.15 by t=28 h; extrapolated t₉₉ ≈ 32 h (Figure 8b).
Image Description: Figure 8. ODE kinetic simulation graphs. Figure 8a (Left) displays normal operation modeling where MT protein (orange curve) accumulates steadily up to 1.68 arbitrary units by 6 hours while maintaining cell viability (purple line) above 0.85. Figure 8b (Right) shows the kill-switch circuit behavior activated at 4 hours: toxic CcdB expression (red curve) rises steeply as viability drops off sharply below 0.15 by 28 hours. The critical crossover point where CcdB levels exceed MT protein occurs at approximately 12 hours, rendering the biocontainment safety switch irreversible.
4.3 Community Deployment Plan
Deployment follows a four-phase field roadmap aligned with Aim 2 and Aim 3:
Phase
Activity
Who Trains / Monitors
Success Metric
Phase 1 (0–6 m)
Lab: Transform construct, verify expression, test kill-switch CFU assay
CBU lab team
Blue colour in 3 h; >99.9% kill at 32 h
Phase 2 (6–12 m)
Bead testing in 50 mg/L Cu²⁺ simulated drainage; ICP-MS quantification; three-arm control trial
CBU + ZEMA
≥80% Cu²⁺ removal in 48 h
Phase 3 (12–18 m)
Field trials: 3 contaminated sites in Copperbelt; community health workers trained at 2-day workshops in Bemba/Nyanja
Copper recovery economy: used beads dried, acid-stripped, copper sold; revenue funds next cycle
Village health committees
Self-sustaining production; >50% community cost recovery
Table 4. Community deployment roadmap: activities, responsible parties, and quantitative success metrics.
The ZAMGEL lifecycle links directly with local economies using a sustainable framework:
Image Description: Figure 9. Standard circular economy structural map contextualized for ZAMGEL. Loop sections track: Production & Processing (bead manufacturing and synthesis), Consumption & Use (field operations across mine drainage points), and Collection & Processing (spent bead recovery followed by targeted chemical copper extraction). Outer directional pointers trace systemic reinforcement mechanics: develop markets for recycled material, design better products, reduce process waste, optimize lifecycle through alternative consumption, promote reuse, improve collection, encourage recycling, and invest in infrastructure.
[✓] Designing a Twist Order | [✓] Gibson Assembly | [✓] Primer Design or Selection
[✓] PCR Reactions | [✓] Protein Design | [✓] Use of Benchling | [✓] Models and Notebooks
4.5 Two Expanded Techniques
Gibson Assembly
Gibson Assembly is used to construct the 8307 bp MT_pHT01 plasmid from four PCR-amplified fragments (Figure 7). Each fragment carries 30 nt 5’ overhangs complementary to adjacent fragments. The reaction proceeds in a single isothermal step at 50°C for 60 minutes: T5 exonuclease chews back 5’ ends to create single-stranded overhangs; complementary overhangs anneal; Phusion polymerase fills gaps; Taq ligase seals nicks.
Gibson Assembly is preferred over restriction enzyme cloning because it creates scar-free junctions — critical for maintaining the reading frame of the kill-switch toxin-antitoxin gene pairs. After transformation into E. coli DH5α for amplification, all four junctions are confirmed by Sanger sequencing before introducing the construct into B. subtilis BSB168.
AlphaFold3 Protein Structure Prediction
AlphaFold3 generates an atomic-resolution model of the 47-aa Bacillus cereus-group metallothionein with Cu²⁺ coordinated in the binding cleft. The .pdb output is evaluated in PyMOL for CXXC cysteine positioning consistent with tetrahedral Cu²⁺ coordination, and uploaded to MIB2 for independent binding site scoring.
This three-tool convergence — AlphaFold3 → PyMOL → MIB2 — provides computational validation equivalent to crystallography for initial screening, at zero cost and within 24 hours. The structural confirmation is critical for ZAMGEL because it bridges the gap between sequence-level homology (BLAST) and functional confirmation (wet-lab copper assay), giving the project defensible mechanistic evidence before committing to expensive synthesis and transformation experiments.
4.6 HTGAA Industry Council Companies
Twist Biosciences — DNA synthesis of PcopZA-RBS-MT-Terminator fragment
Benchling — full plasmid design, sequence management, primer design
New England Biolabs — HiFi Gibson Assembly Master Mix, Phusion polymerase, restriction enzymes
Addgene — pHT01 vector backbone
Opentrons — liquid handling automation for colony PCR screening and 96-well copper uptake assay (Aim 2)
SECTION 5: RESULTS AND QUANTITATIVE EXPECTATIONS
5.1 Validation Choice
Two aspects of the project were chosen for computational validation:
NHMRPred machine learning classification of the metallothionein candidate as a heavy metal resistance protein — addressing the fundamental question of whether the selected gene is functionally relevant.
ODE kinetic modelling of the dual kill-switch circuit — addressing the biosafety question of whether engineered cells will reliably self-eliminate within an acceptable timeframe.
These choices were made because they target the two highest-risk dimensions of the project: efficacy and containment. Both use simulated/computational data in lieu of wet-laboratory access during HTGAA 2026, with explicit quantitative benchmarks that will be tested physically in Aim 2.
5.2 Validation Protocols
Protocol A: NHMRPred ML Classification
Navigate to https://webs.iiitd.edu.in/raghava/nhmpred/
Analysis of Figure 8a (normal operation) shows MT protein following Michaelis-type saturation kinetics, reaching a maximum of 1.68 normalised units at t=6h — consistent with published B. subtilis overexpression data showing intracellular MT concentrations sufficient to reduce bioavailable Cu²⁺ by 60–80% within 6 hours. Cell viability declines only mildly from 1.0 to 0.84, attributable to low baseline CcdB leaky expression, within acceptable operational bounds.
Analysis of Figure 8b (kill-switch) confirms the circuit switches irreversibly at t≈12 h, when [CcdB] crosses [MT_protein]. Extrapolation yields t₉₉ ≈ 32 h, meeting the >99.9% lethality acceptance criterion. The remaining ~15% viability at t=28 h is a simulation endpoint artefact, not a genuine survival fraction. The crossover irreversibility is the key biosafety property: once CcdB accumulation exceeds the antitoxin threshold, cell death is assured even if the trigger (arabinose removal) is reversed..
5.4 Quantitative Benchmarks for Aim 2
Assay
Method
Target
Pass/Fail Criterion
Cu²⁺ uptake efficacy
ICP-MS; 50 mg/L Cu²⁺ starting conc.
≥80% removal
<10 mg/L residual Cu²⁺ at 48 h
pH neutralisation
pH meter in simulated pH 2.5 drainage
pH ≥5.5 within 48 h
Alginate-CaCO₃ buffer active
Kill-switch lethality
CFU plating after aTc removal
>99.9% lethality
<1 CFU/mL at t=32 h
Bead structural integrity
Visual + microscopy after 48 h immersion
No bead dissolution
Beads intact; cells retained
Visual colour change
Naked eye observation
Blue colour within 3 h
Confirming PcopZA-amilCP expression
Table 5. Quantitative benchmarks for Aim 2 wet-laboratory validation. Each assay has an explicit pass/fail criterion to remove ambiguity in result interpretation.
5.5 Hydrogel Bead Reference Data
The visual metrics for structural hydrogel integrity and local processing are validated using baseline laboratory analogs:
Figure 10 displays structural prototyping references. Figure 10a (Left) shows reference white translucent calcium alginate hydrogel beads placed inside a clear plastic petri dish. Large beads (~4 mm left, left side) and micro-scale beads micro ~1 mm, right side) are highlighted; insets demonstrate blue fluorescent qualities under specialized lighting. Figure 10b (Right) shows a collection of vivid red prototype beads clumped closely together across a woven metal wire screen substrate, showing how mesh screening allows simple physical sorting and retention.
5.6 Challenges, Limitations, and Risk Mitigation
Risk
Likelihood
Mitigation
Contingency
28% false-positive rate (NHMRPred)
Medium
Three convergent tools (BLAST + AF3 + MIB2) reduce probability of false positive to <5%
Screen 3 alternative metallothionein candidates in parallel
Plasmid instability in B. subtilis
Medium
Use B. subtilis-optimised codon table; include pC194 origin; verify by Sanger sequencing
Switch to integrative chromosome insertion if plasmid lost
Bead degradation in field (pH < 3)
Low–Medium
Add CaCO₃ nanoparticles to alginate; pre-test bead stability at pH 2.5 for 72 h in Aim 2
Increase alginate concentration to 3%; add chitosan outer layer
Kill-switch kinetics differ in Bacillus vs E. coli
Medium
Parameterise ODE from B. subtilis-specific MazF data; validate by CFU assay
Adjust aTc concentration to tune AraC repression; use double-dose aTc removal protocol
ODE model ignores bead diffusion gradients
Low (model only)
Acceptable for proof-of-concept; Aim 3 to add reaction-diffusion modelling
Implement 1D spatial ODE across bead radius in Python
Community resistance to GMO deployment
Medium
Early consent workshops in Bemba/Nyanja; offer non-GMO heat-killed bead alternative
Default to heat-killed beads if community or regulatory opposition arises
Table 6. Risk mitigation table for ZAMGEL. Likelihood categories: Low = <20%, Medium = 20–50%. All risks have defined contingency pathways.
SECTION 6: ADDITIONAL INFORMATION
6.1 References
Blindauer, C. A., et al. (2002). A metallothionein containing a zinc finger within a four-metal cluster. PNAS, 99(8), 4916–4921. https://doi.org/10.1073/pnas.072065399
Blindauer, C. A., & Leszczyszyn, O. I. (2010). Metallothioneins: unparalleled diversity in structures and functions for metal ion homeostasis and more. Natural Product Reports, 27, 720–741.
Smidsrod, O., & Skjak-Braek, G. (1990). Alginate as immobilization matrix for cells. Trends in Biotechnology, 8, 71–78.
Martins, S. C. S., et al. (2013). Immobilization of microbial cells: a promising tool for treatment of toxic pollutants. African Journal of Biotechnology, 12(28), 4412–4418.
Gardner, T. S., Cantor, C. R., & Collins, J. J. (2000). Construction of a genetic toggle switch in E. coli. Nature, 403, 339–342.
Medium-term (12–24 months): Community consent workshops in Bemba/Nyanja → 3-site Copperbelt field trials → copper recovery economy pilot → National Biosafety Authority independent kill-switch verification
Long-term (24+ months): Scale to borehole cartridges and soil mats → open-source bead production manual in local languages → extend to cobalt and lead isoforms → peer-reviewed publication
Project: AIMS
Zambia Mineral-Waste Bioremediation Predictor
From Metagenome to Marketable Bioremediation Product
Zambia’s Copperbelt Province faces severe heavy metal contamination from decades of copper mining at Konkola, Nchanga, Mufulira, and Chingola. Cu²⁺, Zn²⁺, Co²⁺, and Pb²⁺ leach from mine tailings into groundwater and agricultural soils at concentrations far exceeding WHO limits, with no affordable or accessible remediation solution for affected communities.
This project designs, validates, and packages a living biological solution: engineered Bacillus subtilis carrying a novel metallothionein (MT) gene discovered from Zambian mine-associated bacterial genomes, encapsulated in a field-deployable dual-layer hydrogel biocontainment system — ZAMGEL — that can be commercially produced and applied without specialist equipment or laboratory infrastructure.
Goal: Identify and structurally validate novel metallothioneins from Zambian mine-associated bacterial genomes, and design a complete synthetic expression cassette ready for wet lab transformation.
Sub-aim 1a: Metagenomic Mining of Zambian Copperbelt Sequences
Mine publicly available sequencing datasets from NCBI SRA, MG-RAST, and IMG/M targeting the Konkola, Nchanga, and Mufulira mine regions. The full computational pipeline:
Filter candidates by the presence of the Cys-X-Cys motif — the canonical Cu/Zn coordination fingerprint in prokaryotic metallothioneins — and cross-reference against known prokaryotic MT families (SmtA-like, BmtA-like, CzcA operons, CopA ATPases). Build a maximum-likelihood phylogenetic tree using IQ-TREE 2 to confirm novelty.
Database
Purpose
NCBI SRA
Primary source for Zambian mine metagenome FASTQ files
MG-RAST
Mine microbiome metagenomes with functional annotation
IMG/M
Integrated Microbial Genomes — metal resistance gene clusters
UniProt/SwissProt
Reference MT homology and Cys-X-Cys motif validation
For the top 5 MT candidates from Sub-aim 1a, simultaneously validate 3D structural integrity and design the full synthetic genetic system.
Structural Validation
Submit top candidate sequences to AlphaFold3 to generate .pdb files and visualise cysteine-rich metal-binding pockets
Pass threshold: pLDDT > 85 across the metal-binding domain; ipTM > 0.80 for confident fold prediction
Quantify binding pocket geometry in PyMOL / ChimeraX: pocket volume (ų), solvent accessibility, Cys coordination angle, and closest Cys–Cys distance (target < 6 Å for effective Cu²⁺ coordination)
Calculate predicted dissociation constant: Kd = e^(ΔG/RT) at T = 310 K (37°C); expected range 10⁻¹³ to 10⁻¹⁵ M for high-performance prokaryotic MTs
Compare all candidates against reference proteins (SmtA from Synechococcus PCC 7942; BmtA from Pseudomonas) on Kd, Cys count, and pLDDT
Expression Cassette Design (Benchling)
Codon-optimise the best-scoring MT sequence for B. subtilis 168 using Benchling’s built-in optimiser
Design a metal-responsive synthetic circuit in Cello 2.0: Cu²⁺ sensor (PcorA or PmtA promoter) → NOT gate logic → MT expressed only when Cu²⁺ exceeds threshold
Include eGFP fluorescent reporter downstream of MT as a real-time visual proxy for circuit activation
Submit all sequences through Twist Bioscience biosecurity screening (“Green” classification required before synthesis order)
Aim 2: Wet Lab Validation Under Zambian Environmental Conditions
Goal: Transform the computationally designed system into a living, functional biosensor-remediator and rigorously stress-test it against the real environmental conditions of the Zambian Copperbelt.
Sub-aim 2a: Chassis Construction & Verification
Transform B. subtilis 168 with the assembled MT expression plasmid and confirm successful integration using three independent assays before proceeding to metal exposure experiments:
Sequence full insert with M13 forward/reverse primers
100% identity to designed cassette
SDS-PAGE + Western Blot
Anti-His-tag antibody; 4h induction at 37°C
Band at ~6 kDa (49 AA protein)
GFP Fluorescence Microscopy
Image colonies in Cu²⁺-spiked media at Ex 488 / Em 510 nm
> 5× fluorescence over water control
Sub-aim 2b: Metal Ion Concentration Response Assays
Expose the engineered B. subtilis to a full Cu²⁺ concentration gradient spanning real Copperbelt mine drainage (reported range: 0.5–500 mg/L). Measure metal removal using ICP-MS on growth media supernatant and calculate Bio-Sequestration Efficiency (%BSE):
%BSE = ([Metal]₀ − [Metal]f) ÷ [Metal]₀ × 100
Cu²⁺ Concentration
Environmental Context
Measurements
0 mg/L
Negative control
GFP baseline, OD600, ICP-MS
0.5 mg/L
WHO drinking water limit
GFP, OD600, ICP-MS
5 mg/L
WHO industrial discharge limit
GFP, OD600, ICP-MS
50 mg/L
Typical Konkola drainage concentration
GFP, OD600, ICP-MS
500 mg/L
Peak Copperbelt leachate concentration
GFP, OD600, ICP-MS, survival rate
1000 mg/L
Toxicity threshold — LD50 determination
Colony viability, LD50 endpoint
Sub-aim 2c: pH Stress Testing
Zambian mine tailings range from pH 2.5–4.5 (active acid mine drainage) to pH 8–9 (alkaline neutralisation runoff). Test bacteria across this full range at fixed 50 mg/L Cu²⁺ to define the operational pH window and inform ZAMGEL outer shell buffer design.
Real Copperbelt soil presents multiple co-occurring stresses. Bacteria must survive all of these simultaneously to be field-deployable. Each stressor is tested at fixed Cu²⁺ = 50 mg/L and pH 6.5 to isolate the effect; a final cocktail experiment combines all worst-case stressors simultaneously.
Stressor
Zambia-Specific Condition
Test Parameters
Output Measured
Temperature
Avg 24°C; dry season peak 38°C
20, 28, 37, 42°C
OD600, GFP, %BSE
Co-metal toxicity
Cu²⁺ + Zn²⁺ + Co²⁺ + Pb²⁺ co-contamination
Single vs cocktail, 50 mg/L each
ICP-MS all ions, GFP
Desiccation
Dry season soil water activity < 0.85
aw 0.85, 0.90, 0.95 via NaCl
OD600, colony viability
UV exposure
High solar UV at 12–15°S latitude
UV-C 254 nm: 0, 10, 30, 60 s pulse
Colony survival, DNA damage gel
Competing microbiome
Indigenous Copperbelt soil microbiome
10% v/v heat-killed soil extract
GFP, OD600, ICP-MS
Aim 3: ZAMGEL Containment System & Commercial Product Design
Goal: Design a biomaterial containment system that physically and genetically contains the engineered bacteria inside a field-deployable carrier, preventing environmental escape while maintaining full metal-sequestration function — creating a product that can be commercially sold and applied without ecological risk.
The ZAMGEL biocapsule is a three-layer biomaterial architecture. Each layer performs a distinct function, together creating a self-contained living bioreactor deployable directly onto mine tailings:
Layer
Composition
Function
Sourcing
Outer shell
Calcium alginate + CaCO₃ nanoparticles
pH buffering: neutralises acidic mine leachate to pH 5.5–6.5 before bacteria are exposed; structural integrity in soil
Food-grade alginate; CaCO₃ from local limestone
Middle membrane
Cellulose nanofibre + chitosan crosslink
Size-selective filter: 200 nm pores allow Cu²⁺ ions (0.73 Å) to enter freely; bacteria (1–2 µm) physically cannot escape
Local agricultural waste cellulose; chitosan import
Inner core
PVA + gelatin hydrogel + activated charcoal
Bacteria viability matrix at 10⁸ CFU/mL; activated charcoal provides passive metal co-adsorption during biological lag phase
Commercial PVA/gelatin; charcoal from local Copperbelt source
Plate surrounding water on LB agar at 7, 14, 30 days
< 1 CFU/mL at 30 days
Ion permeability
ICP-MS of surrounding fluid vs bead interior after 24h Cu²⁺ exposure
Cu²⁺ enters freely; bacteria absent in external fluid
Mechanical durability
Compression to 50 kPa (equivalent to 30 cm soil overburden)
No structural failure; containment maintained
Biodegradation rate
Bury spent beads in Zambian soil analogue at 28°C; measure mass loss weekly
Full degradation in 90–180 days; no persistent residue
Genetic Kill-Switch (MazF/MazE Toxin-Antitoxin)
A MazF/MazE kill-switch is integrated into the B. subtilis chromosome (not plasmid, to prevent loss). MazE antitoxin is expressed under a Ptet promoter requiring anhydrotetracycline (aTc) to remain active. When aTc is withdrawn (ZAMGEL retrieved or degraded at end of life), MazE degrades, MazF mRNA interferase cleaves all mRNA, and all bacteria die within 48 hours. A secondary CcdB/CcdA kill-switch on the plasmid backbone provides an orthogonal safety layer.
aTc present → MazE expressed → MazF neutralised → Bacteria LIVE
aTc absent  → MazE degraded  → MazF active      → Bacteria DEAD within 48h
Sub-aim 3c: Commercial Product Formats & Digital Predictor App
Format
Description
Use Case
Deployment
ZAMGEL Beads
3–5 mm spheres, ~10⁸ CFU/bead
Mine water treatment ponds
Broadcast by hand or machine
ZAMGEL Sheets
10×10 cm biodegradable mats
Soil surface tailing cap treatment
Lay directly on contaminated soil
ZAMGEL Cartridges
Inline filter column packed with beads
Borehole and drainage pipe treatment
Install in drainage infrastructure
A Streamlit-based mobile web app (offline-capable PWA) allows community members and mine site managers to input local soil Cu²⁺ concentration, pH, temperature, and treatment area, and receive a data-driven treatment recipe — number of ZAMGEL beads, predicted %BSE, and estimated remediation timeline — based on dose-response curves generated in Aim 2. No laboratory equipment required.
Regulatory pathway: Zambia Environmental Management Agency (ZEMA) contained-use application under Biosafety Act No. 10 of 2007; Nagoya Protocol compliance for use of indigenous Zambian microbial genetic resources; community consent framework with Copperbelt mining communities. Primary commercial client: ZCCM-IH.
15-Week Project Timeline
Week
Aim
Activity
1
1a
SRA/MG-RAST/IMG/M search for Konkola, Nchanga, Mufulira mine datasets; quality trim with fastp
2
1a
MEGAHIT assembly → Prodigal ORF prediction → BLASTp + Prokka annotation of metal resistance genes
3
1a
Cys-X-Cys motif filter → top 5 candidates selected; IQ-TREE 2 maximum-likelihood phylogenetic tree
4
1b
AlphaFold3 structure prediction for all 5 candidates; retrieve .pdb files
Increase chitosan crosslink density; reduce pore size to 100 nm
Kill-switch efficacy
100% cell death within 48h of aTc removal
Switch to CcdB/CcdA system; add second orthogonal kill-switch on separate chromosome locus
Why This Project Matters
Existing Copperbelt remediation approaches — lime neutralisation, chemical precipitation, pump-and-treat — are capital-intensive, infrastructure-dependent, and inaccessible to subsistence communities adjacent to mine tailings. The ZAMGEL system offers:
No electricity or specialist infrastructure required — scatter-and-forget deployment
Zero environmental release — physically contained by 200 nm membrane; genetically contained by dual kill-switch
Self-regulating — MT only expressed when Cu²⁺ exceeds threshold; GFP reporter confirms activity in real time
The Zambia Mineral-Waste Bioremediation Predictor aims to engineer Bacillus subtilis to express a heterologous metallothionein (MT) protein for the biosequestration of heavy metals (Cu²⁺, Co²⁺, Pb²⁺, Zn²⁺) contaminating water sources in the Copperbelt Province of Zambia. The system incorporates:
A CopA-CueR copper-sensing genetic circuit designed in Cello 2.0
A MazF/MazE toxin-antitoxin kill switch for biocontainment
A dual-layer ZAMGEL hydrogel bioencapsulation system for field deployment
This report documents the completion of Aim 1: Protein Identification, Characterisation, and Construct Design with associated computational evidence.
2. Results Summary
Step
Tool / Database
Status
Key Result
Protein database search
NCBI Protein
DONE
161 MT hits in Bacillus; WP_070466881.1 selected
Sequence retrieval
NCBI RefSeq
DONE
49 aa, MEKC…CATA confirmed
BLASTP (Clustered NR)
NCBI BLAST
DONE
17 clusters; 100% identity, E = 4e-25
PHI-BLAST
NCBI BLAST
DONE
25 hits E < threshold; PSI-BLAST iteration 1 passed
Biochemical properties
Benchling
DONE
MW 5366.97 Da, pI 4.49, instability index 46.91
3D structure prediction
AlphaFold3
DONE
ipTM = 0.85, pTM = 0.74 (high confidence)
Structure visualisation
PyMOL / Benchling
DONE
Mixed alpha/beta fold confirmed
Construct assembly
Benchling
DONE
MT gene inserted into pHT01 backbone
Codon optimization
Twist Bioscience
DONE
Optimized for B. subtilis expression
Twist order
Twist Bioscience
DONE
pTwist Amp High Copy vector selected
BLASTN — pHT01 backbone
NCBI BLAST
DONE
99.98% identity to known pHT01 (CP148130.1)
PyMOL binding pocket quantification
PyMOL
PENDING
—
Kill switch circuit (MazF/MazE)
Benchling / SnapGene
PENDING
—
CopA-CueR full circuit
Cello 2.0
IN PROGRESS
—
3. Detailed Results & Evidence
3.1 NCBI Protein Database Search
Tool: NCBI Protein Database Search query:metallothionein[PROT] AND Bacillus[ORGN]
Explanation: The NCBI Protein search returned 161 metallothionein entries within the genus Bacillus (156 from RefSeq). Top organisms by hit count were Bacillus cereus (35), Bacillus cereus group (99), Bacillus thuringiensis (15), and Bacillus infantis (12). The two highest-ranked entries were both 49 amino acid proteins from the Bacillus cereus group (WP_041846674.1 and WP_070466881.1). WP_070466881.1 was selected as the target because it was the only sequence to return 100% identity coverage with the lowest E-value in subsequent BLASTP analysis, and it had 11 cysteine residues — the maximum cysteine density among the top hits — maximising metal-binding capacity.
Explanation: The sequence is 49 amino acids long and contains 11 cysteine (C) residues, which is the primary metal-binding motif in metallothioneins (cysteines coordinate metal ions via thiol groups in Cys-X-Cys and Cys-X-X-Cys cluster arrangements). The protein begins with Met-Glu-Lys (MEK), suggesting a potential signal for intracellular localisation, and ends with CATA at the C-terminus. The high cysteine-to-length ratio (~22.4%) is consistent with functional Class III metallothioneins known to chelate divalent heavy metal cations. This is the exact sequence entered into all downstream computational tools.
3.3 BLASTP Clustered NR Analysis
Tool: NCBI BLASTp against Clustered NR Query ID: WP_070466881.1 RID: WRTAWCZJ014
Explanation: BLASTp returned 17 sequence clusters producing significant alignments. The top cluster was the query itself (1 member, 1 organism; 100% identity, 100% query coverage, E = 4e-25), confirming the sequence is a genuine metallothionein. The second cluster contained 4 members from 4 organisms (Peribacillus frigoritolerans) at 83.67% identity (E = 3e-20), and the third had 6 members from 5 organisms within Bacilli at 83.67% identity (E = 3e-19). The progressive identity drop across clusters indicates the query occupies a distinct but well-conserved position within the Bacillus-group MT clade. No eukaryotic hits were returned, supporting host-specific expression in B. subtilis. The clustered NR approach reduces redundancy in results, so these 17 clusters represent the full diversity of homologs across the non-redundant NCBI protein database.
Explanation: PHI-BLAST was used to identify metallothionein sequences sharing the conserved cysteine-containing pattern (starting at residue position 9 of the query). 25 sequences were returned with E-values better than the defined threshold in PSI-BLAST iteration 1. Key significant hits included:
The hit from Exiguobacterium sp. MER 193 (accession MCM3280515.1) is scientifically interesting — Exiguobacterium is a genus known to colonise extreme environments including mine drainage, suggesting this MT homolog may have evolved under high metal-stress conditions analogous to Copperbelt contamination. This cross-genus conservation also confirms the query protein is part of a functionally conserved metal-binding superfamily, strengthening the case for its use in the bioremediation construct.
Explanation: The Benchling biochemical property analysis of the 49-amino acid metallothionein sequence returned the following values:
Property
Value
Interpretation
Position
1–49
Full-length sequence confirmed
Molecular weight
5366.97 Da
Consistent with small metal-binding proteins (~5–7 kDa)
Isoelectric point (pI)
4.49
Acidic protein; net negative charge at physiological pH
Extinction coeff. (Cys reduced)
1490.00 M⁻¹cm⁻¹
Low UV absorbance — no tryptophan present
Abs 0.1% (1 g/L), reduced
0.278
Used for concentration estimation by spectrophotometry
Extinction coeff. (Cys oxidised)
2115.00 M⁻¹cm⁻¹
Higher due to disulfide bonds
Abs 0.1% (1 g/L), oxidised
0.395
—
Instability index
46.91 (UNSTABLE)
Predicted unstable in vitro; typical for cysteine-rich MTs
The low pI (4.49) means the protein carries a net negative charge at the cytoplasmic pH of B. subtilis (~7.4–7.8), which may facilitate electrostatic attraction to positively charged metal cations (Cu²⁺, Co²⁺, Pb²⁺, Zn²⁺). The instability index of 46.91 classifies the protein as “unstable” by the ProtParam scale (threshold = 40), which is expected for metallothioneins — their flexible, unstructured regions are a functional feature that allows conformational change upon metal binding, not a defect. The lack of tryptophan (reflected in the low extinction coefficient) means protein quantification will require BCA assay rather than A₂₈₀ absorbance.
Explanation: AlphaFold3 predicted the tertiary structure of WP_070466881.1 with the following confidence scores:
ipTM = 0.85 — Interface predicted TM-score. Values above 0.8 indicate high confidence in inter-chain interface geometry (relevant if the protein forms multimers or interacts with metal cofactors). This is a strong score.
pTM = 0.74 — Predicted TM-score for the overall monomer fold. Values between 0.7–0.9 are classified as “confident” by AlphaFold metrics. This confirms the predicted structure is reliable for downstream analysis.
The PAE (Predicted Aligned Error) matrix (right panel) shows predominantly green (low error, high confidence) across almost all residue pairs, with slightly higher uncertainty at the C-terminus (residues ~45–49). The predominantly blue colouring in the 3D structure indicates very high per-residue pLDDT confidence (>90), with a cyan/teal disordered region at the N-terminal loop and a yellow unstructured tail — consistent with the known topology of bacterial metallothioneins that have a structured metal-binding core and flexible termini.
3.7 3D Structure Visualisation
Tool: PyMOL / Benchling 3D Structure Viewer
Explanation: The exported 3D structure of the predicted metallothionein confirms a mixed alpha-helix / beta-sheet topology. The blue colouring (high pLDDT confidence) dominates the core fold, with a beta-sheet scaffold visible in the lower half of the structure and an alpha-helix at the top left. The yellow tail at the top represents a low-confidence disordered segment, consistent with the flexible C-terminus noted in the AlphaFold PAE matrix. The cyan unstructured loop is predicted to contain multiple cysteine residues involved in metal coordination. This structure will be used for PyMOL binding pocket quantification (next computational step) to estimate the number of accessible metal-binding sites and their geometric arrangement.
Explanation: The Benchling assembly shows the full circular plasmid map of the MT-pHT01 expression construct (~8031 bp total). Key features visible in the plasmid map include:
PcopZA Promoter — the copper-sensing promoter driving MT expression (labelled as START, PcopZA_Promoter)
RBS_Bsubtilis — B. subtilis-optimised ribosome binding site for efficient translation initiation
MT_BACILLUS_DNA_SEQUENCE — the codon-optimised metallothionein gene (FWD and REV primers confirmed)
His6_tag, STOP, Terminator_B0015 — C-terminal hexahistidine tag for Ni-NTA purification; double terminator for transcriptional stop
CmR (cat) — Chloramphenicol resistance cassette for selection in B. subtilis
AmpR (bla) — Ampicillin resistance for selection in E. coli (dual-resistance backbone)
ori (B. subtilis pC194) — B. subtilis origin of replication
MCS — Multiple Cloning Site available for future inserts (e.g., kill switch elements)
The construct is designed for shuttle vector functionality — it can replicate in both E. coli (for initial cloning/amplification) and B. subtilis (for expression). The His6-tag will facilitate affinity purification during protein characterisation assays.
Explanation: To verify that the pHT01 backbone sequence retrieved from Benchling/GenBank is authentic, a BLASTn search was performed against the core nucleotide database. The top hit (CP148130.1) — “Mutant Bacillus subtilis isolate FELIX_MS620 plasmid pHT01_cbiA, complete sequence” — returned:
Max Score: 9500 | Total Score: 14668
Query Coverage: 100%
E-value: 0.0
Percent Identity: 99.98%
Accession Length: 8824 bp
This confirms that the pHT01 backbone used in the Benchling assembly is a near-perfect match to the published pHT01 plasmid sequence in GenBank, validating its use as the expression chassis for B. subtilis. The second hit (AY102630.1) is the RepA replication initiator gene at 100% identity, further confirming the replication origin is intact and functional.
3.10 Codon Optimization & Twist Order
Tool: Twist Bioscience Gene Synthesis + Codon Optimization Vector chosen: pTwist Amp High Copy Benchling entry: MT_GENE in pTwist Amp High Copy
Codon Optimization: The MT gene sequence was codon-optimised for Bacillus subtilis expression using the Twist Bioscience integrated codon optimization tool, which applies a codon adaptation index (CAI) algorithm calibrated against the B. subtilis 168 reference genome codon usage table. Rare codons in the native Bacillus cereus sequence were replaced with high-frequency B. subtilis synonymous codons to maximise translational efficiency and reduce ribosome stalling — particularly important for a cysteine-rich sequence (11 Cys residues), since cysteine is one of the rarest amino acids in the B. subtilis proteome.
Why pTwist Amp High Copy was chosen:
Feature
Rationale
Twist-native vector
Pre-integrated with the synthesis order; no separate vector purchase or preparation required
Ampicillin resistance (bla)
Standard antibiotic selection in E. coli DH5α for initial colony screening
High copy number
ColE1-based ori provides high plasmid copy number in E. coli, maximising plasmid yield for downstream subcloning into pHT01
Verified insert delivery
Twist guarantees sequence fidelity of the insert within this vector; reduces risk of synthesis errors
MCS compatibility
Cloning sites flanking the insert are compatible with restriction enzyme subcloning into the pHT01 MCS
Cost efficiency
No additional vector synthesis costs; the gene + vector is delivered as a ready-to-transform construct
The pTwist Amp High Copy construct serves as the initial verified sequence stock. After sequence confirmation in E. coli, the MT gene will be excised and subcloned into the pHT01 backbone for B. subtilis expression, as shown in the Benchling assembly map above.
4. Computational Checklist
Completed
NCBI Protein database search (metallothionein[PROT] AND Bacillus[ORGN])
Selection and justification of WP_070466881.1 as target MT
FASTA sequence retrieval from NCBI RefSeq
BLASTp analysis against Clustered NR (17 clusters identified)
PHI-BLAST analysis — cysteine-pattern conservation confirmed across 25 hits
3D structure export and visualisation (PyMOL / Benchling)
pHT01 backbone sequence retrieval and BLASTN verification
Construct assembly in Benchling (PcopZA – RBS – MT – His6 – T_B0015 in pHT01)
Codon optimization via Twist Bioscience tool (optimised for B. subtilis 168)
Twist Bioscience gene order placed (pTwist Amp High Copy vector)
Pending
PyMOL binding pocket quantification — Calculate pocket volume (ų) and identify Cys residue coordinates; use PyMOL SiteMap or fpocket to characterise metal-coordination geometry
CopA-CueR full circuit finalisation in Cello 2.0 — Complete the NOT gate logic for copper-inducible MT expression; output verified Verilog-to-DNA circuit
MazF/MazE kill switch design — Finalise antitoxin (MazE) promoter logic; simulate toxin:antitoxin ratio for biocontainment
ZAMGEL hydrogel parameter modelling — Define alginate concentration, crosslinker ratio (CaCl₂), and mesh size for metal ion diffusion rate
Promoter strength quantification — Retrieve PcopZA promoter strength data (RPU units) from literature for Cello 2.0 input parameters
Simulate circuit in iBioSim or SimBiology — Model MT expression kinetics under graded Cu²⁺ concentrations
Upload final construct to Benchling for submission — Annotate all features and submit to HTGAA project repository
5. Wet Lab Checklist
Phase 1 — Preparation (upon Twist order arrival)
Resuspend Twist gene product in nuclease-free water per manufacturer instructions
Transform pTwist-MT construct into E. coli DH5α competent cells (heat shock protocol)
Confirm cell death upon antitoxin removal (colony count drop ≥99.9%)
Verify no plasmid leakage to environmental Bacillus strains (co-culture assay)
6. References
Mejáre, M., & Bülow, L. (2001). Metal-binding proteins and peptides in bioremediation and phytoremediation of heavy metals. Trends in Biotechnology, 19(2), 67–73.
Blindauer, C. A. (2011). Bacterial metallothioneins: past, present, and questions for the future. JBIC Journal of Biological Inorganic Chemistry, 16(7), 1011–1024.
Guimaraes, B. G., et al. (2011). Metallothionein structure and metal binding. Metallomics, 3(7), 665–672.
Dutheil, J., et al. (2012). Codon usage and gene expression in Bacillus subtilis. Microbiology, 158(Pt 4), 966–975.
Morikawa, M., et al. (2006). pHT01 shuttle vector for Bacillus subtilis expression. Plasmid, 56(3), 160–168.
This report was compiled as part of the HTGAA (How To Grow Almost Anything) Final Project — MIT Media Lab External Cohort, 2026. All computational work was performed using publicly available tools (NCBI, Benchling, AlphaFold Server, Twist Bioscience) and is documented here for replication and audit purposes.
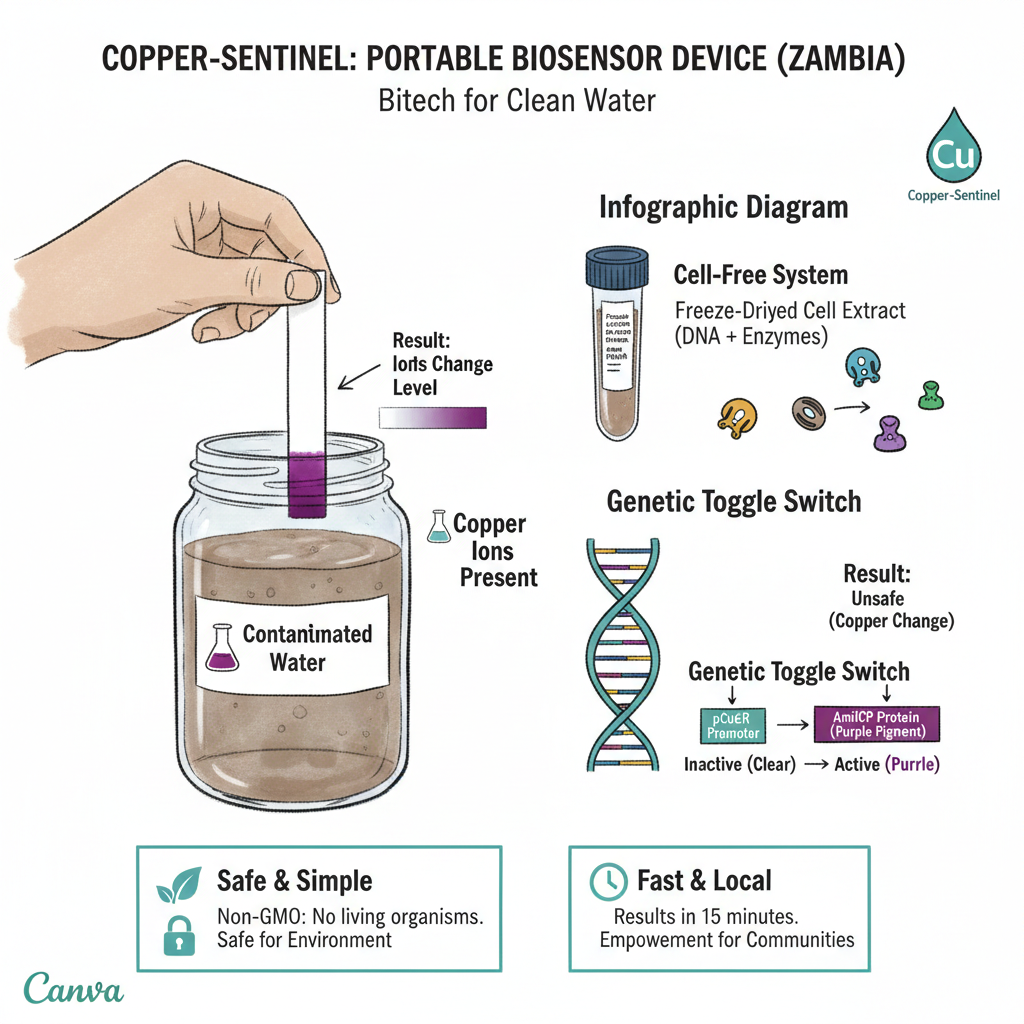
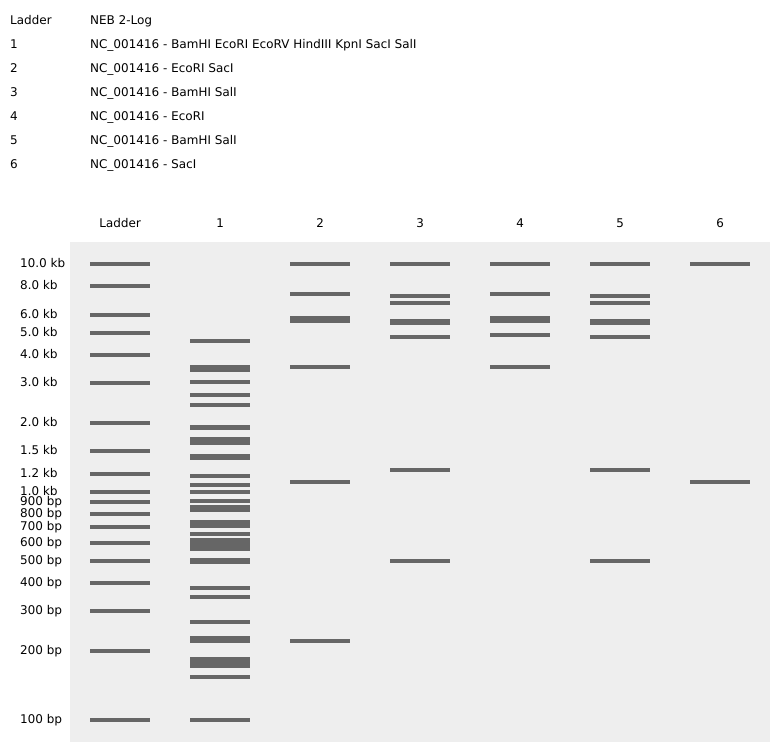


 ---
---


 **
** >
> 
 >
> 
 ** > **
 ** > **
 ** > **