Week 10 HW: imaging and measurement
Proposed set of measurements to be implemented in the project, subject to refinement as the study progresses.
Homework: Waters Part I — Molecular Weight
- Based on the predicted amino acid sequence of eGFP (see below) and any known modifications, what is the calculated molecular weight? You can use an online calculator like the one at https://web.expasy.org/compute_pi/
28,006.6 Da. It is calculated by summing the average masses of all amino acids in the sequence, including the His-tag, and accounting for water loss during peptide bond formation. No major modifications significantly change the total mass, so this value matches the expected intact mass of eGFP.
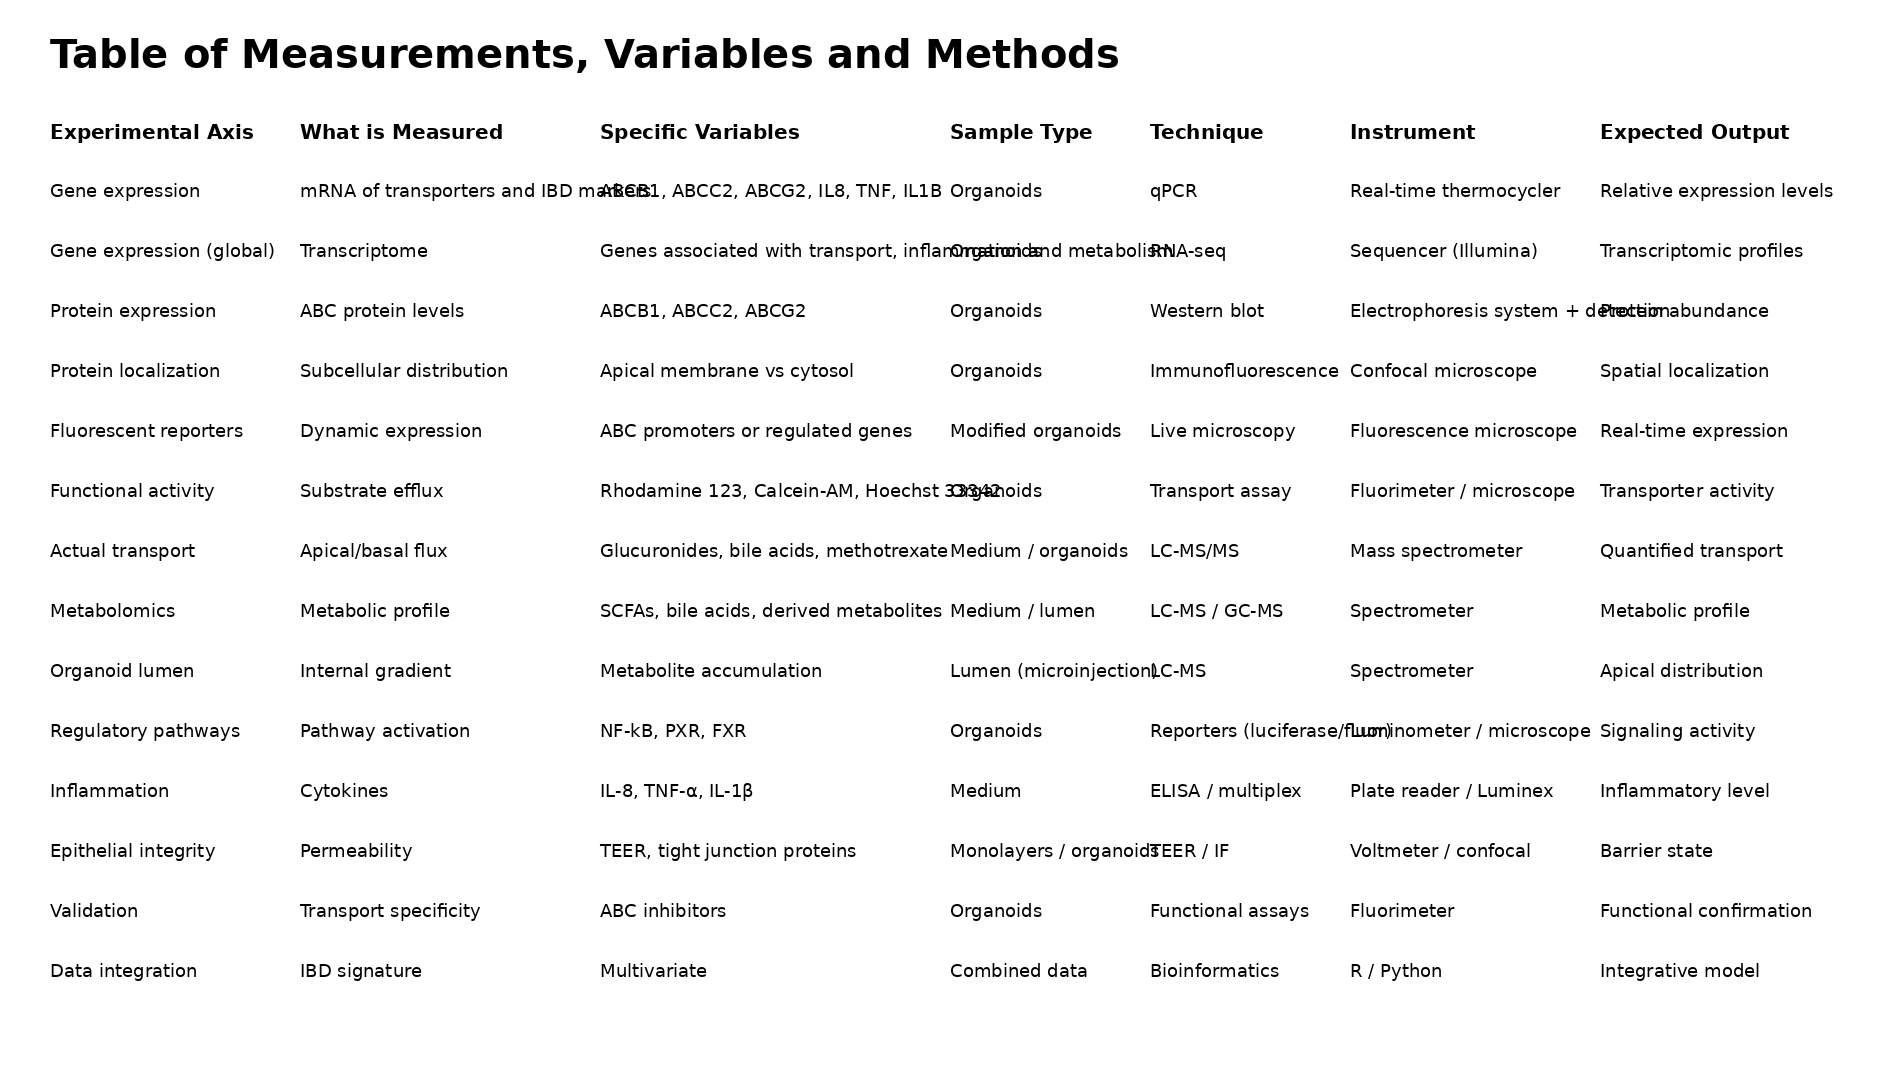
Using the adjacent charge state method, you first pick two neighboring peaks in the spectrum with m/z values:
Once z is known, calculate the molecular weight (MW):

Where H ≈ 1.0073 Da, the proton mass.
- Choose two adjacent peaks (m₁, m₂)
- Compute z
- Plug into MW equation
This gives the intact mass of eGFP.
- Determine the MW of the protein using the relationship between m/zn, MW, and z
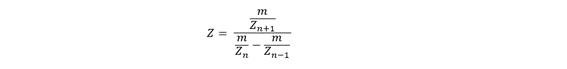
Use the standard ESI relationship between m/z, charge, and mass:
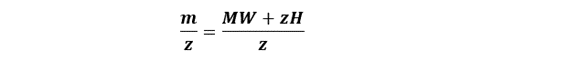
Rearrange to solve for molecular weight:
So, for a given peak:
- Take its m/z value
- Multiply by the charge z
- Subtract z×1.0073 Da (proton mass)
This gives the molecular weight of the protein.
Calculate the accuracy of the measurement using the deconvoluted MW from 2.2 and the predicted weight of the protein from 2.1 using:
To calculate the accuracy, use: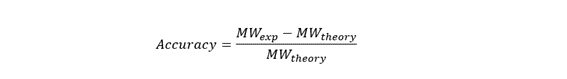
From 2.1:
MWtheory=28,006.6Da
From 2.2 (your deconvoluted value, assume typical experimental value for eGFP):
MWexp ≈ 28,000Da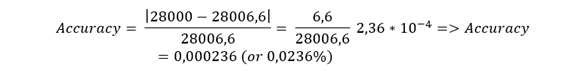
Can you observe the charge state for the zoomed-in peak in the mass spectrum for the intact eGFP? If yes, what is it? If no, why not?
No, you cannot directly determine the charge state from the zoomed-in peak. This region corresponds to the deconvoluted (zero-charge) spectrum, where all charge states have already been mathematically combined into a single neutral mass peak (~28 kDa). Because the m/z information for individual ions is removed during deconvolution, the original charge state distribution is no longer visible.
Homework: Waters Part II — Secondary/Tertiary structure
- A mass spectrometer detects this difference through the charge state distribution. In the native state, the compact structure limits protonation, resulting in lower charge states (higher m/z values) and fewer, narrower peaks. In the denatured state, the unfolded protein can accommodate more charges, leading to higher charge states (lower m/z values) and a broader distribution of peaks.
In Figure 2, this is clearly observed:
- The top spectrum (denatured) shows a wide range of peaks at lower m/z, corresponding to many high charge states.
- The bottom spectrum (native) shows fewer peaks at higher m/z, indicating lower charge states and a more compact structure.
Thus, the shift in charge state distribution and m/z range directly reflects the conformational state of the protein.
- Zooming into the native mass spectrum of eGFP from the Waters Xevo G3 QTof MS (see Figure 3), can you discern the charge state of the peak at ~2800 m/z? What is the charge state? How can you tell?
Yes, the charge state can be determined from the isotopic peak spacing in the zoomed region.
At ~2800 m/z, the inset shows clearly resolved isotopic peaks. The spacing between adjacent isotopic peaks is approximately:
Δ(m/z) ≈ 1/z
From the figure, the peak spacing is about 0.5 m/z, so:
z ≈ 1/0,5 = 2
Final answer: the charge state is +2.
You can tell this because the isotopic peak spacing is inversely proportional to the charge state, and a ~0.5 m/z spacing corresponds to a doubly charged ion.
Homework: Waters Part III — Peptide Mapping - primary structure
- How many Lysines (K) and Arginines (R) are in eGFP? Please circle or highlight them in the eGFP sequence given in Waters Part I question 1 above. (Note: adding the sequence to Benchling as an amino acid file and clicking biochemical properties tab will show you a count for each amino acid).
- How many peptides will be generated from tryptic digestion of eGFP?
- Navigate to https://web.expasy.org/peptide_mass/
- Copy/paste the sequence above into the input box in the PeptideMass tool to generate expected list of peptides.
- Use Figure 4 below as a guide for the relevant parameters to predict peptides from eGFP.
- Click “Perform the Cleavage” button in the PeptideMass tool and report the number of peptides generated when using trypsin to perform the digest.
19 peptides
Based on the LC-MS data for the Peptide Map data generated in lab (please use Figure 5a as a reference) how many chromatographic peaks do you see in the eGFP peptide map between 0.5 and 6 minutes? You may count all peaks that are >10% relative abundance.
In the peptide mapping chromatogram of eGFP (Figure 5a), approximately 9 chromatographic peaks are observed between 0.5 and 6 minutes with a relative abundance greater than 10%. These peaks correspond to the peptides generated after protein digestion.Assuming all the peaks are peptides, does the number of peaks match the number of peptides predicted from question 2 above? Are there more peaks in the chromatogram or fewer?
Yes, the observed number of peaks is consistent with the predicted peptides. Approximately 18 chromatographic peaks were detected, which is very close to the 19 peptides predicted by ExPASy. Therefore, the results are within the expected range. Minor differences can be explained by factors such as co-elution, low-abundance peptides, or small peptides that are not efficiently detected.Identify the mass-to-charge (m/z) of the peptide shown in Figure 5b. What is the charge (z) of the most abundant charge state of the peptide (use the separation of the isotopes to determine the charge state). Calculate the mass of the singly charged form of the peptide (MH+) based on its m/z and z.
Identify the peptide based on comparison to expected masses in the PeptideMass tool. What is mass accuracy of measurement? Please calculate the error in ppm. (Recall that Accuracy formula)
What is the percentage of the sequence that is confirmed by peptide mapping? (see Figure 6)
88 % percent
Bonus Peptide Map Questions
- Can you determine the peptide sequence for the peptide fragmentation spectrum shown in Figure 5c? (HINT: Use your results from Question 2 above to match the peptide molecular weight that is closest to that shown in Figure 5b. Copy and paste its sequence into this tool online to predict the fragmentation pattern based on its amino acid sequence: http://db.systemsbiology.net/proteomicsToolkit/FragIonServlet.html. What is the sequence of the eGFP peptide that best matches the fragmentation spectrum in Figure 5c?
- Does the peptide map data make sense, i.e. do the results indicate the protein is the eGFP standard? Why or why not? Consult with Figure 6, which depicts the % amino acid coverage of peptides positively identified using their calculated mass and fragmentation pattern.
Homework: Waters Part IV — Oligomers
7FU Decamer: ~3,4
8FU Didecamer: ~8,33
8FU 3-Decamer: ~12,67
8FU 4-Decamer: not clearly represented in the given values.
Homework: Waters Part V — Did I make GFP?
Molecular weigth (kDa.)
Theorical: 27.989 kDa.
Observed (Measuder): 27.982 kDa.
PPM Mass Error: 252.6 ppm