Week 12 Lab: Bioproduction
Info
Chapter overview. Three parts: (1) Round 1 Q&A on the six mandatory post-lab questions using an accuracy / confidence rubric with one refinement pass per answer; (2) a reflection introducing the Kirkpatrick model and a lab simulator built to extend Level 2 learning before the wet bench; (3) a placeholder for Round 2 — a re-run of the same six questions after a focused simulator session, used to test whether gamification measurably improves accuracy and calibration.
Lab Context
Lab: Bioproduction of Beta-Carotene and Lycopene System: E. coli transformed with pAC-LYC (lycopene) or pAC-BETA (beta-carotene), grown across a 16-condition matrix (2 plasmids × 4 media × 2 temperatures, in duplicate, plus 2 media-only controls = 34 cultures total). Measurements: OD600 for cell density; peak absorbance at 474 nm (lycopene) and 456 nm (beta-carotene) for pigment quantification.
Part 1 — Round 1: Initial Q&A with Rubric
Each of the six mandatory post-lab questions is answered using a rubric loop: I provide an initial answer, rate my own confidence (1–10), receive an accuracy score (1–10) plus a set of next-step prompts, then revise once and rate confidence again. Final accuracy reflects the revised answer. Refinements are counted but not used in scoring.
Q1. Which genes when transferred into E. coli will induce the production of lycopene and beta-carotene, respectively?
Answer: plasmids pAC-LYC and pAC-BETA
Tip
Next steps to consider:
- The question asks which genes — but plasmids are delivery vehicles, not genes. What’s actually inside each plasmid that does the work?
- The pre-lab reading names three specific genes from one bacterium for lycopene, and one additional gene for beta-carotene. Can you go back and find them by name?
- If pAC-BETA is just pAC-LYC plus one more gene, what does that tell you about how the pathway is built — does the extra gene create the pigment from scratch, or convert one pigment into another?
Q2. Why do the plasmids that are transferred into the E. coli need to contain an antibiotic resistance gene?
Answer: To ensure only plasmids selected with antibiotic resistance to chloramphenicol are transformed.
Tip
Next steps to consider:
- Antibiotics don’t act on plasmids — they act on living things. So what is actually being killed when you add chloramphenicol to a culture, and what survives?
- The protocol says the LB is already supplemented with antibiotic — not just used once at transformation. Why would you need antibiotic pressure to continue throughout a 24-hour growth, not just at the start?
- If a cell loses its plasmid mid-culture, what happens to it? And if many cells lost their plasmids, what would that do to your pigment yield?
Q3. What outcomes might we expect to see when we vary the media, presence of fructose, and temperature conditions of the overnight cultures?
Answer: We may expect to see transcriptional changes in expression of proteins in differing intensity of color of pAC-LYC and pAC-BETA. Higher temperatures faster growth but less time to accumulate pigment. Richer media, also more growth but less pigment. More fructose, better for glucose receptors. I predict pAC-LYC will respond the strongest since it is more compatible with glucose, under wider range of temperature and base media.
Tip
Next steps to consider:
- The fructose papers describe a specific phenomenon involving glucose and gene expression — it’s not about “glucose receptors” but about a regulatory system that suppresses certain genes when glucose is around. What’s that system called, and how does fructose let you escape it?
- Your prediction compares pAC-LYC to pAC-BETA — but the two plasmids share the same backbone, the same promoter, and three of four genes. What would be a more meaningful comparison: which plasmid wins, or which conditions optimize each one?
- The lab divides peak absorbance by OD600 to get pigment-per-cell. Why would the highest-growth condition not necessarily give the most pigment per cell? What does that tell you about how to phrase your prediction?
Q4. Generally describe what “OD600” measures and how it can be interpreted in this experiment.
Answer: OD600 is an optical density measurement of cells suspended in media. This is a calibration step to ensure a baseline. In this experiment, the variables of temperature, fructose, and base media will result in varying levels of cell density. The optical density normalization reading is a good way to determine what has occurred in the experiment.
Tip
Next steps to consider:
- Why is 600 nm specifically chosen as the wavelength? Lycopene absorbs at 474 nm and beta-carotene at 456 nm — what does that suggest about why 600 nm is the right wavelength for measuring cells?
- You used the words “calibration” and “normalization” in the same sentence. They’re actually two different operations in this lab — one happens before the measurement, one happens after. Can you separate them?
- If two cultures have the same OD600 but very different pigment readings at 474 nm, what does that tell you? And what’s the math you’d do to express that difference as a single meaningful number?
Q5. What are other experimental setups where we may be able to use acetone to separate cellular matter from a compound we intend to measure?
Answer: The use of acetone assists in separating cells by dissolving proteins from cells, leaving target cells of interest for further evaluation, such as optical density or pigmentation.
Tip
Next steps to consider:
- Re-read the protocol’s description of what acetone does to the pellet. Does it dissolve the proteins, or precipitate them? And which part — the pellet or the supernatant — do you actually keep for measurement?
- After acetone treatment, are the cells still alive or intact? If not, what does that mean about the phrase “target cells of interest”?
- The question specifically asks for other experimental setups. Think about what carotenoids have in common with chlorophyll, or with other plant pigments — could the same acetone trick work on a leaf? On algae? What’s the underlying property that makes acetone the right solvent?
Q6. Why might we want to engineer E. coli to produce lycopene and beta-carotene pigments when Erwinia herbicola naturally produces them?
Answer: We want to optimize the metabolic load, which allows us to predict and measure pigmentation for large scale bioproduction, using well-characterized systems. We can control the growth rate over wildtype Erwinia herbicola. We can also fine-tune the formulation of E. coli for better regulatory control.
Tip
Next steps to consider:
- You mention “well-characterized systems” — what specifically makes E. coli well-characterized in a way Erwinia herbicola isn’t? Think about the tools you’ve encountered in HTGAA so far (plasmids, promoters, selection markers, codon optimization, CRISPR) — how many of those work out of the box in Erwinia?
- “Regulatory control” can mean two very different things in synthetic biology — gene-level regulation (promoters, induction) and industrial/biosafety regulation (BSL classification, FDA approval). Which one were you describing? Could both apply here?
- This week’s lab transforms E. coli with carotenoid genes — but tomorrow you might want to make zeaxanthin instead, or boost upstream pathway flux. Would it be easier to do that engineering in E. coli or in Erwinia herbicola? Why?
- Tie it back to your own framing: you’ve described BioLight’s Aim 3 as a Kodak/Eastman analogy for democratizing bioproduction. Does Erwinia herbicola fit that vision, or does the chassis question become an infrastructure question?
Round 1 Diagnostic Summary
| Q | Topic | Init Conf | Init Acc | Refs | Final Conf | Final Acc | Δ Acc | LGI % | Calib Gap |
|---|---|---|---|---|---|---|---|---|---|
| 1 | Genes for lycopene/beta-carotene | 8 | 2 | 1 | 5 | 4 | +2 | 25.0 | +1 |
| 2 | Antibiotic resistance gene purpose | 7 | 7 | 1 | 8 | 7 | 0 | 0 | +1 |
| 3 | Media/fructose/temp outcomes | 6 | 3 | 1 | 8 | 6 | +3 | 42.9 | +2 |
| 4 | OD600 meaning & interpretation | 8 | 5 | 1 | 7 | 6 | +1 | 20.0 | +1 |
| 5 | Other acetone-separation setups | 5 | 3 | 1 | 6 | 3 | 0 | 0 | +3 |
| 6 | Why E. coli over Erwinia herbicola | 5 | 3 | 1 | 9 | 6 | +3 | 42.9 | +3 |
Session averages (n = 6):
- Initial accuracy: 3.8 / 10
- Final accuracy: 5.3 / 10
- Δ accuracy: +1.5
- Mean Learning Gain Index (LGI): 21.8%
- Mean final calibration gap: +1.8 (confidence over accuracy)
Scoring methodology:
- Accuracy (1–10): Coach-assigned assessment of factual correctness against the lab protocol and supporting papers.
- Confidence (1–10): Self-reported certainty, asked at both initial answer and after revision. Never coach-assigned.
- Refinements: Counter only — not used in scoring.
- Learning Gain Index (LGI): (Final − Initial) / (10 − Initial) × 100% — measures improvement relative to available headroom.
- Calibration gap: Final Confidence − Final Accuracy. Positive values indicate over-confidence.
Diagnostic plot — Confidence vs Accuracy by question:

Bars: Initial Confidence (blue) and Initial Accuracy (orange). Lines: Final Confidence (dark blue, circles) and Final Accuracy (dark orange, squares).
Pattern read: Confidence (upper trace) consistently sits above accuracy (lower trace) across all 6 questions. The calibration gap widens on Q5 and Q6 — the two questions with the lowest final accuracy — meaning confidence rose as answers got longer, not as they got more correct. Q2 is the only question where initial confidence and accuracy aligned (both 7) and held through revision.
Flagged for Round 2 revision:
- Q1 — Gene names (CrtE, CrtI, CrtB for lycopene; +CrtY for beta-carotene) and source organism (Erwinia herbicola) not yet stated. Easiest fix in the set.
- Q5 — Acetone mechanism inverted (acetone precipitates proteins and dissolves lipophilic pigments, not the other way around); other experimental setups not yet provided.
- Q6 — Concepts present but under-substantiated; tooling advantage and modularity not yet stated.
Part 2 — Reflection: From Q&A to Gamification
Framing through the Kirkpatrick Model
The Kirkpatrick Four-Level Training Evaluation Model (Kirkpatrick & Kirkpatrick, 2016) provides a useful framing for thinking about how this lab’s pre-work, Q&A, and hands-on activity fit together:
- Level 1 — Reaction: the learner’s initial engagement with material — interest, perceived relevance, willingness to continue. Reading the lab protocol and pre-work falls here.
- Level 2 — Learning: the actual acquisition of knowledge, skills, attitudes, and confidence. Answering post-lab questions and reasoning about the experimental design lives here.
- Level 3 — Behavior: application of learning when the learner is back in their own work environment. For HTGAA, this is the wet lab session itself, and later projects that draw on the same techniques.
- Level 4 — Results: the downstream outcomes attributable to the training — research output, contribution to a discipline, capability built into a community.
Reading the prework and studying the experimental data are well-aligned with Level 1 and the early portion of Level 2. They are necessary, but on their own they don’t fully exercise the reasoning under variability that Level 2 ultimately demands — the ability to predict what happens when multiple conditions change at once, observe the result, and update.
In synthetic biology, the traditional path to deeper Level 2 (and on toward Level 3) is hands-on lab activity. There is no substitute for the formal in-person procedures of pipetting, plating, incubating, and measuring — the embodied feedback loop of doing the experiment is what converts conceptual knowledge into operational fluency.
Citation: Kirkpatrick, J. D., & Kirkpatrick, W. K. (2016). Kirkpatrick’s Four Levels of Training Evaluation. ATD Press.
The Hypothesis
Hypothesis: A lightweight virtual lab simulator — with sliders for the same variables this lab manipulates (plasmid choice, base media, fructose, temperature, incubation time) and near-real-time visual feedback — can extend Kirkpatrick Level 2 learning before the wet lab session, by allowing me to make and test predictions repeatedly with inherent variability.
The simulator will not replace the wet lab. It will scaffold it — letting me arrive at the bench with stronger intuition about which conditions optimize which outcomes, and why.
Why Gamification
Three design principles drive the simulator:
Inherent variability. Each “run” injects ±8% Gaussian noise into the result, mirroring real biological variation. Repeated runs of identical conditions don’t give identical answers — which forces me to think statistically rather than deterministically.
Prediction-first feedback loop. Before each run, I commit to a prediction (which condition wins on pigment-per-cell). The simulator scores my prediction against the simulated outcome. Score, streak, and best-result trackers turn the experiment matrix into a game with measurable improvement over time.
Visual saturation feedback. Two cuvettes render side-by-side, with color saturation scaling to pigment-per-cell. The visual channel adds a memory anchor that pure-numeric feedback doesn’t.
The Underlying Model
The simulator uses a transparent kinetic model — not real biology, but biologically plausible:
- Growth rate scales with media richness (2YT > LB) and peaks at 37°C, falling off at extremes
- Pigment-per-cell follows the metabolic-competition tradeoff: high growth → lower per-cell yield
- Fructose boosts pigment expression by ~25% (escape from catabolite repression)
- Temperature above 32°C penalizes recombinant enzyme function
- pAC-LYC carries less metabolic burden than pAC-BETA (3 enzymes vs 4)
- Theoretical optimum: 2YT + fructose at 30°C — but noise can shift any single run
The Simulator

Six controls, two cuvettes, three readouts (OD600, peak absorbance, pigment-per-cell), live game state with score / streak / best-run tracking, and a run log. All in-memory — no persistence yet, by design, so each session is a fresh experiment.
Tooltip Reference
Every interactive control and result readout in the simulator has a hover tooltip with context. The full reference is below for offline study.
Left panel — Controls
| # | Element | Tooltip content |
|---|---|---|
| 1 | Plasmid label | Which gene cassette is in the E. coli. pAC-LYC carries CrtE, CrtI, CrtB (3 enzymes → lycopene). pAC-BETA adds CrtY (4 enzymes → beta-carotene). Source: Erwinia herbicola. |
| 2 | pAC-LYC button | 3-enzyme pathway. Less metabolic burden. Produces red lycopene (peak absorbance 474 nm). |
| 3 | pAC-BETA button | 4-enzyme pathway. CrtY converts lycopene → beta-carotene (peak absorbance 456 nm). Slightly more burden. |
| 4 | Base media label | Growth medium. Richer media supports more biomass but can dilute pigment per cell. Both options are supplemented with chloramphenicol to maintain plasmid selection. |
| 5 | LB button | Luria Broth — standard E. coli medium. Lower nutrient density than 2YT. May give lower OD600 but comparable per-cell pigment yield. |
| 6 | 2YT button | 2× Yeast Tryptone — richer than LB. Drives higher cell density (OD600). Watch the per-cell pigment math: more cells does not mean more efficient. |
| 7 | Fructose supplement | Adds fructose as the primary carbon source. Fructose escapes the catabolite repression that glucose triggers via the cAMP/CRP system, allowing stronger expression of plasmid-borne genes. Boosts pigment-per-cell ~25% in this model. |
| 8 | Temperature label | Incubation temperature. 37°C is optimal for E. coli growth (highest OD600). Lower temperatures (~30°C) slow growth but typically improve recombinant enzyme folding and per-cell pigment accumulation. Above ~32°C, recombinant enzymes lose efficiency. |
| 9 | Incubation time label | Hours of culture growth. The lab protocol specifies 24h. Shorter times underdevelop both biomass and pigment; longer times saturate the OD600 plateau. Pigment-per-cell continues to accumulate longer than cell density. |
| 10 | “This run wins” button | Predict that the plasmid you currently have selected will produce more pigment-per-cell at these conditions than the opposite plasmid would. |
| 11 | “Opposite plasmid wins” button | Predict that the OTHER plasmid (the one not currently selected) would outperform the current selection at these same conditions. |
| 12 | Run culture button | Simulates a 24h culture at the current settings and computes OD600, peak absorbance, and pigment-per-cell. ±8% Gaussian noise per run mimics biological variability. Scores your prediction. |
| 13 | Reset score button | Clears score, streak, best-run tracker, and run log. Conditions stay where you set them. |
Right panel — Output
| # | Element | Tooltip content |
|---|---|---|
| 14 | Your run cuvette | Acetone-extracted pigment from the plasmid you selected. Color saturation = pigment-per-cell. Lycopene appears red-orange at peak 474 nm; beta-carotene appears yellow-orange at peak 456 nm. |
| 15 | Opposite plasmid cuvette | Same conditions, but with the OPPOSITE plasmid. Shown for comparison so you can see whether your prediction was correct. |
| 16 | OD600 readout | Optical density at 600 nm. Cells scatter 600 nm light proportional to their concentration — this is a cell-count proxy. 600 nm is chosen specifically because it sits OUTSIDE the pigment absorption peaks (474 nm lycopene, 456 nm beta-carotene), so the reading reflects density only, not pigment. |
| 17 | A474 / A456 readout | Peak absorbance at the pigment’s characteristic wavelength: 474 nm for lycopene, 456 nm for beta-carotene. Measured on the acetone-extracted supernatant. Reflects total pigment in the cuvette — both number of cells AND pigment per cell. |
| 18 | Pigment/cell readout | Peak absorbance divided by OD600. The most meaningful metric: pigment produced PER cell. A high-OD600 culture can have low pigment/cell if the cells are growing fast but expressing the pathway poorly. This is what the lab actually optimizes. |
| 19 | Score row | Correct predictions / total runs. Increments by 1 each time your prediction (this run wins / opposite plasmid wins) matches the simulated outcome. |
| 20 | Best pigment/cell row | Highest pigment-per-cell value seen so far in this session. Lets you track whether you are converging toward optimal conditions across runs. |
| 21 | Streak row | Consecutive correct predictions. Resets to 0 when you guess wrong. A high streak suggests you have built reliable intuition for this region of the parameter space. |
| 22 | Export Report button | Download a self-contained HTML report with a data table of all runs and a chart of pigment-per-cell over time. Opens in any browser, no internet required. Disabled until at least one run has been logged. |
| 23 | Export CSV button | Download all run data as CSV for spreadsheet or Python analysis. Includes plasmid, conditions, OD600, A474/A456, pigment-per-cell for both your run and the opposite plasmid, and prediction outcome. Disabled until at least one run has been logged. |
| 24 | Sort toggle | Switch between newest-first chronological order and ranked-by-pigment order. Ranked mode adds gold/silver/bronze badges to the top three runs. |
| 25 | Run log | Click any entry to restore the spectrophotometer view to that run’s conditions and results. Green = correct prediction, red = wrong. |
Gameplay Loop
- Set conditions with the sliders/segments
- Predict whether the current plasmid or its opposite wins on pigment-per-cell
- Click Run culture — watch the cuvettes saturate
- Score increments if the prediction matched the simulated winner
- Adjust one variable at a time to build intuition; chase a streak
Sample Session Snapshot
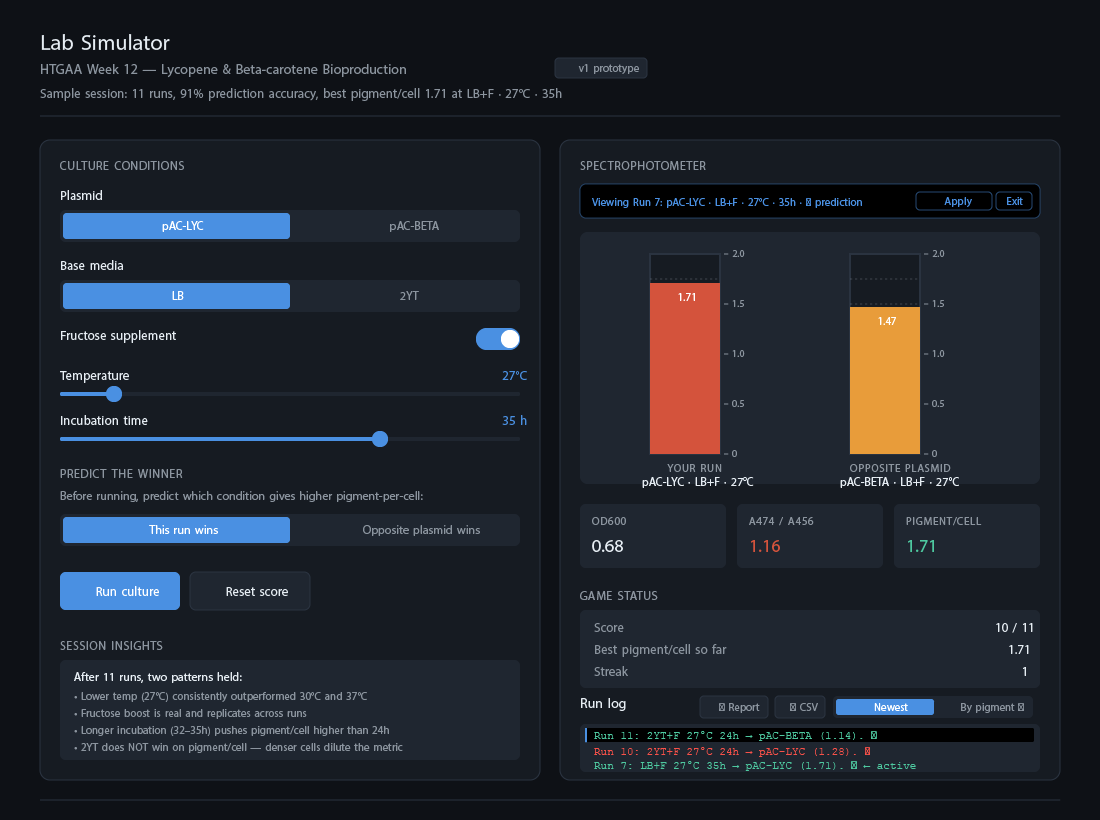
This is a snapshot of the simulator after an 11-run session. Several things worth noting in this view:
- Score: 10/11 (91% prediction accuracy). The blue restore banner indicates I’m currently viewing Run 7, not running fresh — clicking any past run in the log restores the spectrophotometer to that snapshot.
- Best pigment/cell: 1.71 at pAC-LYC · LB + Fructose · 27°C · 35h. The cuvette colors and fill heights confirm this run’s pigment-per-cell beat the opposite plasmid (1.47).
- The session insights panel on the left captures four patterns that emerged across the run history — including one that contradicted my Round 1 Q3 prediction. I had predicted 2YT + fructose at 30°C as the winner, but in actual play, LB + fructose at 27°C with 35h incubation outperformed every 2YT condition I tried. The richer media drove higher OD600 but diluted pigment-per-cell — exactly the metabolic-competition tradeoff the lab is designed to expose.
- The run log shows three of the most recent entries with green/red coding for correct/wrong predictions. The full 11-run history can be exported as a self-contained HTML report or as CSV for spreadsheet analysis.
This is the kind of insight the simulator generates that pure prework reading does not. The hypothesis going into Round 2 is that this hands-on optimization experience will measurably improve my answer accuracy and confidence calibration on the same six questions.
What Round 2 Will Test
After spending time with the simulator, I’ll re-run the same six post-lab questions in Section 3 below under the identical rubric (initial confidence → coach accuracy → next-step prompts → revised confidence → final accuracy → calibration gap). The expected signals:
- Higher initial accuracy on Q3 (variable interactions are now hands-on)
- Better calibration on Q5–Q6 (I’ll have made enough wrong predictions to know what I don’t know)
- Improved Learning Gain Index (LGI) vs. Round 1’s 21.8%
If the simulator doesn’t improve those metrics, the hypothesis fails — and the Reflection itself becomes a Level 1 artifact rather than a bridge to Level 2.
Part 3 — Round 2: Post-Gamification Q&A
Info
Pending. This section will be populated after a focused session with the Lab Simulator v1. The same six mandatory post-lab questions will be re-answered using the rubric process, and a comparison table will plot Round 1 vs. Round 2 confidence and accuracy side-by-side to test the gamification hypothesis.