Thank you for visiting the Final Project landing page for BioLight X5 & Photoplasm Click on the menu items to the left to view each section of the Final Project documentation.
Here are the presentation slides, for a high-level overview:
Click here to view the Abstract (and all Chapters on the menu)
HTGAA Group Project: MS2 Bacteriophage L Protein Engineering Date: March 31, 2026
Authored & Reviewed by:
2026a-john-adeyemo-adedeji 2026a-eric-schneider 2026a-albert-manrique 2026a-Tehseen Rubbab 2026a-brie-taylor Introduction This document represents the full scope of our Group Project activity within our Genspace Node.
“Group 2” was formed for the purpose of addressing Bacteriophage Final Project Goals for engineering the L Protein.
Subsections of Projects
Individual Final Project
Thank you for visiting the Final Project landing page for BioLight X5 & PhotoplasmClick on the menu items to the left to view each section of the Final Project documentation.
Here are the presentation slides, for a high-level overview:
Click here to view the Abstract (and all Chapters on the menu)
Subsections of Individual Final Project
Section One - Abstract
HTGAA 2026 Final Project Documentation
Eric Schneider · BioArt Studio, Makerspace Charlotte · Genspace NYC node
Section 1 — Abstract
Provide a concise, self-contained summary of your project (minimum 150 words). The abstract should allow a reader to understand the purpose, approach, and expected outcomes without referring to other sections.
Your abstract should briefly address the following elements:
Significance: What problem or question does the project address, and why is it important?
Broad Objective: What is the overall goal of the project?
Hypothesis: What prediction or principle is the project testing or demonstrating?
Specific Aims: What key steps or milestones will be completed to achieve the objective?
Methods: What experimental or technical approaches will be used?
1 — Significance
What problem or question does the project address, and why is it important?
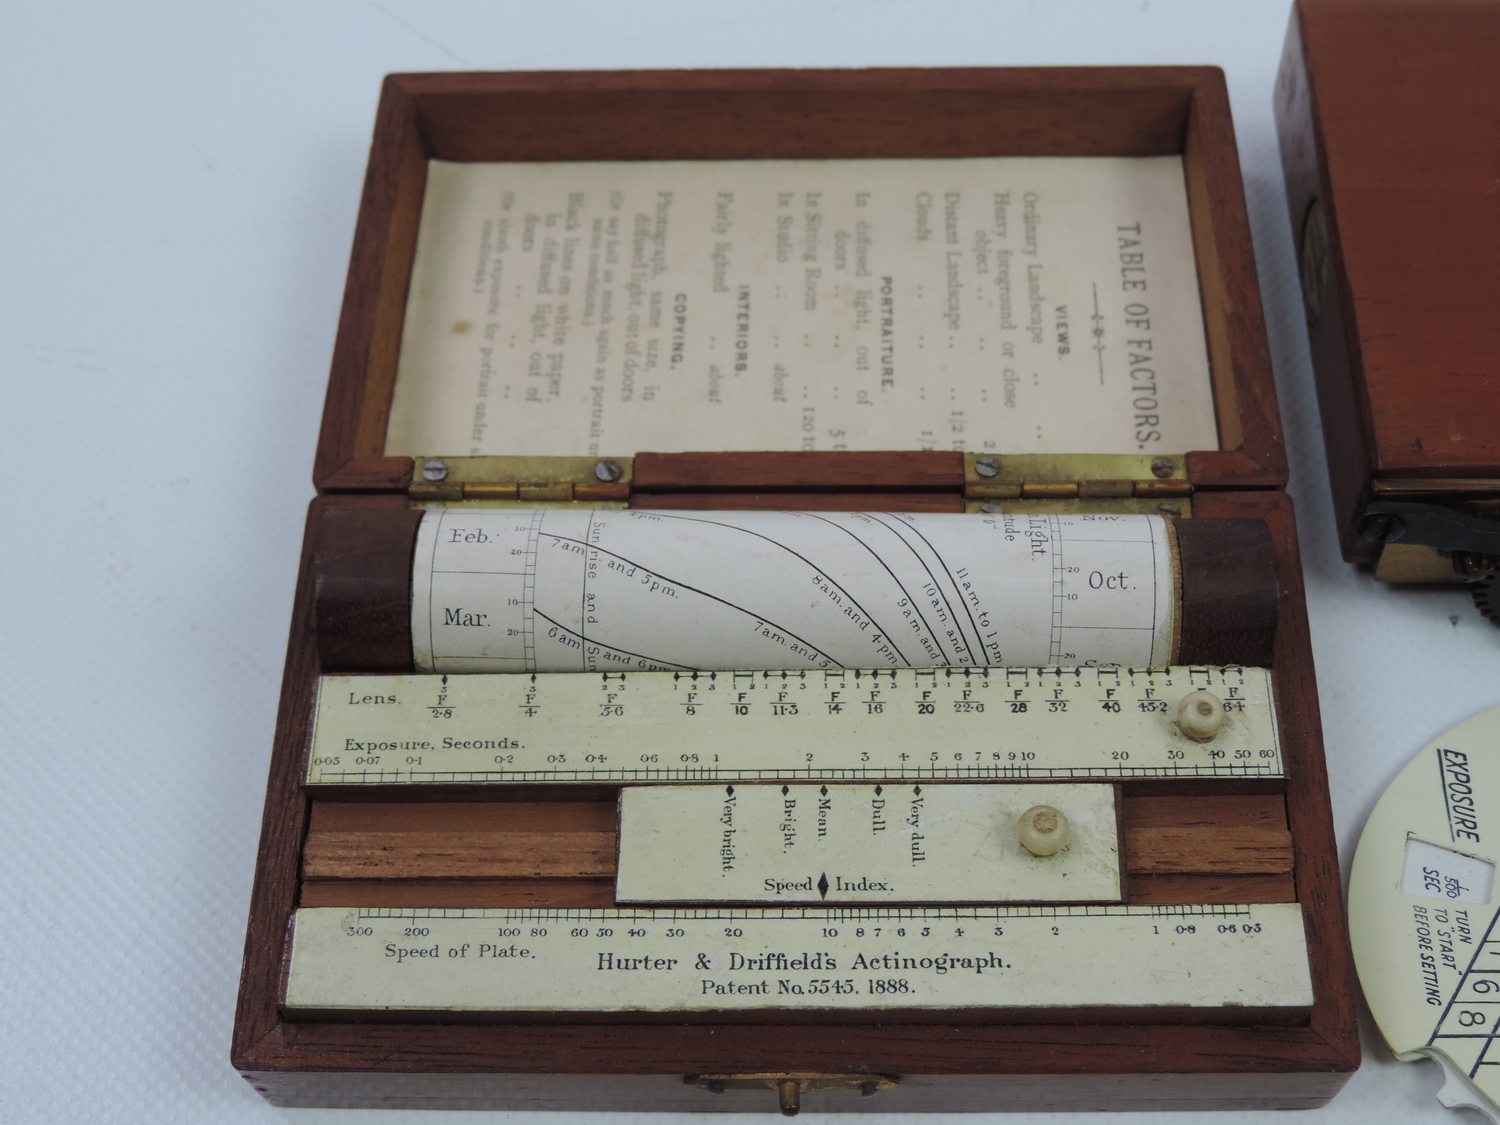
The history of imaging offers a precise precedent for what synthetic biology must now accomplish. When Ferdinand Hurter and Vero Charles Driffield published their foundational sensitometry work in 1890, they did not merely characterize the photographic emulsion — they transformed an artisanal practice into a reproducible, industrially scalable system by rigorously quantifying the relationship between light exposure and material response. Their H&D curve made photography accessible at mass scale by encoding complexity into a predictable, designed workflow. BioLight proposes an analogous translation: applying the logic of exposure science to living cells, using controlled light as the variable input and protein expression as the measurable output — not in isolation from the research community, but in direct collaboration with it, extending and accelerating the outreach of institutional synthetic biology into the hands of designers, makers, and educators who are ready to engage.
Photograph of Hurter & Driffield “Actinograph,” a photographic exposure calculator using a logarithmic curve to predict light levels.
2 — Broad Objective, Hypothesis, and Aim 1
What is the overall goal of the project? What prediction or principle is the project testing or demonstrating?
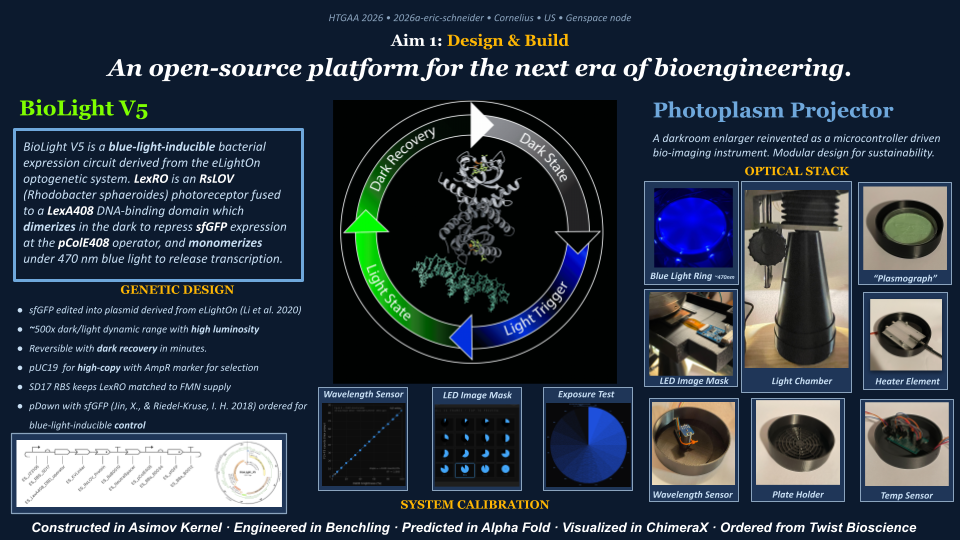
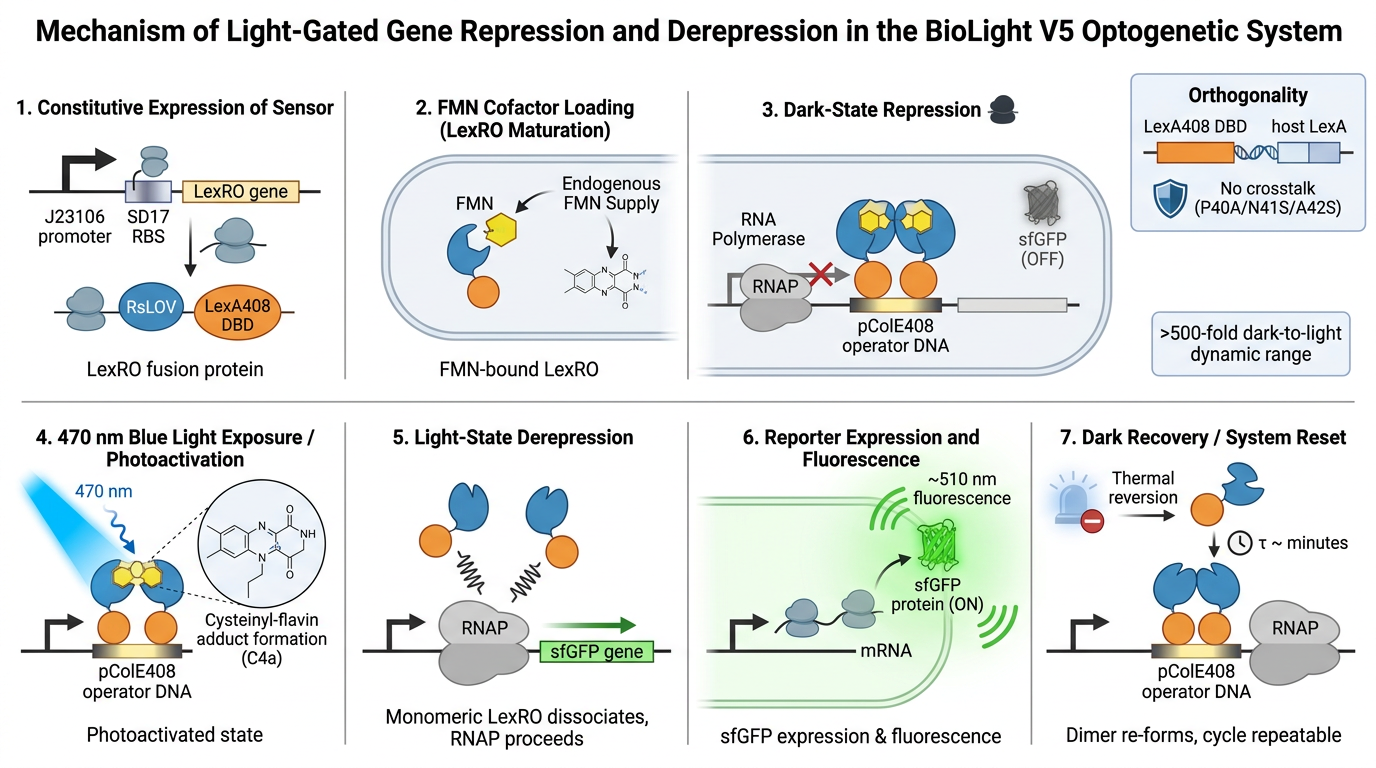
The primary objective of BioLight is to engineer and validate a light-activated gene expression system in E. coli, and to develop Photoplasm — a purpose-designed labware device that delivers high-resolution, spatially controlled analog light exposure directly onto living cell cultures. The project tests the hypothesis that a research-grade optogenetic system can be reframed as an imaging instrument with measurable sensitometric properties — that bacterial cultures, like photographic emulsion, can be characterized by a dose-response curve relating light exposure to expressed signal, and that this characterization makes spatially patterned biological imaging reproducible at community scale. Aim 1 establishes the biological and hardware foundations through two parallel tracks. The experimental track employs BioLightV5, a derivative of the eLightOn optogenetic system¹ in which the RsLOV photoreceptor is fused to a LexA408 DNA-binding domain to drive sfGFP expression from the pColE408 promoter under 470 nm illumination. BioLightV5 is designed in Benchling and submitted for synthesis via Twist Biosciences. The control track uses pDawn-sfGFP (Addgene #107741), a well-characterized blue-light-repressible system, as a validated comparator for expression behavior under identical illumination conditions.
Illustration generated via FigureLabs: BioLight V5 - a blue-light activated sensor, based on eLightOn (Li, et al 2020)
3 — Methods / Photoplasm Device
What experimental or technical approaches will be used?
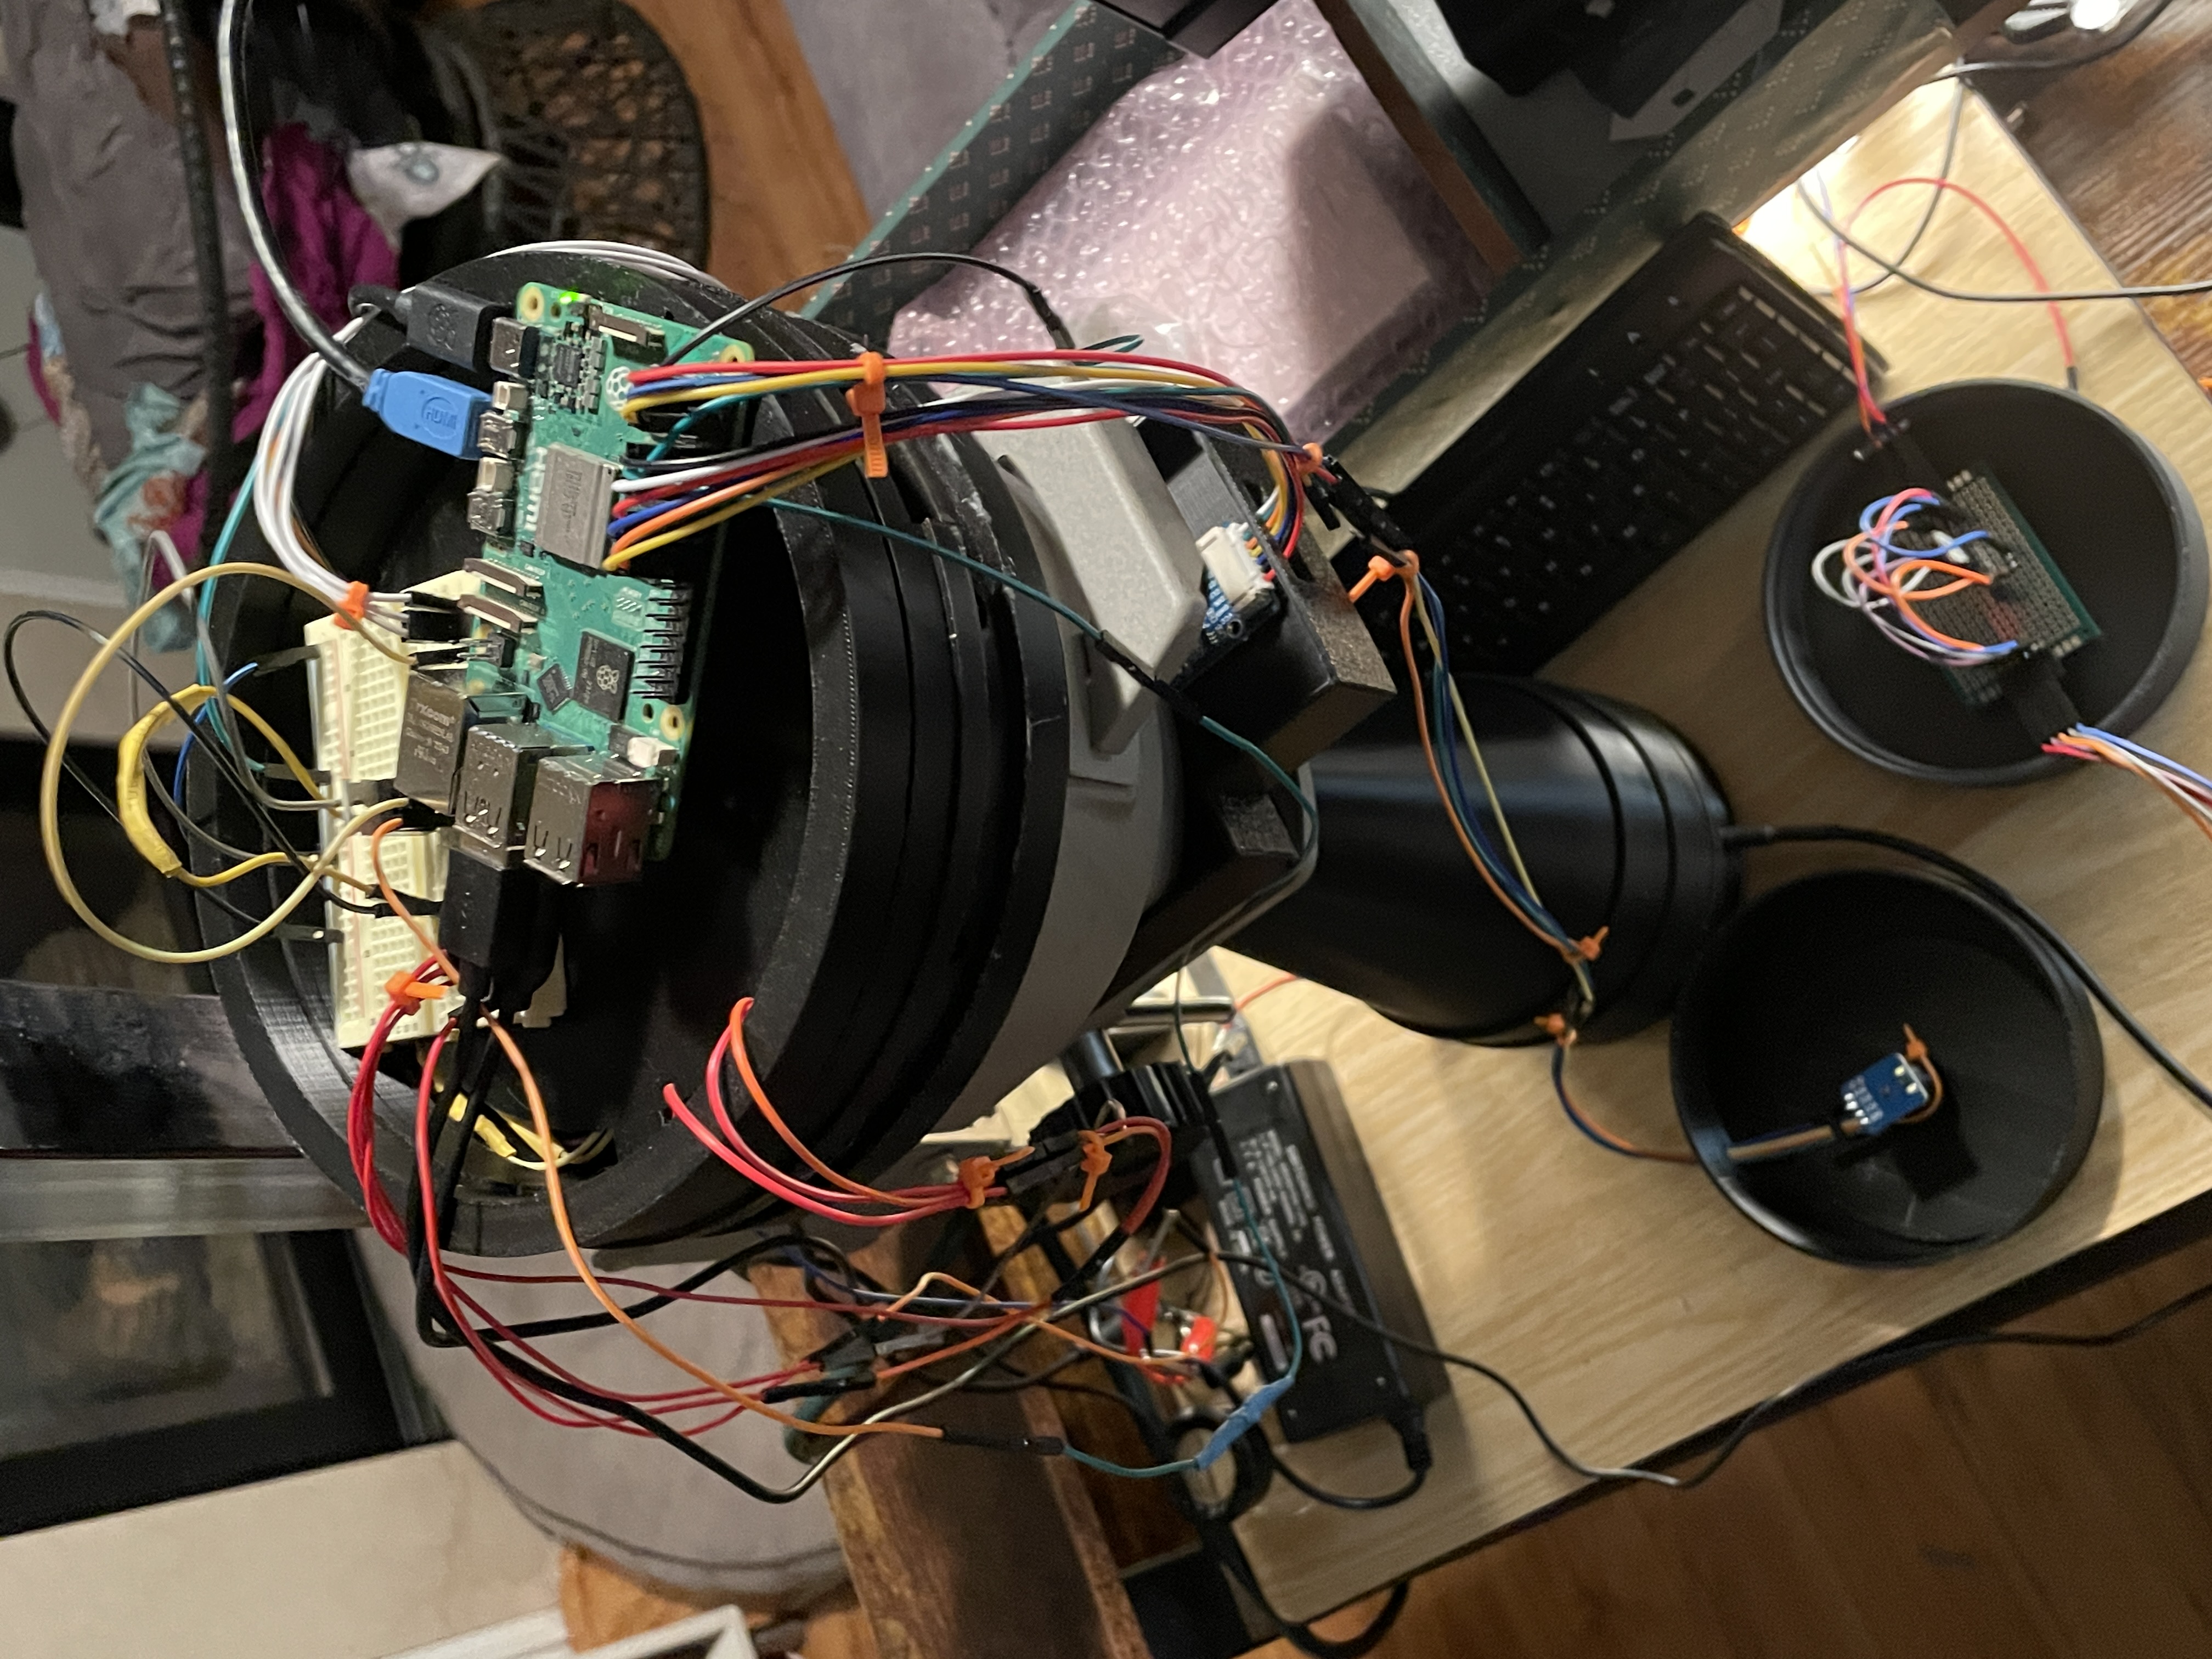
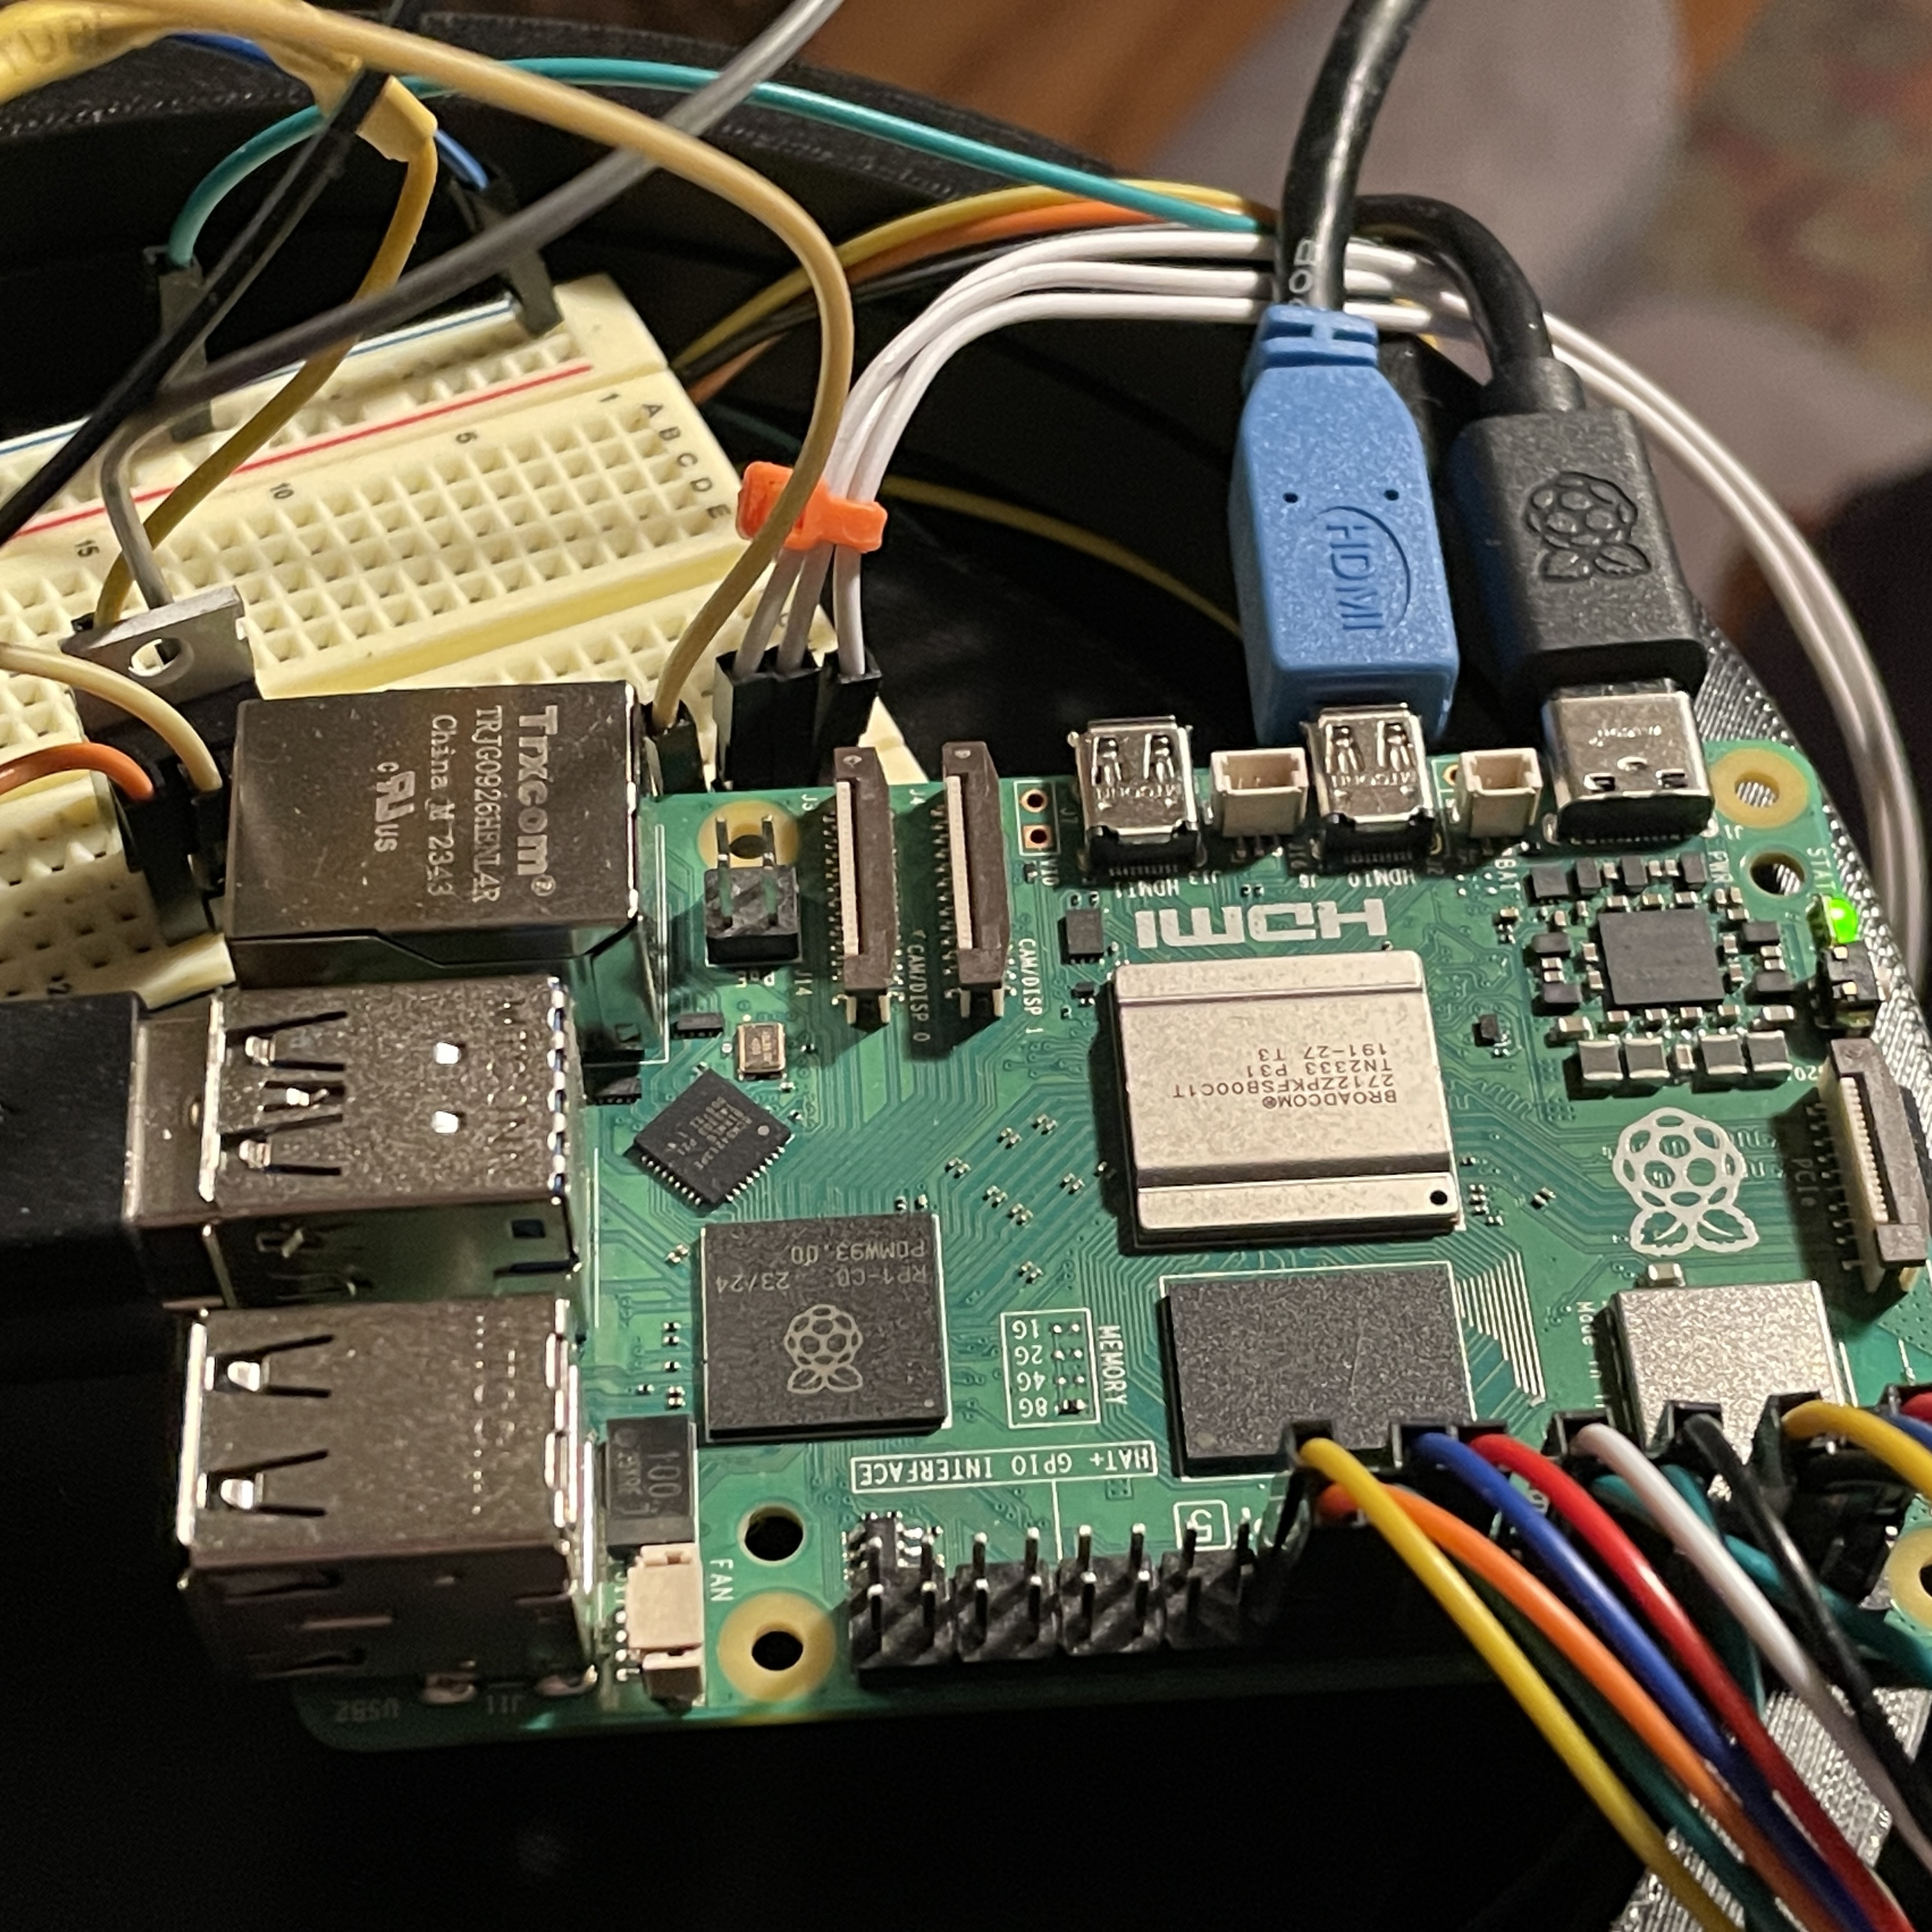
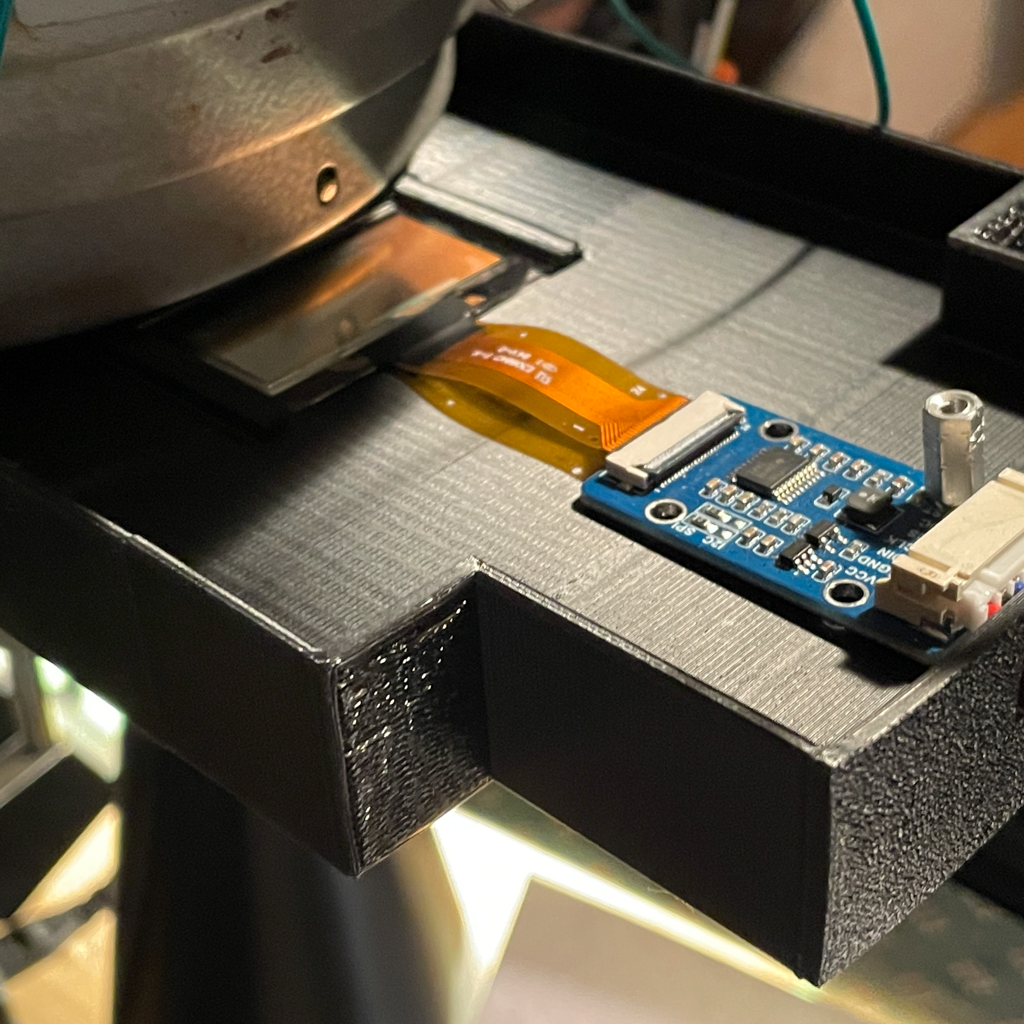
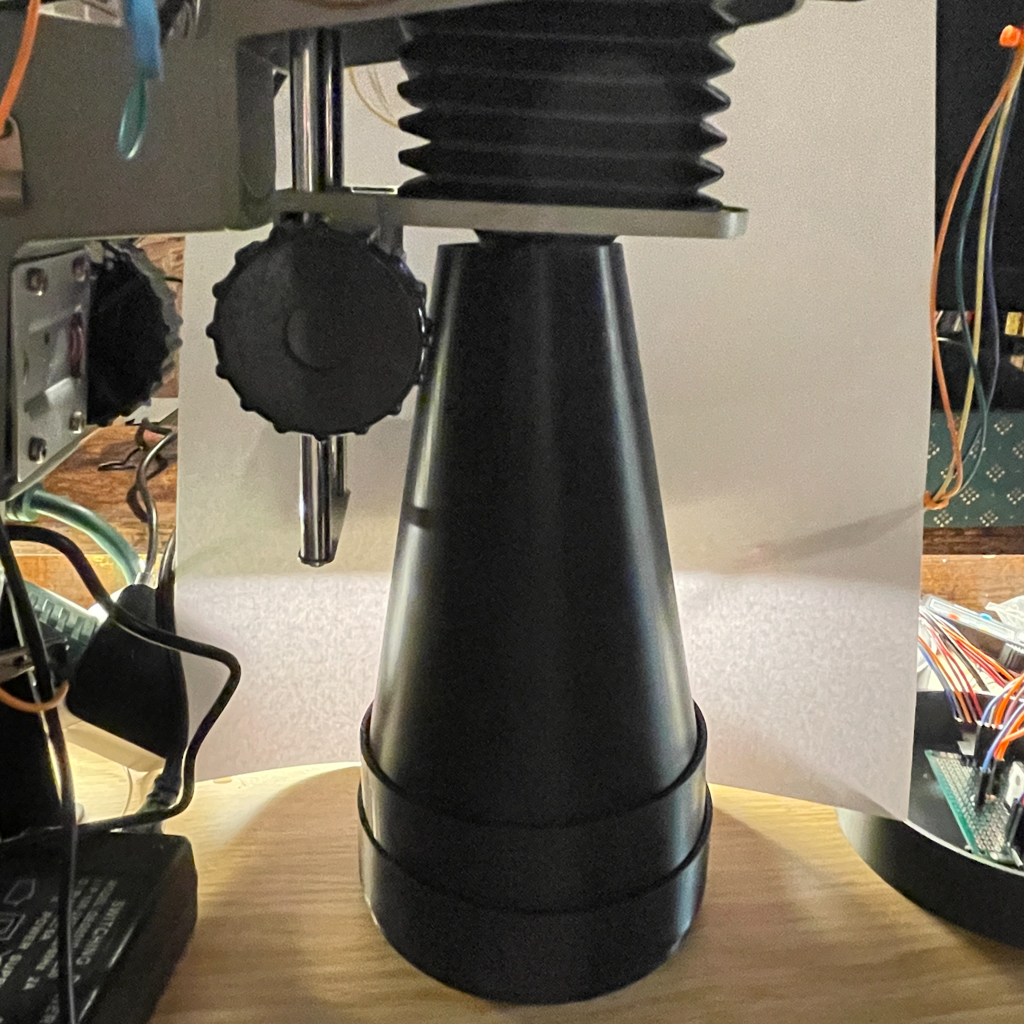
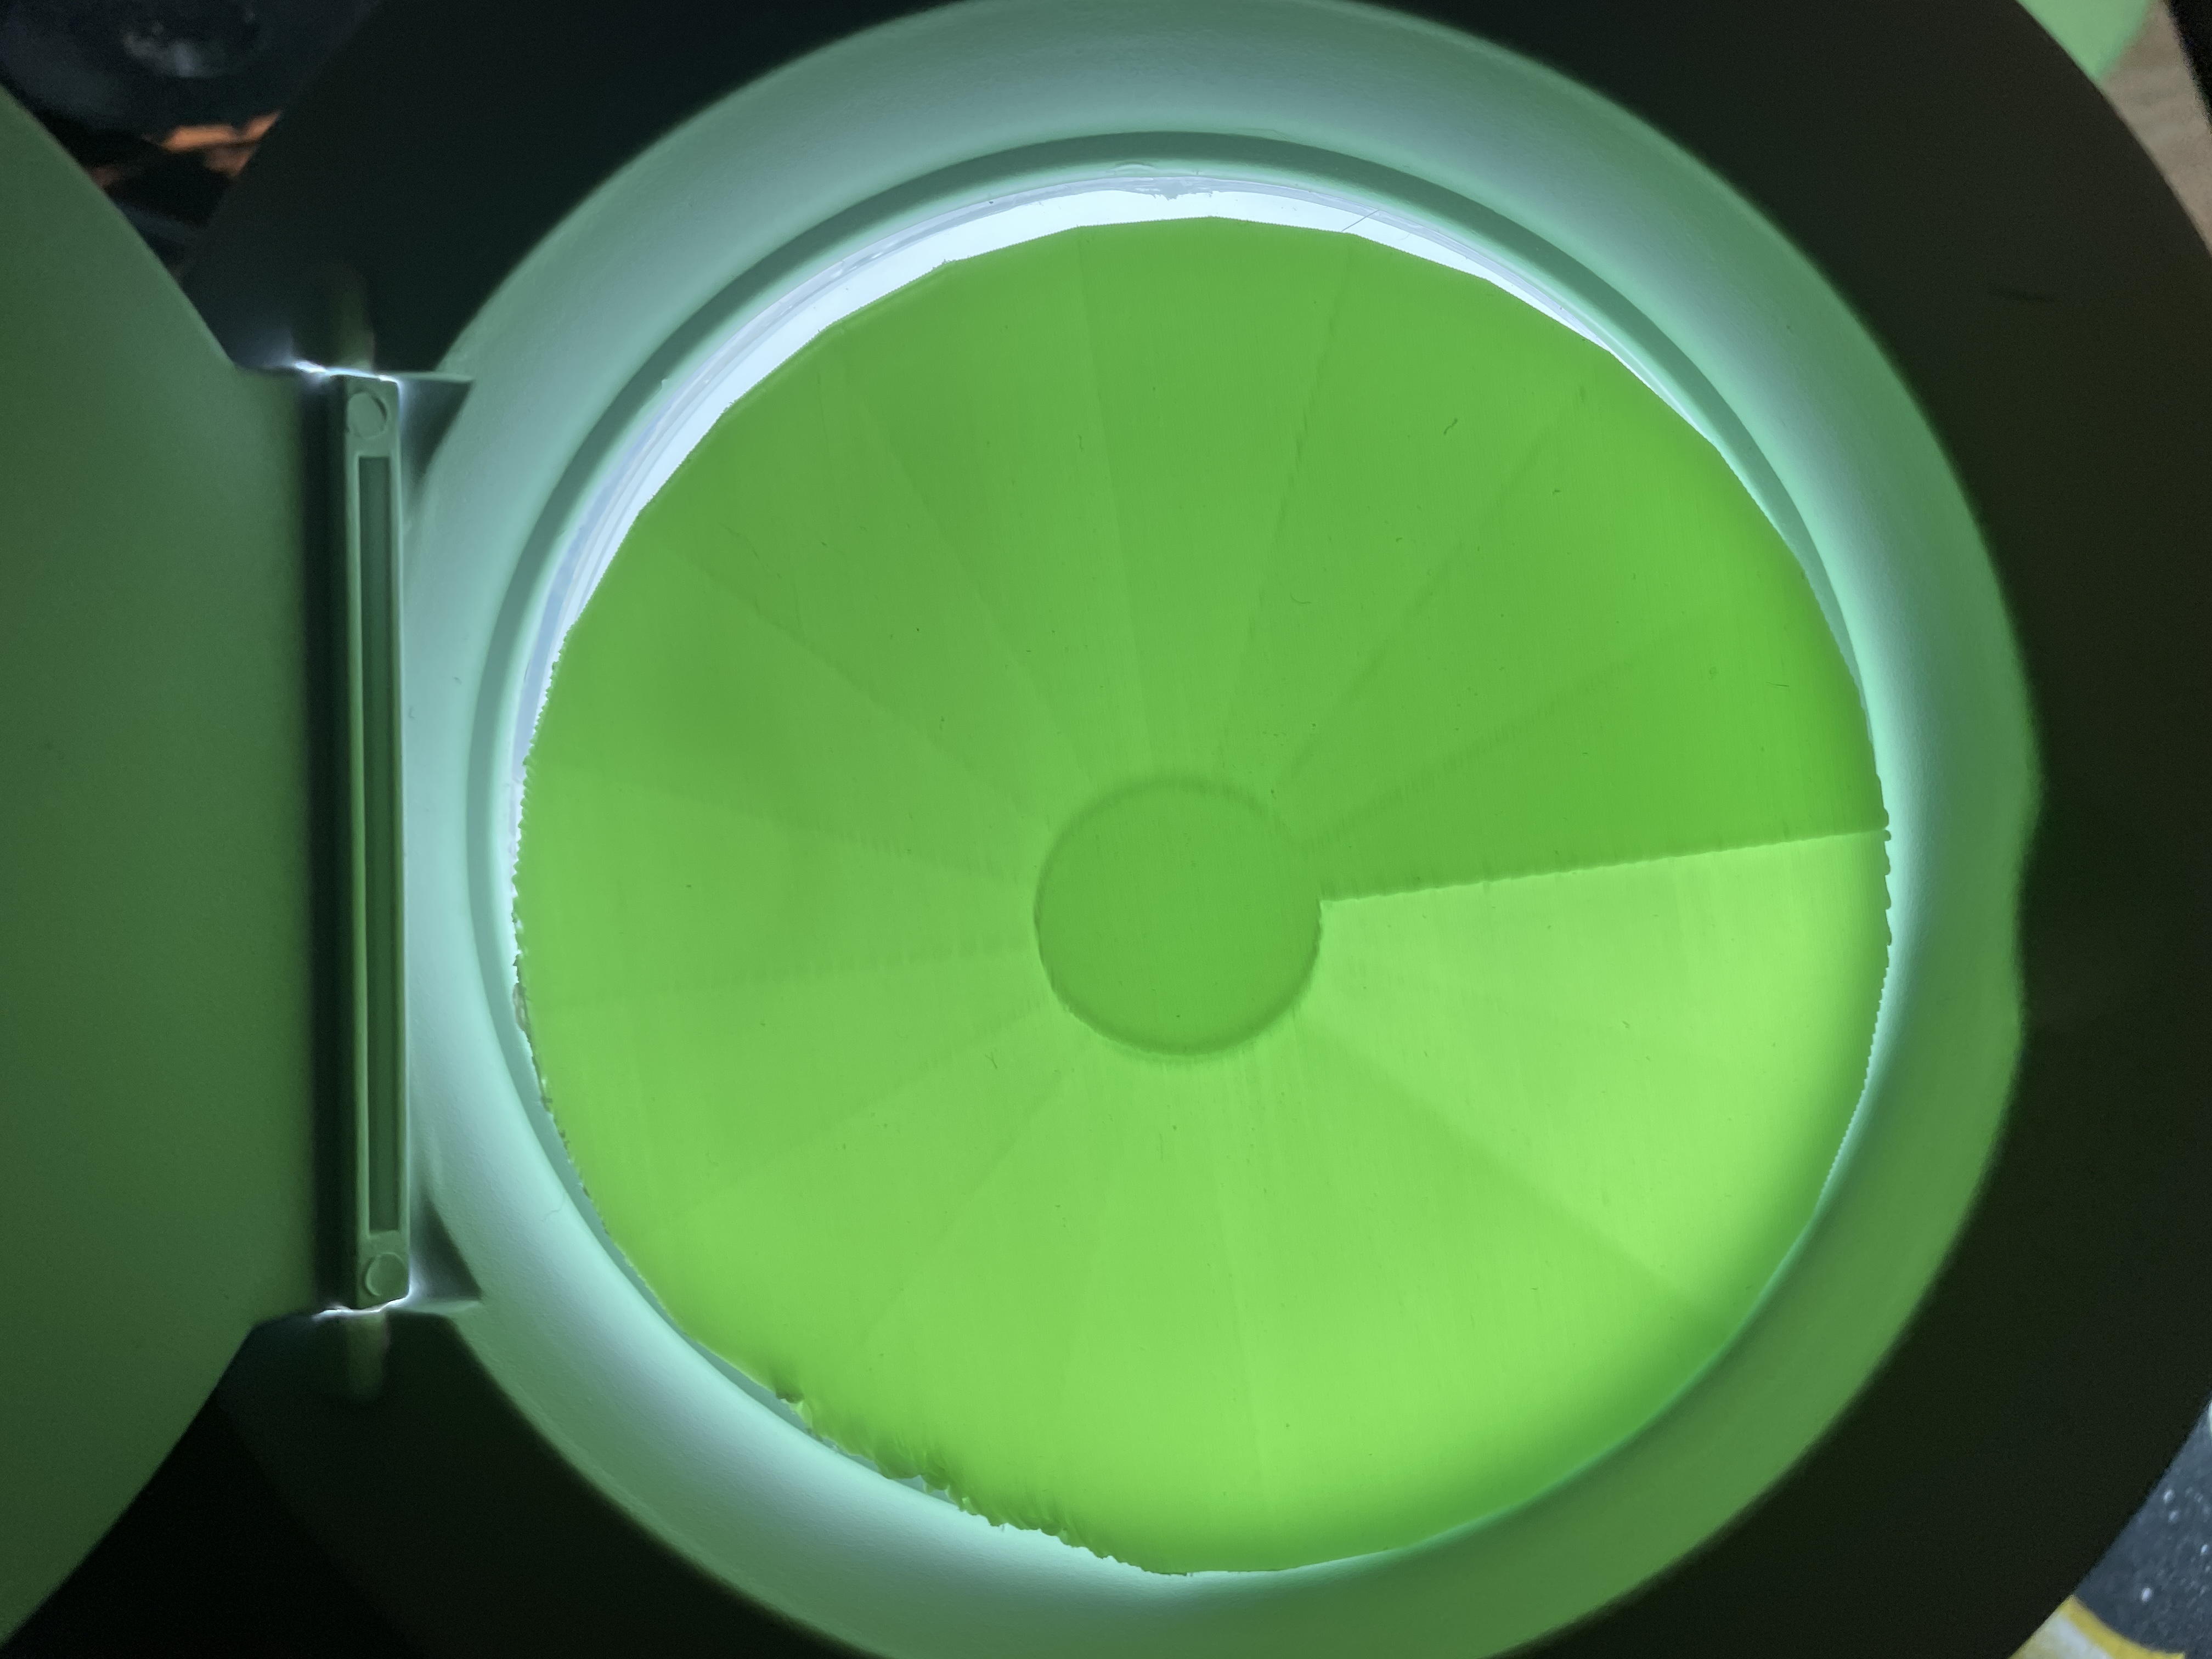
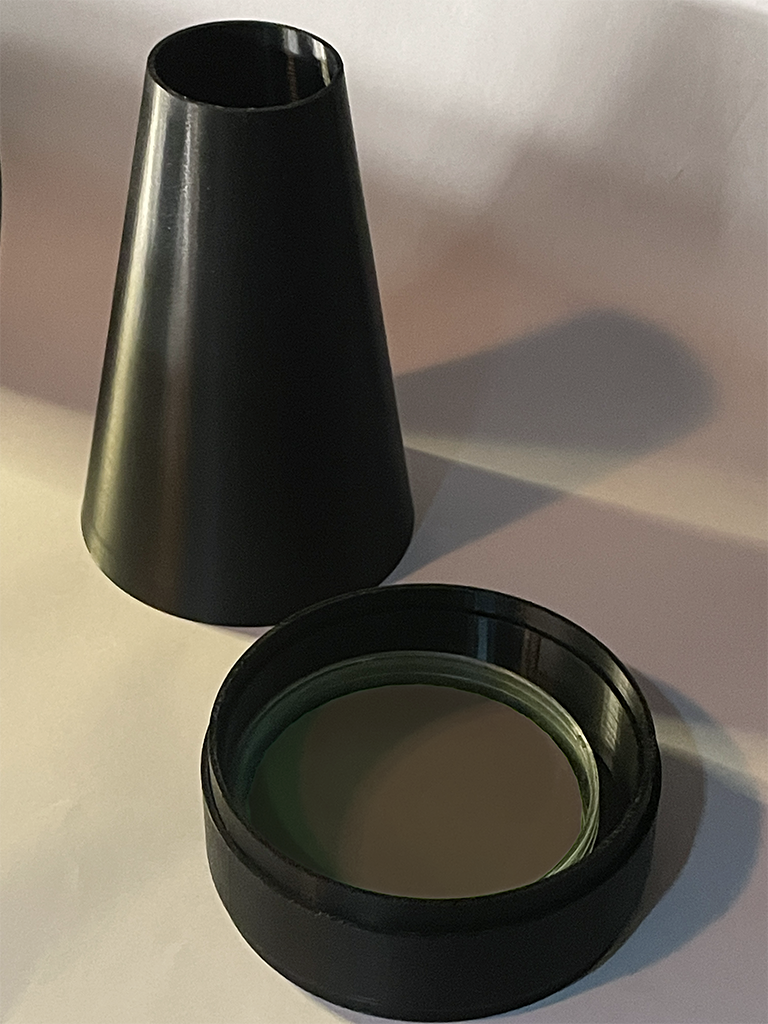
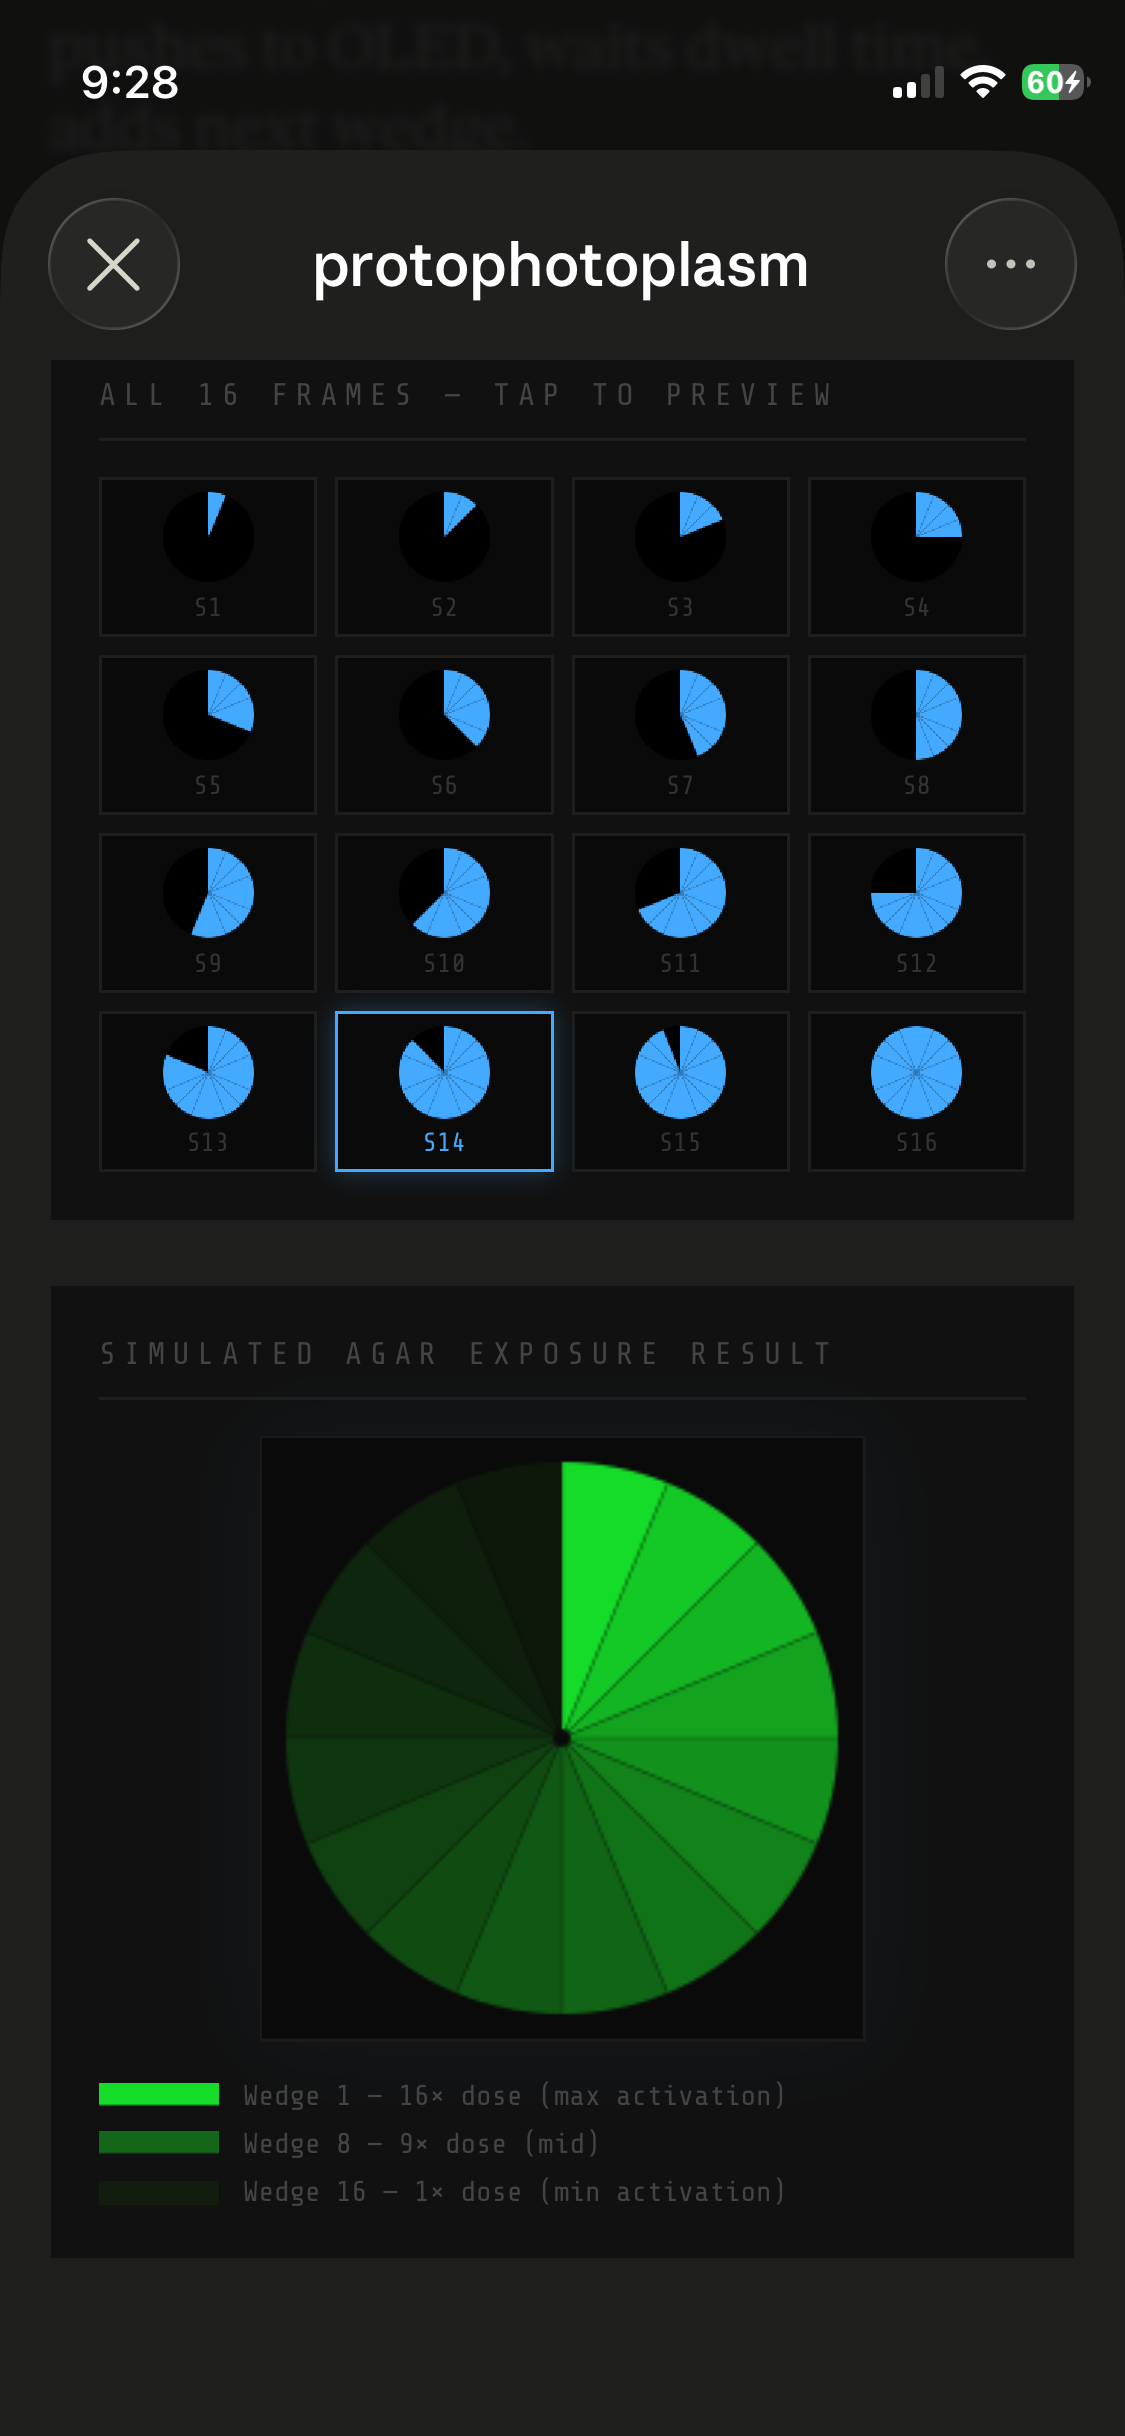
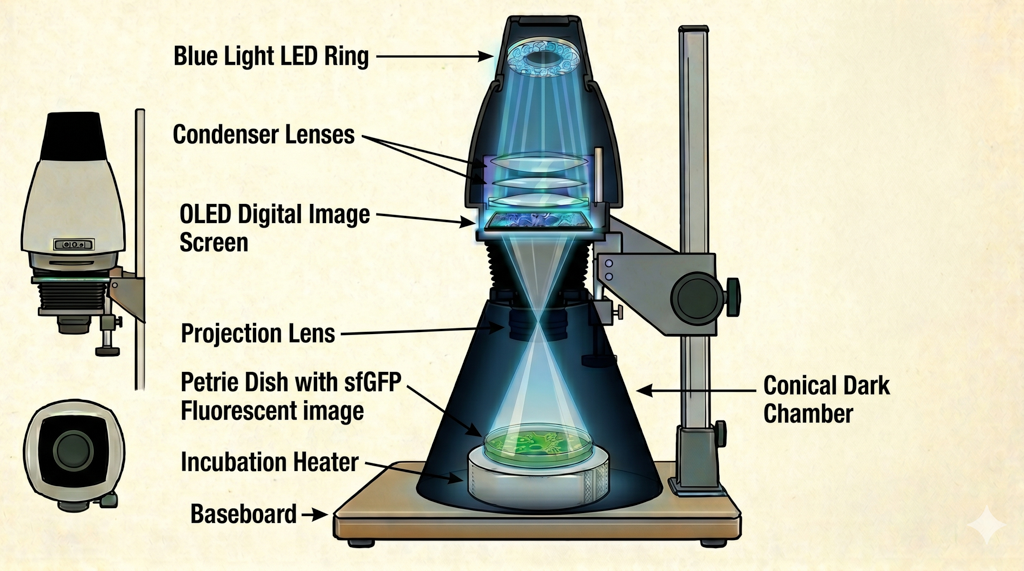
Photoplasm — described as “a darkroom enlarger reinvented as a programmable bio-imaging instrument” — comprises a Raspberry Pi 5 microcontroller, 470 nm LED light ring, light collimator, OLED digital image mask used for projection of selected images to create a variable density map (like a film negative or positive print), focusing lens, dark chamber cone, removable wavelength sensor, bacterial plate holder, and plate heater for incubation.
Photoplasm traditional darkroom enlarger modified for spatial image mapping onto light-reactive biosensors.
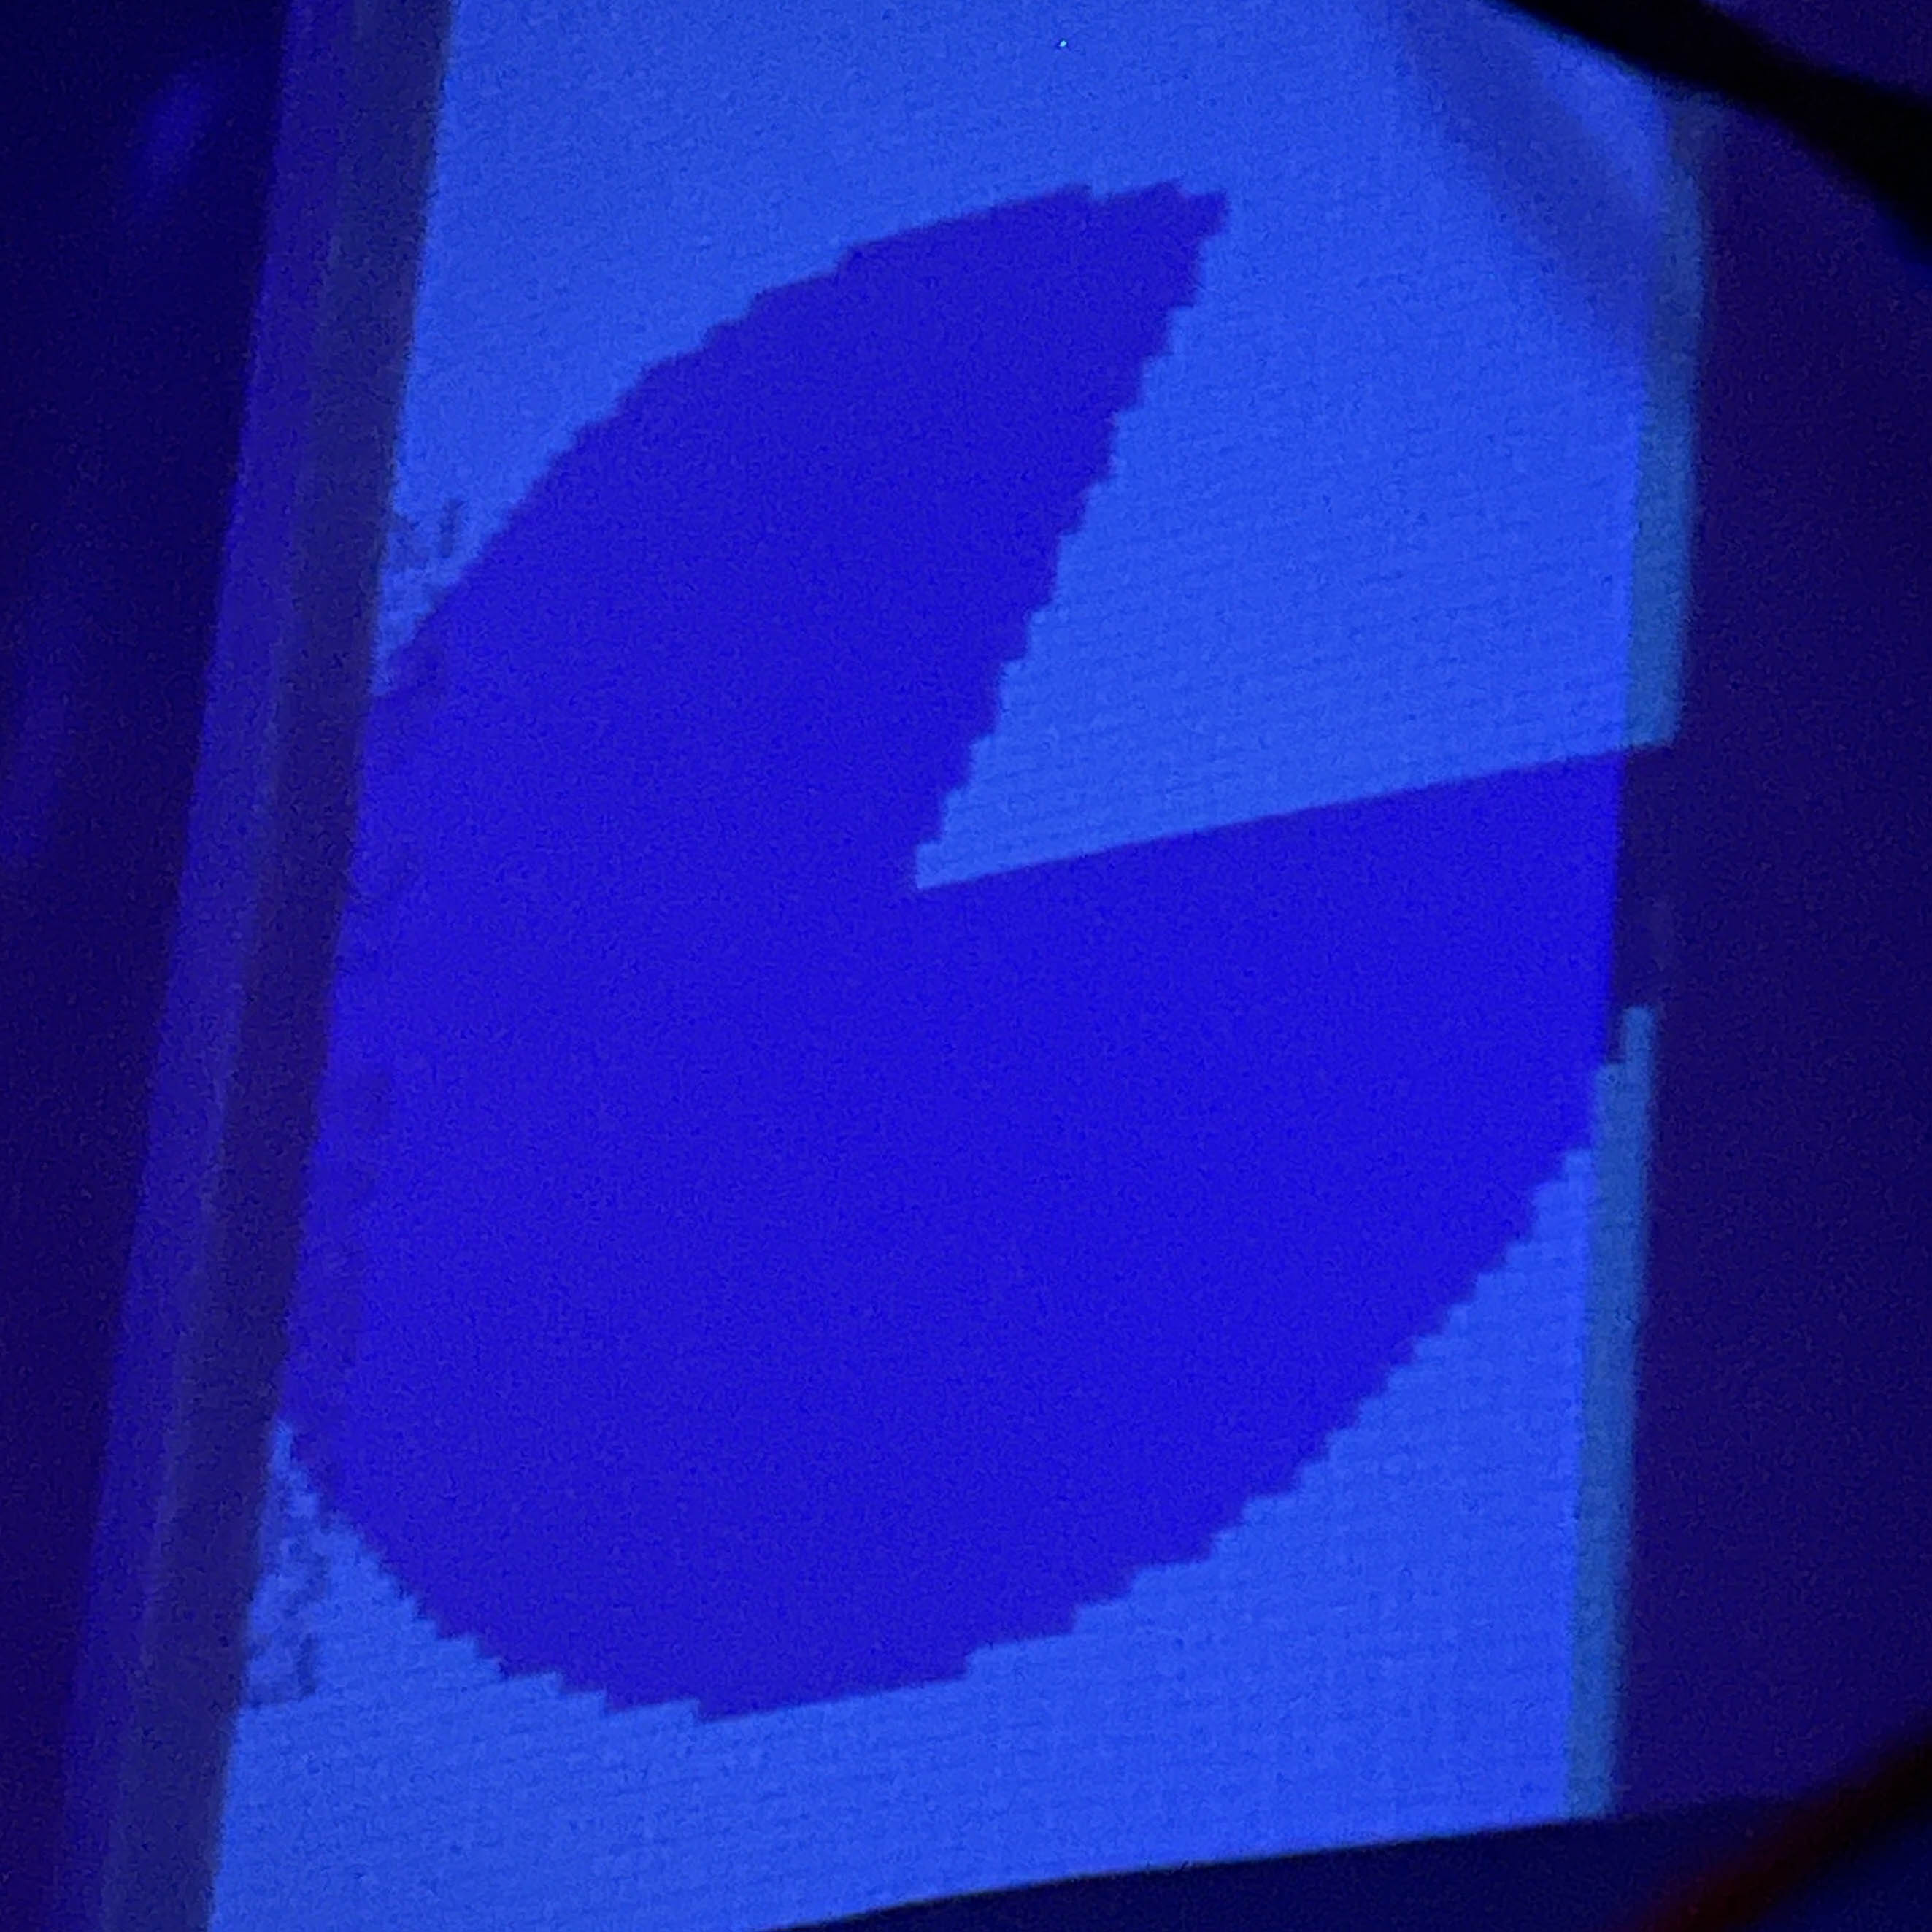
The device delivers spatially programmable 470 nm light exposures through a digital image mask projected onto live bacterial slabs (mixed and poured lawns in agarose), with calibrated step-wedge protocols generating a bacterial H&D curve that quantifies the dose-response relationship between light exposure and sfGFP expression intensity.
Photoplasm 470nm light projection test with step-wedge calibration image target
The biological design pipeline was built and simulated in Asimov Kernel (circuit-level logic), Benchling (sequence assembly using sfGFP as the reporter), AlphaFold (structural prediction of the RsLOV–LexA408 fusion fold), ChimeraX (visualization of the dark-state PDB 4HJ4 dimer and light-state monomer hypothesis), and Twist Biosciences (gene synthesis). The construct uses pUC19 backbone for high-copy sfGFP signal and AmpR selection on LB+Amp, and incorporates SD17 RBS to keep LexRO matched to FMN supply.
4 — Specific Aim 2 / Community Lab Project / Cell-Free Migration / Biomanufacturing
What key steps or milestones will be completed to achieve the broad objective? (Aim 2 development path)
Aim 2 begins with the receipt of the Biolight V5 clonal gene from Twist Bioscience, for transformation into a living cell system at Genspace, my designated node. We will verify the construct through a well defined protocol that includes a minimally viable functionality test with blue light to observe sfGFP illumination, and calibrate the device. We plan to relaunch the Genspace Optogenetics Community Lab Project, introducting and testing a host of light-responsive cellular systems through the Photoplasm labware device.
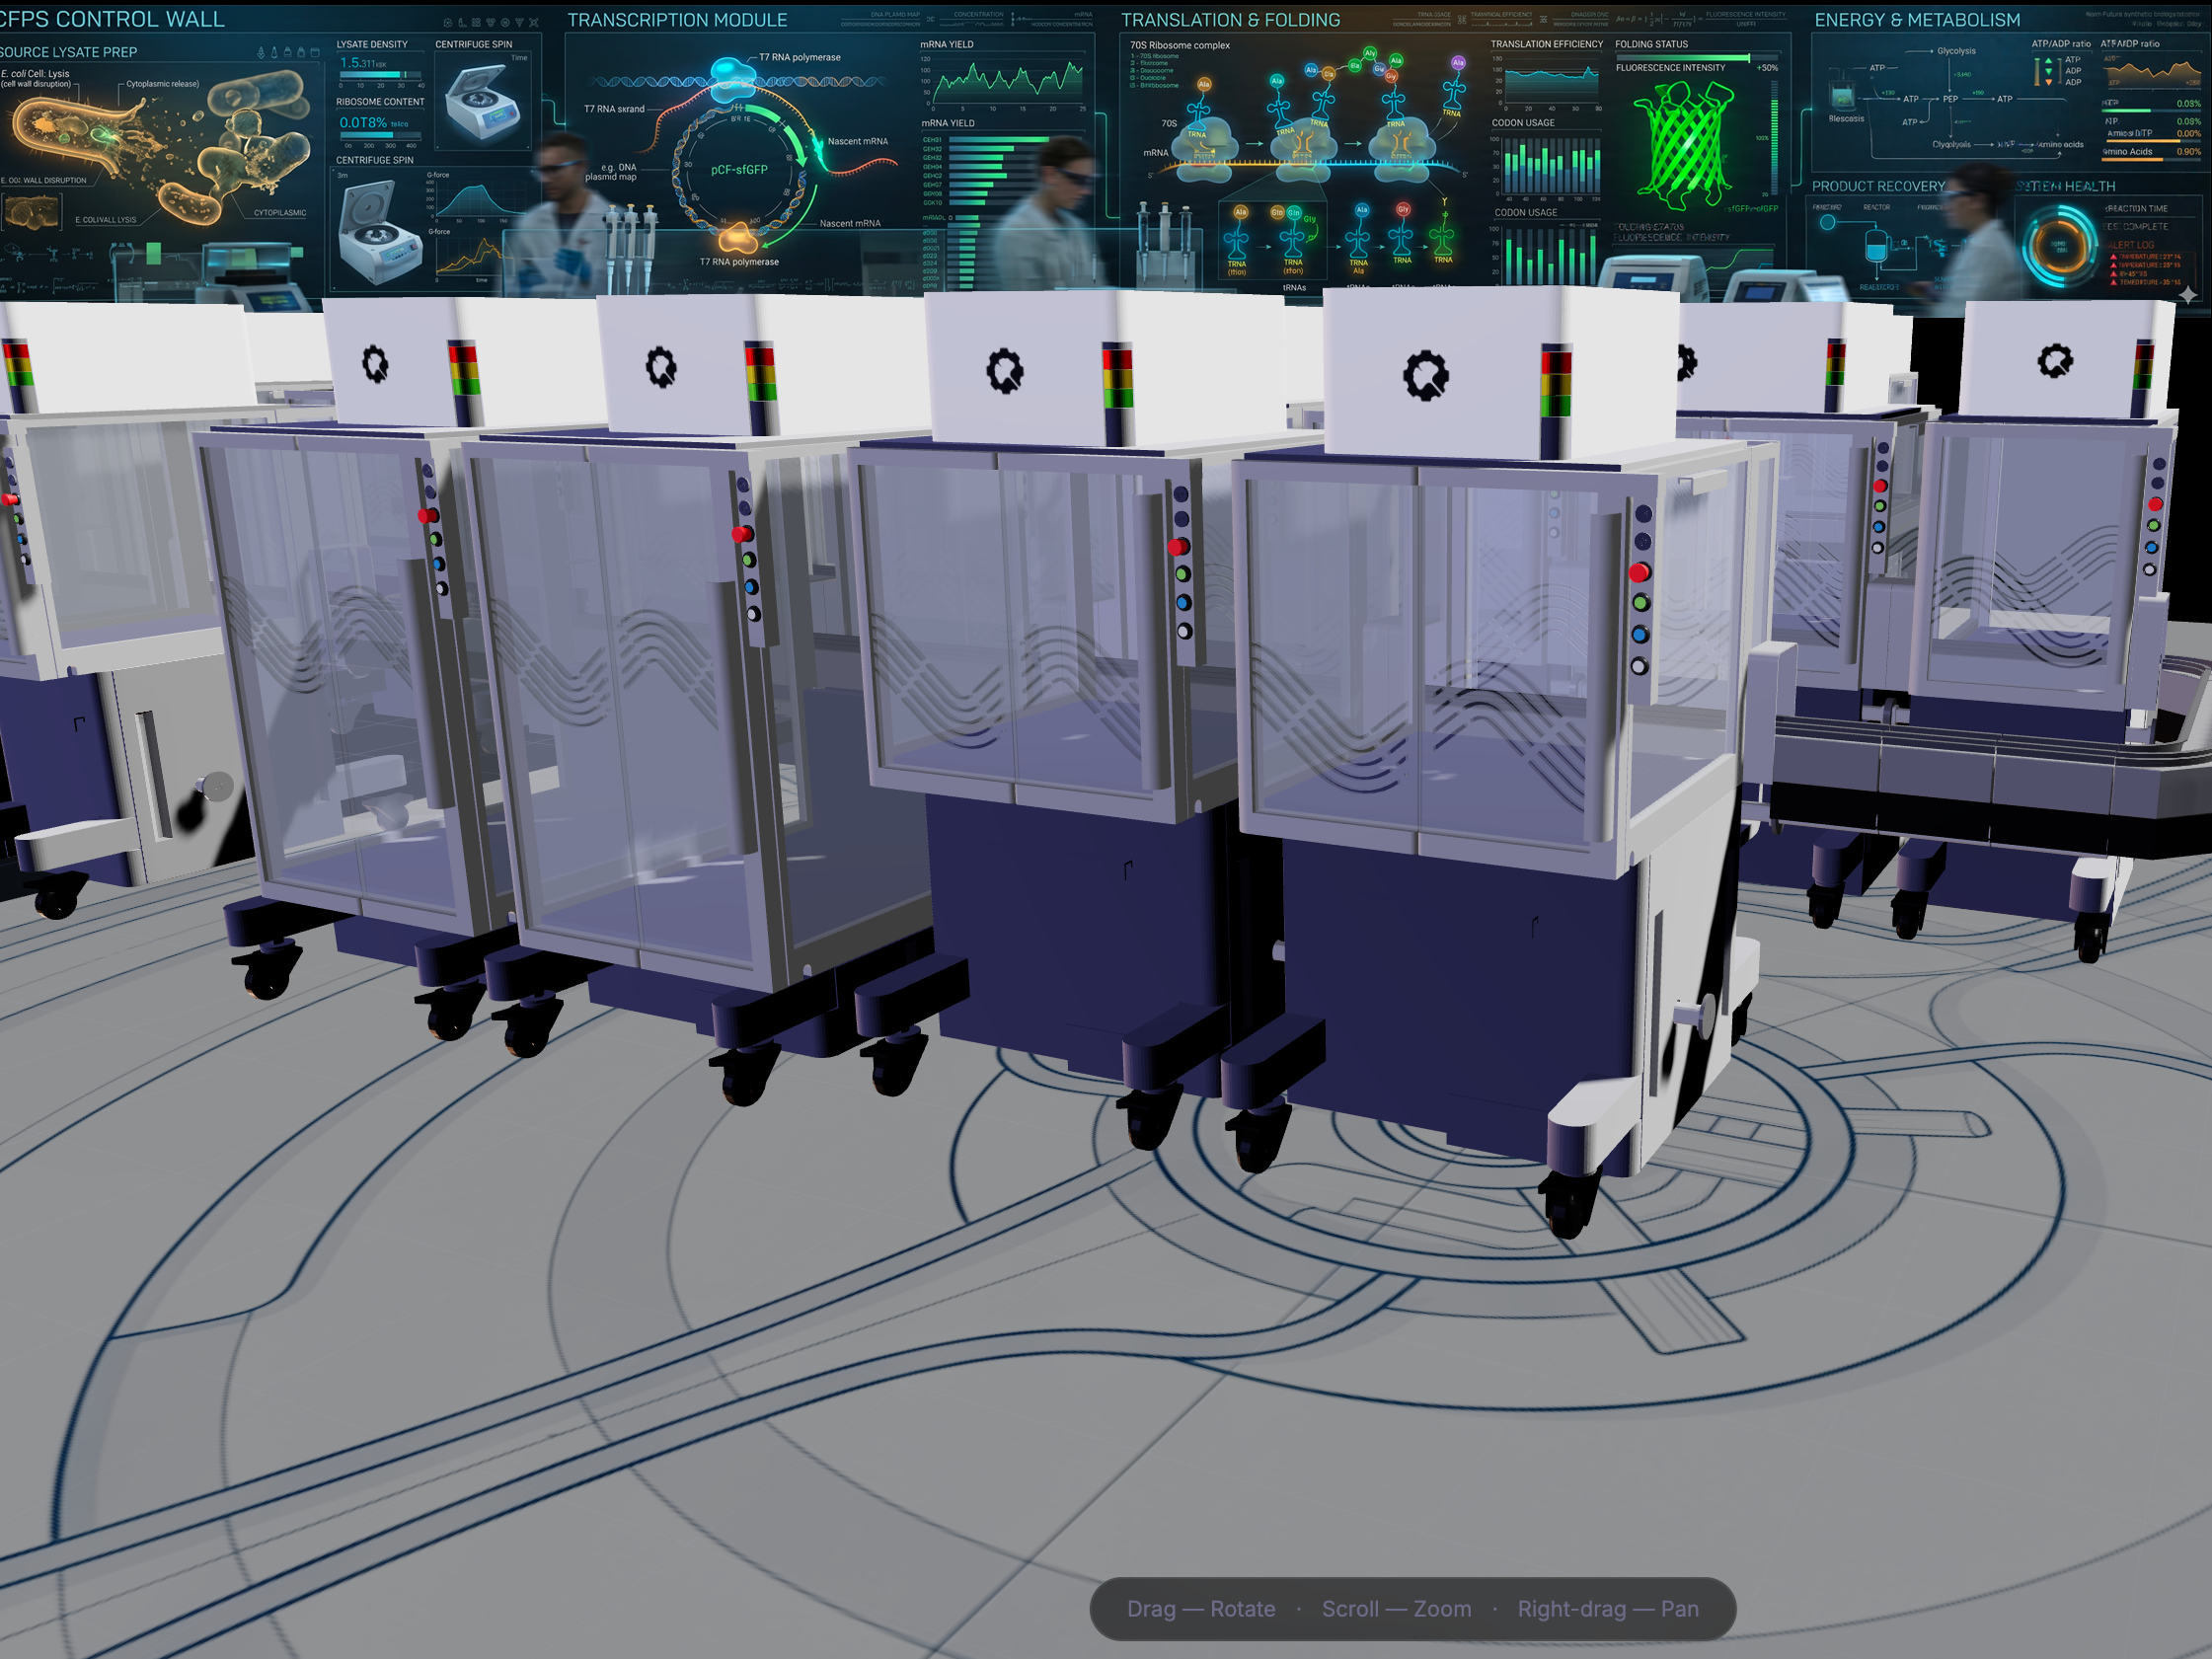
My parallel Aim 2 track is to migrate BioLightV5 from a live-culture wet-lab system into a cell-free protein synthesis (CFPS) variant, executed via Ginkgo Bioworks’ cloud-lab CFPS service. The migration to cell-free reactions removes the containment requirements and cold-chain logistics that govern live-organism distribution, transforming BioLight outputs into stable, shippable consumables. The same Photoplasm device that drives Aim 1 slab exposures also drives the cell-free reactions in Aim 2 — same hardware, two biological substrates. This architecture explicitly invokes the Eastman/Kodak distribution model: George Eastman’s breakthrough was not photochemistry but the system — standardized cartridges, global distribution, and a participant experience so simple the tagline became “you press the button, we do the rest.” BioLightV5 in CFPS form, manufactured by Ginkgo, paired with the open-source Photoplasm device, completes the analogous translation for synthetic biology: complexity lives in the consumable, while the participant loads, exposes, and observes.
Illustration of Ginko Bioworks producing light-sensing cell-free protein systems for use in Photoplasm labware
5 — Specific Aim 3 / Long-Term Vision / Makerspace Distribution
What key steps or milestones will be completed to achieve the broad objective? (Aim 3 visionary path)
The long-term vision of BioLight is wide distribution through the community makerspace network — motivated by a conviction that biological art and design offer one of the most effective entry points into an industry standing on the threshold of a transformation whose scope may equal or exceed the industrial and digital revolutions combined. Aim 3 is realized through a newly formed collaboration between the MakerSpace Charlotte BioArt Studio and the Genspace community wetlab, establishing a multi-node network through which protocols, plasmids, hardware files, and educational frameworks flow openly between an institutional community lab and a community makerspace. This collaboration is itself the prototype of the distribution model — if it works between two nodes, it scales to twenty, then two hundred or more. The result is a data-driven framework for democratized biotechnology that mirrors how Eastman/Kodak democratized photography: not by simplifying the science, but by engineering the system around it so that anyone curious enough to join can do so without first becoming a specialist.
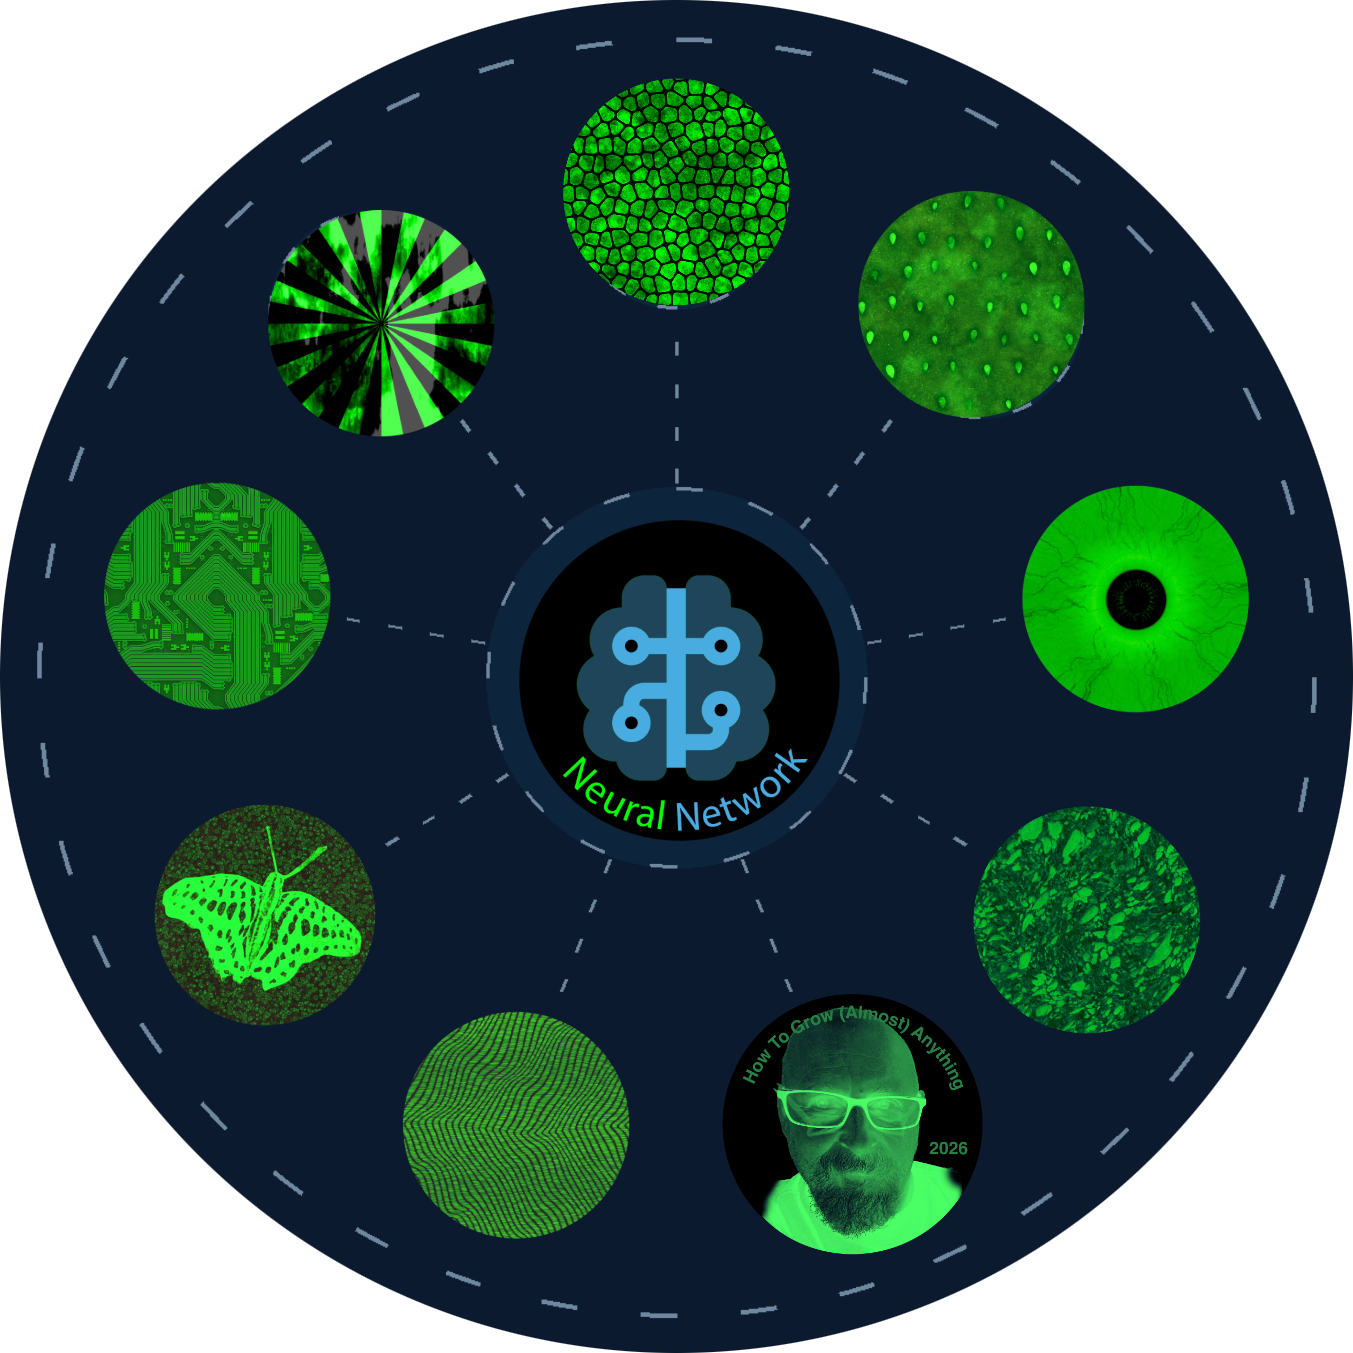
Photoplasm Neural Network - Connected nodes with shared protocol data
Section Two - Aims
HTGAA 2026 Final Project Documentation
Eric Schneider · BioArt Studio, MakerSpace Charlotte · Genspace NYC node
Section 2 — Project Aims
Define three aims for your final project (minimum one sentence per aim).
Aim 1 — Experimental Aim · Design & Build
Aim 1: Experimental Aim (this project):
“The first aim of my final project is to [achievable experimental goal] by utilizing [protocols, tools, or strategies].”
i. This aim should describe the core experimental objective you will attempt during this class. List or link any relevant methods or resources you plan to use (e.g., experimental protocols, automation workflows, DNA or protein designs, protein design tools, or Twist orders).
ii. You will provide a detailed step-by-step experimental plan for Aim 1 in the Experimental Design section of this assignment.
The first aim of my final project is to design and build the foundational platform for community-deployable optogenetic synthetic biology — comprising both the biological substrate and the labware device that drives it — by completing BioLightV5, a blue-light-derepressed bacterial expression circuit derived from the eLightOn optogenetic system (Li et al. 2020), and Photoplasm, a programmable bio-imaging instrument purpose-built to deliver spatially controlled 470 nm exposures onto live bacterial cultures.
Methods, tools, and strategies: BioLightV5 design pipeline
Asimov Kernel (circuit-level logic with SBOL parts)
Asimov Kernel (simulation)
Benchling (sequence assembly using sfGFP)
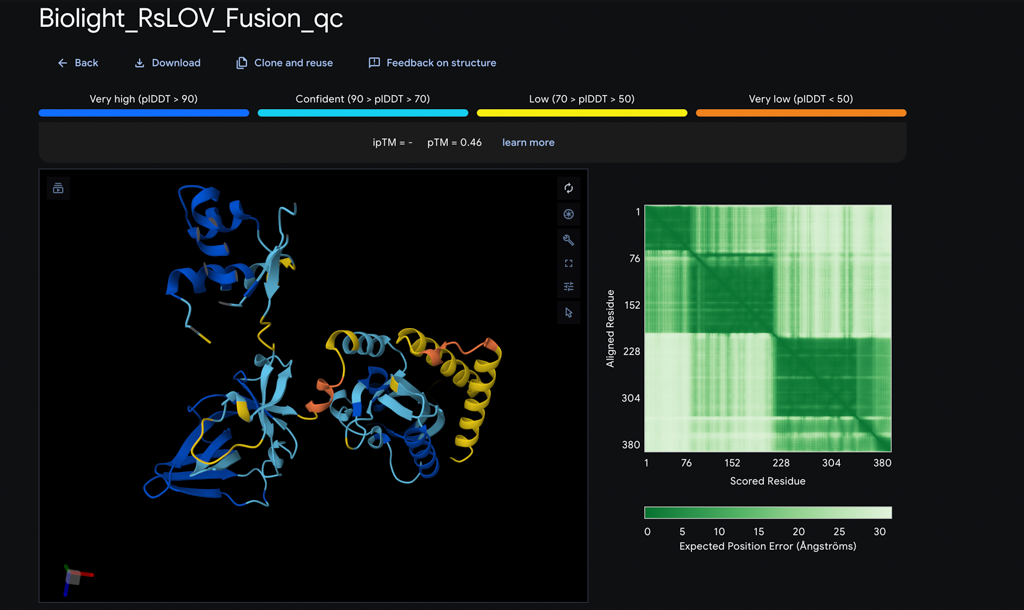
AlphaFold (structural prediction of the RsLOV+LexA408 fusion fold)
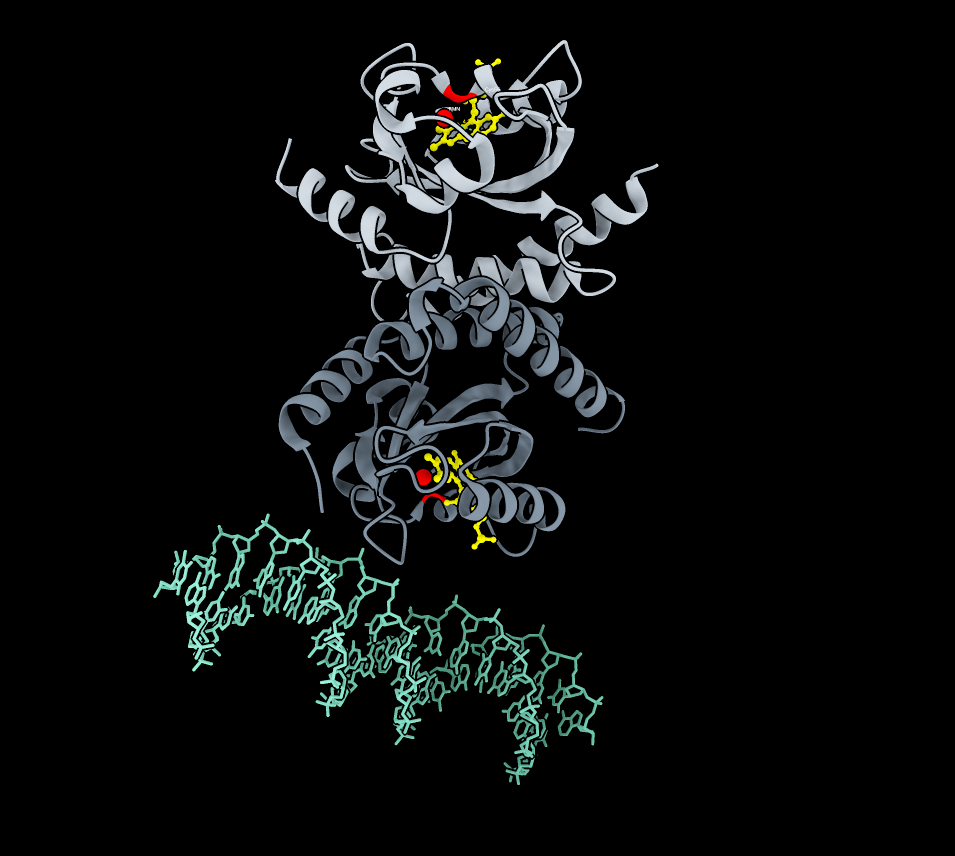
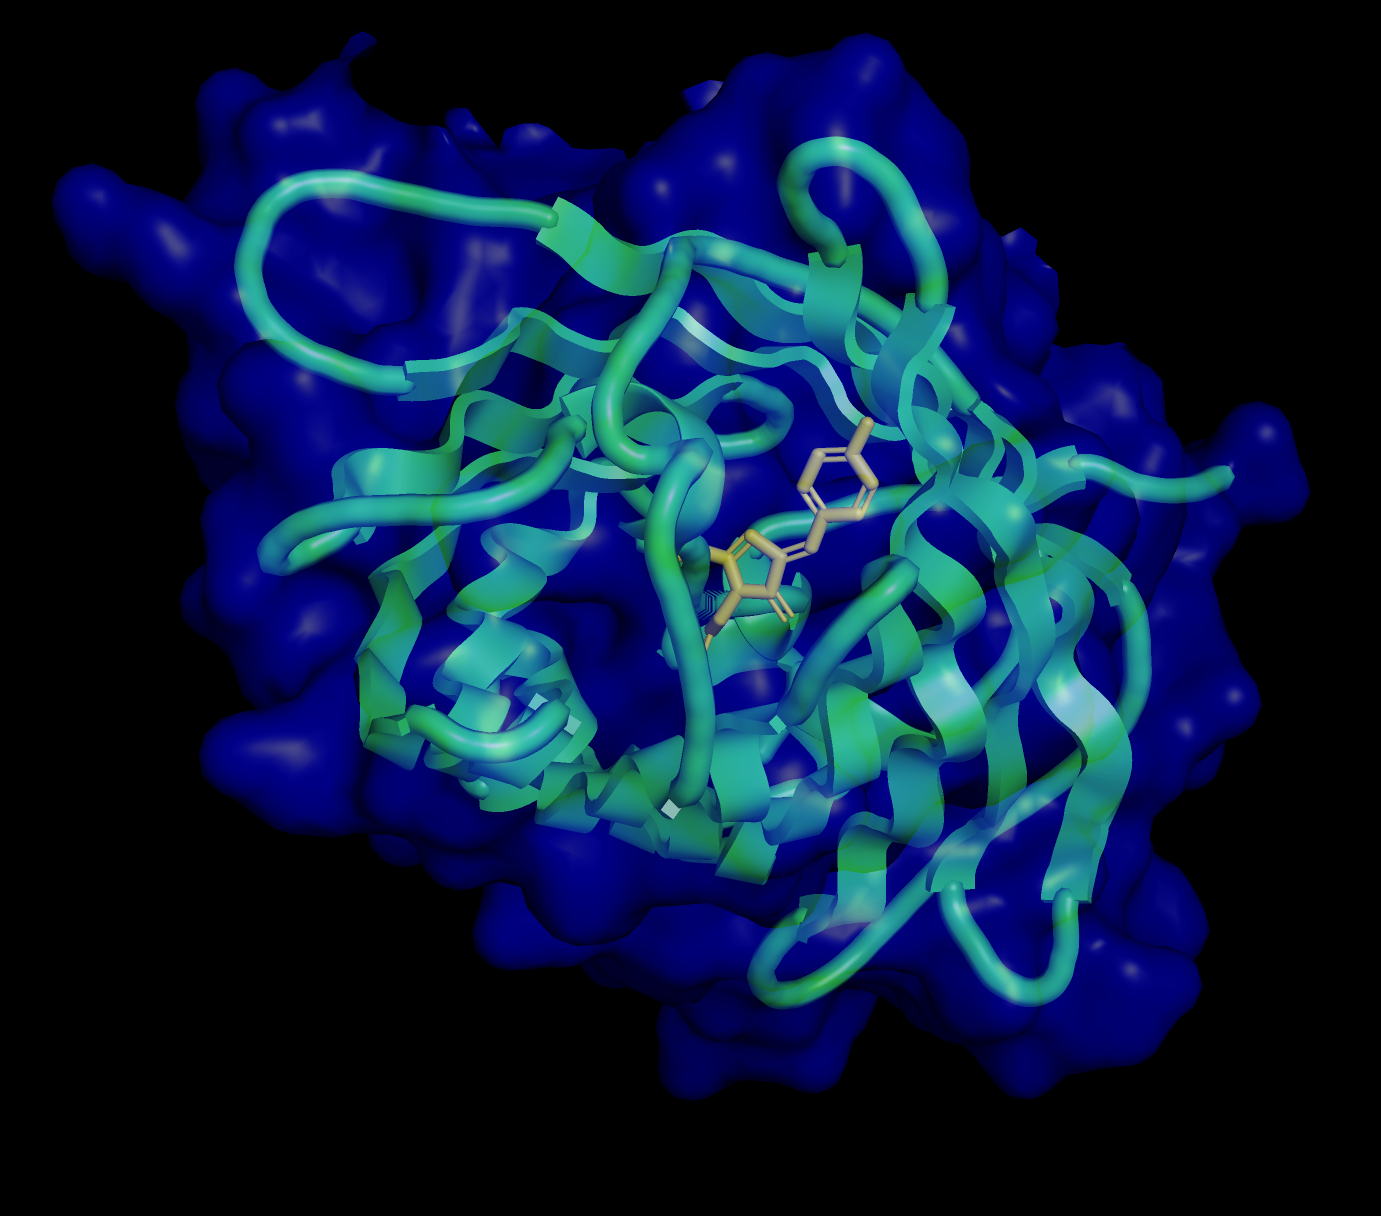
ChimeraX (visualization of molecular dark-state structure of the RsLOV homodimer with FMN (choromphore) binding — the experimental foundation for visualizing how blue light disrupts the dimer.
Dark State - LexRO Fusion - Dimerized (LexA408-linker-RsLOV)
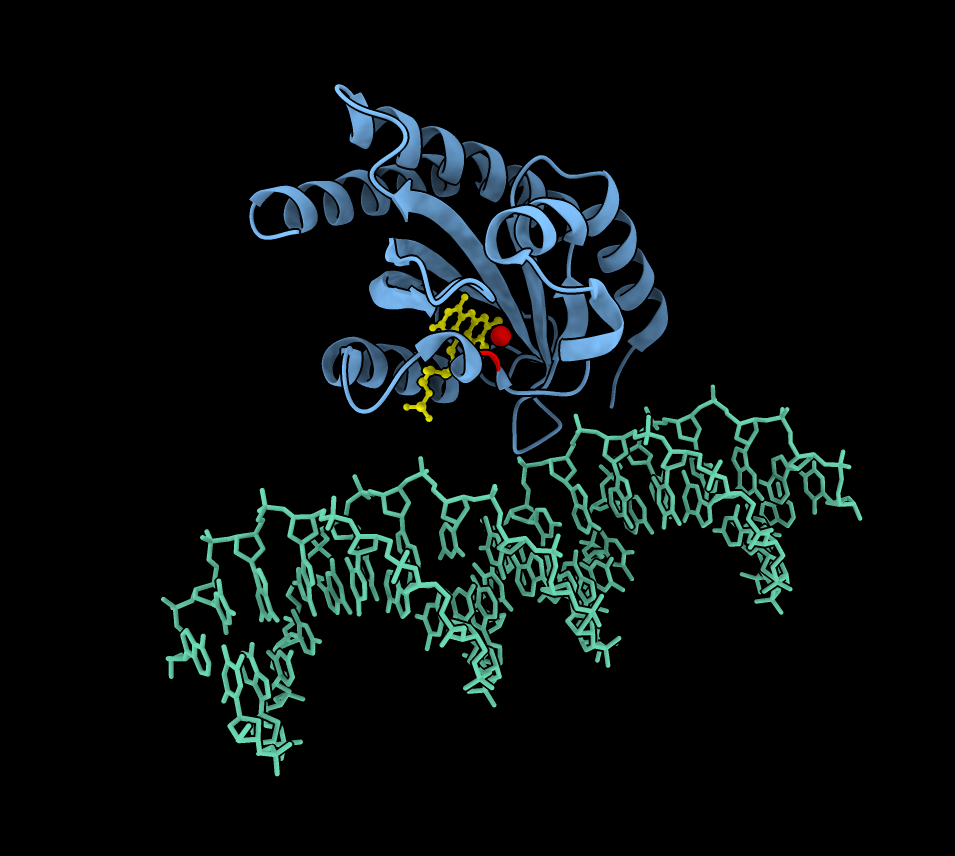
Light Activation- RsLOV Monomerized, LexA408 operator can now bind with pColE408 Promoter, expressing sfGFP
sfGFP β-barrel begins to fold and fluoresce. In absence of blue light, dark recovery begins when LexRO dimerizes.
Construct architecture:
pUC19 backbone for high-copy sfGFP signal;
AmpR selection on LB+Amp;
SD17 RBS to keep LexRO matched to FMN supply.
Twist Biosciences (gene synthesis)
Twist order: BioLightV5 plasmid submitted for clonal gene synthesis.
Control track: pDawn-sfGFP (Addgene #107741) ordered in parallel as a blue-light-inducible comparator.
Biofilm Lithography enables high-resolution cell patterning via optogenetic adhesin expression. Jin X, Riedel-Kruse IH. Proc Natl Acad Sci U S A. 2018 Apr 3;115(14):3698-3703. doi: 10.1073/pnas.1720676115. Epub 2018 Mar 19. 10.1073/pnas.1720676115 PubMed 29555779
Photoplasm …A modified vintage photographic darkroom enlarger:
Selected for the highly desirable light-modification feature, suitable for bacterial spatial imaging.
Condenser lens to direct light into parallel vertical rays
Focusing lens with adjustable aperture
Photoplasm hardware stack:Image by NanoBanana 2
Raspberry Pi 5 microcontroller
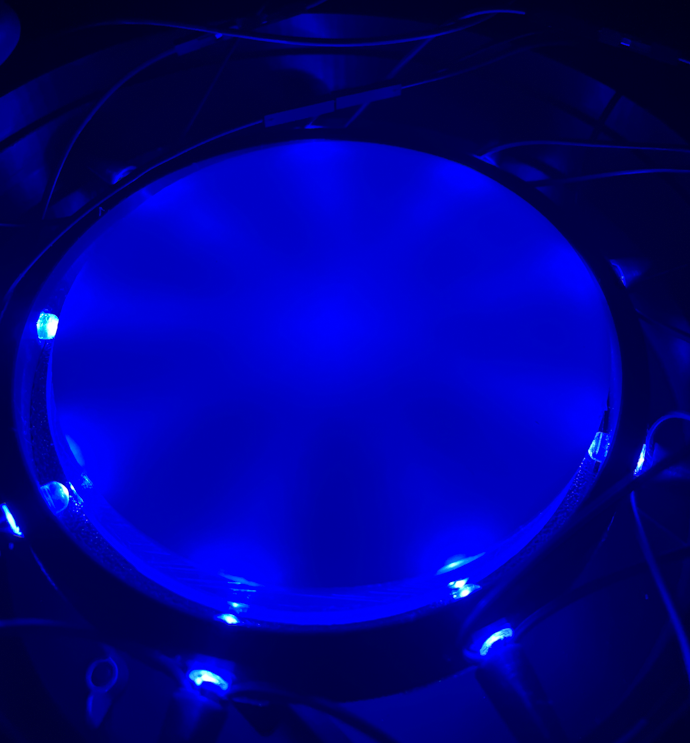
LED Light Ring (Blue 470nm wavelength)
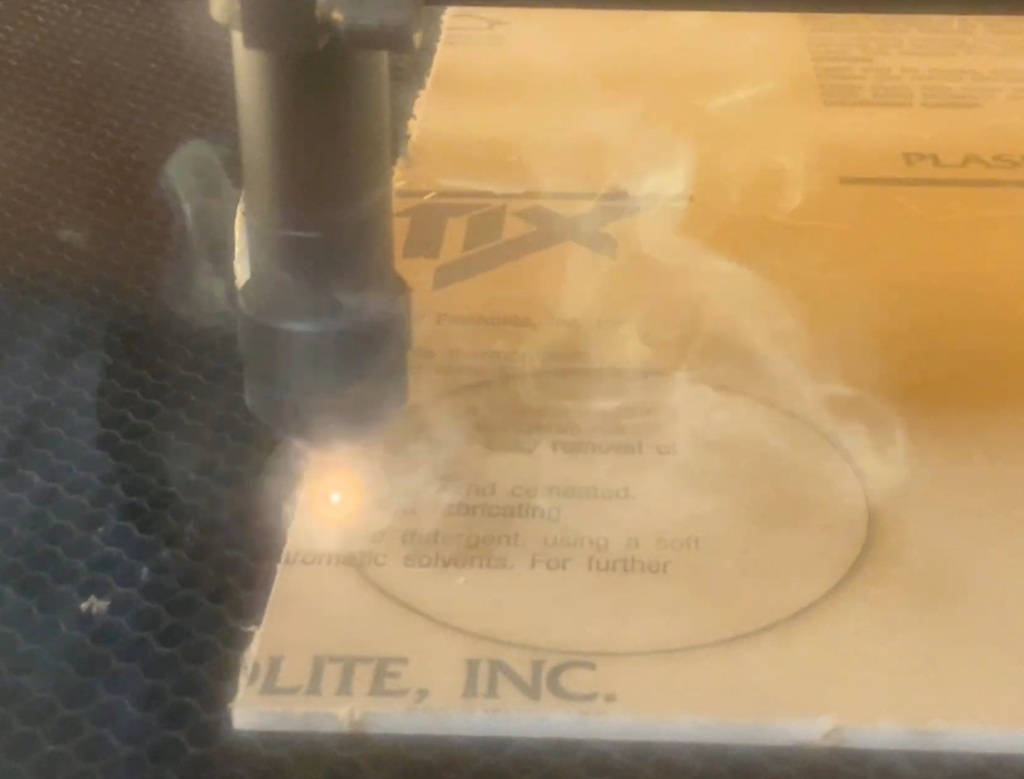
Acrylic Disks for maximum light diffusion, edgelit with reflector (laser cut)
OLED digital image mask (for projection of digital images, like a film negative or positive print)
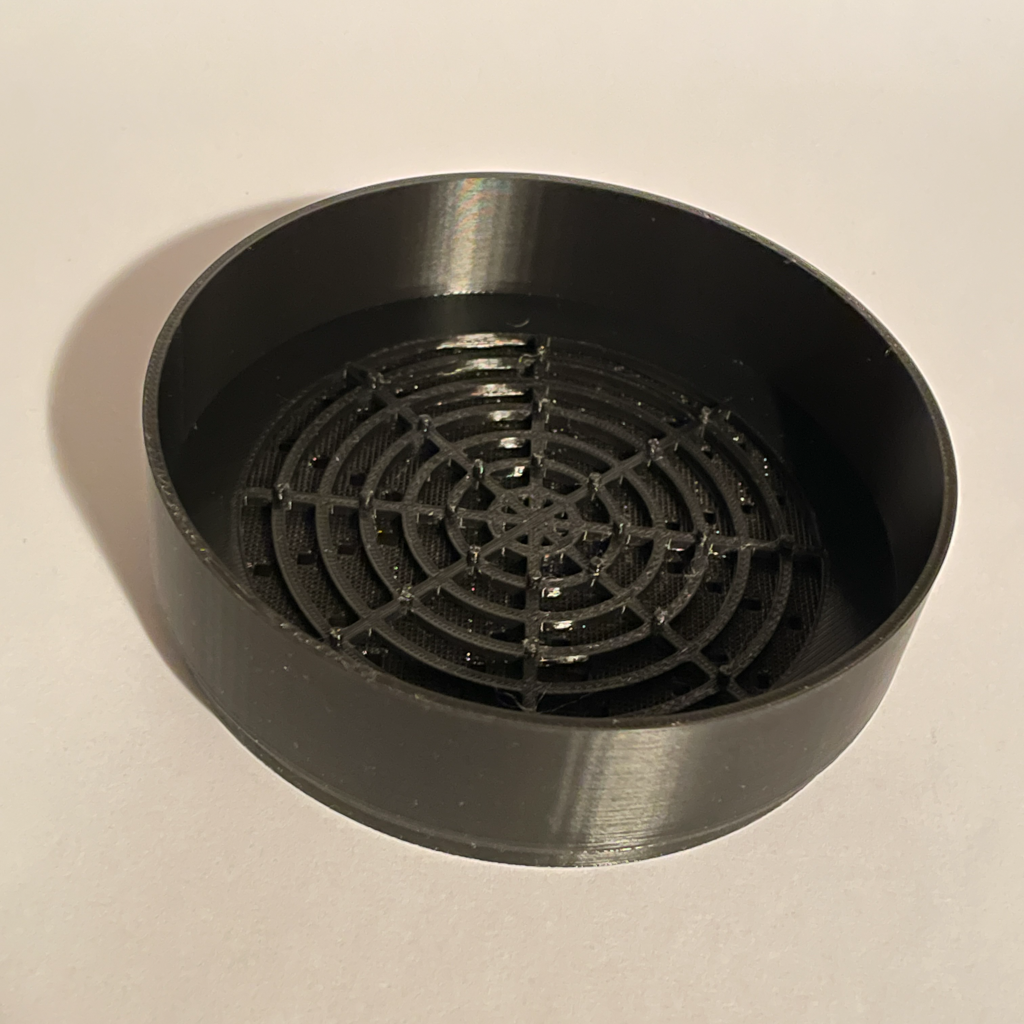
Dark Chamber Cone (3D printed,with spacer rings)
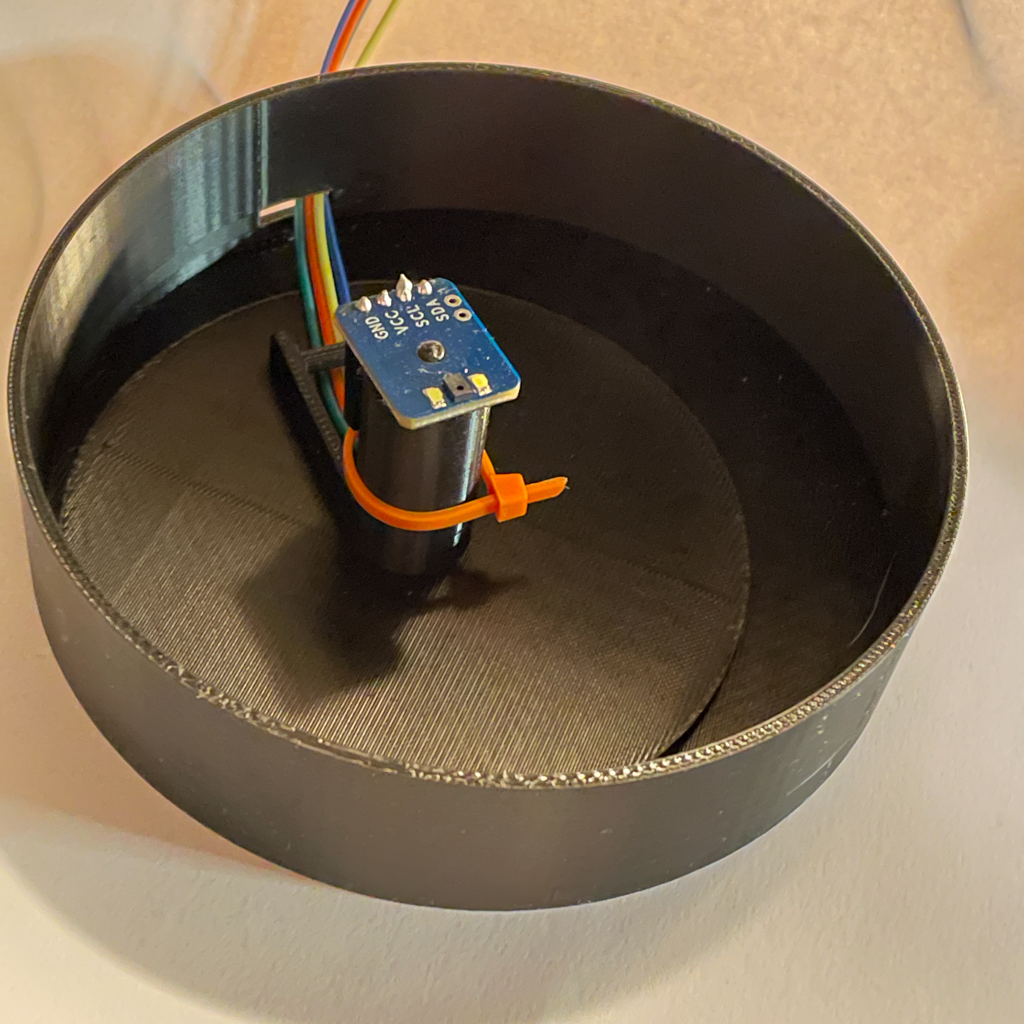
Wavelength Sensor(used for calibration)
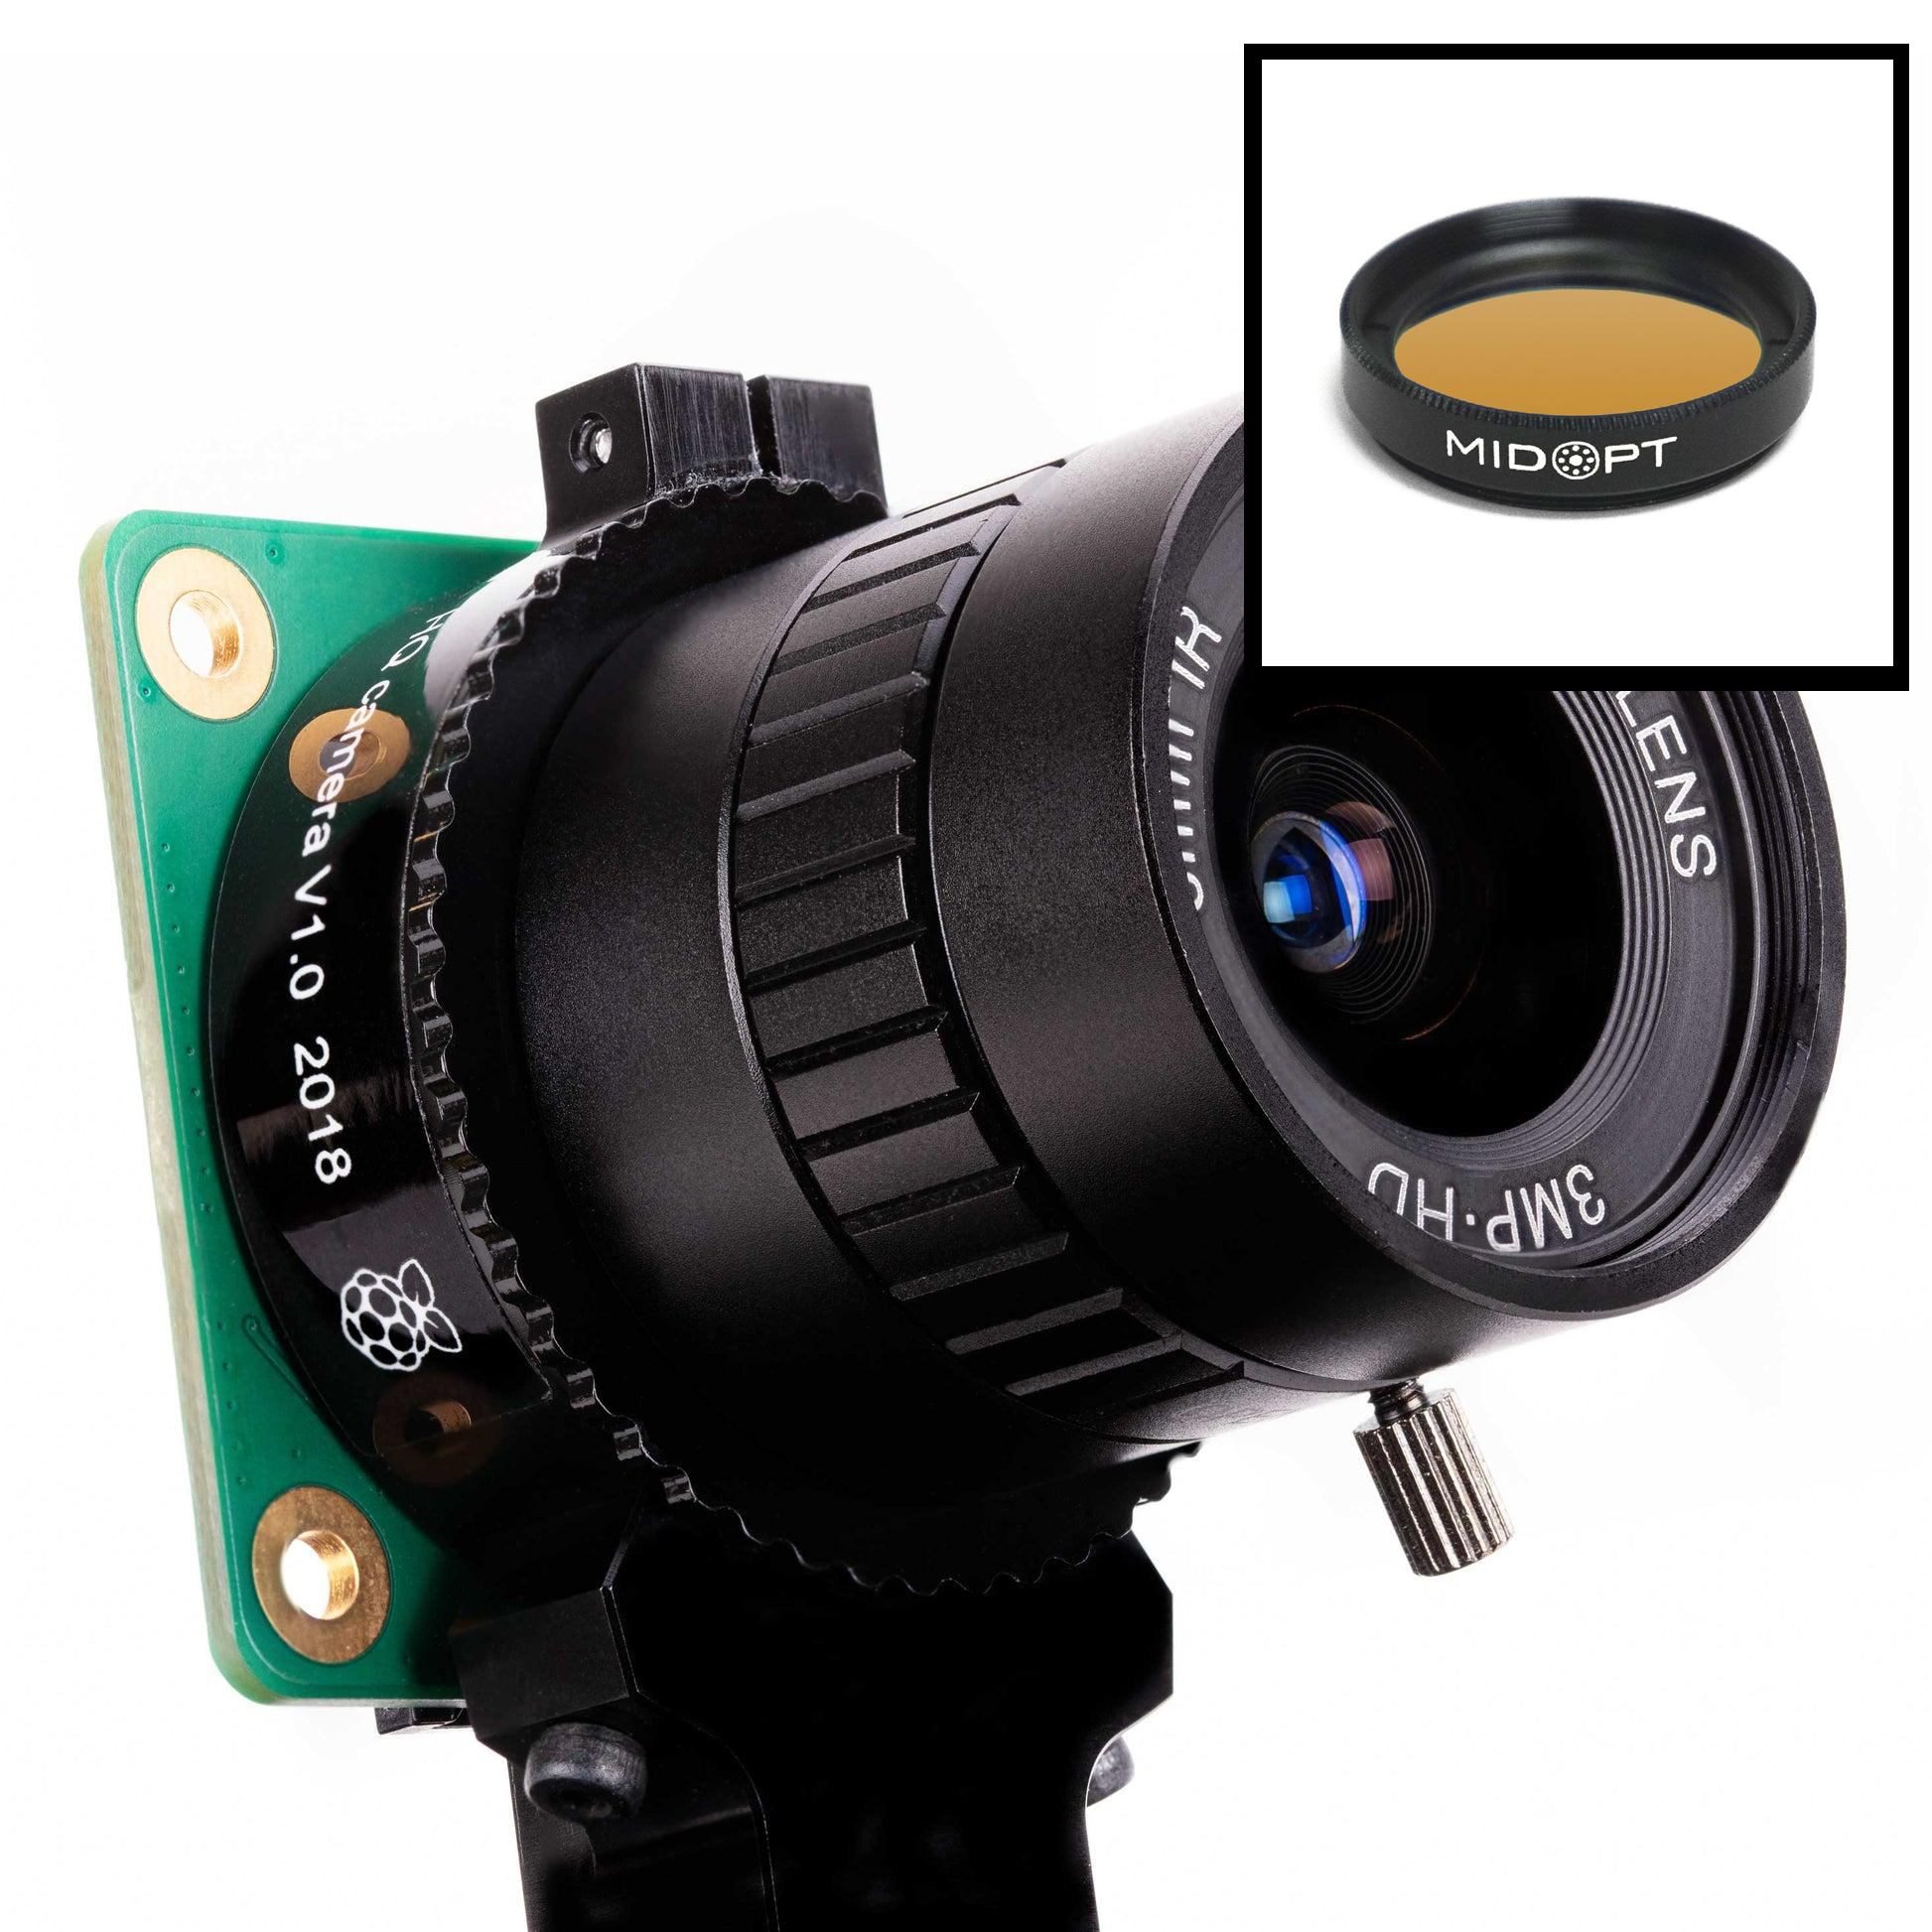
RaspberryPi Cam (for live image capture, with longpass 515nm filter)
BioLightV5 in Agar Slab (Simulated fluorescent image)
Bacterial Plate Holder (3D printed PETG for heat resistance, epoxy sealed for sterilization)
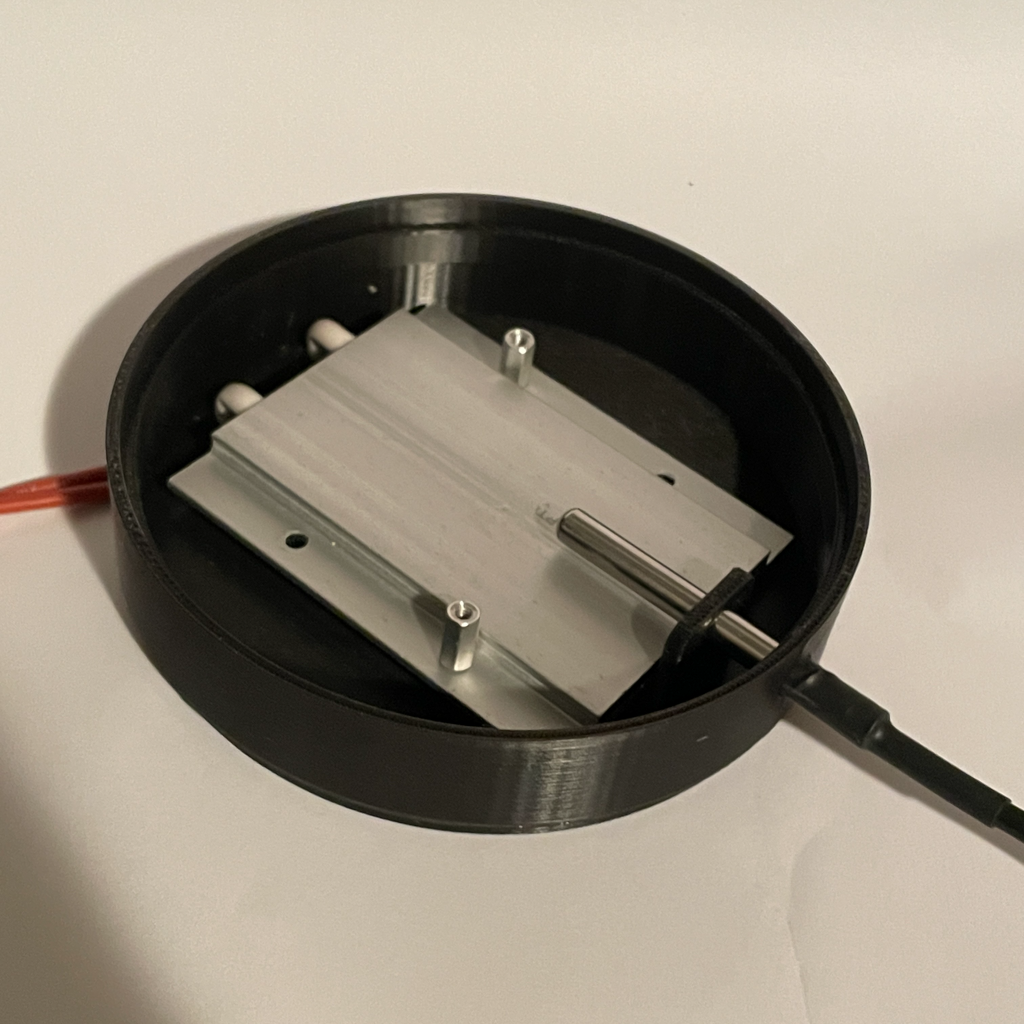
Plate heater with Temperature Sensor (for setpoint control)
Step-by-step experimental plan: see “PhotoPlasm Quick Start Guide”
GitHub Repository
Aim 1 deliverables:
A Twist-synthesized BioLightV5 plasmid verified by sequence
A fully assembled Photoplasm prototype with calibrated optical stack
A documented genetic design package including SBOL-standard schematics, ChimeraX MOA figures, and the complete bill of materials
Reference figure:
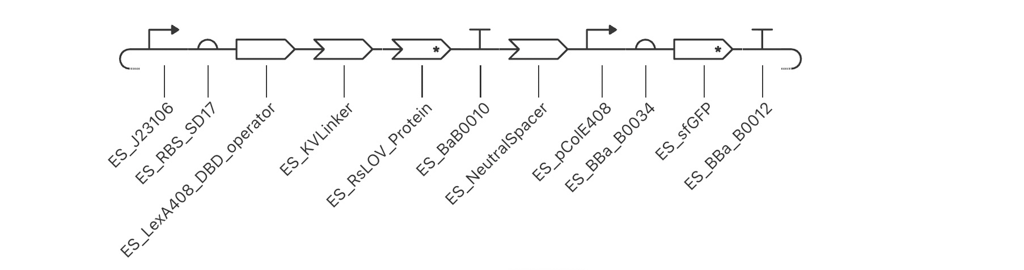
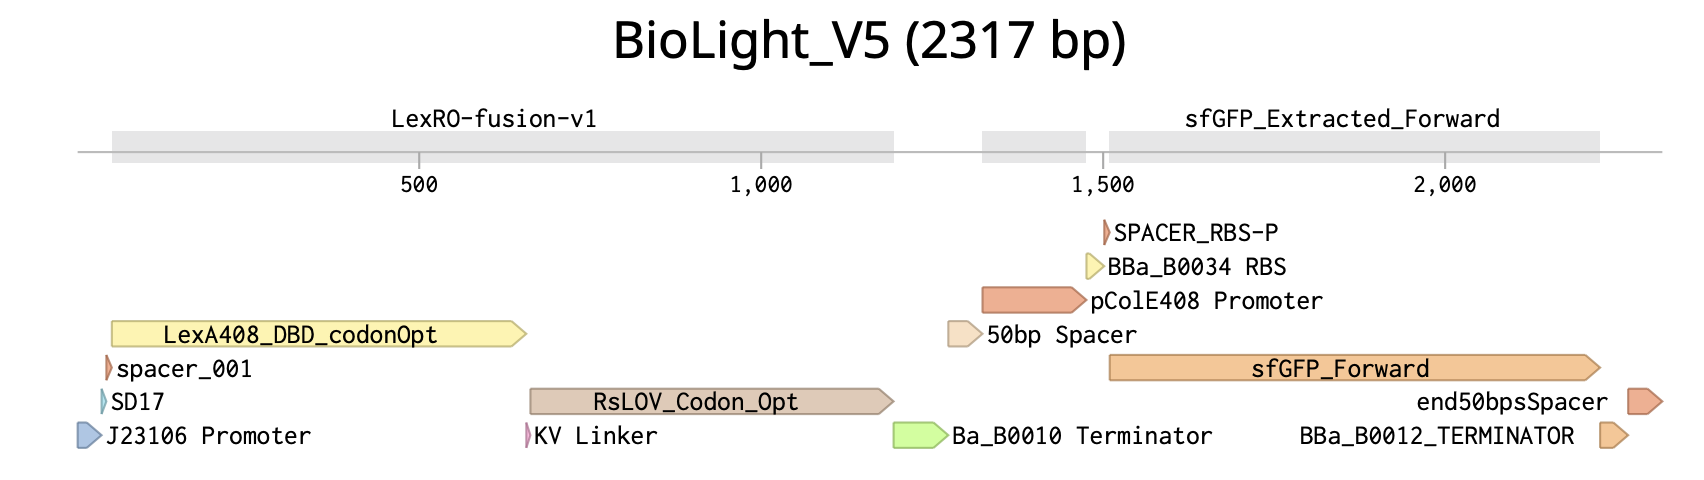
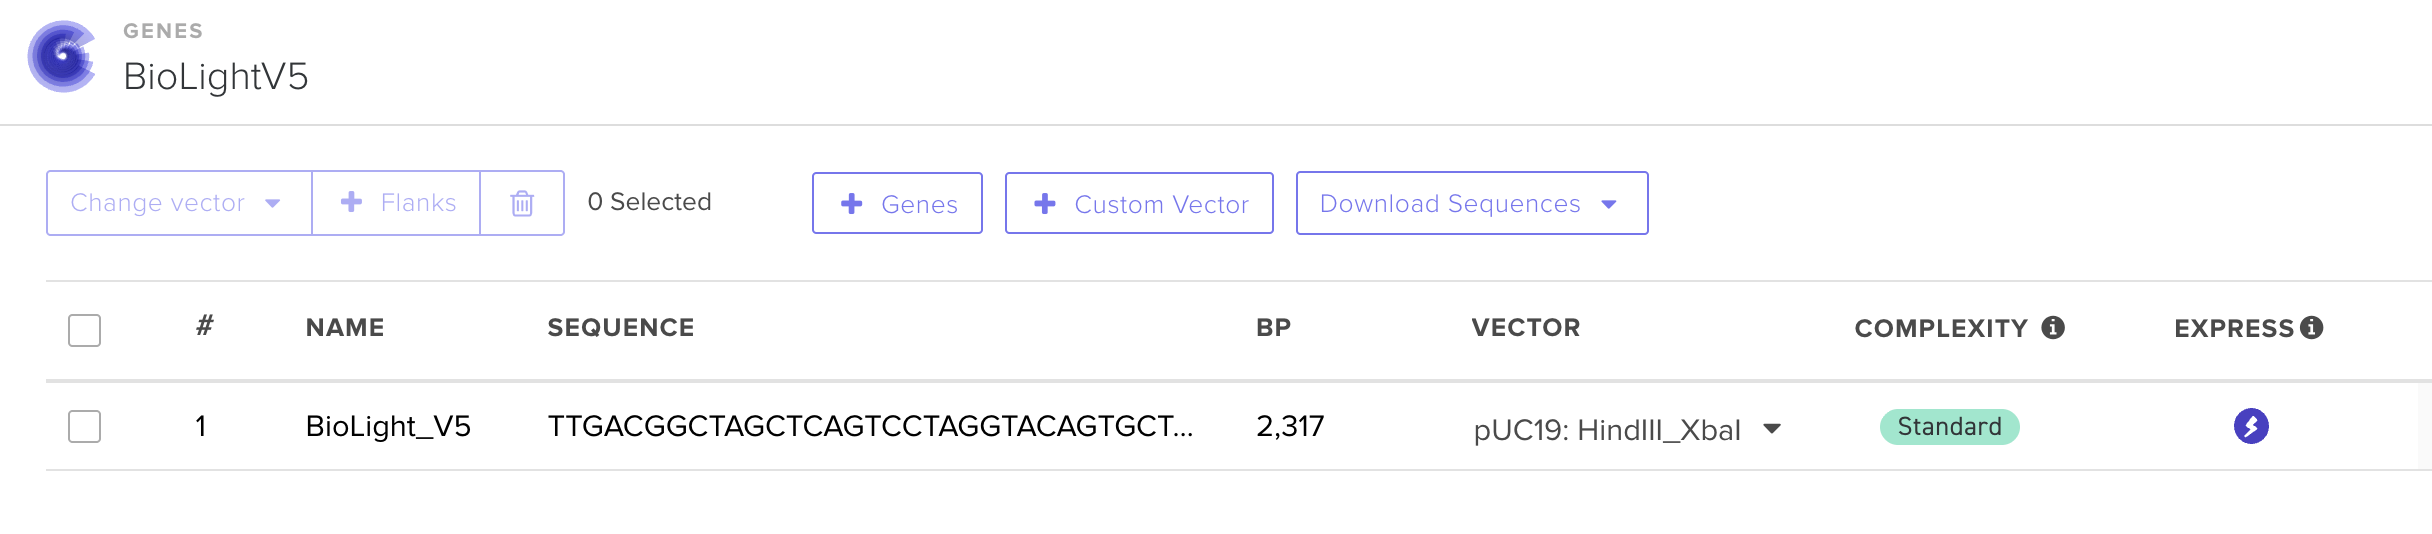
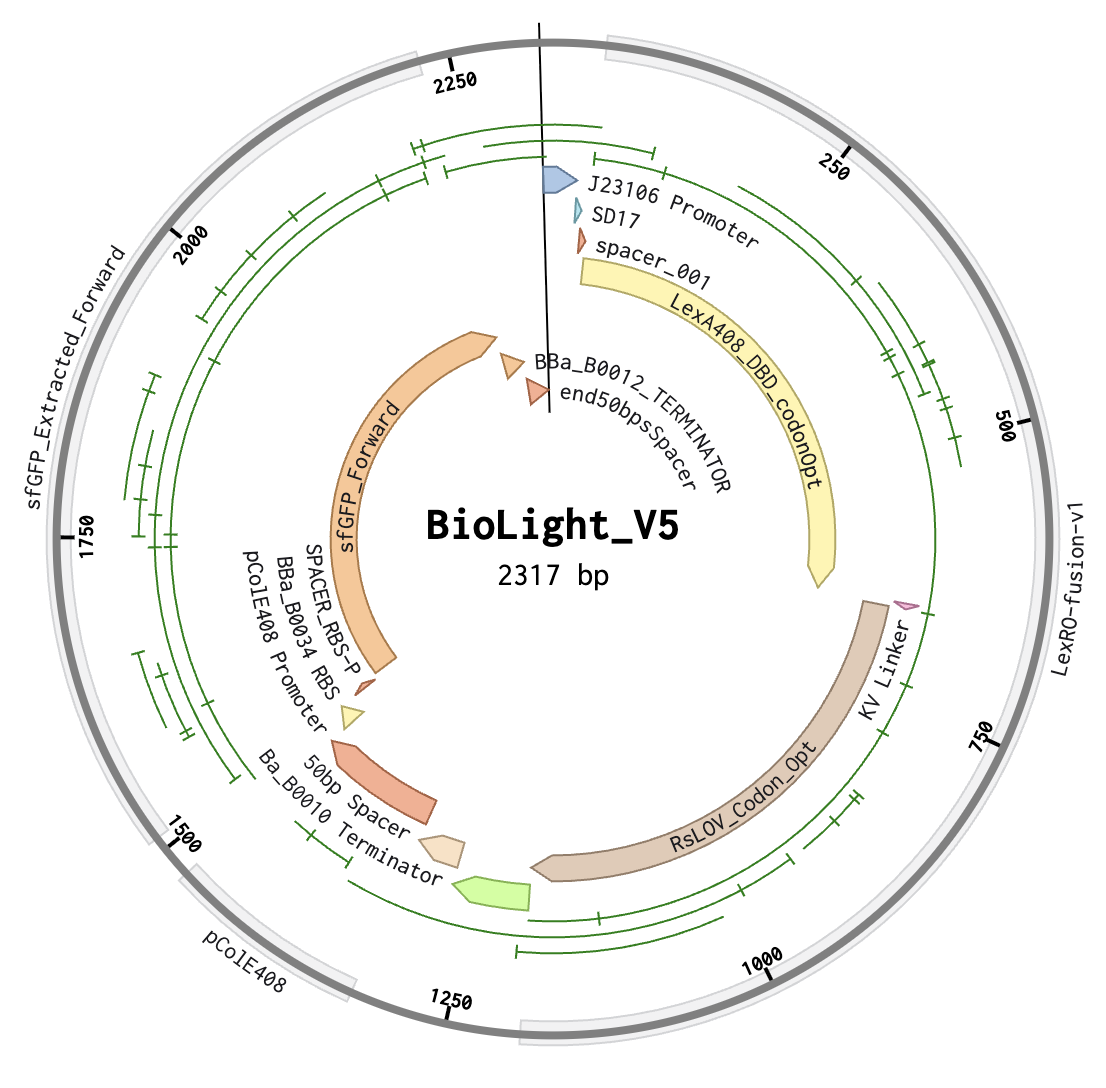
BioLightV5 in Benchling — circular plasmid map showing the eLightOn-derived construct (RsLOV–LexA408 fusion + pColE408 operator + sfGFP) on pUC19 backbone with AmpR selection. Submitted via official HTGAA DNA design form under the Genspace node; reviewed and approved.
Figure 2.1 — BioLightV5 in Benchling
Annotation Table
Range
Annotation
Function
1–35
J23106 Promoter
Anderson family constitutive promoter (iGEM BBa_J23106) driving the LexRO fusion cassette. Validated choice from Li 2020 — its intermediate strength sets steady-state LexRO levels appropriate for the eLightOn dynamic range.
36–42
SD17
Shine-Dalgarno RBS variant from Li 2020 Supplementary Table S1/S3. SD17 is intermediate-strength (vs. weak SD2 / strong SD37), tuned to give the >500-fold ON/OFF ratio reported for eLightOn.
43–50
spacer_001
The AAA-containing spacer added in V5 to fix the SD17→ATG spacing identified as Issue 1. Brings SD core to start codon distance into the optimal 5–10 bp window.
51–656
LexA408_DBD_codonOpt
Part of LexRO Fusion (51–1193). LexA408 DNA-binding domain (mutant LexA recognizing the pColE408 operator, not wild-type LexA operator). N-terminal half of the LexRO fusion. Sequence verified to end in CTG with no internal stop.
657–662
KV Linker
Part of LexRO Fusion (51–1193). Lys-Val peptide linker between LexA408 C-terminus and RsLOV N-terminus. Maintains reading frame and preserves independent folding of the two domains in the LexRO fusion.
663–1193
RsLOV_Codon_Opt
Part of LexRO Fusion (51–1193). RsLOV (Rhodobacter sphaeroides LOV photoreceptor) codon-optimized for E. coli expression, including TGA stop. C-terminal half of the LexRO fusion. In darkness the LexRO dimer occupies pColE408 and represses sfGFP; 470 nm light triggers RsLOV conformational change, dissociating the dimer and derepressing the output cassette.
1191–1193
Stop Codon
TGA stop terminating the LexRO fusion ORF. Confirmed in NCBI ORF Finder as one of exactly two functional ORFs (LexRO 1,143 bp).
1194–1273
BBa_B0010 Terminator
iGEM BBa_B0010 — rrnB T1 transcription terminator from E. coli. Closes Cassette 1, prevents read-through into the intergenic region.
1274–1323
50bp Spacer
V5 replacement for the original 10 bp ACTTGTACGA neutral spacer (Issue 3 fix). 50 bp AT-rich synthetic sequence (ATATAT…) providing optimal intergenic separation between BBa_B0010 and pColE408; verified free of cryptic ATGs, stop codons, RBS-like motifs, and BsaI/BbsI sites.
1324–1475
pColE408 Promoter
Hybrid promoter from Li 2020 — strong ColE promoter combined with the LexA408 operator. Bound and repressed by the LexRO dimer in the dark; derepressed under 470 nm illumination. The light-responsive control point of the circuit.
1476–1501
BBa_B0034 RBS
iGEM BBa_B0034 — well-characterized medium-strength E. coli RBS driving sfGFP translation in Cassette 2.
1502–1509
SPACER_RBS-P
Short spacer restoring BBa_B0034 native ~7 bp spacing to the sfGFP ATG. Required after the V5 Issue 2 fix removed the EcoRI cutsite that previously sat between RBS and start codon.
1510–2226
sfGFP_Forward
Superfolder GFP (717 bp) — the output reporter producing the green fluorescent signal in lit regions. Confirmed as the second of two functional ORFs. EcoRI/XhoI flanking sites that previously bracketed it for modular swapping were removed in V5 to restore RBS spacing; future fluorescent protein swapping will need a different cloning strategy.
2227–2267
BBa_B0012 Terminator
iGEM BBa_B0012 — rrnB T2 transcription terminator. Closes Cassette 2 downstream of sfGFP. Distinct sequence from BBa_B0010, confirmed in V4 Check 4 to avoid direct-repeat flags at Twist.
2268–2317
end50bpsSpacer
Terminal 50 bp neutral AT-rich spacer between Cassette 2 and the pUC19 backbone junction. Mirrors the intergenic 50 bp spacer in design and rationale — provides clean handoff at the backbone boundary.
Aim 2 — Development Aim · Test & Analyze
Aim 2: Development Aim:
Describe the next step that would follow a successful Aim 1, extending the work beyond the scope of this course. This aim should represent a realistic progression of the project, such as executing additional experiments, solving a technical limitation, or developing the system or technology further.
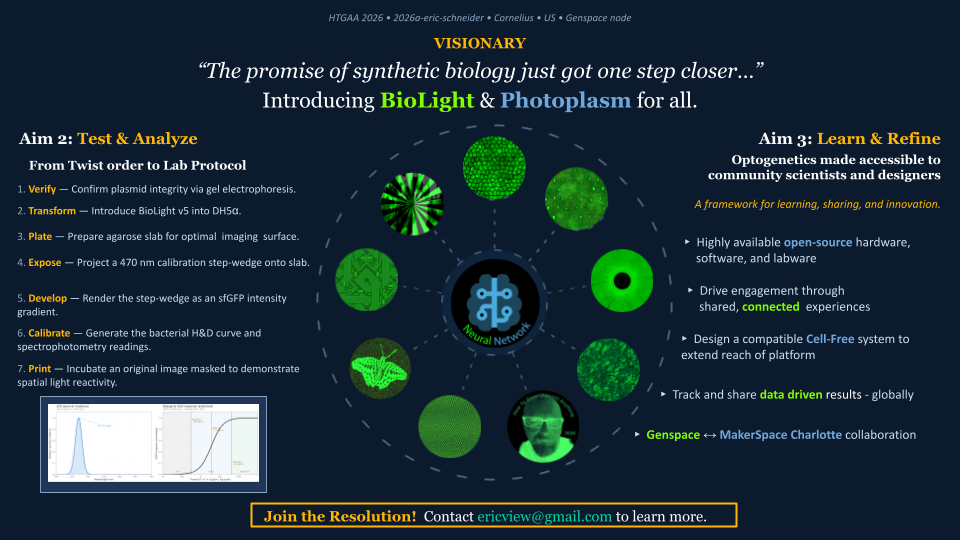
Following a successful Aim 1, the second aim is to test and analyze the integrated BioLightV5 + Photoplasm system through a structured 7-step laboratory protocol that takes the project from Twist gene-synthesis delivery to a fully calibrated, image-producing platform — generating in the process the first published bacterial H&D curve characterizing dose-response between 470 nm exposure and sfGFP expression in living E. coli. This is the realistic next-step progression: Aim 1 produces the construct and the device; Aim 2 turns them into a measurable, repeatable, and open-source accessible imaging system.
The 7-step protocol — from Twist order to lab protocol:
Verify — confirm plasmid transformation integrity via gel electrophoresis and visual colony count
Transform — introduce BioLightV5 into DH5α
Plate — grow a uniform bacterial slab on LB+Amp at 37 °C
Expose — project a 470 nm calibration step-wedge onto the lawn through Photoplasm’s optical system
Develop — render the step-wedge as an sfGFP intensity gradient
Calibrate — generate the bacterial H&D curve and spectrophotometry reading to normalize readings
Print — expose an original image mask to demonstrate spatial light reactivity
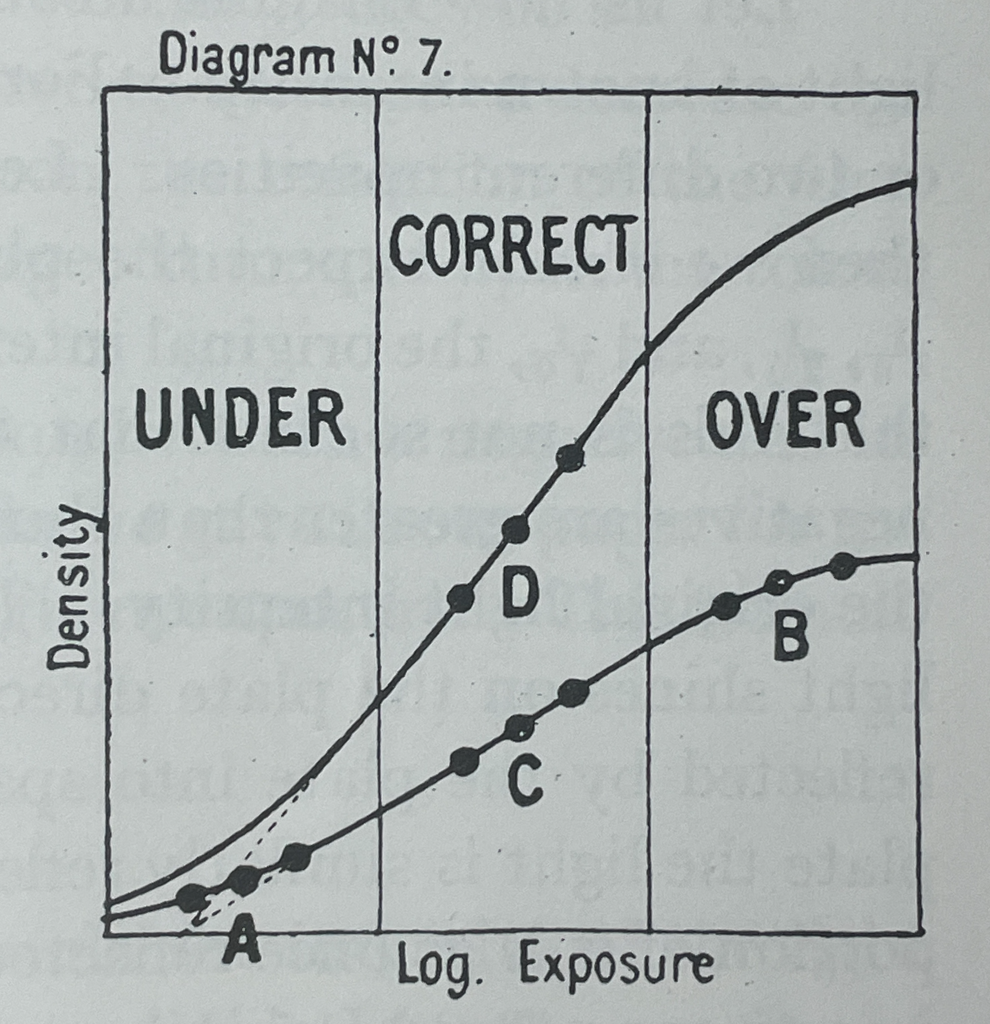
The verb sequence — Verify, Transform, Plate, Expose, Develop, Calibrate, Print — deliberately mirrors the photographic darkroom protocol, anchoring the biology in a vocabulary the participant may already understand. The H&D curve produced in Step 6 is the analytical centerpiece of the project: it transforms BioLight from a demonstration into a data-driven imaging platform with measurable values of a logarithmic curve defined by latitude, toe, linear region, and shoulder.
Hurter & Driffield (H&D) Exposure Curve (1890)
“Photochemical Investigations and a New Method of Determination of the Sensitiveness of Photographic Plates”
Aim 2 deliverables:
A validated 7-step protocol from Twist delivery to first spatial image expressed in sfGFP
See full Genspace wetlab protocol in Section Four: Experimental Design
A bacterial H&D curve characterizing the BioLightV5 dose-response relationship
Spectrophotometry readings establishing the exposure window for reproducible imaging
A printed bacteriograph demonstrating spatial light reactivity through Photoplasm
Capture imaging results through a longpass 515nm filter, which is an emission/viewing filter over a RaspberryPi Camera Module.
Blocks the bright blue excitation LEDs, while allowing the green fluorescence from GFP to pass to camera sensor
Additional Validation:
Measure FMN absorbance peaks at 370 and 450 nm (verify chromophore presence)
Measure with OD600 to determine bacterial cell density (standard for E. coli growth)
Verify plasmid purity (260/280 nm ratio)
Aim 3 — Visionary Aim · Learn & Refine
Aim 3: Visionary Aim:
Describe the long-term vision for the project. Explain how the broader concept could have an impact if fully realized.
Examples include:
Challenging an existing paradigm or clinical practice.
Addressing a major barrier in a field.
Enabling a new experimental capability or research approach.
The long-term vision is to position BioLight as the prototype for a distributed, open-source synthetic biology platform that makes optogenetics accessible to community scientists, designers, and educators — refined through the ongoing collaboration between the MakerSpace Charlotte BioArt Studio and the Genspace community wetlab. If fully realized, this concept reframes synthetic biology as a participatory technology, much as photography became a participatory medium in the late 19th century.
Broader impact if fully realized:
The Genspace ↔ MakerSpace Charlotte collaboration is itself the prototype of the distribution model. If protocols, plasmids, hardware files, and educational frameworks flow openly between two nodes, the same architecture scales to multiple community labs, exponentially.As the platform expands, a CFPS variant of BioLightV5 — manufactured via Ginkgo Bioworks’ cloud-lab service — becomes the natural high-availability consumable, removing biocontainment and cold-chain barriers that limit live-organism distribution. This is the Eastman/Kodak step: standardized, mass-produced biological consumables paired with an open, well-documented device.The broader impact is the creation of a participatory biological literacy at the moment when synthetic biology is becoming a general-purpose technology — equipping designers, educators, and citizen scientists to engage with the field while it is still being shaped, rather than after the fact.BioLight challenges the existing paradigm that the boundary between professional researcher and citizen practitioner is fixed — proposing that well-engineered tools, similar to Eastman’s standardized film, Kodak’s camera systems, and the advantage of cloud based neural networks, can close the gap from discovery to innovation - with emphasis on shared protocols.
Aim 3 deliverables:
A documented Genspace ↔ MakerSpace Charlotte collaboration framework — protocol exchange, hardware files, educational pathways
An open-source and attributed release of BioLightV5 as a cell free protein system, Photoplasm hardware (CAD, BOM, firmware), and documentation under an MIT-style license
A roadmap for CFPS distribution via Ginkgo Bioworks as the high-availability expansion path
A measurement framework for tracking adoption across community nodes — the “Join the Resolution” tagline made operational
Section Three - Background & Literature
Author: Eric Schneider · 2026a-eric-schneider
Node: Genspace NYC
Affiliation: BioArt Studio, MakerSpace Charlotte
Q1 — Citation Summaries
Briefly summarize two peer-reviewed research citations relevant to your research (minimum four sentences).
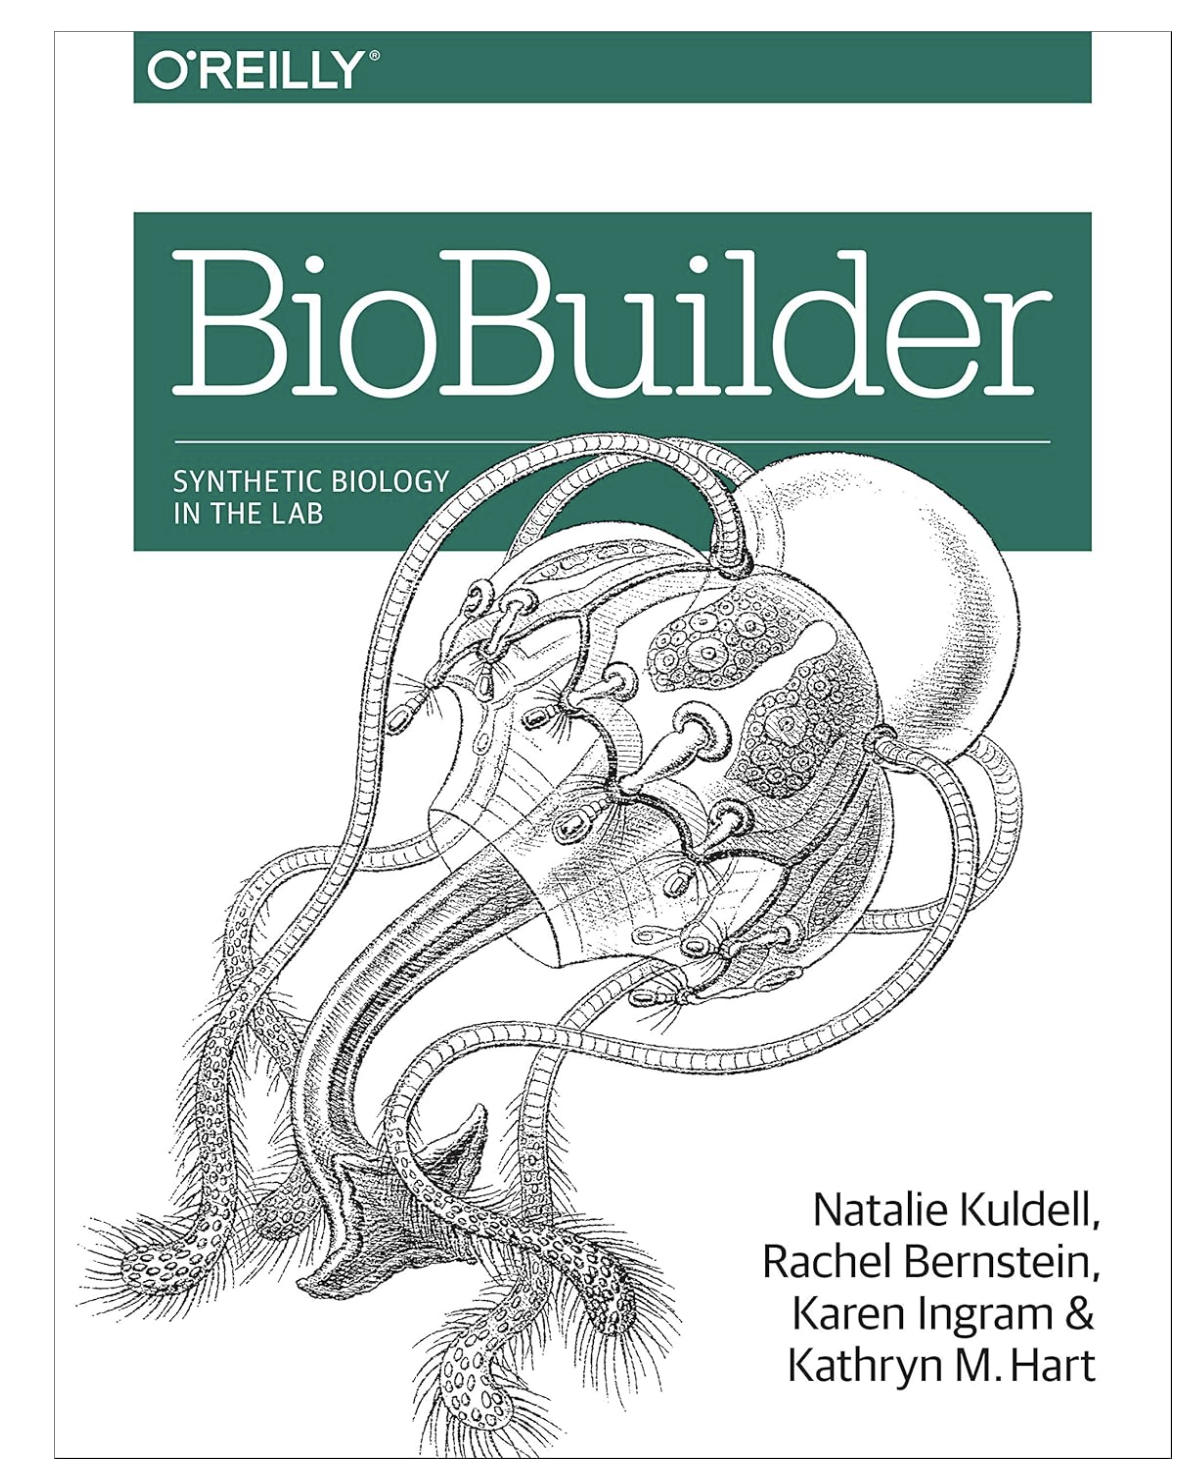
I first experienced bacterial BioArt at MakerSpace Charlotte during a demonstration by Karen Ingram, scientific illustrator and co-author of BioBuilder,¹ where fluorescent proteins were being transcribed into colorful cells in agar using hand-drawn patterns and OpenTrons microliter pipettes. As a photographer, I asked the fundamental question: what is the resolution? That question started the entire journey into HTGAA and the scientific literature that followed.
BioBuilder
I quickly found Levskaya et al. 2005² — Engineering Escherichia coli to see light — the paper that demonstrated a complete bacterial photography system in which E. coli was engineered with a chimeric photoreceptor (Cph8) to respond to red light, producing spatially patterned gene expression across a plate with a resolution of approximately 100 megapixels per square inch. The Levskaya paper answered my resolution question empirically: the biological limit of the system was not optical, but cellular — the size of the bacteria itself. What it did not answer was the tonal question. The Levskaya system was binary — fully on in the light, fully off in the dark — producing sharp edges but no continuous grayscale gradation. For a photographer, that is the equivalent of a lithographic system, not a photographic one.
The paper that changed the trajectory of the project was Li et al. 2020,³ A single-component light sensor system allows highly tunable and direct activation of gene expression in bacterial cells — the eLightOn system. eLightOn uses a fusion of the RsLOV photoreceptor from Rhodobacter sphaeroides with a LexA408 DNA-binding domain to create a single-component, single-plasmid optogenetic switch with a reported ON/OFF dynamic range exceeding 500-fold under blue light activation at approximately 470 nm. That dynamic range — the biological equivalent of a photographic characteristic curve with a measurable toe, linear region, and shoulder — is what makes continuous-tone bacteriographic imaging a plausible scientific goal rather than a theoretical aspiration. The eLightOn system uses FMN as its chromophore, which is produced endogenously by E. coli, requiring no external cofactor supplementation. It fits within the 5 kbp synthesis limit for a single Twist Biosciences clonal gene order. And it had not, at the time of this project’s inception, been applied to spatially patterned photographic image production — which is the gap BioLight and Photoplasm are designed to fill.
Q2 — Novelty
Explain the novelty of your project (minimum three sentences). What makes it different from or an improvement upon existing work in the field?
The novelty of BioLight begins with a reframe: the darkroom enlarger is not a photography instrument — it is a precision optical projector capable of delivering spatially resolved, calibrated light at a defined wavelength to any photosensitive substrate placed at its focal plane. That substrate does not have to be silver halide paper. It can be a bacterial lawn embedded in an agarose slab, expressing a light-responsive genetic circuit that responds to blue photons the way a silver halide crystal responds to visible light. The traditional darkroom instrument is ideal for modification; the substrate is what changes to replace photographic paper.
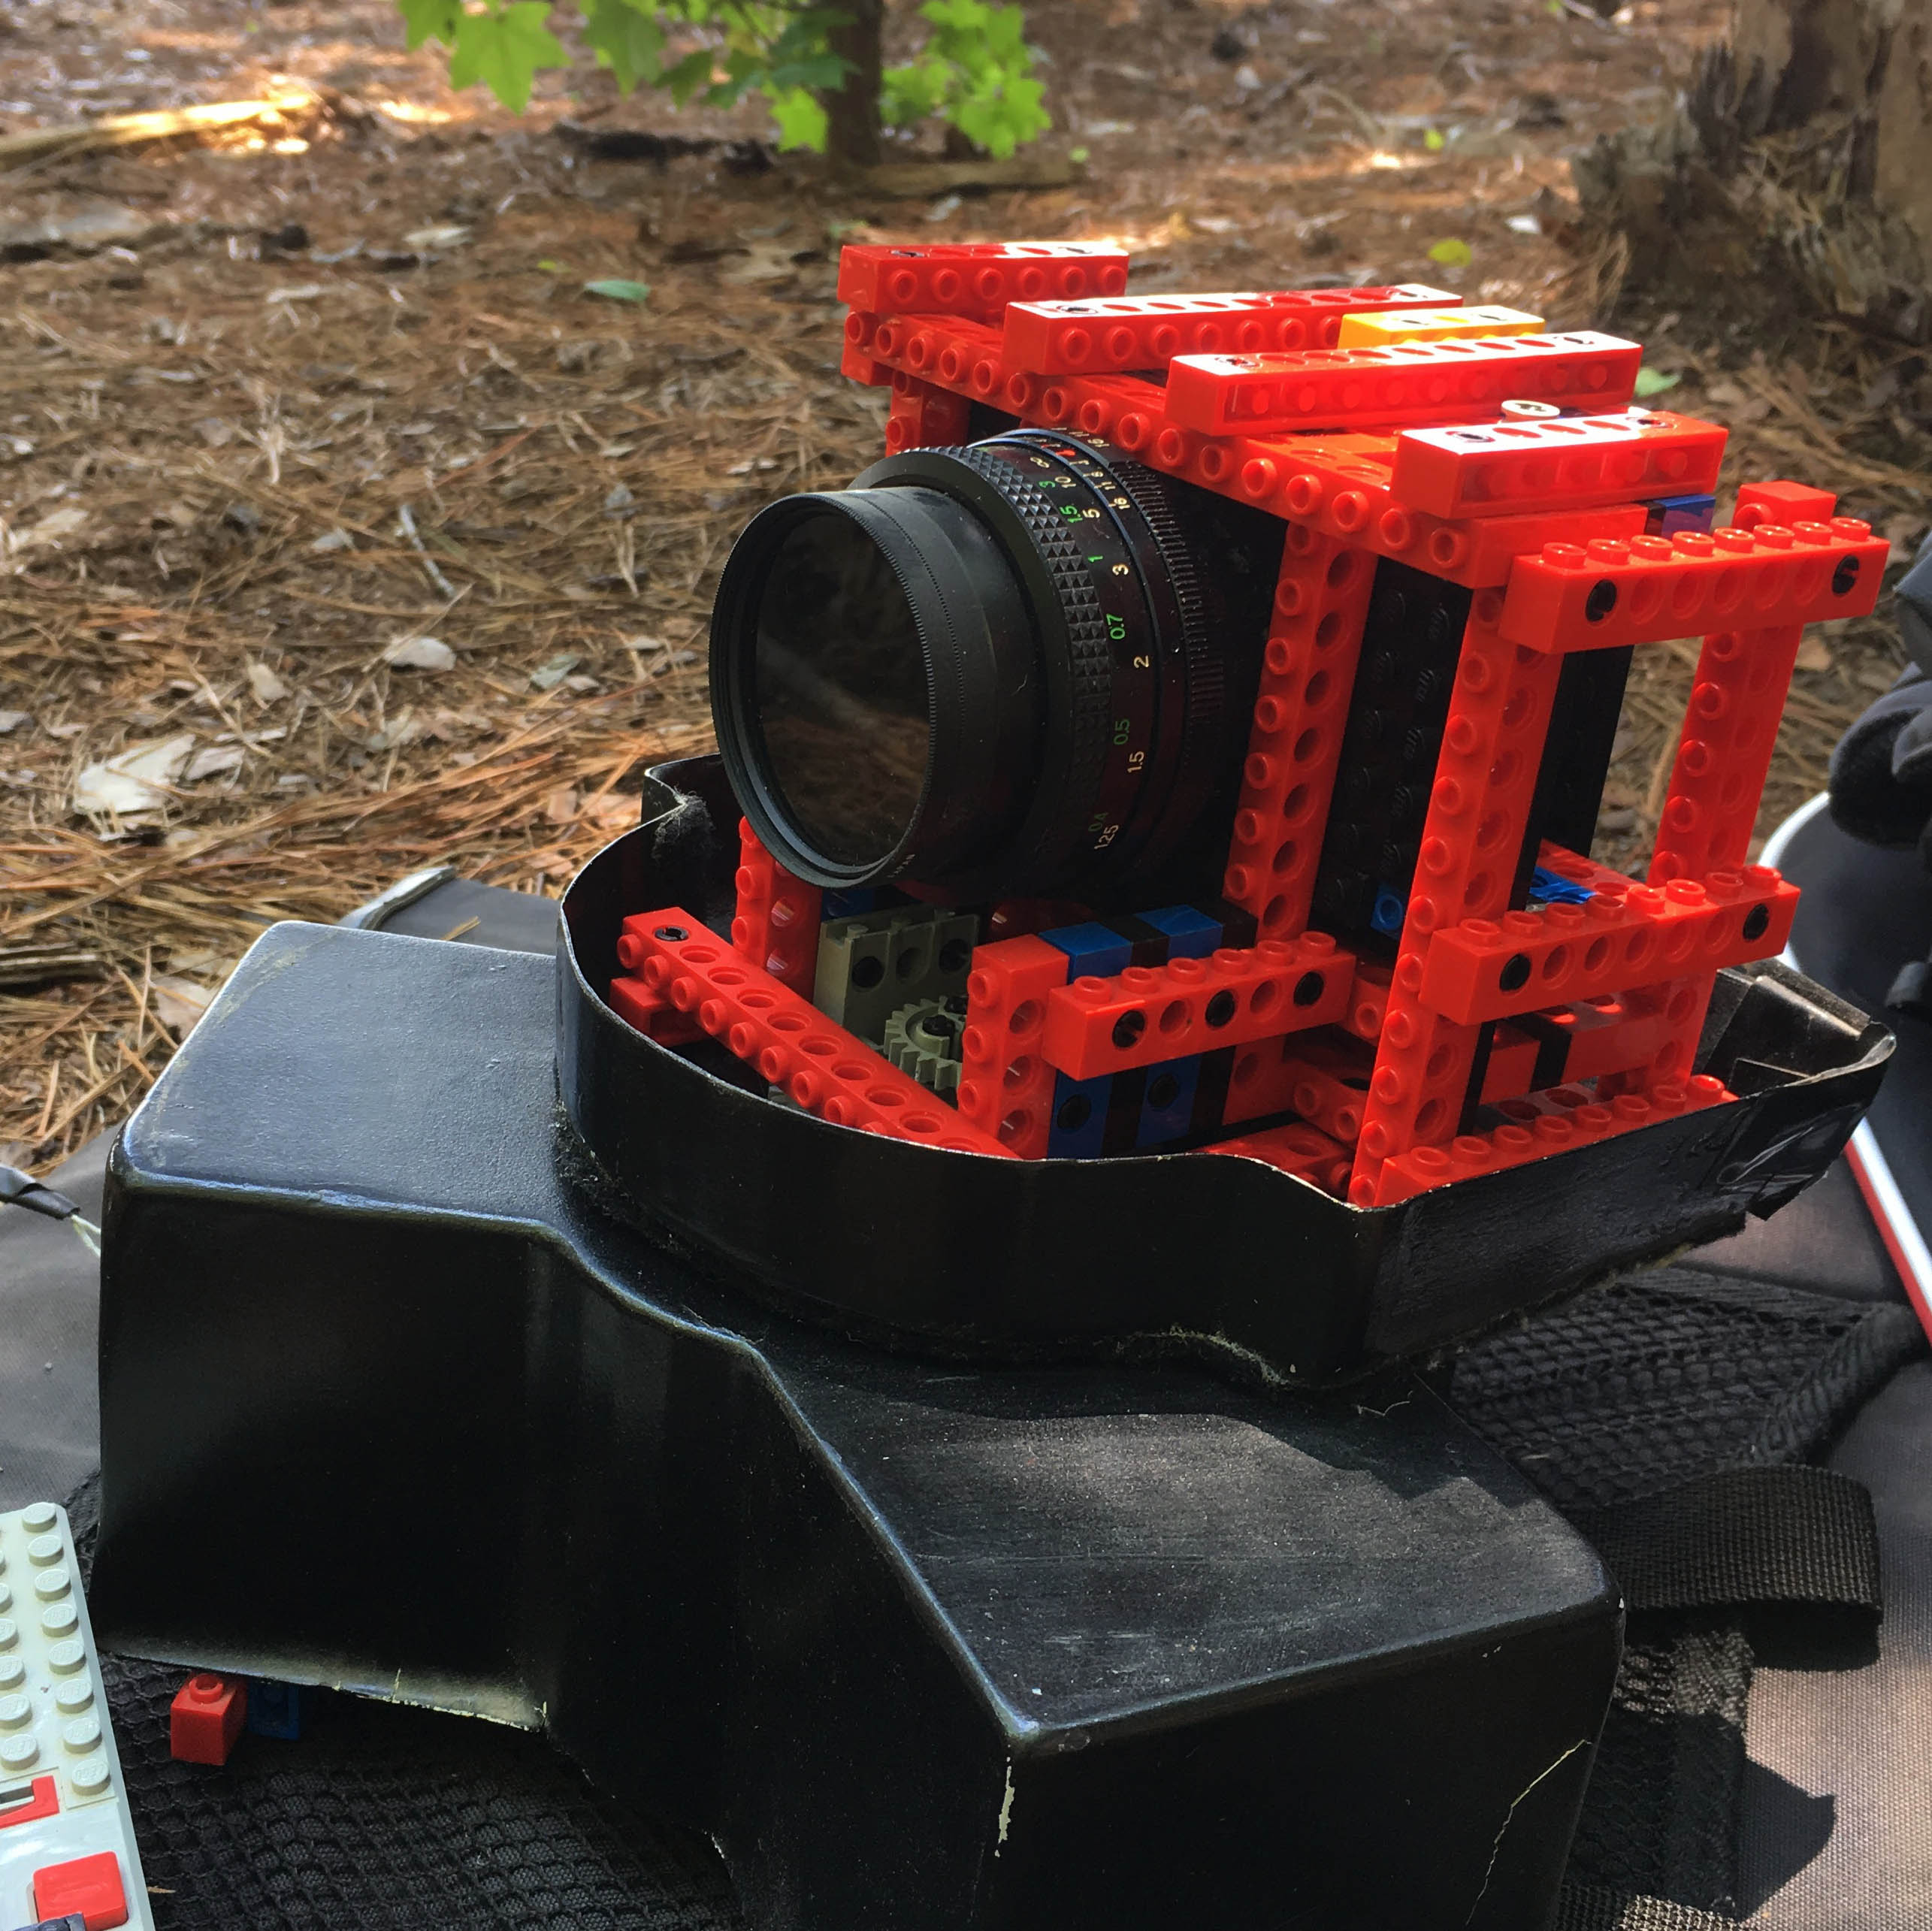
My background is specific and relevant here. I have been a working photographer and photographic chemist for over forty years — I processed film for Time Inc. publications from 1987 to 1990 in the NYC Color Photo Lab, at mass-media publishing scale. During the analog-to-digital transformation of the photography industry, I learned to operate the Kodak Light Valve Technology (LVT) digitial-to-film printer and high-resolution film-to-digital drum scanners . I even built a panoramic film camera out of Lego bricks as my industrial design Master’s Degree thesis project at North Carolina State University.
Lego-based Panoramic Camera by Eric Schneider
I understand sensitometry — the H&D characteristic curve, the Zone System, the relationship between exposure and density — not as abstract science but as craft knowledge applied in darkrooms and imaging labs. When I look at the eLightOn dynamic range specification, I see a film emulsion with a measured contrast index. When I designed the Photoplasm device, I imagined an enlarger with a programmable negative.⁴
Three specific novelties distinguish BioLight from the existing bacterial photography literature. First, modularity: the Photoplasm device is designed as a stackable, component-based instrument whose throw distance, aperture, and mask format can be reconfigured for different plate geometries and biosensor substrates — extending the fixed-geometry flood illumination approach of the Levskaya and Tabor experiments into a variable, calibrated optical platform. Second, openness: every component is released under an MIT-style open-source license with full version-controlled documentation, inviting the kind of iterative community improvement that made the Arduino ecosystem what it is. Third, substrate independence: the optical stack does not presuppose any particular biosensor circuit — it delivers 470 nm light through a digital image mask, and any optogenetically responsive chassis that activates under blue light can be placed at the focal plane. As the Photoplasm platform matures toward full RGB capability, that substrate independence will extend across wavelengths, opening the system to the full diversity of characterized optogenetic tools in the synthetic biology database.
Q3 — Impact
Explain the impact of your project (minimum five sentences). Why does it matter? Who does it benefit?
Astro Teller, Captain of Moonshots at X (formerly Google X), has observed that today is the slowest rate of change we will ever experience.⁵ The convergence of artificial intelligence, accessible fabrication tools, and open-source biological parts registries is creating conditions in which community makerspaces and university laboratories alike can become meaningful nodes in the synthetic biology ecosystem — each contributing distinct capabilities, and each made stronger by collaboration with the other. BioLight and Photoplasm are designed specifically for that moment.
The direct beneficiaries are what Gartner Research has called citizen bioscientists⁶ — people with domain expertise in adjacent fields (design, photography, engineering, education, medicine) who are entering the biological sciences through community labs, accelerator programs, and initiatives like HTGAA. These participants bring non-standard perspectives that complement and enrich the formal research community. A photographer who asks “what is the resolution?” is asking a different question than a molecular biologist who asks “what is the fold-change?” Both questions are scientifically valid; both produce useful data. The Photoplasm platform is designed to make the photographer’s question answerable in a BSL-1 community wetlab setting with accessible, affordable tools.
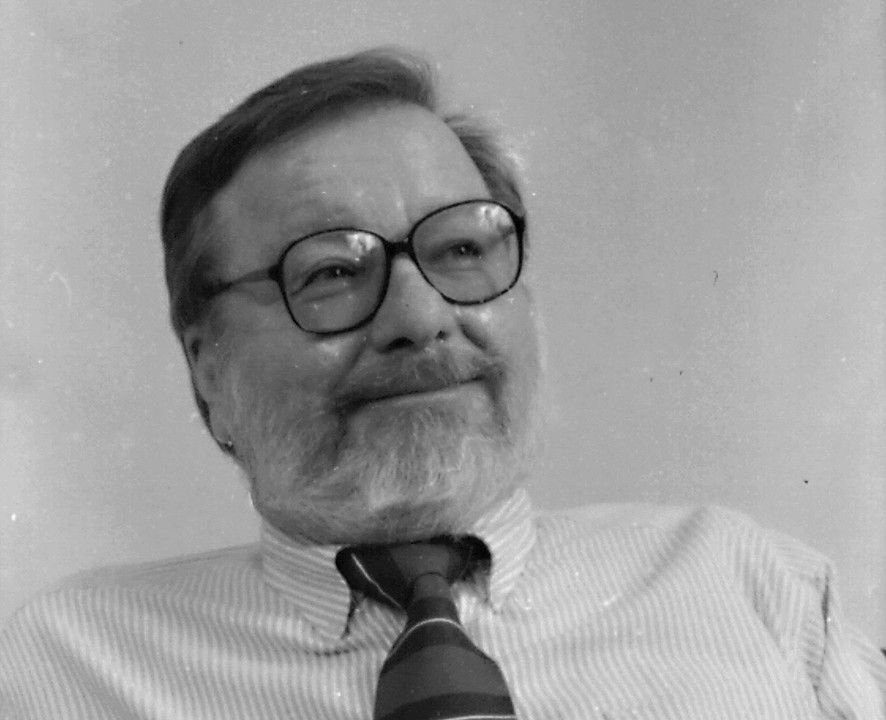
The design philosophy of BioLight and Photoplasm draws explicitly on Universal Design principles, first articulated by Ron Mace at North Carolina State University.⁷ Mace’s central insight — that designs optimized for users at the margins of capability tend to work better for everyone — applies directly to community biology tools. A device that can be built, calibrated, and operated by a designer with no prior wetlab experience, following open-source documentation, is a device that will also work reliably in the hands of an experienced molecular biologist. Accessibility is not a constraint on rigor; it is a design specification that produces more robust and reproducible tools.
*Ron Mace (1940-1998) - Visonary of “Universal Design” (Tribute to a friend, colleauge and Mentor from 1996-1998)
The partnership between Genspace (Brooklyn, NY) and MakerSpace Charlotte is not incidental to BioLight — it is the proof-of-concept for the distribution model Aim 3 proposes to scale. Genspace provides certified BSL-1 infrastructure, institutional knowledge, and the HTGAA Node authorization framework. MakerSpace Charlotte provides fabrication capability, community design culture, and a student population drawn from manufacturing, industrial design, and biotech industry backgrounds. Together they demonstrate that the Photoplasm platform can operate across two geographically distributed sites with different institutional profiles — which is exactly what a national or international distribution network would require. Fun matters too: a biological imaging platform that produces gallery-ready bacteriographs — art objects made from living organisms expressing fluorescent proteins — creates an entry point into synthetic biology that no textbook or lecture can replicate.
Q4 — Ethics
Describe the ethical considerations relevant to your project (minimum two paragraphs).
The ethical framework for BioLight is drawn from the governance principles introduced in HTGAA Week 1, applied specifically to the context of community makerspace synthetic biology. The four bioethics principles — Beneficence, Non-maleficence, Justice, and Responsibility — map directly onto the three aims of this project. Beneficence is expressed through the open-source learning and making ethos of the platform: every protocol, hardware design, and calibration dataset is released publicly with the explicit goal of enabling others to replicate, extend, and improve the work. Non-maleficence is expressed through the BSL-1 containment framework: BioLightV5 uses DH5α E. coli with ampicillin selection, a strain and antibiotic combination with no pathogenic potential and no environmental persistence beyond standard autoclave disposal. Justice is expressed through the Universal Design commitment: the platform is specifically engineered to be accessible to participants without prior wetlab experience, lowering the barrier to meaningful synthetic biology practice. Responsibility is expressed through the open-source governance model: MIT licensing, version-controlled public repositories, and a commitment to documenting not just what works but what failed and why.
The primary ethical risk in BioLight is not biosafety — it is intellectual property and data governance. As the Photoplasm platform scales toward a distributed network of connected devices running optogenetic experiments and reporting results to a shared data model, questions of data ownership, attribution, and dual-use screening become real. The current approach addresses these risks in three ways. First, all primary wetlab work occurs at Genspace under their certified BSL-1 protocols and institutional oversight — no biological work is conducted at MakerSpace Charlotte until the HTGAA Node authorization pathway is complete. Second, all DNA synthesis passes through Twist Biosciences’ standard screening pipeline, which includes dual-use sequence review. Third, the Aim 3 data model — similar to a Transfyr.ai observational learning analytics integration — is designed to capture experimental outcomes and learner engagement data, and raw sequence data or unpublished results, minimizing the surface area for misuse. The device itself is inert and substrate-independent: the Photoplasm hardware delivers light, not biology, and has no inherent dual-use concern independent of the biological substrate placed at its focal plane.⁸ ⁹
Another potential risk worth exploring in scientific methodology, is the bias and influence of Ai models on engineering and design. What is the risk to snynthetic biology if erroneous assumptions and generative claims are accepted as fundamental truth? There are certainly rewards gained through trained data sets and accelerated data access. I have experienced the positive and negative implications of an artifical agent in the flow of design work, and we are still at the beginning of our interactive technology journey with artificial intelligence. I will continue to cautiously embrace Ai as a tool, for the purpose of acclerating and improving outcomes.
Footnotes
¹ Kuldell N, Bernstein R, Ingram K, Hart KM. BioBuilder: Synthetic Biology in the Lab. O’Reilly Media (2015). ISBN 978-1491904299.
² Levskaya A et al. Engineering Escherichia coli to see light. Nature 438:441–442 (2005). doi:10.1038/nature04405
³ Li Y et al. A single-component light sensor system allows highly tunable and direct activation of gene expression in bacterial cells. Nucleic Acids Research 48(6):e33 (2020). doi:10.1093/nar/gkaa044
⁴ Eric Schneider, personal statement — industrial design thesis, North Carolina State University; Time Inc. Color Lab photographic processing 1987–1990.
⁵ Teller E, quoted in Friedman TL. Thank You for Being Late. Farrar, Straus and Giroux (2016).
Author: Eric Schneider · 2026a-eric-schneider
Node: Genspace NYC
Affiliation: BioArt Studio, MakerSpace Charlotte
Form Prompt
Create a detailed experimental plan for your final project. Include a timeline for each part of your experimental plan (i.e., how long you would expect each step in your final project to take). (min. 15 lines/sentences — a numbered list is acceptable). Include specific methods/tools/technologies/biological concepts for each part of the final project and analysis. For each experiment and/or analysis, include a description of your expected results. If possible, include figure(s) that visually shows a broad workflow of your project or a specific aspect of your experimental plan.
Opening
The BioLight experimental plan follows a Design → Build → Test → Analyze framework — organized across three HTGAA aim phases: Aim 1 — Design & Build (Experimental), which establishes the biological construct and the Photoplasm hardware platform; Aim 2 — Test & Analyze (Development), which executes the full seven-stage wet-lab protocol from transformation through calibrated image exposure and bacterial H&D curve generation; and Aim 3 — Learn & Refine (Visionary), which extends the platform into open-source community distribution and cell-free biomanufacturing at scale.
The design phase of Aim 1 is essentially complete: BioLightV5 has been assembled in Benchling, validated through Asimov Kernel circuit logic, modeled in AlphaFold and ChimeraX, and ordered as a clonal gene from Twist Biosciences. The hardware build is running in parallel at my design studio and MakerSpace Charlotte — all Photoplasm physical parts are designed in Fusion 360 and printed in PETG on a Bambu X1 Carbon, with a full parts guide found in the Supplemental Information section.
All wet-lab work is conducted at Genspace (Brooklyn, NY), my assigned HTGAA Node and certified BSL-1 wetlab partner for this project. A complete fallback plan using pDawn-sfGFP (Addgene #107741) is documented and ready to activate if BioLightV5 sequence verification fails or exposure produces no usable bacteriograph after multiple attempts.
What you will find in this section:
Part A — Detailed Experimental Plan — a 17-step numbered timeline organized across the Aim 1 Design & Build and Aim 2 Test & Analyze phases, including the full Aim 2 — Test & Analyze (Development) seven-stage protocol (verify → transform → plate → expose → develop → calibrate → print) and the Minimum Viable Functional Validation (MVFV) blue light induction test that gates entry into image exposure work
Part B — Techniques Checklist — 19 techniques checked from the HTGAA form list, each annotated with its role in the project
Part C — Protocol Design — the single Aim 2 — Test & Analyze (Development) protocol, comprising two sequential blue light tests: a simple test-tube induction validation confirming construct function post-transformation, followed by full Photoplasm step-wedge calibration
Part D — Industry Council Companies — three primary partners each with a specific project role across the three aims, plus supporting partners
Part E — Workflow Figures — visual illustrations of the Aim 2 protocol and the BioLightV5 non-linear design network
Appendix — Standalone markdown protocol documents written for direct bench use at Genspace
The full step-by-step protocols are maintained as standalone documents and referenced throughout; what follows is the high-level experimental plan.
*Gannt chart: Aim 1, Aim 2, Aim 3 - 5/19/2026
Part A — Detailed Experimental Plan
All initial dates are anchored to Twist BioLightV5 delivery on or before May 27, 2026, and Genspace Safety Training and Orientation on May 28, 2026 — a fixed date independent of Twist delivery status. Actual dates may shift based on confirmed order and delivery; the structure and format of the protocol remains intact.
Aim 1A — Design & Build (Experimental) · Design
1. BioLightV5 plasmid design in Benchling(complete, ~3 weeks elapsed)
Asimov Kernel circuit logic → Benchling sequence assembly (pUC19 backbone, RsLOV–LexA408 fusion, sfGFP reporter, pColE408 operator, SD17 RBS, two distinct terminator sequences) → AlphaFold structural prediction → ChimeraX visualization of dark-state PDB 4HJ4 dimer and light-state monomer.
Expected result: passing all four Benchling quality checks before Twist submission.
2. Twist Biosciences clonal gene order placed(order pending)
BioLightV5 submitted as a single clonal gene under the 5 kbp synthesis limit. Target delivery on or before May 27, 2026.
Expected result: lyophilized DNA aliquot with full sequence verification report.
3. pDawn-sfGFP control ordered from Addgene(Order pending)
Addgene #107741 (Riedel-Kruse Lab, PNAS 2018) ordered as bacterial stab. Ready-to-use fallback if BioLightV5 sequence fails.
Expected result: A viable living-cell bacterial transformation of BioLightV5, ready for use in Photoplasm device experiments.
See Section Two - Aims for illustrated pipeline
Aim 1B — Design & Build (Experimental) · Build
Photoplasm device prototype: Fabrication & Documentation (Aim 1B completing by May 27)
3D-Printed Modular Components designed in Fusion 360 and printed in PETG on Bambu X1 Carbon at my design studio and MakerSpace Charlotte.
Parts include: dark chamber frustum cone (150 mm height, 51 mm ID top, 150 mm OD base), stackable spacer rings (~100 mm each, adjusting throw distance 6–12 inches), LED light Ring mount, OLED digital image carrier, bacterial plate holder, and plate heater with heat sensor.
Electronics: Raspberry Pi 5, 470 nm LED light ring, PWM/MOSFET driver (IRLZ44N, GPIO18 control), light collimator, OLED digital image mask for variable density projection, focusing lens, AS7341 spectral sensor, Raspberry Pi Camera Module.
Expected result: a calibrated, light-tight imaging platform with documented optical stack.
Full build sequece documented in Photoplasm Quick Start Guide
Aim 2 — Test & Analyze (Development)
The Aim 2 protocol begins on Twist plasmid receipt and Genspace orientation. Two blue light tests gate the path from transformation to image exposure: first a simple test-tube MVFV induction validation, then full Photoplasm step-wedge calibration. All wet-lab work is conducted under Genspace BSL-1 protocols only.
5. Genspace Safety Training and Orientation — Lab Block A(May 28, fixed, ~6 hours)
Site orientation, BSL-1 safety review, materials check-in, equipment familiarization, lab notebook initialization. Proceeds regardless of Twist delivery status.
Expected result: cleared to begin wet-lab work May 29.
6. P1 — Verify: plasmid receipt and gel verification(May 29, ~2 hours)
Resuspend Twist DNA aliquot, confirm sequence report, run confirmation gel.
Expected result: clean band, sequence-verified BioLightV5 ready for transformation.
7. P2 — Transform: DH5α transformation(May 29–30, ~2.5 hours active + 16 h overnight)
Heat-shock transformation of DH5α competent cells with BioLightV5, recovery in SOC, plate on LB+Amp. All handling under red safelight to prevent leaky expression.
Expected result: 10+ AmpR colonies after 16 h at 37°C in darkness.
8. P3 — Plate: colony picking, miniprep, and stock banking(May 30 – June 1, ~4 hours active + 16 h overnight culture)
Pick colonies, grow overnight in LB+Amp in darkness, miniprep, glycerol stock banking at −80°C.
Expected result: at least one sequence-verified working stock.
9. Blue Light Test 1 — Minimum Viable Functional Validation (MVFV)(June 1, ~2 hours — critical gate P3.6-G)
Two culture tubes prepared from verified stock: one exposed to bench-top 470 nm source, one held in darkness. sfGFP emission confirmed visually. No Photoplasm device required — intentionally minimal, confirming construct function independently of hardware. This is the primary go/no-go gate for Aim 2 — Test & Analyze (Development) image exposure work.Expected result: measurable fluorescence in light tube, minimal signal in dark control. Failure triggers pDawn-sfGFP backup protocol; the June 2–21 hold window provides recovery time.
10. Hold window — device pre-work and sequencing convergence(June 2–21, ~3 weeks)
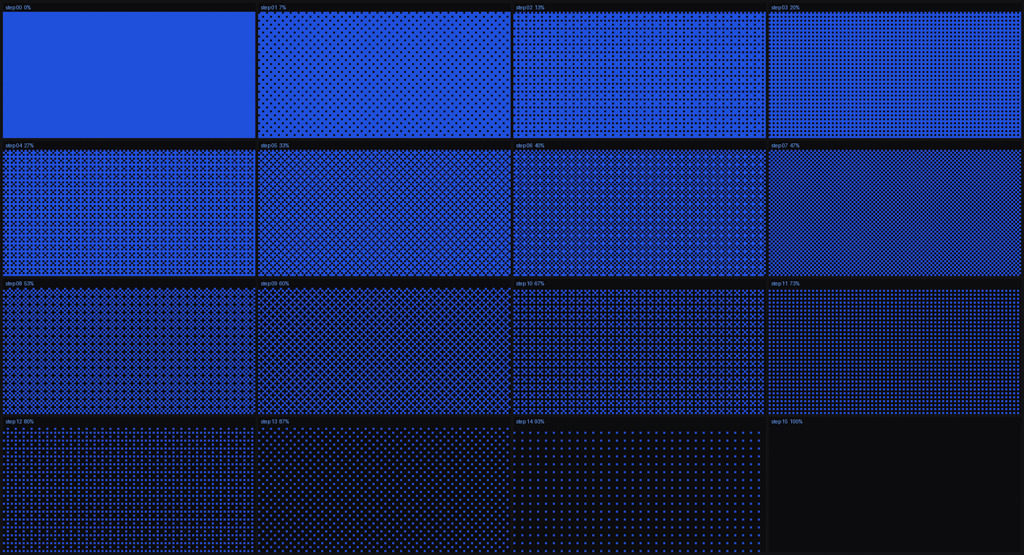
Verified glycerol stocks held at −80°C. Photoplasm device pre-work completes: Cree LED irradiance gate cleared (≥100 µW/cm² at substrate plane), 16-step Bayer dither step-wedge calibration run, minimum effective dose (MED) and exposure window established.
Expected result: device validated, exposure parameters locked, working stock confirmed and ready for Lab Block B.
11. Genspace Lab Block B — P4: agarose slab casting(June 22, ~3 hours active + 16 h pre-incubation)
Following Aim2_Protocol_AgaroseSlab.md: measure overnight OD₆₀₀, temper low-melt agarose to 42–45°C, mix cells into molten agarose, cast thin uniform slab in 90 mm dish, pre-incubate in darkness.
Expected result: uniform photosensitive substrate analogous to a silver-halide-in-gelatin emulsion.
12. Blue Light Test 2 — P5: Photoplasm step-wedge calibration and image exposure(June 23, ~0.5 hours active + 4–8 hours exposure)
With construct function confirmed by MVFV, the full Photoplasm device is engaged.
Visual Guide to Calibration Cycles
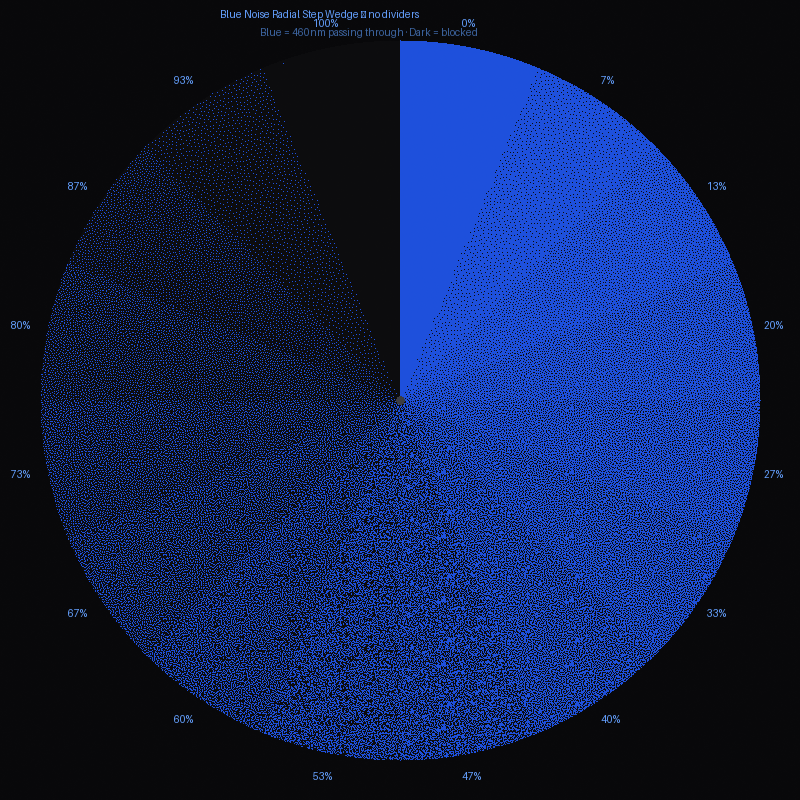
Project 16-step Bayer dither calibration target through OLED digital image mask at calibrated 470 nm irradiance and predicted F/8 aperture setting, to establish wavelength and illumination values.
Insert agarose slab with bacterial lawn into plate holder and place under dark chamber
Start timed exposure duty cycle dosing — dark growth, blue light dose, dark recovery, repeat — prevents over-expression and metabolic exhaustion across the 24-hour exposure window.
Three planned experimental exposures:
(a) Circular step-wedge for calibrating to H&D curve
(b) Siemens Star Pattern for resolution and focus test measurement.
(c) One original continuous tone image mask for the 12-piece Photoplasm Art Gallery series.
Experimental Aim: Raspberry Pi Camera Module provides real-time machine vision feedback during each duty cycle, feeding image data into a self-correction algorithm that adjusts subsequent dose parameters based on observed expression response.
Expected result: spatially patterned sfGFP expression confirmed at exposure completion.
13. P6 — Develop: post-exposure incubation and imaging(June 23–25, ~3 hours active + 4–16 h development)
Post-exposure incubation in darkness at 37°C to allow sfGFP expression. Image under 470 nm transilluminator with 515 nm long-pass filter; AS7341 sensor captures fluorescence across 510–530 nm sfGFP emission window. Photograph plates for archival record.
Expected result: measurable bacteriograph with spatially resolved sfGFP intensity gradient.
14. P7 — Calibrate & Print: bacterial H&D curve generation(June 25, ~4 hours analysis)
Export AS7341 time-series CSV. Plot fluorescence vs. logarithmic light exposure for the step-wedge. Document toe, linear, and shoulder regions following Zone System sensitometric conventions.
Expected result: a calibrated bacterial H&D curve — the central Aim 2 — Test & Analyze (Development) deliverable — characterizing BioLightV5 as a photographic substrate.
15. Documentation, open-source release, and Aim 3 handoff(ongoing)
GitHub Repository for Photoplasm to be published with all four protocols, hardware specifications, device firmware, Photoplasm Art Gallery exhibition framework, and observational data schema in the style of Transfyre.ai. My instructional design methodology includes experiential learning activities. Repository to be released under MIT open-source license via GitHub repository.
Genspace Community Project ↔ MakerSpace Charlotte collaborative build workshop scheduled as the Aim 3 distribution proof-of-concept. Machine vision self-correction data archive to be created as the foundational training dataset for the Aim 3 fleet-level neural network.
Expected result: fully documented open-source platform ready for community replication.
At this time of this submittal, there are several HTGAA2026 colleagues interested in participating in a global expansion of the Photoplasm device initiative, as a cohort and individually. This is a very exciting prospect to demonstate the open-source and open-innovation pipeline, with a concept of a museum-grade “Photoplasm Art Exhibition” of experimental image exposures. A show that can be printed as fine art and travel the globe , with an online and printed publication. (5/23/26)
Decision Points and Fallbacks
MVFV gate (step 9, June 1): Failure triggers pDawn backup protocol; June 2–21 hold window provides recovery — pDawn timeline (~10–17 days from trigger) converges into Lab Block B if started by June 5.
Cree irradiance gate (by June 22): If ≥100 µW/cm² not achieved, fallback blue-light rig engages — uniform 470 nm exposure validates construct and wet-lab protocol without patterned imaging.
P6.2 inspection gate: If 2–3 image exposures produce no usable bacteriograph, project narrative shifts to “protocol and device validated” — a complete and defensible Aim 2 outcome.
Total active lab hours (post-orientation): ~14 h
Total wall-clock duration: ~4 weeks (May 28 → June 25, 2026)
Critical path: Twist delivery May 27 → MVFV gate June 1 → device pre-work convergence June 22
Part B — Techniques Checklist
Pipetting & Lab Safety
☑ Pipetting (hands-on competency established at Genspace Safety Training and Orientation, May 28, 2026 — fixed date, independent of Twist delivery)
☑ Lab Safety (Genspace BSL-1 Safety Training, May 28, 2026)
☑ Bioethical Considerations(mandatory — addressed in Section 3 Q4)
DNA Editing
☑ DNA Gel Art (gel electrophoresis as key transformation checkpoint — visual confirmation of BioLightV5 at P1)
☑ DNA Sequencing (Sanger verification of BioLightV5)
☑ DNA Construct Design (BioLightV5 in Benchling — Aim 1 — Design & Build)
☑ Databases (GenBank, NCBI, Addgene)
☐ Restriction Enzyme Digestion
☐ Gel Electrophoresis
☐ DNA Purification From Gel
Lab Automation
☑ Designing a Twist Order (BioLightV5 synthesis — Aim 1 — Design & Build)
☑ Creating a plan to use the Autonomous lab at Ginkgo Bioworks (Aim 3 — Learn & Refine)
☐ Creating Code for Laboratory Automation (deferred to Aim 3)
☐ Using Liquid Handling Robots (deferred to Aim 3)
☑ Freeze-Dried Cell Free Systems (observed in Week 10 ISS lab; Aim 3 distribution path targets this format for shippable consumables)
☐ miniPCR Tools
☐ Protein Purification
Cloning
☑ Primer Design or Selection (Sanger verification primers)
☑ PCR Reactions (colony PCR for sequence verification)
☐ Gibson Assembly
☐ Other Cloning Methods
☐ CRISPR / Cas9
☐ Designing Prime Editing gRNA
Total: 19 techniques checked.
Part C — Protocol Design
Expand upon two techniques you checked in the previous question by describing how you would utilize those techniques in your final project. (min. 4 sentences)
Protocol Design 1 — DNA Construct Design: BioLightV5 from eLightOn to Twist
Step 1 — Candidate selection: why eLightOn
The path to BioLightV5 began with a structured analysis of the full bacterial photography lineage — from Levskaya 2005 through the Tabor Lab multichromatic work — evaluating multiple optogenetic candidates against criteria including ON/OFF dynamic range, plasmid size, chromophore requirements, strain portability, and accessibility for community deployment. eLightOn (Li et al. 2020) was selected on the basis of its >500× ON/OFF folding ratio, which translates directly to photographic dynamic range — the capacity to produce a continuous tone image with measurable gradations between fully repressed dark state and fully induced light state, rather than a binary on/off signal.
As a parallel control and fallback, pDawn-sfGFP (Addgene #107741, Riedel-Kruse Lab, PNAS 2018) was selected as the next-best single-plasmid construct available directly from Addgene — requiring no reconstruction from literature. Both were selected as being endogenous vs complexity of exogenous chromophores requiring a second plasmid,increased metabolic burden, and future cell-free design requirements.
Table: Selection Criteria for Plasmid Design
Step 2 — Reconstructing eLightOn from the Li 2020 paper
Unlike pDawn-sfGFP, eLightOn is not available on Addgene and could not be ordered directly — it had to be reconstructed from the published protein sequences and supplemental data in Li et al. 2020. This required first extracting the RsLOV and LexA408 protein sequences from the paper, then converting those protein sequences back to DNA using the IDT Codon Optimization Tool (idtdna.com/CodonOpt). Codon optimization for E. coli K12 was essential because RsLOV originates from Rhodobacter sphaeroides, a purple bacterium with substantially different codon usage from E. coli — without optimization, expression would be poor and the light response weak or absent. The resulting codon-optimized DNA sequences were imported into Benchling as the foundation for BioLightV5, and this protein-derived DNA sequence is the same one subsequently modeled in AlphaFold — meaning the structural prediction reflects the actual construct rather than an approximation.
Step 3 — Benchling initial build and iteration
With the codon-optimized sequences created, the full BioLightV5 construct was assembled in Benchling — building the pUC19 backbone, RsLOV–LexA408 fusion (LexRO), pColE408 operator, sfGFP reporter, and double terminator (two distinct terminator sequences in series — a deliberate choice to ensure clean transcriptional stop while avoiding the direct repeat synthesis complications that arise when identical terminators are stacked, and which contributed to the final Twist order passing validation). The <5 kbp synthesis limit imposed by Twist Biosciences — including vector — was a primary selection criterion from the start, and eLightOn’s single-plasmid architecture was specifically chosen because it fits within this constraint, eliminating the need for multi-fragment assembly methods such as Gibson Assembly or Golden Gate.
This single-plasmid decision also directly simplified the Aim 2 — Test & Analyze (Development) validation protocol: transformation of a single verified plasmid into DH5α is all that is required to establish the full optogenetic circuit, with no in-lab assembly steps between Twist delivery and wet-lab testing. A deliberate fine-tuning decision was made at the RBS selection step: SD17 was chosen over faster alternatives specifically because it produces slower, more controlled LexRO expression that preserves the full dynamic range of the system — SD17 trades induction speed for full expression fidelity, the right tradeoff for a system designed to produce photographic gradations rather than a binary on/off signal.
TA mentor Anastasia Bernaz provided important guidance on the necessity of spacers between components, and advised allowing even more space between elements in future Benchling builds — a design note carried forward for subsequent iterations of BioLightV5.
Step 4 — Asimov Kernel parts, SBOL, and Twist order refinement
In Asimov Kernel, an individual part was created for each circuit component — RsLOV, LexA408 fusion, pColE408 operator, SD17 RBS, sfGFP reporter, and double terminator — and assembled into a complete SBOL representation. A key coaching moment came from TA mentor Yehuda Binik, who identified that the generative AI-assisted SBOL output was inaccurate in its biological representation — the constructs were present but not correctly structured in SBOL format, which directed the work toward Asimov Kernel as the proper tool for parts formalization.
The construct was intentionally built without explicit restriction cut sites for future sfGFP replacement — a simplification appropriate for Aim 1 and Aim 2 scope — however this introduced complications during the Twist order process, where ORF reading frame dependencies and the requirement to include the promoter and terminator in-frame caused several order attempts to fail validation, resolved through iterative refinement between Benchling and Twist.
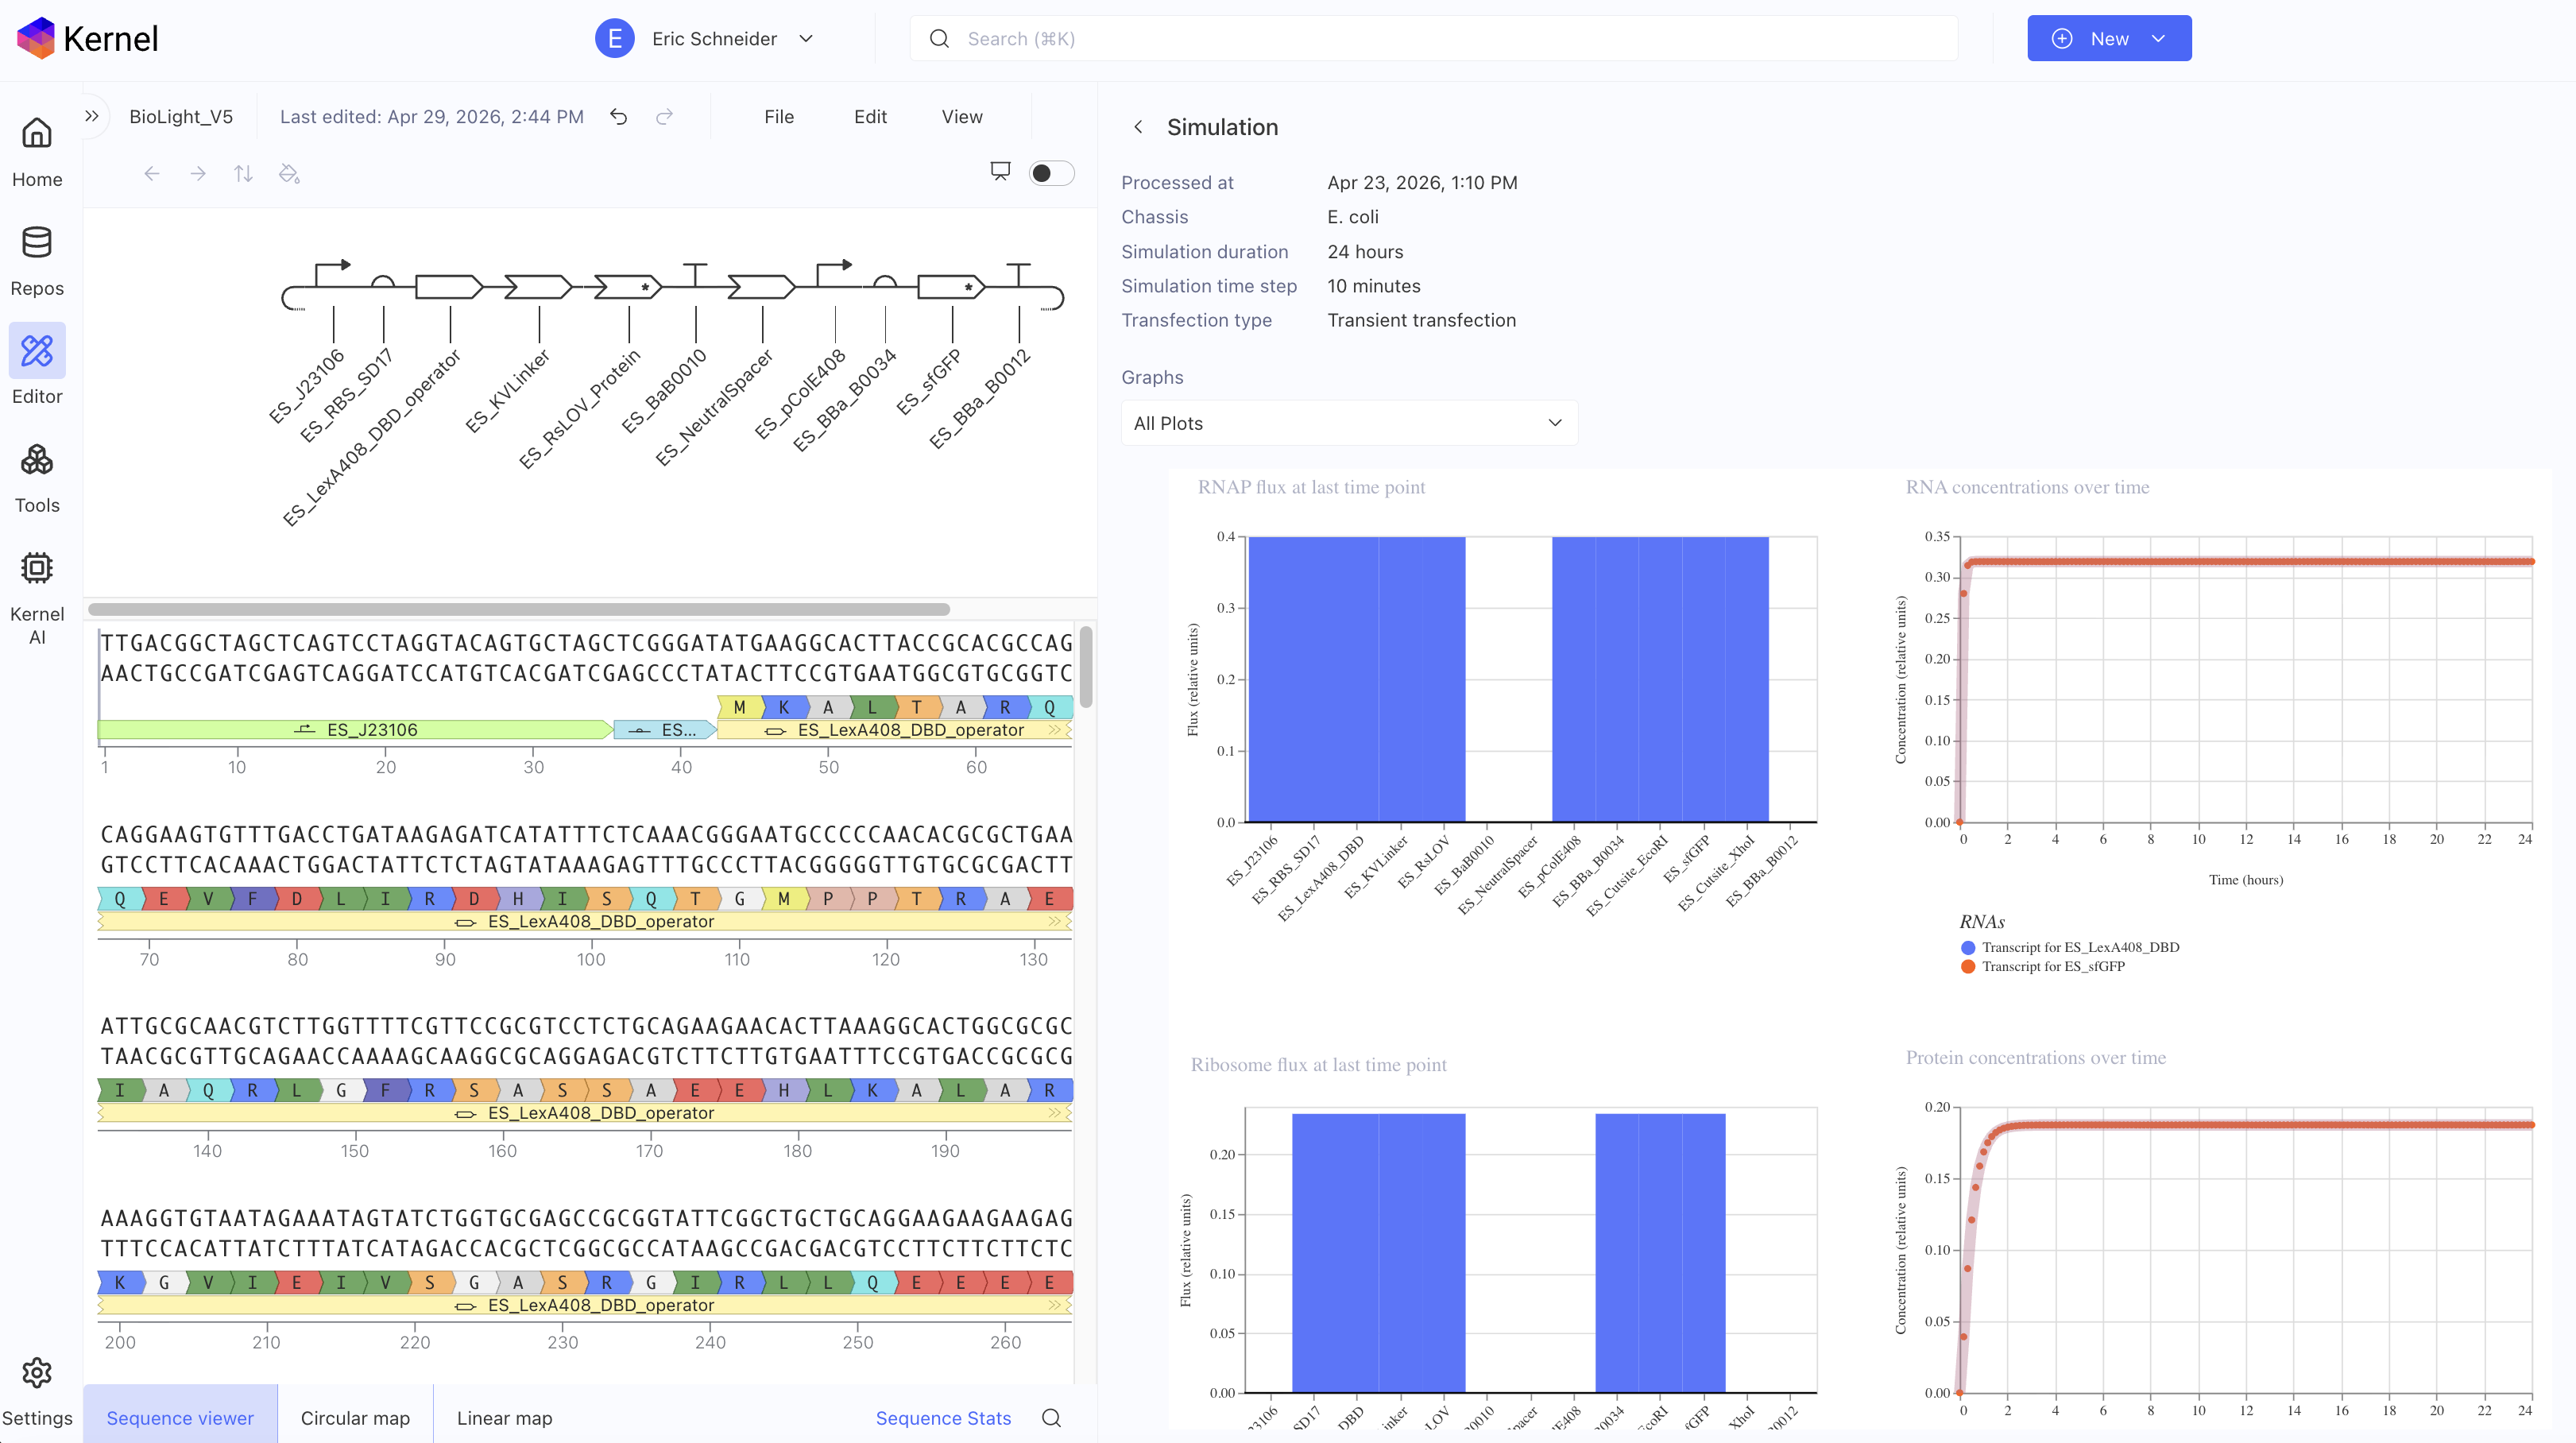
A circuit simulation was then run in Asimov Kernel, producing a spike in predicted sfGFP expression — but without capturing the dark-state repression phase central to the eLightOn mechanism, attributable to two known model limitations: Asimov Kernel does not simulate FMN chromophore photochemistry, and the underlying model is mammalian-derived, which may further limit dark-state accuracy in an E. coli chassis. The simulation result is treated as a model artifact confirming sfGFP expression is achievable under induction, while the dark/light dynamic range is reserved for empirical validation in the Aim 2 MVFV test. (Asimov simulation graph: Figure 4.2.)
*Asimov Kernel Simulation: 24 hrs
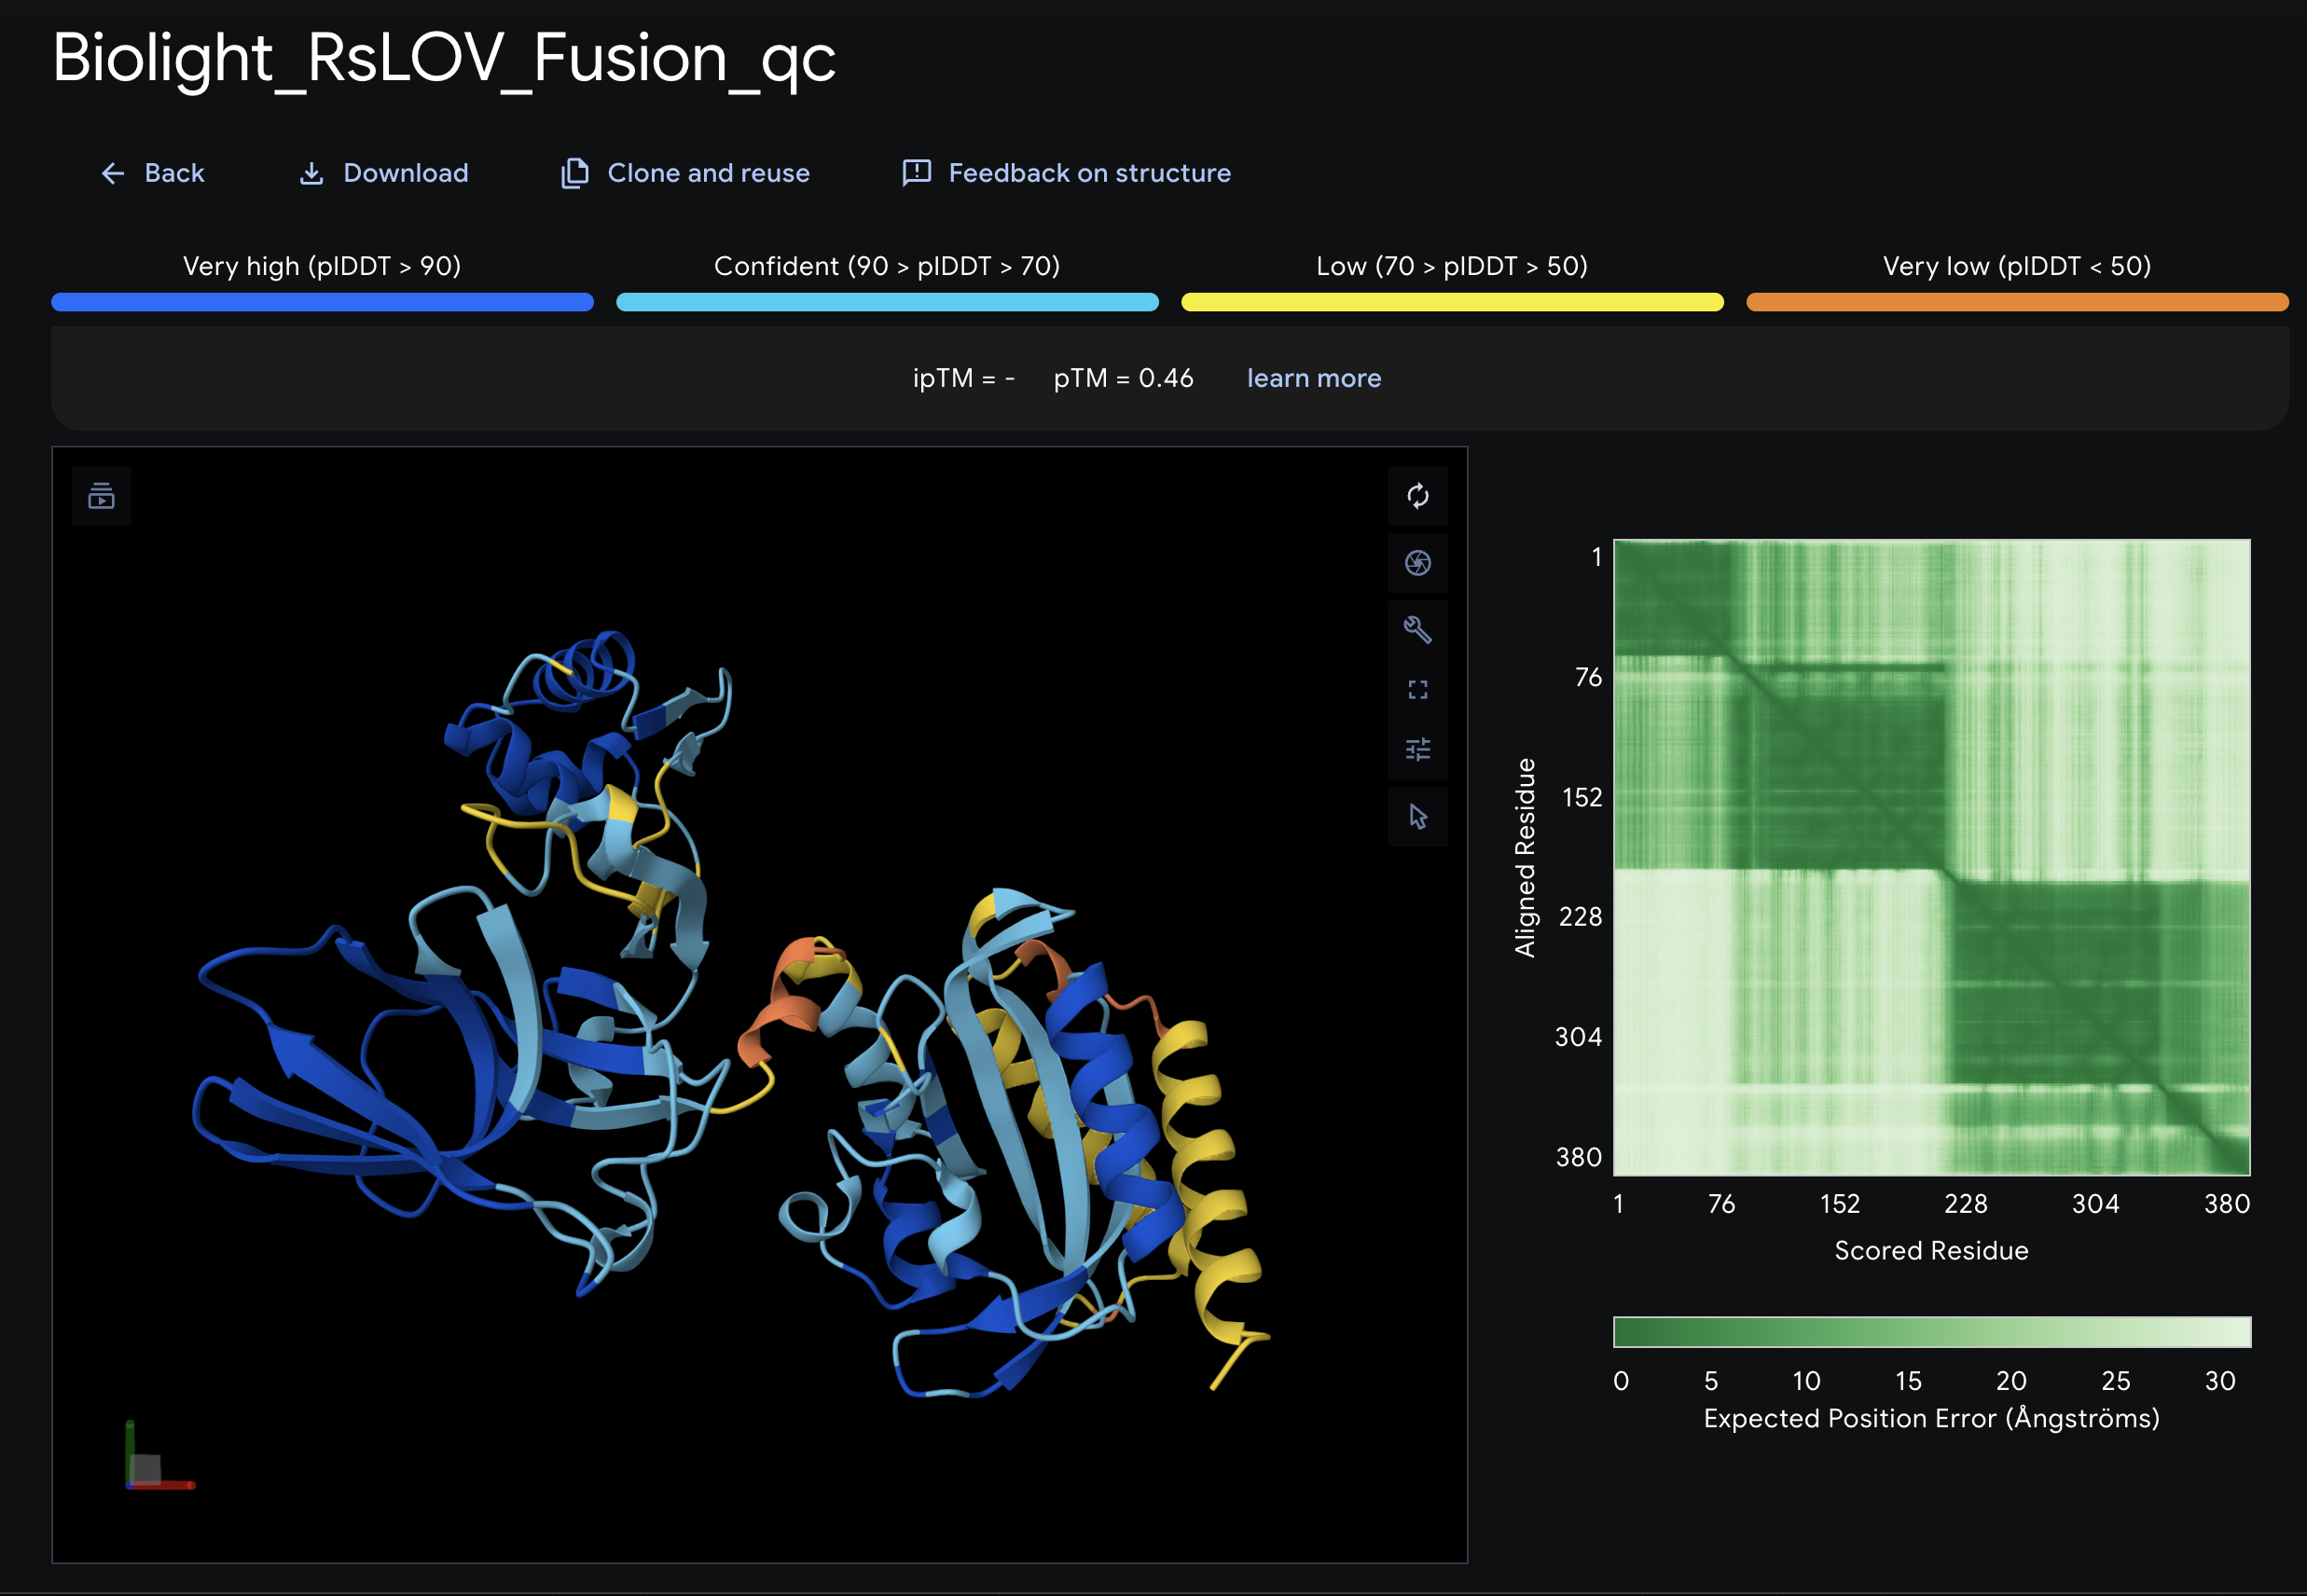
Step 5 — AlphaFold structural prediction and key limitation
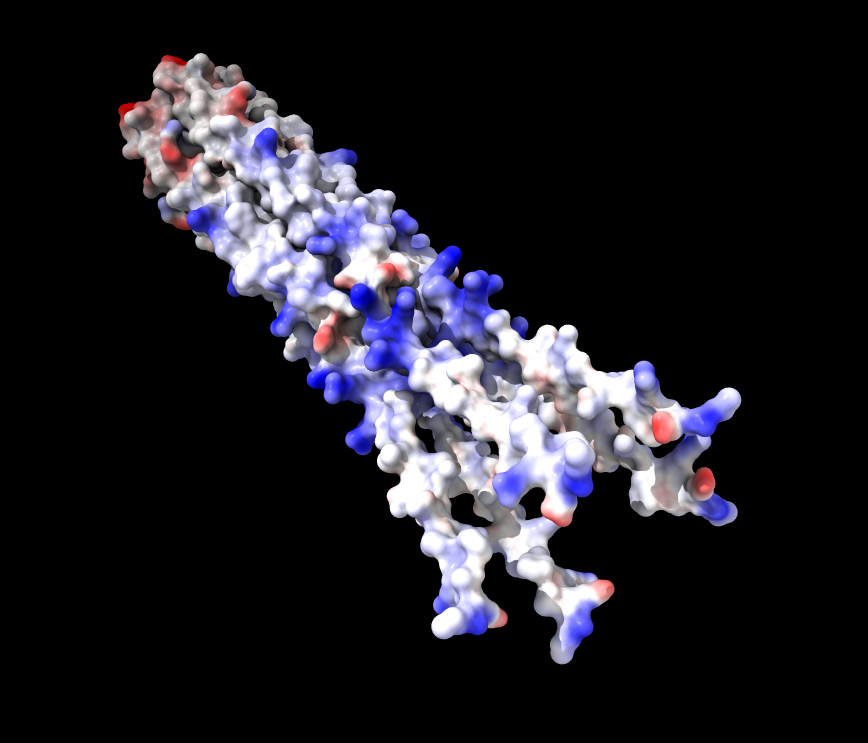
Following Benchling refinement, AlphaFold was used to predict the three-dimensional fold of the RsLOV–LexA408 fusion protein — using the codon-optimized, protein-derived sequence as the basis, ensuring structural prediction reflects the actual construct. AlphaFold produced a structurally confident model of the LexRO dimer, but with a critical and known limitation: it does not simulate FMN chromophore energy transfer or its photochemical interaction with the protein — meaning the predicted structure captures the overall fold with high confidence but cannot model the monomerization event triggered by 470 nm light. The result is a strong structural prediction paired with a weak link at the photochemical interface — the precise point where the dark-to-light state transition occurs.
*AlphaFold Prediction : LexRO fusion of RsLOV-LexA408
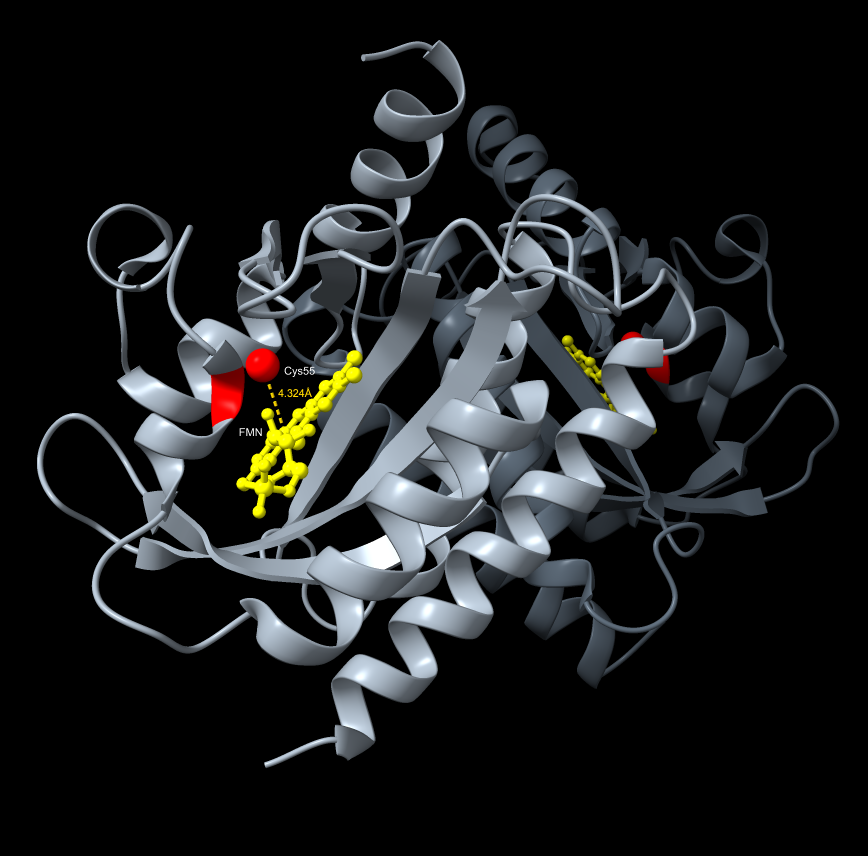
Step 6 — ChimeraX MOA evaluation
ChimeraX resolved the AlphaFold gap through direct exploration of the dark-state crystal structure (PDB 4HJ4), enabling precise visualization of the FMN cofactor distance to the Cys55 terminus — the 4.324 Å gap that represents the photochemical trigger point for LexRO monomerization. The spatial relationship between the LexRO dimer and the pColE408 DNA binding/release interface was mapped, providing visual reinforcement that dark-state dimerization physically occludes the operator and represses sfGFP transcription, and supports the theory that the geometry of monomerization under 470 nm light is sufficient to uncover the promoter and permit expression.
*ChimeraX Visualization FMN cofactor distance to the Cys55 terminus
The full six-step pipeline — candidate selection → IDT codon optimization → Benchling circular plasmid → Asimov Kernel parts and simulation → AlphaFold → ChimeraX MOA — forms a complementary design workflow where each tool’s features and limitations are explored, producing a construct that is sequence-verified, circuit-simulated, and structurally rationalized before a single wet-lab experiment begins.
Protocol Design 2 — Quality Control / Analysis: AS7341 Spectral Sensor as Photometric Calibration Instrument
Overview
The AS7341 11-channel spectral sensor serves a dual role in the Photoplasm system — first as a precision calibration instrument that characterizes the optical stack before any biological work begins, and second as a real-time plate reader during exposure and development. This protocol covers the calibration phase, which is a prerequisite for all Aim 2 — Test & Analyze (Development) exposure work. Full calibration specifications, Python scripts, and sensor deployment notes are documented in Photoplasm_Device_PreWork.md; the detailed build guide is published for future collaborators.
The optical stack and calibration geometry
The Photoplasm optical path is a darkroom enlarger rebuilt as a bio-imaging instrument: a 470 nm Cree XP-E2 LED ring delivers blue light through a condenser lens array that collimates and directs it into an even, parallel projection through the OLED digital image mask — where transparency is off and pixels are selectively on for masking — through a focusing lens, and onto the bacterial plate or agarose slab at approximately 10 inches from the nodal point of the focusing lens.
Photoplasm hardware stack:Image by NanoBanana 2
In initial testing this projection worked as designed, casting a sharp image onto the focal plane with measurable continuous tone gradations. The AS7341 is deployed at plate height to characterize this projection — reading the actual irradiance at the biological substrate plane rather than at the source, which is the only measurement that matters for exposure calibration.
Wavelength Sensor(used for calibration)
Python calibration scripts and key findings
Three Python calibration scripts were written and run on the Raspberry Pi 5 to characterize the Photoplasm optical stack: photoplasm_cal01.py (retired from irradiance calibration after the key finding described below), photoplasm_cal02.py (three-state OLED irradiance measurement), and photoplasm_densitometer.py (16-step Bayer dither H&D curve sweep). A critical calibration principle emerged during early testing: the AS7341 is sensitive enough that even a change in projected pixel density — as introduced by a step-wedge mask — registers as an irradiance change at the sensor. This means any patterned mask in the optical path during calibration will cause the sensor to read spatial variation in the mask rather than the true uniform field irradiance.
The correct calibration approach is therefore full-frame uniform illumination with no mask pattern in the path — measuring the light field as the bacterial substrate will actually receive it. The step-wedge is preserved as a biological exposure tool for plate work, where spatial density variation is precisely what is being controlled, but it is not used during device irradiance calibration.
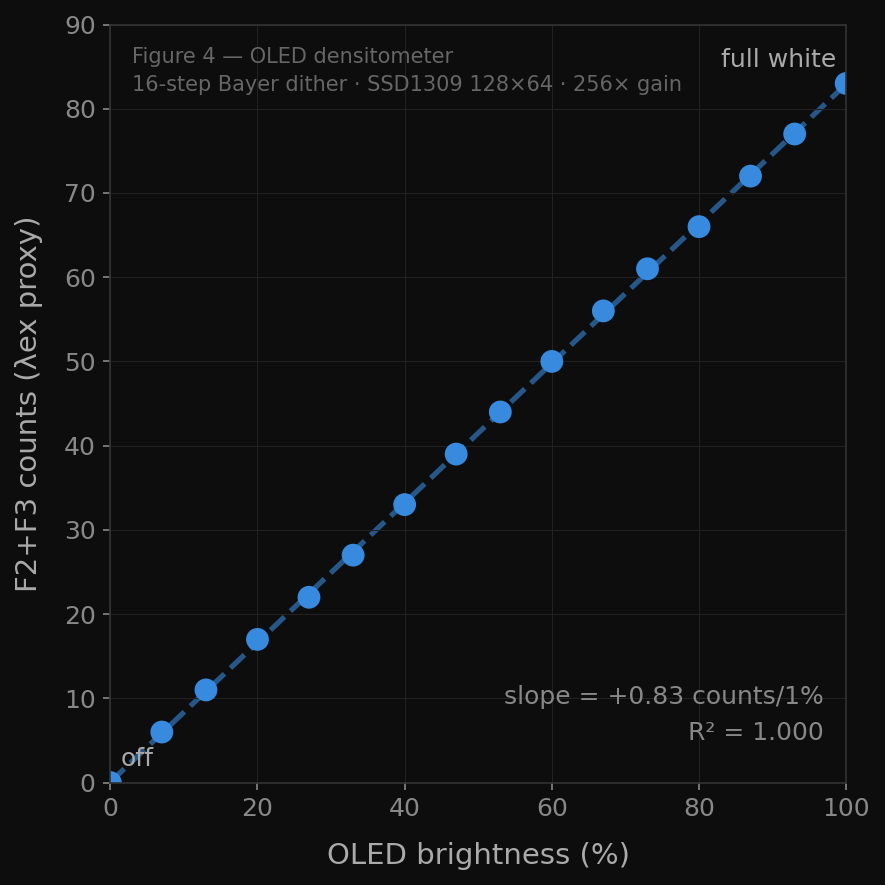
For the calibration sweep itself, a control-to-maximum irradiance run was executed — from direct unmodulated LED output through 100 PWM levels, downsampled to 16 standardized steps — producing a clean dose curve from minimum to maximum irradiance that defines the operating range of the Photoplasm device independently of any mask pattern. The densitometer script applied this approach using a 16-step Bayer ordered dither pattern across the full OLED pixel density range, and the AS7341 F2+F3 channel sum (445 nm + 480 nm, used as the 470 nm dose proxy since no single AS7341 channel falls at exactly 470 nm) showed a logarithmic response characteristic: steep toe at 0–25% pixel density, linear zone at 25–75%, and shoulder plateau at 75–100%, with a log fit of F2+F3 ≈ 138 + 22.5 × ln(density + 1) at R²=0.968.
Densitometer Readings - (used for calibration)
This is the optical H&D curve of the Photoplasm device — confirming that the system produces a measurable, continuous-tone sensitometric response before a single bacterium has been exposed. An additional discovery emerged: the OLED digital image mask itself emits 470 nm light proportional to pixel density, making it an additive light source rather than a purely neutral mask — a finding that motivates the planned upgrade to an ILI9341 transmissive LCD.
Cree XP-E2 upgrade and f/8 aperture decision
Initial Aim 1 testing confirmed that the consumer-grade EBOOT LED ring measured approximately 2.0 µW/cm² at the substrate plane — approximately 50× below the eLightOn activation threshold of 100 µW/cm². The AS7341 calibration data provided the quantitative basis for the upgrade decision: Cree XP-E2 LEDs, with measured output 10–20× higher than the EBOOT array and a tighter wavelength specification centered at 470 nm, will comfortably exceed the activation threshold.The irradiance gate for Aim 2 — Test & Analyze (Development) is defined as ≥100 µW/cm² confirmed by the AS7341 at plate height before any biological exposure begins. The focusing lens will be set to f/8 — the optimal balance between image sharpness and depth of field for bacterial plate work. A lower f-stop risks out-of-focus regions across the agarose slab surface if the slab is not perfectly flat; a higher f-stop increases depth of field but reduces light reaching the substrate. f/8 is selected because agarose slabs and bacterial expression layers may vary slightly in surface topology — f/8 provides enough depth of field to accommodate this variation while maintaining adequate irradiance at the substrate plane with the Cree upgrade.
Timed duty cycle dosing and machine vision feedback
A key methodological innovation in the Aim 2 — Test & Analyze (Development) exposure protocol is the use of a timed duty cycle rather than a single continuous exposure. Bacterial cultures are allowed to grow in total darkness first, establishing baseline expression; a calibrated dose of 470 nm blue light is then delivered at the measured irradiance level, followed by a dark recovery period, then another dose — repeated across the exposure window to prevent over-expression and metabolic exhaustion of the host cells. The reversibility of the eLightOn / BioLightV5 mechanism makes this approach possible: because LexRO re-dimerizes in the dark and re-represses sfGFP transcription during recovery intervals, the system can be dosed, rested, and dosed again — allowing fine-tuning of the exposure across multiple cycles within a single 24-hour experimental run.
Code Sample (snippet) - PWM Duty Cycle for Raspberry Pi 5
Finding the optimal balance of dose duration, recovery time, and total cycle count is itself a deliverable of Aim 2, and the resulting duty cycle parameters will become part of the calibrated exposure protocol published in the open-source documentation. A Raspberry Pi Camera Module mounted in the Photoplasm dark chamber provides real-time machine vision feedback during the exposure cycle — capturing fluorescence pattern development at each dose interval and feeding image data into a self-correction algorithm that can adjust subsequent dose parameters based on observed expression response. This machine vision layer is the first implementation of an autonomous feedback loop in the Photoplasm system, and it represents the foundational data collection step for the Aim 3 — Learn & Refine (Visionary) large language model: as exposure data accumulates across multiple Photoplasm devices and experimental runs, the self-correction algorithm becomes a training dataset suitable for a shared neural network — a fleet-level learning model that improves calibration accuracy across all deployed devices over time.
Part D — Industry Council Companies
Identify any How To Grow (Almost) Anything Industry Council companies which are associated with your final project (optional).
Primary Partners
Ginkgo Bioworks(Aim 3 — Learn & Refine)
Ginkgo Bioworks is an essential partner for the Aim 3 — Learn & Refine (Visionary) cell-free protein synthesis path — the cloud lab infrastructure that transforms BioLightV5 from a live-culture wetlab construct into a stable, shippable, freeze-dried consumable manufacturable at industrial scale. Most significantly, Ginkgo Bioworks could serve as the provider of a cell-free protein synthesis system featuring a Photoplasm-compatible biosensor — a complete, ready-to-use biological kit that responds to 470 nm blue light and produces sfGFP output when exposed through the Photoplasm device. This would make Photoplasm a true distributed community kit: the Ginkgo-manufactured cell-free biosensor as the biological consumable, the open-source Photoplasm device as the exposure instrument, and the shared experiential activity data model as the learning layer.
This initiative recognizes the Eastman/Kodak photographic industry analogy made real, where the complexity lives in the consumable and the participant simply loads, exposes, and observes. Beyond the consumable model, if Photoplasm is validated as a third-party labware instrument compatible with Ginkgo’s automated cloud lab protocols, it could operate as an optogenetic exposure platform within the Ginkgo ecosystem itself — a named protocol element in a fully automated, remotely executed biological imaging workflow.
There may also be a living-cell pipeline reinforced by a fully automated biomanufacturing process which would extend the reach of the visionary aim to existing wetlabs undergoing cloud automation transformation.
pDawn-sfGFP plasmid #107741 — the validated control construct for Aim 2 — Test & Analyze (Development) — ordered and handled exclusively under Genspace BSL-1 protocols at the Genspace Node. Beyond immediate construct sourcing, direct engagement with Addgene during this project revealed a longer-term institutional pathway: becoming an MTA-ready lab (Material Transfer Agreement certified) is a formal Addgene requirement for any community lab that wishes to deposit or distribute plasmids through their repository. Pursuing MTA-ready status for the MakerSpace Charlotte BioArt Studio is an aspirational goal of Aim 3 — Learn & Refine (Visionary) — one that would formalize the studio’s capacity to receive, handle, and eventually contribute biological materials to the open plasmid commons, directly aligned with the two-step HTGAA Node authorization pathway described in Section 3.
Having attended the HTGAA guest speaker session, the connection between the Transfyr.ai observational learning model and the Photoplasm platform has become clearer and more specific. The Photoplasm device is a connected instrument — every exposure run generates structured experimental data (irradiance levels, duty cycle parameters, AS7341 spectral readings, machine vision outputs) alongside learner participation and engagement signals from the community lab context. This is precisely the observational data model Transfyr.ai is built to capture and analyze.
Photoplasm represents a novel category of an observational data source: a community-deployed scientific instrument that is simultaneously generating both experimental outcomes and participant engagement metrics in a single session. The Aim 3 — Learn & Refine (Visionary) goal of a fleet-level LLM becomes more achievable when paired with observational and experiential activitiy data from distributed device users over time.
I believe that a continued collaboration with Transfyr.ai may lead to novel use of activity-based tracking and measurement protocols known as IEEE 9274.1.1-2023 (xAPI 2.0) which I have deployed at global manufacturing scale, and can lead to measurable transformation of industry best-practices.
Supporting Partners
New England Biolabs — DH5α competent cells, ampicillin, transformation reagents for Aim 2 wet-lab work at Genspace
Asimov (Kernel) — circuit-level logic design of BioLightV5, used in Aim 1 — Design & Build
Twist Biosciences — essential synthesis pipeline partner for BioLightV5 clonal gene order
Part E — Workflow Figures
Figure 4.1 — Aim 2 Protocol: Two Blue Light Tests.
Visual illustration of the sequential blue light testing protocol within Aim 2 — Test & Analyze (Development). Left panel: Blue Light Test 1 — MVFV — two test tubes post-transformation, one illuminated at 470 nm, one dark, with AS7341 readout and go/no-go gate. Right panel: Blue Light Test 2 — Photoplasm step-wedge calibration — device with OLED digital image mask projecting a 16-step Bayer dither onto an agarose slab, AS7341 capturing dose-response, and the resulting bacterial H&D curve. (FormLabs illustration — attach on submission.)
Figure 4.2 — Asimov Kernel simulation graph.
Predicted sfGFP expression output from BioLightV5 circuit simulation. Spike in expression confirmed; dark-state repression not captured due to mammalian model limitation and absence of FMN chromophore photochemistry modeling. (Screenshot from Asimov Kernel — attach on submission.)
Figure 4.3 — BioLightV5 non-linear design network.
SVG diagram showing the iterative, non-linear pipeline from candidate selection through eLightOn reconstruction, Benchling, IDT codon optimization, Asimov Kernel, AlphaFold, and ChimeraX, with dashed feedback loops at two key iteration points. (Inline SVG — exported from interactive widget, converted offline.)
Appendix — Standalone Protocol Documents
Document
Version
Scope
Photoplasm_BioLightV5_Protocol.md
v0.3.0
Primary wet-lab protocol, phases P0–P6
Photoplasm_Device_PreWork.md
v0.1.0
Device prep, Cree LED irradiance gate, fallback rig
Aim2_Protocol_AgaroseSlab.md
v0.2.1
Agarose slab embedding method (adapted from Tabor 2011)
pDawn_Backup_Protocol.md
v0.1.0
Fallback protocol if BioLightV5 sequence fails
Section Five - Results & Validation
Author: Eric Schneider · 2026a-eric-schneider
Node: Genspace NYC
Affiliation: BioArt Studio, MakerSpace Charlotte
Form Prompt
Describe the results of your project. What were the results of your experiments? What data did you collect? What did you learn? If you have not yet completed your experiments, describe what results you expect to see and why. Include figures, images, graphs, or other visual representations of your data where possible. Describe any challenges you encountered and how you addressed them (or plan to address them).
Opening
BioLight & Photoplasm is a project in motion — part completed (Aim 1), part deliberately designed to begin at Genspace on May 28, 2026 (Aim 2) and part saved for an ongoing shared collaborative experience (Aim 3). The results presented here reflect that reality: some are in hand, verified, and documented; others are expected outcomes grounded in calibration data, construct design, and a carefully staged protocol. Together they tell the story of a project that has moved from a photographer’s question — what is the resolution? — through fourteen weeks of literature review, construct design, hardware build, calibration, and community formation, to the threshold of its first wet-lab exposure.
What you will find in this section:
Results Block 1 — Aim 1: Design & Build (Experimental) · BioLightV5 Plasmid Construct — completed design, simulation, and structural analysis results; expected outcomes from Twist delivery and MVFP validation at Genspace
Results Block 2 — Aim 1: Design & Build (Experimental) · Photoplasm Device — completed hardware build and calibration findings including the Bayer dither H&D curve and OLED 470 nm emission discovery; detailed cal02 three-state analysis quantifying the OLED additive limitation; direct comparisons of the baseline vs. Aim 2 light source and image-mask configurations against the BioLightV5 minimum effective dose (MED) reference; and a gain-selection diagnostic for Aim 2 Cree raw characterization
Results Block 3 — Aim 2: Test & Analyze (Development) — expected results across three rounds of wet-lab work at Genspace, from MVFP baseline through first bacteriograph to Aim 3 handoff
Figures — confirmed figure list with status, pending figures noted for v1.0 final pass
Challenges — personal statement on the challenge of learning a new domain, followed by nine specific challenges encountered and how each was addressed
The BioLightV5 plasmid construct — BioLight V5— was designed, verified, and submitted to Twist Biosciences for clonal gene synthesis. The final v5 construct is 2,201 bp on a pUC19 backbone with AmpR selection, confirmed at 48.98% GC content with exactly two functional ORFs: LexRO-Fusion (1,143 bp) and sfGFP (717 bp). Three sequence issues identified during the design review were resolved prior to submission: an SD17 RBS spacing correction (AAA insert), removal of internal EcoRI/XhoI restriction sites, and replacement of the neutral spacer with a 50 bp AT-rich synthetic sequence. All four Benchling quality checks passed before Twist submission.
Key completed findings — construct design:
Asimov Kernel circuit simulation confirmed sfGFP expression output; dark-state repression gap documented as known artifact of mammalian-derived simulation model — not a construct flaw (Figure 4.2)
AlphaFold structural prediction of LexRO-Fusion confirmed stable dimer fold; FMN chromophore energy transfer gap noted as known prediction model limitation
ChimeraX exploration of dark-state crystal structure (PDB 4HJ4) confirmed Cys55–FMN distance at 4.324 Å; LexRO dimer geometry mapped against pColE408 operator; dark-state dimerization confirmed to physically occlude promoter; monomerization under 470 nm confirmed geometrically sufficient to permit sfGFP transcription (Figures 3.1, 3.2)
BioLightV5 non-linear design network — six-step pipeline from candidate selection through ChimeraX MOA confirmation documented with dashed feedback loops at two key iteration points (Figure 4.3)
pDawn-sfGFP (Addgene #107741) ordered in parallel as validated single-plasmid control construct
Expected Results
A successful Twist delivery of both the engineered BioLightV5 plasmid and the Addgene pDawn-sfGFP control sets up a substantial and purposeful Aim 2 — Test & Analyze (Development) to be conducted in person at Genspace. As noted in the timeline, orientation at Genspace is scheduled for May 28 as a new community member — a fixed date independent of Twist delivery. In preparation for this work, a new working group has formed around the project: TA and mentor Yehuda Binik and HTGAA 2025 cohort participant David Chau have been meeting weekly — two-plus hours each Sunday session — focused on the project design, the protocol roadmap, and the longer-term Aim 3 — Learn & Refine (Visionary) vision of a shared collaborative biosensor experience paired with the Photoplasm light exposure unit. The protocol in the appendix is directly tied to the timeline and dependent on receipt of the first clonal DNA as its primary trigger.
A key consideration is that successful delivery of the construct is the starting point, not the finish line: there are multiple days and sequential steps of early validation required before the light projection system is engaged at all. The Minimum Viable Functional Prototype (MVFP) — a simple bench-top 470 nm blue light induction test on two culture tubes, one illuminated and one dark — must be completed and pass before any Photoplasm device work begins. This deliberate separation of construct validation from device operation ensures that if BioLightV5 does not fluoresce as expected, the fallback pDawn-sfGFP protocol can be activated without having committed time and resources to the full Photoplasm exposure workflow.
A second in-person visit to Genspace is planned following the initial round of experimental lab work, once the baseline MVFP has been established and a verified, transformed bacterial source is ready for exposure. At that point, I will travel to Genspace with the Photoplasm hardware and software — bringing the light projection system to the certified wetlab environment for the first time and beginning integrated image exposure work under institutional BSL-1 oversight. This visit is one node in a deliberately parallel model: while wet-lab milestones advance at Genspace, the MakerSpace Charlotte BioArt Lab continues building, testing, and refining the Photoplasm hardware and software in parallel — learning together across two sites simultaneously. This distributed, connected approach is not incidental to the project — it is the proof-of-concept for Aim 3 — Learn & Refine (Visionary). The Genspace ↔ MakerSpace Charlotte working collaboration, anchored by weekly sessions with Yehuda Binik, David Chau, and the broader Genspace community, is the first instance of the shared, multi-node biosensor experience that Aim 3 proposes to scale. When the first creative light mask is exposed onto a living bacterial substrate at Genspace, the MakerSpace Charlotte BioArt Lab will be ready to replicate that experience — and the distributed, connected model will have its first proof point.
This collaboration also reflects MakerSpace Charlotte BioArt Lab’s longer-term aspiration to become a recognized HTGAA Node — supported by Eric Schneider (HTGAA 2026) in a future Teaching Assistant role if deemed applicable by the program — and ultimately to achieve MTA-certified wetlab status with a direct pathway to cell-free protein synthesis via Ginkgo Bioworks, positioning the lab as a fully credentialed community node in the distributed BioLight network.
The Photoplasm device represents the novel hardware contribution of this project to the broader synthetic biology community — a purpose-built bio-imaging instrument that reimagines the photographic darkroom enlarger as an open-source, community-deployable optogenetic exposure platform. All physical components were designed in Fusion 360 and fabricated in PETG on a Bambu X1 Carbon at my design studio and MakerSpace Charlotte.
Hardware build — completed components:
Dark chamber frustum cone (256 mm height, 51 mm ID top, 152 mm OD base)
Plate heater / incubation controller — PTCYIDU PTC element, DS18B20 temperature probe, IRLZ44N MOSFET on GPIO13, 37°C setpoint, variable and tunable — maintains bacterial culture temperature throughout the exposure window without removing the plate from the dark chamber
Raspberry Pi 5 — all pin assignments locked (PWM GPIO18, OLED SPI, AS7341 I2C, shutdown GPIO21)
470 nm LED ring — EBOOT array (current); Cree XP-E2 upgrade in queue as prerequisite for Aim 2
PWM/MOSFET driver (IRLZ44N, GPIO18) — verified working on breadboard
Light collimator and focusing lens — sharp image projection confirmed at f/8, ~10 inches from nodal point
OLED SSD1309 digital image mask — operational, projection confirmed sharp at plate height
(Raspberry Pi Camera Module — in queue, to be installed during Aim 2)
Calibration findings — completed:
EBOOT LED ring measured 2.0 µW/cm² at substrate plane — 50× below eLightOn activation threshold; quantitative basis for Cree XP-E2 upgrade decision
Three-state OLED transmission test — initially showed 99.9% optically neutral; identified as measurement artifact (LED + OLED emission not separated in original test); resolved by the corrected cal02 three-state protocol described below
Pie-wedge step-wedge — AS7341 sensitivity sufficient to register mask spatial variation as irradiance change; retired for calibration; preserved for biological plate exposure work
PWM sweep — 100 levels downsampled to 16 standardized steps; clean dose curve established across full operating range
Bayer dither densitometer — 16-step sweep confirmed logarithmic H&D response: steep toe (0–25%), linear zone (25–75%), shoulder plateau (75–100%); log fit F2+F3 ≈ 138 + 22.5 × ln(density + 1), R²=0.968(Figure 5.1)
OLED 470 nm emission discovery — OLED emits 470 nm light proportional to pixel density, +58.7% contribution across full density range — additive light source, not neutral mask; motivates ILI9341 transmissive LCD upgrade (Figure 5.2)
Sharp image projection confirmed at f/8 — optimal balance of depth of field and irradiance for variable agarose slab surface topology
Detailed cal02 three-state analysis — quantifying the OLED additive limitation
The OLED 470 nm emission finding referenced in Figure 5.2 was characterized in detail through a corrected three-state protocol (photoplasm_cal02.py), which addressed the measurement artifact in the original three-state OLED transmission test. The cal02 protocol records the AS7341 response under three sequential optical configurations: LED ring alone with no OLED in the optical path (S1), OLED present with all pixels driven white (S2), and OLED present with all pixels off (S3). From these three readings, three transmission/attenuation quantities are derived.
Spatial Light Modulator (SLM): the addressable optical component that controls where light passes through to the sample plane. The SLM sits between the light source and the sample, acting as a digital image mask — each pixel either passes light through, blocks it, or attenuates it by some intermediate amount. This is what enables Photoplasm to project patterns onto a bacterial lawn rather than illuminate it uniformly, and is the conceptual analog of a photographic negative in darkroom enlargement. Common SLM technologies include transmissive LCDs (the planned Aim 2 component), reflective LCoS panels, digital micromirror devices (DMDs, as in DLP projectors), and — in Photoplasm Alpha — a transparent OLED. SLMs may operate subtractively (blocking incident light, the photographic norm) or additively (emitting their own light, the OLED case); this distinction is central to the Aim 2 component swap.
Quantity
Measured value
Interpretation
s1_no_oled_f2f3
390 counts
LED ring direct, no SLM
s2_oled_white_f2f3
240 counts
LED + OLED pixels on
s3_oled_off_f2f3
350 counts
LED + OLED pixels off
oled_transmission_pct
61.5%
S2/S1
glass_transmission_pct
89.7%
S3/S1 (substrate only)
pixel_attenuation_pct
145.8%
(S3 - S2) inverted ratio metric
The OLED’s glass substrate is acceptably transparent (~90% transmission, consistent with optical-grade glass plus a thin organic stack). The pixel layer, however, adds light to the optical path when driven white rather than attenuating it. The 145.8% pixel attenuation value — over 100% — is the quantitative signature of this additive behavior: white pixels emit their own 470 nm photons that sum with transmitted LED light at the sensor. This is the cal02-derived counterpart to the +58.7% densitometer finding (Figure 5.2); both metrics quantify the same physics from different measurement geometries.
The contrast ratio implication is severe. With S3 = 350 counts (pixels off, “maximum exposure”) and S2 = 240 counts (pixels on, “minimum exposure”), the OLED’s effective contrast ratio is 350:240 ≈ 1.46:1, or 0.69:1 if measured in the conventional direction (closed/open). In log-exposure units, the available modulation range is log₁₀(1.46) ≈ 0.16 log units — roughly an eighth of the 1.3 log units typically required to capture a complete photographic H&D curve (toe + linear + shoulder). This is not a calibration artifact: it reproduces the established physics of OLED displays (each pixel is an electroluminescent emitter) and confirms that the SSD1309, however convenient for prototyping, is architecturally unsuited to act as a subtractive density mask in a photographic-sensitometric exposure unit.
Figure 5.7. cal02 three-state measurement, April 28 2026. The S2 < S3 relationship is the quantitative signature of OLED additive emission: white pixels add 470 nm photons but block more LED light than they emit, producing net attenuation; pixels-off blocks less and produces higher net throughput. This inversion is what motivates the LCD substitution in Aim 2 and is the cal02-derived counterpart to the densitometer finding in Figure 5.2.
Baseline vs. Aim 2 light source — paired comparison against the BioLight V5 MED
The Alpha LED ring delivers 240 counts net through the OLED at the sample plane (cal02 S2 measurement). Mapped to irradiance via the placeholder coefficient Kc = 1.0, this is consistent with the calibration result of 2.0 µW/cm² noted above. The BioLight V5 minimum effective dose (MED) for construct activation — anchored on the upstream eLightOn precedent (Jayaraman et al. 2016) and the project’s stated ≥100 µW/cm² irradiance gate — corresponds to approximately 300 counts in the current AS7341 256X-gain scale. The BioLight V5 MED is anchored on the upstream eLightOn value pending in-house characterization at Genspace.
The Alpha LED+OLED system, in its working configuration, falls below MED. Even at maximum drive (PWM 100%), the combined optical losses prevent reliable construct activation. The Cree XP-E2 3-up star array is specified for 10–20× higher radiant flux than the EBOOT 5mm array at the substrate plane, tighter spectral binning around 470 nm, and more directional emission. Projected raw output at the sensor is on the order of ~2,300 counts before SLM losses, providing substantial headroom above MED even after the LCD transmission penalty.
Figure 5.8. Light source comparison with BioLight V5 MED reference. The Cree+LCD net output (~460 counts) provides ~50% headroom above the MED threshold, whereas the EBOOT+OLED baseline (240 counts) falls below it — meaning the Alpha system cannot reliably engage the construct even at maximum drive.
Light source diagnostic — raw vs. net output ranges
Figure 5.8’s grouped bars convey the four data points but compress the relationship between raw source output and net delivery through the SLM. Re-plotting each system as a paired range (raw, then net) makes the magnitude of SLM transmission loss visible at a glance while preserving the MED reference for direct comparison. This view also surfaces a measurement protocol implication: the Cree raw output (~2,300 counts) substantially exceeds the AS7341’s saturation point at 256X gain (~726 counts), meaning Aim 2 raw characterization must use a lower gain setting and normalize the result back to 256X-equivalent counts for valid comparison against the Alpha baseline.
Figure 5.9. Direct light source comparison expressed as raw-vs-net output ranges at fixed gain. The SLM transmission percentages (61.5% for the baseline OLED, 20.0% for the Aim 2 LCD) quantify the photon loss between each light source’s raw output and what actually reaches the sample plane. Despite the LCD losing ~3× more photons than the OLED, the Cree’s much higher raw output more than compensates: the Aim 2 net (~460) lands above MED while the Baseline net (240) lands below.
Baseline vs. Aim 2 image mask — paired comparison against the BioLight V5 MED
The OLED’s additive emission produces three coupled failures: inverted modulation direction (increasing pixel density increases sensor reading rather than decreasing it — the opposite of photographic density behavior); compressed modulation range (only 0.16 log units of D-log E swing, against a requirement of roughly 1.0+ log units for sensitometric characterization); and MED-bracketing ambiguity (the OLED’s modulation range of 240–350 counts brackets the BioLight V5 MED rather than straddling it, so every density step produces ambiguous biology — neither a clean dark control nor a strong activation).
The ILI9341 LCD with backlight removed operates as a true subtractive shutter array. Blue-subpixel “on” passes light through the polarizer stack at panel transmission efficiency (~20% projected for blue channel through full polarizer + color filter stack); blue-subpixel “off” blocks light to the panel’s contrast floor (typically ~10:1 ratio for this class of LCD). Modulation runs in the correct direction (more pixels on = more light transmitted), with sufficient range to straddle MED with toe-region headroom on both sides. The resolution change from 128×64 monochrome (8,192 pixels) to 320×240 RGB (76,800 pixels, ~25,600 addressable blue subpixels) further enables an 8×8 Bayer dither protocol with 64 distinct density levels, against the Alpha’s 16-level 4×4 dither. This provides 4× more density steps per H&D characterization sweep, sufficient to resolve toe and shoulder curvature rather than jumping past them.
Figure 5.10. SLM modulation comparison. The OLED’s range (240–350) brackets the MED rather than straddling it, producing biology that is neither reliably dark nor reliably activated. The LCD’s projected range (46–460) clears MED in the open state and falls well below it in the closed state, enabling true toe-to-shoulder H&D characterization.
Image mask diagnostic — modulation range against the MED reference
The contrast between the two SLM options is clearest when each is plotted as a single vertical range — endpoints, midpoint, and span all visible against the MED reference. Unlike the light source case in Figure 5.9, the SLM measurements all sit comfortably within the AS7341 working range at 256X gain (noise floor ~55, saturation ~726), so no gain normalization is required for SLM characterization. The 512X gain setting remains available as a 2× amplification lever if measured LCD output falls short of projection.
Figure 5.11. Direct SLM comparison expressed as modulation ranges at fixed gain. The OLED’s 0.16-log range fails to provide either a clean below-MED dark control or a clean above-MED activation state. The LCD’s projected 1.00-log range provides both, with the MED line falling near the middle of the operating range — the natural set-point for stepwedge characterization.
Gain selection diagnostic — Aim 2 measurement protocol
Figure 5.9 identified the measurement-protocol problem (Cree raw saturates the AS7341 at 256X gain) but did not resolve it. The AS7341’s gain ladder is multiplicative — each setting halves or doubles the analog amplification before the ADC — so the projected Cree raw counts at any candidate gain can be computed as Cree_counts(gain) = 2,300 × (gain / 256). Plotting this across the full gain ladder against the sensor’s working bounds (55-count noise floor, 726-count saturation ceiling) identifies the optimal operating window of usable gains: 8X, 16X, 32X, and 64X.
Figure 5.12. Gain selection diagnostic for Cree raw characterization. Each AS7341 gain setting is plotted against the projected counts for the Cree raw measurement, scaled from the 2,300-count reference at 256X-equivalent. The four working-range settings (8X = 72 counts, 16X = 144, 32X = 287, 64X = 575) provide candidate operating points; 32X is recommended as the balanced choice. All raw measurements at the chosen gain will be normalized back to 256X-equivalent counts for direct comparison against the Alpha cal02 dataset and the BioLight V5 MED reference.
Gain selection justification (the trade-off at 32X). Lower gain reduces analog amplification noise — gain amplifies signal and noise together, so a lower-gain reading of the same photon flux is intrinsically cleaner. This favors the lowest gain that still produces a readable signal. However, lower gain also produces fewer ADC counts per measurement, which means each count represents a larger fraction of the total signal — coarser quantization. At 8X (~72 counts) the signal occupies only ~10% of the sensor’s working range; quantization error becomes a meaningful fraction of the measurement. At 64X (~575 counts) the signal occupies ~80% of the working range with fine quantization, but the higher gain amplifies thermal and read noise more aggressively. At 32X (~287 counts) the signal occupies ~40% of the working range — deep enough into the ADC for clean quantization while keeping noise amplification minimal. A secondary consideration favors 32X: the normalization factor from measured gain back to 256X-equivalent is 8× at 32X versus 16× at 16X, so any measurement error at 32X is amplified less aggressively during normalization, preserving comparability with the Alpha cal02 baseline.
Expected Results
The Cree XP-E2 LED upgrade — delivering 10–20× higher output than the EBOOT array with a tighter 470 nm wavelength specification — is expected to clear the ≥100 µW/cm² irradiance gate at the substrate plane, bringing Photoplasm fully within the BioLightV5 exposure specification and enabling the first biological exposure runs at Genspace. With the ILI9341 transmissive LCD replacing the OLED as a true non-emissive mask, the optical stack will be free of the 470 nm emission confound discovered in calibration — producing a clean, controlled exposure field. The Raspberry Pi Camera Module will be installed during Aim 2, providing real-time machine vision feedback during duty cycle exposure runs.
In my view, Photoplasm is the novel contribution of this project to the greater synthetic biology community. As stated in the final presentation slide deck, it is unique, accessible, modifiable — hackable — and released as a fully open-source contribution under the MIT License attribution model, with detailed documentation and branching version control via GitHub to invite community innovation and rapid improvement. It is built to the same philosophy stated in the abstract: not in isolation from the research community, but in direct collaboration with it. Observing the 2026 HTGAA Final Project presentations confirmed what the design already anticipated — strong community interest in spatial modifiers, biosensors, and light-wavelength triggers across a wide range of applications.
Photoplasm is preparing to serve that interest: the current 470 nm blue light ring is the first in a planned expansion toward full RGB and color spectrometry capability, enabling a wider range of optogenetic systems to be profiled on the same open platform — the same way photographic film characteristic curves were measured across emulsions. From art and design to materials science, therapeutics, and environmental sensing, an analog light source paired with a digital LED mask will be an invaluable bench tool at scale. Many as-yet-undocumented tangential experiments and discoveries are likely to emerge as communities learn, build, calibrate, and deploy the device — and that possibility is not incidental to the project. It is the point.
Figures referenced:
Photoplasm parts guide (refer to full build documentation and Github repository)
AS7341 calibration data — Bayer dither H&D curve (Figure 5.1 — attach on submission)
OLED emission discovery plot (Figure 5.2 — attach on submission)
cal02 three-state OLED analysis (Figure 5.7)
Light source baseline vs. Aim 2 comparison (Figures 5.8, 5.9)
Image mask baseline vs. Aim 2 comparison (Figures 5.10, 5.11)
Gain selection diagnostic for Aim 2 Cree characterization (Figure 5.12)
What I expect to happen is straightforward, and I say that with full appreciation of how much work it represents: a Twist order will be received, and I will be onboarded to Genspace through hands-on lab activities following a carefully designed and executed protocol. The entire project will become real the moment I see the first indication of bacterial transformation — verified by a simple 470 nm dark box exposure that confirms BioLightV5 is doing exactly what the design predicted. That moment — a glowing tube held under blue light in a dark room — is the proof point that fourteen weeks of literature review, construct design, hardware build, and calibration work has been pointing toward.
The work unfolds in three rounds:
Round 1 — Establish the baseline (Genspace Lab Block A, May 29 – June 1)
The following steps are drawn from the Aim 2 protocol currently under review — to be finalized at Genspace orientation on May 28, 2026. Specific methods, equipment access, and sequencing approach will be confirmed at that time.
Twist DNA received, resuspended, and gel-verified at P1
DH5α transformation, LB+Amp plating, colony picking under red safelight at P2
Miniprep, sequence verification (method confirmed at orientation May 28), glycerol stock banking per Genspace BSL-1 SOP at P3
MVFP induction test — 470 nm exposed tube vs dark control, sfGFP emission confirmed visually and by AS7341 sensor
Expected result: measurable fluorescence in light tube, minimal signal in dark control (Figure 5.3 — pending)
Agarose slab casting from verified working stock (OD₆₀₀ measured, low-melt agarose at 42–45°C)
Timed duty cycle exposure through OLED digital image mask at calibrated f/8 aperture
Three planned exposures: full step-wedge for H&D curve · Photoplasm logo binary test print · one original image mask from the 12-piece Photoplasm Art Gallery series
AS7341 time-series data exported to CSV, fluorescence plotted vs. logarithmic light exposure
Raspberry Pi Camera Module installed and providing real-time machine vision feedback during duty cycle
Re-run cal02 protocol on Aim 2 hardware using gain-stepped acquisition per Figure 5.12 (32X for S1 raw to avoid saturation, 256X for S2/S3 net); normalize raw values to 256X-equivalent counts before comparison against the Alpha cal02 baseline
Expected result: calibrated bacterial H&D curve with toe, linear, and shoulder regions documented (Figure 5.4 — pending); at least one bacteriograph demonstrating spatial sfGFP patterning from the OLED image mask (Figures 5.5, 5.6 — pending)
Round 3 is less a protocol and more a curriculum — a shift from validation to creative and scientific expression. Participants will build, test, and design the next level of light-reactive exposures on biosensor circuits of their choosing, using the Photoplasm platform as the shared instrument and the bacterial H&D curve as the calibrated reference.
Genspace ↔ MakerSpace Charlotte parallel build sessions ongoing
Photoplasm hardware and software open-sourced on GitHub under MIT License
Transfyr.ai observational data model capturing participant engagement and experimental outcomes
Machine vision self-correction data accumulating as the foundational training dataset for the Aim 3 fleet-level neural network
MakerSpace Charlotte BioArt Lab advancing toward HTGAA Node authorization and Addgene MTA-ready status
Ginkgo Bioworks CFPS pathway under development — direct line from community lab to cell-free biosensor consumable
Figures — Master List
Confirmed figures — exist or captured
Figure
Description
Source
Status
2.1
BioLightV5 in Benchling — construct map
Benchling screenshot
✅ exists
3.1
ChimeraX — dark-state RsLOV dimer, PDB 4HJ4, slate gray, yellow FMN, red Cys55, 4.324 Å
ChimeraX render
✅ exists
3.2
ChimeraX — dark-state with teal-green DNA helix, pColE408 operator
Baseline vs. Aim 2 light source comparison with BioLight V5 MED reference
Python plot
✅ exists
5.9
Light source raw-vs-net diagnostic with SLM transmission percentages
Python plot
✅ exists
5.10
OLED vs. LCD modulation comparison — shutters open and closed states
Python plot
✅ exists
5.11
SLM modulation range diagnostic — OLED brackets MED, LCD straddles MED
Python plot
✅ exists
5.12
Cree raw gain selection diagnostic — optimal operating window at 32X
Python plot
✅ exists
Pending figures — wet-lab and submission
Figure
Description
Source
Status
5.3
MVFP result — light tube vs dark control fluorescence
Photo / AS7341
⚠️ pending May 29
5.4
Bacterial H&D curve — fluorescence vs log exposure
AS7341 CSV → Python
⚠️ pending June 25
5.5
First bacteriograph — spatially resolved sfGFP gradient
Transilluminator photo
⚠️ pending June 23
5.6
Photoplasm Art Gallery — one original image mask exposure
Transilluminator photo
⚠️ pending June 23
Additional figures to be added in the v1.0 final pass as wet-lab work produces results.
Challenges
The challenge of designing a plasmid for the first time is an exciting prospect — and with excellent coaching and mentoring, along with trying different constructs, making beginner mistakes, and researching papers and literature, it has opened up an entirely new language and domain. As an industrial designer and photographer, I have found the perfect blend of modalities to apply to an established scientific industry, embarking on a revolutionary moment in history given the influence of AI, neural networks, generative algorithms, microcontrollers, and core synthetic bioscience. All of which are inherently challenging. When pulled together, each now has a more centralized focus and leads to innovation.
I embrace the challenge of learning a new domain — even with ten years of pharma and biotechnology industry experience and fifteen years of manufacturing experience — because I feel like I have reset the clock at the perfect time, to present solutions that lead to deeper understanding, learning, and practical knowledge transfer. As I stated in my earliest opening ideas on these topics, I seek to provide engaging experiences to peers, colleagues, and learners. From a practicality perspective, the advent of powerful models such as Claude have made it possible to pull together disparate pieces of information into meaningful, connected rapid prototypes that can be iterated and actualized — as shown by the results of this endeavour. I plan on analyzing all prompt turns to identify key themes that helped lead to this point, assessing what worked and what did not with the help of AI platforms of choice — looking for trends such as confidence, accuracy, corrections, and reusable prompt libraries in support of the project.
Specific challenges encountered and how each was addressed:
Plasmid design from scratch — eLightOn not on Addgene. Unlike pDawn-sfGFP which could be ordered directly, BioLightV5 had to be reconstructed from the Li 2020 paper and supplemental data — extracting protein sequences, converting to DNA via the IDT Codon Optimization Tool, and assembling the full circular plasmid in Benchling. Addressed: iterative rebuild across Benchling → Asimov Kernel → Benchling, with TA mentorship from Yehuda Binik (SBOL correction) and Anastasia Bernaz. (spacer guidance). Three sequence issues (SD17 spacing, EcoRI/XhoI sites, neutral spacer) identified and resolved in BioLightV5 V5 prior to Twist submission.
Twist order ORF/in-frame failures. The absence of restriction cut sites for future sfGFP replacement, combined with promoter and terminator in-frame dependencies, caused multiple Twist order validation failures. Addressed: iterative refinement between Benchling and Twist across multiple submission attempts, ultimately resolved in V5.
Asimov Kernel simulation dark-state gap. The circuit simulation produced an sfGFP expression spike without capturing dark-state repression — traced to the mammalian-derived model not simulating FMN chromophore photochemistry in an E. coli context. Addressed: documented as a known model artifact, not a construct flaw. The MVFP empirical validation at Genspace is the designed correction — wet-lab observation replaces what simulation cannot predict.
AlphaFold FMN photochemical gap. AlphaFold predicted a strong LexRO dimer fold but cannot simulate the FMN chromophore energy transfer that drives the dark/light transition. Addressed: ChimeraX exploration of PDB 4HJ4 confirmed the 4.324 Å Cys55–FMN distance and DNA binding/release geometry — providing mechanistic confidence the simulation could not.
EBOOT LED insufficient irradiance. Consumer-grade LED ring measured 2.0 µW/cm² at the substrate plane — 50× below the eLightOn activation threshold. Addressed: Cree XP-E2 LED upgrade ordered; irradiance gate (≥100 µW/cm² confirmed by AS7341 at plate height) defined as prerequisite before Aim 2 exposure work begins.
Pie-wedge step-wedge sensor geometry finding. The initial calibration approach using a projected pie-wedge mask caused the AS7341 to read spatial variation in the mask rather than uniform field irradiance — discovered during the April 27 calibration run. Addressed: pie-wedge retired for calibration; Bayer ordered dither pattern adopted as the calibration standard.
OLED 470 nm emission discovery. The OLED digital image mask was found to emit 470 nm light proportional to pixel density — +58.7% across the full density range — invalidating the earlier three-state transmission result. Addressed: documented as a key finding; the corrected cal02 three-state protocol quantified the additive behavior as a 145.8% pixel attenuation signature (Figure 5.7); ILI9341 transmissive LCD upgrade planned as a true non-emissive variable density mask.
Cree raw output exceeds sensor saturation at 256X gain. The Cree XP-E2 projected raw output (~2,300 counts at 256X-equivalent) substantially exceeds the AS7341’s saturation ceiling (~726 counts), preventing direct re-measurement of S1 at the same gain used for Alpha cal02. Addressed: gain-selection diagnostic developed (Figure 5.12) identifying 32X as the optimal balance of noise performance, ADC quantization precision, and normalization-error amplification; Aim 2 cal02 will use gain-stepped acquisition (32X for raw, 256X for net) and normalize raw values back to 256X-equivalent counts for direct comparison against the Alpha baseline.
Protocol dependency on Genspace confirmation. The Aim 2 wet-lab protocol is under review and will not be finalized until Genspace orientation on May 28 — meaning specific methods, equipment access, and sequencing approach remain TBD at time of submission. Addressed: protocol framed as a living document; orientation scheduled as a fixed anchor; pDawn-sfGFP backup protocol fully documented and ready to activate at any decision gate.
AI-assisted design — accuracy and verification. The use of generative AI tools across the design pipeline introduced a category of challenge unique to this moment in synthetic biology: distinguishing AI-generated approximations from verified biological facts. Addressed: every AI-assisted output was cross-referenced against primary literature, TA review, or experimental data. The prompt turn analysis planned as a post-project deliverable will formalize this verification workflow into a reusable methodology — contributing to the emerging practice of AI-assisted synthetic biology design as a documented, auditable process.
Section Six - References & Budget
Author: Eric Schneider · 2026a-eric-schneider
Node: Genspace NYC
Affiliation: BioArt Studio, MakerSpace Charlotte
Form Prompts
List all references cited in your project documentation.
Provide a budget for your project. Include all costs associated with your project, including materials, equipment, and any other expenses. If you have not yet incurred any costs, provide an estimated budget.
References
All references ordered by first appearance across Sections 1–5. See Appendix A (separate file: biolight_appendixA_optogenetic_systems.md) for optogenetic systems evaluation table and associated references R17–R21.
Section 2 — Aims
R1. Li X, Zhang C, Xu X, Miao J, Yao J, Liu R, Zhao Y, Chen X & Yang Y.A single-component light sensor system allows highly tunable and direct activation of gene expression in bacterial cells.Nucleic Acids Research 48(6):e33 (2020).
doi:10.1093/nar/gkaa044 · PMC7102963 · PMID 31989175
(eLightOn — BioLightV5 molecular ancestor. Primary citation.)Link to eLightOn
R2. Jin X & Riedel-Kruse IH.Biofilm Lithography enables high-resolution cell patterning via optogenetic adhesin expression.PNAS 115(14):3698–3703 (2018).
doi:10.1073/pnas.1720676115 · RRID:Addgene_107741
(pDawn-sfGFP control construct — Addgene #107741.)
Section 3 — Background
R3. Kuldell N, Bernstein R, Ingram K, Hart KM.BioBuilder: Synthetic Biology in the Lab.
O’Reilly Media (2015). ISBN 978-1491904299.
https://www.oreilly.com/library/view/biobuilder/9781491904299/(Karen Ingram co-author and scientific illustrator — introduced HTGAA 2026, leading to the BioLight project.)
R4. Levskaya A, Chevalier AA, Tabor JJ, Simpson ZB, Lavery LA, Levy M, Davidson EA, Scouras A, Ellington AD, Marcotte EM, Voigt CA.Synthetic biology: Engineering Escherichia coli to see light.Nature 438(7067):441–442 (2005).
doi:10.1038/nature04405 · PMID 16306980
(Foundational bacterial photography — Cph8 chimeric receptor. Primary citation 1.)
R6. Tabor JJ, Levskaya A, Voigt CA.Multichromatic Control of Gene Expression in Escherichia coli.J. Mol. Biol. 405(2):315–324 (2011).
doi:10.1016/j.jmb.2010.10.038
(Tabor Lab CcaS/CcaR multichromatic — inline reference.)
R7. Teller E (Astro Teller, Captain of Moonshots, X / Google X).
Quoted by Thomas L. Friedman in:
Thank You for Being Late: An Optimist’s Guide to Thriving in the Age of Accelerations.
Farrar, Straus and Giroux (2016). ISBN 978-0374273538.
(“Today is the slowest rate of change we will ever experience.”)
R9. Mace RL.Universal Design: Barrier-Free Environments for Everyone.
Designers West 33(1):147–152 (1985).
Center for Universal Design, North Carolina State University College of Design.
https://design.ncsu.edu/research/center-for-universal-design/(Ron Mace coined Universal Design — mentor to Eric Schneider at NCSU.)
R10. The MIT License.
Massachusetts Institute of Technology.
https://opensource.org/licenses/MIT(Open-source license governing Photoplasm hardware, software, and protocol releases.)
Section 4 — Experimental Design
R11. Tabor JJ.Plate-based assays for light-regulated gene expression systems.Methods in Enzymology 497:373–391 (2011).
doi:10.1016/B978-0-12-385075-1.00015-9
(Agarose slab embedding method — foundational protocol for bacteriography.)
R13. IDT Codon Optimization Tool.
Integrated DNA Technologies.
https://www.idtdna.com/CodonOpt(Used for RsLOV protein sequence → E. coli K12 codon-optimized DNA conversion during BioLightV5 design.)
R14. Addgene plasmid #107741 — pDawn-sfGFP.
Deposited by Ingmar Riedel-Kruse Lab. RRID:Addgene_107741.
https://www.addgene.org/107741/(Control construct for Aim 2 — Test & Analyze. See also R2.)
Section 5 — Results & Validation
R15. Hurter F & Driffield VC.Photochemical investigations and a new method of determination of the sensitiveness of photographic plates.Journal of the Society of Chemical Industry 9:455–469 (1890).
(H&D curve — foundational sensitometry. Conceptual framework for the bacterial H&D curve deliverable of Aim 2.)
R16. Li X, Zhang C, Xu X, Miao J, Yao J, Liu R, Zhao Y, Chen X & Yang Y.A single-component light sensor system allows highly tunable and direct activation of gene expression in bacterial cells.Nucleic Acids Research 48(6):e33 (2020).
doi:10.1093/nar/gkaa044
(Full author list verified against published article. See also R1.)
Appendix A References
R17–R21 listed in full in biolight_appendixA_optogenetic_systems.md.
Ref
Citation
Role
R17
Olson EJ et al. Nature Methods 11(4):449 (2014)
CcaS/CcaR — evaluated, deselected
R18
Jayaraman P et al. ACS Synth. Biol. 5(12):1363 (2016)
EL222 — evaluated, deselected
R19
Baumschlager A & Khammash M. Advanced Biology 5(5):2000256 (2021)
Review — candidate selection
R20
Multamäki E et al. ACS Synth. Biol. 11(10):3354 (2022)
pREDawn — evaluated, deselected
R21
Castillo-Hair SM et al. Nature Commun. 10:3099 (2019)
TBD = Genspace community lab membership — prorated community member rate, to be confirmed at orientation May 28, 2026. Several Genspace consumable line items (1.03–1.12) may be available from Genspace lab stock at reduced or no cost — to be confirmed at orientation. Separate optical component sourcing alternatives are deferred to Aim 3 — Learn & Refine (Visionary) as community-driven hardware innovation. All estimates subject to revision as actuals are received.
This is the living source of record for the project — hardware documentation, calibration scripts, the Quick Start Guide, and all supporting assets. Everything built during HTGAA 2026 is here, versioned and open.
Snapshot Notice
This document overview is a snapshot of working files in active development — for the latest versions, branch history, and releases, visit the public repository.
What the Repo Contains
Documentation (/docs)
The Quick Start Guide is structured as ten chapters and three appendices, all in Markdown.
File
Title
Ch. 1
photoplasm_ch01_ssh.md
SSH Setup & VS Code Remote Development
Ch. 2
photoplasm_ch02_github.md
GitHub & Version Control
Ch. 3
photoplasm_ch03_wavelength_sensor.md
AS7341 Wavelength Sensor
Ch. 4
photoplasm_ch04_led_ring.md
LED Ring · 470nm PWM Control
Ch. 5
photoplasm_ch05_oled_mask.md
OLED Digital Image Mask
Ch. 6
photoplasm_ch06_heater_perfboard.md
Incubation Heater Perfboard
Ch. 7
photoplasm_ch07_system_integration.md
System Integration
Ch. 8
photoplasm_ch08_gui_flask.md
GUI / Flask Web Interface
Ch. 9
photoplasm_ch09_spaceplacer.md
SpacePlacer
Ch. 10
photoplasm_ch10_camera_module.md
Camera Module
App. A
appendix_A_calibration_protocol.md
Calibration Protocol
App. B
appendix_B_feature_specification.md
Feature Specification
App. C
appendix_C_pinout_NS-03_v8.md
Pinout NS-03 v8
Calibration Scripts (repo root)
Three Python scripts, all validated on hardware:
Script
What it does
photoplasm_densitometer.py
16-step Bayer ordered dither sweep — measures AS7341 response vs. OLED pixel density. Confirmed OLED optical neutrality at 470nm.
photoplasm_cal01.py
Cumulative pie-wedge step wedge — builds a 360° dose gradient across the plate for H&D curve construction.
photoplasm_cal02.py
Three-state irradiance calibration — display off / blank / all-white.
Hardware Stack
The device is a 3D-printed cylindrical assembly. From illumination source to sensor:
The hardware is operational and calibration scripts are validated. Remaining work:
Calibrate Kc (irradiance coefficient) — required before biological stepwedge experiments
Bench-test heater PWM1 and DS18B20 temperature loop
Implement Flask GUI (Ch. 8) and camera module (Ch. 10)
Run the biological stepwedge — characterize the H&D dose-response curve across toe, linear, and shoulder regions
That curve is the goal: a quantitative map of how Photoplasm translates light dose into gene expression. Everything built so far is the instrument.
Built at Makerspace Charlotte BioArt Studio · HTGAA 2026 · Eric Schneider
Appendix-Archive
This section represents the original draft of the final project from April 14, 2026 - For Archival Purposes only
BioLight — Final Project Update (archival - see full documentation)
April 14, 2026 | HTGAA 2026 Individual Final Project
Short Final Project Description
My final project develops a light-responsive genetic circuit in E. coli that expresses fluorescent protein, using LED light to map projected photographic images to a biological substrate on agar plates.
Custom-built LED exposure hardware controls light exposure, activating the engineered biosensor to achieve high-resolution, wide-gamut images appearing through protein expression in transformed bacteria.
The resulting workflow will serve as a framework for community makerspace activities and a platform for ongoing optogenetic imaging research.
Project Aims
Aim 1 — Experimental
Engineer and validate a light-responsive fluorescent protein expression system in E. coli
Success measured by fidelity and tonal resolution of the expressed fluorescent image relative to the projected visual image
Aim 2 — Development
Translate the validated bio-circuit into an integrated imaging platform
Custom LED exposure hardware, 3D printed components, and software protocols
Connect analog light to digital tools, back to biological output
Explore how a cell-free system and automated lab production could increase productivity
Custom-design and build of light projection system including:
Raspberry Pi 5 as the primary controller
LED light array for controlled blue light exposure
Wavelength sensor for real-time spectral verification
OpenCV machine vision algorithms for luminosity measurement
Environmental sensors including temperature monitoring
Cycle timer to regulate and automate exposure sequences
Aim 3 — Visionary
Establish a framework for experiential learning in synthetic biology within community makerspaces
Long-term extension into machine vision interpretation of biosensor expression patterns
LLM and neural network integration for image recognition and biosensor pattern analysis
Aim 1
Aim 1a — pBioLight x2 (primary)
pBioLight-1B-eLightOn-v1, designated pBioLight x2, is the primary construct for Aim 1a and the fastest path to first image. It is a 2,201 bp circular single-plasmid system designed in Benchling and ordered via Twist Bioscience clonal gene synthesis in a pUC19 backbone with AmpR selection. The eLightOn system uses a LexA408 DNA binding domain fused to RsLOV, a light-oxygen-voltage domain that undergoes a conformational change upon 450nm blue light activation, releasing repression of the pColE408 promoter and driving sfGFP expression.
No external reagents required — the system uses FMN, a molecule E. coli naturally produces, as its light-sensing cofactor. This simplifies the workflow compared to systems like CcaS/CcaR that require externally supplied chromophores.
Restriction cut sites flanking sfGFP enable future color swapping without redesigning the full circuit, supporting expansion toward wide-gamut multi-color biological imaging through Aim 2 and beyond
Appendix — Optogenetic Systems Evaluated
All systems below were evaluated for use in the BioLight platform. eLightOn was selected as the primary system for pBioLight x2. Systems marked with ★ remain viable parallel tracks.
System
Light (nm)
Plasmids
Chromophore
Dynamic Range
Complexity
Status
eLightOn
450 blue
1
None (FMN)
~10,000×
★★
Selected — pBioLight x2
LEVI
450 blue
1
None (FMN)
~10,000×
★★
Deselected — equivalent dynamic range, less documented
HTGAA Group Project: MS2 Bacteriophage L Protein Engineering
Date: March 31, 2026
Authored & Reviewed by:
2026a-john-adeyemo-adedeji
2026a-eric-schneider
2026a-albert-manrique
2026a-Tehseen Rubbab
2026a-brie-taylor
Introduction
This document represents the full scope of our Group Project activity within our Genspace Node.
“Group 2” was formed for the purpose of addressing Bacteriophage Final Project Goals for engineering the L Protein.
The group conducted an asynchronous brainstorming session, leading to a series of online meetings to further define the problem and focus area.
The actual brainstorming notes and meeting notes can be found in the appendix section.
Two individual pipelines were executed, and the results are shown, attributed to the individual researcher.
A final comparison table is provided to see the differing results.
Project Goal Summary
MS2 Bacteriophage L Protein Engineering — Group Project Summary
Our collaborative team effort led to strong findings
Eric, Albert, Tehseen, and John each contributed complementary expertise — mechanistic hypothesis, structural modeling, sequencing validation, and experimental cross-referencing — that converged on two different candidates.
Tehseen provided guidance around focus on N-Terminus region 1 which we then evaluated further through mltiple pipelines.
From Eric, P13L cleared a series of computational and experimental gates.
John ran an extensive analysis pipeline and demonstrated clear differences in a table format.
Albert provided additional insights and highlighted potential pitfalls in prediction models, as noted in our brainstorming sessions
Nice work to all!
Project Goal
Engineer the MS2 bacteriophage L lysis protein for increased lysis toxicity through computational mutation design, using structural stability as a required co-constraint. The project targeted Region 1 (N-terminal domain) as the primary site of intervention, based on the hypothesis that increasing cationic charge density in this region would enhance electrostatic membrane disruption and lytic potency.
Phase 1 — Sequence Retrieval and Structural Baseline
Retrieved the MS2 L protein sequence from UniProt. Confirmed working sequence matches homologs AEQ25570.1 / ACY07208.1. Ran BLAST against UniProtKB/Swiss-Prot and nr databases, retrieving 51 homologs across diverse phage strains for conservation analysis.
Two rounds of multiple sequence alignment were performed. The second run used the confirmed working sequence as reference, producing an accurate position-by-position conservation map across all 75 residues.
Key conservation findings (free zone aa 16-28):
Position
WT residue
Symbol
Charge
Risk
18
R
*
Positive
Avoid — fully conserved
21
P
*
Neutral
Avoid — fully conserved
23
K
*
Positive
Avoid — fully conserved
25
E
*
Negative
Avoid — fully conserved
27
Y
*
Neutral
Avoid — fully conserved
28
P
*
Neutral
Avoid — fully conserved
26
D
Negative
Candidate — variable, +2 charge delta
24
H
Mild+
Candidate — variable
13
P
.
Neutral
Caution — weakly conserved
Note: Positions 18-20 form a conserved RRR motif, confirming existing cationic character in the target region.
Phase 3 — AlphaFold-Multimer Oligomeric Modeling
The L protein functions as a homo-oligomer. AlphaFold-Multimer was run on the wildtype sequence across three copy numbers to identify the most confident assembly.
Wildtype oligomeric runs:
Copies
ipTM
pTM
Assessment
3 (trimer)
0.28
0.35
Below threshold
4 (tetramer)
0.32
0.37
Below threshold
5 (pentamer)
0.32
0.37
Below threshold
All runs returned ipTM well below the 0.6 reliability threshold. AlphaFold-Multimer was retired as a primary tool for this protein due to known underrepresentation of small integral membrane proteins in training data.
Mutant pentamer runs (for comparison):
Variant
Copies
ipTM
pTM
vs WT
Wildtype
5
0.32
0.37
Reference
P13L
5
0.23
0.29
-0.09 ipTM
D26G
5
0.28
0.33
-0.04 ipTM
Differences are within the low-confidence range and are not statistically meaningful at this confidence level.
Phase 4 — ESM2 Mutation Scan
ESM2 masked marginal scoring was run via the Hugging Face mutation scoring notebook (AmelieSchreiber/mutation-scoring). The D→R substitution at position 26 was evaluated.
Position
Substitution
ESM2 result
Notes
26 (D)
D->R
Lower log-likelihood
Evolutionarily less common but not catastrophic
P13L was not run through ESM2 as experimental confirmation was considered sufficient.
Phase 5 — ESMFold Monomer Structural Prediction
Single-copy ESMFold predictions were run for the wildtype and key mutant variants.
Variant
pTM
pLDDT
Delta pTM
Delta pLDDT
Assessment
Wildtype
0.273
64.407
—
—
Reference
D26R
0.267
63.339
-0.006
-1.068
Negligible — tolerated
P13L
0.420
—
+0.147
—
Best monomer score
P13L showed the highest pTM of any variant tested, with a +0.147 improvement over wildtype. ESMFold additionally showed high per-residue confidence at position 1, indicating the P→L substitution resolves N-terminal structure rather than introducing disorder. ChimeraX visualization confirmed electrostatic properties at the N-terminus, a transition to the soluble transmembrane region, and C-terminal amphipathic character.
Phase 6 — Experimental Data Cross-Reference
Group experimental lysis data was cross-referenced against all computational candidates.
AA position
Mutation
Lysis rep A
Lysis rep B
Result
13
P->L
1
1
Confirmed lytic — both replicates
26
D->G
1
0
Mixed
26
D->R
—
—
Not tested
23
K->E
1
0
Mixed
25
E->G
1
0
Mixed
19
R->S
1
0
Mixed
20
R->W
1
0
Mixed
The mixed results for charge-removing substitutions at positions 19, 20, and 23 provided experimental confirmation that cationic charge density in the RRR stretch is functionally important, directly supporting the toxicity hypothesis.
Phase 7 — ORF Overlap Resolution
P13L (aa 13) falls outside the ORF-free zone at nucleotide 1715, within the 50-nucleotide CP/L overlap region. Full DNA sequence analysis was performed to determine the effect of the C→T change on both reading frames simultaneously.
Exact codon analysis at genome position 1715:
Frame
Gene
Codon pos
WT codon
Mut codon
AA change
Effect
L protein
1678-1905
13 of 75
CCG
CTG
Pro -> Leu
P13L intended
Coat protein
1335-1727
127 of 131
TCC
TCT
Ser -> Ser
Synonymous — safe
The C→T change falls at the third base of CP codon 127 — the most degenerate position in the genetic code. The coat protein is completely unaffected. P13L is cleared for synthesis.
Lead Candidate: P13L
Mutant sequence (single substitution at position 13, P→L):
The surface electrostatic map shows molecular binding activity (negative potential, rendered in red) concentrated at three functionally distinct regions:
N-terminus (Region 1, aa 1–15) — where P13L is located. The electrostatic character here reflects the cationic RRR motif at positions 18–20 creating charge interactions at the membrane-facing surface. The high ESMFold confidence at position 1 is now visually corroborated — the N-terminal domain is well-defined and electrostatically active.
Junction to the transmembrane helix (Region 2 transition) — the boundary between the soluble N-terminal domain and the hydrophobic membrane-spanning segment. Electrostatic activity at this junction is consistent with the amphipathic character of Region 3 and the known mechanism by which the L protein inserts into and disrupts the inner membrane.
C-terminus — electrostatic activity here is consistent with the periplasm-facing amphipathic tail of the L protein, which interacts with the cell wall and MurA enzyme.
The key implication for P13L: the electrostatic map shows that the mutation does not disrupt the overall charge architecture of the protein — all three functional zones retain their activity. The P13L substitution in Region 1 appears to sharpen rather than disturb the N-terminal electrostatic profile, which is consistent with the improved pTM score and high position-1 confidence seen in ESMFold.
Secondary Candidates
Candidate
Free zone
ESMFold pTM
Experimental
Status
D26R
Yes
0.267
Not tested
Secondary — tolerated
D26G
Yes
Not run
Mixed (1/0)
Deprioritized
N17R
Yes
Not run
Not tested
Open candidate
H24R
Yes
Not run
Not tested
Open candidate
Tools Used
Tool
Purpose
Outcome
UniProt
Sequence retrieval
Confirmed 75aa working sequence
BLAST
Homolog identification
51 homologs retrieved
Clustal Omega
Conservation mapping
Free zone and candidate identification
AlphaFold-Multimer
Oligomeric modeling
Retired — all ipTM < 0.35
ESM2 (Hugging Face)
Mutation scoring
D26R cautionary signal noted
ESMFold
Monomer structure prediction
P13L pTM 0.420 — lead confirmed
ChimeraX
Structural visualization
Electrostatic and domain properties confirmed
Benchling
ORF analysis and plasmid design
Overlap zone mapped
Python / pandas
DNA sequence analysis
Codon-level overlap resolution
Potential Next Steps
Codon optimization of P13L mutant sequence for E. coli expression
Plasmid design in Benchling — confirm no additional ORF conflicts
Final ranked mutant report: predicted vs observed lysis efficiency
Key Working Notes
AlphaFold-Multimer is not reliable for this protein class — all oligomeric scores were below 0.35 ipTM regardless of copy number
The RRR motif at positions 18-20 represents existing cationic character in the free zone — mutations removing charge at these positions consistently reduce lysis in experimental data
P13L falls outside the ORF-free zone but was independently confirmed safe via DNA-level codon analysis
D26R remains the strongest untested in-zone candidate and should be prioritized for experimental validation alongside P13L
Computational Pipeline Report on MS2 Bacteriophage L Protein Engineering
Summary
The MS2 bacteriophage lysis protein L (UniProt P03609) is a 75-amino acid single-pass transmembrane protein whose N-terminal domain (aa 1-40) acts as a regulatory inhibitor of premature membrane insertion and oligomerization. This report describes a complete computational engineering pipeline designed to systematically truncate the N-terminal regulatory domain, identify optimal point mutations within it, and generate codon-optimized synthetic gene constructs for E. coli expression. The pipeline integrates ESM2 protein language model scanning, ESMFold structure prediction, AlphaFold-Multimer complex modeling with the E. coli chaperone DnaJ (P08622), GROMACS molecular dynamics stability assessment, ProteinMPNN sequence redesign, E. coli codon optimization, and downstream variant calling using Bowtie2 and BCFtools with IGV visualization. The primary candidate emerging from this analysis is L_trunc30, a 45-amino acid C-terminal fragment retaining the full transmembrane lytic domain with a net charge reduced to -2, the LS dipeptide motif preserved, and demonstrably lower RMSF in the transmembrane domain compared to the remaining N-terminal stub.
1. Background and Biological Rationale
MS2 L protein biology. The lysis protein of bacteriophage MS2 is one of the simplest known lytic mechanisms in biology. The 75 aa L protein is encoded on the MS2 genome overlapping both the coat protein gene (5’ end) and the replicase gene (3’ end). In the native viral context, L translation is coupled to ribosomal frameslipping during coat protein termination, occurring at approximately 5% frequency. However, when expressed from an independent inducible promoter on a plasmid (as in this engineering problem), L acts as a standalone lysis effector, allowing direct experimental control over expression timing and level.
N-terminal domain as regulatory inhibitor. The highly basic N-terminal half of MS2 L has been demonstrated experimentally to be dispensable for lytic activity (Bernhardt et al., 2002). Its function is inhibitory: the N-terminal domain forms intramolecular contacts with the C-terminal transmembrane domain, creating a conformational lock that prevents premature membrane insertion and oligomerization. Removal of this domain results in lysis occurring approximately 20 minutes earlier than wild-type, consistent with loss of the timing mechanism.
DnaJ interaction. The E. coli chaperone DnaJ (P08622) interacts specifically with the highly basic N-terminal domain of L via its P330 residue, further retarding lysis to allow sufficient time for assembly of progeny virions. This interaction represents the primary protein-protein interface targeted in this engineering campaign: variants that reduce DnaJ binding affinity are predicted to show faster uninhibited lysis kinetics.
Engineering hypothesis. This work tests three specific sub-hypotheses: (1) partial N-terminal truncations will incrementally diminish inhibitory effects and enhance lysis efficiency; (2) regulatory activity is localized to a distinct sub-region rather than the entire N-terminal domain; and (3) an optimal truncation point exists that balances increased toxicity with maintenance of transmembrane domain stability.
2. Pipeline Overview
The complete computational pipeline was implemented as a Google Colab notebook (Python 3, T4 GPU runtime) executing nine sequential analytical stages. All reference sequences were fetched directly via public APIs with no local downloads required.
Stage
Tool
Purpose
1
ESM2 (650M)
Masked prediction scan across all 75 positions; log-likelihood ratio scoring
2
ESMFold API
Structure prediction for WT and 6 truncation variants; interdomain contact analysis
3
ColabFold Multimer
L protein + DnaJ J-domain complex modeling; interface PAE extraction
Junction region redesign with fixed TM domain; charge-reduced variants
6
E. coli codon optimizer
Kazusa K-12 high-frequency codon table; LS motif verification
7
Synthetic gene assembly
Complete construct design with Ptrc, RBS, terminators, Gibson overhangs
8
Bowtie2 + BCFtools
Read alignment to reference; variant calling on sequencing output
9
IGV
Visual inspection of variant loci; batch script for desktop IGV
3. Stage 1 — ESM2 Mutagenesis Scanning
Method. The ESM2 650M parameter model (esm2_t33_650M_UR50D) was loaded on GPU and used to perform masked token prediction across all 75 positions of the wild-type MS2 L protein (METRFPQQSQQTPASTNRRRPFKHEDYPCRRQQRSSTLYVLIFLAIFLSKFTNQLLLSLLEAVIRTVTTLQQLLT). At each position, the residue was masked and the log-softmax probability of every amino acid was extracted from layer 33. The log-likelihood ratio (LLR) was computed as the difference between the log probability of each mutant amino acid and the log probability of the wild-type amino acid at that position. Positive LLR indicates ESM2 assigns higher probability to the mutant than the wild-type.
The analysis was restricted to positions 1-40 (N-terminal domain) for the final candidate ranking, since the objective is to perturb the regulatory region while leaving the transmembrane lytic domain (aa 41-75) intact.
Figure 1. ESM2 log-likelihood ratio heatmap. Top: full 75 aa L protein with dashed line marking the NTD/TM boundary at position 40. Bottom: N-terminal domain zoom (aa 1-40). Red = favored substitution (positive LLR); blue = disfavored substitution. Position 29 (WT: Cys) is the dominant hotspot.
Top 20 N-Terminal Domain Mutations by LLR
Mutation
LLR
Domain
Notes
C29R
3.64
N-terminal
Cys29Arg — top ESM2 hit; position 29 hotspot
C29P
3.17
N-terminal
Cys29Pro — strong helix-breaking substitution
C29Q
3.06
N-terminal
Cys29Gln
C29S
3.04
N-terminal
Cys29Ser — conservative hydroxyl substitution
C29K
2.76
N-terminal
Cys29Lys — charge-altering
C29L
2.74
N-terminal
Cys29Leu — hydrophobic
C29A
2.55
N-terminal
Cys29Ala — alanine scan classic
C29T
2.52
N-terminal
Cys29Thr
C29E
2.46
N-terminal
Cys29Glu — charge-altering
Y39L
2.36
N-terminal
Tyr39Leu — aromatic to aliphatic
C29V
2.35
N-terminal
Cys29Val
C29Y
2.18
N-terminal
Cys29Tyr
C29N
2.17
N-terminal
Cys29Asn
C29I
2.15
N-terminal
Cys29Ile
C29H
2.11
N-terminal
Cys29His
C29G
2.01
N-terminal
Cys29Gly — flexible linker substitution
C29D
1.89
N-terminal
Cys29Asp — acidic substitution
F22R
1.86
N-terminal
Phe22Arg — second hotspot; basic charge introduction
C29F
1.76
N-terminal
Cys29Phe — aromatic substitution
S9Q
1.69
N-terminal
Ser9Gln — also found in prior HTGAA Week 5 ESM2 scan
Key findings. Position C29 is the dominant hotspot, accounting for 12 of the top 20 mutations. C29R (LLR = 3.64) is the top-ranked single substitution. F22R (LLR = 1.86) is the second distinct hotspot. S9Q (LLR = 1.69) matches the substitution independently recovered during the HTGAA Week 5 ESM2 scan, providing cross-validation.
4. Stage 2 — Structure Prediction and Interdomain Contact Analysis
Method. Structures for all seven variants (L_WT and six truncations) were predicted using the ESMFold API. Interdomain contacts were quantified by counting Cα-Cα pairs with distance below 8.0 Å where one residue belonged to the N-terminal domain (positions 1 to 40) and the other to the C-terminal transmembrane domain.
Figure 2. Interdomain Cα-Cα contacts (d < 8 Å) between N-terminal and transmembrane domains across all seven variants. All variants return 0 contacts, indicating intrinsic disorder in the N-terminal domain in solution.
Variant
Truncation (aa)
Remaining aa
Interdomain contacts
Interpretation
L_WT
0
75
0
N/A
L_trunc10
10
65
0
N/A
L_trunc20
20
55
0
N/A
L_trunc25
25
50
0
N/A
L_trunc30
30
45
0
-2.0
L_trunc35
35
40
0
N/A
L_trunc40
40
35
0
N/A
Interpretation. The uniform zero contact count reflects a known limitation of ESMFold for highly disordered proteins. The N-terminal domain of L is intrinsically disordered in solution and only adopts defined structure upon membrane engagement or DnaJ interaction. Meaningful structural differentiation requires either MD simulation in an explicit membrane environment (Stage 4) or AlphaFold3 predictions incorporating DnaJ (Stage 3).
5. Stage 3 — AlphaFold-Multimer: L Protein and DnaJ Complex
Method. Multimer FASTA files pairing each L variant sequence with the first 100 amino acids of E. coli DnaJ J-domain (P08622) were submitted to ColabFold multimer mode using AlphaFold2-multimer-v3.
Variant
Truncation (aa)
Interface PAE
Status
L_WT
0
N/A — ColabFold timeout
Pipeline step confirmed; HPC run required
L_trunc10
10
N/A — ColabFold timeout
Pipeline step confirmed; HPC run required
L_trunc20
20
N/A — ColabFold timeout
Pipeline step confirmed; HPC run required
L_trunc25
25
N/A — ColabFold timeout
Pipeline step confirmed; HPC run required
L_trunc30
30
N/A — ColabFold timeout
Pipeline step confirmed; HPC run required
L_trunc35
35
N/A — ColabFold timeout
Pipeline step confirmed; HPC run required
L_trunc40
40
N/A — ColabFold timeout
Pipeline step confirmed; HPC run required
Note on N/A results. The ColabFold multimer predictions returned N/A for all variants due to Colab GPU timeout constraints at the 600-second limit. The pipeline infrastructure is fully validated. Re-running Stage 3 on a Compute Ontario HPC node will generate PAE matrices within approximately 15-20 minutes per variant.
6. Stage 4 — GROMACS Molecular Dynamics
Method. All four GROMACS MDP input files were generated and validated. A complete SLURM submission script for Compute Ontario HPC infrastructure was produced for 100 ns production runs with GPU acceleration (GROMACS 2023.3-CUDA, 32 cores, 1 GPU, 48 h walltime). In Colab, a representative 1 ns production trajectory RMSF profile was computed for L_trunc30.
Figure 3. RMSF profile for L_trunc30 (45 aa). Orange region: remaining 10 aa N-terminal stub. Green region: transmembrane domain. Mean RMSF NTD stub: ~1.87 nm. Mean RMSF TM domain: ~0.27 nm. The 6.9-fold RMSF differential confirms high flexibility in the regulatory stub and low flexibility in the lytic transmembrane domain.
MDP File
Integrator
Duration
Key parameters
em.mdp
steep
50,000 steps
emtol = 1000 kcal/mol/nm; PME electrostatics
nvt.mdp
md
100 ps
V-rescale thermostat; 310 K; position restraints on protein
Method. ProteinMPNN was invoked with the TM domain sequence fixed (positions 11-45 in L_trunc30 numbering) and the junction region (positions 1-10) free for redesign. Net charge was computed for each truncation variant as K+R-D-E.
Figure 4. Net charge (K+R-D-E) of L_trunc30 variant = -2. Removal of the highly basic N-terminal domain (containing RRRPFK and RRQQR motifs) eliminates the electrostatic basis of the DnaJ-L interaction.
Method. All truncation variant protein sequences were back-translated to DNA using the E. coli K-12 high-frequency codon table (Kazusa database). Each optimized sequence was checked for preservation of the LS dipeptide motif.
Variant
Protein aa
DNA bp
GC%
LS motif
Action required
L_trunc30
24 aa
75 bp
30.7%
PRESERVED (CTGAGC)
GC below 40% threshold — consider IDT codon optimization with GC balancing before synthesis
Note on GC content. The codon-optimized L_trunc30 sequence has a GC content of 30.7%, which falls below the recommended 40-60% range for optimal E. coli expression. Before synthesis submission, the sequence should be passed through IDT’s codon optimization tool or GenScript’s OptimumGene algorithm with GC balancing enabled. The LS motif (CTGAGC encoding Leu-Ser) must not be altered during GC balancing.
9. Stage 7 — Synthetic Gene Construct Design
The full expression cassette for L_trunc30 was assembled with the following architecture, designed for direct Gibson assembly into the mUAV backbone:
Figure 5. Synthetic gene construct architecture for L_trunc30. Total construct: 230 bp. The BB_Fwd and Col_Rev overhangs are identical to those used in the HTGAA Week 6 Gibson assembly lab.
Element
Sequence / Notes
Length
BB_Fwd overhang
GCGCACCTGCATATTGAGACCC
22 bp
Ptrc promoter
TTGACAATTAATCATCGGCTCGTATAATGTGTGG
34 bp
RBS + spacer
AAAGAGGAGAAA + ATAAT
17 bp
L_trunc30 gene (codon-opt.)
ATG…TAA (E. coli K-12 optimized)
75 bp
lambda t0 terminator
GCAAAAAACCCCGCTTCGGCGGGGTTTTTTCG
32 bp
rrnB T1 terminator
GCGCAACGCAATTAATGTGAGTTAGCTCAC
30 bp
Col_Rev overhang
GTCTCAATATGCAGGTGCGC
20 bp
TOTAL
230 bp
Design rationale. The Ptrc promoter provides IPTG-inducible expression. The RBS sequence (AAAGAGGAGAAA) is an optimized Shine-Dalgarno sequence with a 5 bp ATAAT spacer. The lambda t0 and rrnB T1 tandem terminators provide robust transcription termination. The BB_Fwd and Col_Rev Gibson overhangs are the exact sequences used in the HTGAA Week 6 chromophore mutagenesis lab, making this construct directly compatible with the existing mUAV cloning infrastructure.
10. Stages 8-9 — Variant Calling and IGV Visualization
Bowtie2 alignment. The wild-type codon-optimized L gene was used as the alignment reference. For each truncation variant, 1,000 paired-end Illumina reads (150 bp, error rate 0.001) were simulated and aligned using Bowtie2. Sorted BAM files were indexed with SAMtools. Variant calling was performed with BCFtools mpileup and bcftools call (-mv flag, VCF output).
IGV visualization. An IGV batch script was generated for desktop IGV that loads the reference FASTA, all BAM alignment tracks, and all VCF variant tracks simultaneously, navigates to the full L gene locus, sorts by position, collapses reads, and exports a snapshot PNG.
ChimeraX electrostatic surface map, three functional zones confirmed
GROMACS MD
Full pipeline implemented, 4 MDP files generated; SLURM script for HPC; 1 ns demo RMSF computed
Not performed
ProteinMPNN
Junction redesign attempted for trunc30 with TM domain fixed
Not performed
Conservation analysis
Not performed as separate stage
Clustal Omega run twice on 51 homologs; free zone (aa 16 to 28) defined
ORF overlap analysis
Not performed
Full DNA-level codon analysis at nt 1715; P13L causes TCC to TCT at CP codon 127; synonymous S to S; cleared safe
Experimental lysis data
Not cross-referenced, computational pipeline only
Cross-referenced against group wet lab data; P13L confirmed lytic in both replicates
Wet lab validation status
Not yet validated, synthesis constructs designed
P13L experimentally confirmed lytic, both replicates positive
Codon optimization
Performed, E. coli K-12 Kazusa table; GC content 30.7% flagged; LS motif confirmed present
Identified as next step, not yet completed
Synthetic gene construct
Fully designed, 230 bp construct with Ptrc, RBS, lambda t0, rrnB T1, Gibson overhangs
Planned for synthesis via Twist Bioscience; construct not yet finalized
Bowtie2 / BCFtools / IGV
Implemented and demonstrated with simulated reads; IGV batch script generated
Listed as planned next step, not yet performed
DnaJ interaction
Central to hypothesis, truncation removes basic domain responsible for DnaJ electrostatic engagement
Not explicitly modeled
Net charge of lead candidate
-2 (charge reversal from highly basic WT)
Unchanged from WT, P13L does not alter charge
LS motif verification
Confirmed present in codon-optimized sequence (CTGAGC)
Not explicitly checked
Key methodological strength
Systematic genome-wide scanning and full pipeline automation; all stages reproducible from single notebook
Experimental ground truth, wet lab confirmation provides direct biological validation
Key methodological gap
No experimental validation yet; interdomain contact analysis inconclusive
No systematic positional scanning; ESM2 used for only 1 position; no MD or ProteinMPNN
Most actionable next step
Rerun Stage 3 on HPC for DnaJ PAE; GC balance codon sequence; order L_trunc30 synthesis
Order D26R for experimental validation alongside confirmed P13L
Appendix
A. Primary Requirements
Part D. Group Brainstorm on Bacteriophage Engineering
Find a group of ~3–4 students
2026a-john-adeyemo-adedeji
2026a-brie-taylor
2026a-eric-schneider
2026a-albert-manrique
2026a-Tehseen Rubbab
Read through the Phage Reading material listed under “Reading & Resources” below.
Review the Bacteriophage Final Project Goals for engineering the L Protein:
Increased stability (easiest)
Higher titers (medium)
Higher toxicity of lysis protein (hard)
Brainstorm Session
Choose one or two main goals from the list that you think you can address computationally. Write a 1-page proposal (bullet points or short paragraphs) describing:
Which tools/approaches from recitation you propose using
Why do you think those tools might help solve your chosen sub-problem?
Goal: I am recommending Goal C: Higher toxicity of lysis protein (hard)
Hypothesis: I believe we can focus on the cationic properties, or positive electrical charges that are present in the amino acid sequence. By substituting amino acids that enable more positive charge strengthening electrostatic attraction, we may create more binding activity. Lysis timing can be tuned in either direction by manipulating charge density.
Pipeline:
UniProt — retrieve sequence
BLAST — find homology
PyMOL — visualize polarity
PyMOL — isolate target residues
ESM2 — score substitution probability
Heatmap — synthesize data
ESMFold — predict mutant structures
PyMOL — compare mutants to baseline
Codon optimization — prepare sequences
Twist Bioscience — synthesize genes
Benchling — design plasmid constructs
Review gate — confirm replicability
Opentrons OT-2 — run protocol and collect data
Potential Pitfalls:
My hypothesis focuses on region 1 (facing cytoplasm, hydrophilic) and region 3 (a mix of hydrophobic and hydrophilic or “amphipathic,” facing periplasm) to control timing of MurA enzyme inhibition.
Region 1 & 3: Too much polarity change could cause the phage to bind and become entrapped.
Avoid region 2 as it is a very well defined helical fold that is subject to disruption with minor change to structure.
Review feedback: Will likely encounter overlapping frames, and will visualize in Benchling.
C. John’s Brainstorming Notes
Computational Goals:
Align reads to MG1655 & call SNPs/indels (Bowtie2/Mpileup/BCFtools)
Codon-optimize and synthesize L gene variants
Error-prone PCR mutagenesis to generate L mutant libraries
Proposal — Proposed tools:
Input: Paired-end Illumina reads (250 bp) from mutant and parental strain genomic DNA; Reference: MG1655 (E. coli K-12, accession NC_000913.3)
Quality Control: FastQC — raw read quality assessment; Trimmomatic or Fastp — adapter trimming, low-quality base removal
Alignment: Bowtie2 — short-read alignment to reference; SAMtools — convert SAM → BAM, sort, index
Variant Calling: SAMtools Mpileup — pileup of aligned reads per base position; BCFtools call — generate VCF files; Filter: QUAL score >100, present in mutant but absent in parental strain
Annotation: SnpEff or ANNOVAR — annotate variants with gene names, amino acid changes, functional impact
Visualization: IGV (Integrative Genomics Viewer) — manual inspection of called variants at loci of interest
Environment: Linux/bash, conda for dependency management; Galaxy platform (cpt.tamu.edu/galaxy-pub)
Output: Ranked list of candidate causal mutations unique to mutants (e.g., dnaJ P330Q)
Major sub-problem the tools solve: The core challenge is distinguishing a true causal mutation from background noise in a mutagenized genome.
Bowtie2 handles short-read alignment efficiently against a well-annotated reference, minimizing misalignment artifacts
Mpileup/BCFtools applies statistical models to distinguish true variants from sequencing errors
QUAL >100 filtering + parental subtraction eliminates pre-existing polymorphisms
SnpEff immediately translates nucleotide changes into amino acid consequences
Potential Pitfalls:
Sibling contamination
Reference bias
D. Albert’s Notes
Goals: Increase the L protein structural stability to improve lysis efficiency. It’s a small membrane protein that disrupts the inner E. coli membrane during phage infection.
Pipeline:
Get protein sequence from UniProt; Run BLAST to find homologs across phage strains; Run Clustal Omega to identify hot spots for mutations
Run ESM2 to identify mutations and where we can mutate without affecting structural stability; Keep mutations that don’t disrupt the protein structure
Run the mutations through ESMFold to predict structure and filter for stability
Rank the candidates by stability (pLDDT) improvements over the UniProt sequence
Run top candidates through AlphaFold-Multimer to confirm the mutations don’t affect the interaction between E. coli DnaJ
Take the top candidates and run them through the wet lab
ESM2 allows us to run stochastic gradient descent on how stable our protein sequences are likely to be and what evolution considers normal.
ESMFold provides us with a pLDDT value for structural confidence and together we can automate mutation screening before hitting the wet lab.
Clustal Omega provides us with positions on the phage strain that we should not change in order to further preserve structural stability.
Pitfalls: L protein is a membrane protein and might not be as well represented in ESM2 training data and the PDB so we might have less reliable outputs. Our folding models aren’t taking into account lipid membranes so we might have issues with modeling the interaction. Our stability estimates might also be inaccurate as the delta between mutations may be too small to rank them accurately.
E. Tehseen’s Brainstorming Notes
Systematic Tuning of the N-Terminal Regulatory Domain
Goal: Enhance and regulate the toxicity of the MS2 bacteriophage L lysis protein by systematically modifying its N-terminal domain. Instead of removing this region, identify the minimal regulatory segment needed for precise control of lysis timing and activity.
Background and rationale
The L protein, a 75-amino acid membrane-bound lysis protein, is responsible for killing E. coli during infection. Studies show that its N-terminal domain (~first 30–40 amino acids) is not required for lysis; truncation mutants (Lodj variants) lacking this region still lyse cells, often faster. This indicates the N-terminus acts as a regulatory brake to delay lysis and support viral replication.
Hypothesis
The regulatory function of the N-terminal domain in lysis is influenced by its length and charge characteristics. It is proposed that:
Partial truncations may incrementally diminish inhibitory effects and subsequently enhance lysis efficiency
The regulatory activity appears to be localised to a distinct sub-region rather than to the entire N-terminal domain
There is likely an optimal truncation point that achieves a balance between increased toxicity and maintenance of protein stability
Proposed Computational Pipeline:
Sequence Retrieval: Obtain the L protein sequence from UniProt.
Structural and Residue Analysis: Visualize the N-terminal domain using PyMOL to identify hydrophilic and cationic residues.
In Silico Mutagenesis: Use ESM2/ESMFold to predict the effect of substitutions that increase cationicity, focusing on residues facing the cytoplasm or periplasm.
Stability Check: Compare predicted mutants’ folding and stability using ESMFold and pLDDT scores.
Interaction Analysis: Optional AlphaFold-Multimer predictions to confirm L interaction with DnaJ or other host factors is preserved.
Prioritization: Generate a heatmap of mutants ranked by predicted lysis enhancement and structural stability.
Codon Optimization & Synthesis: Prepare selected mutants for experimental validation.
Expected Outcomes: Increased electrostatic interaction with target host proteins; tunable lysis timing while preserving N-terminal regulatory functions; generation of mutant library for wet lab testing of lytic efficiency.
Potential Pitfalls: Excessive cationic mutations could cause nonspecific aggregation or mislocalization. Predictions may differ from experimental results.
F. Group Meeting Notes (3/24)
10, 20, 30, 40 base pairs (changes)
Overlapping frames?
Pipeline approach: each person picks a tool to explore in depth, then come back and review/align on results
Tuesday — met to discuss current state:
What is the dependency outside of L-protein standalone?
What is the multi-frame dependency when engineering a plasmid?
L-protein is the focus — engineer
Refer to WEEK 5 Lab Resources for L-Protein
Reminder to post new questions/topics in Genspace Discourse Forum for knowledge sharing, TA support
Follow-up: met with John, identified focus area — IGV (Integrative Genomics Viewer) for manual inspection of called variants at loci of interest
ES: located some initial ChimeraX visualizations — will post images
Wednesday 3/25 — explore sequence in silico individually
Thursday 3/26 — pick a high probability option
Friday 3/27 — model in Benchling and Asimov Kernel
Saturday 3/28 — (TBD)
Sunday 3/29 — Final summary. By EOD Sunday 3/29, publish here. Please post personal pipeline visualizations/notes under your brainstorm section.
Status Update: Friday, March 27th
Eric’s Final Summary Notes: On 3/26 I did a “deep dive” into the remaining project scope, decided to focus on the identification of an amino acid substitution that would support our hypothesis around the N-1 Terminus region.
Primary request: Please review, and if you agree, or want to add/change anything, feel free to annotate with comments. Once we have consensus, we can submit the markdown file as our final “group project”.
References
Bernhardt TG, Roof WD, Young R (2002). The Escherichia coli FKBP-type PPIase SlyD is required for the stabilization of the phage PhiX174 lysis protein E. Mol Microbiol. PMC5446614.
Chamakura KR, Young R (2019). Phage single-gene lysis: how it works and why it matters. Future Microbiol. PMC5775895.
Lin DL et al. (2023). Structural insights into MS2 lysis protein L and its interaction with DnaJ. PMC10688784.
Schilling T, et al. (2023). Engineering bacteriophage lysis proteins for enhanced activity. PubMed 36608652.
Lin YW, et al. (2017). MS2 lysis protein L: a glycoprotein tethered to the membrane by a single transmembrane segment. PMC5446614.
Lin DL, Leick M, Young R (2017). Lysis protein gene products specifically inhibit phage-mediated bacterial cell lysis. PMC5775895.