Week 4 HW: Protein Design - Part I
Homework: Protein Design I
Objective:
- Learn basic concepts:
- amino acid structure
- 3D protein visualization
- the variety of ML-based design tools
- Brainstorm as a group how to apply these tools to engineer a better bacteriophage (setting the stage for the final project).
Part A. Conceptual Questions
Answer any NINE of the following questions from Shuguang Zhang: (i.e. you can select two to skip)
- How many molecules of amino acids do you take with a piece of 500 grams of meat? (on average an amino acid is ~100 Daltons)
At first, I thought that it would be a simple math conversion, but after a quick internet search, I realized that not every type of meat has the same amount of protein. According to Barr et al. (2025), 100 g of cooked red meat contains ~28–36 grams of protein, and 100 g of cooked white meat contains ~23–31 grams of protein. Because of this, I decided to use 30 grams of protein per 100 grams of meat as an approximation for the calculations.
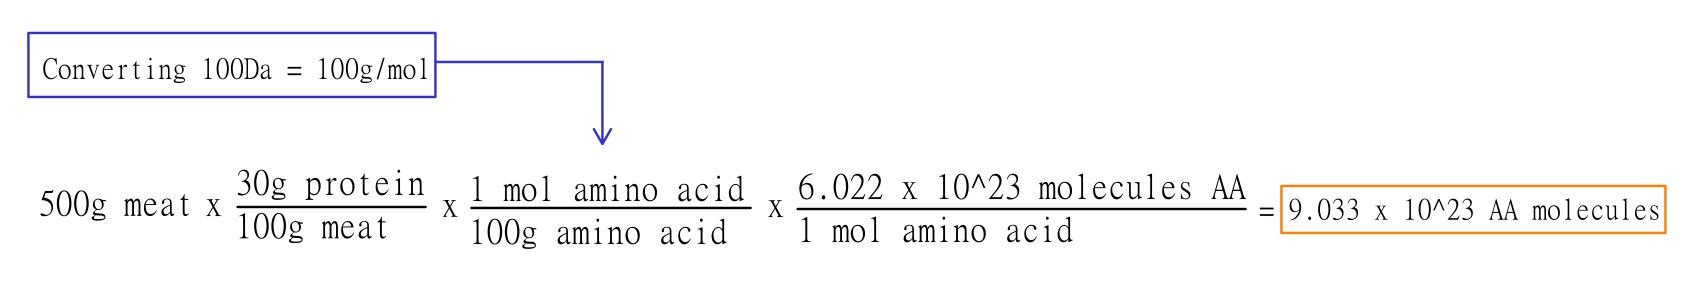
Since we know that there’s 30 grams of protein per 100 grams of meat, there would be 150 grams of protein in a piece of 500 grams of meat. These 150 grams of protein, then, are divided by 100 Daltons (which is equivalent to 100 g/mol AA) and finally converted into AA molecules, which gives us a result of approximately 9.033 x 10^23 amino acids!
- Why do humans eat beef but do not become a cow, eat fish but do not become fish?
Everything we eat is broken down into universal micro building blocks (amino acids, lipids, sugars). Our body doesn’t use the cow’s proteins directly; it hydrolyzes them and then uses our own genetic “code” to reassemble those building blocks into human proteins. It’s about the information (DNA), not the source of the bricks.
- Why are there only 20 natural amino acids?
It’s a balance between functional diversity and translational fidelity. These 20 provide enough chemical groups to build almost any catalytic or structural site. Adding more amino acids would increase the risk of errors during translation without a significant evolutionary “payoff.”
- Can you make other non-natural amino acids? Design some new amino acids.
- Where did amino acids come from before enzymes that make them, and before life started?
They likely came from abiotic synthesis (like the Miller-Urey experiment) using simple precursors ($CH_{4}$, $NH_{3}$, $H_{2}$, $H_{2}O$) and energy sources like lightning or hydrothermal vents. Also, carbonaceous meteorites (like Murchison) have shown that amino acids can form in space via Strecker synthesis.
- If you make an α-helix using D-amino acids, what handedness (right or left) would you expect?
Since natural L-amino acids form right-handed helices, a helix made of D-amino acids would be left-handed. It’s a direct mirror image dictated by the stereochemistry of the Cα atom.
- Can you discover additional helices in proteins?
Yes, besides the standard α-helix, proteins show other geometries like the tighter &3sub10;-helix or the wider π-helix. We also see Polyproline helices in collagen and can even design synthetic foldamers with helical shapes that do not exist in nature.
- Why are most molecular helices right-handed?
It’s mostly due to the L-homochirality of life. Because all biological proteins are made of L-amino acids, the steric clashes between side chains and the backbone favor the right-handed twist as the most thermodynamically stable conformation (lowest energy).
- Why do β-sheets tend to aggregate?
Because they have “sticky” edges. The backbone hydrogen-bond donors and acceptors are exposed at the edges of the sheet, inviting other β-strands to join.
- What is the driving force for β-sheet aggregation?
Mainly inter-strand hydrogen bonding and the hydrophobic effect, as burying nonpolar side chains between sheets is energetically favorable.
- Why do many amyloid diseases form β-sheets?
Many amyloids form β-sheets because it’s the “global energy minimum” for many sequences; the cross-β structure is incredibly stable and protease resistant.
- Can you use amyloid β-sheets as materials?
Yes, they can be used as nanoscaffolds for tissue engineering or as conductive nanowires because of their extreme mechanical strength and self-assembling properties.
- Design a β-sheet motif that forms a well-ordered structure.
Part B: Protein Analysis and Visualization
In this part of the homework, you will be using online resources and 3D visualization software to answer questions about proteins. Pick any protein (from any organism) of your interest that has a 3D structure and answer the following questions:
- Briefly describe the protein you selected and why you selected it.
I have selected the bacteriorhodopsin (bR) protein for this part of the homework because of its light conversion cycle and its structure! I am particularly interested in its light-sensitive properties, which offer great potential for applications in bioart. Scientifically, bR is a perfect model for studying single molecule kinetics, as seen in Perrino et al. (2021). Additionally, it provides key insights into membrane protein stability, specifically regarding helical reorganization in the context of membrane protein folding: Insights from simulations with bacteriorhodopsin (BR) fragments (Chatterjee et al., 2024). This combination of biological efficiency and aesthetic potential makes it an ideal choice for my research.
For the next parts of the homework, I will be using the high-resolution crystal structure of the bacteriorhodopsin protein identified by PDB code 7Z09. This specific model was solved using X-ray diffraction and was published recently (2022), representing the protein in its ground state with a resolution of 1.05 Å. I selected this specific entry because of its atomic-level detail that allows for a precise visualization of the retinal chromophore and the internal water networks that are essential for proton pumping.
- Identify the amino acid sequence of your protein.
Here’s the bacteriorhodopsin protein sequence I’m using in FASTA format:
>7Z09_1|Chain A|Bacteriorhodopsin|Halobacterium salinarum (2242) QAQITGRPEWIWLALGTALMGLGTLYFLVKGMGVSDPDAKKFYAITTLVPAIAFTMYLSMLLGYGLTMVPFGGEQNPIYWARYADWLFTTPLLLLDLALLVDADQGTILALVGADGIMIGTGLVGALTKVYSYRFVWWAISTAAMLYILYVLFFGFTSKAESMRPEVASTFKVLRNVTVVLWSAYPVVWLIGSEGAGIVPLNIETLLFMVLDVSAKVGFGLILLRSRAIFGEAEAPEPSAGDGAAATS
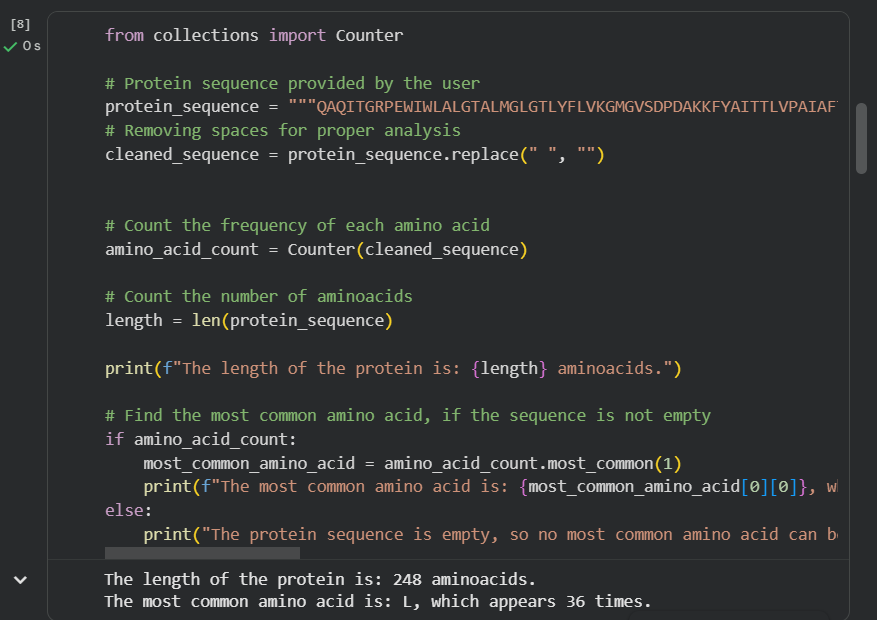
- How long is it? What is the most frequent amino acid? You can use this Colab notebook to count the frequency of amino acids.
The bR protein is 238 AA long, and the most frequent amino acid is L (leucine), which appears 36 times in the protein sequence.
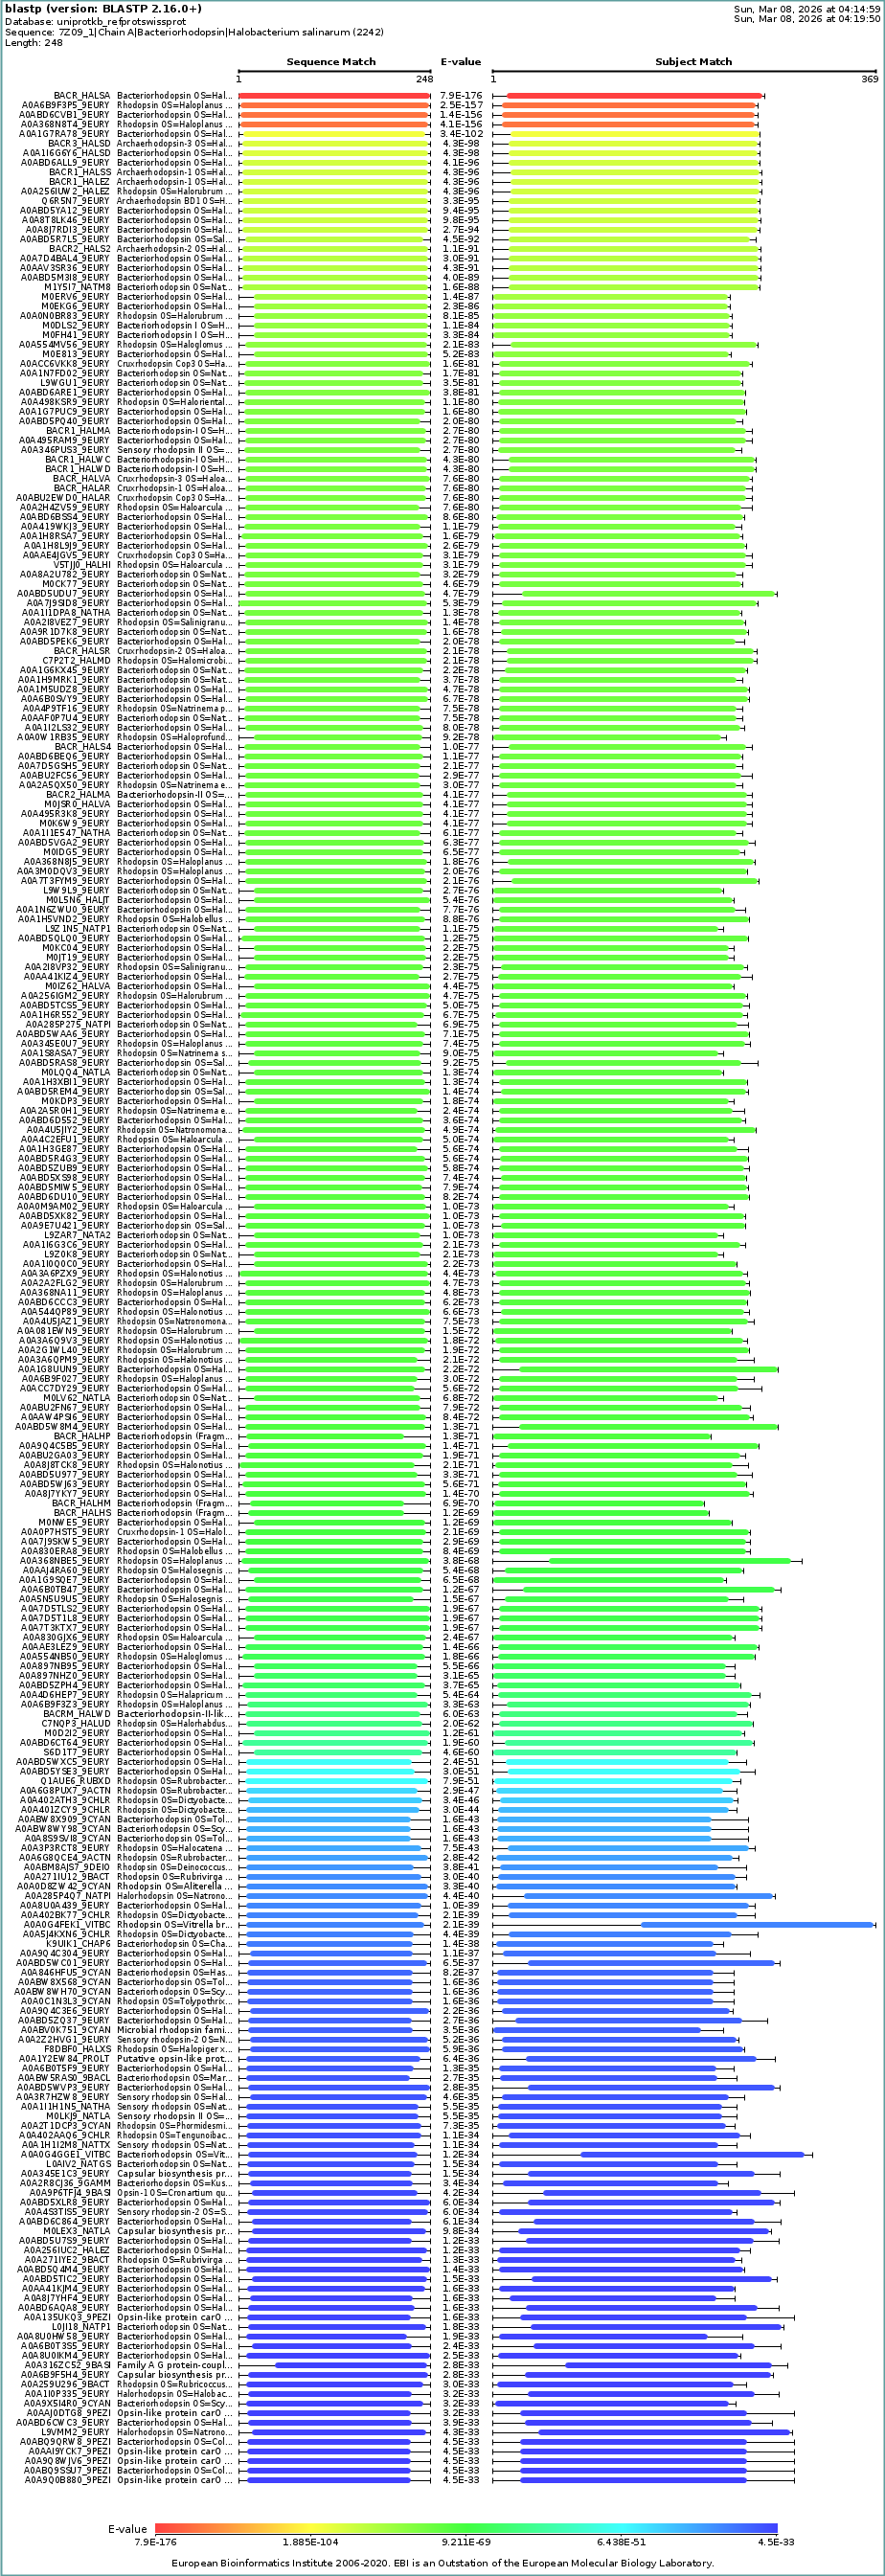
- How many protein sequence homologs are there for your protein? Hint: Use Uniprot’s BLAST tool to search for homologs.
For this question, I ran Uniprot’s BLAST tool using the bR protein mentioned before. Here’s the Uniprot’s BLAST ID.
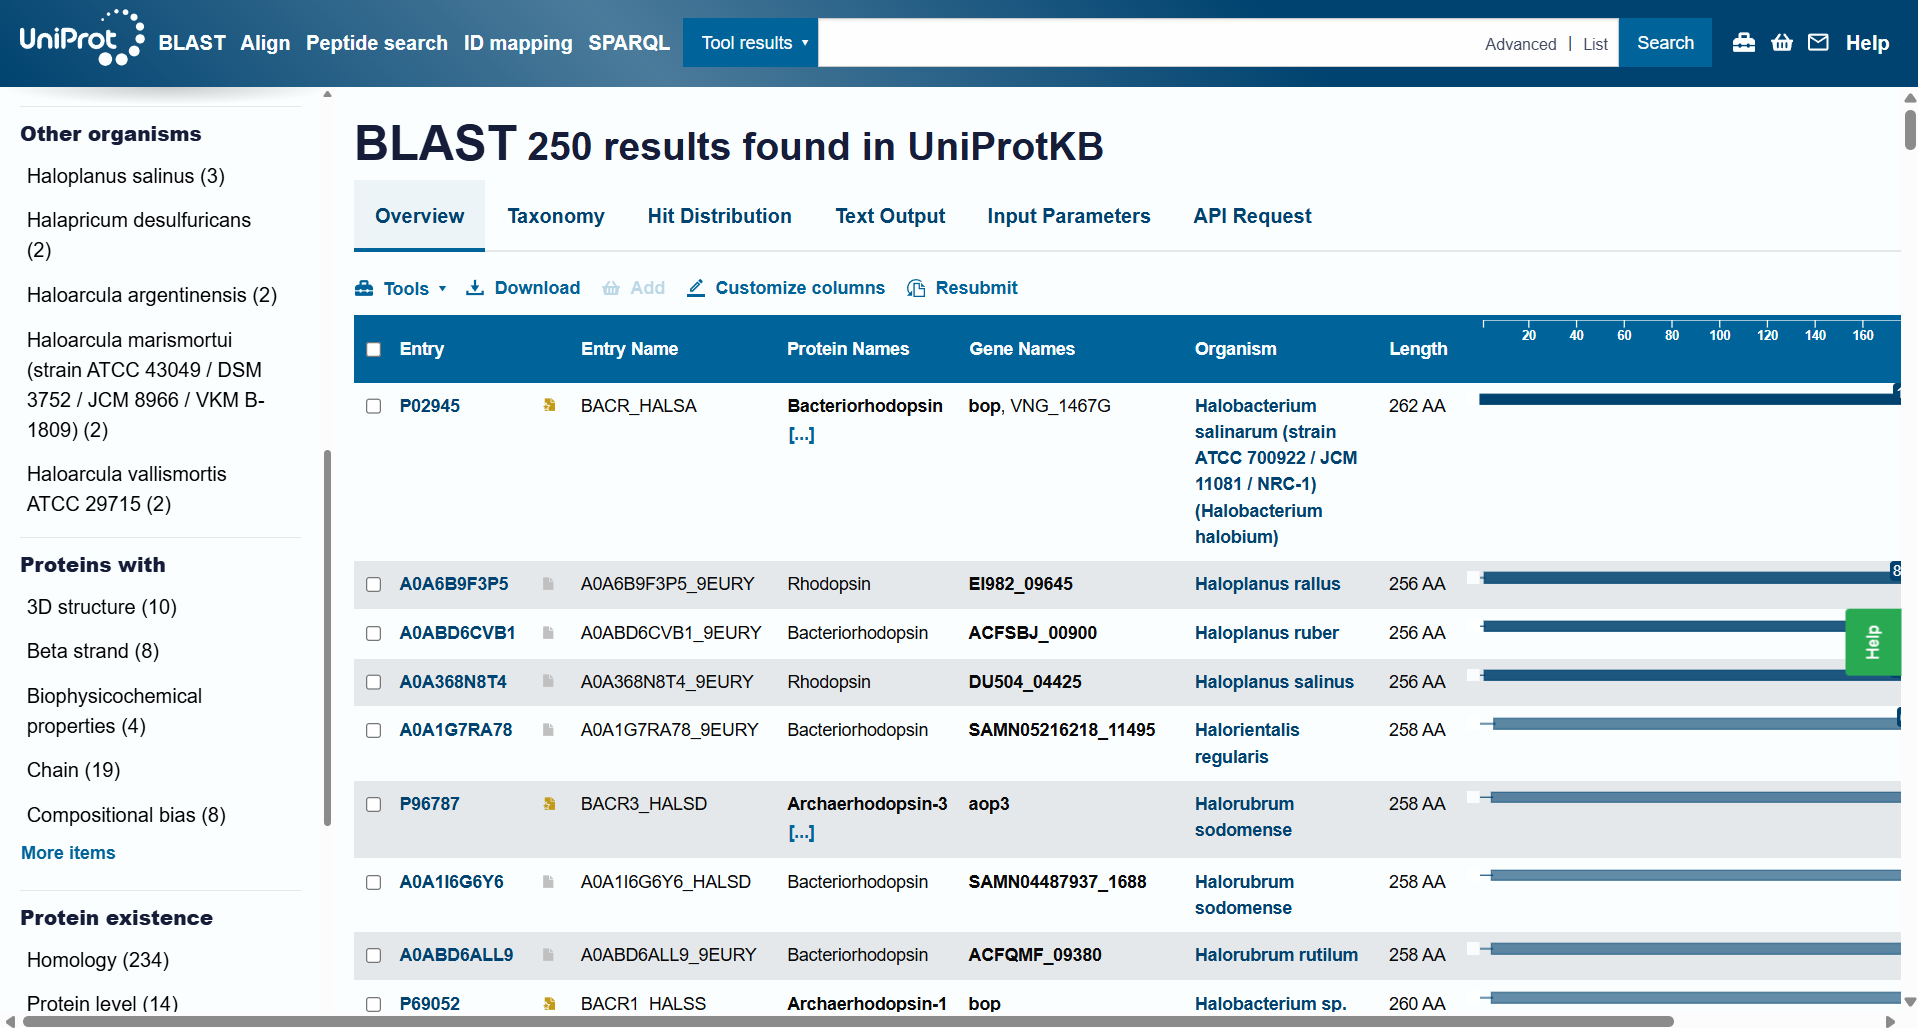
The BLAST tool identified 250 homologs for the protein I selected: 234 of these sequences are inferred through homology, 14 have been experimentally validated at the protein level, and 2 are predicted sequences.
- Does your protein belong to any protein family?
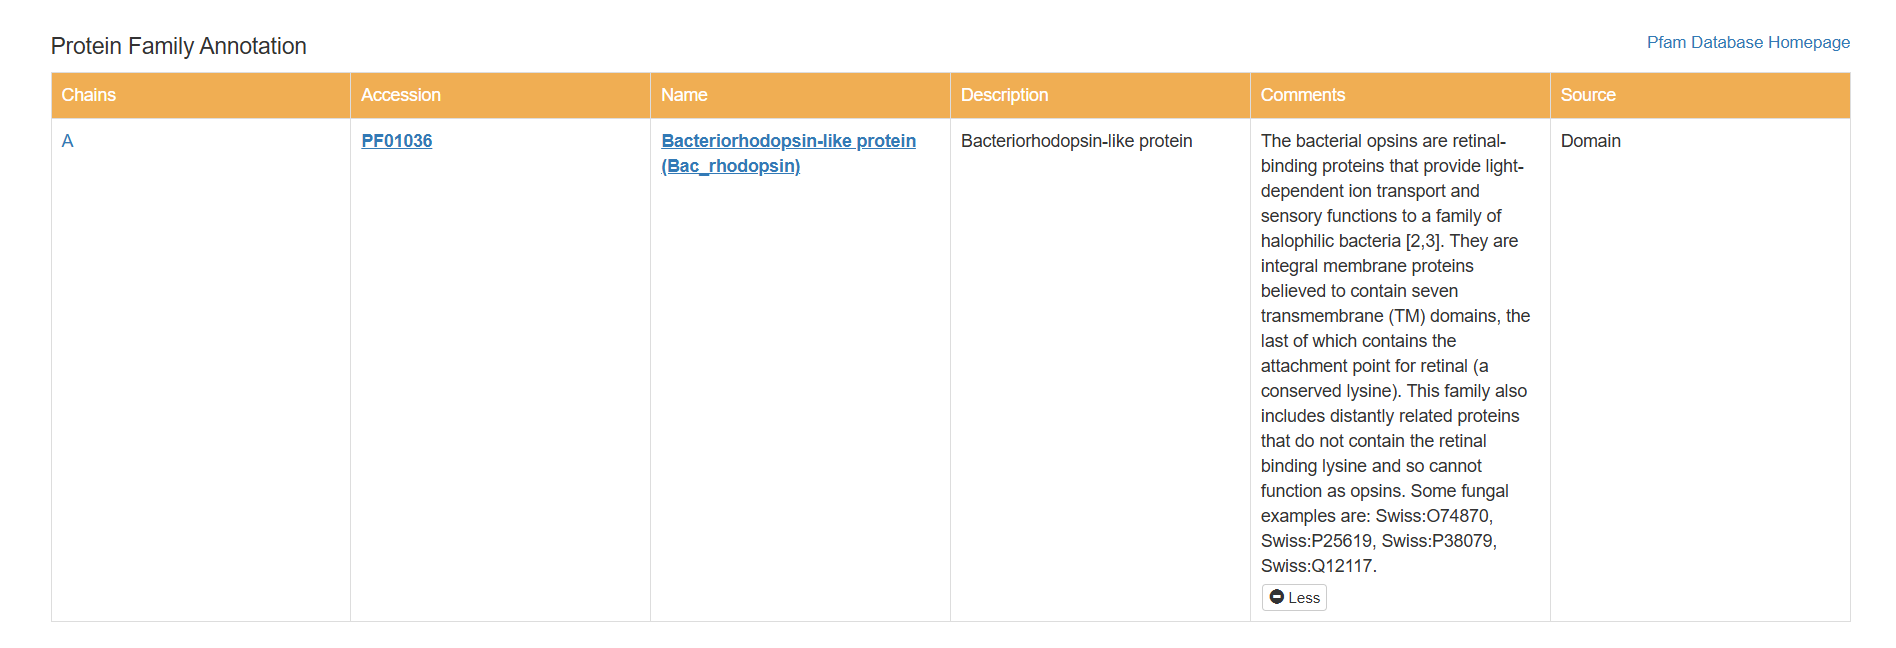
Based on my results, my protein belongs to the microbial rhodopsin family, specifically within archaeal-type rhodopsins. Additionally, according to the Pfam PDB annotation (Accession: PF01036), it is classified as a Bacteriorhodopsin-like protein, which are integral membrane proteins characterized by seven transmembrane (TM) domains that utilize a covalently bound retinal to provide light-dependent ion transport.
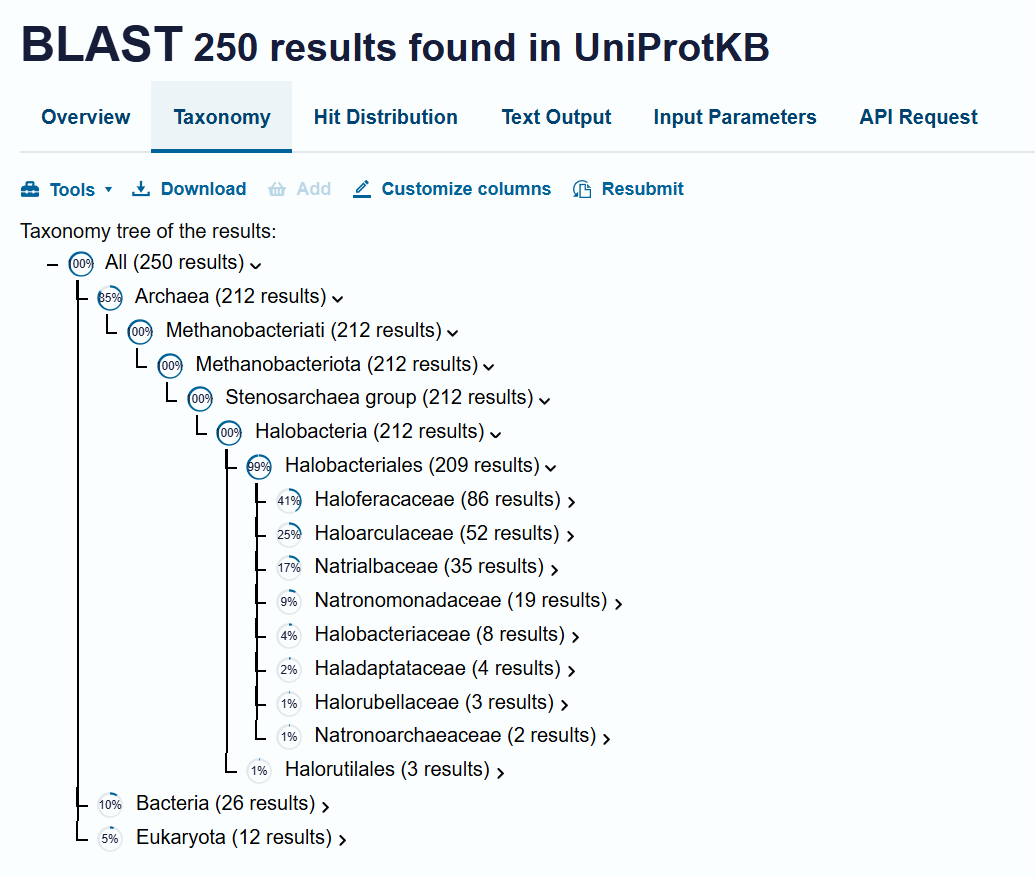
BLAST’s taxonomy data shows a dominance of homologs within the Haloferacaceae (41%), Haloarculaceae (25%), Natrialbaceae (17%), and Halobacteriaceae (4%) families. The presence of the protein in a wide variety of genera such as Halorubrum, Haloplanus, Haloarcula, and Halobacterium confirms its role as a highly conserved protein across different halophilic microorganisms.
- Identify the structure page of your protein in RCSB
- When was the structure solved? Is it a good quality structure? Good quality structure is the one with good resolution. Smaller the better (Resolution: 2.70 Å)
The structure page for my selected protein can be found at RCSB PDB: 7Z09.
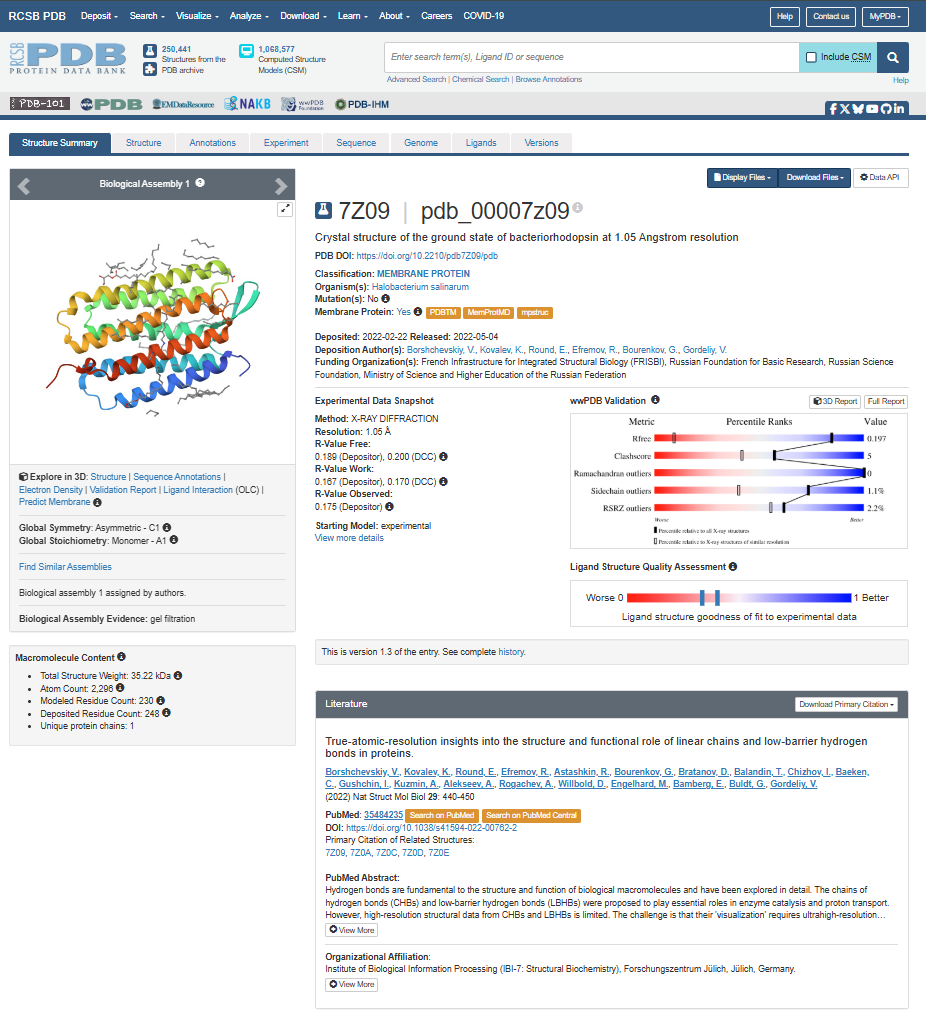
The protein I chose was deposited on 2022-02-22 and officially released three months later, on 2022-05-04. It is considered an exceptional quality structure because its resolution is 1.05 Å, which is significantly better (smaller) than the 2.70 Å threshold. At this atomic resolution, the positions of individual atoms and the surrounding water are mapped with a lot of precision.
- Are there any other molecules in the solved structure apart from protein?
Yes, there are other molecules in the solved structure apart from the bR protein.
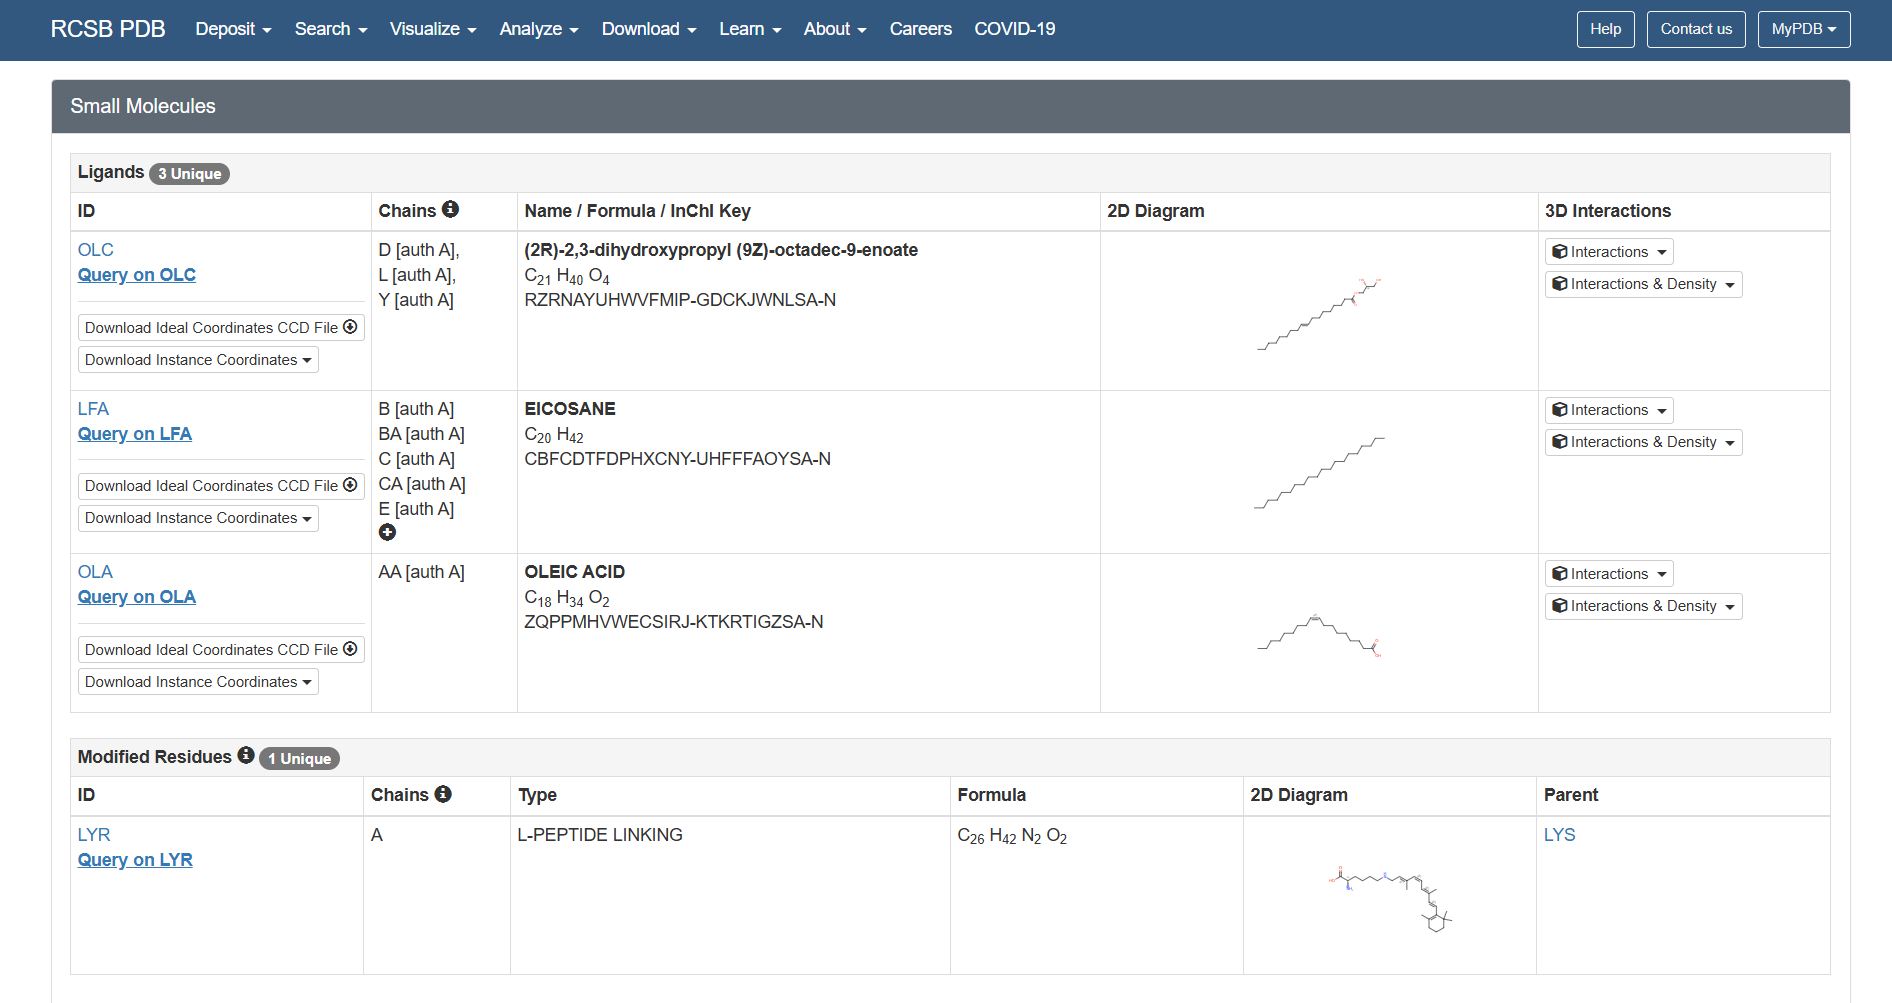
Based on the RCSB ligand data, I identified the following molecules: 3 ligands and 1 modified residue.
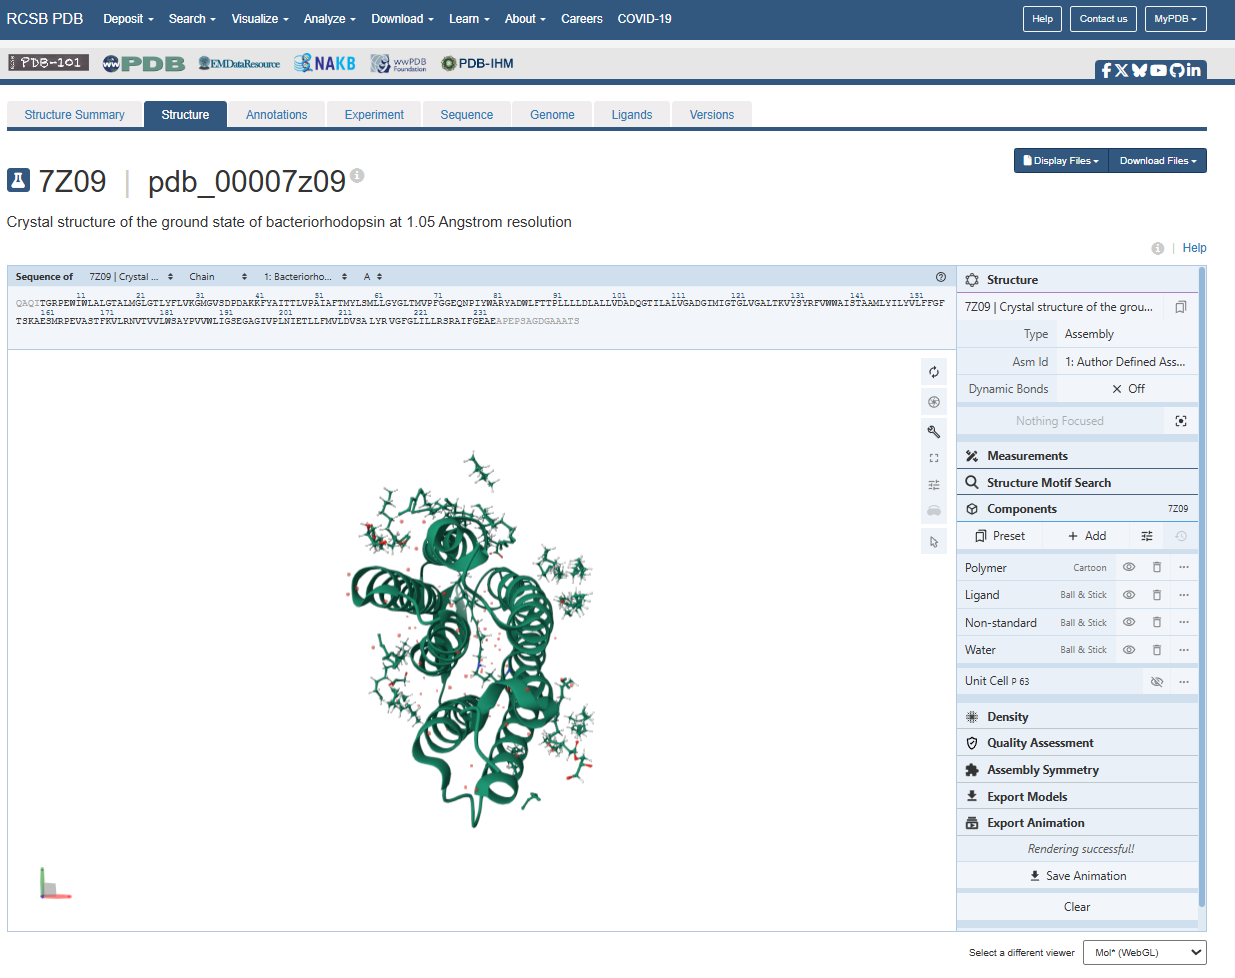
However, on the structure page we can actually see the 3 ligands, the retinal molecule (LYR), and some water molecules.
The 3 ligands found on the protein are lipids and fatty acids like OLC ((2R)-2,3-dihydroxypropyl (9Z)-octadec-9-enoate), eicosane (OLA), and oleic acid. These ligands represent the lipidic environment that surrounds the protein in its natural state.
The modified residue corresponds to retinal (LYR), which is covalently linked to lysine in the protein chain, and it is the chromophore responsible for absorbing light.
Additionally, there are some water molecules around the bR protein structure that are critical for the proton transport mechanism.
- Does your protein belong to any structure classification family?
Yes! According to the SCOP database, my protein belongs to the following structural hierarchy:
- Class: Membrane proteins
- Fold: G protein-coupled receptors, GPCRs-like
- Superfamily: G protein-coupled receptor-like (SCOP ID: 8026950).
- Family: Bacteriorhodopsin-like (SCOP ID: 80393298039329).
- Open the structure of your protein in any 3D molecule visualization software:
- PyMol Tutorial Here (hint: ChatGPT is good at PyMol commands)
So this is my first time using PyMol, it feels intimidating but I hope I get the hang of it!
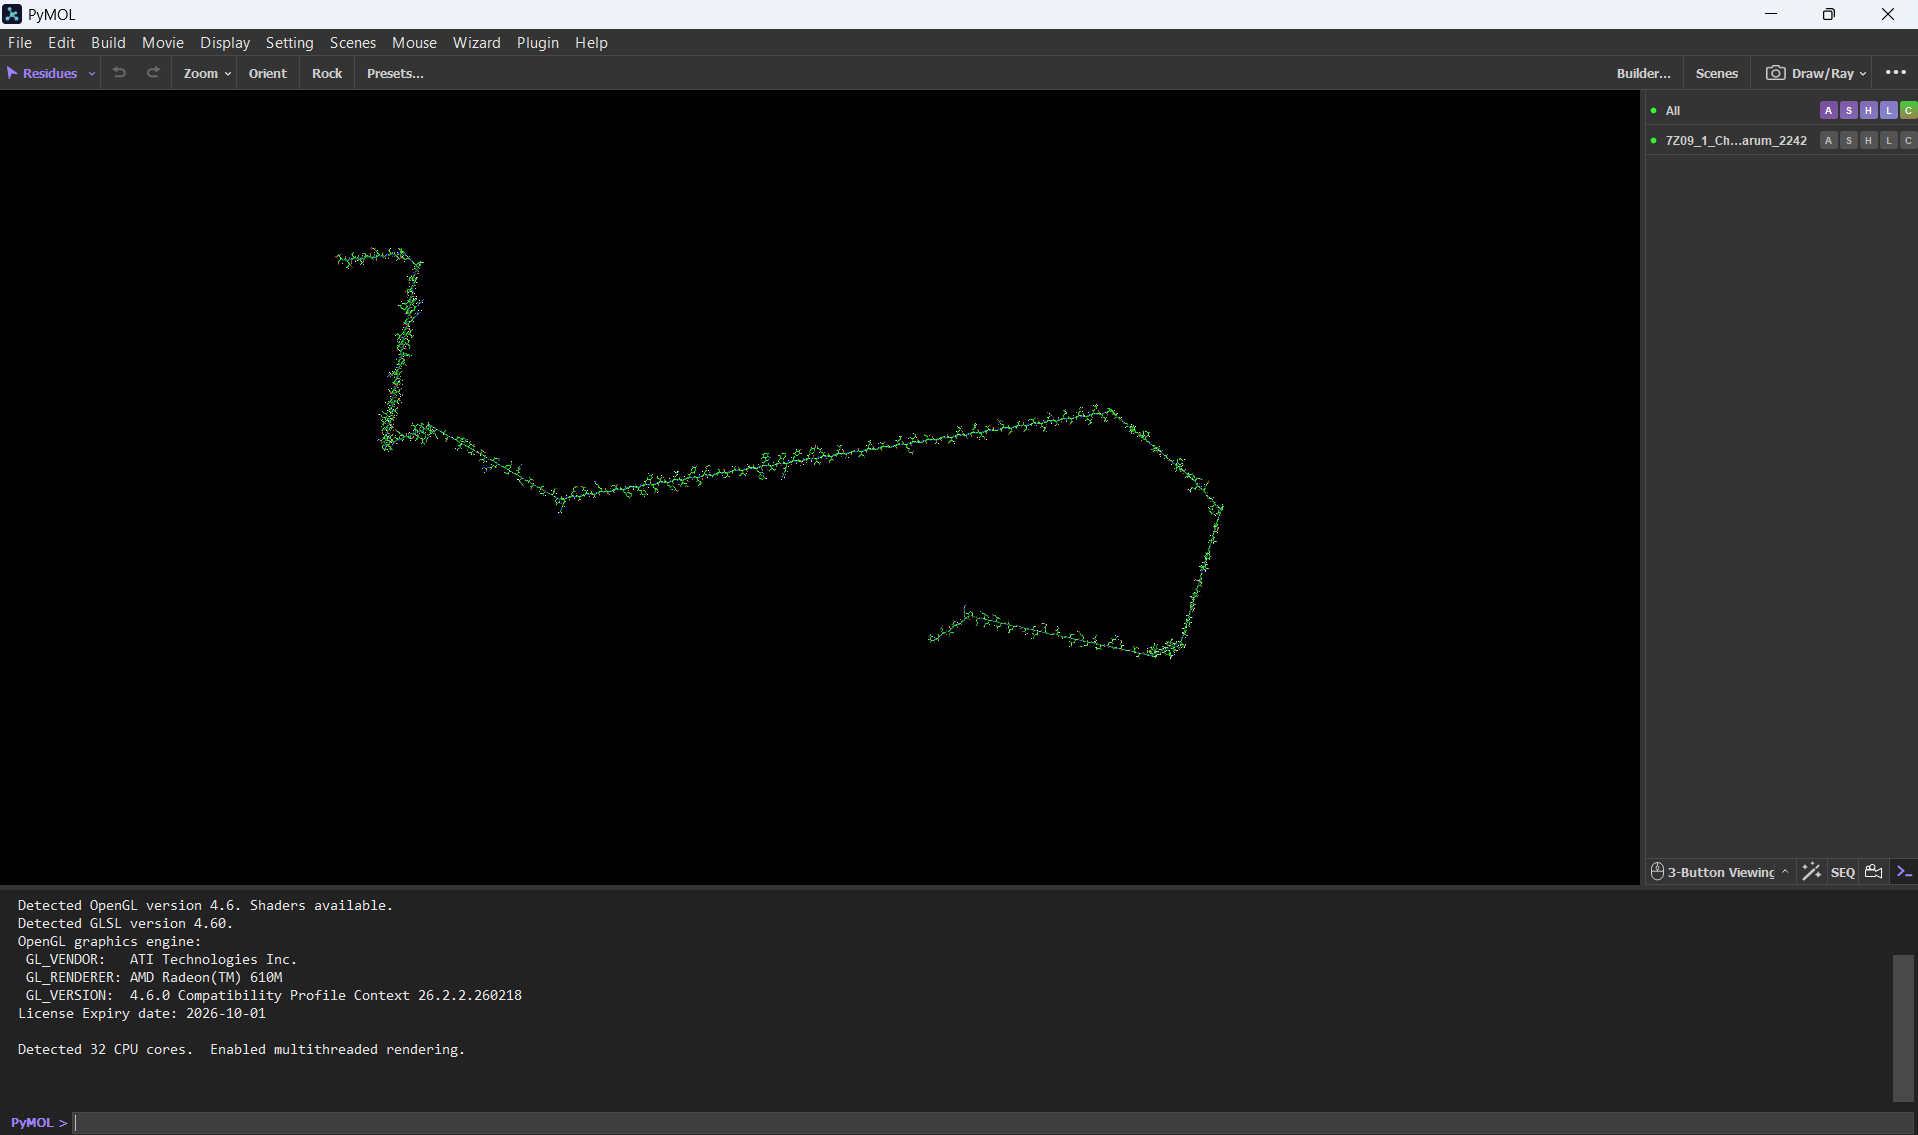
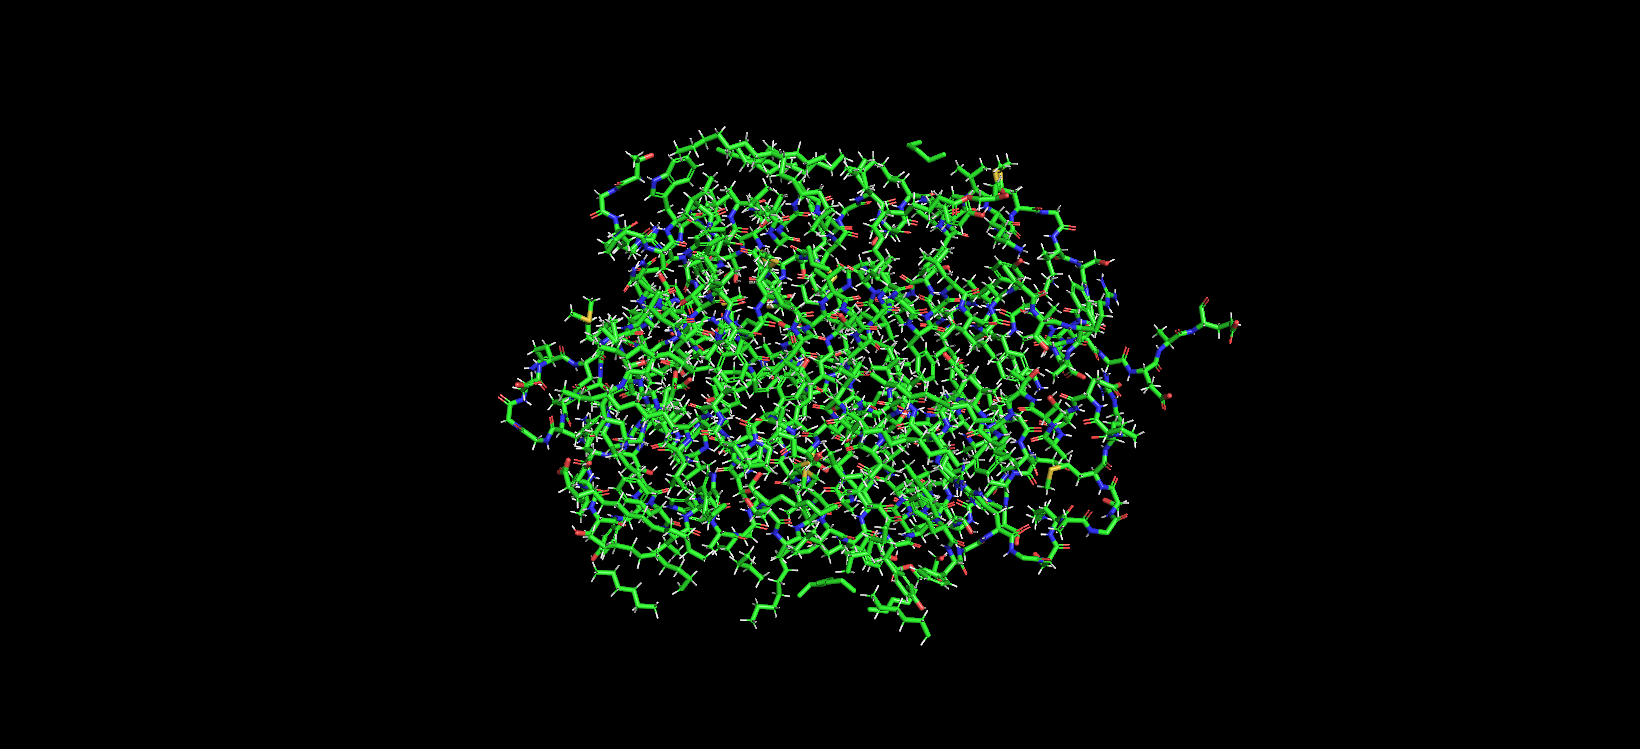
At first, I uploaded the FASTA bR protein sequence file thinking it would give me the protein structure. But after loading it, all I saw was a very long chain of amino acids. I found that funny for my first experience with PyMol. After that I went back to the PDB page and downloaded the correct .pdb file format.
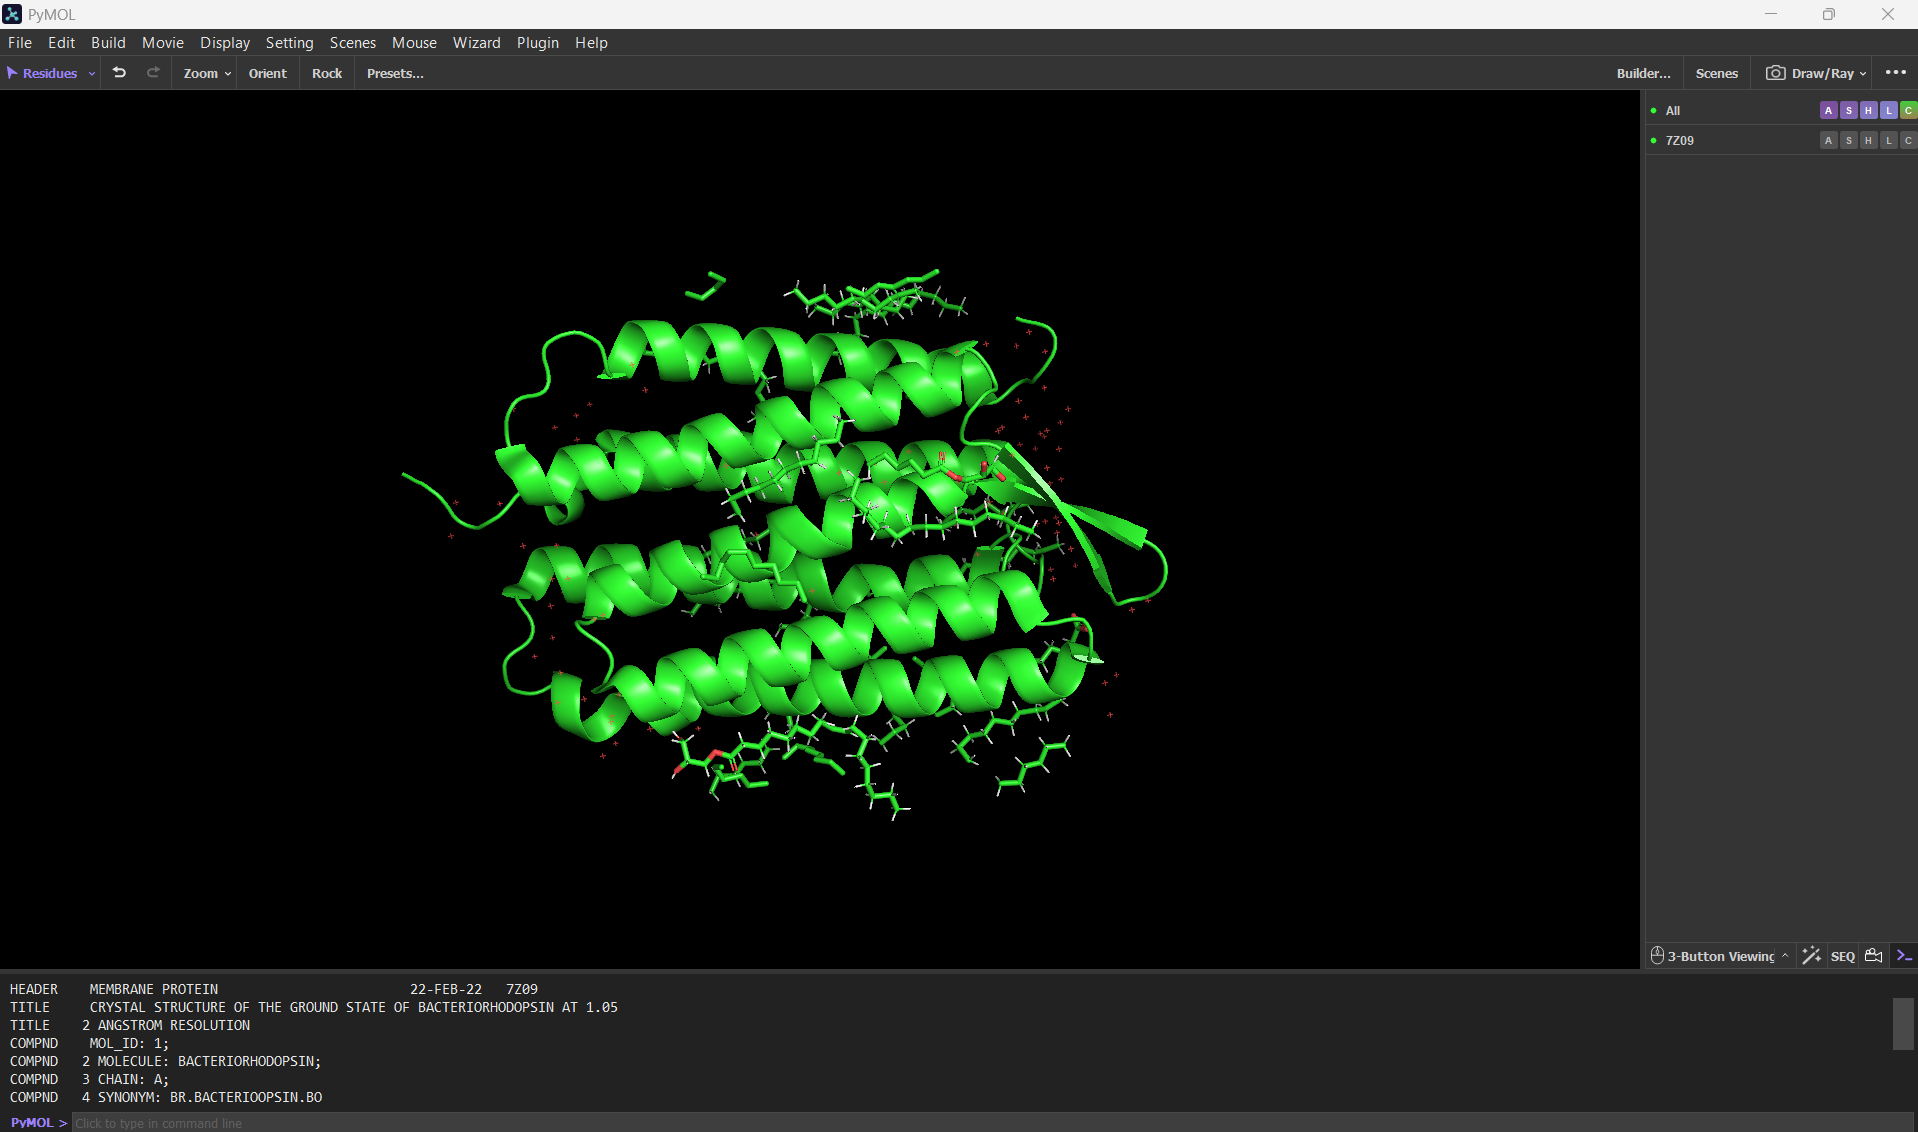
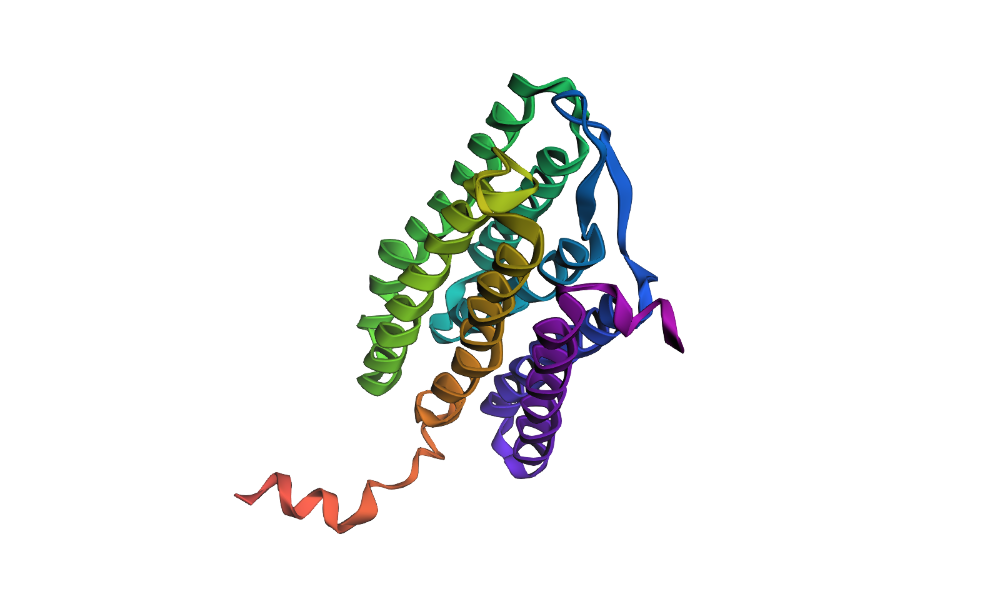
Here’s a screenshot of the bR protein in PyMol using the .pdb file.
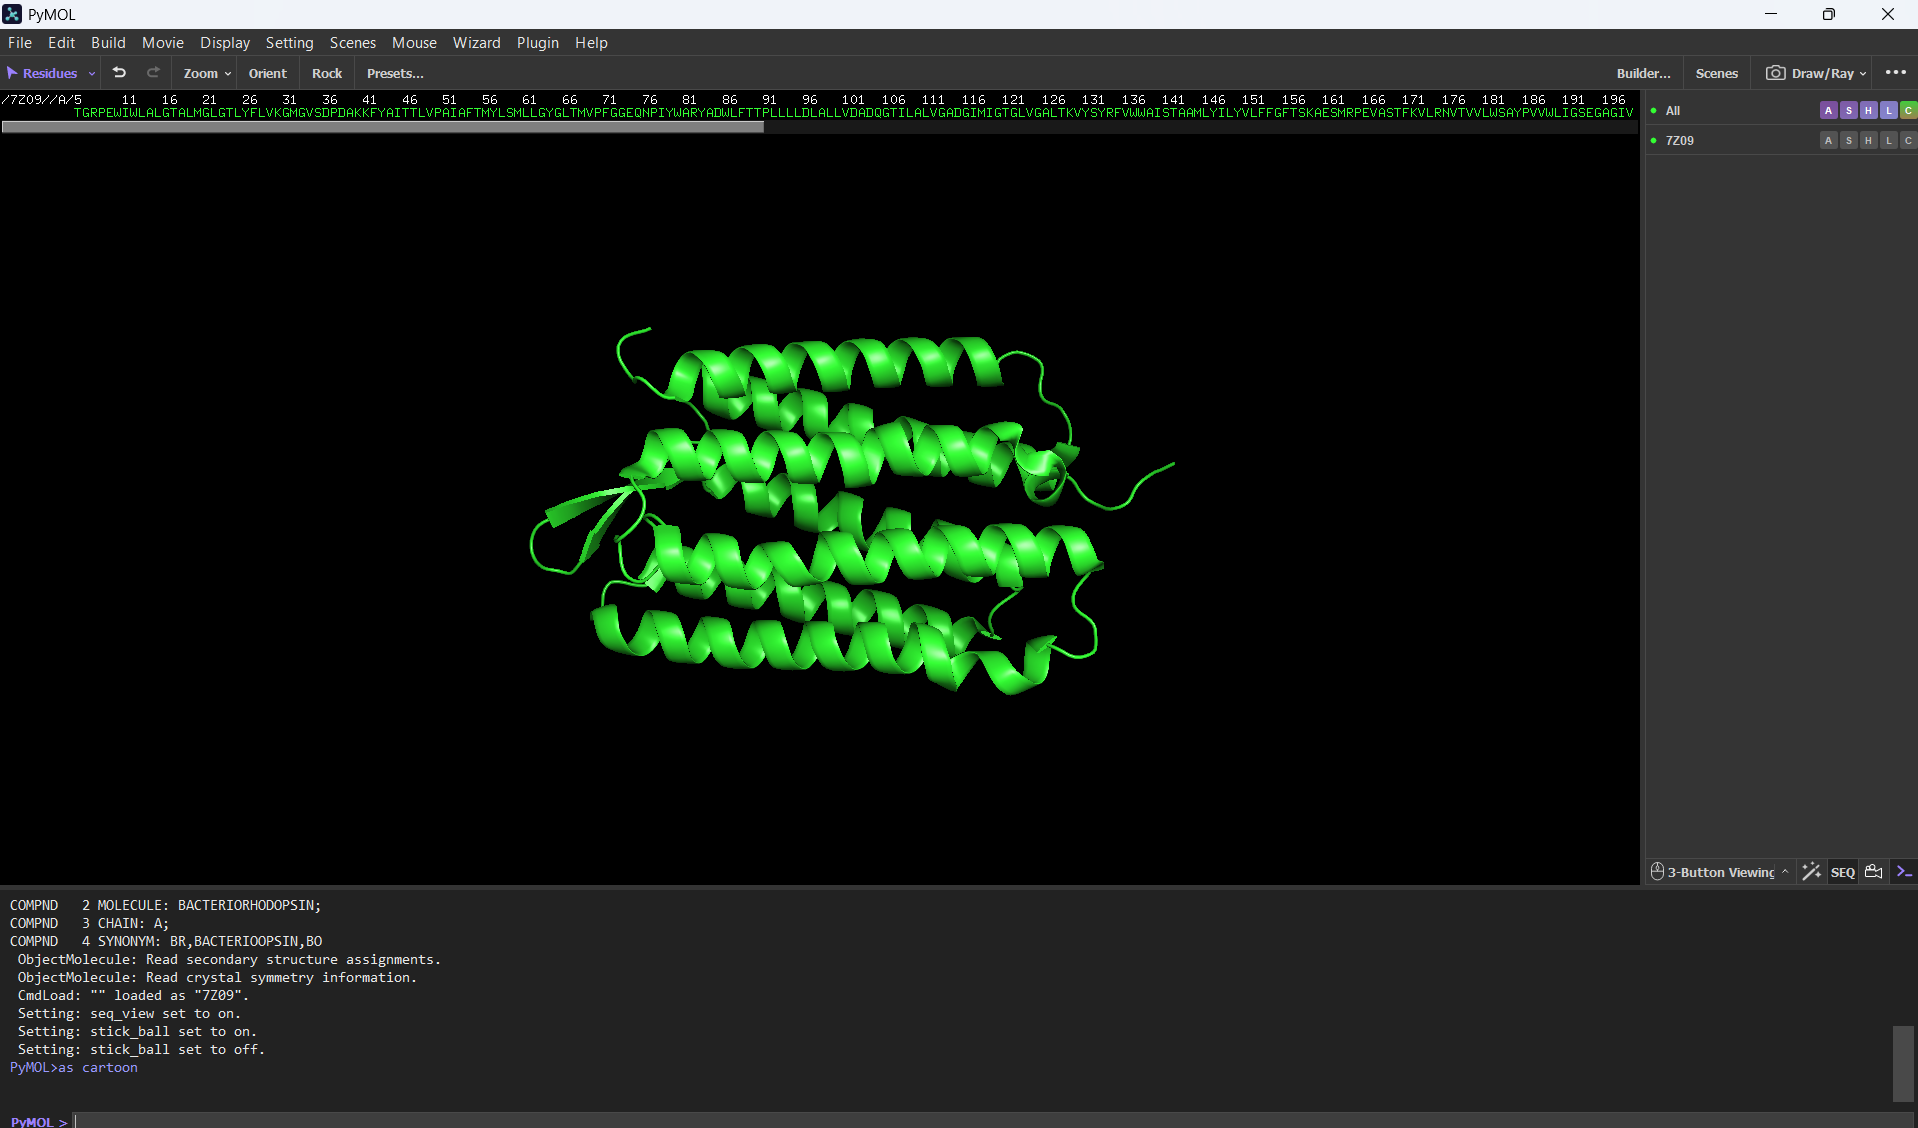
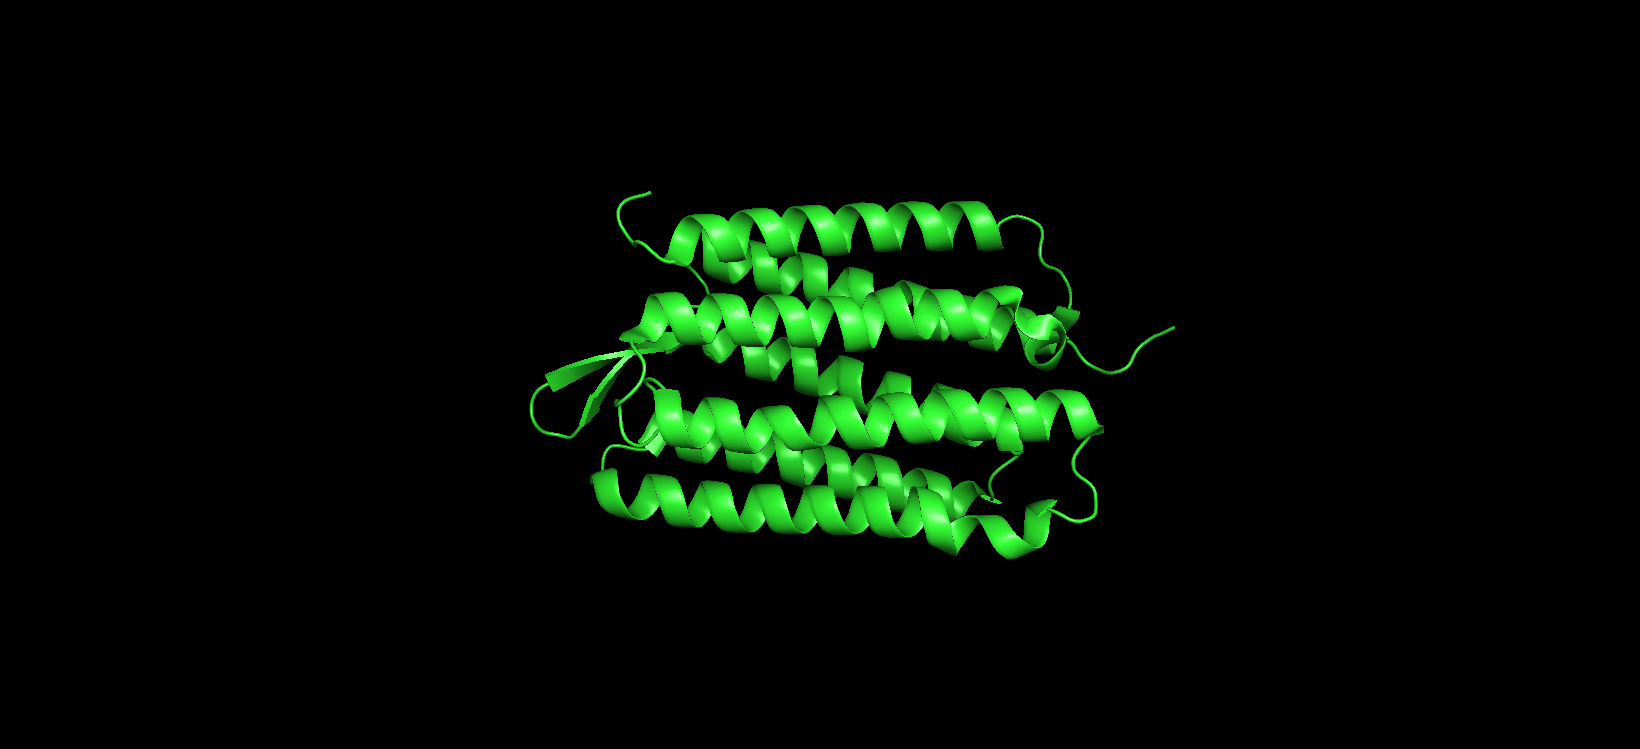
- Visualize the protein as “cartoon”, “ribbon” and “ball and stick”.
Visualizing the protein as “cartoon”:
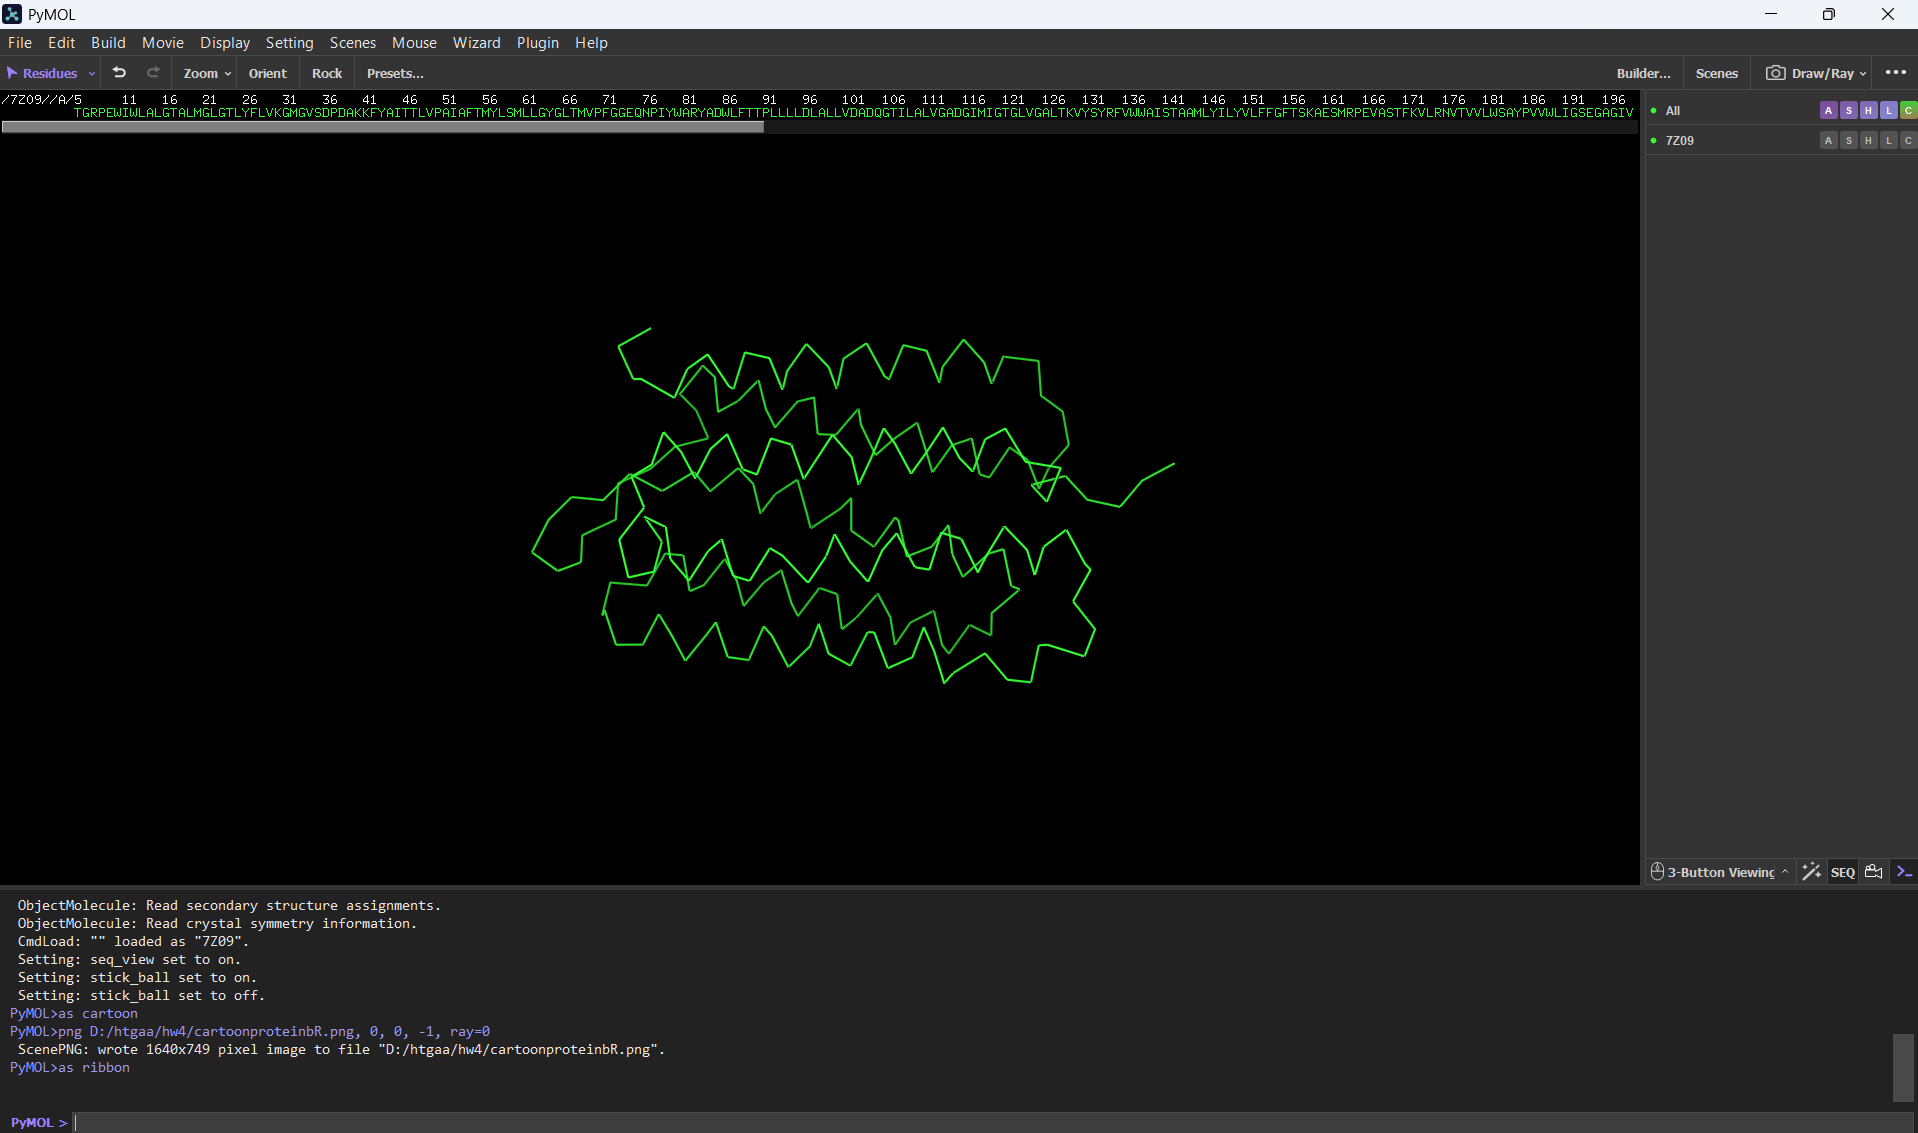
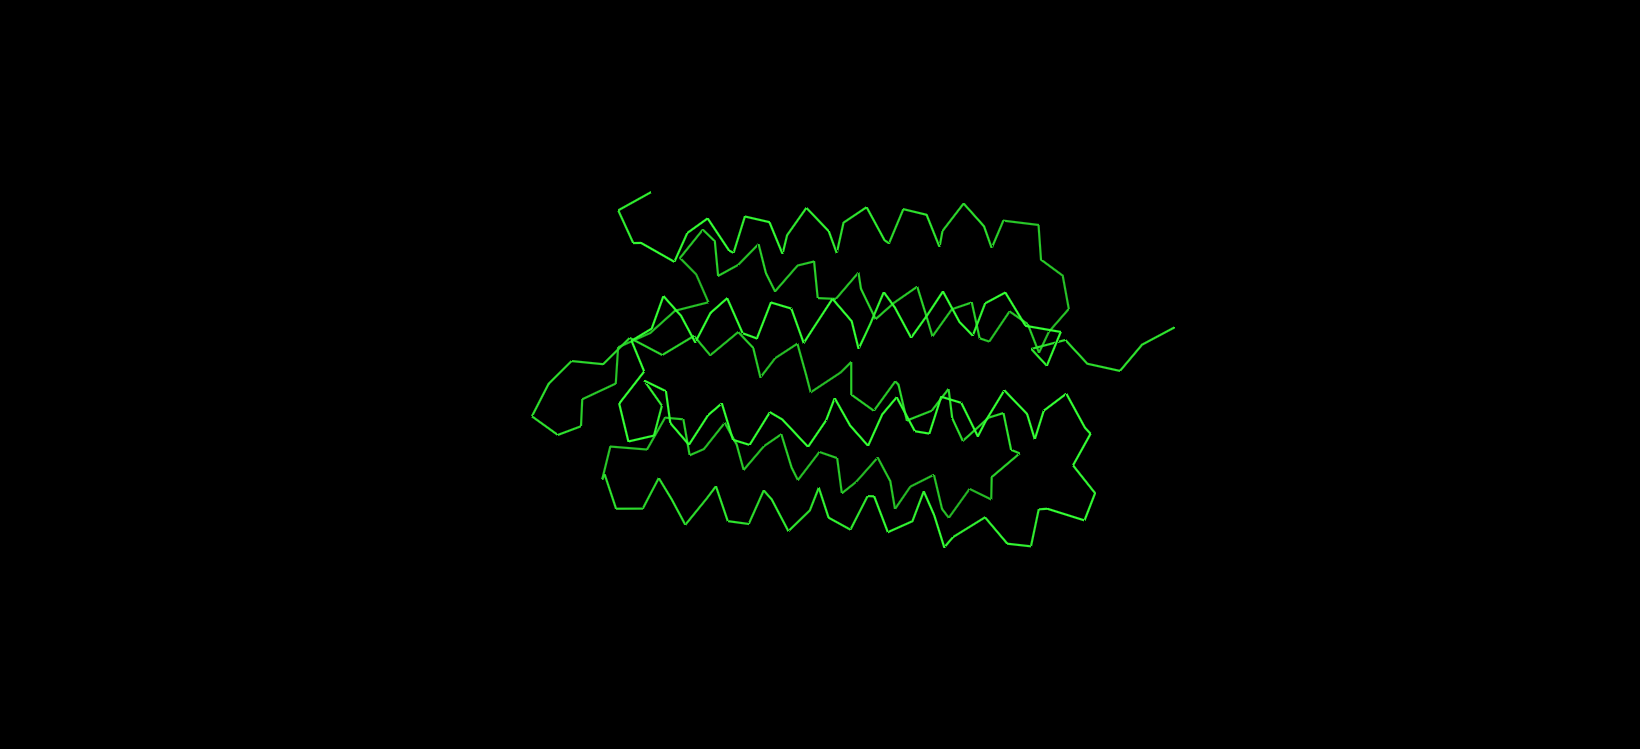
Visualizing the protein as “ribbon”:
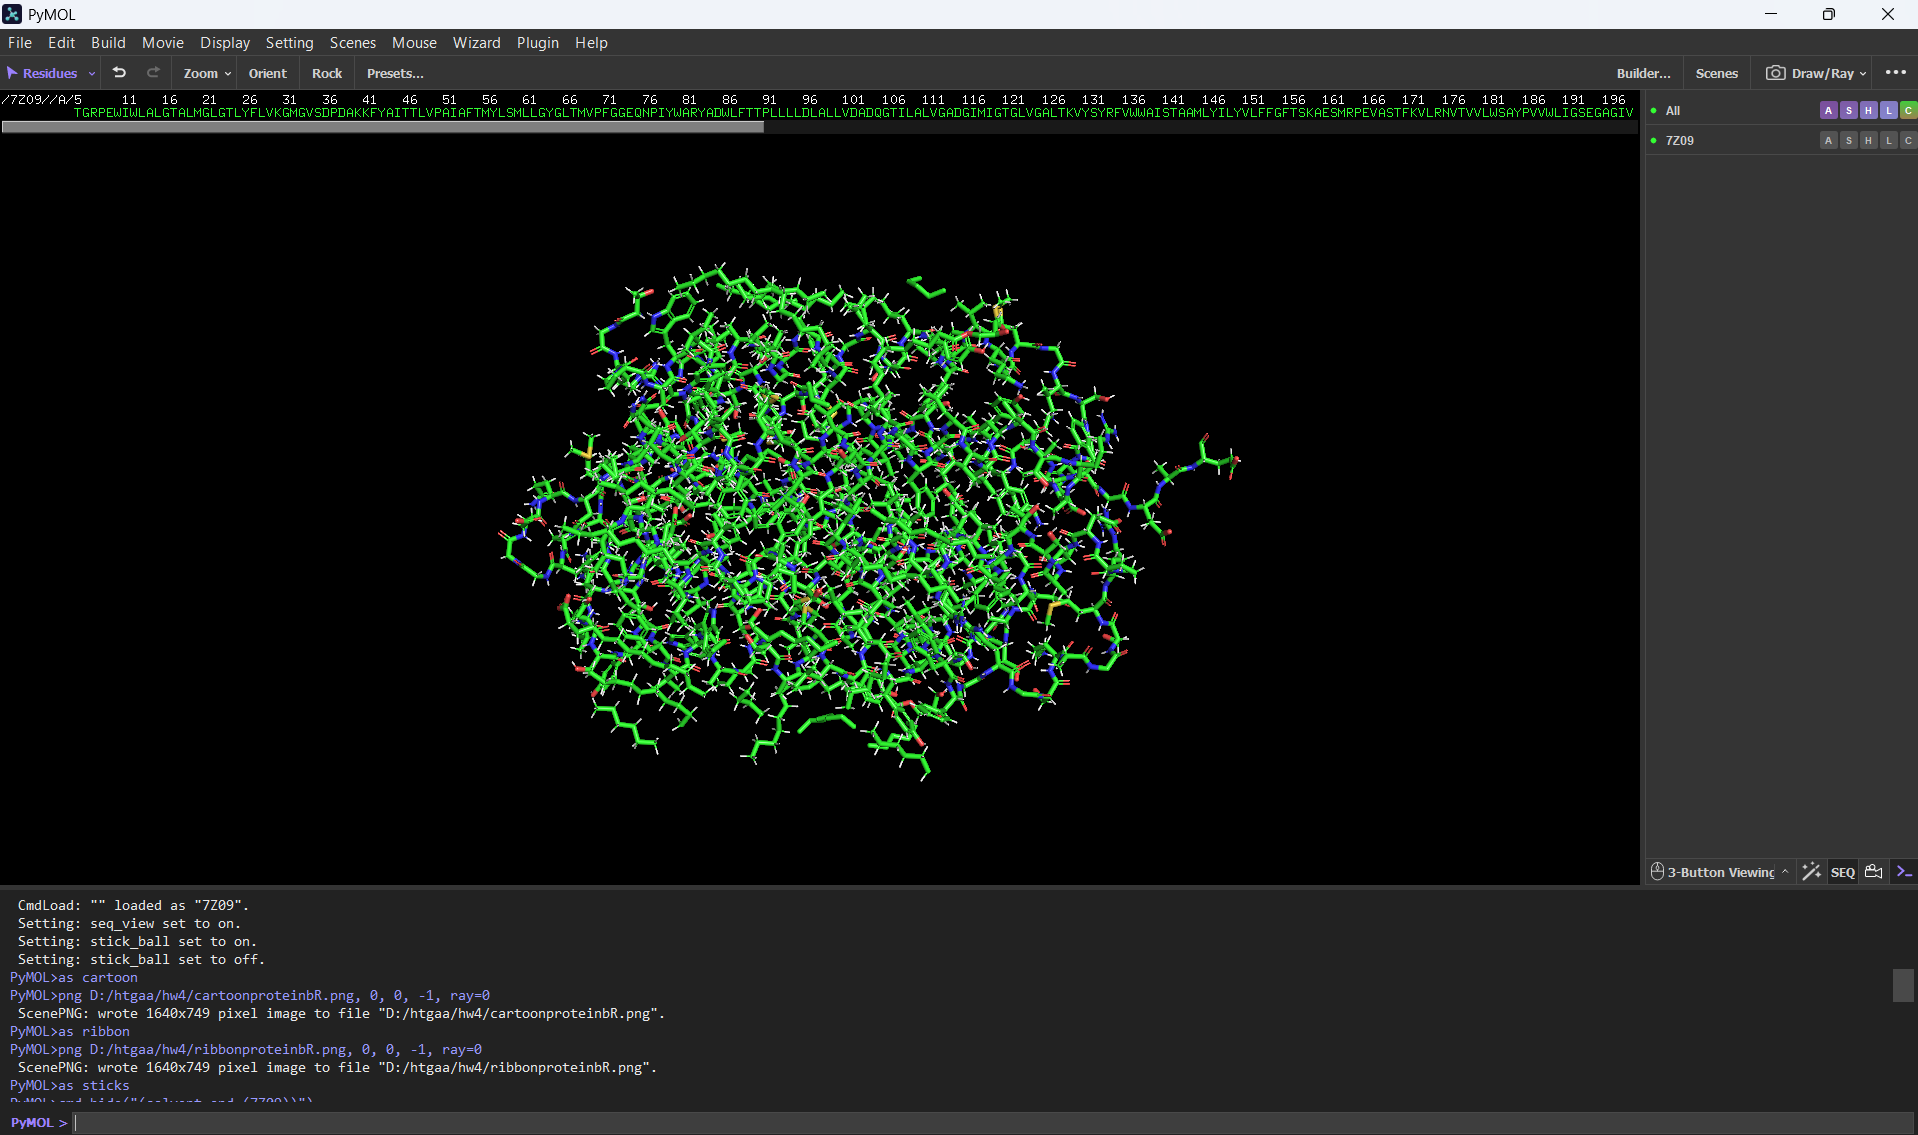
Visualizing the protein as “ball and stick”:
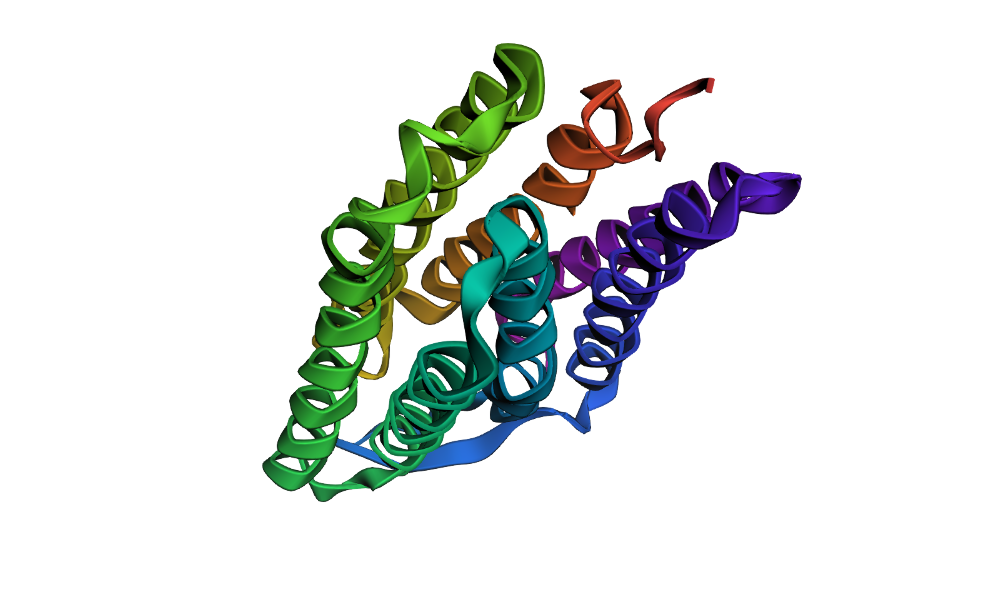
- Color the protein by secondary structure. Does it have more helices or sheets?
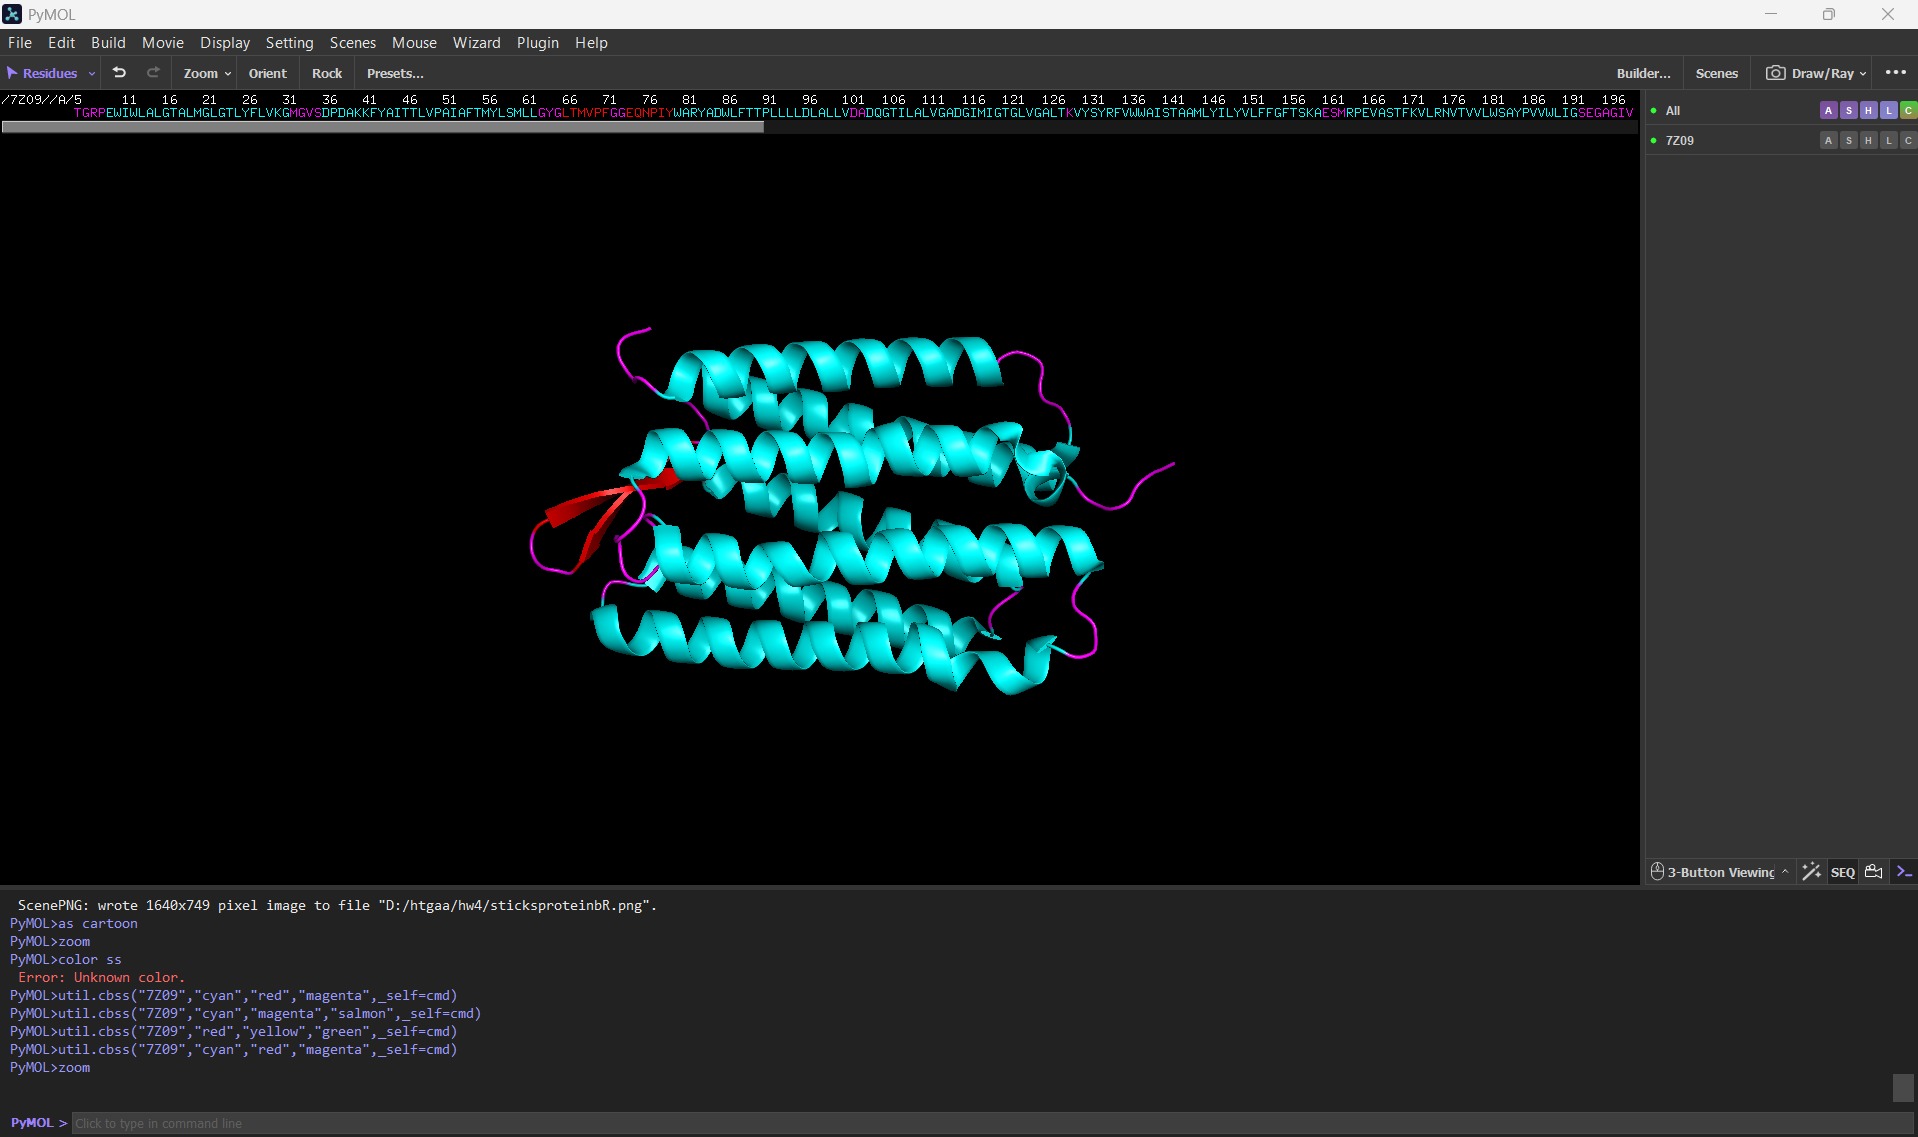
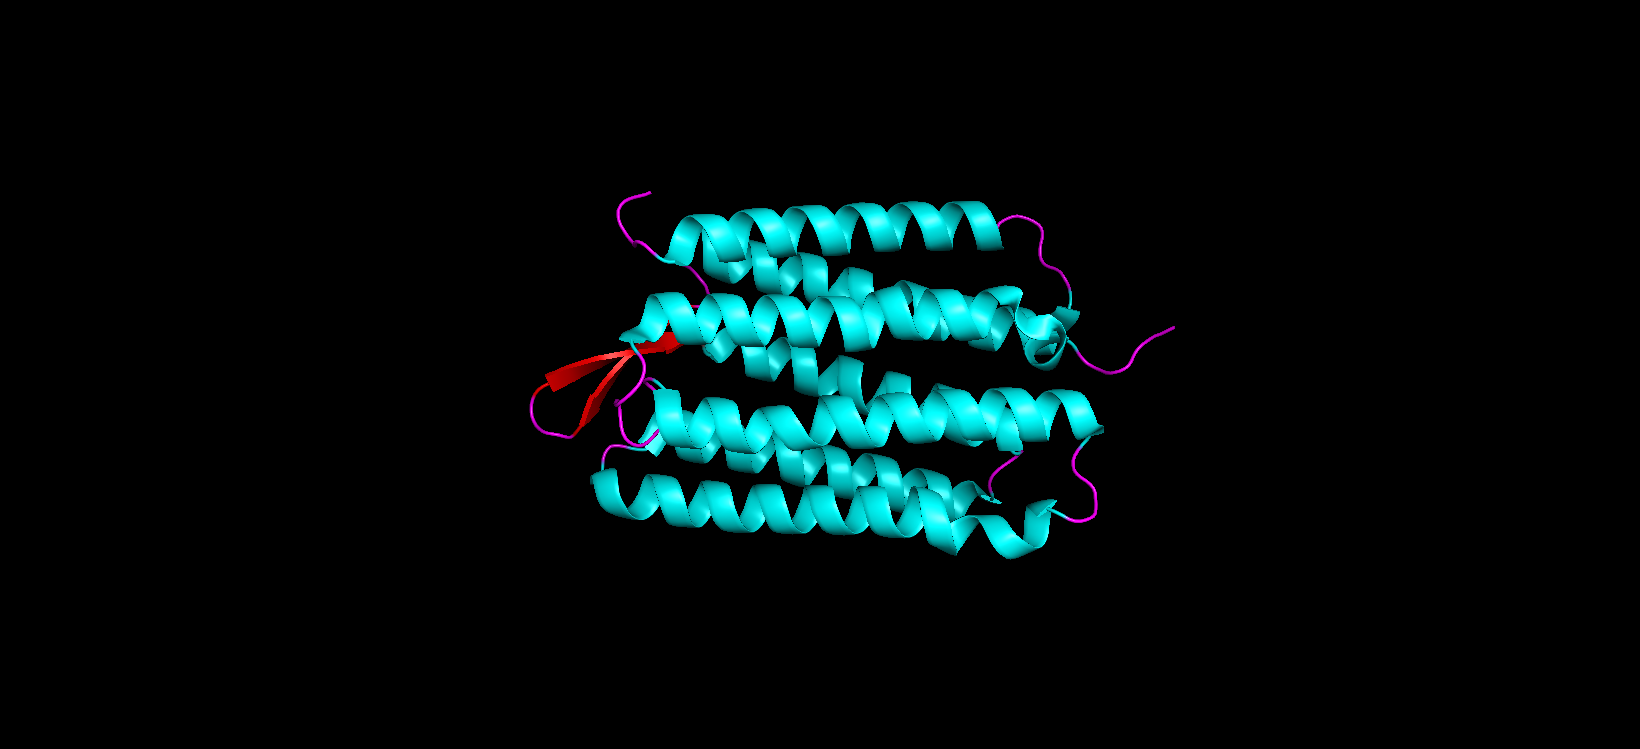
After coloring the protein according to its secondary structure, I realized there are more helices than sheets. There are 7 alpha helices (colored in cyan), and there are just 2 beta sheets (colored in red) but they are very small. Additionally, PyMol shows that there are 8 loops. which are colored in magenta.
- Color the protein by residue type. What can you tell about the distribution of hydrophobic vs hydrophilic residues?
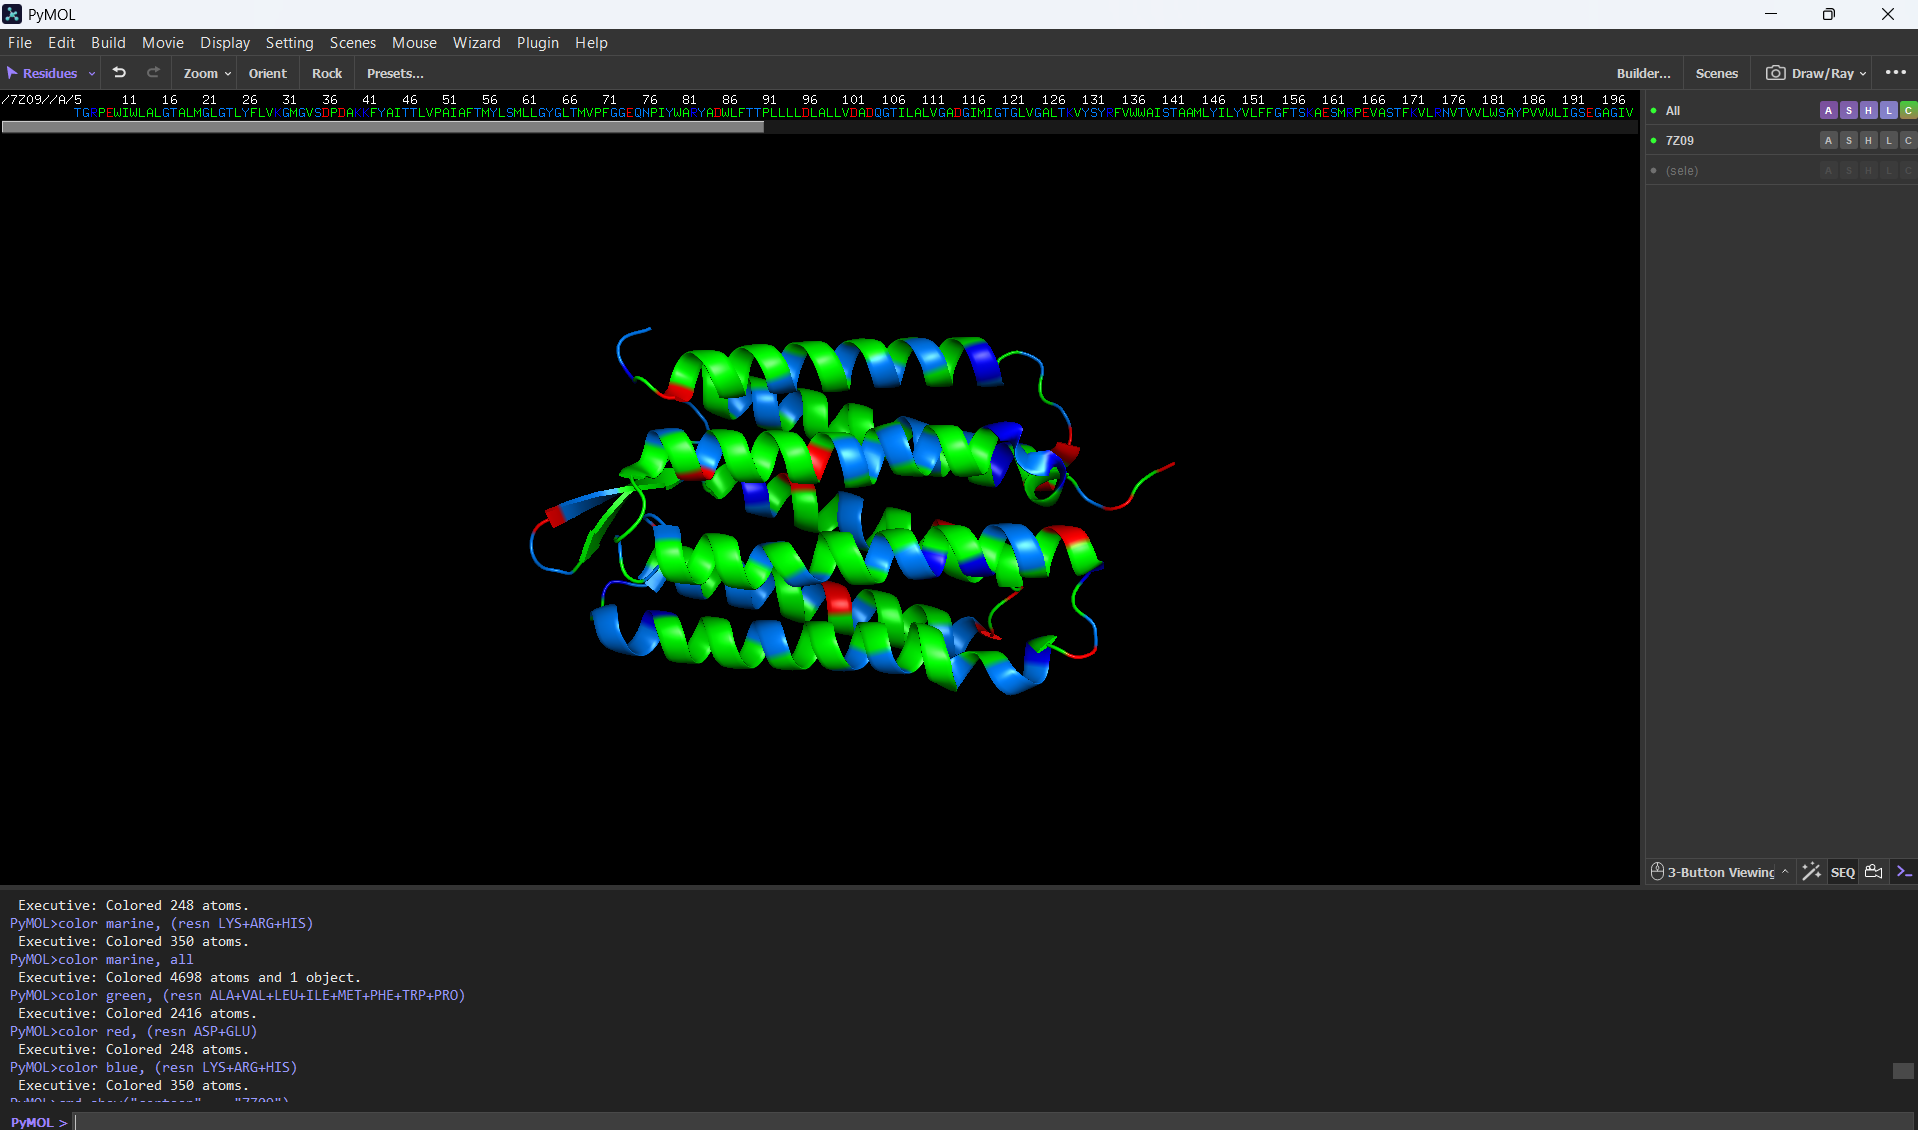
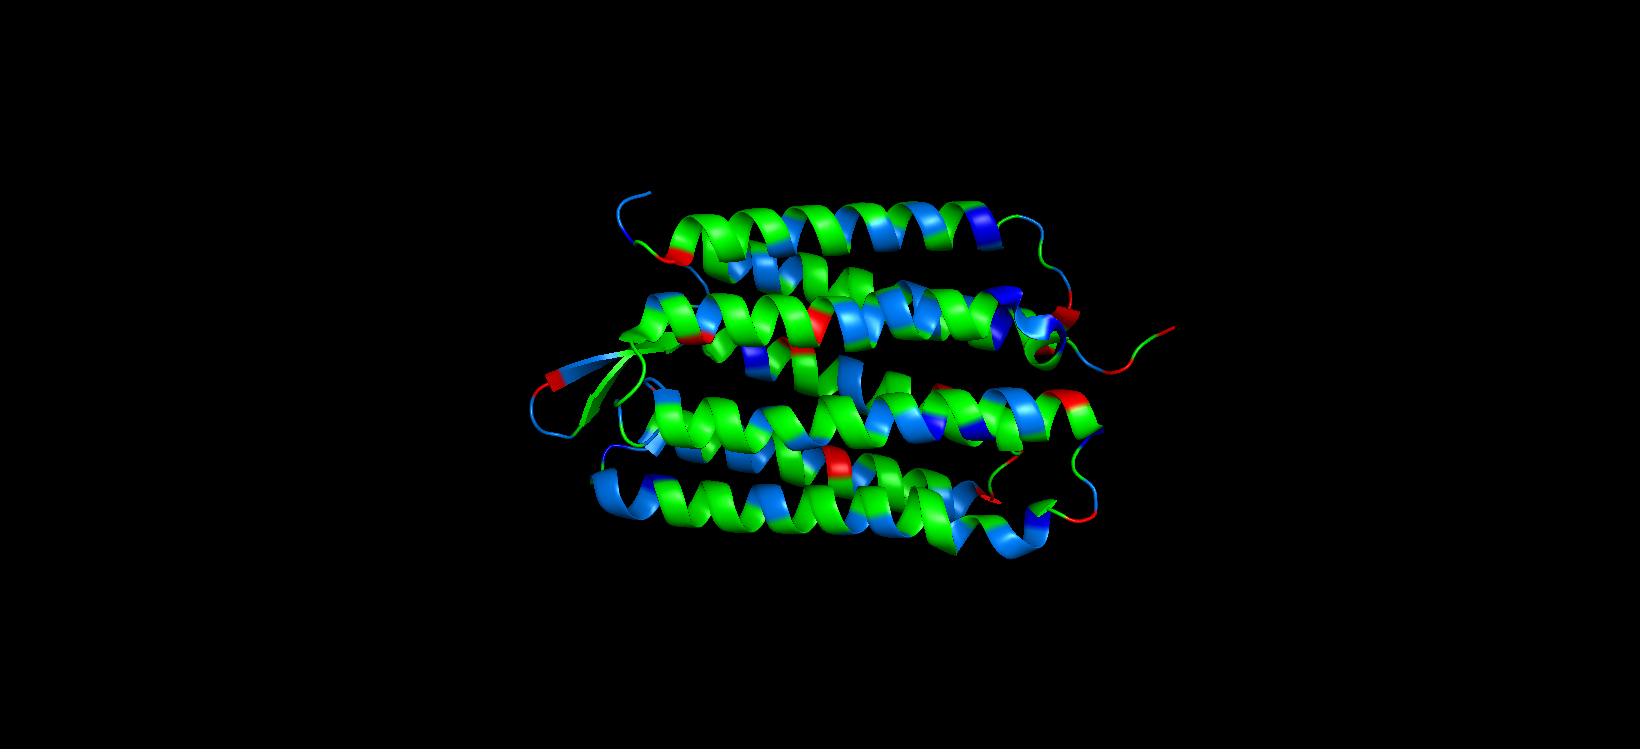
For this part, I colored the hydrophilic residues marine, the hydrophobic ones green, and the charged residues red and blue. After visualizing the colored protein, I recognize that there are more hydrophobic residues than hydrophilic ones, especially along the outer surface of most of the alpha helices, while the hydrophilic residues are mostly in the extremes of the protein, which are mostly exposed to the aqueous environment.
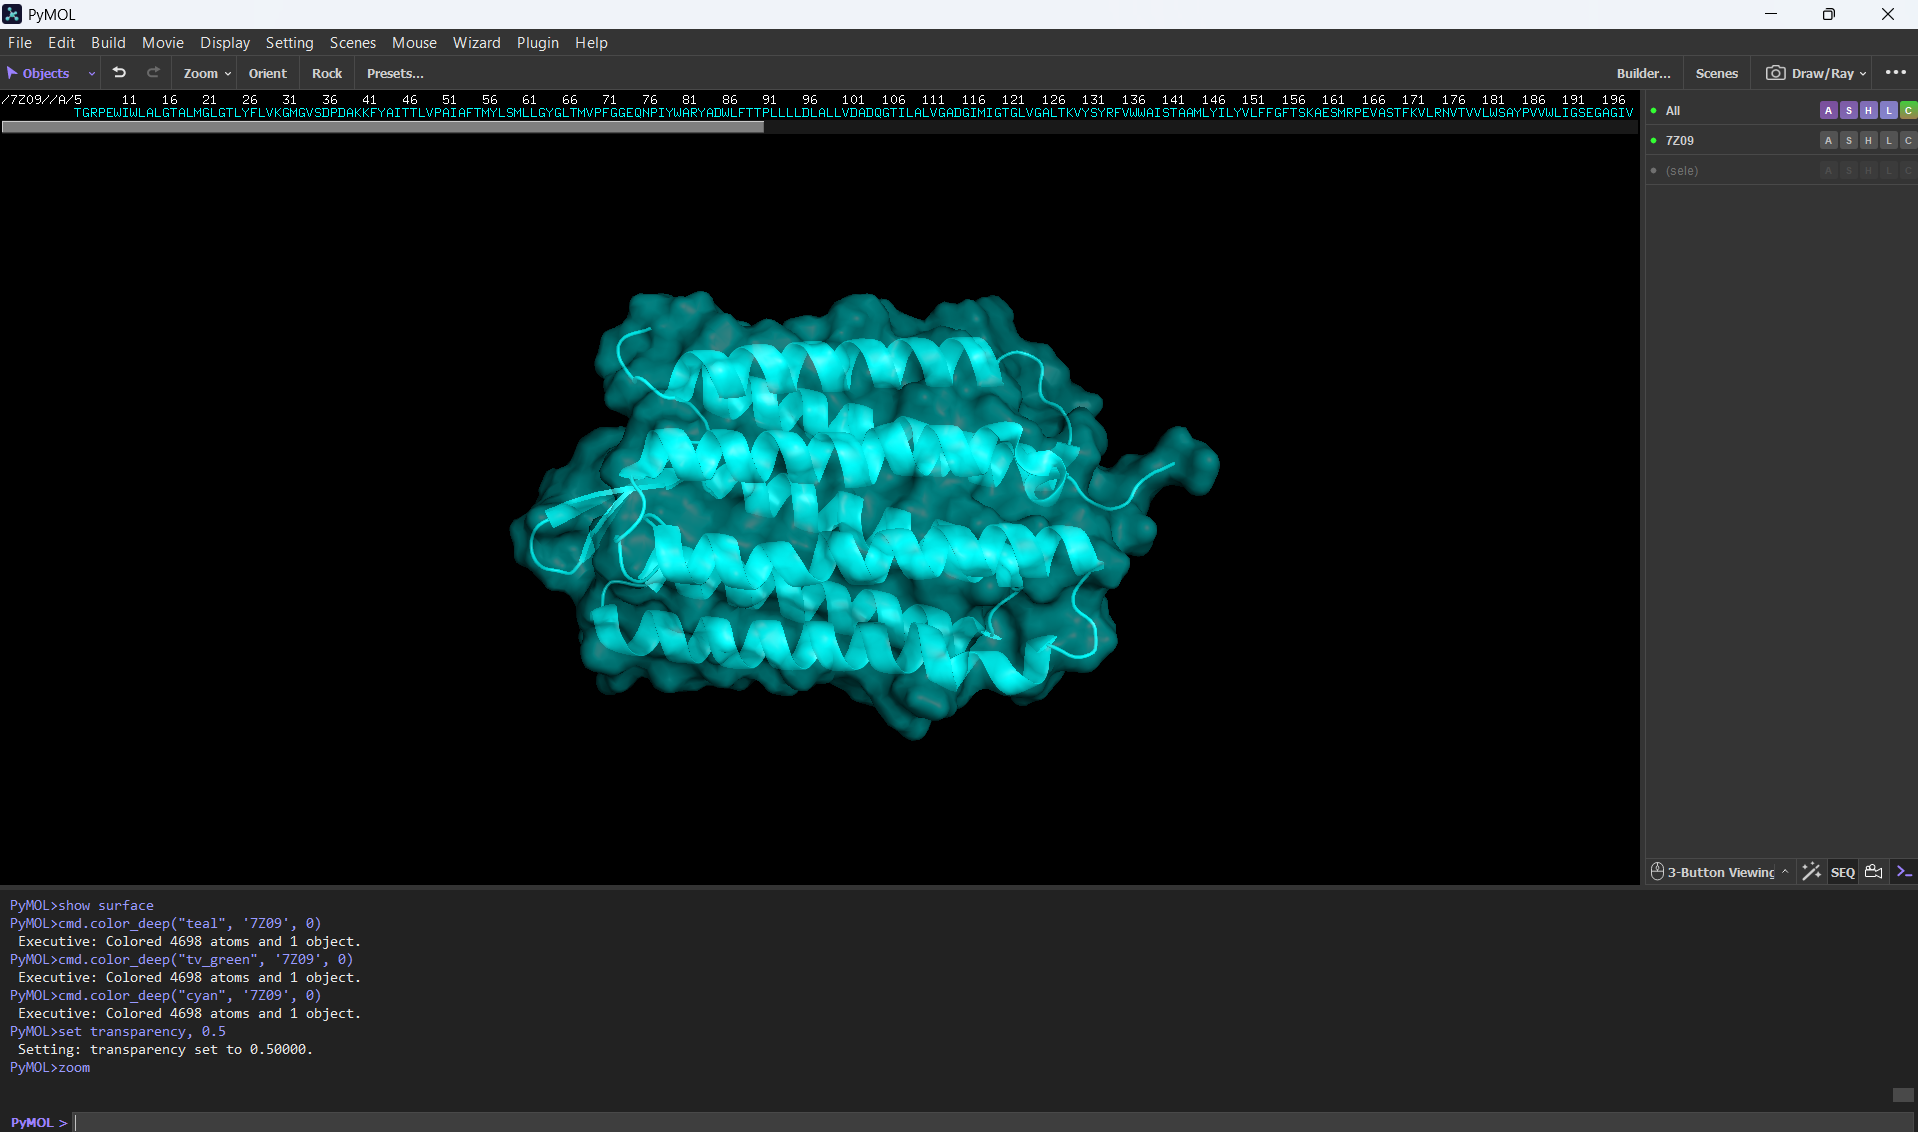
- Visualize the surface of the protein. Does it have any “holes” (aka binding pockets)?
Here’s a screenshot of the protein visualized by its surface (I set up the transparency to 0.5 to see the inside better):
Here’s a close-up of the protein’s surface:
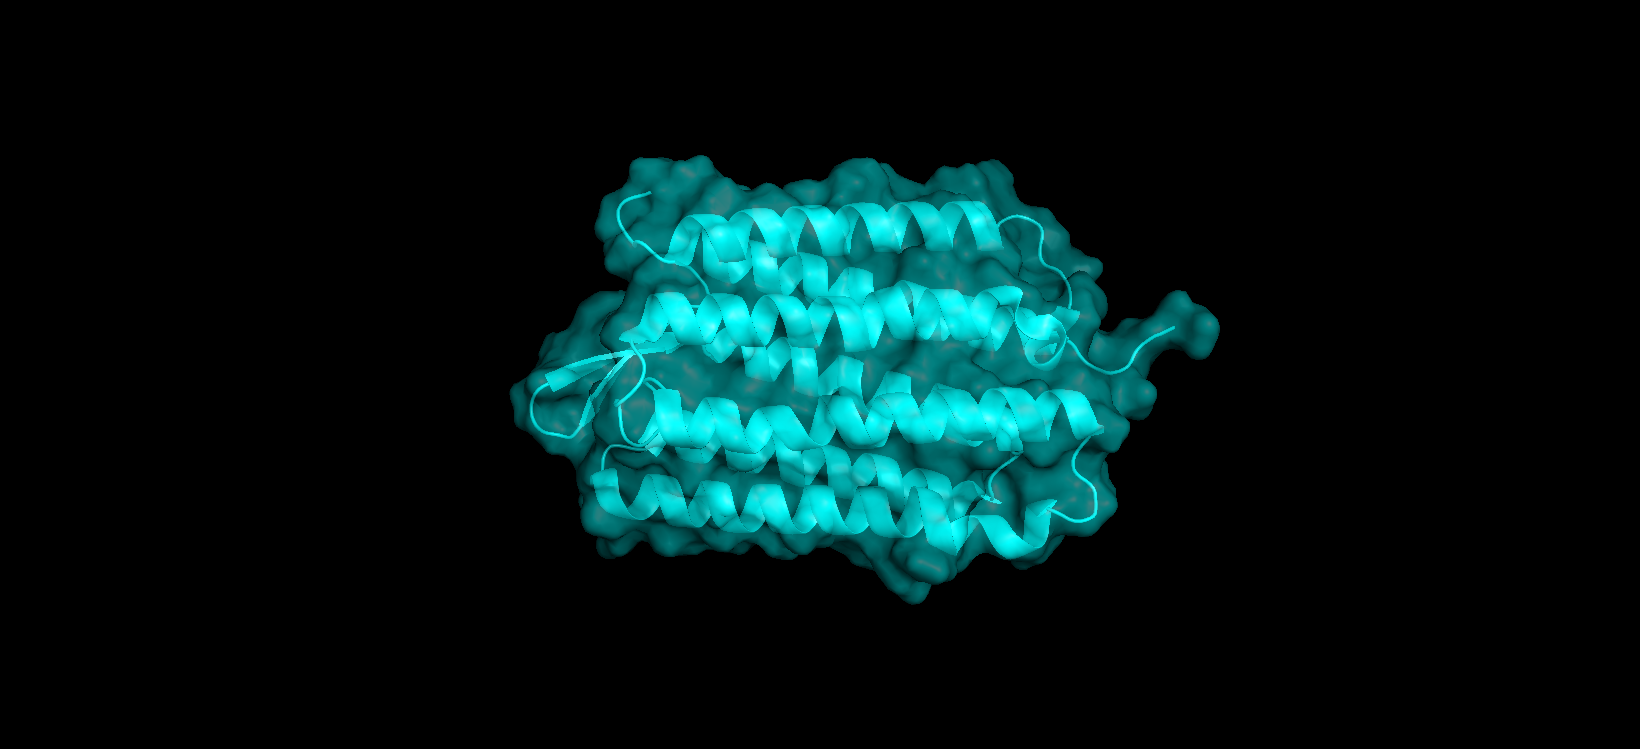
Finally, here’s another angle of the protein’s surface and its interior:
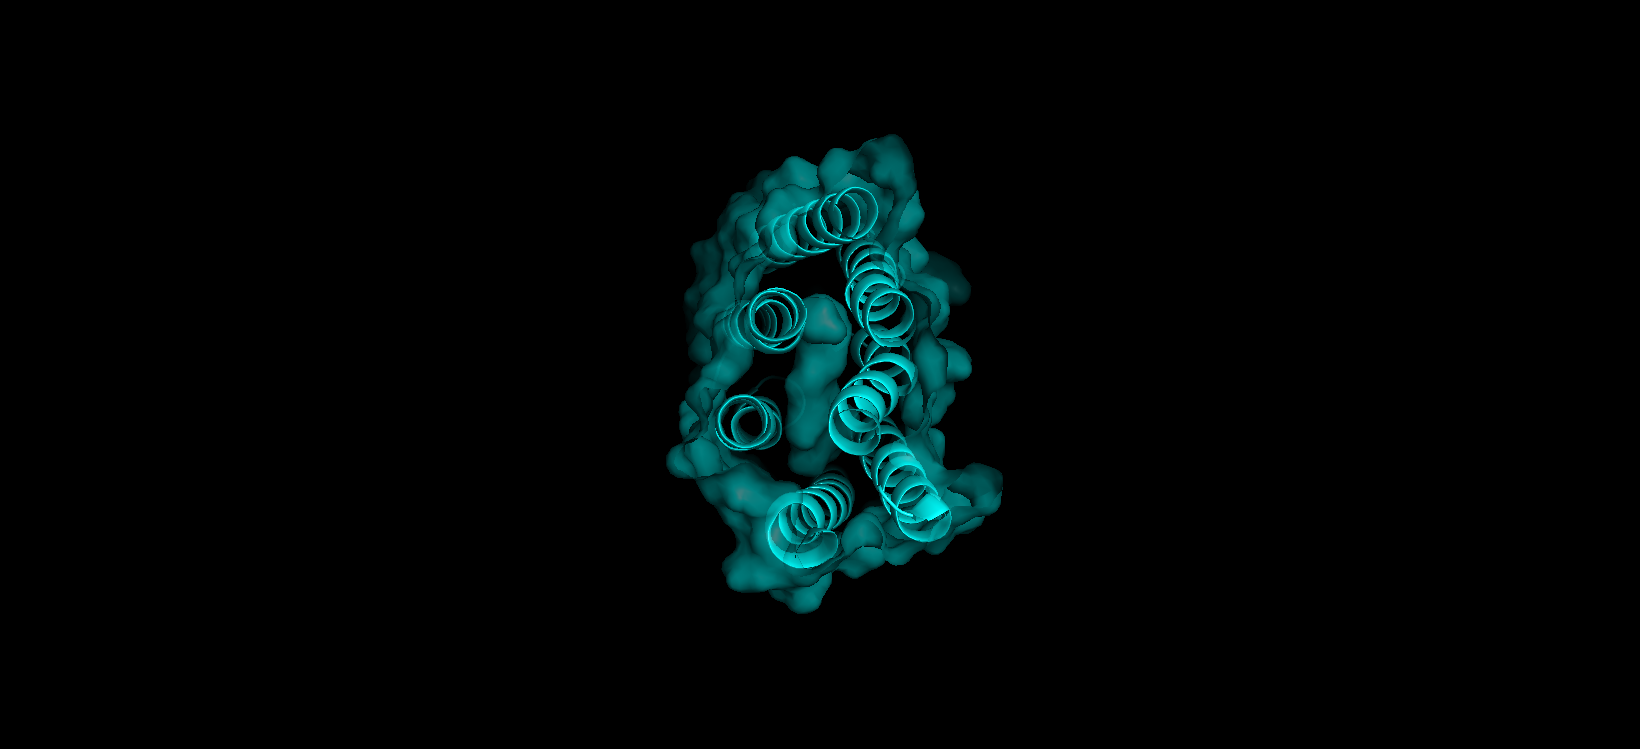
At first sight, it seems that the protein is very compact and would not have any holes. After using PyMol, I can actually see the central binding pocket that houses the retinal chromophore. Beyond this main site (“hole”), the visualization reveals a continuous internal channel rather than isolated holes along the protein. These results correspond to the bR protein function as a proton pump because of the binding pocket in the middle of it.
Part C. Using ML-Based Protein Design Tools
In this section, we will learn about the capabilities of modern protein AI models and test some of them in your chosen protein.
- Copy the HTGAA_ProteinDesign2026.ipynb notebook and set up a colab instance with GPU.
- Choose your favorite protein from the PDB.
- We will now try multiple things in the three sections below; report each of these results in your homework writeup on your HTGAA website:
Here’s my collab copy for Part C: Fabrizio_Flores_HTGAA_ProteinDesign2026.ipynb
C1. Protein Language Modeling
Deep Mutational Scans
- Use ESM2 to generate an unsupervised deep mutational scan of your protein based on language model likelihoods.
- Can you explain any particular pattern? (choose a residue and a mutation that stands out)
- (Bonus) Find sequences for which we have experimental scans, and compare the prediction of the language model to experiment.
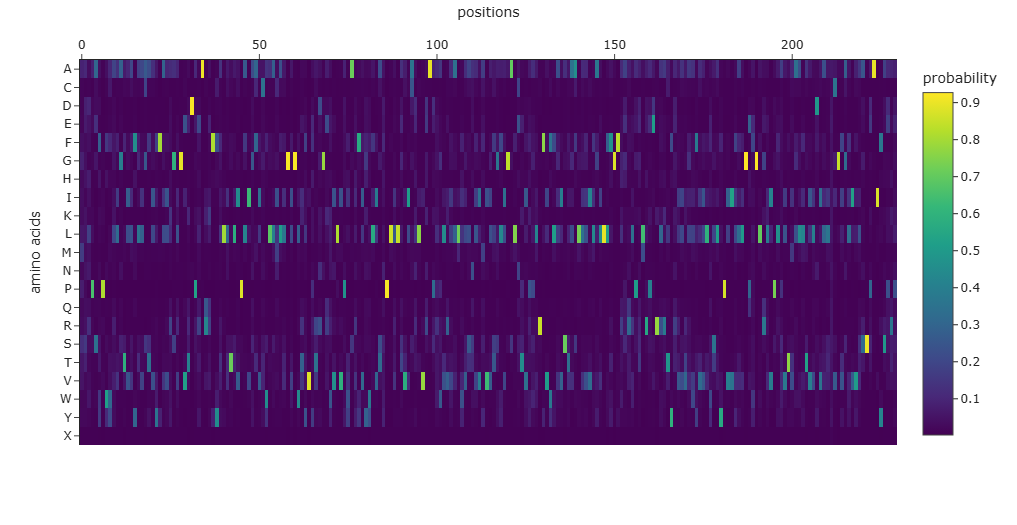
For the unsupervised deep mutational scan, I used the ESM2 8M parameter model! Here’s the heatmap the model produced using the bR protein.
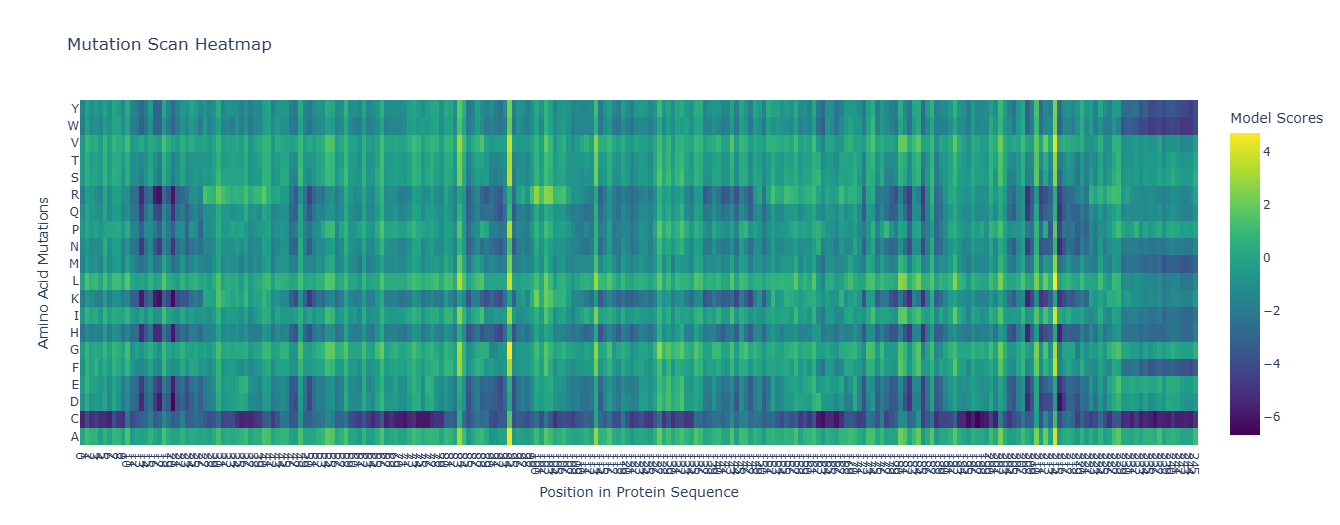
After looking at the heatmap for a while, I noticed that there were high model scores for two interesting positions: the 94 and the 214 positions showed mostly yellow colors in comparison to the other positions. But between the two, the 214 position had the highest model score.
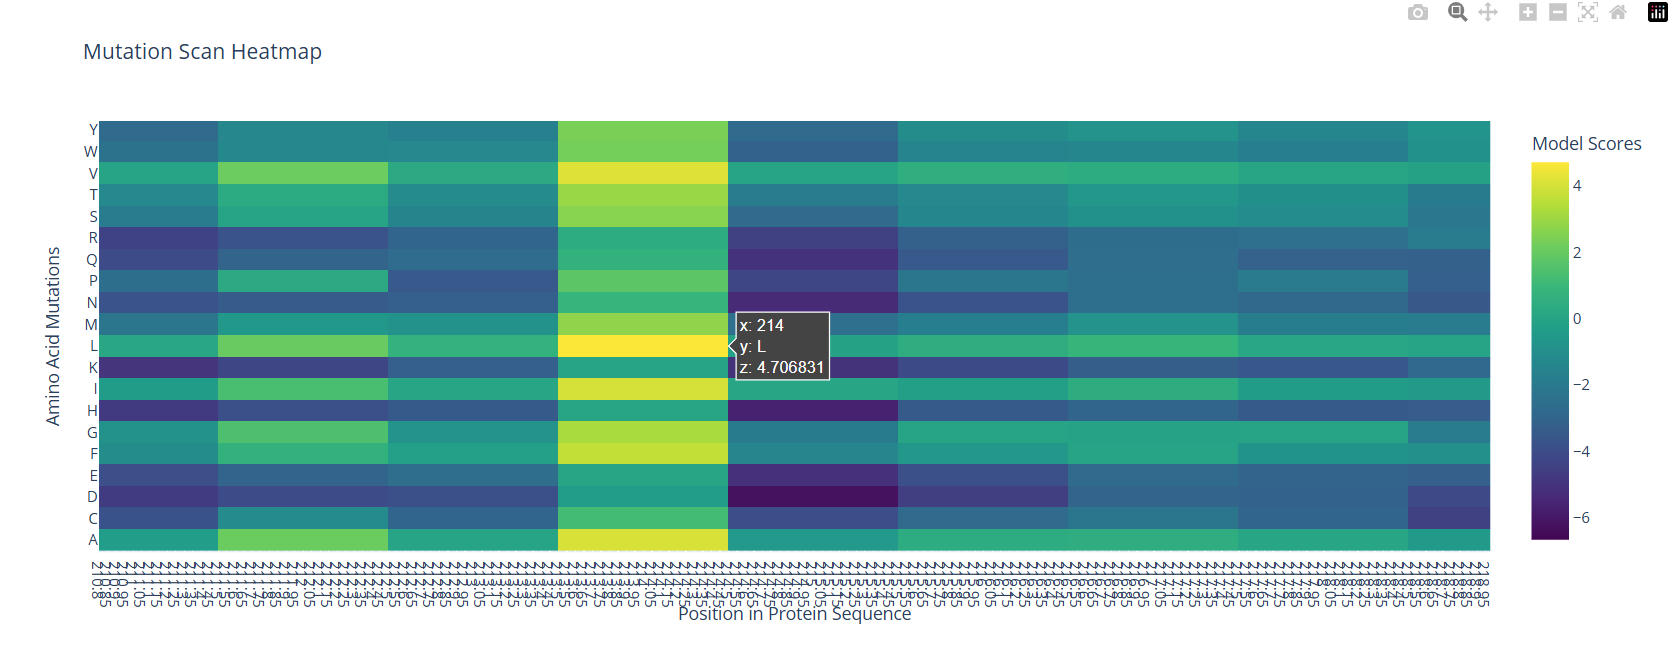
With the help of the zoom tool, we can clearly identify which residue it corresponds to: leucine (L) with a model score of 4.7. However, this mutation corresponds to the wild-type protein, which indicates that it is a conserved position that bR has perfected in its evolution.
I compared my ESM-2 unsupervised predictions with experimental data from Jacobson and Perkins (2021). They measured energy changes for mutations in bacteriorhodopsin using single molecule force spectroscopy in a native lipid bilayer. Their results show that even small mutations in the 7-helix core significantly impact protein stability. This correlates with my ESM-2 heatmap, where internal residues like L214 or A94 get the highest scores while destabilizing changes are penalized with dark, low-probability colors. This proves that the model can sense the physical constraints of 7Z09 without needing experimental labels.
Latent Space Analysis
- Use the provided sequence dataset to embed proteins in reduced dimensionality.
- Analyze the different formed neighborhoods: do they approximate similar proteins?
- Place your protein in the resulting map and explain its position and similarity to its neighbors.
I used the ESM-2 model to process a protein sequence dataset from ASTRAL SCOP. The model generates high-dimensional mean embeddings for each sequence, which then is reduced to three dimensions using the t-SNE algorithm to visualize the latent space in a 3D plot.
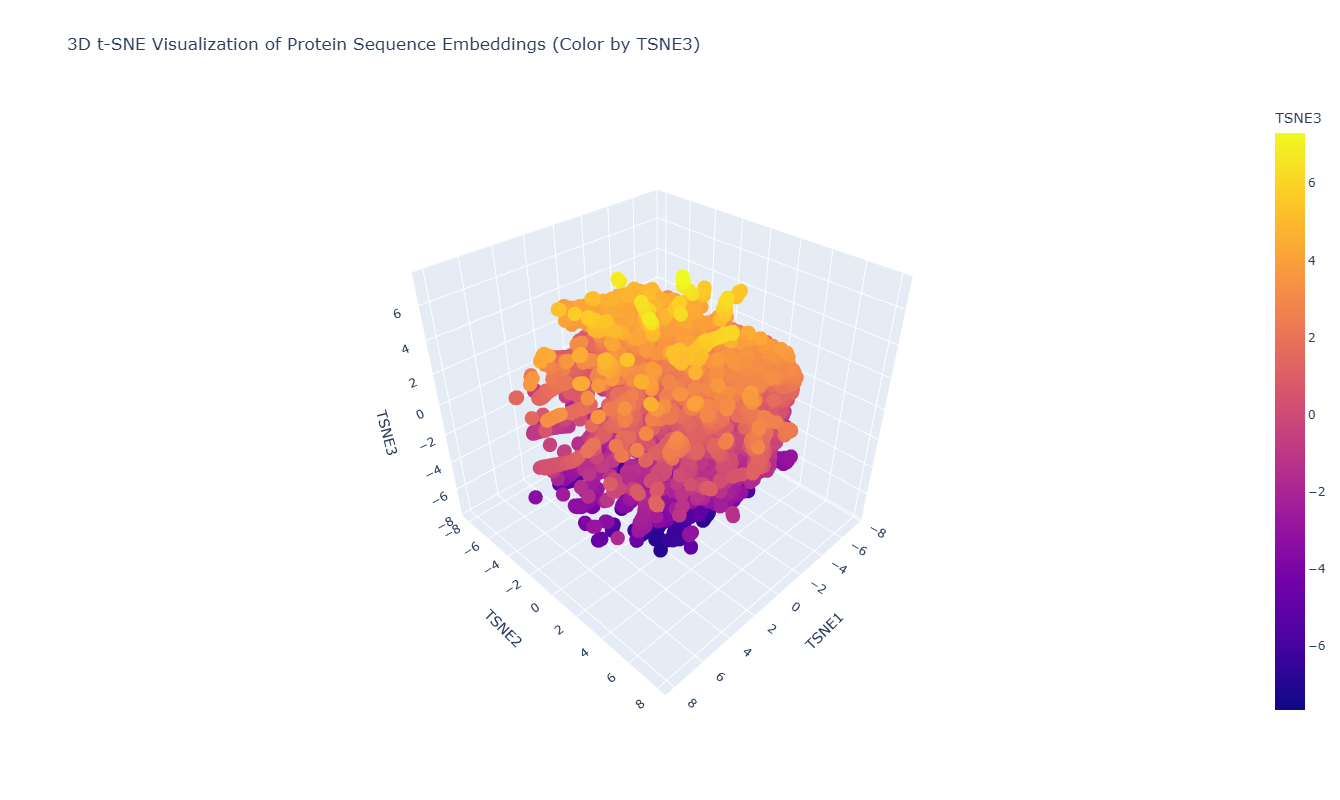
The 3D map reveals distinct neighborhoods where proteins are grouped by their structural characteristics. These neighborhoods approximate similar proteins effectively because of the nature of the SCOP dataset (structural classification). For instance, the following neighborhood contains alpha-1-syntrophin, phosphoinositide phospholipase C, and Rho guanine nucleotide exchange factor 12.
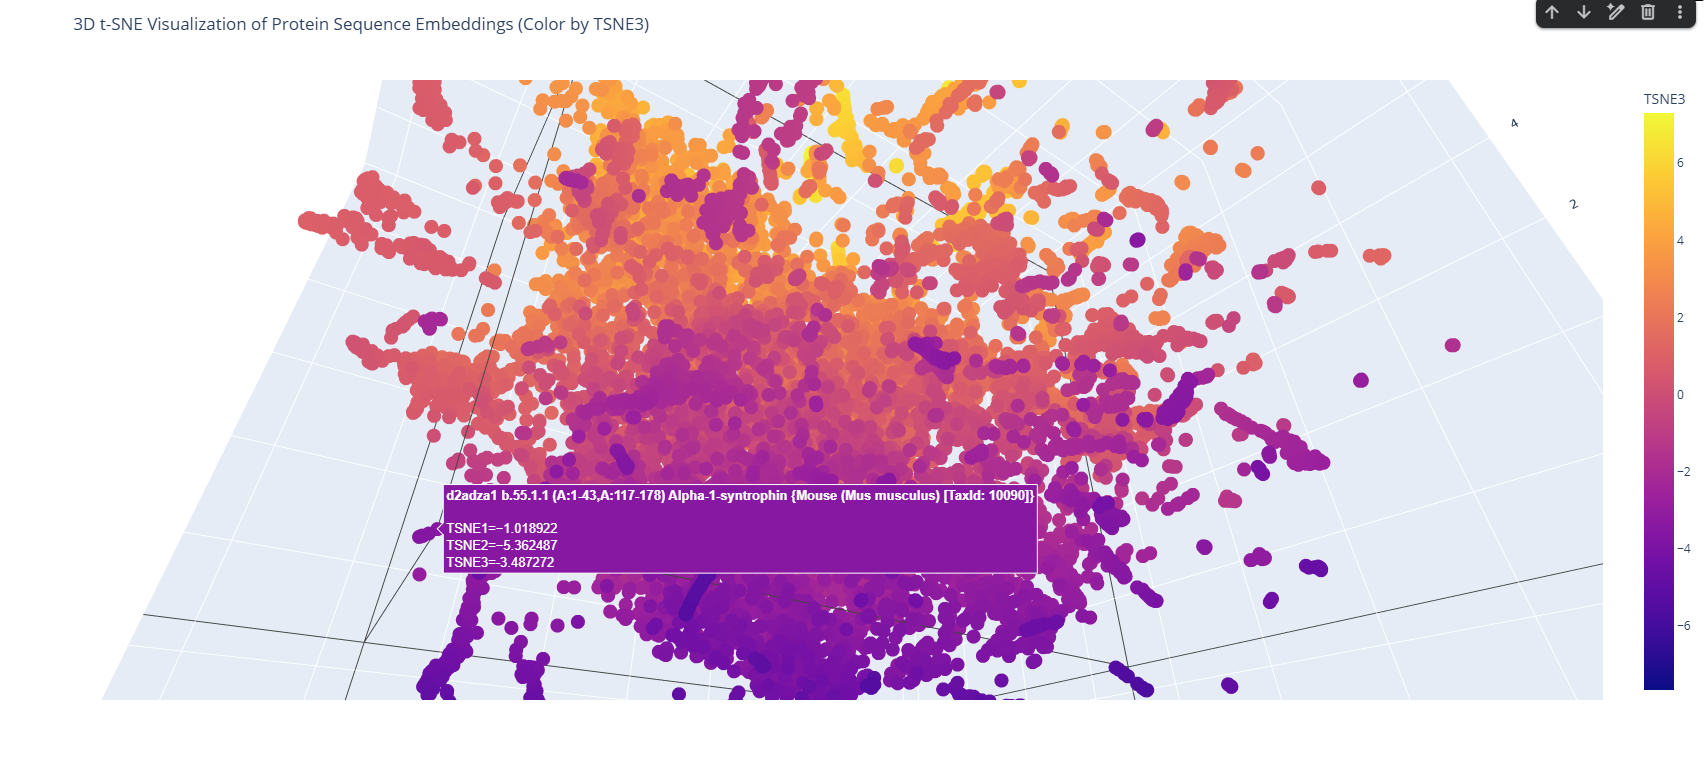
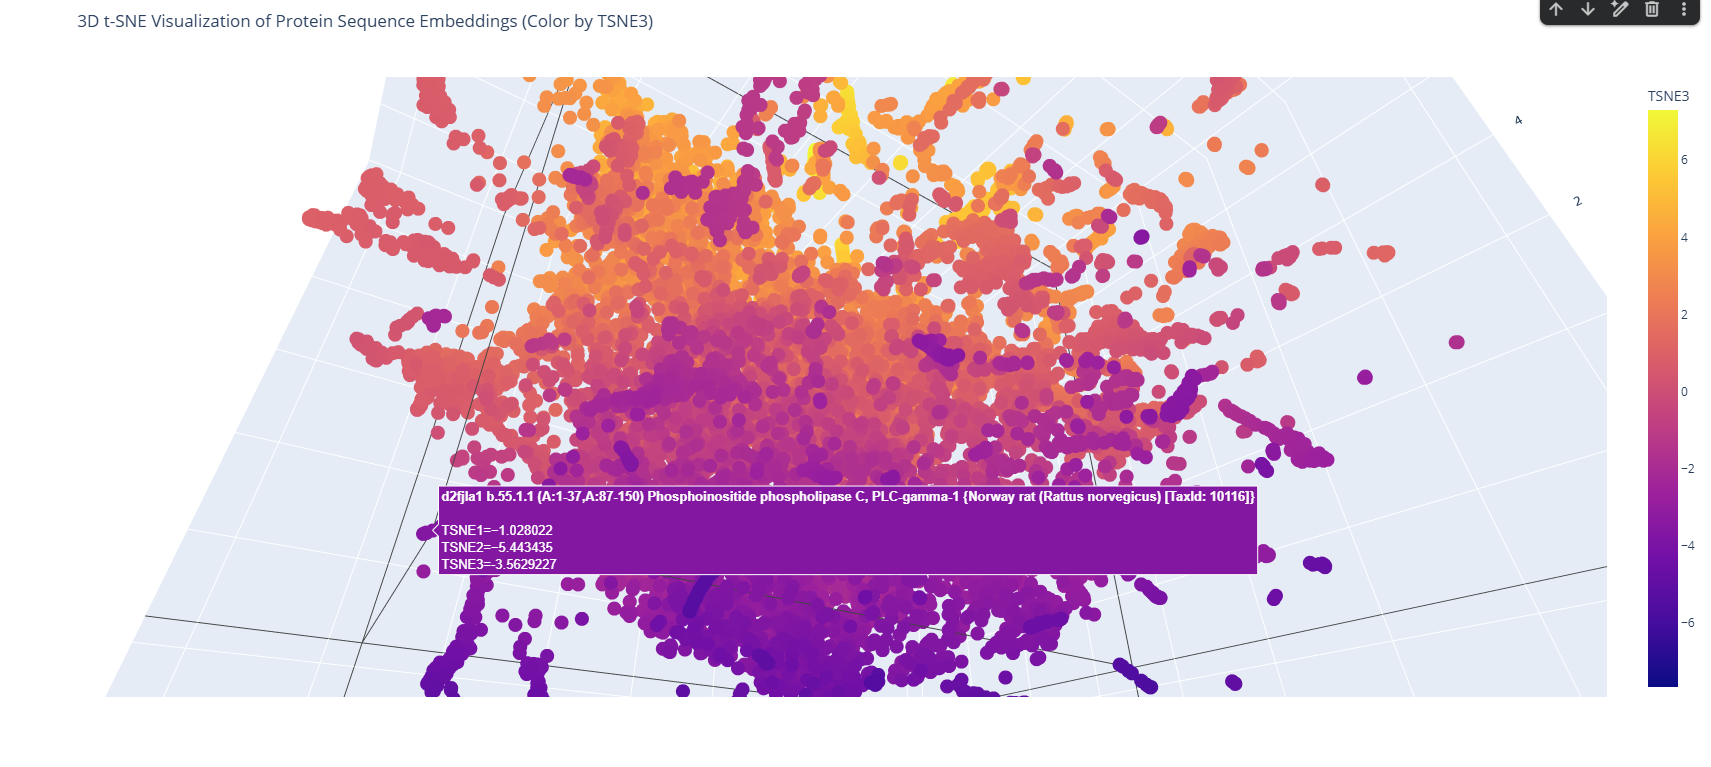
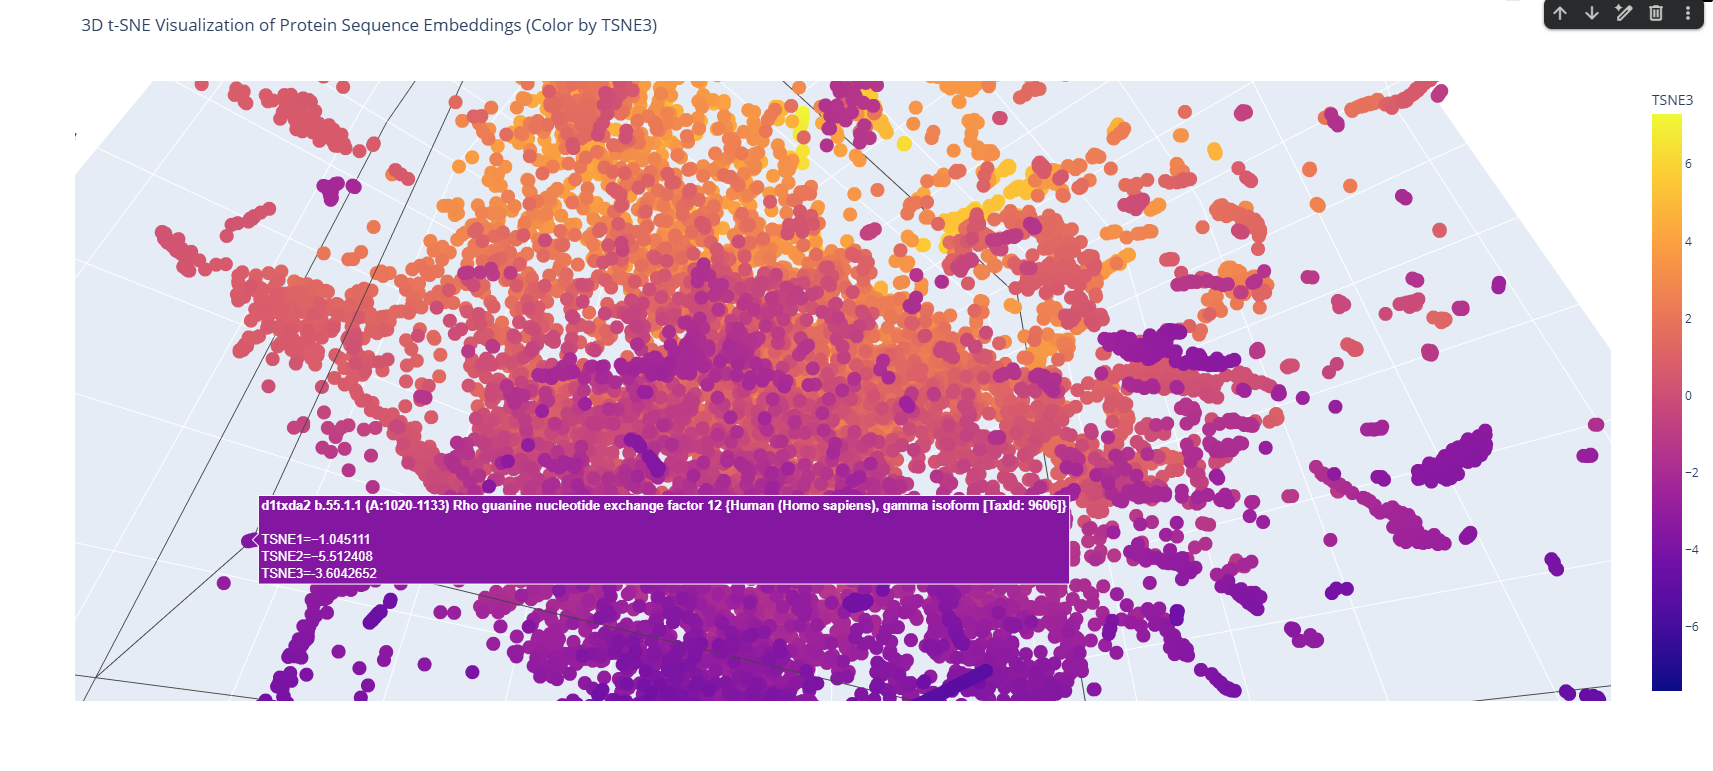
These proteins belong to the PYP-like sensor domain (PAS domain) superfamily since they share the alpha-beta(2)-alpha(2)-beta(3) structure.
I place my protein within Class f: Membrane and cell surface proteins and peptides. Its position in the latent space is determined by the specific patterns of its seven transmembrane alpha-helices and its high hydrophobic content. It clusters near other microbial rhodopsins and light-driven pumps, as the model recognizes that these proteins share the same biological logic and structural constraints required to function within a lipid bilayer.
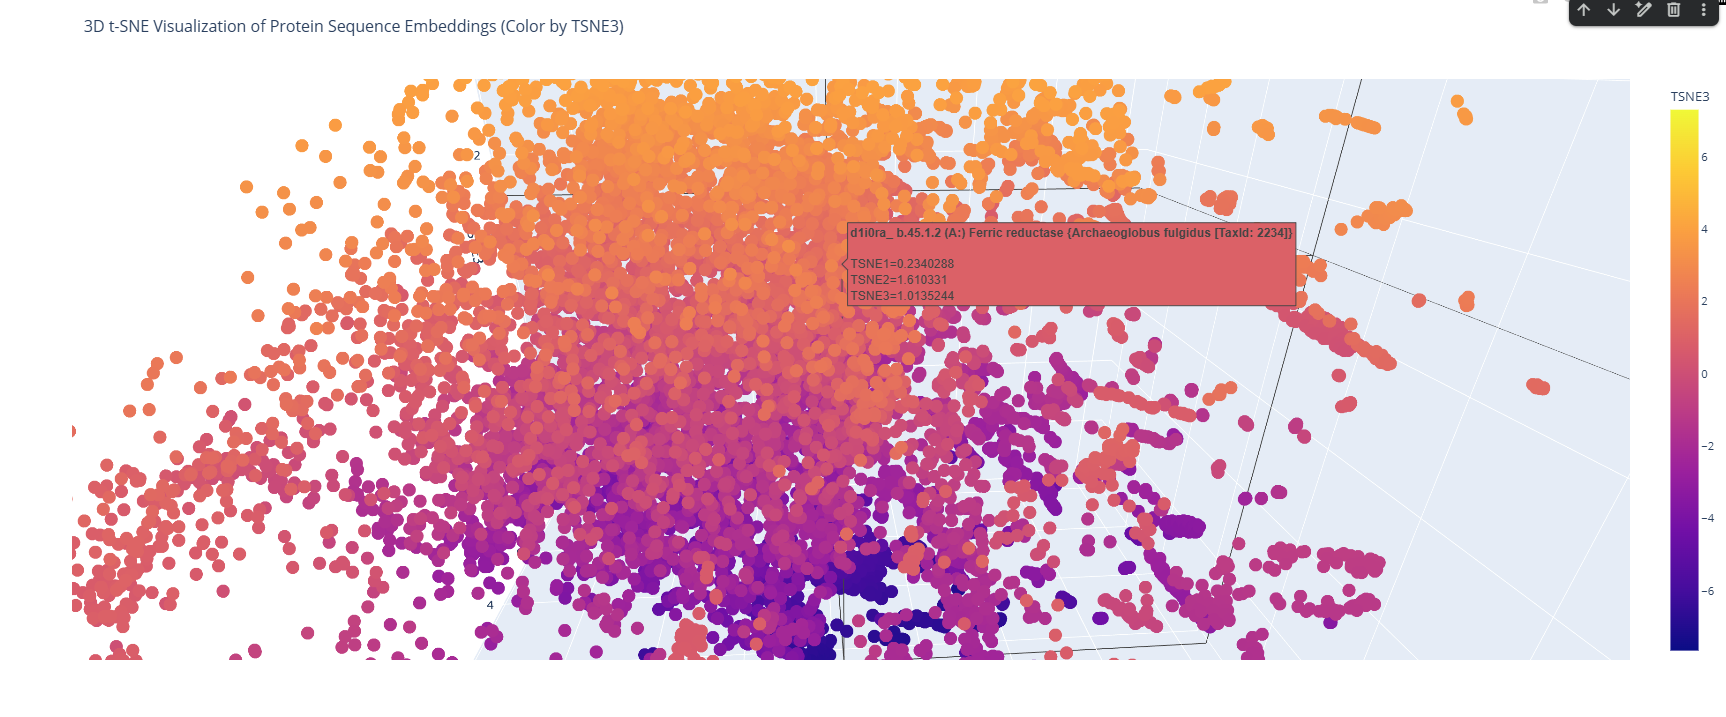
I couldn’t find my protein exactly, but it is near other bacteriorhodopsin-like proteins since my protein’s Tax ID is 2242. So in the 3D plot I would probably find my protein somewhere in the middle.
C2. Protein Folding
Folding a protein
- Fold your protein with ESMFold. Do the predicted coordinates match your original structure?
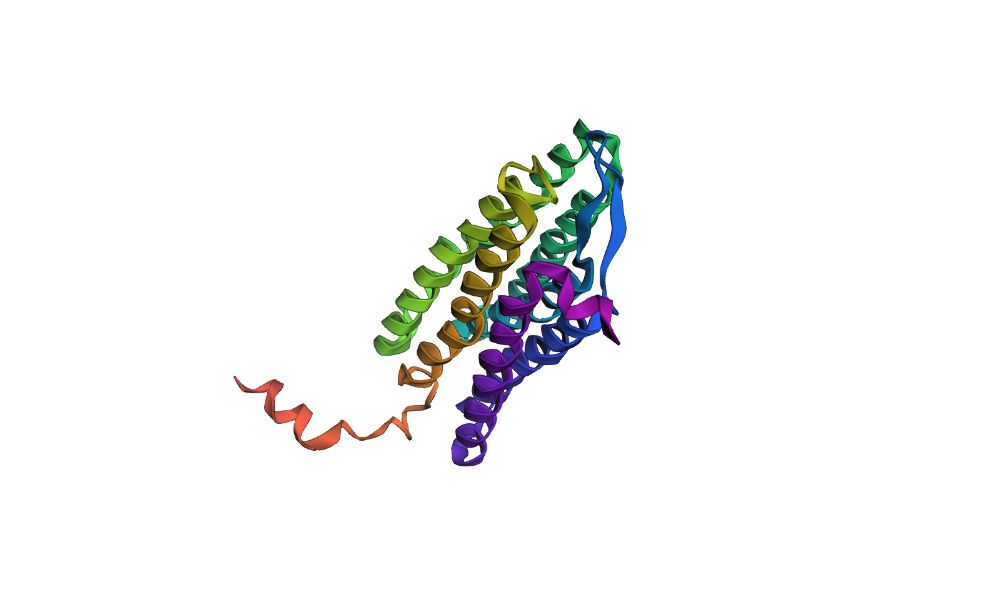
Here’s my protein folded with ESMFold:
And here’s an alignment of the original 7Z09 bR protein and the ESMFolded one (this was done using the align command on PyMol using the ESMFold .pdb result and the 7Z09.pdb)
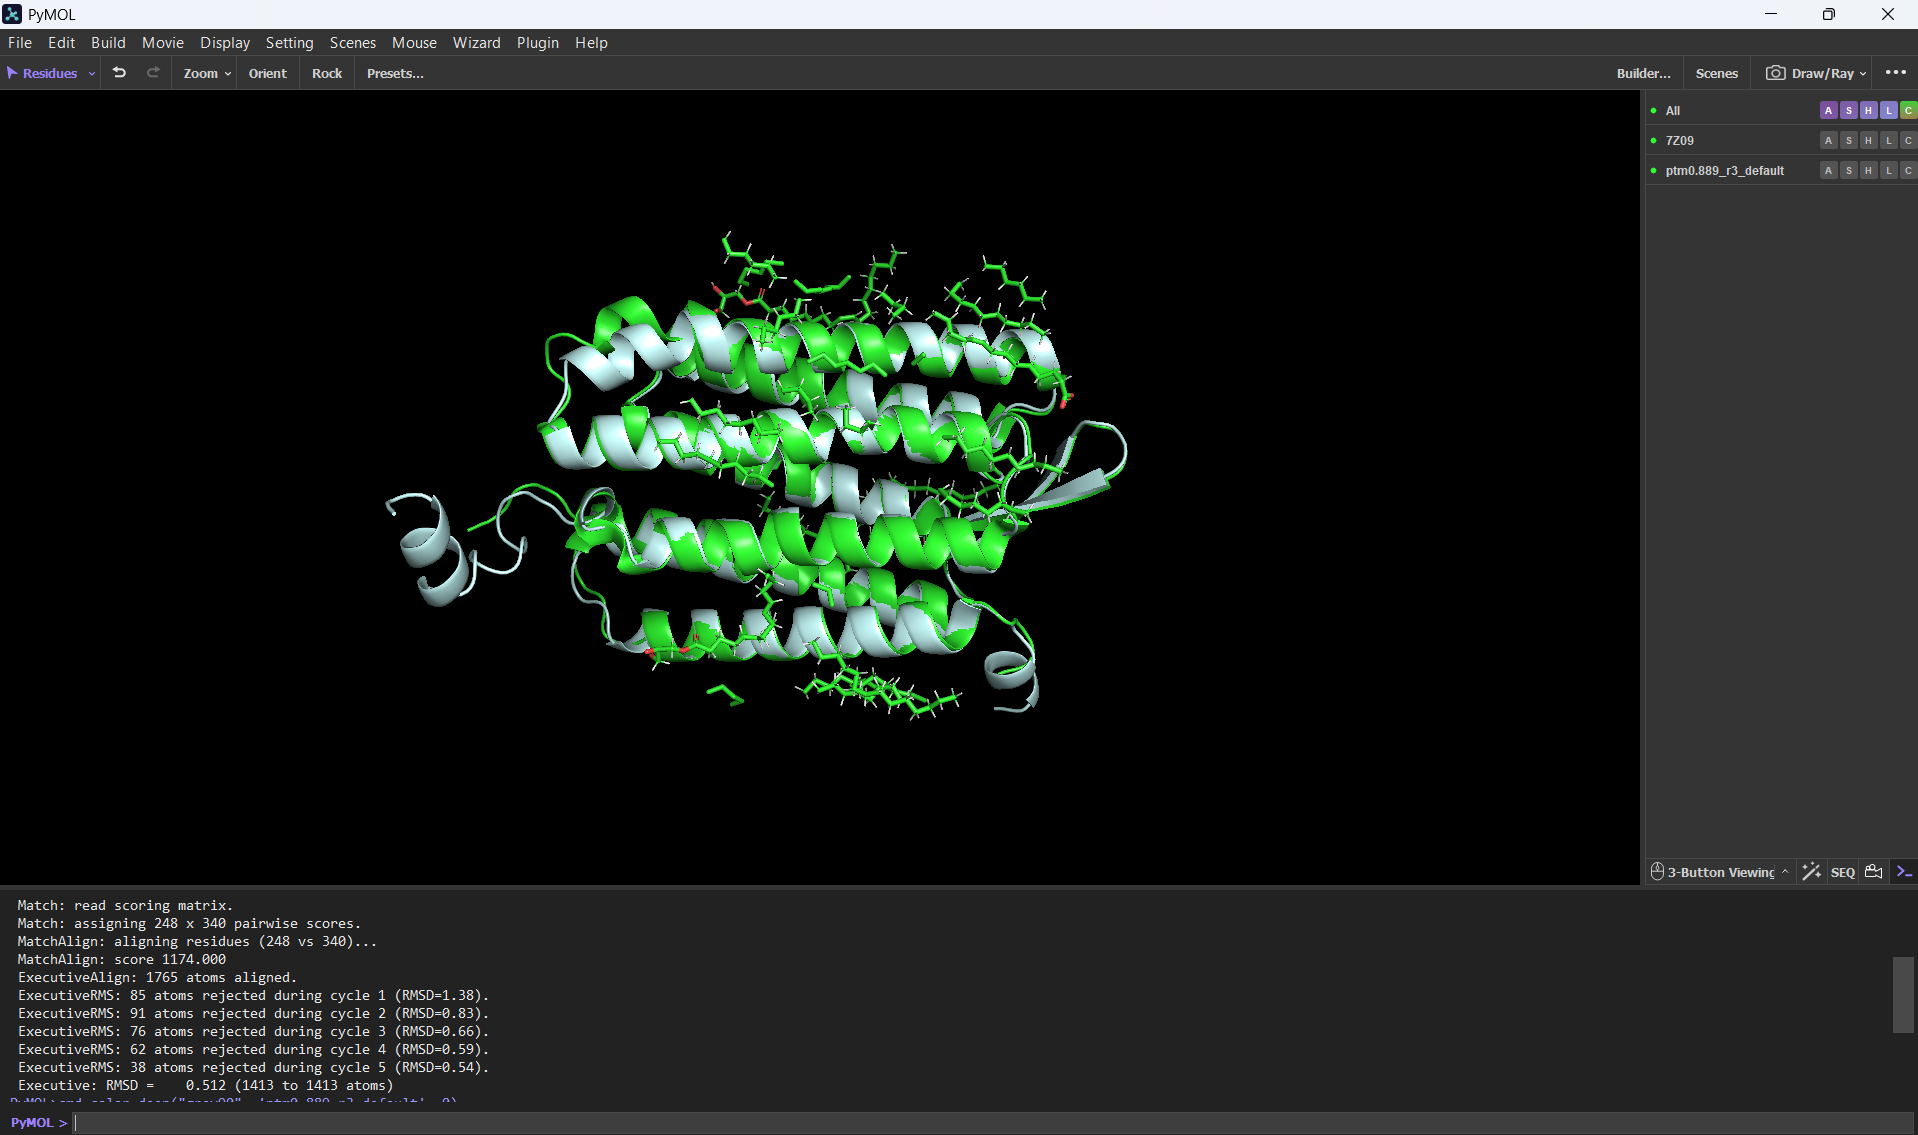
Aditionally, here’s the PyMOL command results after doing the alignment.
PyMOL>align ptm0.889_r3_default, 7Z09 Match: read scoring matrix. Match: assigning 248 x 340 pairwise scores. MatchAlign: aligning residues (248 vs 340)... MatchAlign: score 1174.000 ExecutiveAlign: 1765 atoms aligned. ExecutiveRMS: 85 atoms rejected during cycle 1 (RMSD=1.38). ExecutiveRMS: 91 atoms rejected during cycle 2 (RMSD=0.83). ExecutiveRMS: 76 atoms rejected during cycle 3 (RMSD=0.66). ExecutiveRMS: 62 atoms rejected during cycle 4 (RMSD=0.59). ExecutiveRMS: 38 atoms rejected during cycle 5 (RMSD=0.54). Executive: RMSD = 0.512 (1413 to 1413 atoms)
The RMSD was only 0.512 Å over 1413 atoms; this statistic confirms that the ESMFold code can accurately reconstruct the bacteriorhodopsin protein. This means that the language model has deeply learned the structural patterns of the bacteriorhodopsin fold with high accuracy.
- Try changing the sequence, first try some mutations, then large segments. Is your protein structure resilient to mutations?
To test the resilience of the bR 7Z09 fold, I performed two types of sequence modifications. First, I introduced point mutations in the transmembrane helices.
>Point mutation L214P QAQITGRPEWIWLALGTALMGLGTLYFLVKGMGVSDPDAKKFYAITTLVPAIAFTMYLSMLLGYGLTMVPFGGEQNPIYWARYADWLFTTPLLLLDLALLVDADQGTILALVGADGIMIGTGLVGALTKVYSYRFVWWAISTAAMLYILYVLFFGFTSKAESMRPEVASTFKVLRNVTVVLWSAYPVVWLIGSEGAGIVPPNIETLLFMVLDVSAKVGFGLILLRSRAIFGEAEAPEPSAGDGAAATS
The structure showed high resilience to minor changes, maintaining its 7-helix architecture with minimal RMSD shifts. However, when I replaced large segments of the helical core with random or polar sequences, the ESMFold prediction collapsed or showed significant unfolding in those regions.
>Large segment mutation using A's and G's QAQITGRPEWIWLALGTALMGLGTLYFLVKGMGVSDPDAKKFYAITTLVPAIAFTMYLSMLLGYGLTMVPFGGEQNPIYWARYADWLFTTPLLLLDLALLVDADQGTILALVGADGIMIGTGLVGALTKVYSYRFVAAGGAAAGGAAAGGAAAGGAAMLYILYVLFFGFTSKAESMRPEVASTFKVLRNVTVVLWSAYPVVWLIGSEGAGIVPLNIETLLFMVLDVSAKVGFGLILLRSRAIFGEAEAPEPSAGDGAAATS
This confirms that while the bacteriorhodopsin fold is structurally robust, its stability is strictly dependent on the conserved hydrophobic patterns that allow the helices to pack correctly within the membrane.
C3. Protein Generation
Inverse-Folding a protein: Let’s now use the backbone of your chosen PDB to propose sequence candidates via ProteinMPNN
- Analyze the predicted sequence probabilities and compare the predicted sequence vs the original one.
Here are the results after running the ProteinMPNN colab section
`Generating sequences…
7Z09, score=1.6239, fixed_chains=[], designed_chains=[‘A’], model_name=v_48_020 TGRPEWIWLALGTALMGLGTLYFLVKGMGVSDPDAKKFYAITTLVPAIAFTMYLSMLLGYGLTMVPFGGEQNPIYWARYADWLFTTPLLLLDLALLVDADQGTILALVGADGIMIGTGLVGALTKVYSYRFVWWAISTAAMLYILYVLFFGFTSKAESMRPEVASTFKVLRNVTVVLWSAYPVVWLIGSEGAGIVPLNIETLLFMVLDVSAXVGFGLILLRSRAIFGEAE T=0.1, sample=0, score=0.9490, seq_recovery=0.4410 MSLPAFPWWLLGTIAFLLGTIYFAIRGVGVTDPEARRFYTLLTLIPLIGAICWLLILLGIGWTYVYTDGEWVLVPWAVFIYWLITFPLLLTVIALLVRAPLWLRVALWVSNLVMVLTGLIGALETVPPLRFVFLAISTAALLLILALLLFGFRARLPTLRPERLRTYRVVVLWFVVLWSLYPVILLLGPFGLRLIPLPVTVALLTVLDILLXCGIGLIVLSSPAIYSPRP`
The ProteinMPNN analysis shows a 44.1% sequence recovery and a high 0.9490 confidence score, indicating that the model successfully redesigned over half of the residues while maintaining the protein’s evolutionary “grammar.”
The probability heatmap confirms that internal transmembrane positions remain conserved, while external loops allow for significant sequence variability.
- Input this sequence into ESMFold and compare the predicted structure to your original.
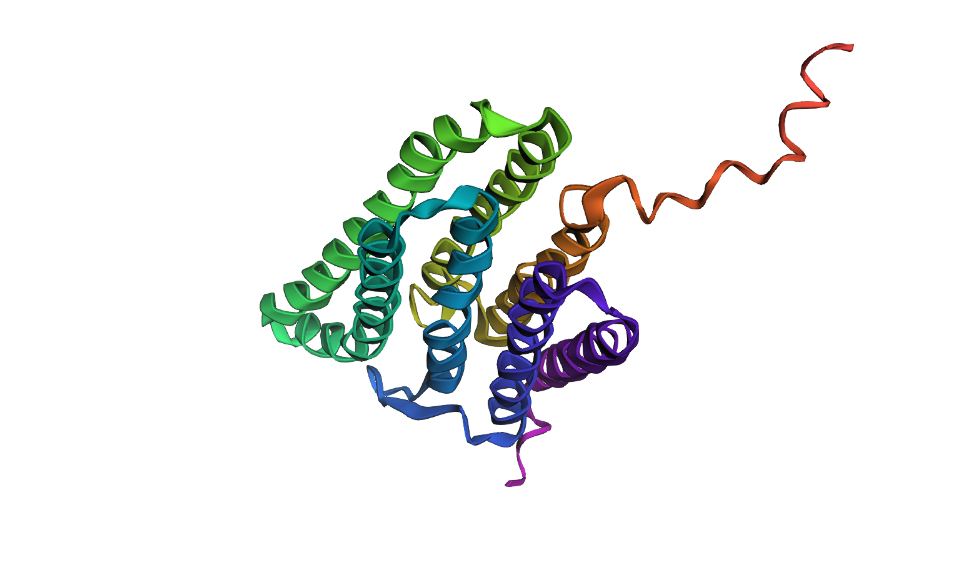
Here’s a screenshot of the protein generated by ProteinMPNN and folded using ESMFold:
Here’s a screenshot of the protein visualized using PyMOL aligned with the original one:
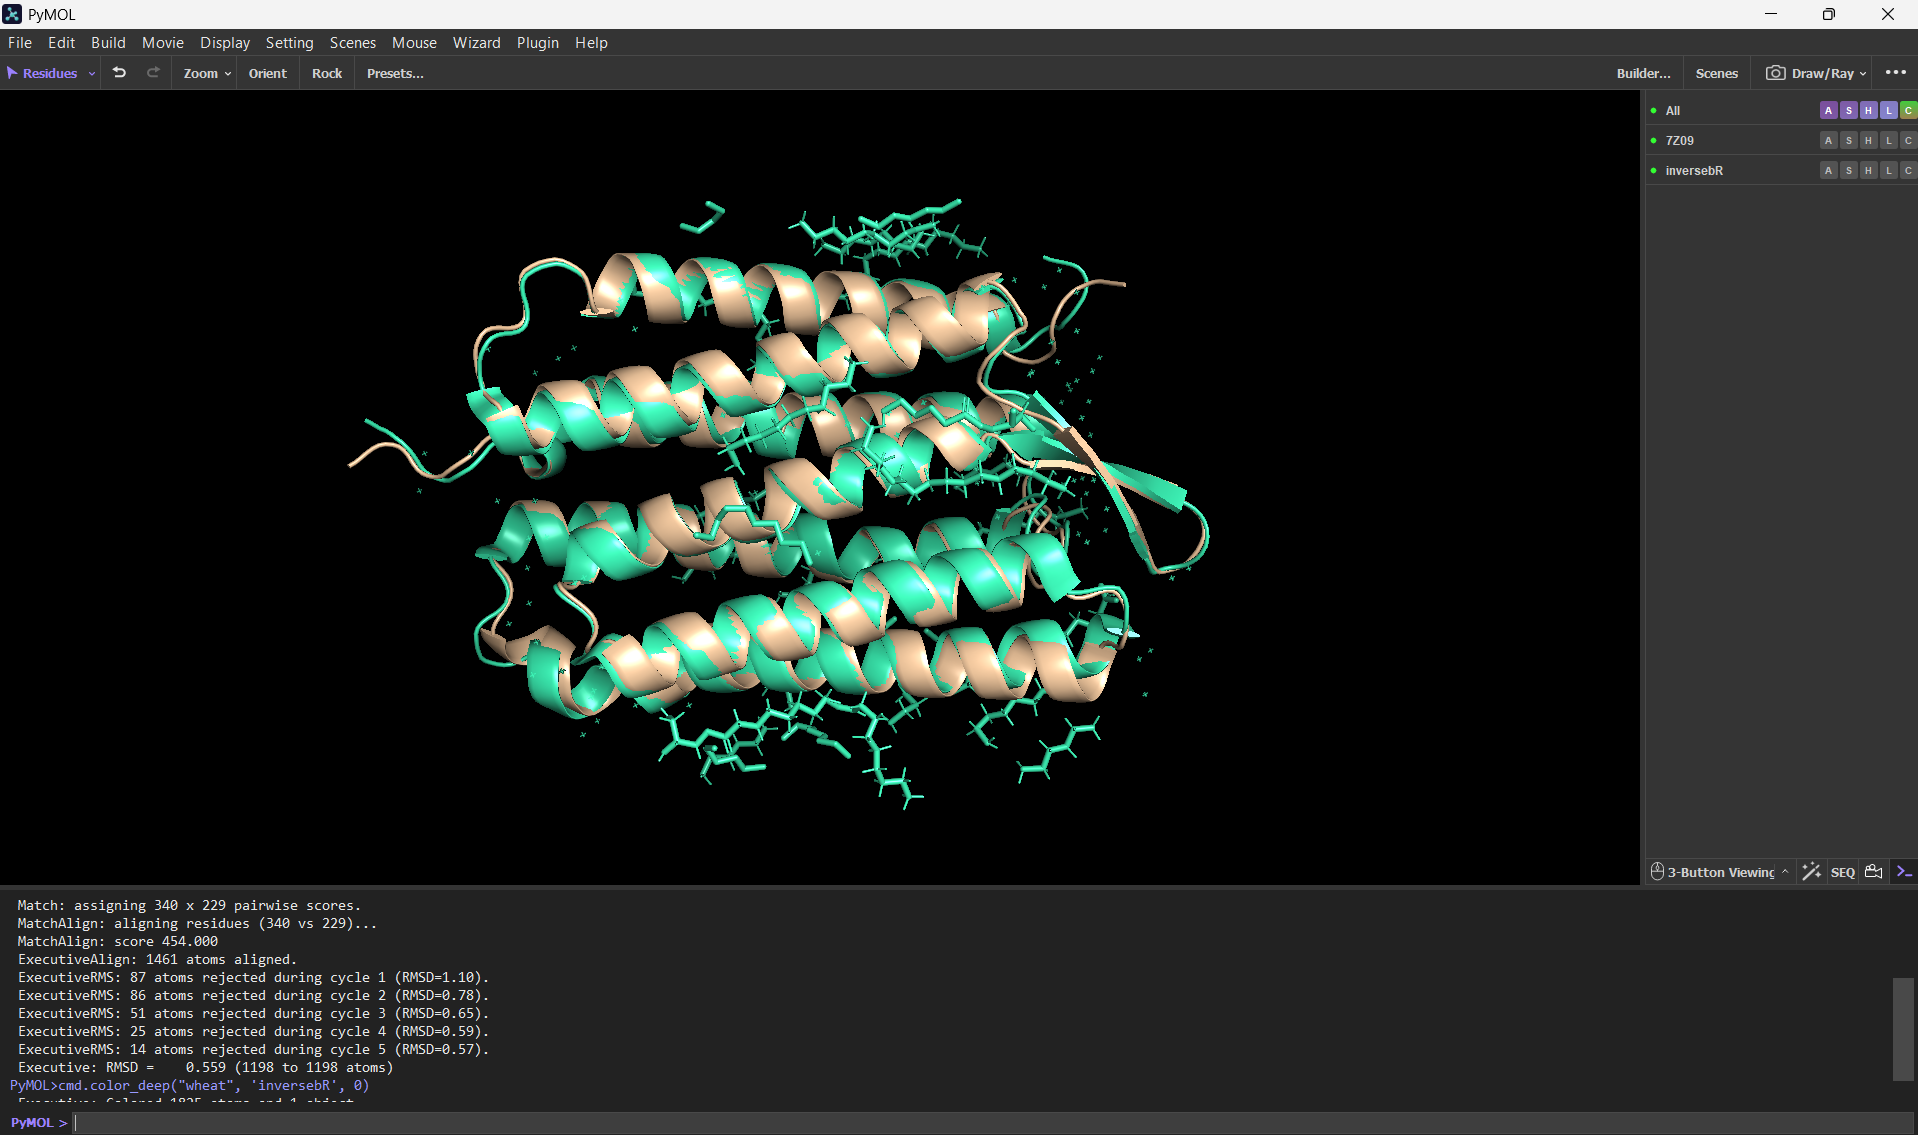
Folding the redesigned sequence with ESMFold resulted in a structure nearly identical to the original 7Z09 backbone, validating that the inverse-folding process preserved the 7-helix architecture. This proves that ProteinMPNN can “hallucinate” valid sequence variants that strictly obey the biophysical and geometrical constraints of the native bacteriorhodopsin fold.
References
- Barr, B., Levitt, D. E., & Gollahon, L. (2025). Red Meat Amino acids for Beginners: A narrative review. Nutrients, 17(6), 939. https://doi.org/10.3390/nu17060939
- Perrino, A. P., Miyagi, A., & Scheuring, S. (2021). Single molecule kinetics of bacteriorhodopsin by HS-AFM. Nature Communications, 12(1), 7225. https://doi.org/10.1038/s41467-021-27580-2
- Chatterjee, H., Mahapatra, A. J., Zacharias, M., & Sengupta, N. (2024). Helical reorganization in the context of membrane protein folding: Insights from simulations with bacteriorhodopsin (BR) fragments. Biochimica Et Biophysica Acta (BBA) - Biomembranes, 1866(5), 184333. https://doi.org/10.1016/j.bbamem.2024.184333
- Jacobson, D. R., & Perkins, T. T. (2021). Free-energy changes of bacteriorhodopsin point mutants measured by single-molecule force spectroscopy. Proceedings Of The National Academy Of Sciences, 118(13). https://doi.org/10.1073/pnas.2020083118
Part D. Group Brainstorm on Bacteriophage Engineering
- Find a group of ~3–4 students
I found a group of 4 students: Sheila Ramani, Ganapathi Naayagam, Deep Dalvi and I, Fabrizio Flores
Read through the Phage Reading material listed under “Reading & Resources” below.
Review the Bacteriophage Final Project Goals for engineering the L Protein:
- Increased stability (easiest)
- Higher titers (medium)
- Higher toxicity of lysis protein (hard)
Brainstorm Session
- Choose one or two main goals from the list that you think you can address computationally (e.g., “We’ll try to stabilize the lysis protein,” or “We’ll attempt to disrupt its interaction with E. coli DnaJ.”).
- We will focus on increasing the structural stability of the L protein to ensure it remains functional under different environmental conditions.
- We will also attempt to increase the toxicity of the lysis protein by optimizing its target regions to enhance bacterial cell wall disruption.
- Write a 1-page proposal (bullet points or short paragraphs) describing:
- Which tools/approaches from recitation you propose using (e.g., “Use Protein Language Models to do in silico mutagenesis, then AlphaFold-Multimer to check complexes.”).
- We will use ESMFold to perform in silico mutational scanning and identify target regions in the L protein.
- We propose using Genomic Language Models (GLMs) to design and optimize sequences with higher lytic potential.
- Finally, we will use AlphaFold-Multimer to validate the folding and stability of the engineered protein complexes.
- Why do you think those tools might help solve your chosen sub-problem?
- ESMFold allows for high-speed structural feedback, making it easier to test how mutations affect the 7-helix bundle.
- GLMs are essential for capturing the “evolutionary grammar” of toxicity, helping to design proteins that are more aggressive than natural variants.
- AlphaFold ensures that our computational designs are biophysically plausible and stable before any potential wet-lab implementation.
- Name one or two potential pitfalls (e.g., “We lack enough training data on phage–bacteria interactions.”).
- Contextual Gap: There is a lack of specific data regarding the host bacteria’s environment, which might lead to unexpected results in vivo.
- Misfolding Risk: The engineered protein might still misfold or aggregate in a real biological system despite having positive simulation results in the pipeline.
- Include a schematic of your pipeline.
Here’s a short written schematic of our pipeline: [Sequence Input] → [ESM-2 Mutational Scan] → [GLM Toxicity Optimization] → [AlphaFold Validation] → [Final Design]
- This resource may be useful: HTGAA Protein Engineering Tools
Each individually put your plan on your HTGAA website
- Include your group’s short plan for engineering a bacteriophage