Week 6 HW: Genetic Circuits Part I
Homework
Assignment: DNA Assembly
Answer these questions about the protocol in this week’s lab:
- What are some components in the Phusion High-Fidelity PCR Master Mix and what is their purpose?
Some components in the Phusion High-Fideñity PCR Master Mix include the Phusion DNA Polymerase, which is the enzyme that actually builds the new DNA strands with high accuracy. It also contains dNTPs, which are the building blocks (A, T, C, and G) used to synthesize the DNA. There are also buffer salts and magnesium ions (Mg^2+) that provide the right chemical environment for the enzyme to stay stable and work efficiently.
- What are some factors that determine primer annealing temperature during PCR?
The biggest factor is the melting temperature (T_m) of the primers, which is mostly determined by their length and GC content since G-C pairs have stronger bonds than A-T pairs. The concentration of salts in the PCR buffer and the concentration of the primers themselves also play a huge role. Usually the annealing temperature is set about 2 to 5°C below the lower T_m of the primer pair to make sure they bind specifically to the template.
- There are two methods from this class that create linear fragments of DNA: PCR, and restriction enzyme digests. Compare and contrast these two methods, both in terms of protocol as well as when one may be preferable to use over the other.
For instance, PCR uses a thermocycler and specific primers to synthesize millions of new copies of a specific DNA segment which is great for adding mutations or overhangs for assembly. While restriction digests use enzymes to cut existing DNA at specific recognition sites, which is a much simpler “cut and paste” protocol.
PCR is preferable when you need to create a lot of DNA from a tiny sample or when you need to change the sequence (like our color mutations). Digests are better when you already have the DNA and just need to move a large, pre-existing block without the risk of mutation errors from a polymerase.
- How can you ensure that the DNA sequences that you have digested and PCR-ed will be appropriate for Gibson cloning?
I’d have to verify that the ends of my DNA fragments have overlapping sequences of about 20 to 40 base pairs that are identical to the fragment they are being joined to. In the lab protocol, it is verified by designing primers with 5’ overhangs that match the other fragment. I’d also need to check the concentration via Nanodrop to ensure I have enough DNA and run a diagnostic gel to confirm the fragments are the correct size before mixing them.
- How does the plasmid DNA enter the E. coli cells during transformation?
The DNA enters through temporary pores created in the bacterial cell wall. In heat shock we use an abrupt temperature change to stress the membrane and open these pores, while in electroporation we use a high-voltage pulse to achieve the same thing. Once the pores are open, the plasmid moves into the cell by simple diffusion, and then we give the cells SOC media so they can recover and close those pores back up.
- Describe another assembly method in detail (such as Golden Gate Assembly)
- Explain the other method in 5 - 7 sentences plus diagrams (either handmade or online).
Golden Gate Assembly is a really cool method that uses Type IIS restriction enzymes and T4 DNA ligase to assemble multiple fragments in a single reaction. Unlike standard enzymes, these cut outside of their recognition sites, which allows for “scarless” assembly because the recognition sequences are removed during the process. You design the fragments so that they create unique 4-base pair overhangs that guide the pieces together in the correct order. This is super efficient for building complex circuits because you can put many fragments together at once in one tube. It relies on a cycle of different temperatures to keep the cutting and pasting going until the final circular plasmid is formed.

Here’s a diagram of the first step of Golden Gate Assembly from Snapgene
- Model this assembly method with Benchling or Asimov Kernel!
Assignment: Asimov Kernel
- Create a Repository for your work
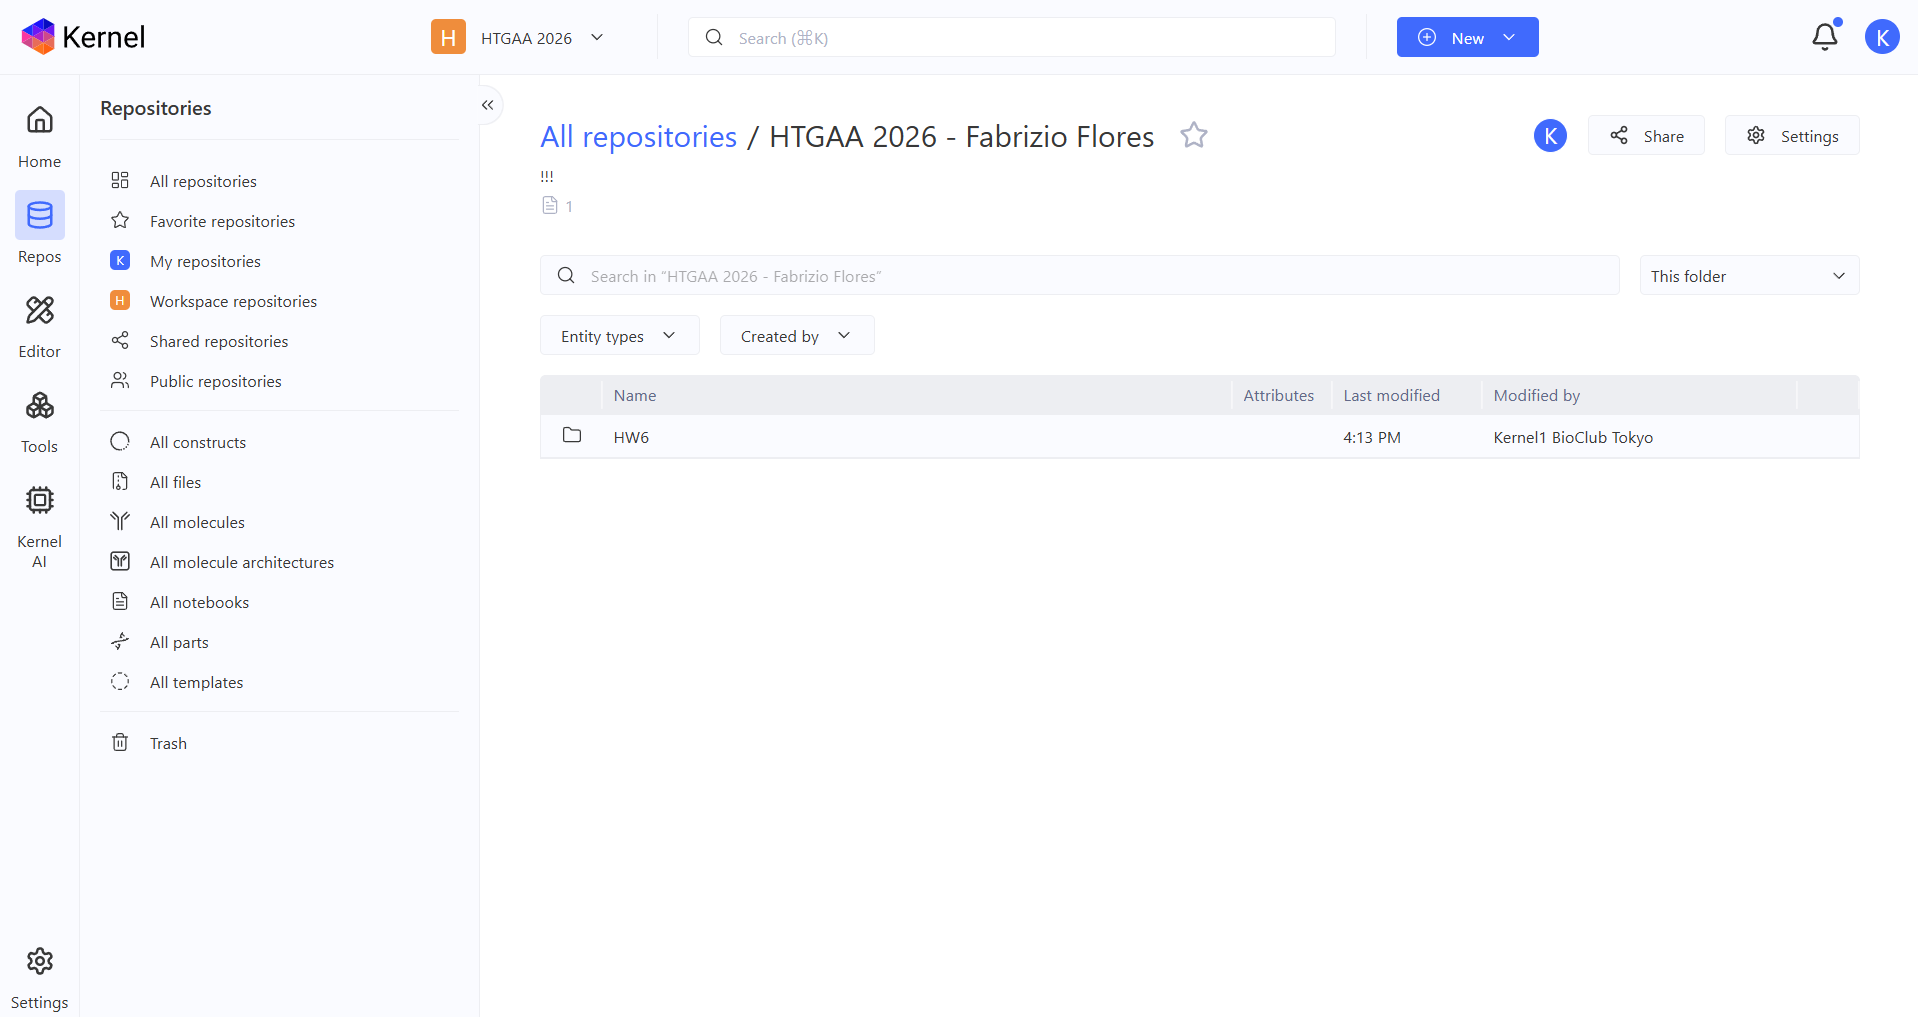
I created my repository under the name HTGAA 2026 - Fabrizio Flores in Asimov Kernel!
- Create a blank Notebook entry to document the homework and save it to that Repository
I created a blank notebook entry!
- Explore the devices in the Bacterial Demos Repo to understand how the parts work together by running the Simulator on various examples, following the instructions for the simulator found in the “Info” panel (click the “i” icon on the right to open the Info panel)
Bacterial Demos repo Exploration
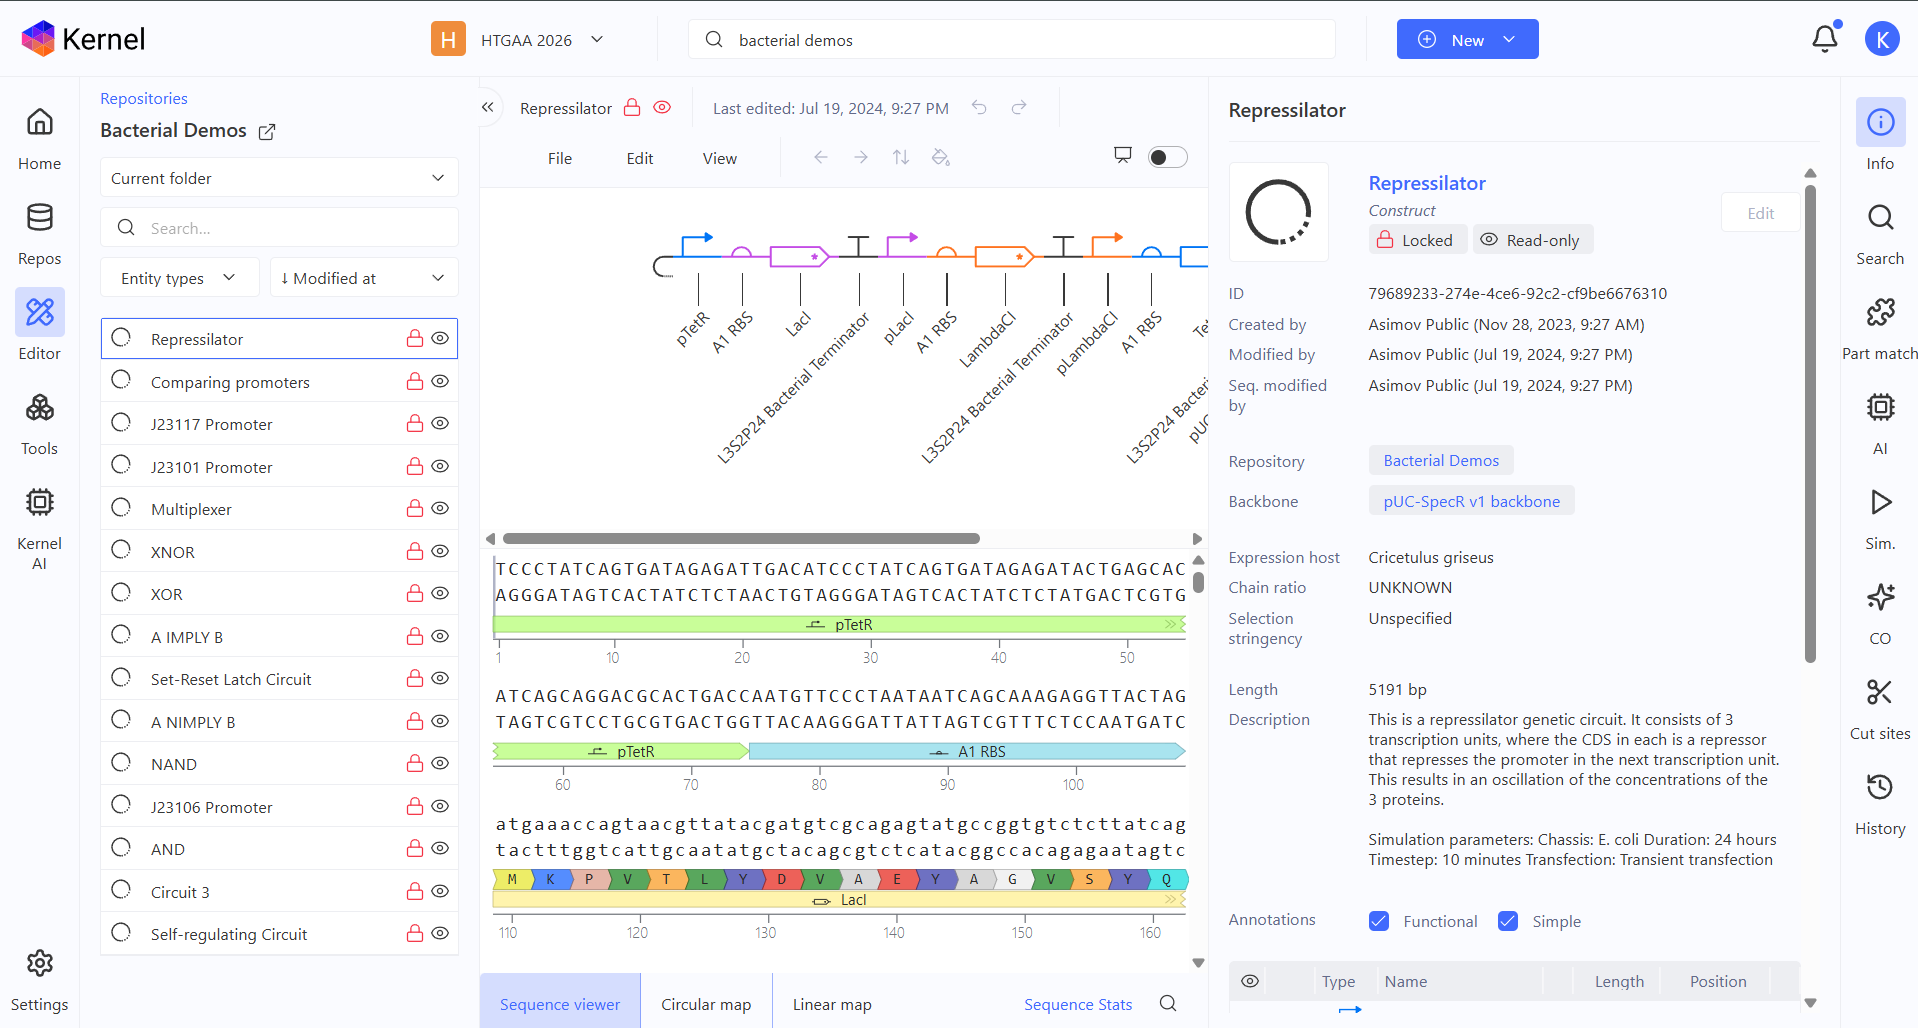
After finding the Bacterial Demos Repo on Asimov Kernel, I started looking at all the constructs, starting with the Repressilator one! There are 3 promoters with different properties, biological logic gates and more complex circuits like the self-regulating one or the Multiplexer.
Repressilator demo
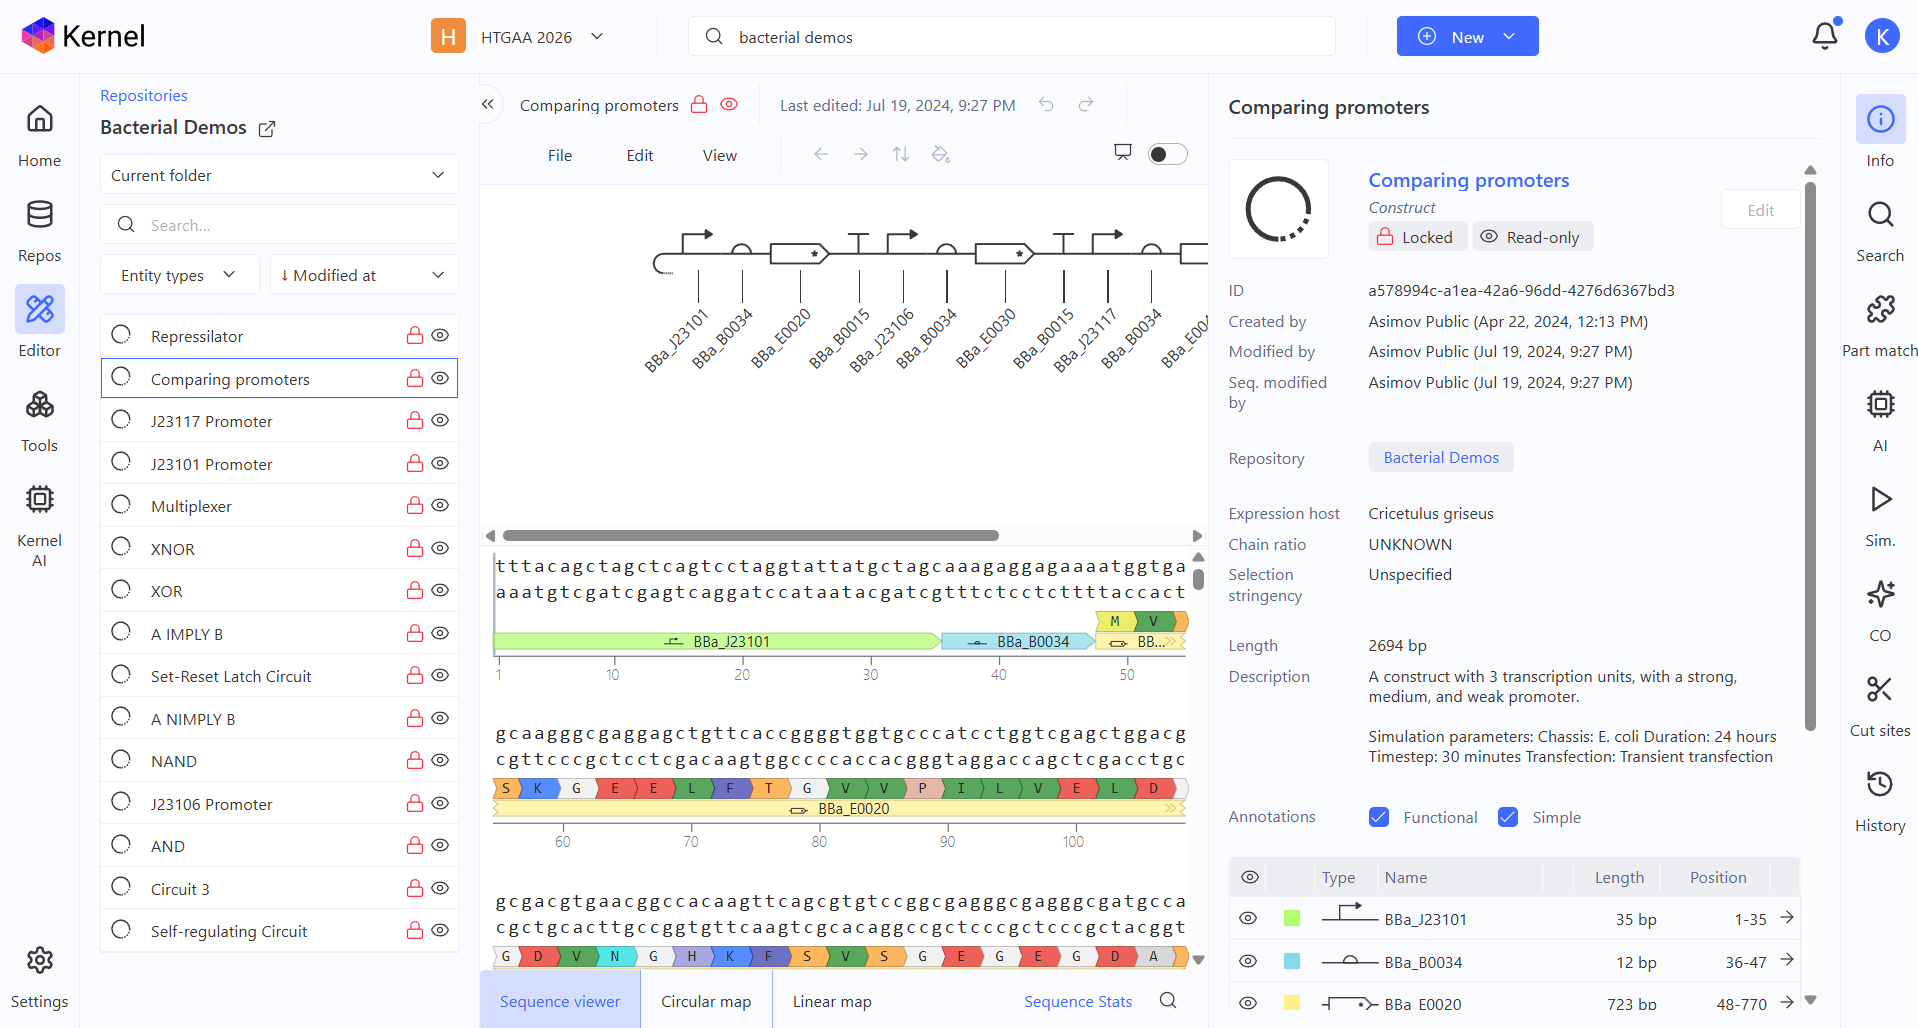
Comparing promoters demo
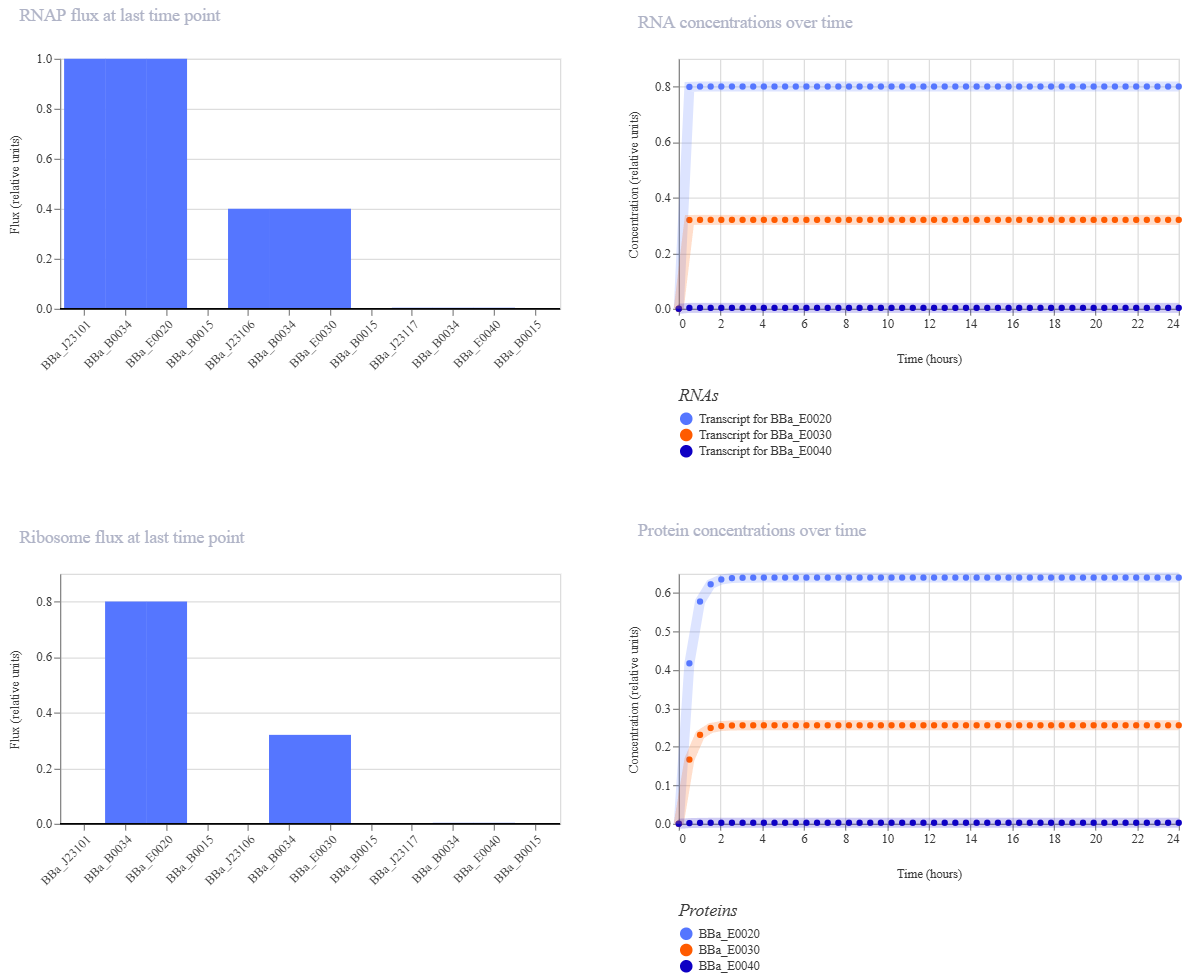
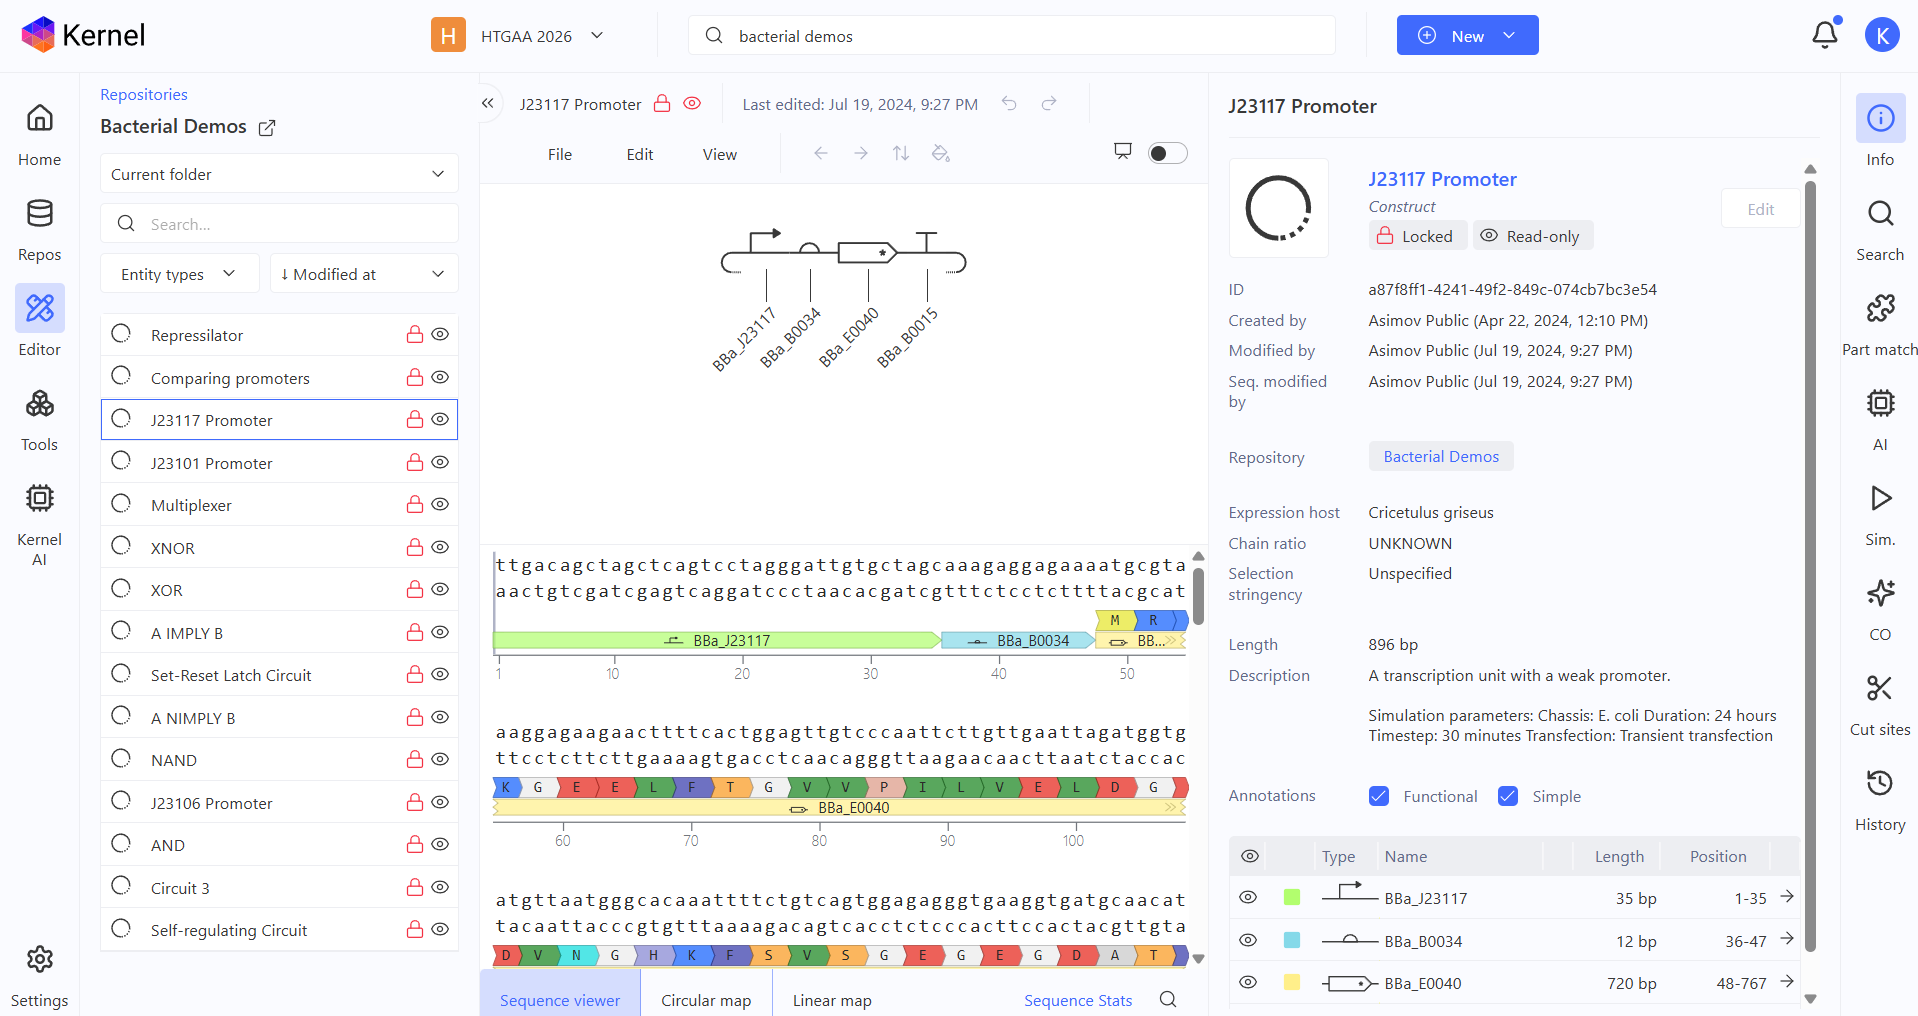
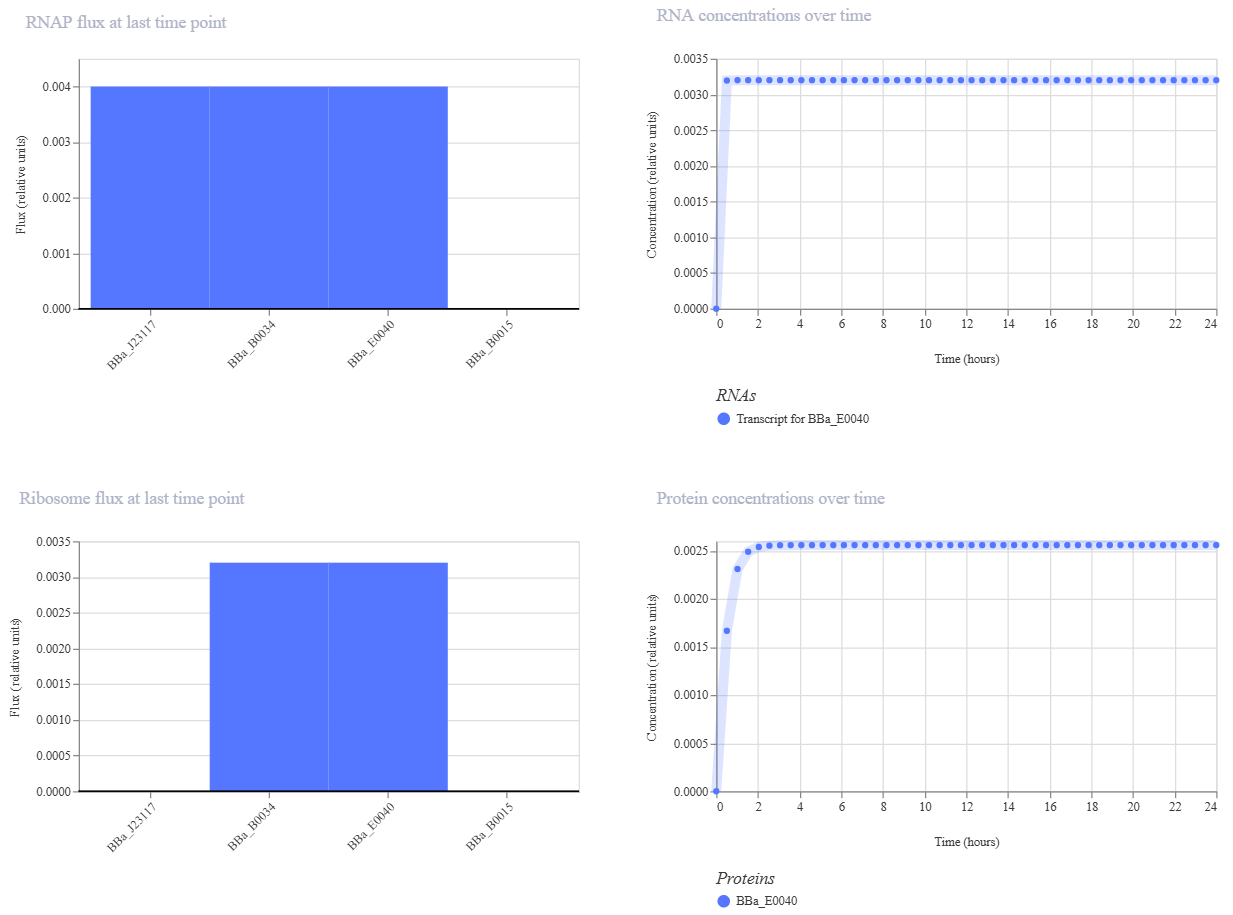
J23117 promoter demo
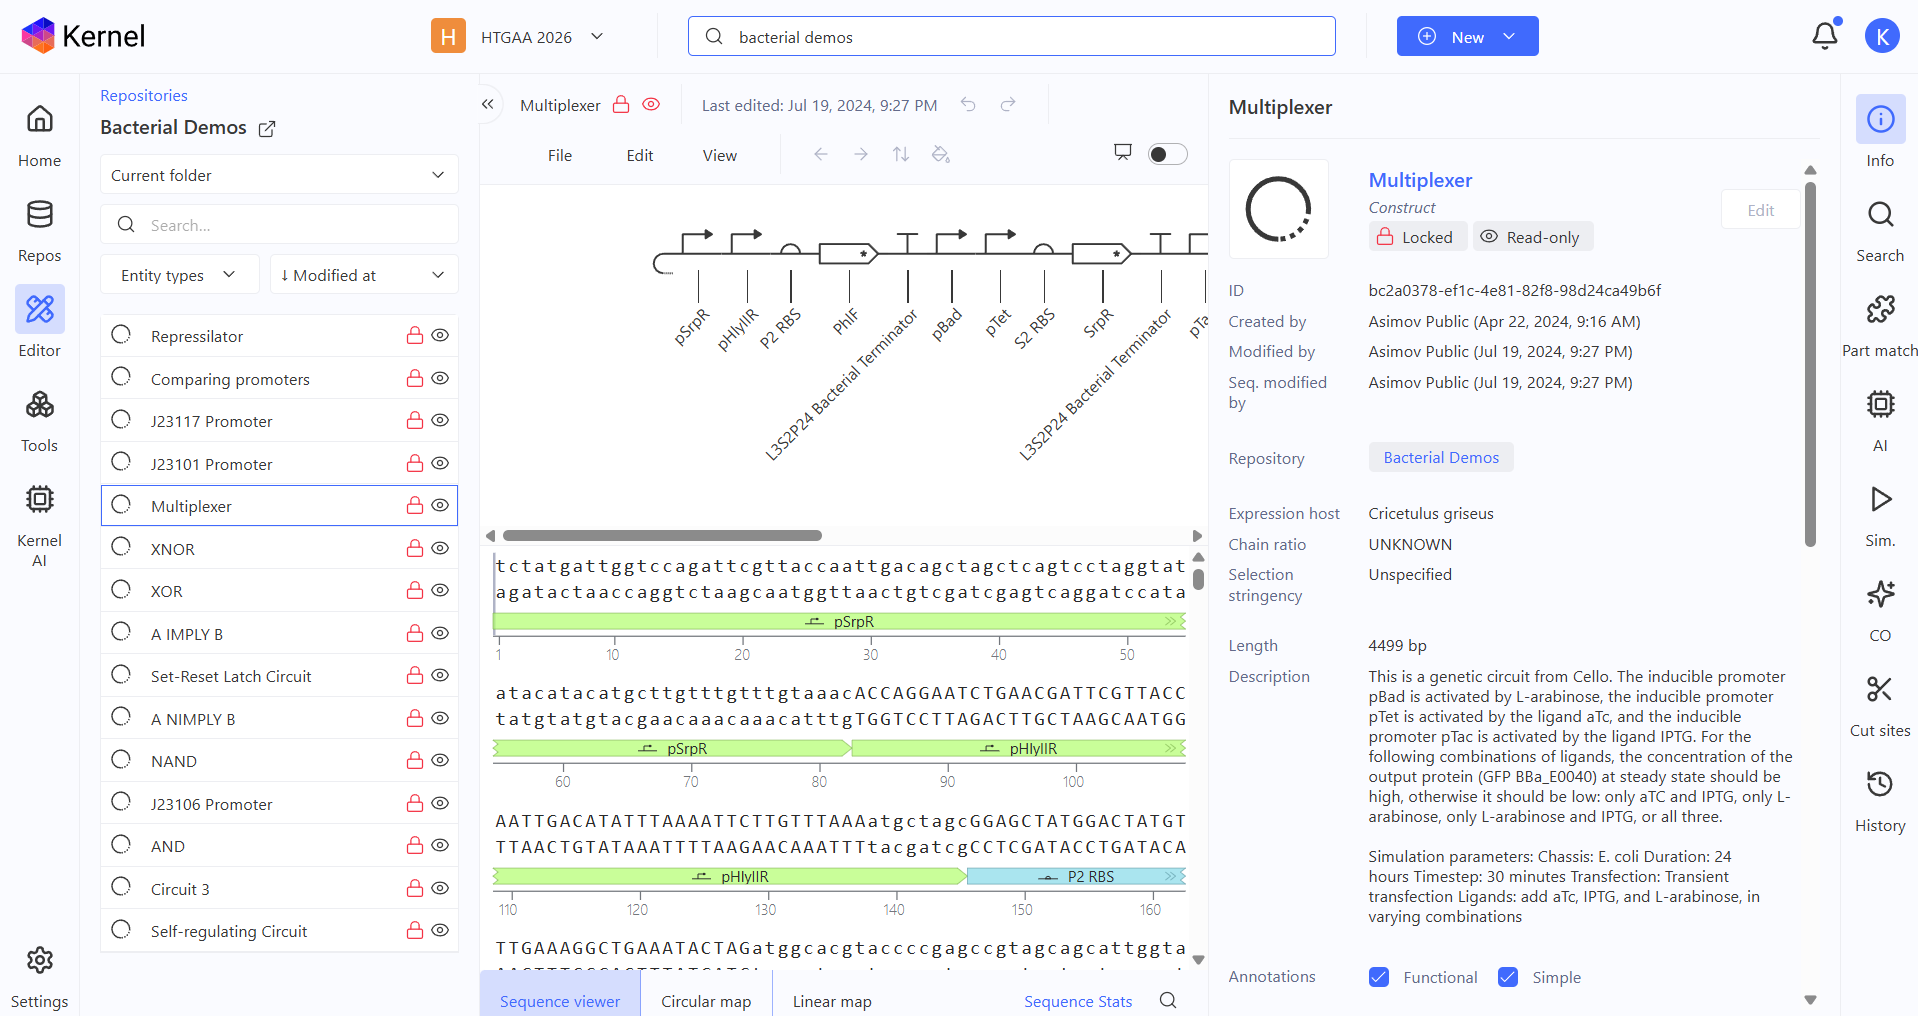
Multiplexer demo
- Create a blank Construct and save it to your Repository
- Recreate the Repressilator in that empty Construct by using parts from the Characterized Bacterial Parts repository
- Search the parts using the Search function in the right menu
- Drag and drop the parts into the Construct
- Confirm it works as expected by running the Simulator (“play” button) and compare your results with the Repressilator Construct found in the Bacterial Demos repository
- Document all of this work in your Notebook entry - you can copy the glyph image and the simulator graphs, and paste them into your Notebook
Repressilator recreation
So first, I created an empty Construct to start my Repressilator recreation!
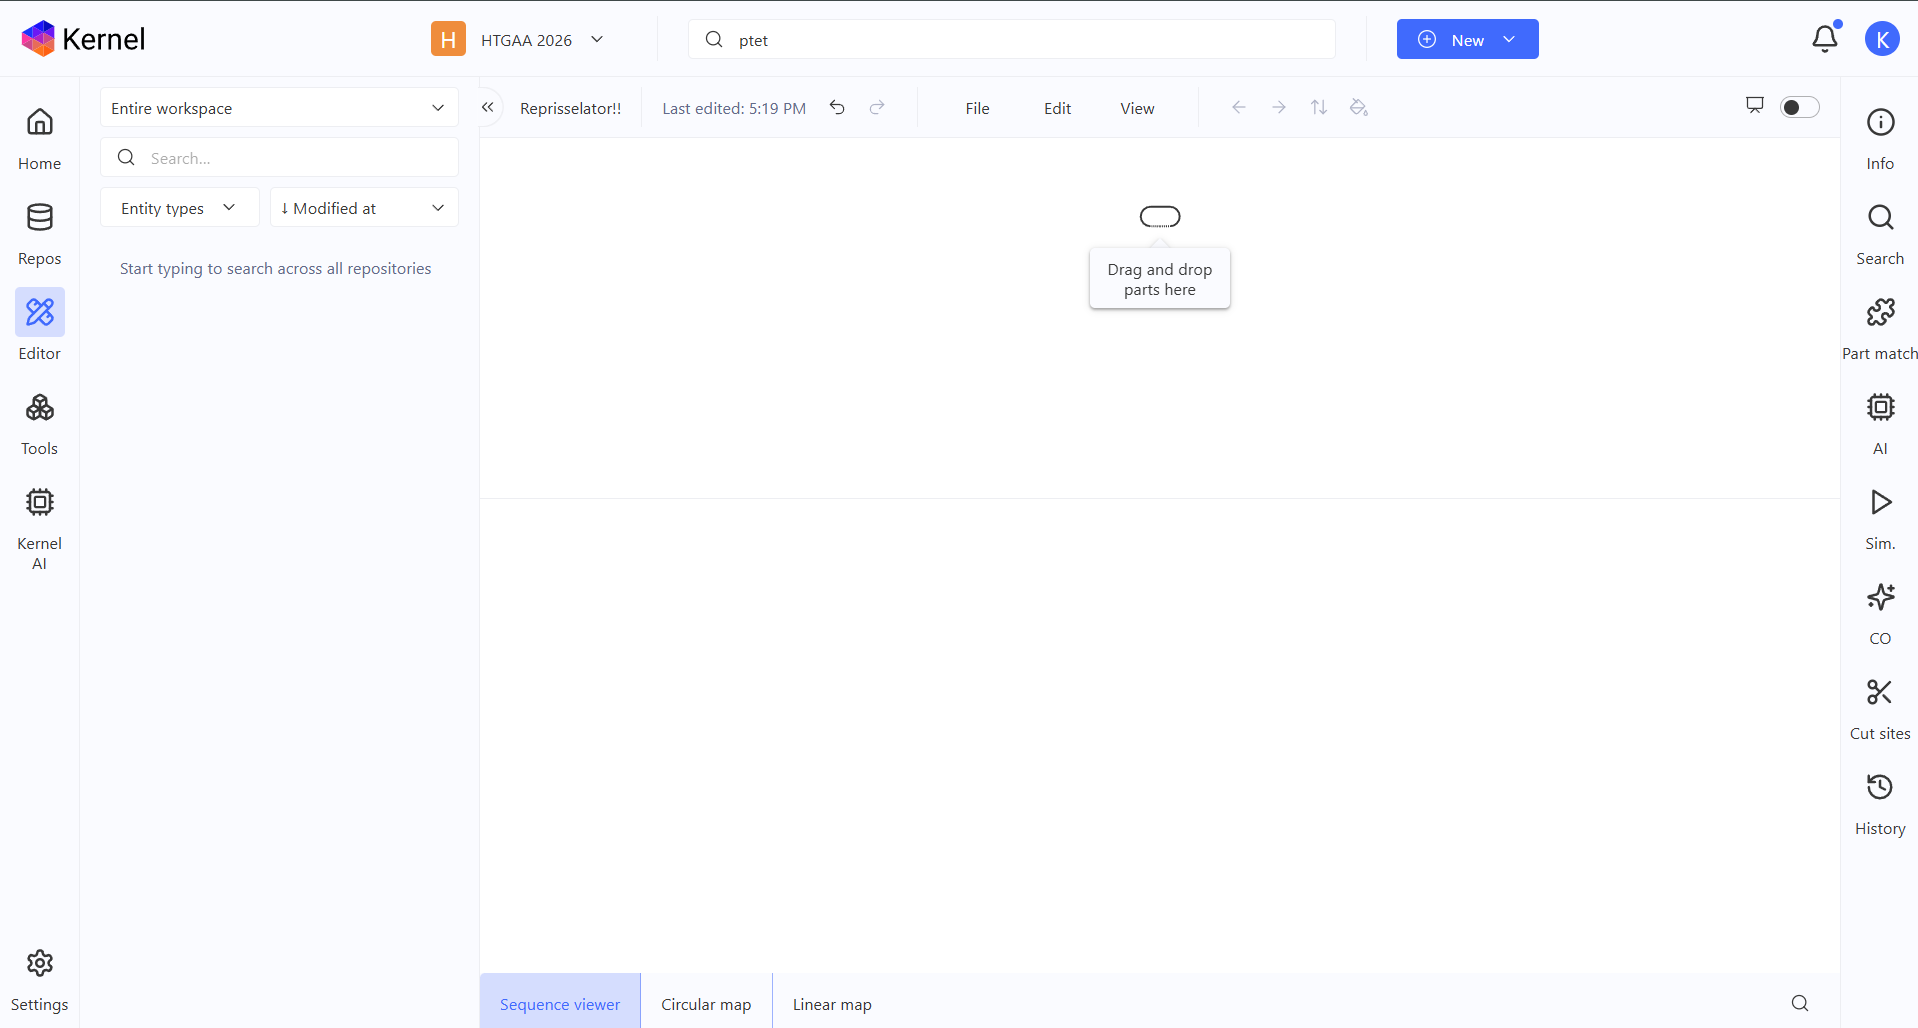
Then I searched the Repressilator parts one by one and started adding them up on my empty Construct.
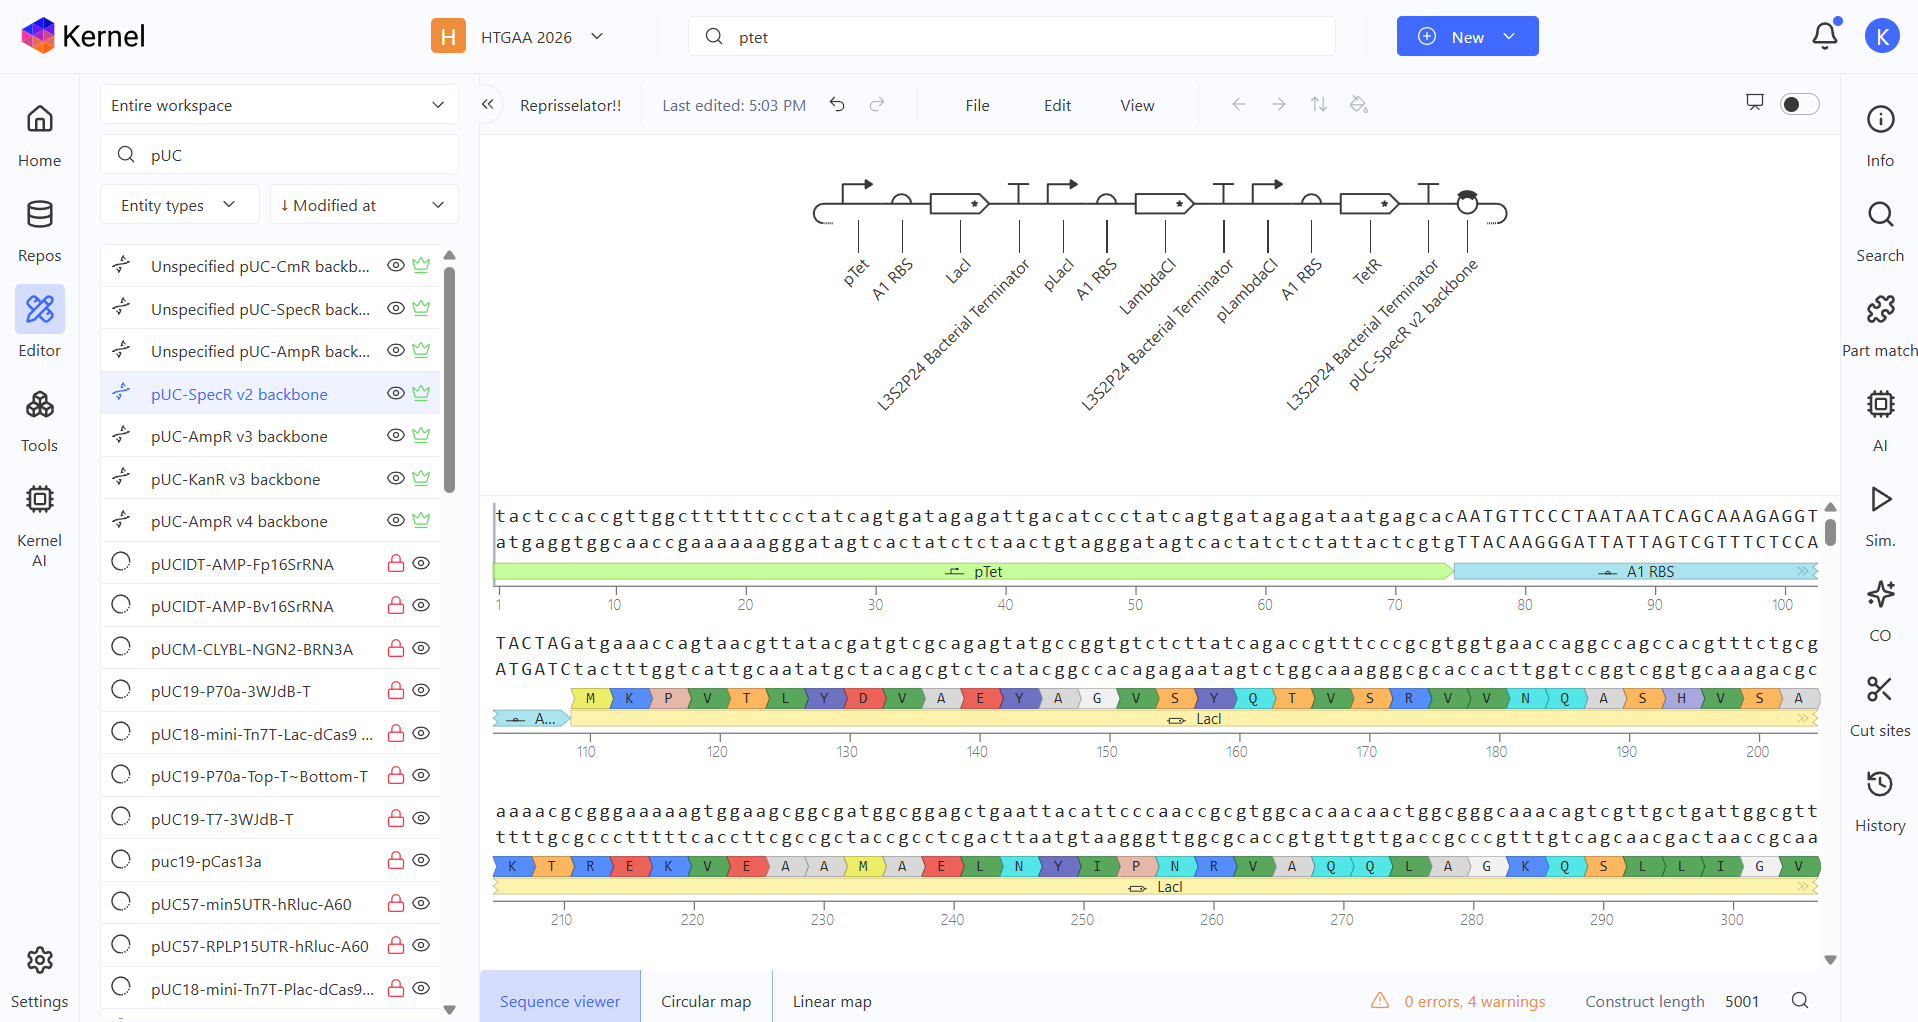
Here you can see the construct, the linear map and the circular map better!
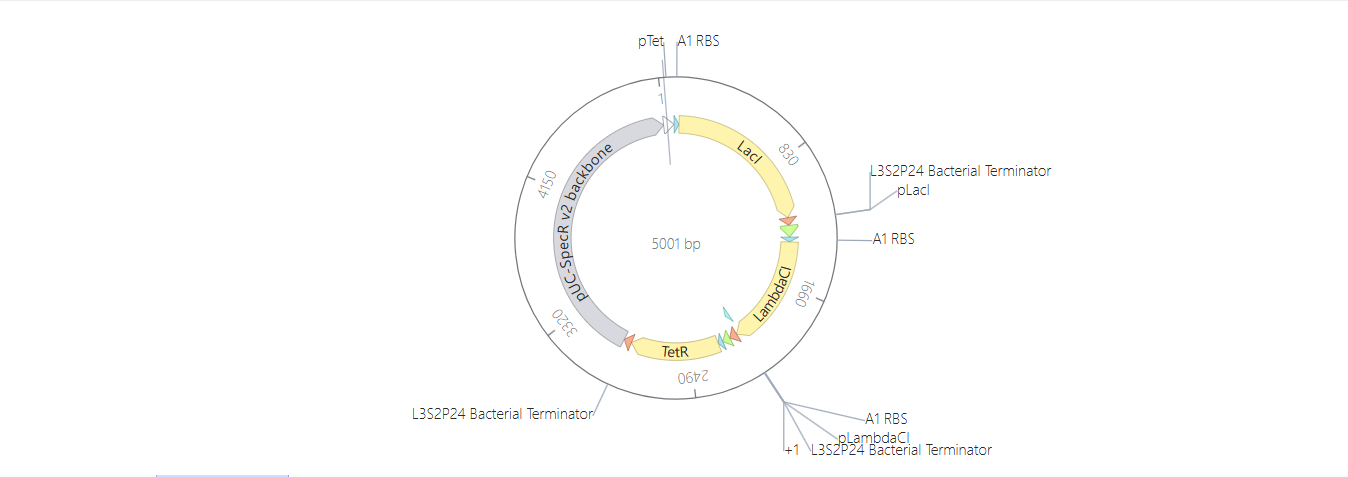
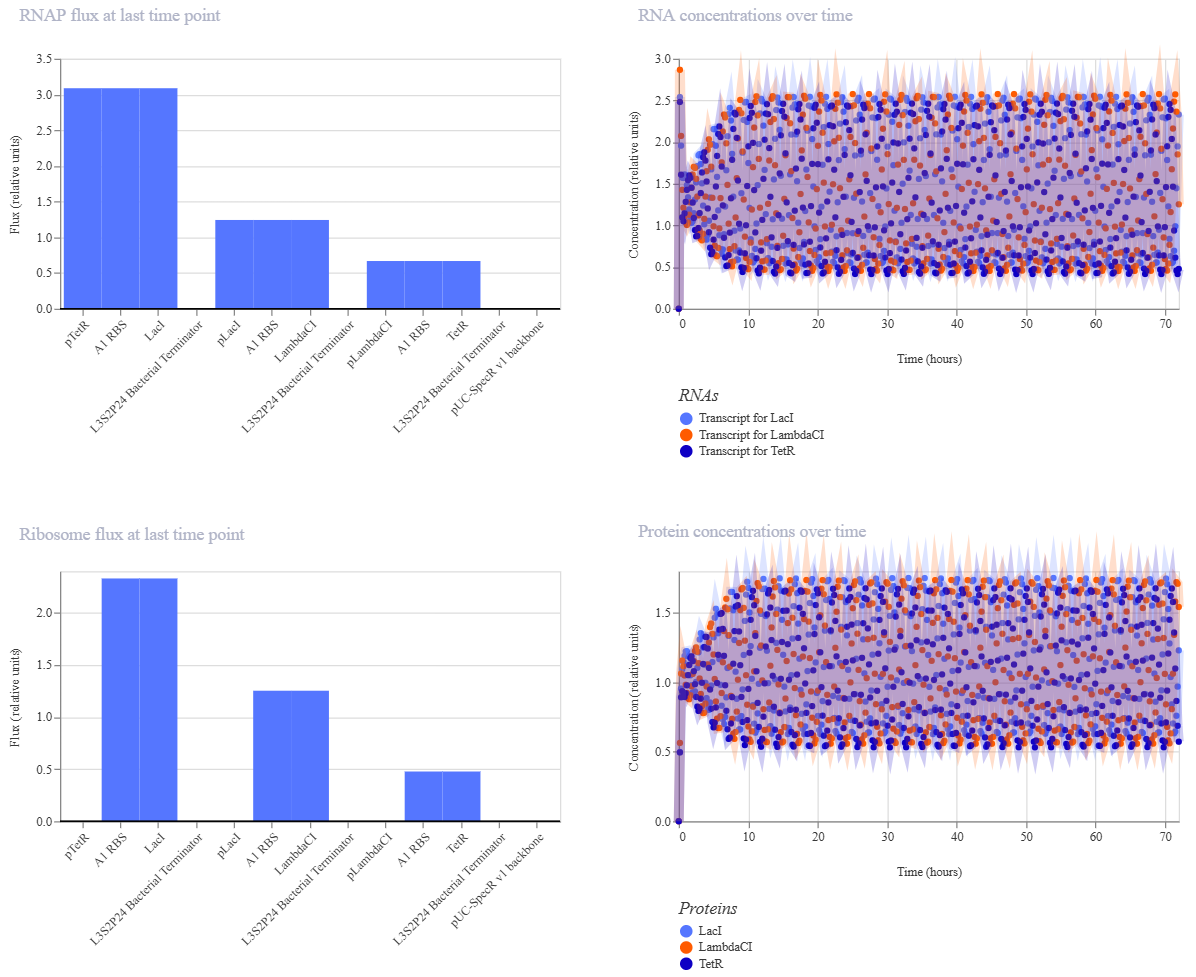
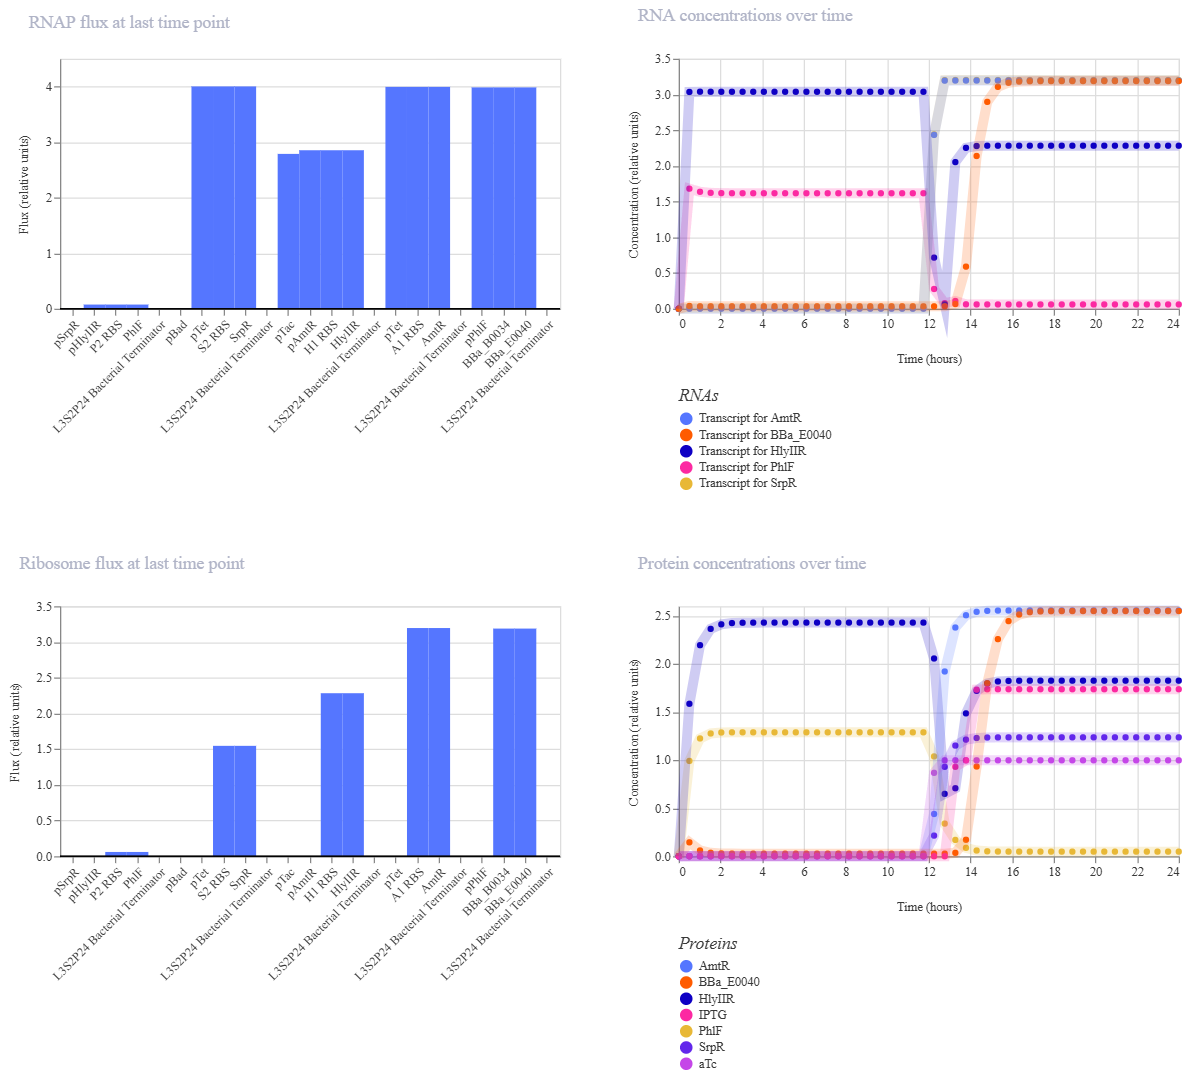
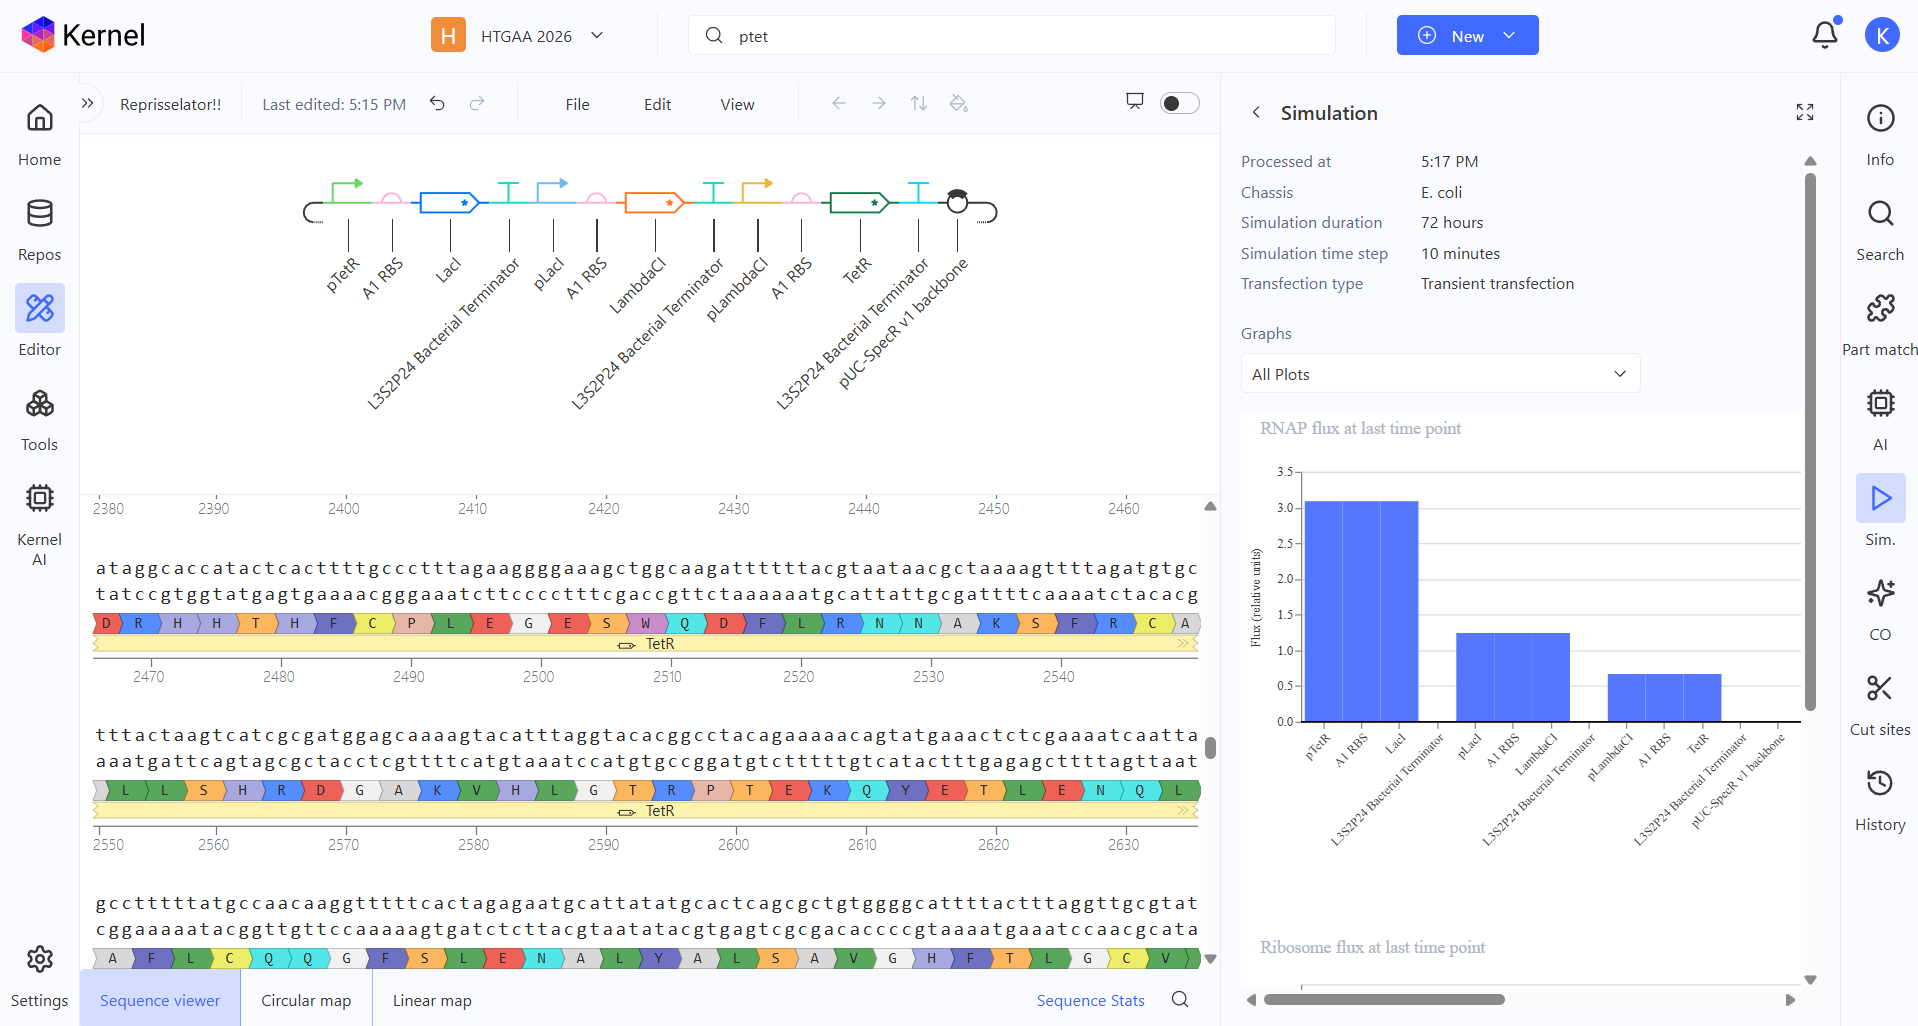
After the Represillator construction, I ran the simulation and got these results:
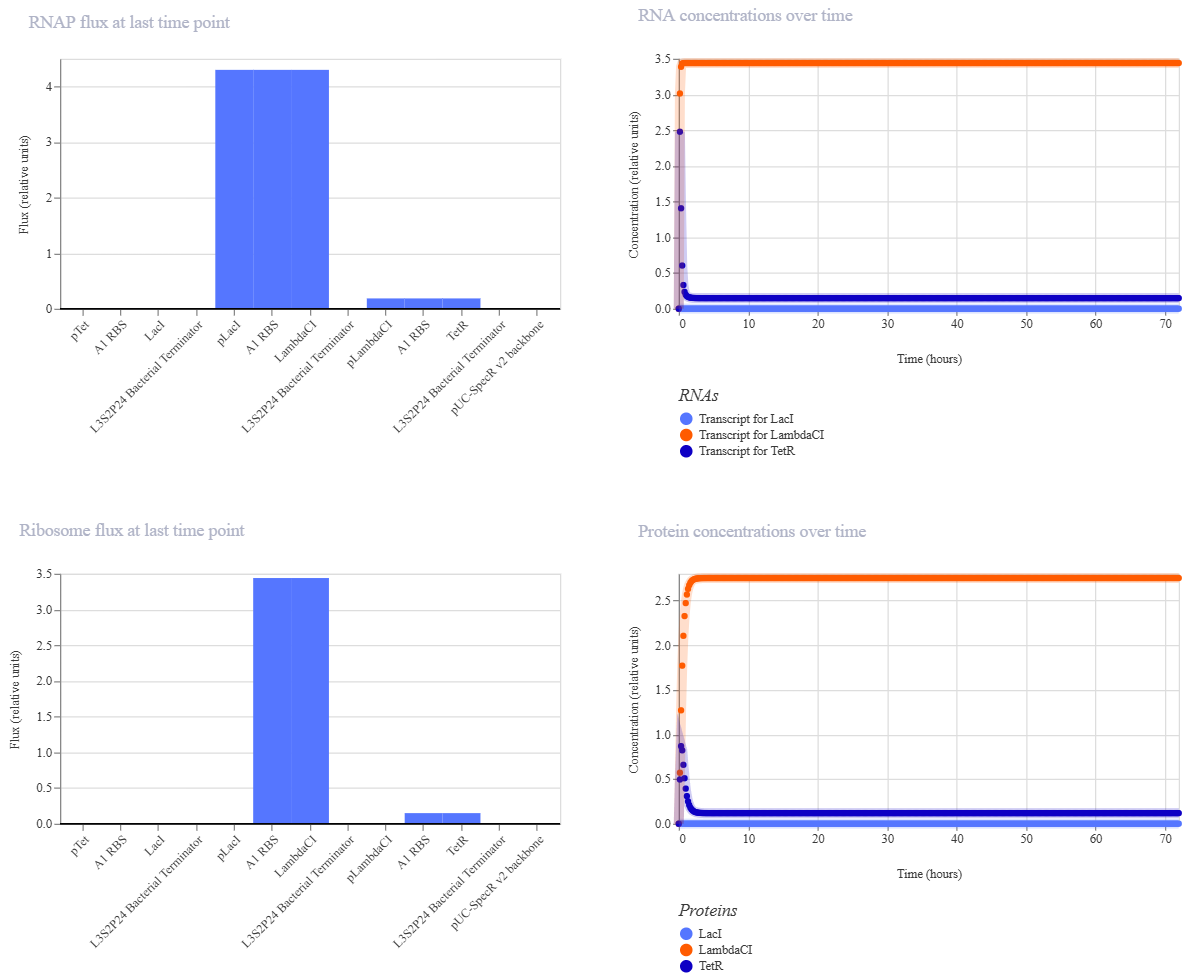
And here are the results from the Repressilator Construct found in the Bacterial Demos repository:
At first, my results seemed not to match the ones I got from the Represillator from the Bacterial Demos repository since my RNA and protein concentrations over time weren’t oscillating. That made me think that maybe I had made a mistake in my reconstruction, so I started to compare the constructs and realized that I had used pTet instead of pTetR at the start (my bad haha.)
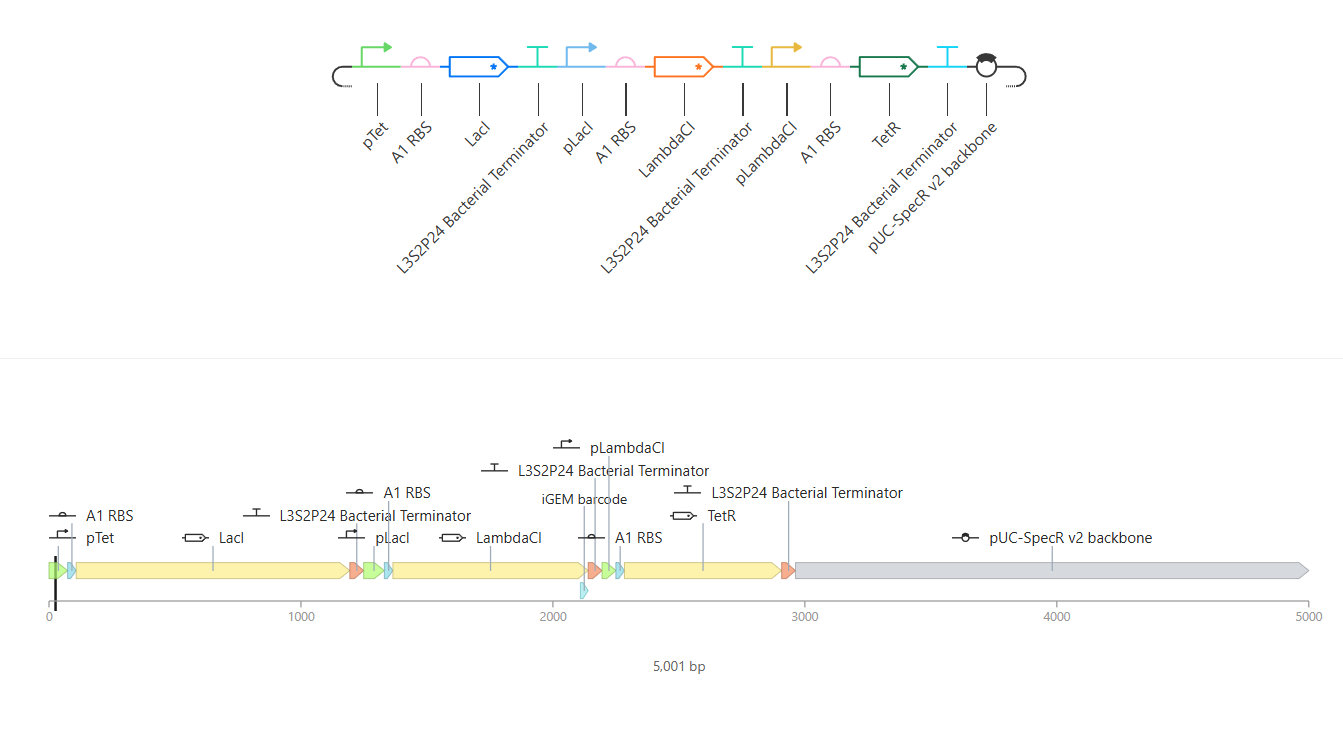
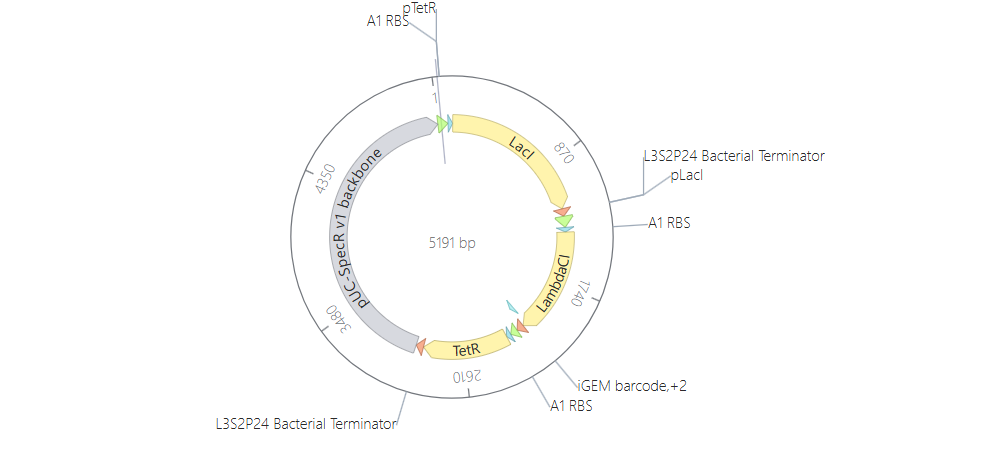
So I changed that promoter and now the construct looks like this:
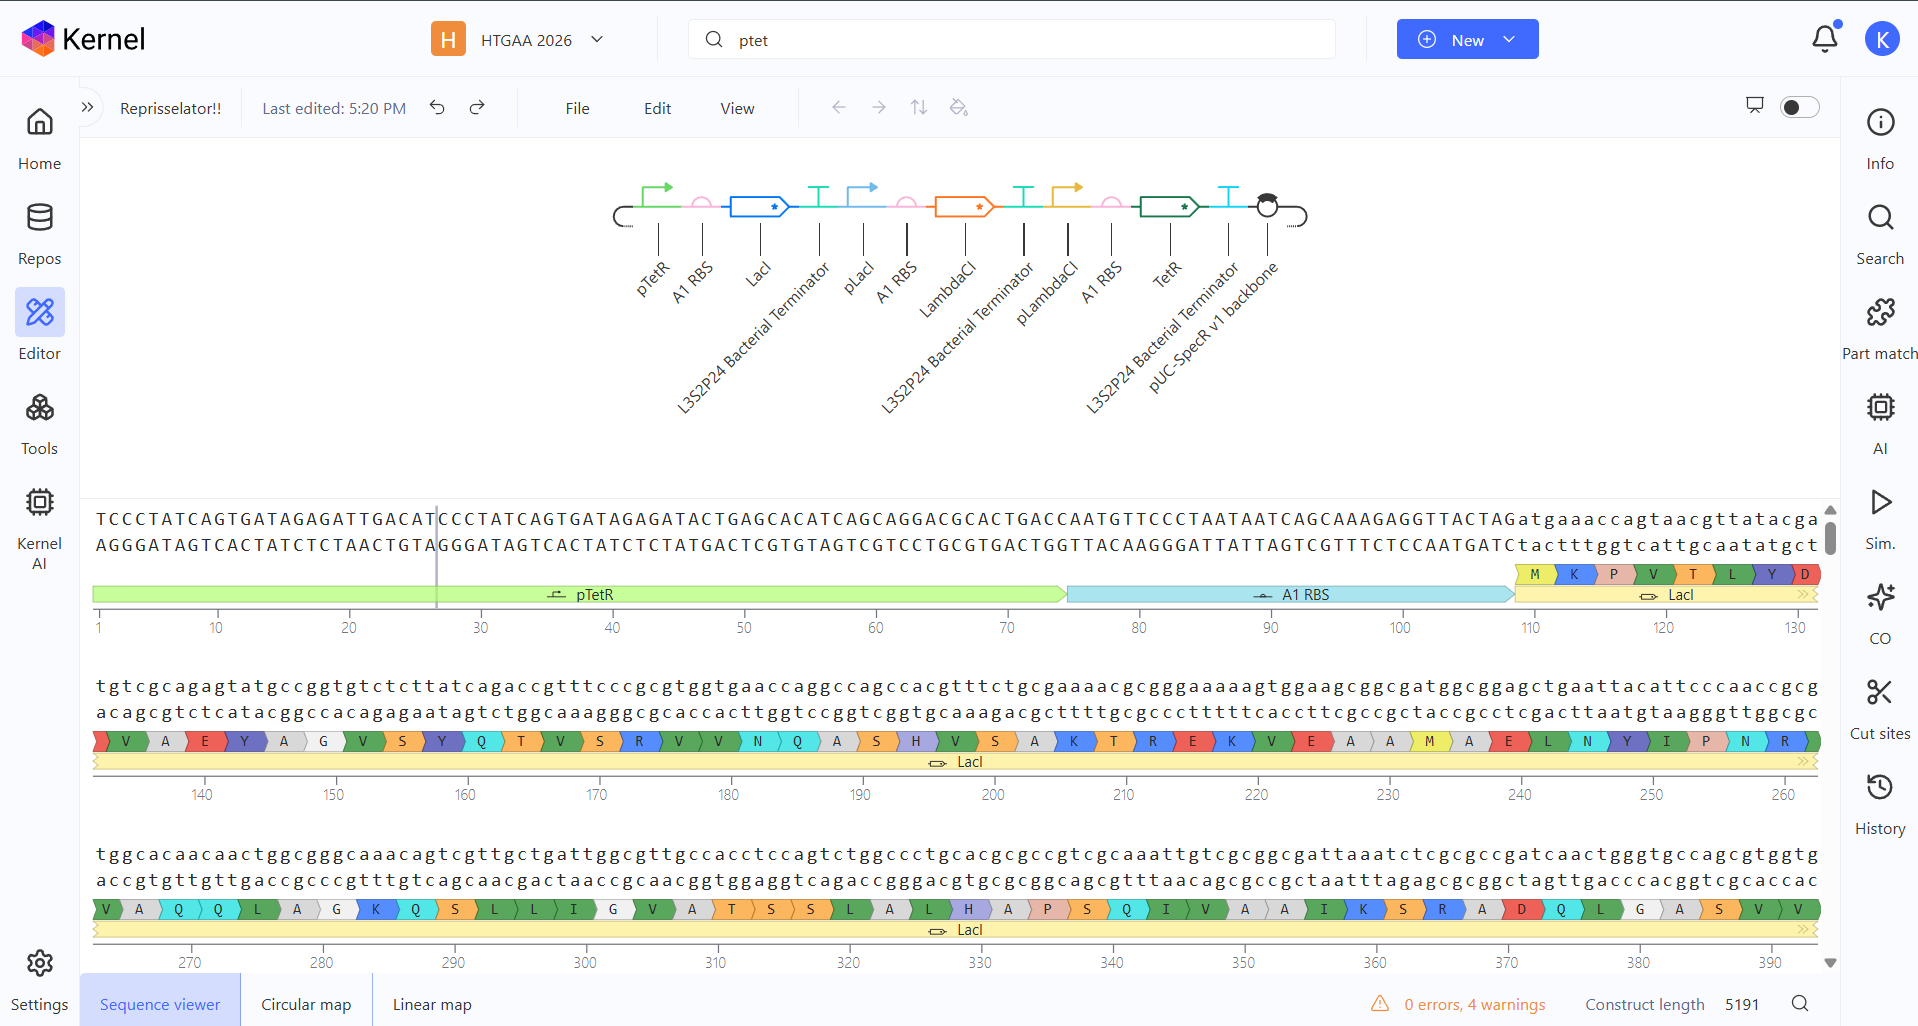
And here you can see the construct more detailed in its circular map and linear map forms:

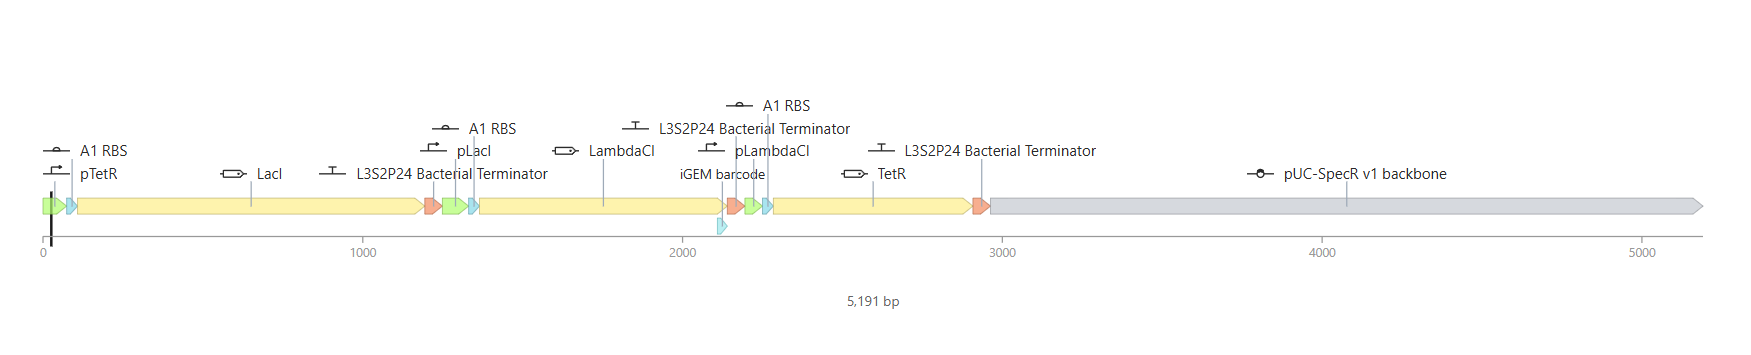
And after running the simulation again, my results finally matched the one from the Bacterial Demo repo:

All of the process is documented in my Notebook entry on Asimov Kernel
- Build three of your own Constructs using the parts in the Characterized Bacterials Parts Repo
- Explain in the Notebook Entry how you think each of the Constructs should function
- Run the simulator and share your results in the Notebook Entry
- If the results don’t match your expectations, speculate on why and see if you can adjust the simulator settings to get the expected outcome
My Constructs
Construct 1
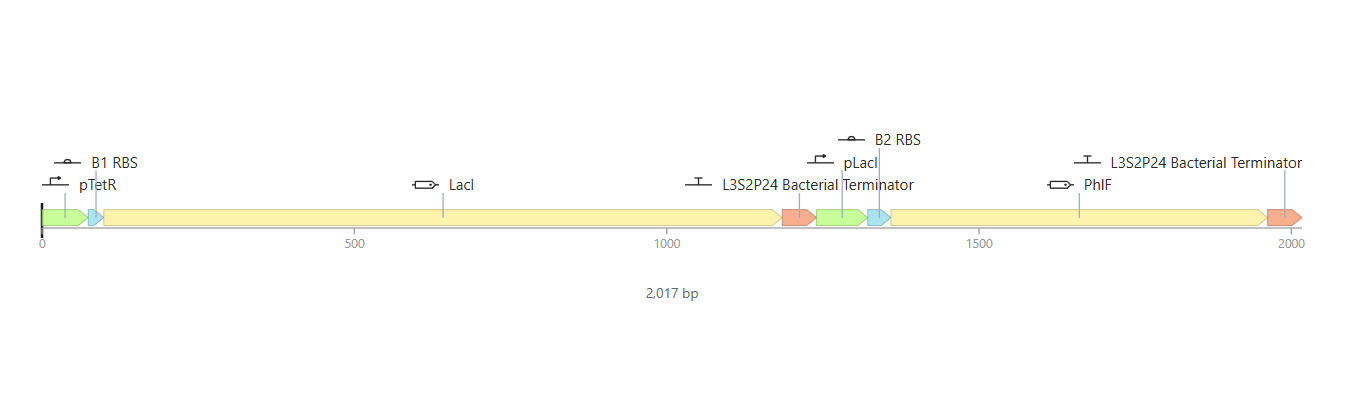
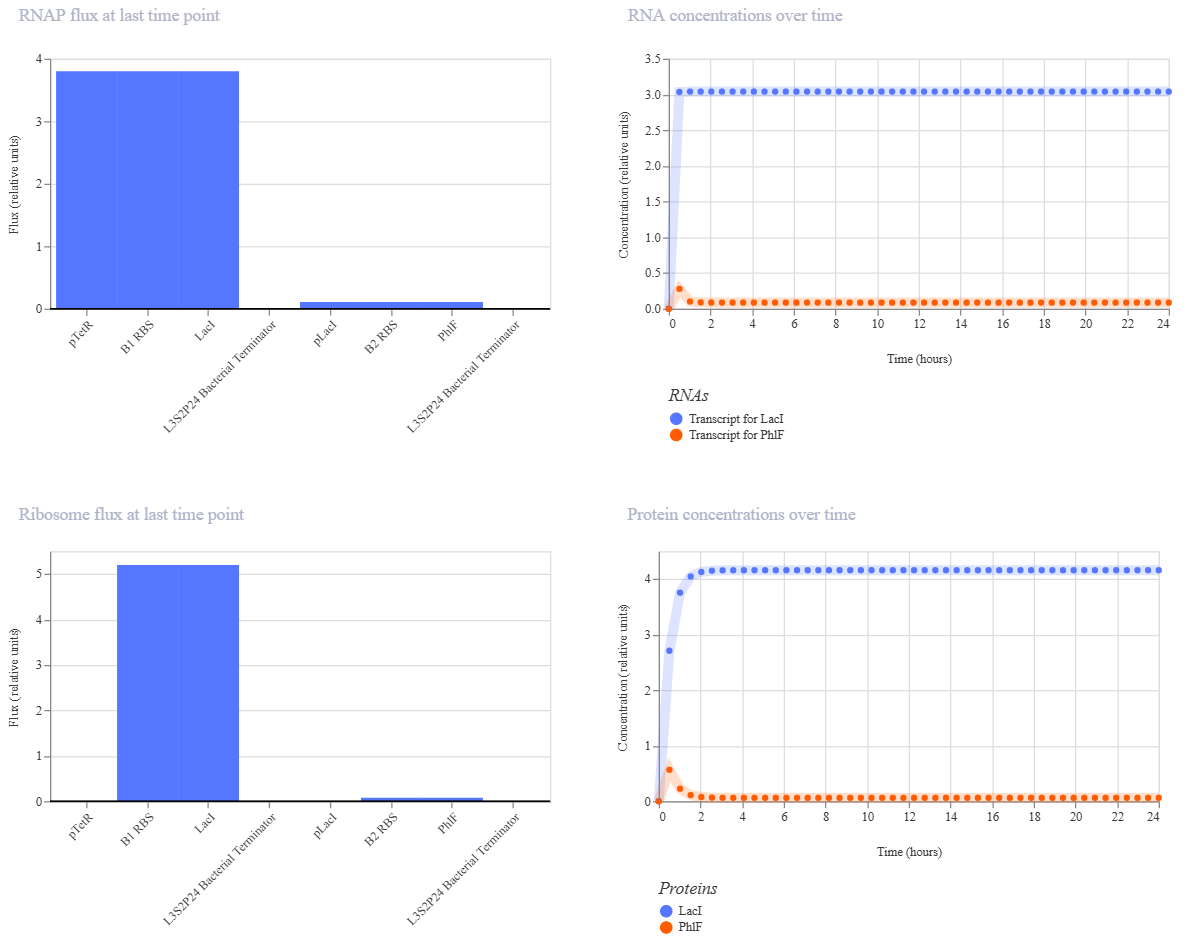
So for my first construct I tried making an inverter (NOT logic gate) where the first operon acts as a “sensor,” driving the expression of the LacI repressor under the pTetR promoter, while the second operon serves as the “output,” where the reporter gene is controlled by the LacI-sensitive promoter pLacI.
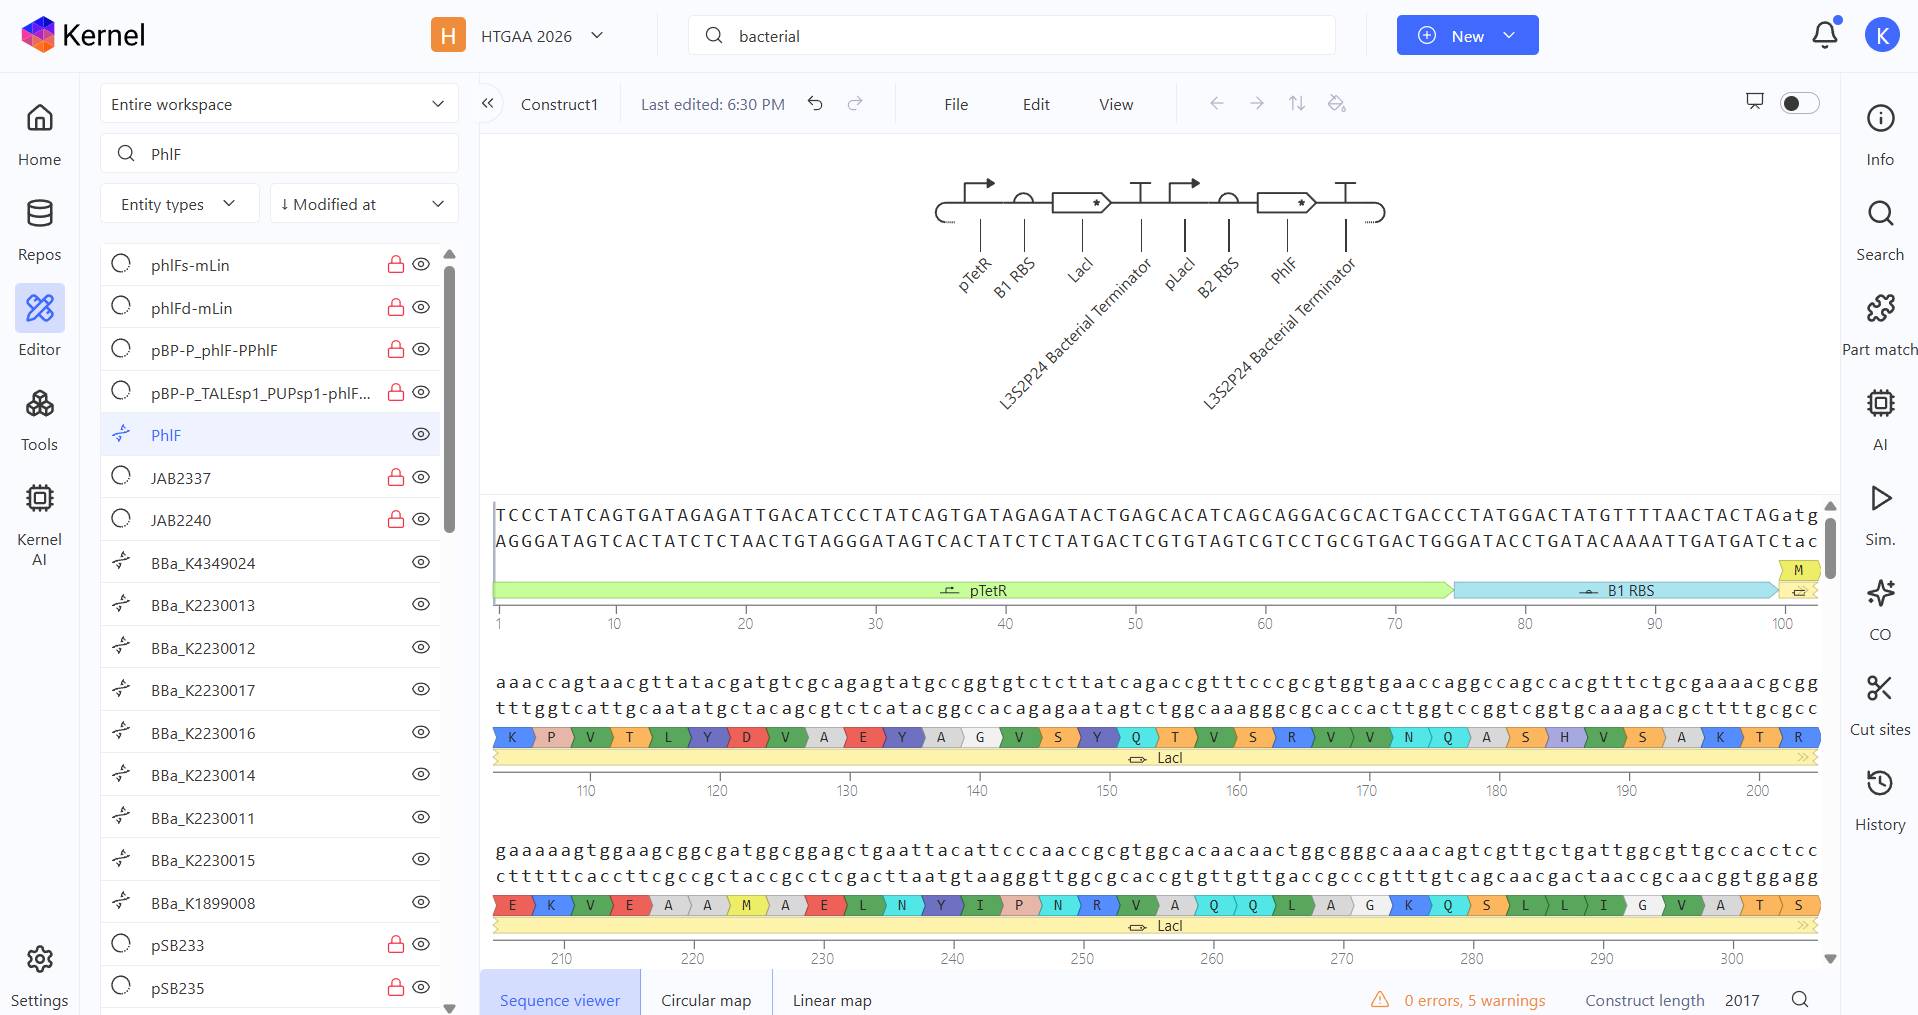

To test it, I ran two simulations using these parameters:
Simulation 1 parameters: Chassis: E. coli Duration: 24 hours Timestep: 30 minutes Transfection: Transient transfection
Simulation 2 parameters: Chassis: E. coli Duration: 24 hours Timestep: 30 minutes Transfection: Transient transfection Ligands: add aTc at time 12 Hours
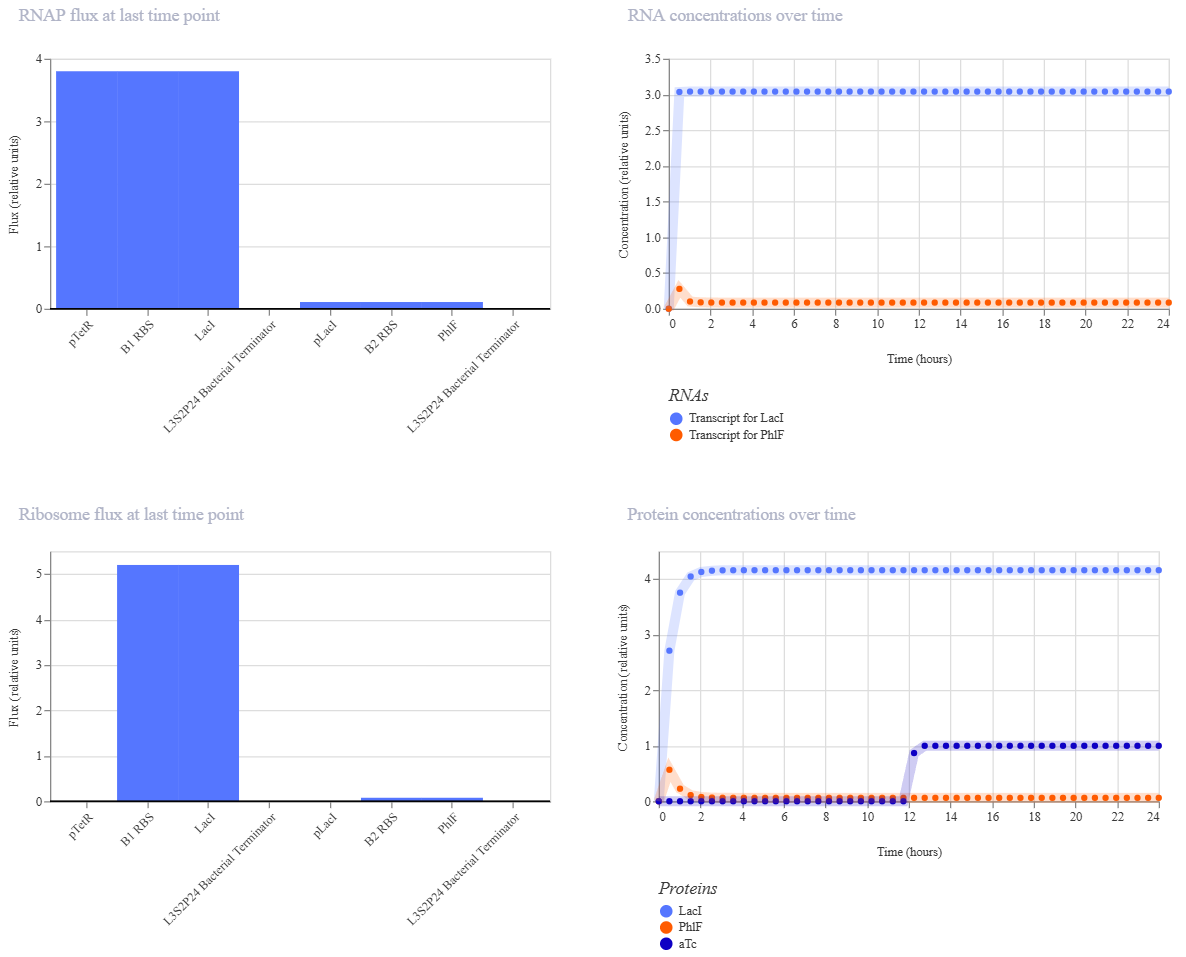
The inverter successfully maintained a “LOW” output state, but the induction failed to flip the switch. Even after adding aTc at the 12-hour mark, the reporter concentration didn’t show a significant increase.
The reason for this result is a missing link in the induction machinery. Here, PTetR behaves as a constitutive promoter unless the TetR protein is already present in the chassis. Since my construct doesn’t include a gene to produce TetR, the aTc ligand has no target to bind to. Consequently, pTetR remains at maximum power, keeping LacI levels high enough to permanently suppress the output.
To improve the circuit and achieve a successful induction, I would need to add a third constitutive operon expressing the TetR protein.
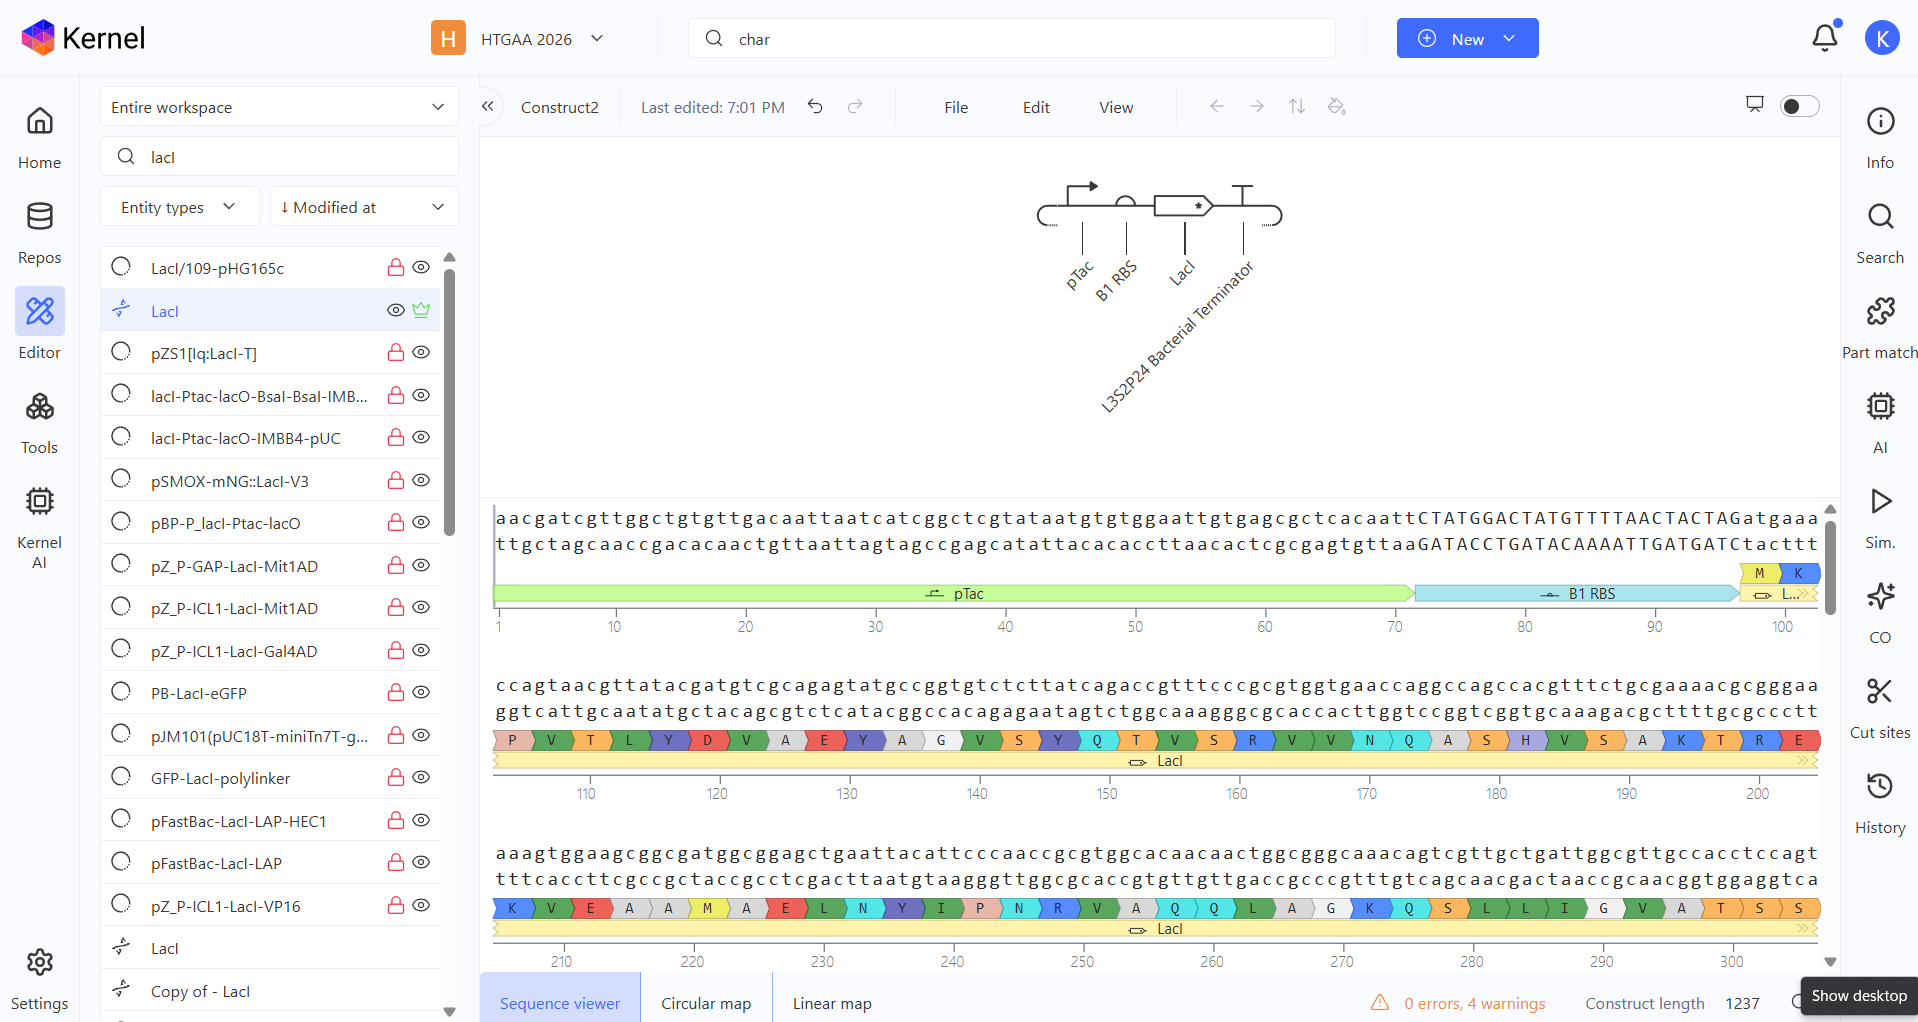
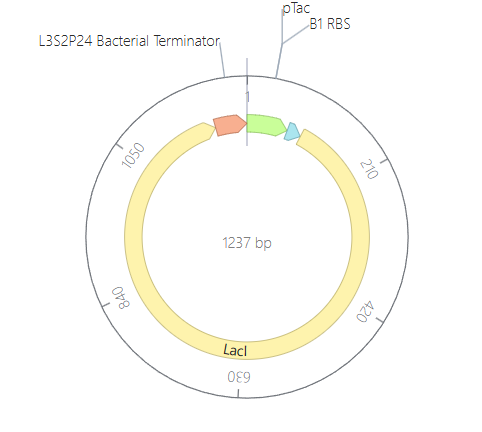
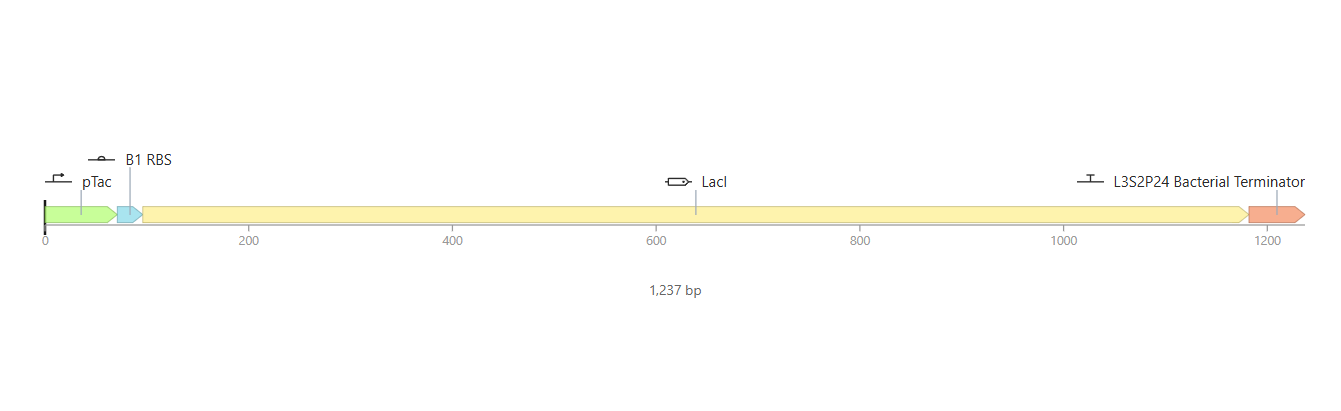
Construct 2
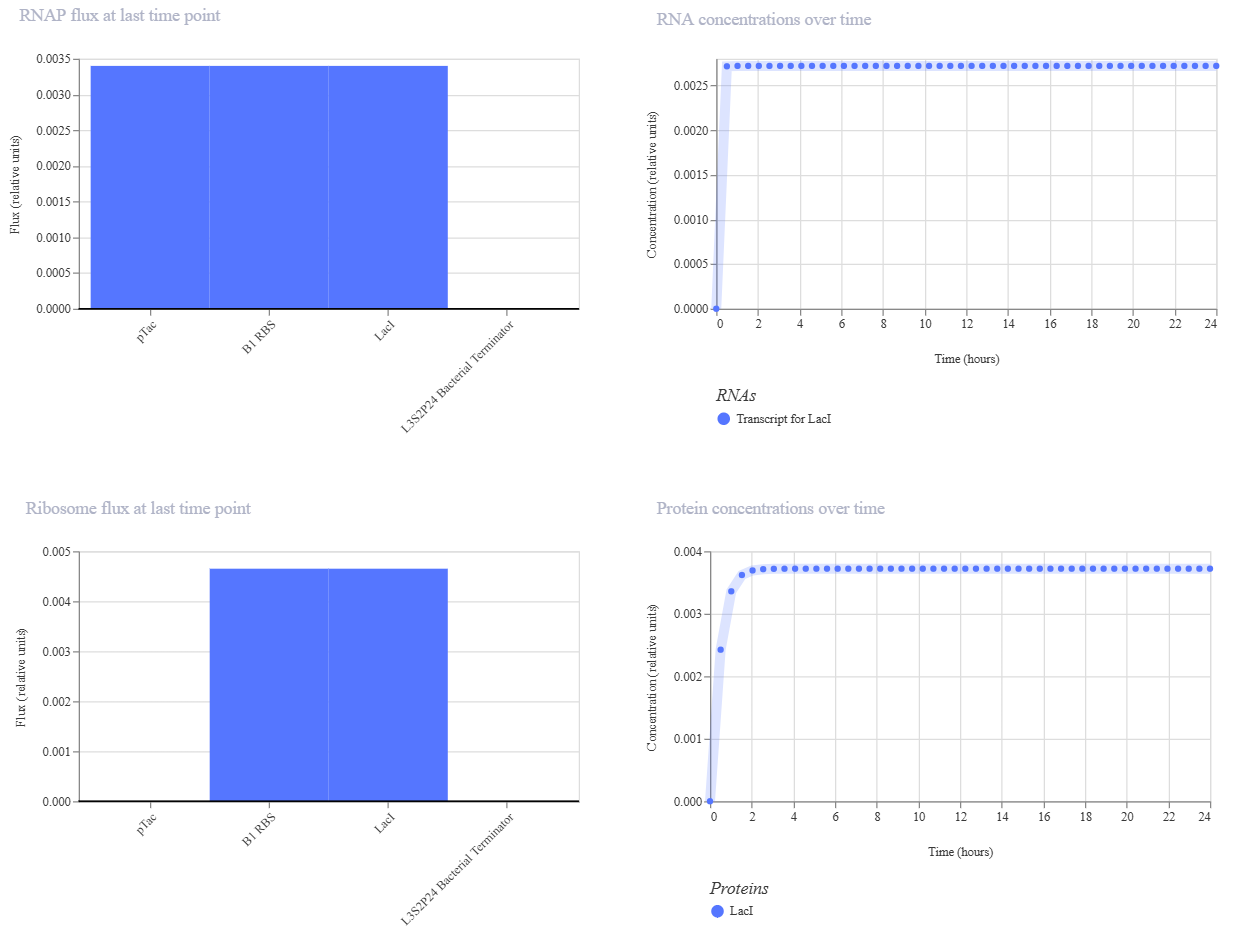
For my second construct, I wanted to demonstrate transcriptional homeostasis by building a negative feedback loop. In this design, I used the pTac promoter to drive the expression of its own repressor, LacI, followed by a strong terminator. Here are the construct and results:
To test it, I ran two simulations using these parameters:
Simulation 1 parameters: Chassis: E. coli Duration: 24 hours Timestep: 30 minutes Transfection: Transient transfection
Simulation 2 parameters: Chassis: E. coli Duration: 24 hours Timestep: 30 minutes Transfection: Transient transfection Ligands: add aTc at time 12 Hours

My expectation was to see a rapid initial burst of protein production that quickly plateaus into a very stable steady state, preventing the expression from overshooting. The simulation results matched this perfectly, showing a clean line after the first two hours, which confirms the circuit’s ability to maintain a consistent equilibrium state.
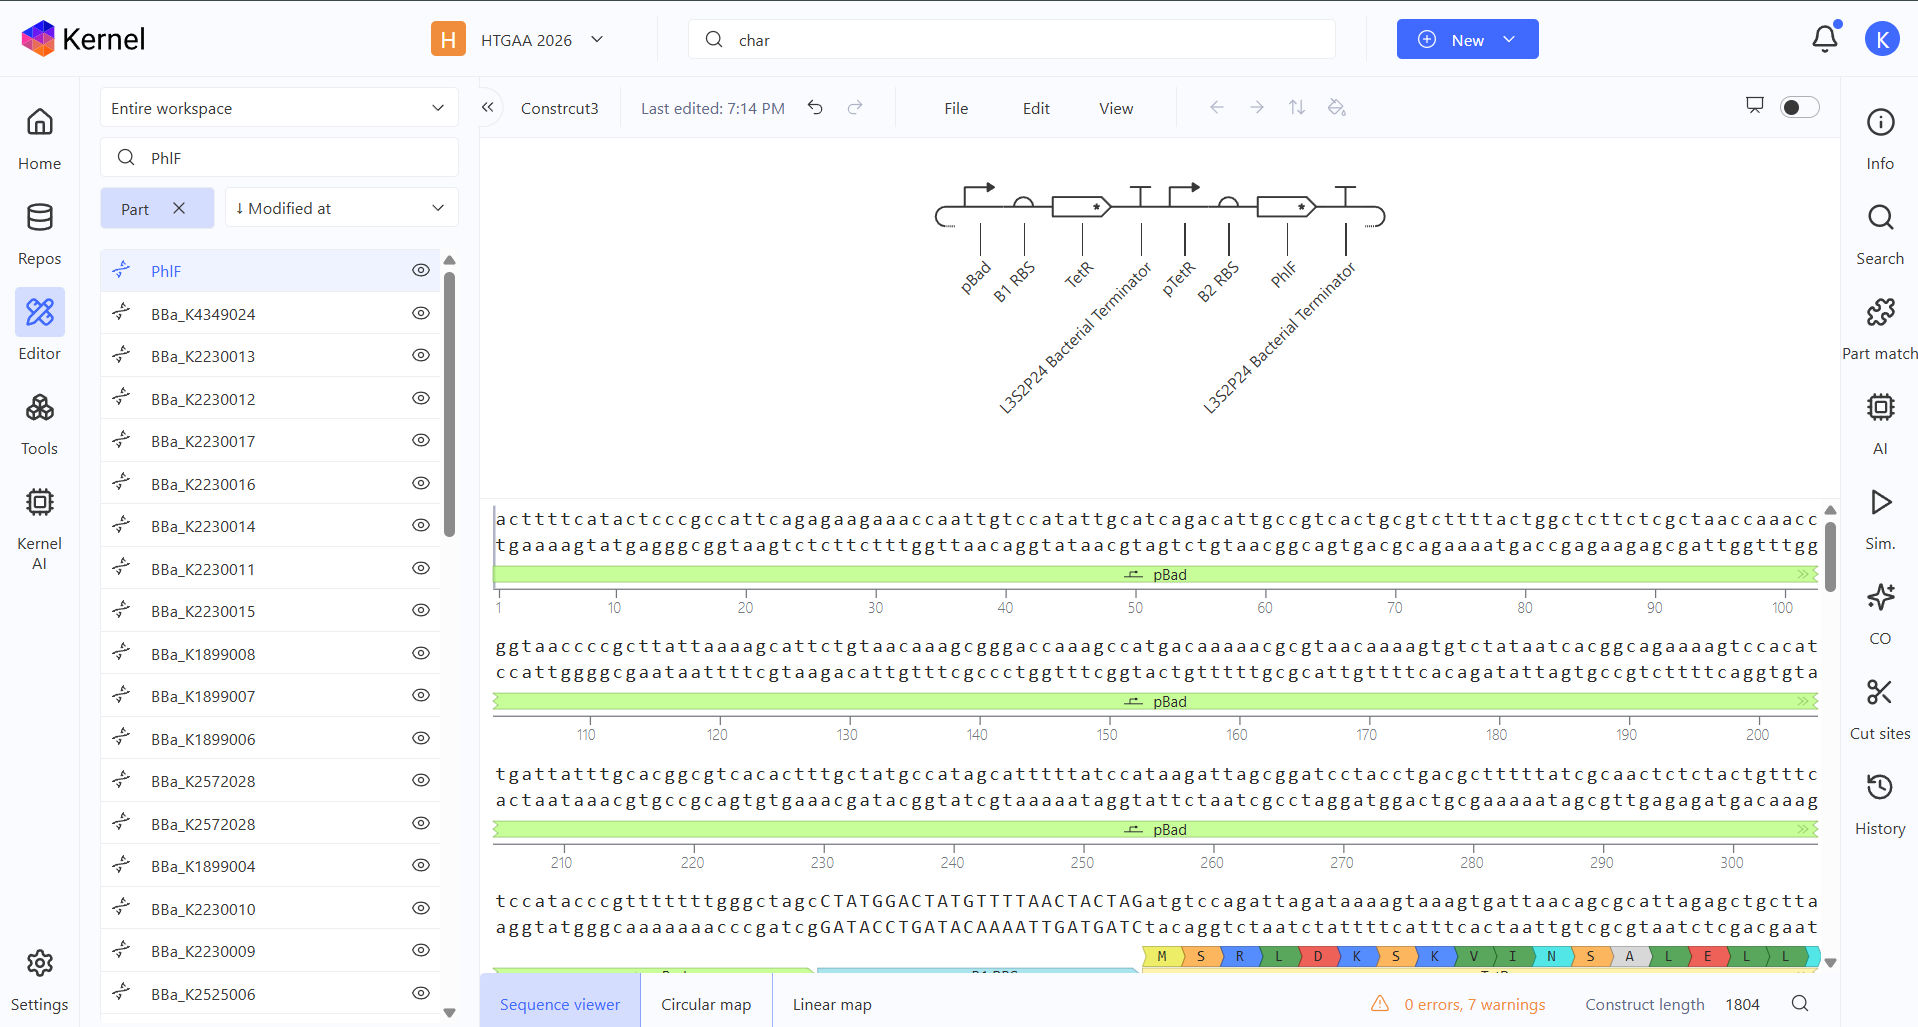
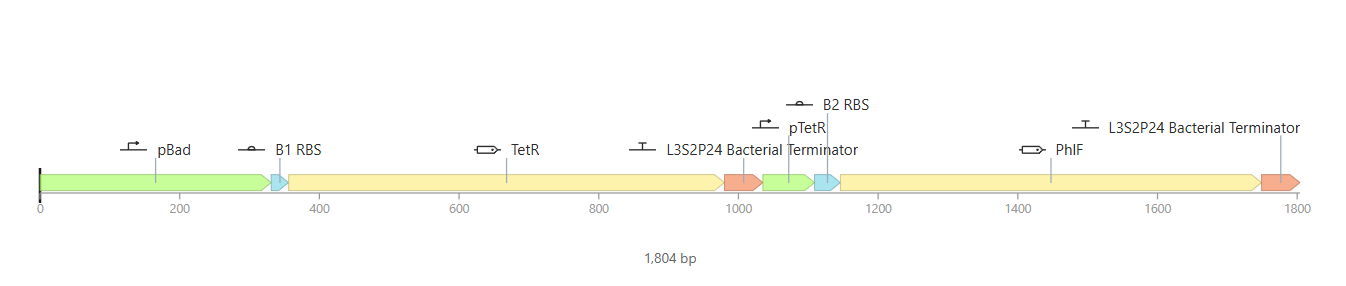
Construct 3
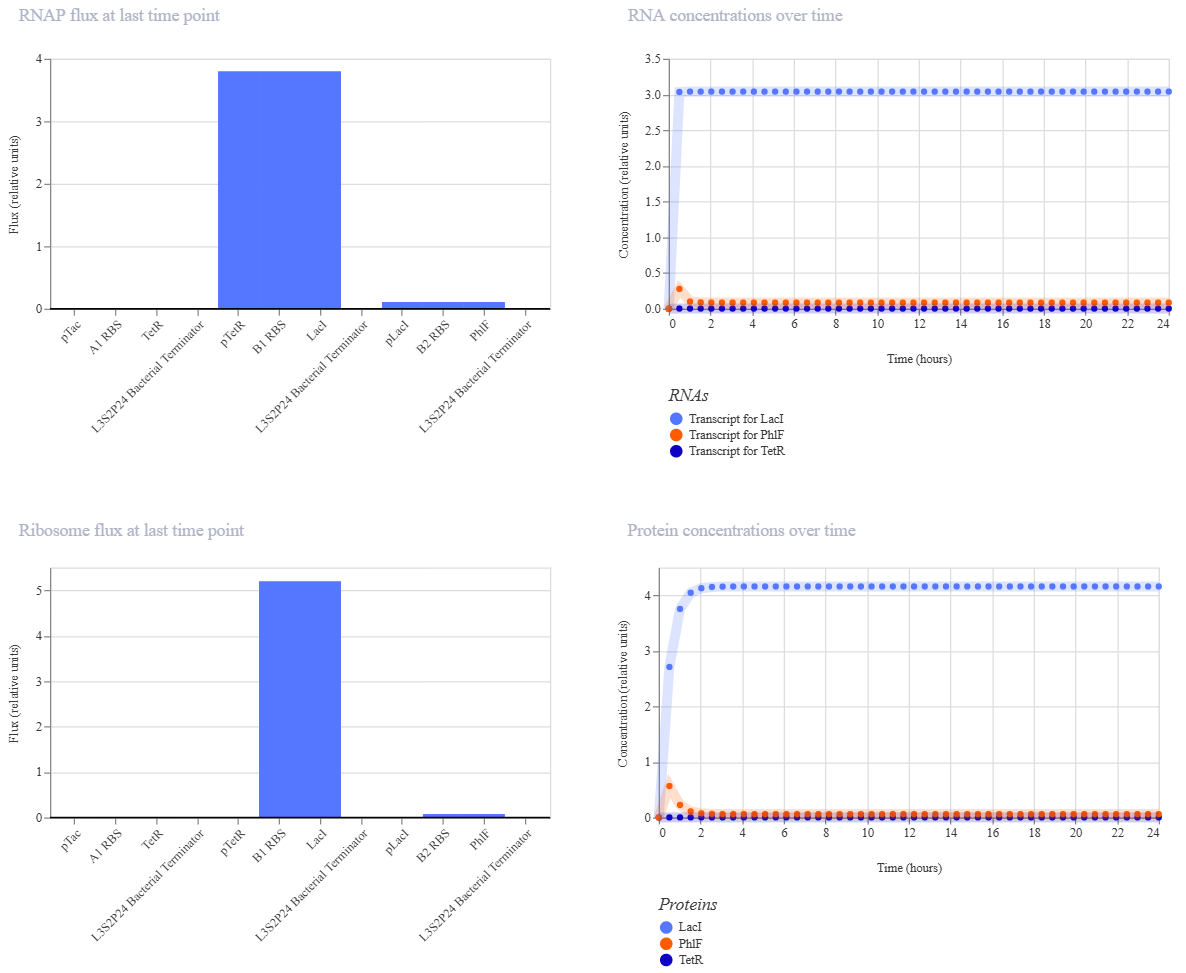
For my third construct, I decided to build a Double Inverter (Signal Cascade) to demonstrate how signal transduction works between different regulatory layers. I designed a first operon where the pBad promoter (activated by L-arabinose) drives the expression of the TetR repressor. This is followed by a second operon where the pTetR promoter controls the expression of the PhlF reporter protein.

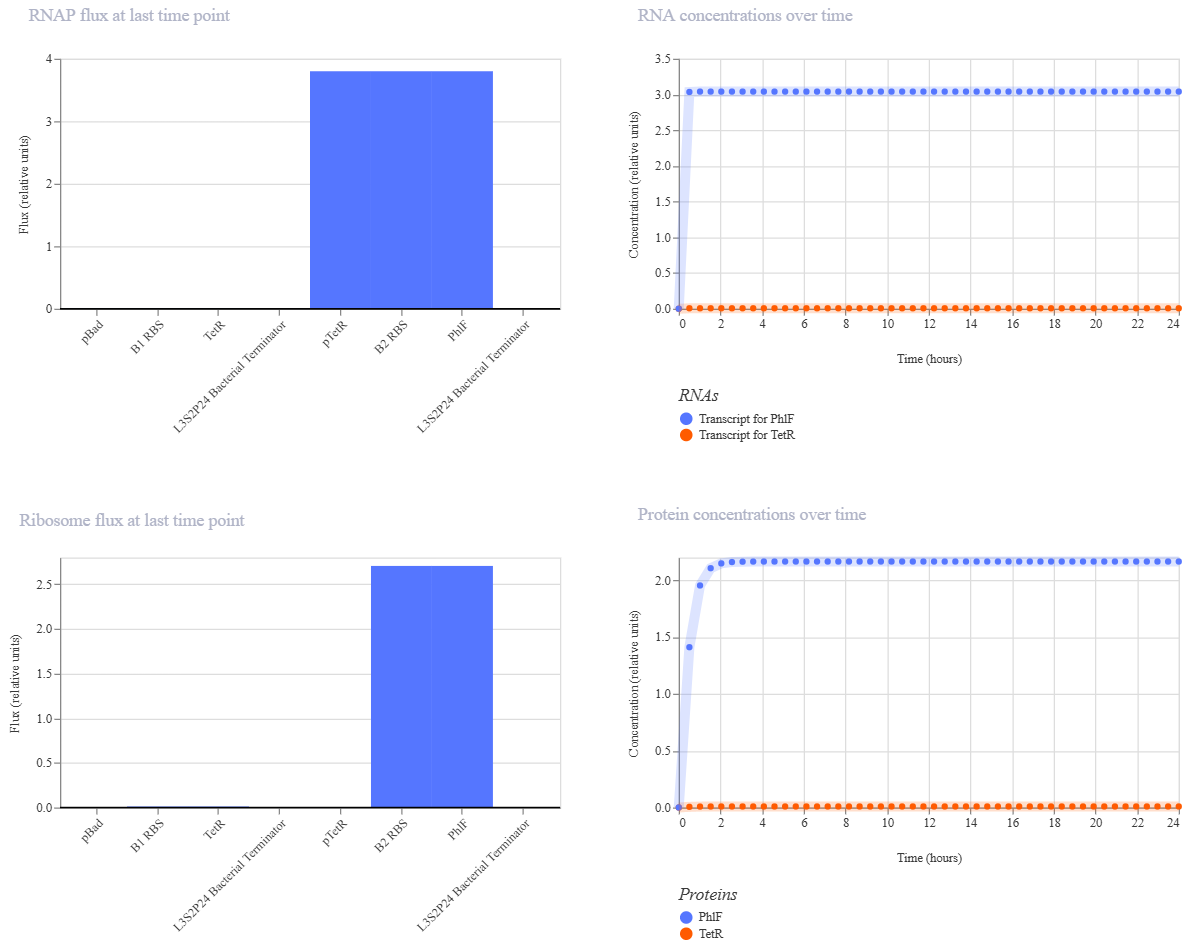
To test it, I ran two simulations using these parameters:
Simulation 1 parameters: Chassis: E. coli Duration: 24 hours Timestep: 30 minutes Transfection: Transient transfection
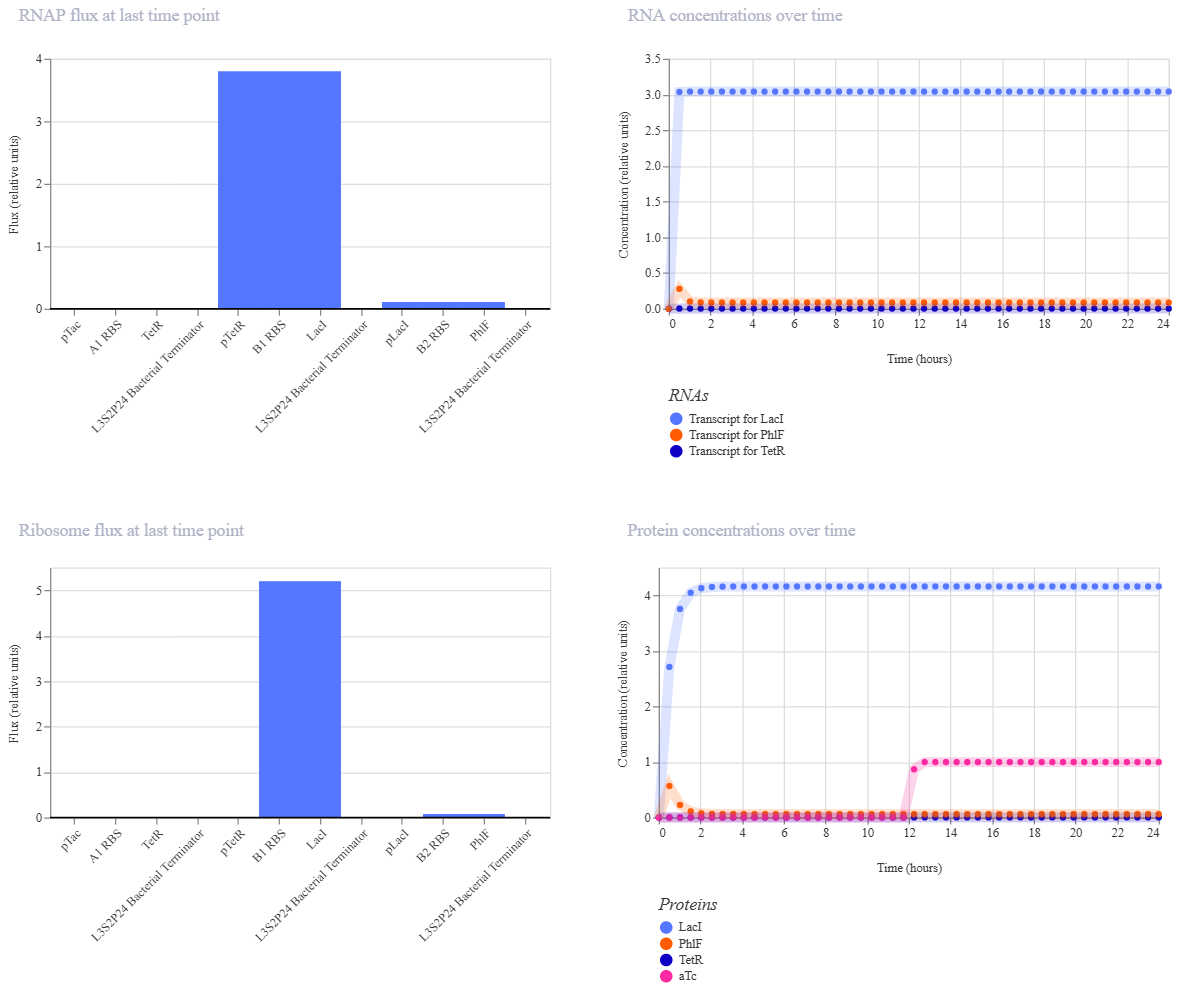
Simulation 2 parameters: Chassis: E. coli Duration: 24 hours Timestep: 30 minutes Transfection: Transient transfection Ligands: add L-arabinoseat at time 6Hours
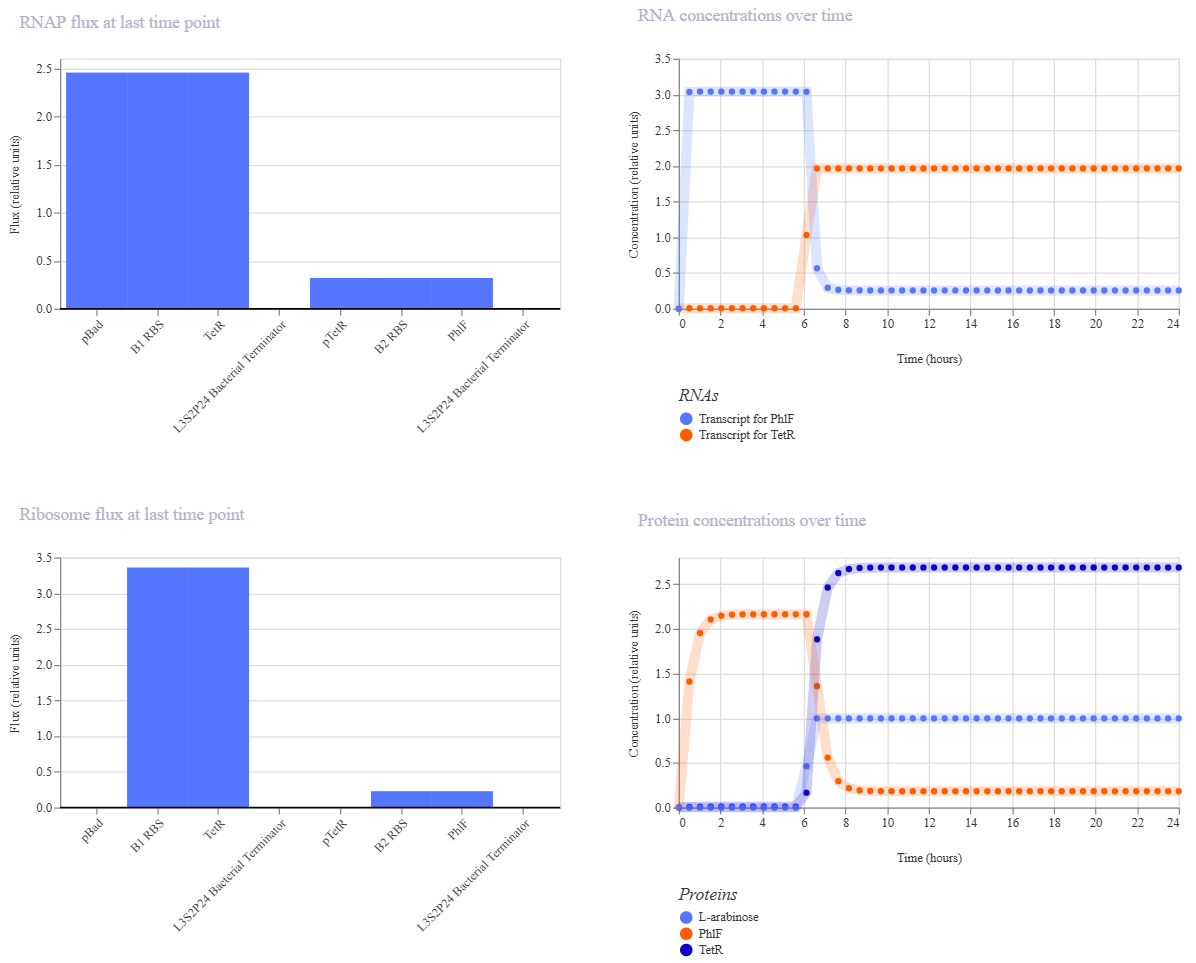
Simulation 3 parameters: Chassis: E. coli Duration: 24 hours Timestep: 30 minutes Transfection: Transient transfection Ligands: add L-arabinoseat at time 12 Hours
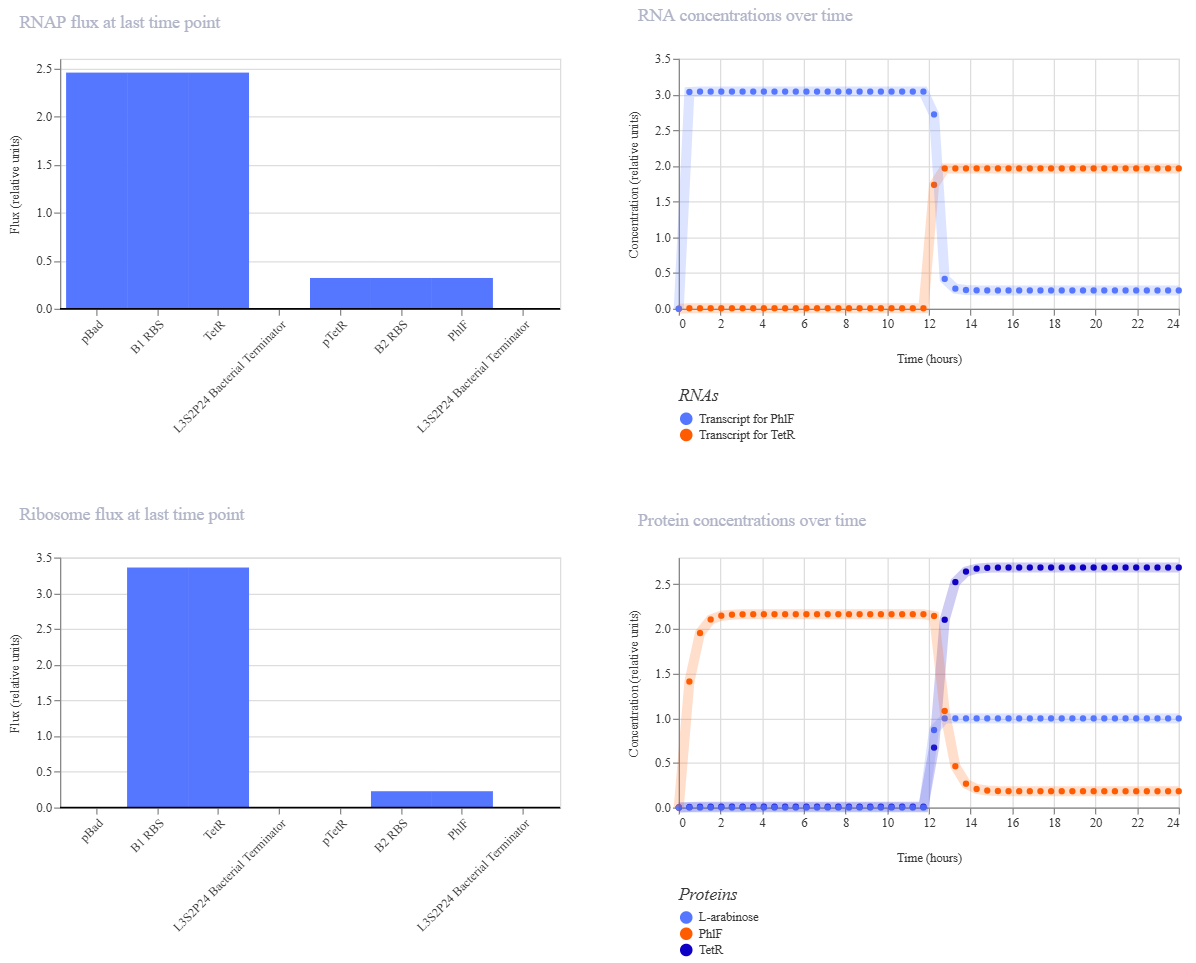
The simulation results under 6h and 12h induction showed exactly what I expected: as soon as L-arabinose triggers the spike in TetR, there’s a corresponding sharp drop in PhlF. I noticed a slight ’lag’ or delay between the two curves, which is a classic characteristic of biological cascades, as the second repressor needs time to accumulate and saturate the downstream promoter. To decrease this response time, I would suggest using a stronger RBS for the TetR gene to reach the inhibitory threshold faster.