Week 10 HW: Imaging and Measurement
Homework
Homework is partly based on data that will be generated in the Waters Immerse Lab in Cambridge, MA. Students will characterize green fluorescent protein (eGFP, a recombinant protein standard) structure (primary, secondary/tertiary) in the lab using liquid chromatography and mass spectrometry, as well as Keyhole Limpet Hemocyanin (KLH) oligomeric states using charge detection mass spectrometry (CDMS). Data generated in the lab needed to do the homework is included both within this document and in the Appendix of the laboratory protocol.
Homework: Final Project
For your final project:
- Please identify at least one (ideally many) aspect(s) of your project that you will measure. It could be the mass or sequence of a protein, the presence, absence, or quantity of a biomarker, etc.
For my final validation pipeline, I want to focus on measuring three primary aspects of the bioreactor system. First, I will monitor the Biomass Growth Rate ($\mu$ in $h^{-1}$) to evaluate our population’s structural viability under nutrient scarcity. Second, I plan to quantify the Intracellular PHB Accumulation ($\mu\text{g/mL}$) to establish the actual bioplastic synthesis yields achieved. Third, I would like to measure the Transcriptional Expression levels of the inserted operon to confirm that our biological components react precisely to the computed microenvironmental shifts.
- Please describe all of the elements you would like to measure, and furthermore describe how you will perform these measurements.
To perform these measurements, I would like to track cellular growth and biomass viability by sampling culture density at fixed intervals directly within a microfluidic plate matrix. I would follow the biopolymer accumulation by tracking the physical formation of intracellular inclusion bodies under starvation conditions. Additionally, I plan to execute gene expression profiling by isolating cellular transcripts at our peak optimization node, allowing me to check if the synthetic circuit actively overrides native metabolic constraints.
- What are the technologies you will use (e.g., gel electrophoresis, DNA sequencing, mass spectrometry, etc.)? Describe in detail.
I would like to execute the experimental protocol using three distinct bioengineering technologies. I could use Spectrophotometry ($OD_{600}$) via an automated microplate reader to calculate kinetic growth rates from real-time optical density data. For biopolymer quantification, I would like to deploy Nile Red Fluorescence Assays because they perform rapid, non-destructive tracking by binding a lipophilic fluorophore to the plastic granules, which allows us to measure signal emission at $590\text{ nm}$. Finally, I plan to use Quantitative Reverse Transcription PCR (RT-qPCR) to extract total cellular RNA, synthesize cDNA, and amplify the target phaABC sequences, confirming that our calculated $82.9%$ nutrient dilution effectively drives transcriptional overdrive through the synthetic NIT1 promoter.
Homework: Waters Part I — Molecular Weight
We will analyze an eGFP standard on a Waters Xevo G3 QTof MS system to determine the molecular weight of intact eGFP and observe its charge state distribution in the native and denatured (unfolded) states. The conditions for LC-MS analysis of intact protein cause it to unfold and be detected in its denatured form (due to the solvents and pH used for analysis).
Based on the predicted amino acid sequence of eGFP (see below) and any known modifications, what is the calculated molecular weight? You can use an online calculator like the one at https://web.expasy.org/compute_pi/
eGFP Sequence:
MVSKGEELFTG VVPILVELDG DVNGHKFSVS GEGEGDATYG KLTLKFICTT GKLPVPWPTL VTTLTYGVQC FSRYPDHMKQ HDFFKSAMPE GYVQERTIFF KDDGNYKTRA EVKFEGDTLV NRIELKGIDF KEDGNILGHK LEYNYNSHNV YIMADKQKNG IKVNFKIRHN IEDGSVQLAD HYQQNTPIGD GPVLLPDNHY LSTQSALSKD PNEKRDHMVL LEFVTAAGIT LGMDELYKLE HHHHHH
Note: This contains a His-purification tag (HHHHHH) and a linker (theLEbefore it).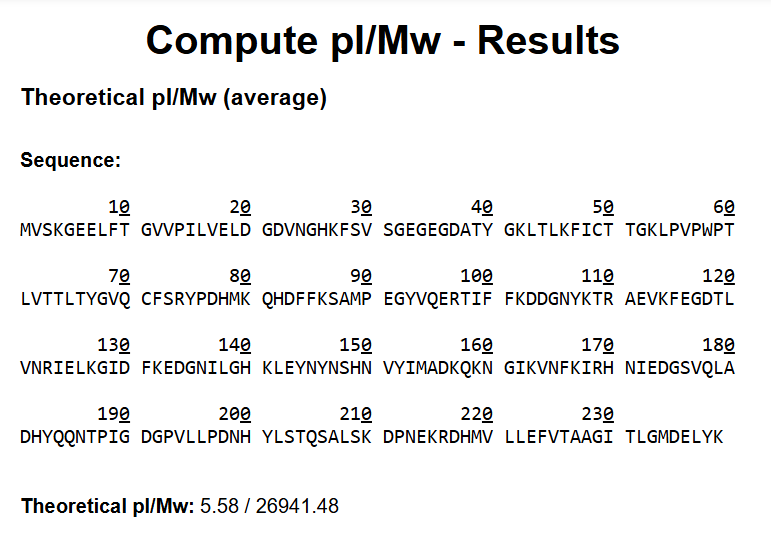
Theoretical molecular weight of the original eGFP amino acid sequence using the expasy calculator.
Using the ExPASy Compute pI/Mw tool, the original eGFP amino acid sequence (without the His-purification tag and the LE linker) yields a theoretical molecular weight of 26941.48 Da.
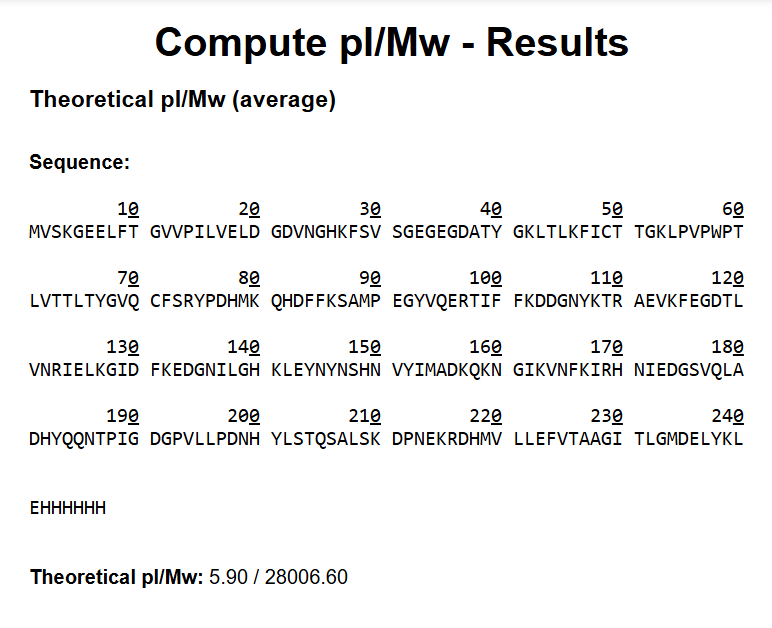
Theoretical molecular weight of the modified eGFP amino acid sequence using the expasy calculator.
On the other hand, the modified eGFP amino acid sequence yields a theoretical molecular weight of 28006.60 Da.
- Calculate the molecular weight of the eGFP using the adjacent charge state approach described in the recitation. Select two charge states from the intact LC-MS data (Figure 1) and:
I selected this pair of adjacent peaks from the intact LC-MS data to verify the experimental molecular weight calculation:
$$ \frac{m}{z_n} = 848.9162 $$ (left peak, high charge)
$$ \frac{m}{z_{n+1}} = 875.4421 $$ (right peak, low charge)
- Determine z for each adjacent pair of peaks (n, n+1) using: $ {\large z} = {\Large \frac{\frac{m}{z_{n+1}}} {\frac{m}{z_n} - \frac{m}{z_{n+1}}}} $
Using the adjacent pair formula: $$ z = \frac{848.9162}{875.4421 - 848.9162} = \frac{848.9162}{26.5259} $$ $$ z = 32.003 \rightarrow \mathbf{z = +32} $$
This places the charge state of the first peak at $+32$ and the second peak at $+31$.
- Determine the MW of the protein using the relationship between $\frac{m}{z_n}$, $MW$, and $z$
Using the relationship $$ MW = z \cdot (\frac{m}{z}) - (z \cdot m_{\text{proton}}) $$, where the mass of a proton ($H^+$) is $\approx 1.0078\text{ Da}$: $$ MW_{\text{experiment}} = 32 \cdot 875.4421 - (32 \cdot 1.0078) = 28014.15 - 32.25 = \mathbf{27981.90\text{ Da}} $$
Calculate the accuracy of the measurement using the deconvoluted MW from 2.2 and the predicted weight of the protein from 2.1 using:
$ \text{Accuracy} = \frac{|MW_{\text{experiment}} - MW_{\text{theory}}|}{MW_{\text{theory}}} $

Figure 1. Mass Spectrum of intact eGFP protein from the Waters Xevo G3 LC-MS (a mass spectrometer with 30,000 resolution) with individual charge state peaks labeled with $ \frac{m}{z} $ values.
In this case, using the formula stated above, I’ve got this result: $$ \text{Accuracy} = \frac{|27981.90 - 28006.60|}{28006.60} = \frac{24.7}{28006.60} \approx \mathbf{0.0008819\text{ (or 0.088%)}} $$
In ppm, the accuracy of the measurement is $$ \text{Accuracy} = \mathbf{0.0008819 \times 1,000,000} = 881.9 \approx 882 $$
- Can you observe the charge state for the zoomed-in peak in the mass spectrum for the intact eGFP? If yes, what is it? If no, why not?
No, I can’t observe the individual isotopic charge states in the zoom-in window. Although I see some minor peaks, they probably represent instrumental noise and overlapping profiles rather than clean, resolved isotopes, because the expected isotopic splitting distance at this high mass and charge ($z \approx 19$) is far too small ($\approx 0.053\text{ m/z}$) to be baseline resolved. I think it could be observed if the image had higher quality since I can’t really distinguish the small numbers at the top of the peaks.
Homework: Waters Part II — Secondary/Tertiary structure
We will analyze eGFP in its native, folded state and compare it to its denatured, unfolded state on a quadrupole time-of-flight MS. We will be doing MS-only analysis (no liquid chromatography, also known as “direct infusion” experiments) on the Waters Xevo G3-QToF MS.
Based on learnings in the lab, please explain the difference between native and denatured protein conformations. For example, what happens when a protein unfolds? How is that determined with a mass spectrometer? What changes do you see in the mass spectrum between the native and denatured protein analyses (Figure 2)?

Figure 2. Comparison of the mass spectra between denatured (top) and native (bottom) eGFP standard on the Waters Xevo G3 QTof MS.
Native proteins retain their compact, three-dimensional folded structures, stabilizing non-covalent interactions and burying hydrophobic residues. When a protein denatures, it unfolds into an extended, flexible, and disordered polymer chain, greatly increasing its solvent-accessible surface area.
In electrospray ionization mass spectrometry (ESI-MS), this structural change directly alters the Charge State Distribution (CSD):
- Top Spectrum (Green, Denatured): Unfolding exposes a massive number of basic amino acid residues (like Lys, Arg, and His) that were previously buried in the core. This results in extensive protonation, yielding a broad distribution of peaks at a higher charge state (higher $z$), which shifts the entire envelope toward lower $m/z$ values (between 700 and 1300 $m/z$).
- Bottom Spectrum (Red, Native): The tightly folded conformation restricts solvent and acid accessibility, leaving only a few surface residues available for protonation. Consequently, the protein carries fewer charges (lower $z$), shifting the signal to a tight, high-intensity peak envelope at higher $m/z$ values (predominantly around 2545 and 2799 $m/z$).
Zooming into the native mass spectrum of eGFP from the Waters Xevo G3 QTof MS (see Figure 3), can you discern the charge state of the peak at ~2800 $ \frac{m}{z} $? What is the charge state? How can you tell?

Figure 3. Native eGFP mass spectrum from the Waters Xevo G3 Q-Tof MS. The inset is a zoomed-in view of the charge state at ~2800 $ \frac{m}{z} $ on a mass spectrometer with 30,000 resolution.
Yes, the charge state can be clearly discerned from the high-resolution inset window because the compact, single-conformer nature of native eGFP allows the instrument to baseline-resolve individual isotopic peaks.
Taking two consecutive isotopic peaks from the zoom-in inset:
- $(\frac{m}{z})_1 = 2545.3140$
- $(\frac{m}{z})_2 = 2545.4058$
1. Difference in $\frac{m}{z}$ values ($\Delta \frac{m}{z}$):
$$\Delta \frac{m}{z} = 2545.4058 - 2545.3140 = 0.0918\text{ m/z}$$
2. Charge State Calculation ($z$):
Using the natural monoisotopic mass difference of a neutron: $$\Delta m = {}{13}\text{C} - {}{12}\text{C} \approx 1.00335\text{ Da}$$
Based on this value and the fundamental mass-to-charge relationship: $$\Delta \frac{m}{z} = \frac{\Delta m}{z}$$
Now, we can solve for z using the experimental data: $$z = \frac{1.00335}{\Delta \frac{m}{z}} = \frac{1.00335}{0.0918} = 10.93 \rightarrow \mathbf{z = +11}$$
The charge state of the native protein peak cluster is $+11$. We can tell because the fine isotopic splitting distance of $\approx 0.092\text{ m/z}$ corresponds mathematically to a multi-protonated species carrying exactly 11 charges.
Homework: Waters Part III — Peptide Mapping - primary structure
We will digest the eGFP protein standard into peptides using trypsin (an enzyme that selectively cleaves the peptide bond after Lysine (K) and Arginine (R) residues. The resulting peptides will be analyzed on the Waters BioAccord LC-MS to measure their molecular weights and fragmented to confirm the amino acid sequence within each peptide – generating a “peptide map”. This process is used to confirm the primary structure of the protein.
There are a variety of tools available online to calculate protein molecular weight and predict a list of peptides generated from a tryptic digest. We will be using tools within the online resource Expasy (the bioinformatics resource portal of the Swiss Institute of Bioinformatics (SIB)) to predict a list of tryptic peptides from eGFP.
- How many Lysines (K) and Arginines (R) are in eGFP? Please circle or highlight them in the eGFP sequence given in Waters Part I question 1 above. (Note: adding the sequence to Benchling as an amino acid file and clicking biochemical properties tab will show you a count for each amino acid).
Here’s the amino acid sequence of eGFP with Lysines (K) and Arginines (R) circled!
MVSKGEELFTG VVPILVELDG DVNGHKFSVS GEGEGDATYG KLTLKFICTT GKLPVPWPTL VTTLTYGVQC FSRYPDHMKQ HDFFKSAMPE GYVQERTIFF KDDGNYKTRA EVKFEGDTLV NRIELKGIDF KEDGNILGHK LEYNYNSHNV YIMADKQKNG IKVNFKIRHN IEDGSVQLAD HYQQNTPIGD GPVLLPDNHY LSTQSALSKD PNEKRDHMVL LEFVTAAGIT LGMDELYKLE HHHHHH
I’ve circled 20 Lysisnes (K) and 6 Arginines (R)
And below we can also confirm these results using Benchling’s biochemical properties tab.
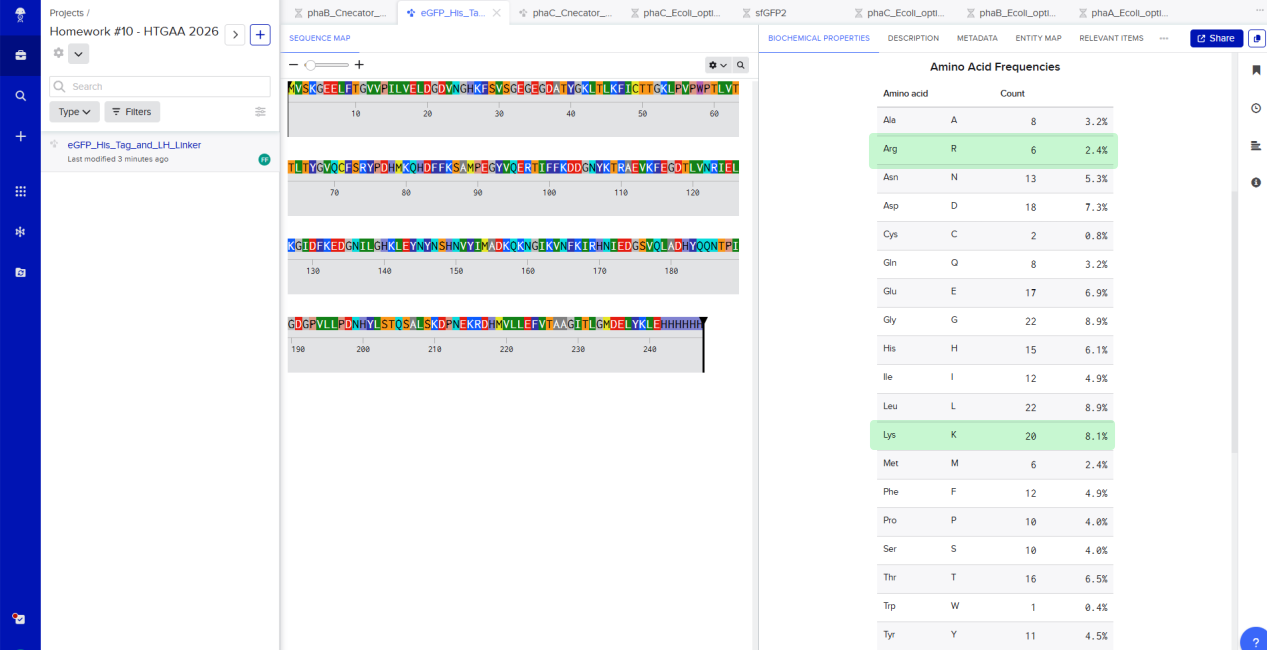
eGFP amino acid sequence and its frequency using Benchling.
- How many peptides will be generated from tryptic digestion of eGFP?
- Navigate to https://web.expasy.org/peptide_mass/
- Copy/paste the sequence above into the input box in the PeptideMass tool to generate expected list of peptides.
- Use Figure 4 below as a guide for the relevant parameters to predict peptides from eGFP.
- Click “Perform the Cleavage” button in the PeptideMass tool and report the number of peptides generated when using trypsin to perform the digest.

Figure 4. Example conditions for predicting the number of tryptic peptides from the eGFP standard. Please replicate all parameters shown above.
I followed the steps and got the following results:
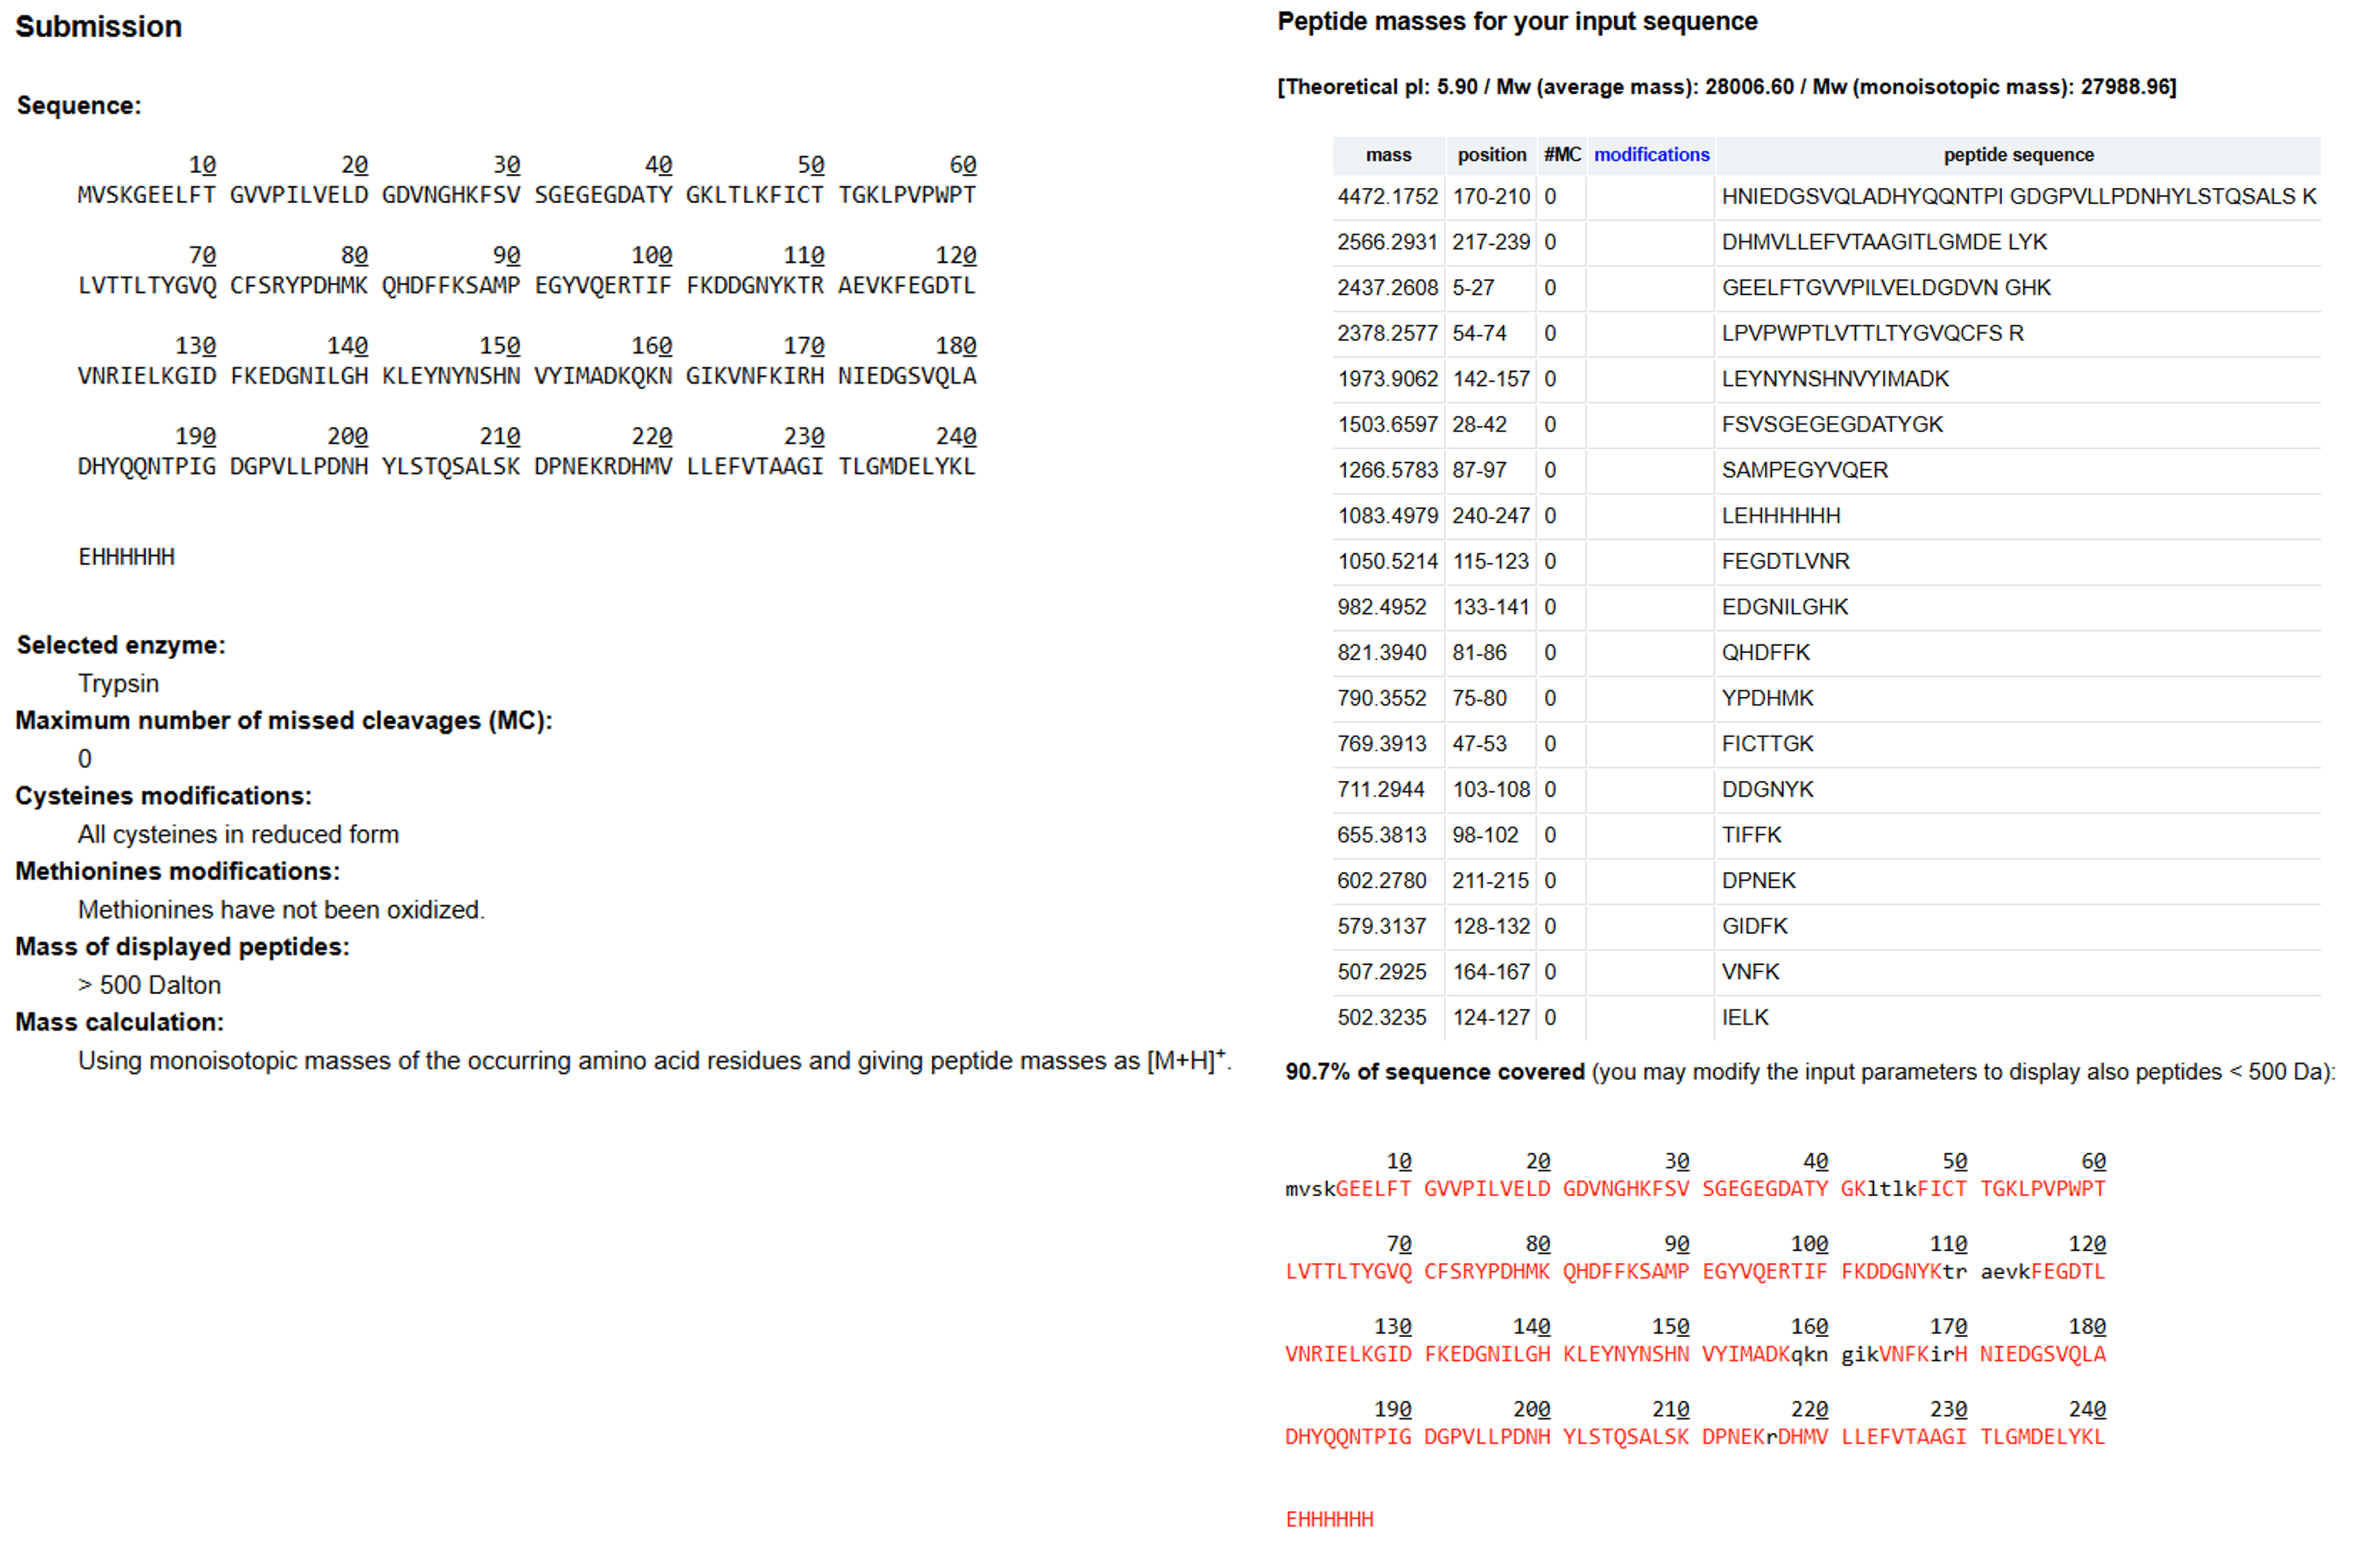
Tryptic digestion results of eGFP using the expasy PeptideMass tool!
The PeptideMass Tool found that 19 peptides will be generated from eGFP tryptic digestion, and it covered 90.7% of the total amino acid sequence.
Based on the LC-MS data for the Peptide Map data generated in lab (please use Figure 5a as a reference) how many chromatographic peaks do you see in the eGFP peptide map between 0.5 and 6 minutes? You may count all peaks that are >10% relative abundance.

Figure 5a. Total ion chromatogram (TIC) of the eGFP peptide map. The peak at 2.78 minutes is circled, and its MS data is shown in the mass spectrum in Figure 5b, below.
First, to determine the 10% relative abundance threshold, I looked at the highest peak in the chromatogram (the peak at 4.87 minutes), which reaches the maximum intensity of $1.2 \times 10^7$ counts (100%).
Calculating 10% of this maximum intensity value gives our cutoff line: $$I_{\text{cutoff}} = 0.10 \times (1.2 \times 10^7)$$
$$I_{\text{cutoff}} = 1.2 \times 10^6 \text{ counts}$$
Any peak rising above this intensity line (just below the $2 \times 10^6$ mark on the TIC axis) is included. Looking at the Total Ion Chromatogram (TIC) between 0.5 and 6.0 minutes, I can clearly identify 17 distinct peaks that meet this criteria:
- Between 0.5 - 1.0 min: 0.61, 0.79
- Between 1.0 - 2.0 min: 1.43, 1.80, 1.85, 1.93
- Between 2.0 - 3.0 min: 2.17, 2.26, 2.54, 2.78
- Between 3.0 - 4.0 min: 3.27, 3.53, 3.59, 3.70
- Between 4.0 - 5.0 min: 4.48, 4.64, 4.87
Just to mention, the 3.27 peak is also considered since it is above the threshold but just by a little. Besides that one, there are also 2 other peaks with no number that could also be considered since they are above the line too.
With those considerations, there are 17 identified numbered peaks + 2 unnumbered peaks = 19 total peaks.
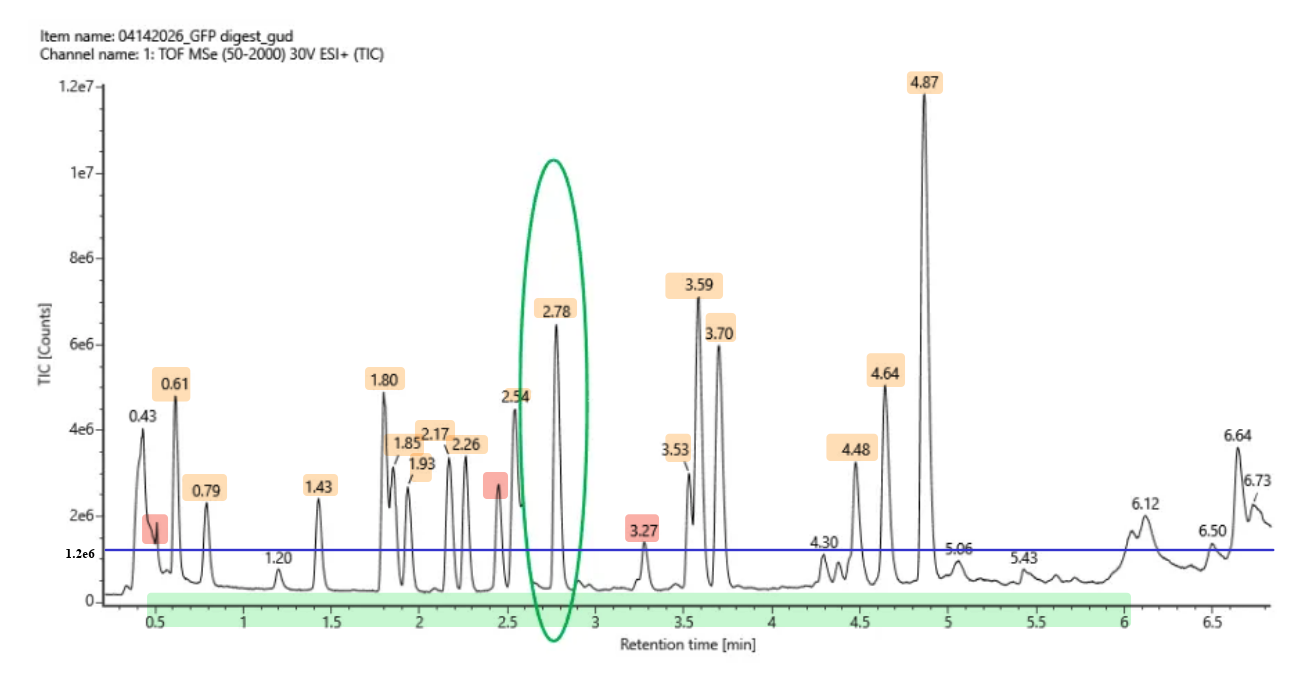
TIC of the eGFP with the 10% threshold, numbered peaks are highlighted in orange and small peaks are highlighted in red.
- Assuming all the peaks are peptides, does the number of peaks match the number of peptides predicted from question 2 above? Are there more peaks in the chromatogram or fewer?
However, the 17 observed chromatographic peaks do not perfectly match the total number of predicted tryptic peptides from PetideMass, which is 19. Generally, a typical digest yields fewer visible peaks than theoretical fragments because of some of the following reasons:
- Some small hydrophilic peptides elute in the void volume (before 0.5 min) and are lost.
- Multiple distinct peptides can co-elute at the exact same retention time (overlapping peaks).
- Incomplete or missed tryptic cleavages can create larger, alternative peptide fragments.
Identify the mass-to-charge ($\frac{m}{z}$) of the peptide shown in Figure 5b. What is the charge ($z$) of the most abundant charge state of the peptide (use the separation of the isotopes to determine the charge state). Calculate the mass of the singly charged form of the peptide ($\small{[M\!\!+\!\!H]^+}$) based on its $\frac{m}{z}$ and $z$.

Figure 5b. Mass spectrum figure to show $\frac{m}{z}$ for the chromatographic peak at 2.78 min from Figure 5a above. The inset is a zoom-in of the peak at $\frac{m}{z}$ 525.76, to discern the isotope peaks.

Figure 5c. Fragmentation spectrum of the peptide eluting at retention time 2.78 minutes in Figure 5a (above).
5.1 Mass-to-charge ratio ($\frac{m}{z}$) The most abundant precursor peak eluting at 2.78 minutes has an $\frac{m}{z}$ of $525.76$ (specifically $525.76712$).
5.2 Charge state ($z$) determination In the zoomed-in mass spectrum inset (Figure 5b), the spacing between the individual isotope peaks is consistently $0.5\text{ m/z}$.
Since $\Delta \frac{m}{z} = \frac{1}{z}$:** $$z = \frac{1}{0.5} = \mathbf{2}$$
The peptide is in a doubly charged state ($z = +2$).
5.3 Calculation of the singly charged form ($[M+H]^+$) Using the single charged mass relationship $[M+H]^+ = (z \times \frac{m}{z}) - (z - 1)$ to find the mass of the monoisotopic protonated form: $$[M+H]^+ = (2 \times 525.76) - (2 - 1)$$ $$[M+H]^+ = 1051.52 - 1 = \mathbf{1050.52\text{ Da}}$$
- Identify the peptide based on comparison to expected masses in the PeptideMass tool. What is mass accuracy of measurement? Please calculate the error in ppm. (Recall that $ \text{Accuracy} = \frac{|MW_{\text{experiment}} - MW_{\text{theory}}|}{MW_{\text{theory}}} $ )
By matching the experimental $[M+H]^+$ mass of 1050.52 Da against the predicted tryptic masses of eGFP using the PeptideMass tool, we find a perfect sequence match with the peptide fragment: FEGDTLVNR (Theoretical $MW_{\text{theory}} = 1050.5214\text{ Da}$).
Mass Accuracy Calculation (in ppm): $$\text{Accuracy} = \frac{|1050.52 - 1050.5214|}{1050.5214} \times 1,000,000$$ $$\text{Accuracy} = \frac{0.0014}{1050.5214} \times 1,000,000 \approx \mathbf{1.33\text{ ppm}}$$
An error of 1.33 ppm is well within the high-resolution mass accuracy threshold ($<5\text{ ppm}$) of the Waters Xevo G3 QTof system, confidently confirming the identity of the peptide.
What is the percentage of the sequence that is confirmed by peptide mapping? (see Figure 6)

Figure 6. Amino Acid Coverage Map of eGFP based on BioAccord LC-MS peptide identification data.
The percentage of the confirmed sequence by peptide mapping is 88% according to Figure 6.
Bonus Peptide Map Questions
- Can you determine the peptide sequence for the peptide fragmentation spectrum shown in Figure 5c? (HINT: Use your results from Question 2 above to match the peptide molecular weight that is closest to that shown in Figure 5b. Copy and paste its sequence into this tool online to predict the fragmentation pattern based on its amino acid sequence: http://db.systemsbiology.net/proteomicsToolkit/FragIonServlet.html. What is the sequence of the eGFP peptide that best matches the fragmentation spectrum in Figure 5c?
Yes, the peptide sequence can be definitively determined and verified by matching the fragment ions from the MS/MS spectrum in Figure 5c with the theoretical monoisotopic masses generated by the online Fragment Ion Calculator tool for the sequence FEGDTLVNR. The calculator results confirm a perfect structural match, resolving a clear N-terminal b-ion series containing $b_2$ (FE) at $277.11833\text{ m/z}$ and $b_3$ (FEG) at $334.13979\text{ m/z}$, alongside an intense C-terminal y-ion series anchored by the terminal Arginine.
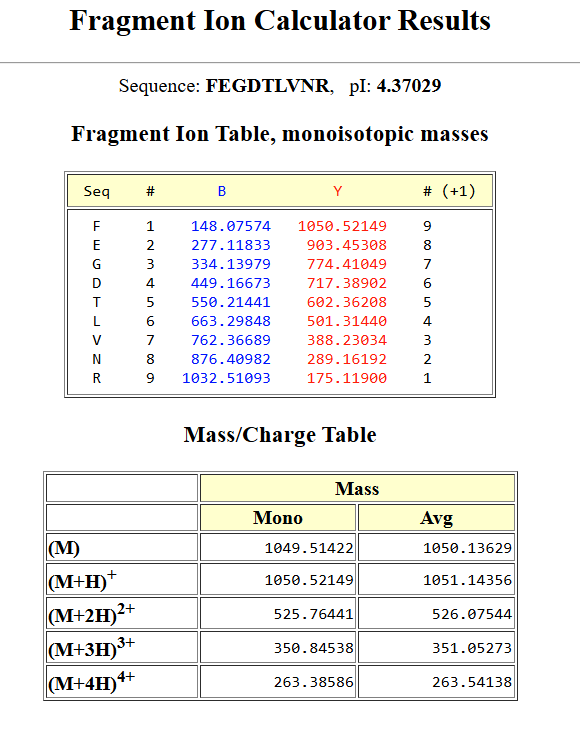
Peptide sequence fragmentation pattern using the systemsbiology tool.
Specifically, the highly abundant experimental fragments track directly with the tool’s predictions for $y_1$ (R) at $175.11900\text{ m/z}$, $y_2$ (NR) at $289.16192\text{ m/z}$, and $y_3$ (VNR) at $388.23034\text{ m/z}$. Furthermore, the tool calculates the theoretical monoisotopic mass for the doubly charged precursor $(M+2H)^{2+}$ at $525.76441\text{ m/z}$, which aligns flawlessly with our dominant experimental signal at $525.76\text{ m/z}$ and solidifies this peptide identity.
- Does the peptide map data make sense, i.e. do the results indicate the protein is the eGFP standard? Why or why not? Consult with Figure 6, which depicts the % amino acid coverage of peptides positively identified using their calculated mass and fragmentation pattern.
Yes, the peptide map data perfectly indicates that the protein sample is the eGFP standard because the results provide a definitive structural fingerprint. First, the automated peptide mapping achieved an exceptionally high 88% amino acid coverage, which easily exceeds the standard threshold required for confident protein identification. Furthermore, the experimental mass for the prominent tryptic peptide at 2.78 minutes matched the theoretical sequence with an incredibly tight error margin of only 1.33 ppm, a level of precision that virtually rules out false positives. Finally, the structural fragment markers verified in the MS/MS spectrum uniquely trace back to the primary sequence of the eGFP construct, confirming that both the intact mass and internal chemical structure align with the standard.
Homework: Waters Part IV — Oligomers
We will determine Keyhole Limpet Hemocyanin (KLH)’s oligomeric states using charge detection mass spectrometry (CDMS). CDMS single-particle measurements of KLH allow us to make direct mass measurements to determine what oligomeric states (that is, how many protein subunits combine) are present in solution. Using the known masses of the polypeptide subunits (Table 1) for KLH, identify where the following oligomeric species are on the spectrum shown below from the CDMS (Figure 7):
- 7FU Decamer
- 8FU Didecamer
- 8FU 3-Decamer
- 8FU 4-Decamer
| Polypeptide Subunit Name | Subunit Mass |
|---|---|
| 7FU | 340 kDa |
| 8FU | 400 kDa |

Figure 7. Mass spectrum of Keyhole Limpet Hemocyanin (KLH) acquired on the CDMS.
To determine the oligomeric states using CDMS, we first need to calculate the mass of each decamer. We also need to remember that a decamer is 10 identical subunits, so didecamer is 20 identical subunits, and 3 decamer is 30 and so on.
Making the calculations:
- 7FU Decamer: Mass = 10 x 340 kDa = 3400 kDa <> 3.4 MDa (Megadaltons)
- 8FU Didecamer: Mass = 20 x 400 kDa = 8000 kDa <> 8 MDa (Megadaltons)
- 8FU 3-Decamer: Mass = 30 x 400 kDa = 3400 kDa <> 12 MDa (Megadaltons)
- 8FU 4-Decamer: Mass = 40 x 400 kDa = 3400 kDa <> 16 MDa (Megadaltons)
Once calculated, I need to identify them in the graph. Here’s the result of that:
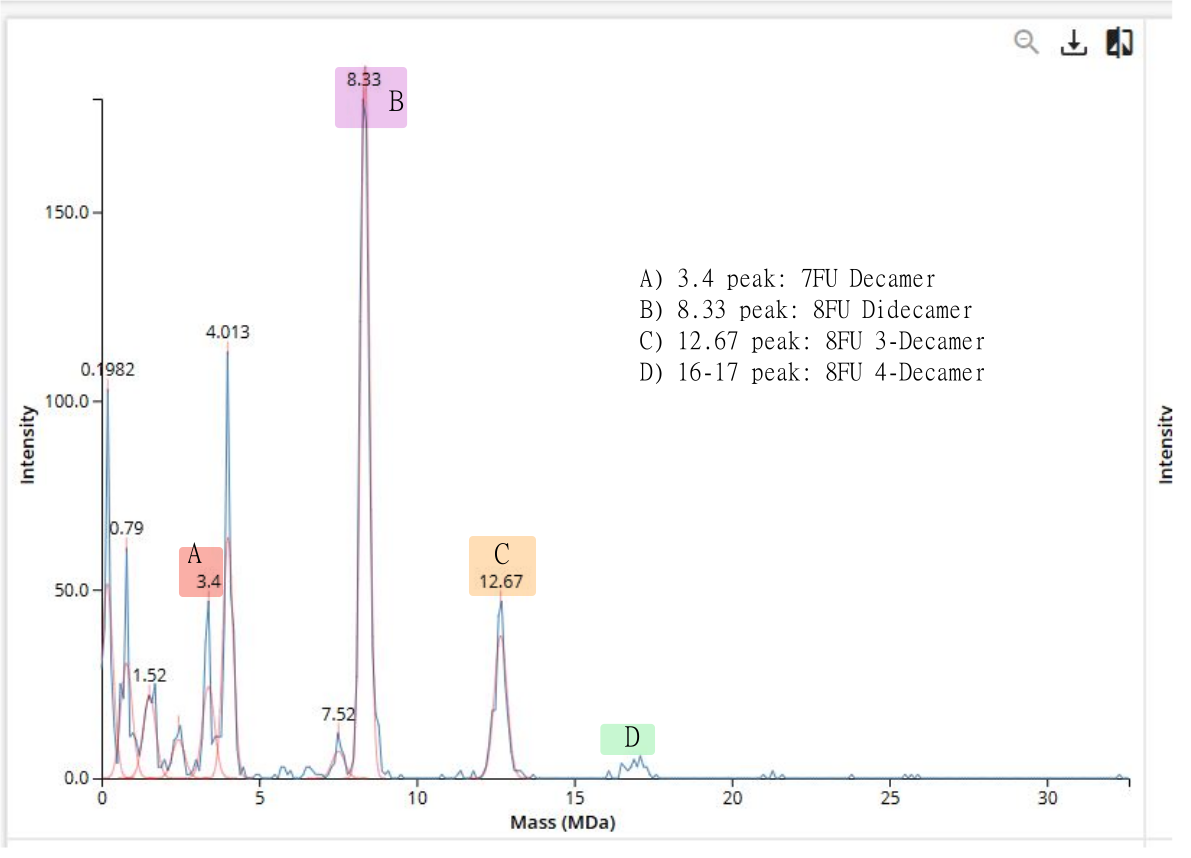
Oligomeric identificacion using the CDMS peaks graph.
In this case most peaks align decently with the theoretical calculations.
- 7FU Decamer: 3.4 observed peak as calculated before.
- 8FU Didecamer: 8.33 observed peak, which is near the 8MDa calculation made before.
- 8FU 3-Decamer: 12.67 observed peak, which is also near the 12MDa calculation made before
- 8FU 4-Decamer: 16 to 17 observed peaks, which should be near the 16 MDa mass calculation but are lower than the other peaks.
Homework: Waters Part V — Did I make GFP?
Please fill out this table with the data you acquired from the lab work done at the Waters Immerse Lab in Cambridge, or else the data screenshots in this document if you were unable to have lab work done at Waters.
| Theoretical | Observed/measured on the Intact LC-MS | PPM Mass Error | |
|---|---|---|---|
| Molecular weight (kDa) | 28006.60 | 27981.90 | 882 |