Week 6 Review: Genetic Circuits I
Week 6 — Genetic Circuits I: Assembly Technologies
Part 1 — DNA Assembly: PCR, Gibson, Golden Gate, and transformation
A topic guide on the molecular-biology toolkit that underpins all of synthetic biology: amplifying DNA (PCR), cutting it (restriction enzymes), joining it (Gibson and Golden Gate), and getting it into cells (transformation). Written as a stand-alone primer rather than a homework Q&A. Part 2 (Asimov Kernel: building genetic circuits computationally) will follow as a separate page once the simulation work is complete.
Course: HTGAA Spring 2026 Lecture (Tues, Mar 10, 2026): Doug Densmore & Traci Haddock — Genetic Circuits Part I: Assembly Technologies Recitation (Wed, Mar 11): Eyal Perry & Ronan Donovan — PCR, Gibson Assembly Author: Fiona (Committed Listener BioPunk)
At a glance
Read time ~25 min Audience Anyone wanting a primer (pun-intended) on the molecular-biology toolkit of synthetic biology What you’ll learn DNA amplification (PCR), cut it (restriction enzymes), join it (Gibson and Golden Gate), and get it into bacterial cells (transformation) — with verified protocols and the failure checks Format Part 1- Theorectical overview , Part 2 — genetic circuits and Asimov Kernel build example
Why this matters
Synthetic biology runs on the ability to compose DNA parts — promoters, RBSs, CDSs, terminators — into functional circuits. Until the late 2000s, multi-fragment assembly was painful: restriction enzymes left scars, ligation efficiencies were mediocre, and any non-trivial circuit took weeks of iterative cloning. Two innovations changed the field. Gibson Assembly (Gibson 2009) collapsed multi-fragment ligation into a single isothermal one-pot reaction with seamless joints. Golden Gate Assembly (Engler 2008) used Type IIS enzymes for scarless, hierarchical assembly with directional control over fragment order. Together, they unlocked the modular abstractions that earlier standards (BioBricks) only aspired to.
Computational design caught up. Benchling and platforms like Asimov Kernel let you simulate construct behavior — predicted protein output, dynamics, signal-to-noise — before ordering a single oligo. Densmore’s group (Boston University) has been particularly central to this design-automation thread.
This page is the bench-and-protocol foundation for everything later in HTGAA. Every later week — protein engineering, cell-free systems, genome engineering — assumes you can assemble defined DNA constructs and get them into cells. Master this, and the rest of the course is design problems.
1. PCR — making DNA in vitro
PCR (Kary Mullis, 1983; commercialized 1985) turns a single template DNA molecule into ~10⁹ copies in a couple of hours. It is the workhorse of every cloning, sequencing, diagnostic, and forensic lab.
1.1 The three-step cycle
Each PCR cycle has three temperature stages, repeated 25–35 times:
flowchart LR
    A[Template + Primers<br/>+ Phusion + dNTPs] --> B[Denaturation<br/>~95 °C · 10–30 s]
    B --> C[Annealing<br/>~50–65 °C · 15–30 s]
    C --> D[Extension<br/>~72 °C · 15–30 s/kb]
    D -->|repeat 25–35×| B
D --> E[~10⁹ copies<br/>of target]- Denaturation (~95 °C, 10–30 s) — double-stranded DNA melts apart into single strands.
- Annealing (~50–65 °C, 15–30 s) — primers (short ~20-nt synthetic oligos that flank your target) bind to the now-single-stranded template at their complementary sequences.
- Extension (~72 °C, 15–30 s/kb for Phusion) — the polymerase copies the template starting from each primer’s 3′ end, producing new dsDNA.
After the first few cycles, every newly-synthesized strand is itself a template for the next cycle. The amount of DNA between the two primers doubles per cycle — exponential amplification. After 30 cycles you have ~10⁹× the starting amount, enough to clone, sequence, or visualize on a gel.
1.2 Phusion HF — the modern default
For cloning-grade work, Phusion High-Fidelity DNA Polymerase (Thermo Fisher) is the standard choice. It is a proofreading polymerase fused to a non-specific DNA-binding domain that boosts processivity. The error rate is 4.4 × 10⁻⁷ errors per base — roughly 50× lower than Taq. For a 5 kb construct over 30 cycles, that is ~1 in 50 clones with a polymerase-introduced error. Manageable.
The Phusion HF Master Mix is sold pre-formulated and combines four components:
| Component | Purpose |
|---|---|
| Phusion polymerase | Proofreading DNA polymerase fused to a non-specific DNA-binding domain for high processivity. ~50× lower error than Taq. |
| dNTPs (dATP, dTTP, dCTP, dGTP) | Building blocks for the new DNA strand. |
| HF reaction buffer | Tris-HCl (~pH 8.8) for buffering, K⁺ for ionic environment, Mg²⁺ as the catalytic cofactor for the polymerase. |
| Tracking dye | Density agent + visible dye (in the Phusion Green Master Mix variant only) for direct gel loading without a separate loading buffer. The standard HF Master Mix is colorless. |
A separate GC buffer is sold for high-GC templates that don’t amplify well in HF buffer — the two buffers differ in additive composition tuned for fidelity (HF) versus yield on tough templates (GC).
1.3 Annealing temperature — what sets it
Primer annealing temperature is set by primer Tm (melting temperature), with three sequence-intrinsic factors and two solution-condition factors:
Sequence-intrinsic (set Tm):
- Primer length — longer primers melt at higher T. Standard range 18–25 nt.
- GC content — G–C base pairs (3 H-bonds) are stronger than A–T (2 H-bonds). 50% GC is the design sweet spot; > 65% gets hard to manage.
- Sequence-specific effects — nearest-neighbor thermodynamics, runs of GC, and secondary structure (primer hairpins lower effective Tm).
Solution conditions (modify effective Tm):
- Mg²⁺ concentration — higher Mg²⁺ stabilizes duplex formation, raising effective Tm. Standard 1.5–2 mM.
- Monovalent salt (K⁺, Na⁺) — also stabilizes duplexes; standard ~50 mM K⁺ in Phusion buffer.
Practical rule: anneal 3–5 °C below the Tm of the lower-Tm primer in the pair. If your primers are Tm 60 °C and 65 °C, anneal at ~57 °C. For Phusion specifically, with sufficiently long primers (Tm > 72 °C), you can drop to a 2-step protocol with annealing/extension combined at 72 °C.
Tm calculators (Primer3, NEB Tm Calculator, Benchling primer tool) compute these automatically and should be used for any non-trivial PCR design.
1.4 Failure modes — including primer dimers
PCR fails in characteristic ways. The four to know:
- Smeared product on gel. Non-specific amplification — usually fixed by raising annealing T, shortening extension time, or reducing template input.
- No-template control (NTC) shows a band. Reagent contamination — discard primers/water/Master Mix and start fresh.
- No product at all. Primer–template mismatch, dead polymerase, or template not present at adequate copy number.
- Primer dimers. Two primer molecules anneal to each other (instead of to the template) and the polymerase extends across the junction. Even 3–5 bp of complementarity at the 3′ ends is enough. The result is a short product (30–80 bp) that gets amplified exponentially alongside (or instead of) your real target. Once dimers start forming, they hog dNTPs, primer, and polymerase. They show up as a low-MW band/smear on agarose gels (best seen at 2–3% agarose). A positive NTC lane is the classic giveaway. For downstream Gibson cloning, dimers are particularly damaging — they can mis-prime onto your fragments or compete for reaction components.
Mitigations for primer dimers, in priority order:
- Primer design. Use Primer3, NEBuilder, or Benchling’s primer tool to flag (a) 3′-end complementarity between forward/reverse primers, (b) self-complementarity within each primer.
- Hot-start polymerase. Phusion is sold in a Hot Start variant where the polymerase is held inactive (antibody- or aptamer-blocked) until the first denaturation. Single highest-leverage mitigation.
- Lowest workable primer concentration (0.2–0.5 μM is plenty for most applications).
- Raise the annealing temperature. Favors specific primer–template binding over primer–primer (which has lower Tm).
- Touchdown PCR. Start at a high annealing T and step down incrementally — biases early cycles toward specific product before dimers can take over.
Key takeaway — PCR. Phusion HF Master Mix + carefully-designed primers + the right annealing temperature gets you 95% of the way. The remaining 5% is hot-start polymerase to suppress primer dimers. If you can read a gel, you can debug a PCR.
2. Restriction enzymes — cutting DNA at defined positions
Restriction enzymes are the molecular scissors of synthetic biology. Discovered in the 1960s as bacterial defense against phage infection (Arber, Smith, Nathans — Nobel 1978), they cut DNA at specific recognition sequences. The defining trick: bacteria methylate their own DNA, protecting it from their own restriction enzymes; foreign (phage) DNA is unmethylated and gets cut. Synthetic biology has repurposed thousands of these enzymes as cloning tools.
2.1 Type II restriction enzymes
The familiar workhorses (EcoRI, BamHI, HindIII, NotI) recognize palindromic sequences and cut inside the recognition site. EcoRI’s site is GAATTC; it cuts between G and A on both strands, leaving a 4-nt 5′ overhang of AATT:
Two products with matching “sticky” ends. Anneal with another fragment that has the same overhang and seal the nicks with T4 DNA ligase — the classical cloning workflow from the 1980s.
Practical issues to know: sticky-end self-ligation (fix with phosphatase treatment of the linearized vector); limited overhang vocabulary (each enzyme has one specific overhang); star activity (relaxed-specificity cutting at high glycerol or low salt — use HF variants); and methylation sensitivity (Dam/Dcm-blocked sites need a Dam⁻/Dcm⁻ host like JM110 or GM2163).
2.2 Type IIS restriction enzymes
The clever ones. Type IIS enzymes (BsaI, BsmBI/Esp3I, SapI, BbsI) recognize an asymmetric site but cut outside that site at a defined offset, leaving 4-nt overhangs of arbitrary sequence. BsaI’s recognition site is GGTCTC(N₁) with cleavage at N₁+4 on the top strand and N₁+8 on the bottom:
The recognition site is removed in the cut product. The 4 N’s of the overhang can be designed to be anything. Two consequences: custom overhangs (you specify which fragments anneal to which neighbors) and irreversible one-pot reactions (re-ligated parental plasmid still carries the site and gets re-cut, while assembled product is stable). This is what underwrites Golden Gate Assembly (§4).
2.3 PCR vs restriction digest in practice (worked answer)
Both methods produce linear dsDNA fragments, but they differ at almost every protocol step and serve different use cases:
| Feature | PCR | Restriction enzyme digest |
|---|---|---|
| Starting material | Any template (plasmid, genomic DNA, cDNA — even a few molecules) | Existing dsDNA construct, typically a plasmid |
| Defines fragment by | Primer position — anywhere on the template | Recognition site position — fixed by the enzyme |
| Product yield | Exponential amplification (1 → ~10⁹ copies) | Stoichiometric (1 → 1 per input molecule) |
| End chemistry | Blunt by default; engineered 5′ overhangs added via primer extensions | The enzyme’s specific overhang (sticky or blunt) |
| Mutation introduction | Trivial — encode in the primer | Requires installing a new restriction site first |
| Sequence fidelity | Polymerase error rate (~4.4 × 10⁻⁷ per base for Phusion) | Faithful — original sequence preserved |
| Time | ~1–2 hours per cycling run | ~30 min – 2 hours per digest |
| Common failure modes | Primer dimers, no product, smear | Star activity, methylation blocking, incomplete digestion |
When PCR is preferable: building a fragment with arbitrary 5′ extensions for downstream Gibson or Golden Gate; introducing point mutations or insertions/deletions via primer design; amplifying from low-copy templates (genomic DNA, cDNA, environmental samples); generating multiple variants in parallel from a common template.
When restriction digest is preferable: recovering an intact fragment from an existing plasmid where you trust the sequence and can’t risk polymerase-introduced errors; subcloning very large fragments (> 10 kb) that PCR amplifies poorly; linearizing a vector for Gibson or ligation when you already have suitable restriction sites in place; preserving methylation status or other DNA modifications.
The hybrid in modern practice. Most cloning workflows combine both: PCR-amplify the insert with engineered overlaps; restriction-digest the backbone. PCR gives you any fragment you want with arbitrary ends; restriction gives you a clean, mutation-free backbone in high yield. For Gibson assembly specifically, PCR-for-inserts + RE-digested-backbone is the standard pattern.
Key takeaway — restriction enzymes. Type II enzymes are the classical cutters with palindromic sites and fixed overhangs. Type IIS enzymes (BsaI, BsmBI) cut outside their recognition sites, giving you arbitrary 4-nt overhangs — the foundation of Golden Gate Assembly.
3. Gibson Assembly
In 2009, Daniel Gibson at the J. Craig Venter Institute published a one-pot, isothermal DNA assembly method that made multi-fragment cloning routine. The motivation was JCVI’s effort to chemically synthesize the Mycoplasma mycoides genome (~1 Mb) — they needed efficient assembly of many overlapping fragments. The same chemistry now underpins most modern molecular cloning.
3.1 The three-enzyme cocktail
A Gibson reaction contains three enzymes operating simultaneously at 50 °C for 15–60 minutes:
flowchart LR
    A[Fragments with<br/>15–40 bp overlaps] --> B[T5 exonuclease<br/>chews back 5′ ends]
    B --> C[3′ ssDNA overhangs<br/>anneal]
    C --> D[Phusion<br/>fills in gaps]
    D --> E[Taq ligase<br/>seals nicks]
E --> F[Seamless<br/>assembled product]- T5 exonuclease — chews back DNA from 5′ ends, exposing single-stranded 3′ overhangs on each fragment.
- Phusion polymerase — fills in any gaps after complementary overhangs anneal.
- Taq DNA ligase — seals the remaining nicks at the joint.
T5 exonuclease is heat-labile, so its activity decreases over the reaction time, allowing the polymerase and ligase to take over and finalize the joints. The result is seamless joints — no scar, no leftover restriction sites, just continuous dsDNA.
Critical reagent caveat. T5 exonuclease activity drops sharply with freeze-thaw. Use a fresh aliquot of Gibson Master Mix within ~24 h of thawing, or pre-aliquot small volumes to single-use tubes. This is the most common silent cause of Gibson failure.
3.2 How it works mechanistically
Each fragment is designed to share 15–40 bp of homology with its neighbors. T5 exo chews the 5′ ends back, exposing complementary 3′ ssDNA tails. The tails anneal. Phusion fills in any gaps. Taq ligase seals the nicks.
Overlap design rules: 15–25 bp is standard for ~50% GC; 30–40 bp for high-GC overlaps that need more thermodynamic strength. Avoid hairpins or repeats in the overlap sequence — they mis-anneal. Match Tm of adjacent overlaps to ~60 °C for clean assembly. Tools like NEBuilder Assembly Tool and Benchling’s Gibson primer designer automate this.
3.3 Why Gibson is the modern default
- Multi-fragment, one-pot. Up to 5–6 fragments routinely; up to 15+ with optimization.
- No scars. Seamless joints mean any sequence can be the joint.
- No restriction-site constraints. You don’t need to find unique cutters in the right places.
- Predictable. With overlaps designed properly, reactions are high-efficiency.
3.4 Ensuring Gibson-readiness — a pre-flight checklist (worked answer)
Gibson is unforgiving of upstream sloppiness. The single most useful artifact is a checklist organized by stage.
Sequence design
- Overlaps are 15–40 bp between adjacent fragments (15–25 bp for ~50% GC; 30–40 bp for high-GC).
- Overlap Tm ~60 °C, matched across all junctions.
- No hairpins or repeats within the overlap sequence — verify with NEBuilder, Benchling, or Primer3.
- No unintended internal homology between non-adjacent fragments — would cause scrambled assemblies.
- Designed in an assembly-aware tool (NEBuilder Assembly Tool, Benchling Gibson designer).
PCR product quality
- Single clean band on a 1% agarose gel — no smear, no dimers, no extra bands.
- Negative no-template control (NTC) — no contamination.
- DpnI-digested if amplified from a circular plasmid template (37 °C, 1 h, then heat-inactivate at 80 °C). DpnI cuts only methylated G(m⁶)ATC, destroying parental plasmid carryover.
- Gel-purified or column-purified to remove primer dimers, unincorporated primers, and dNTPs.
- Sanger-sequenced if the fragment is novel or has been mutated, to confirm no polymerase errors before assembly.
Backbone digest quality (for the linearized vector)
- Complete digestion — no residual circular plasmid (run a small aliquot on gel; uncut shows as supercoiled/nicked bands, fully cut as a single linear band).
- Phosphatase-treated if using a single restriction site (CIP, rSAP, or Antarctic phosphatase) to prevent vector self-ligation.
- Gel-purified to remove any excised fragment and residual undigested vector.
Quantity and stoichiometry
- Quantified by Nanodrop or Qubit (Qubit is more accurate at low concentration).
- Fragments at equimolar ratio in the assembly reaction. Compute molarity from
concentration ÷ fragment length × Avogadro— don’t go by nanogram amounts alone. - Total DNA 50–100 ng per 20 µL Gibson reaction. More usually doesn’t help; less risks insufficient encounter rate.
Reaction setup
- Fresh Gibson Master Mix — T5 exonuclease activity drops with freeze-thaw. Use within 24 h of thawing, or aliquot.
- Reaction at 50 °C, 15–60 min depending on number of fragments (longer for more complex assemblies).
- Transform a small aliquot (1–2 µL into 50 µL competent cells) — too much DNA can saturate cells or carry over inhibitors.
Sanity checks before transformation
- Run 2–3 µL of the assembled reaction on a gel — for simple 2-fragment assemblies you should see a band at the expected combined size.
- Plate a no-DNA negative control transformation alongside the experimental, to detect competent-cell contamination.
Key takeaway — Gibson. Three enzymes, one tube, 50 °C, 15–60 min. The chemistry is robust; the failures are upstream — bad primers, undigested parental plasmid, or unequal molar ratios. The §3.4 checklist catches all of them.
4. Golden Gate Assembly
In 2008, Carola Engler and Sylvestre Marillonnet at the Institute of Plant Biochemistry (Halle, Germany) published Golden Gate Assembly — a one-pot, scarless cloning method that exploits Type IIS restriction enzymes for fragment-order control. It’s the most-used alternative to Gibson today, particularly for plant and modular synthetic biology, where the MoClo hierarchical extension dominates.
4.1 The mechanism
A Golden Gate reaction contains, in one tube, at one temperature (37 °C, ~1–2 h):
- Type IIS enzyme (typically BsaI, BsmBI/Esp3I, or SapI).
- T4 DNA ligase + ATP.
- Your fragments, each flanked by Type IIS recognition sites that point inward.
The enzyme cuts each fragment at its designed offset, removing the recognition site and exposing a 4-nt sticky end that you specified at the design stage. The ligase joins fragments whose overhangs are complementary. Both reactions run continuously and in parallel.
4.2 The reaction-loop trick
Because the recognition site is removed in the cut product, the assembled fragment cannot be re-cut. But any re-ligated parental plasmid still carries the recognition site, so the enzyme cuts it again. The reaction therefore drives toward the assembled product irreversibly. Running the reaction longer increases yield rather than damaging it — a feature distinctive to this assembly method.
flowchart LR
    A[Parental plasmid<br/>+ Insert + BsaI + Ligase] --> B[BsaI cuts<br/>removes recognition site]
    B --> C[4-nt overhangs<br/>exposed]
    C --> D{Ligation}
    D -->|matching overhangs| E[Assembled product<br/>no BsaI site → stable]
    D -->|parental re-circularizes| F[Still has BsaI site<br/>→ re-cut → recycled]
    F --> B
4.3 Overhang design
The 4-nt overhang is whatever you specify in the primer or synthesized fragment. Theoretically there are 4⁴ = 256 distinct 4-nt sequences. In practice, you want overhangs with high Hamming distance (≥ 2 differences between any two overhangs in the assembly) to prevent mis-pairing. Standard MoClo libraries provide curated overhang sets — typically 12–20 orthogonal overhangs that have been wet-lab-validated to assemble cleanly together.
4.4 Hierarchical assembly — MoClo and Loop
The same chemistry scales with alternating enzymes. MoClo (Weber et al. 2011) and Loop assembly (Pollak et al. 2019) cycle BsaI and BsmBI/Esp3I:
- Level 0: parts (promoters, CDSs, terminators) flanked by BsaI sites in BsmBI-flanked vectors.
- Level 1: BsaI assembles parts into transcription units; the new TU is flanked by BsmBI sites in a BsaI-flanked vector.
- Level 2: BsmBI assembles TUs into multi-gene constructs.
Multi-gene plasmids of 5–10 transcription units assemble in a few cycles of these reactions — orders of magnitude faster than equivalent Gibson assemblies at the same complexity.
4.5 Worked alternative-method writeup (Q6)
The Week 6 homework asks for a 5–7 sentence description of an alternative assembly method, plus a schematic and a Benchling/Asimov Kernel model. Golden Gate is the natural choice. Here’s the writeup:
- Golden Gate Assembly is a one-pot DNA cloning method developed by Engler and Marillonnet (2008) that uses Type IIS restriction enzymes to assemble multiple fragments scarlessly in a single reaction.
- Type IIS enzymes (BsaI, BsmBI/Esp3I, SapI) recognize an asymmetric site and cut outside that site at a defined offset, producing 4-nt sticky overhangs whose sequences the user designs in the fragment ends.
- The reaction tube contains the Type IIS enzyme, T4 DNA ligase, ATP, and the fragments — all at 37 °C — so cutting and ligation occur simultaneously, with the recognition site removed from each cut product.
- Because each fragment’s overhang is custom-specified, the user controls the order and orientation of assembly: only fragments with matching overhangs anneal, and unwanted combinations are physically forbidden.
- The reaction is irreversible because re-ligated parental plasmid still carries the recognition site and gets re-cut by the enzyme, while the assembled product no longer contains the site and is stable.
- Compared to Gibson, Golden Gate excels at multi-fragment (10+) directional assembly, hierarchical schemes (MoClo, Loop), and standardized parts libraries; the main constraint is domestication — removing internal copies of the Type IIS recognition sequence from each fragment before assembly.
Schematic
Benchling / Asimov Kernel model
In Benchling: open the Assembly Wizard → choose “Golden Gate” or “Type IIS” assembly mode. Add 2–3 fragments with BsaI flanking sequences and custom 4-nt overhangs designed for orthogonality (e.g., overhangs from the MoClo standard set: GGAG, AATG, GCTT, CGCT). Run the assembly simulation; verify the predicted product matches the intended sequence. Export the rendered glyph and the assembly trace for inclusion in the Notebook entry.
In Asimov Kernel: open a new Construct in your Repository. Drag in three Type IIS-flanked parts from the Characterized Bacterial Parts repo (or any compatible set). Use the assembly preview to verify directional ligation and confirm no internal BsaI sites in the parts. Save the Construct + the assembly graph to the Notebook. The simulated product should be a single, scarless plasmid with the three parts joined in the order specified by the overhangs. Mis-pairing or internal-site issues will show up as failed-assembly warnings in either tool.
4.6 When Golden Gate beats Gibson (and vice versa)
| Golden Gate / MoClo | Gibson | |
|---|---|---|
| Multi-fragment scaling | Excellent (10+ fragments routine) | Good up to 5–6, harder beyond |
| Scarless | Yes (recognition site removed) | Yes (no scar at all) |
| Sequence constraints | Internal Type IIS sites must be removed (“domestication”) | None |
| Library compatibility | Strong (MoClo, Loop, OpenMTA) | Weaker |
| Best for | Standardized parts assembly, multi-gene synbio | Ad-hoc cloning, novel sequences |
Key takeaway — Golden Gate. Type IIS enzymes give you arbitrary 4-nt sticky overhangs and a self-driving assembly reaction. Excellent for ≥10-fragment, multi-level, library-friendly synthetic biology. The price is upfront effort: domesticate your parts first.
5. E. coli transformation — getting DNA into cells
After you’ve assembled your construct, you need to get it into a cell where it can replicate, express, and be selected. E. coli is the workhorse host because it grows fast, takes up DNA readily (with help), and has a century of genetic toolkit behind it.
The challenge: E. coli has a complex envelope — outer membrane with lipopolysaccharide (LPS), periplasm, peptidoglycan cell wall, and cytoplasmic membrane. Plasmid DNA is ~10 kbp of negatively-charged duplex; it doesn’t cross any of those layers passively. Two methods overcome this barrier.
5.1 Chemical transformation (CaCl₂ + heat shock)
Cells are pre-treated with cold CaCl₂. Ca²⁺ ions neutralize electrostatic repulsion between the phosphate backbone of the plasmid and the negatively-charged LPS, allowing DNA to associate with the cell surface; the cold rigidifies the lipid bilayer. A brief heat shock at 42 °C for 30 seconds is then thought to perturb the bilayer enough to create transient pores through which DNA enters. Returning to ice re-seals the membrane. The precise molecular details of the heat-shock step remain incompletely characterized — proposed contributions include LPS rearrangement, periplasmic Ca²⁺–DNA complex formation, and active uptake via outer-membrane porins (OmpC, OmpF).
→ Verified protocols: NEB High-Efficiency Transformation Protocol (C2987H/I) · NEB Chemical Transformation Tips · Addgene Bacterial Transformation Protocol
5.2 Electroporation
A microsecond high-voltage pulse (1.8–2.5 kV across a 1–2 mm gap) polarizes the membrane beyond its dielectric breakdown threshold, creating transient electropores. DNA migrates electrophoretically through these pores during and immediately after the pulse. Once the field is removed, the bilayer re-seals on a millisecond timescale.
→ Verified protocols: NEB Electroporation Protocol (C3020) · NEB Electroporation Tips · High Efficiency Transformation Protocol — NEB 10-beta
Time-critical step. Add recovery medium (SOC) to the cuvette immediately after the pulse. A one-minute delay can cause a ~3× drop in transformation efficiency (per NEB). Have the SOC pre-warmed and within arm’s reach before pulsing.
5.3 After uptake — recovery and selection
The cell needs ~1 hour of recovery in non-selective rich medium (LB or SOC at 37 °C) to (a) re-seal the envelope, (b) express the antibiotic-resistance gene encoded on the plasmid (typically AmpR, KanR, CmR, or TetR), and (c) begin replication. Plating directly on selective antibiotic without recovery kills successful transformants before they can produce enough resistance protein. Surviving colonies on the selective plate carry the plasmid (with some background from re-circularized vector — hence the controls in the §3.4 Gibson checklist).
5.4 Comparison — chemical vs electroporation
| Chemical (CaCl₂ + heat shock) | Electroporation | |
|---|---|---|
| Mechanism | Heat-shock-induced transient pores; Ca²⁺-mediated DNA–membrane association | High-voltage pulse → dielectric breakdown → electropores |
| Efficiency | 10⁵–10⁹ CFU per μg supercoiled plasmid | 10⁹–10¹⁰ CFU per μg |
| Equipment | 42 °C heat block + ice bucket — standard lab kit | Electroporator (~$1,000–3,000 capital) + chilled cuvettes (1–2 mm gap, ~$1–2 each) |
| Cell cost (commercial) | ~$3–6 per reaction (NEB DH5α / 5-alpha) | ~$5–10 per reaction (NEB 10-beta / 5-alpha electrocompetent) |
| DIY-prep option | Easy — CaCl₂ buffer + minimal equipment | More demanding — multiple low-salt wash steps; higher prep failure rate |
| DNA prep tolerance | Tolerates standard miniprep DNA; some salt OK | Must be in water or low-salt TE — high salt arcs the cuvette |
| Time per reaction | ~1.5–2 hours including recovery | ~1.5–2 hours including recovery |
| Best for | Routine cloning, sub-cloning, classroom / teaching | Large libraries, low-yield assemblies, hard-to-transform strains |
| Common pitfalls | Old cells (efficiency drops with freeze-thaw); wrong heat-shock timing | Salt arcing in cuvette; delayed recovery (1 min delay = ~3× efficiency loss, per NEB) |
Key takeaway — transformation. Chemical for routine work, electroporation when you need maximum efficiency. Both require a 1-hour antibiotic-free recovery before plating, and both punish stale cells.
6. Pitfalls, controls, and how to know it worked
A unified failure-mode catalog for the workflow:
- Smeared PCR product. Lower template, raise annealing T, shorten extension.
- NTC band positive. Reagent contamination — replace primers/water/Master Mix.
- Primer dimers visible. Hot-start polymerase, redesign primers, raise annealing T.
- Gibson returns no colonies. Verify (1) DpnI was added to PCR products; (2) overlaps are correct; (3) competent cells are fresh; (4) molar ratios are equimolar.
- All colonies carry empty backbone. Linearized backbone wasn’t gel-purified away from undigested circular parental, or phosphatase wasn’t applied to a single-enzyme-cut vector (whose self-compatible overhangs let it re-circularize without insert).
- No transformation colonies at all. Old competent cells (efficiency drops with freeze-thaw); wrong heat-shock timing; antibiotic plate too old.
- Mixed colonies on plate. Cross-contamination between transformations or reagents.
- Sequencing reveals point mutations. Polymerase error during PCR; switch to a higher-fidelity polymerase or sequence multiple clones to find a clean one.
The single most useful sanity check across the whole pipeline is the gel — at every step where DNA is generated or modified, run a small aliquot on agarose. Most failures are visible long before transformation if you look.
7. Recommended reading — 4 key papers
- Gibson, D. G. et al. (2009). Enzymatic assembly of DNA molecules up to several hundred kilobases. Nat Methods 6: 343–345. — The foundational Gibson Assembly paper, describing the T5 exo + Phusion + Taq ligase one-pot reaction.
- Engler, C., Kandzia, R., Marillonnet, S. (2008). A one pot, one step, precision cloning method with high throughput capability. PLoS ONE 3: e3647. — Golden Gate Assembly — the answer to Q6 of this week’s homework. Read for the elegant use of Type IIS enzymes.
- Elowitz, M. B. & Leibler, S. (2000). A synthetic oscillatory network of transcriptional regulators. Nature 403: 335–338. — The Repressilator — the canonical demonstration that genetic circuits can implement temporal logic. Key reference for the Asimov Kernel build assignment in Part 2.
- Gardner, T. S., Cantor, C. R., Collins, J. J. (2000). Construction of a genetic toggle switch in Escherichia coli. Nature 403: 339–342. — Companion paper to the Repressilator, same issue. The bistable switch — the second canonical genetic-circuit primitive.
8. Course resources & recordings
- Lecture recording (Densmore & Haddock, Mar 10)
- Recitation recording (Perry & Donovan, Mar 11)
- Recitation slides
- Lab page: Gibson Assembly
Part 2 — Asimov Kernel: building genetic circuits computationally
A topic guide on computational genetic-circuit design using Asimov Kernel. Covers the EDA approach to synthetic biology, the four canonical circuit motifs (Repressilator, toggle switch, feed-forward loop, AND gate), and the practical lessons that emerge when you try to build them in a real simulator — including what happens when the parts library lets you down.
9. Why simulate circuits before building them?
Circuits are parametrically fragile — small changes in promoter strength, repressor cooperativity, or copy number can qualitatively change behavior. Iterating through the design space at the bench is slow and expensive (rough order-of-magnitude figures, Twist Bioscience standard gene synthesis ~$0.07–0.10/bp [UNVERIFIED — 2026 pricing not directly confirmed]):
| Iteration step | Wet-lab cost | Computational |
|---|---|---|
| Build a new design | $50–250 DNA + ~1 week | Minutes |
| Measure dynamics | $50–100 + ~1 day | Seconds |
| 10 design iterations | ~$1,500 + ~10 weeks | ~1 hour |
EDA tools like Asimov Kernel (commercial), Cello (Nielsen et al. 2016 Science 352:aac7341), and iBioSim (academic) let you predict which designs will oscillate, be bistable, or silently fail — before ordering a single oligo. Important caveat: EDA collapses the design-space exploration loop dramatically, but the build-and-validate wet-lab step remains. The same revolution that transformed semiconductor design between 1980 and 2000 is now reshaping synthetic biology.
Key takeaway. Simulate first to find the working parameter regime; then build only the designs the simulator predicts will work.
10. Asimov Kernel and the EDA approach
Asimov Kernel is a cloud-based genetic-circuit design environment built around three core abstractions:
- Characterized Bacterial Parts (CBP) — a curated library of promoters, RBSs, CDSs, and terminators with measured biophysical parameters (promoter strength, RBS efficiency, repressor binding affinity, degradation rate). The “characterized” qualifier is the key — these aren’t just sequences, they come with quantitative parameters wired into the simulator.
- Constructs — the user-facing DNA design canvas. Drag parts onto a track to build a transcription unit; Kernel automatically infers regulatory connections from part metadata (e.g., “this promoter is repressed by TetR; this CDS encodes TetR; ring closed”).
- Simulator — both deterministic ODE and stochastic SSA modes. Solves the regulatory network’s dynamic equations using the CBP-calibrated parameters. Outputs time-course traces of every species in the design plus RNAP flux at each transcription unit. The platform also provides Bacterial Demos, a library of reference circuits (Repressilator, toggle switch, FFLs) — used both as design templates and as ground-truth comparisons for student designs.
Asimov Kernel vs Cello vs iBioSim
| Tool | Strength | Limitation |
|---|---|---|
| Asimov Kernel | User-friendly graphical interface; fast simulation; commercial support | CBP library is narrow on combinatorial/hybrid promoters |
| Cello (Nielsen 2016) | Characterized NOR-gate library (~12–20 in original paper, expanded in subsequent work) for compositional logic design | Higher learning curve; design-by-compilation rather than drag-and-drop |
| iBioSim (Myers lab, Univ. Utah) | Open-source, SBOL-compliant, supports broad model classes | Less polished UX; smaller community |
For this week’s assignment we used Kernel because it ships with the Bacterial Demos reference Repressilator — direct comparability with our recreated build was the pedagogical point.
11. The Repressilator — recreation and the parts-library lesson
The Repressilator (Elowitz & Leibler 2000, Nature 403:335) is the canonical oscillating genetic circuit. Three repressors arranged in a ring of mutual inhibition produce sustained limit-cycle oscillations in repressor concentrations.
Circuit topology
flowchart LR
    TetR -.->|represses| LacI
    LacI -.->|represses| LambdaCI
    LambdaCI -.->|represses| TetR
    TetR -. "(closes ring)" .-> LacI
Three transcription units, each of the form [Promoter repressed by X] → [RBS] → [CDS = Y] → [Terminator], wired so that each repressor’s gene is downstream of the previous repressor’s binding site. The odd number of inversions (three) prevents any single stable fixed point and forces the system into a limit cycle.
The build — final working configuration
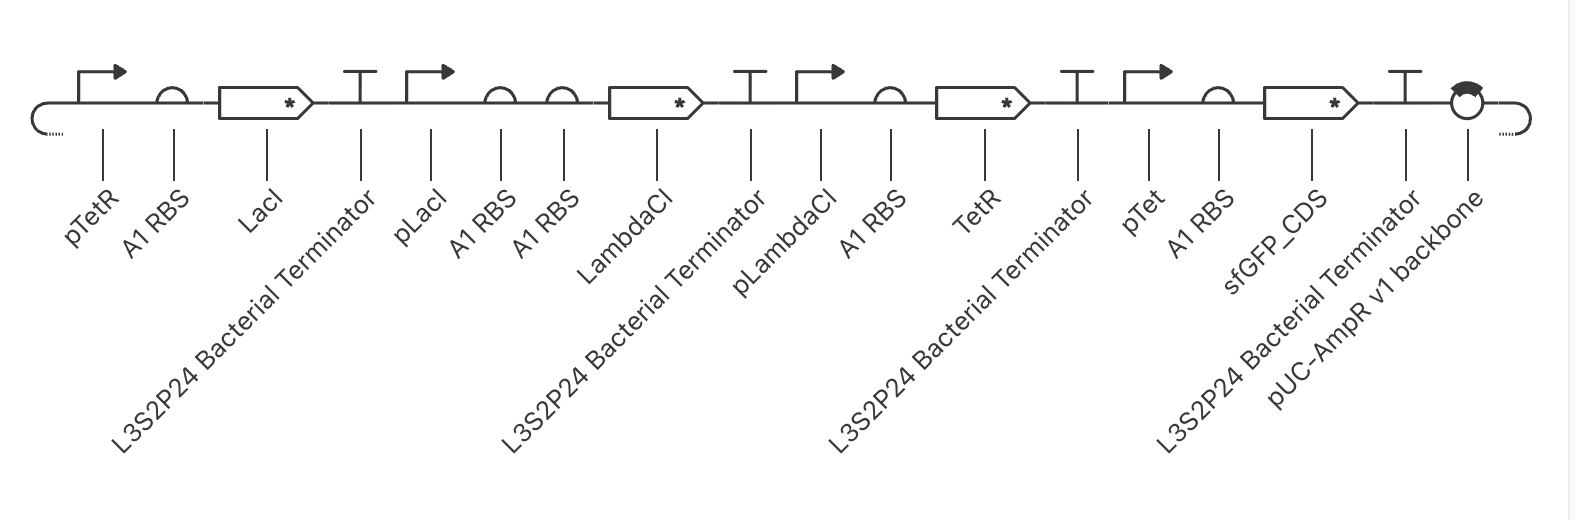
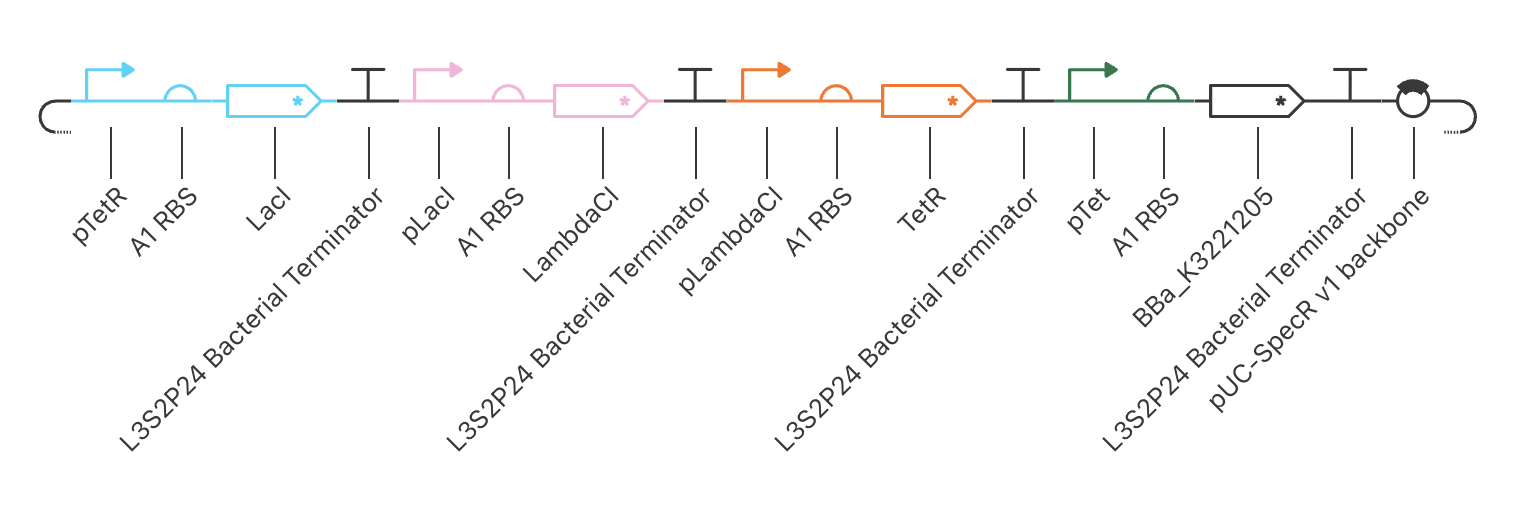
| TU | Promoter | RBS | CDS | Terminator |
|---|---|---|---|---|
| 1 | pTetR (CBP) | A1 | LacI* | L3S2P24 |
| 2 | pLacI (CBP) | A1 | LambdaCI* | L3S2P24 |
| 3 | pLambdaCI (CBP) | A1 | TetR* | L3S2P24 |
| 4 (reporter) | pTet (CBP) | A1 | BBa_K3221205 | L3S2P24 |
Backbone: pUC-SpecR v1. Asterisks denote ssrA/LVA degradation-tagged CDS variants — required so that protein half-life is short enough (~10 min) to support oscillatory dynamics.
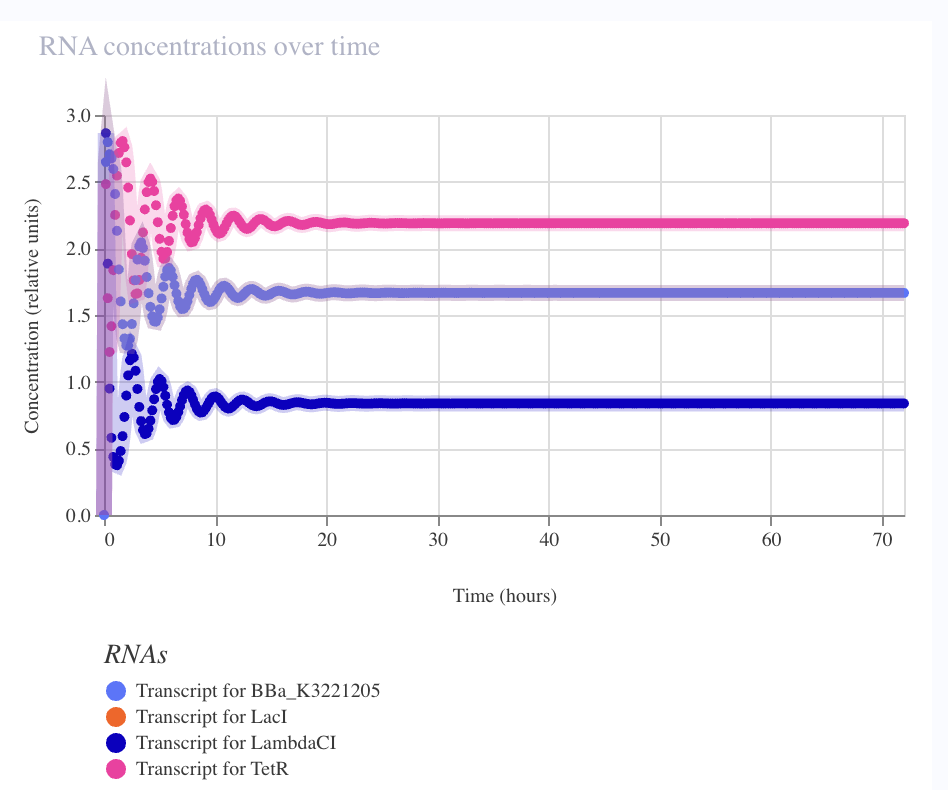
Result — sustained limit cycle
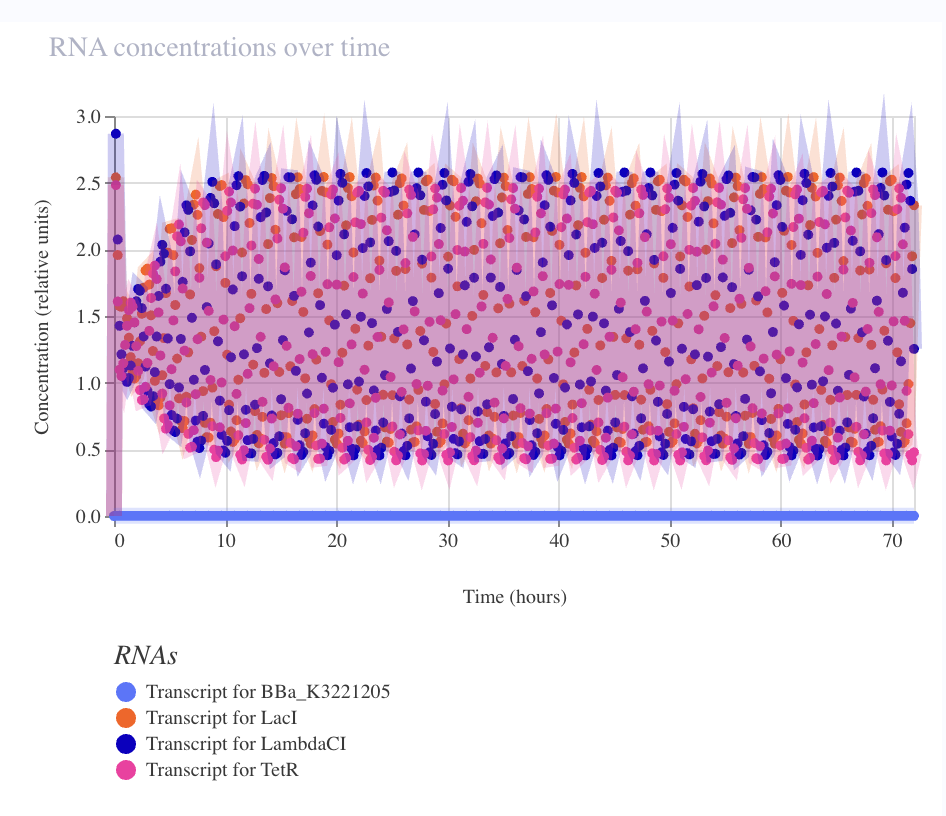
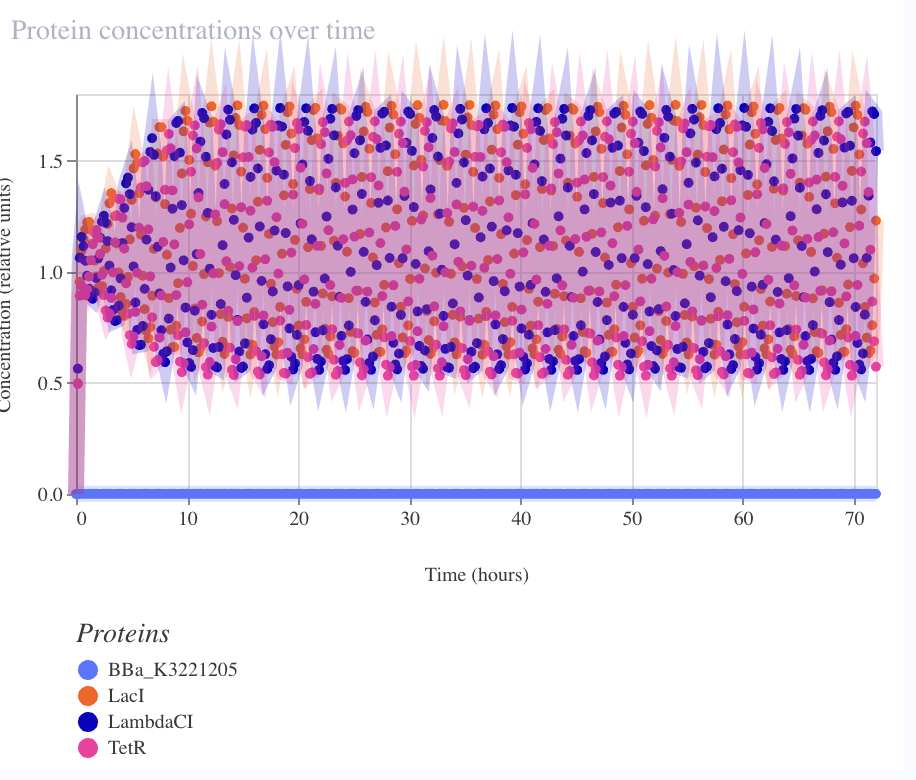
| Metric | Observed | Elowitz wet-lab |
|---|---|---|
| Period | ~2–3 h | ~150 min |
| Amplitude (RNA) | ~5× fold-change | — |
| Amplitude (protein) | ~3.5× fold-change | ~3–10× single-cell |
| Sustained over 72 h | ✅ no damping | — |
The debug story — seven iterations to oscillation
The first six builds collapsed to the same TetR-dominant stable fixed point. Each iteration ruled out one parameter:
| Iter | Change tested | Result | What it ruled out |
|---|---|---|---|
| 1 | H1 RBS, no backbone | Stable fixed point | — (baseline) |
| 2 | Stronger A1 RBS | Stable | Production rate |
| 3 | Add pUC-SpecR backbone | Stable | Backbone presence |
| 4 | Switch to low-copy backbone | Stable | Copy-number scaling |
| 5 | Swap reporter pTetR → pTet (fix TetR load) | Stable | Single-locus titration |
| 6 | Swap reporter CDS to BBa_K3221205 | Stable | Reporter CDS choice |
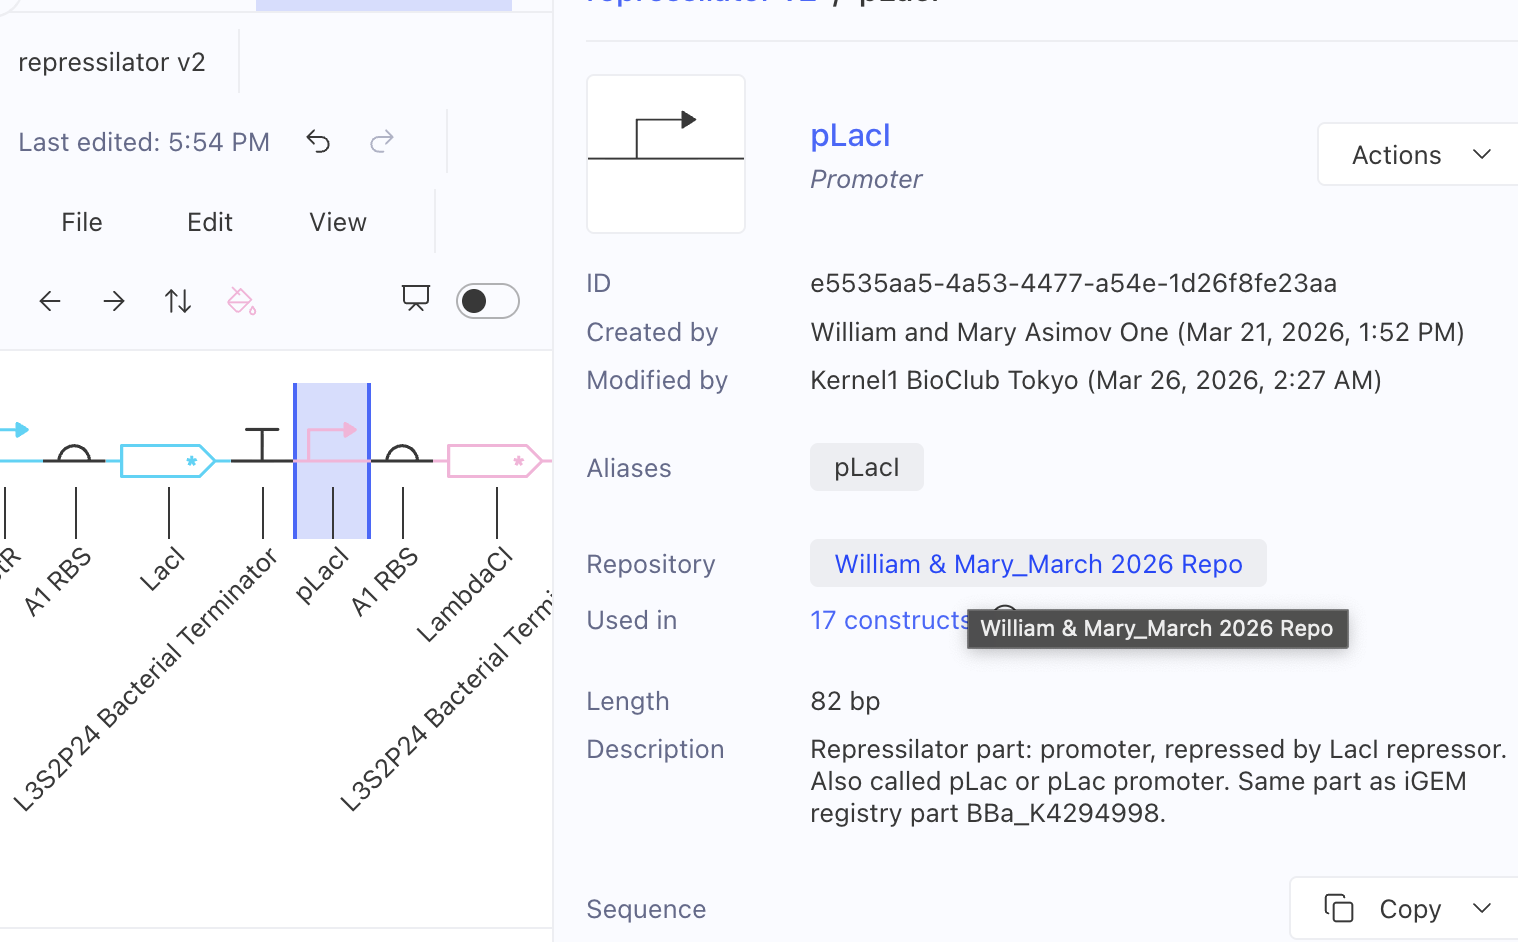
| 7 | Swap pLacI from W&M repo → CBP canonical | ✅ Limit cycle | Hill coefficient (root cause) |
The W&M pLacI was likely wild-type E. coli pLac (one weak operator, Hill ~1). The CBP canonical pLacI is PLlacO-1 (Lutz & Bujard 1997 Nucleic Acids Res 25:1203) — two symmetric lac operators, Hill ≥ 2. Cooperativity was the binding constraint, not RBS strength or copy number.
Key takeaway — part-library hygiene. Parts with identical names in different repositories can have wildly different Hill coefficients. Always check repository source and operator architecture.
Bonus experiment — retroactivity directly observed
Swapping the reporter promoter pTet → pTetR rescued reporter visibility but damped the oscillator to a stable fixed point within ~15 h:
| Reporter promoter | Oscillation | Reporter readout |
|---|---|---|
| pTet (lower TetR affinity) | ✅ Sustained limit cycle | ❌ Flat at 0 (over-repressed) |
| pTetR (higher TetR affinity) | ⚠️ Damps to fixed point in ~15 h | ✅ Visible at ~1.7 |
The high-affinity reporter sequesters TetR from the oscillator’s free pool — a textbook demonstration of retroactivity (Del Vecchio, Ninfa & Sontag 2008 Mol Syst Biol 4:161).
Key takeaway — modules aren’t modular. Adding a “passive” reporter can break a working circuit via molecular titration. Standard fix: put reporters on a separate plasmid (as Elowitz did).
12. Toggle switch — bistability with caveats
The genetic toggle switch (Gardner, Cantor & Collins 2000, Nature 403:339, same issue as the Repressilator) is the bistable companion to the Repressilator. Two repressors in mutual repression. Even number of inversions (two) means no oscillation — instead, two stable steady states separated by an unstable saddle.
Topology and build
flowchart LR
    TetR -.->|represses| LacI
    LacI -.->|represses| TetR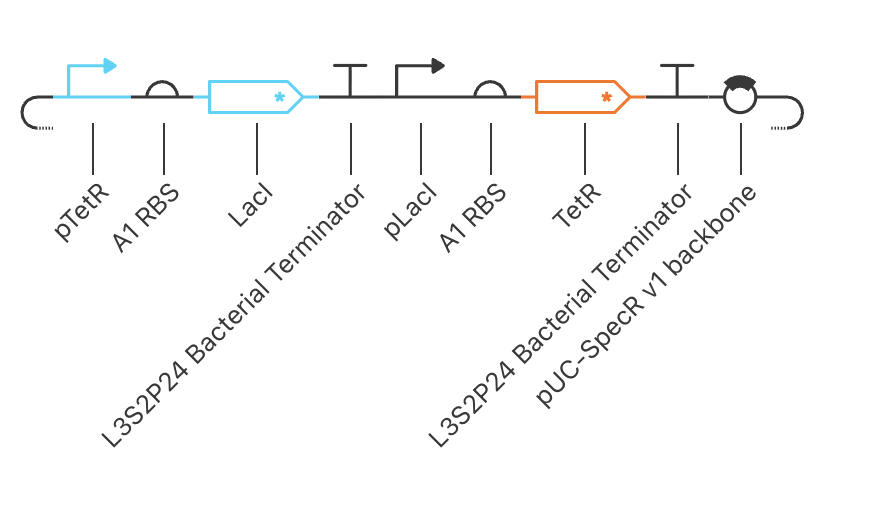
Two transcription units (TU#1: pTetR → A1 → LacI* → L3S2P24; TU#2: pLacI → A1 → TetR* → L3S2P24) on a pUC-SpecR backbone. Symmetric parts across both arms — same RBS, same terminator, both CDSs degradation-tagged.
Result — State B verified, State A inferred
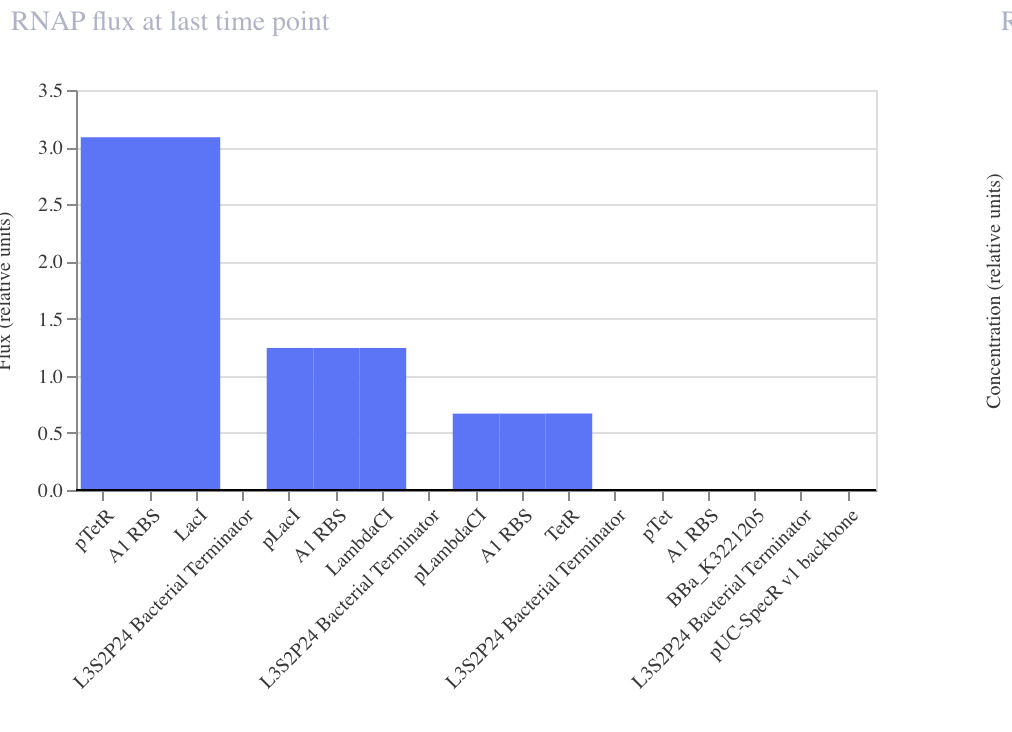
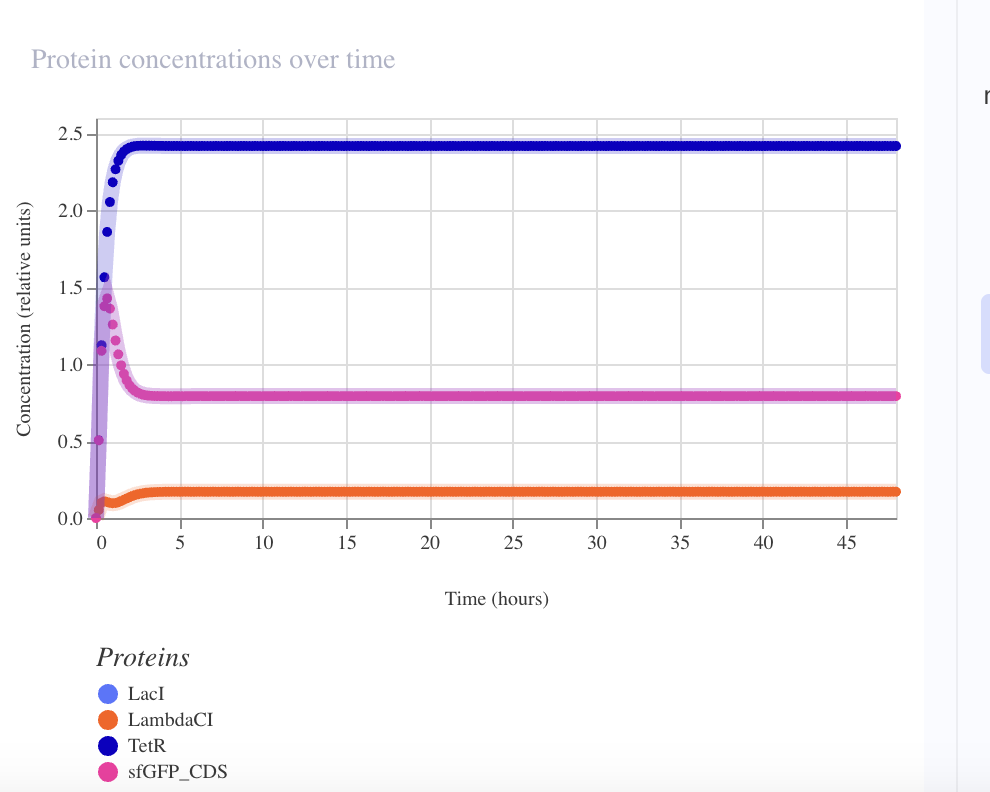
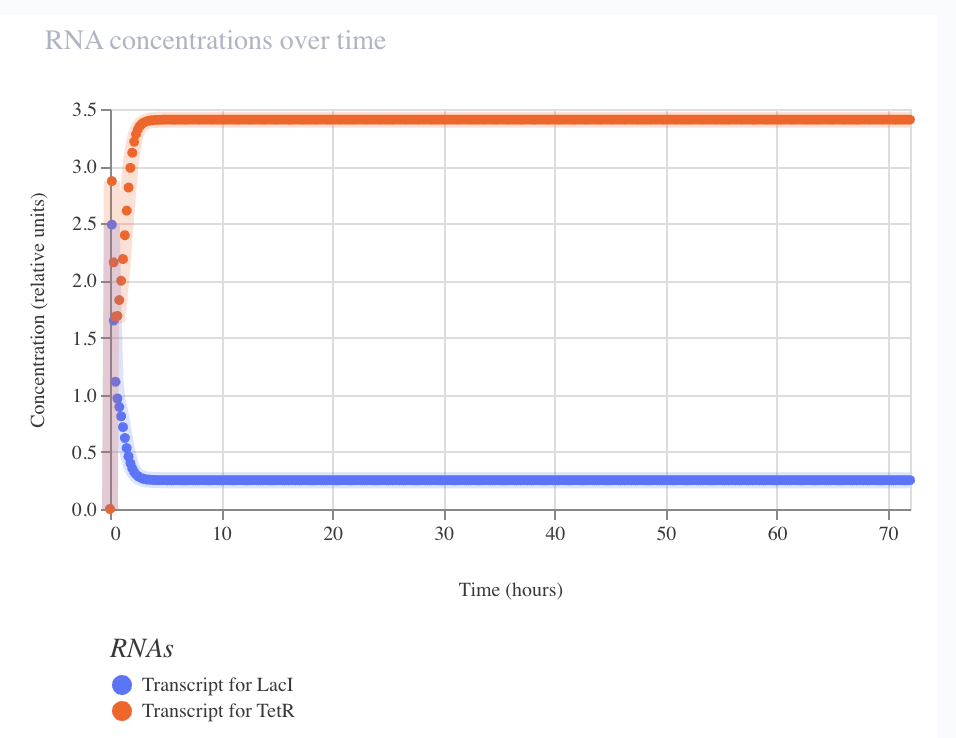 Baseline simulation collapsed to State B (TetR ≈ 2.7, LacI ≈ 0.2) by hour 5 and held stable across 72 h. Flux chart confirms strong asymmetry: pTetR flux 0.3 (heavily repressed), pLacI flux 4.25 (wide open). One attractor cleanly demonstrated.
The second stable state (State A: LacI-high, TetR-low) could not be directly shown in this Kernel build. Two bistability tests attempted:
| Test | Result | Why |
|---|---|---|
| Asymmetric initial conditions (LacI high, TetR zero at t=0) | Not possible | Kernel exposes only time-pointed ligand additions, not species ICs |
| aTc pulse (multiple doses + timings, including max aTc held from t=0) | No state change | Basin too deep for available aTc-TetR coupling to lift system over the saddle |
The toggle’s deep basin of attraction is a feature, not a bug — it’s what makes the circuit useful as biological memory. Wet-lab toggles often need 10–100 µM aTc to flip; Kernel’s calibration is conservative. Topology is correctly built and one attractor is verified; full bistability is inferred.
Key takeaway — simulator capabilities are part of the design problem. Knowing what your EDA tool can and cannot model is part of using it responsibly.
13. I1-FFL pulse generator — a negative result
The incoherent type-1 feed-forward loop (Mangan & Alon 2003 PNAS 100:11980) is the canonical pulse generator. One of the most overrepresented motifs in real bacterial gene-regulatory networks.
flowchart LR
    X([X input]) --activate--> Y
    X --activate--> Z
    Y -.->|represses| Z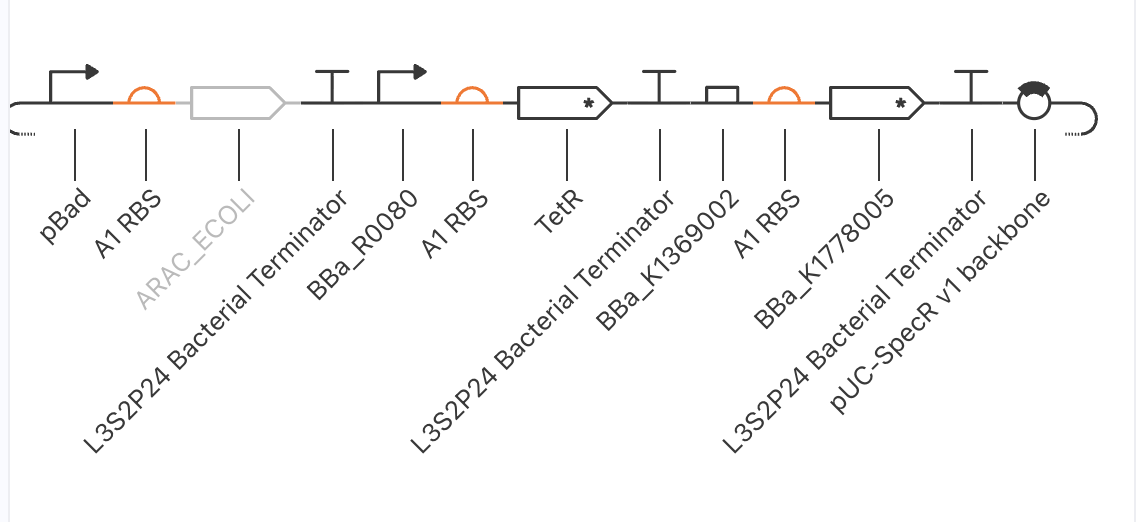
When X turns on: Z rises fast (direct activation), Y rises slower (one extra TX/TL step), then Y crosses threshold and represses Z back down. Z pulses on then off.
The crux: Z’s promoter must be combinatorial — simultaneously X-activated AND Y-repressed. Without hybrid regulation, the circuit collapses to a simple X → Y ⊣ Z cascade (sigmoidal inverter, no pulse).
Build attempt — dual failure
Attempted with pBad/AraC as X, TetR as Y, and BBa_K1369002 as the combinatorial promoter on Z.
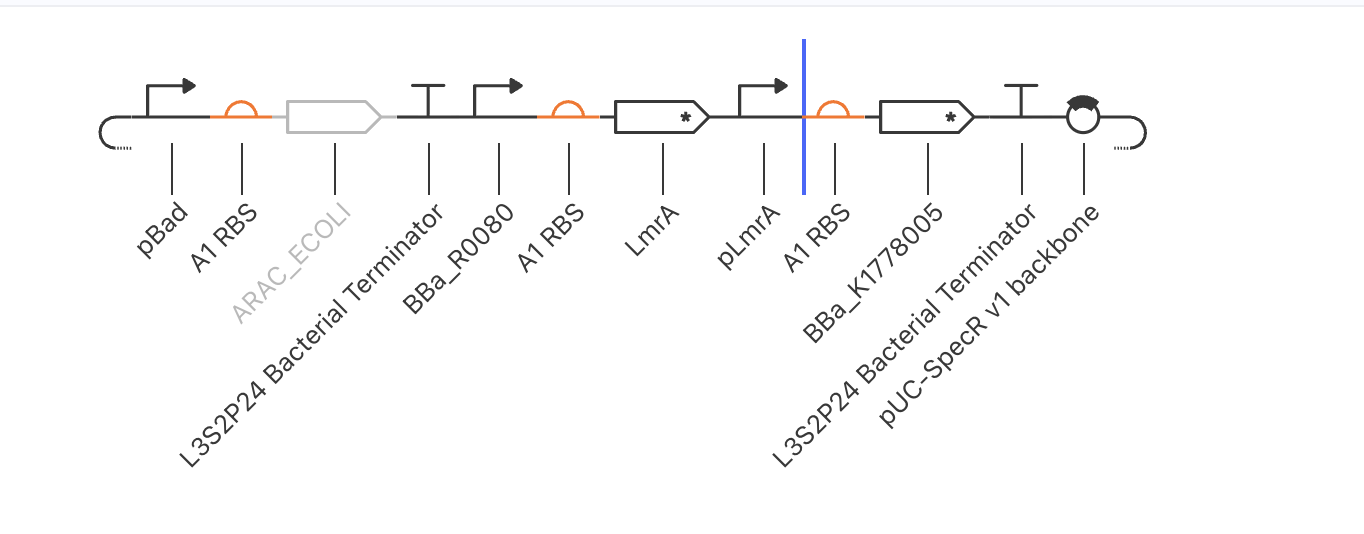
| Arm | Required | What happened |
|---|---|---|
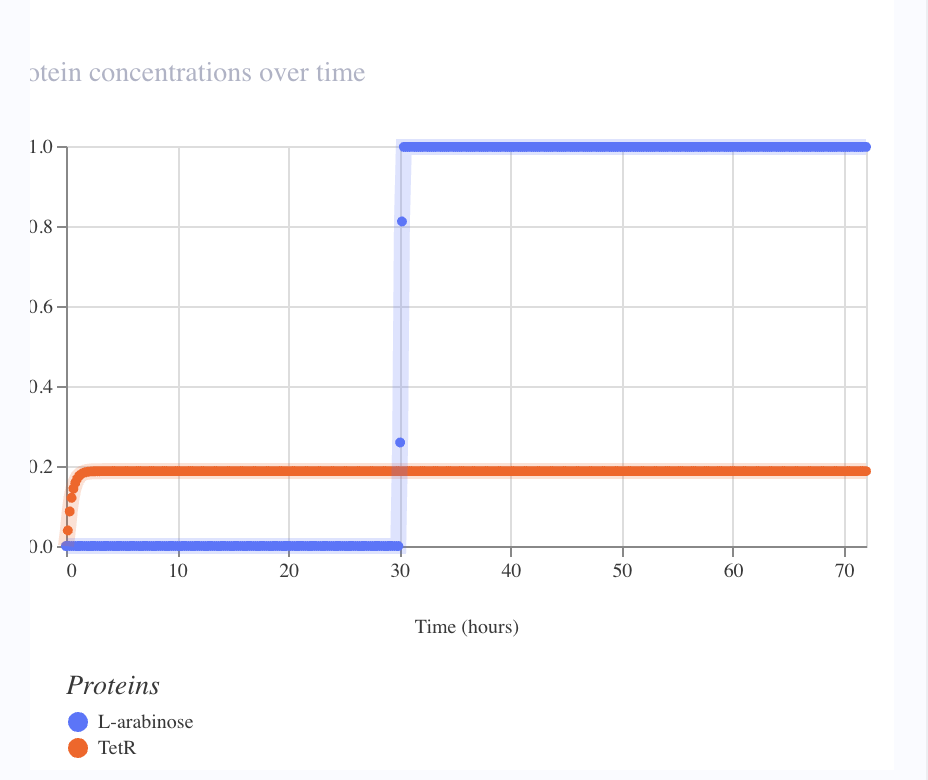
| X → Y | pBad-activated TetR | BBa_R0080 (confirmed AraC-regulated, all canonical pBad sites) wired correctly. Arabinose addition at t=30 h produced no change in TetR. Likely cause: Kernel doesn’t model the AraC-arabinose allosteric switch or the CRP-cAMP co-activator dependency. Part is correct; simulator’s induction model is missing. |
| X → Z | Combinatorial pBad + TetR-operator promoter | BBa_K1369002’s documentation was internally contradictory — title said “AraC + TetR operators,” body said “LacI + TetR operators.” Reporter remained at zero throughout, consistent with the latter interpretation (no AraC binding site). |
Key takeaway — CBP is rich for repressor-only circuits, lean on activator-based combinatorial promoters. The Repressilator and toggle switch both worked with canonical parts. The I1-FFL hit a parts-library limitation in two independent ways.
Practical alternatives for future I1-FFL work
- Domesticate hybrid promoters manually — synthesize pBad with a TetR operator inserted near the transcription start (Voigt and Anderson labs have published these; sequences not in CBP)
- Switch to Cello (Nielsen et al. 2016 Science 352:aac7341) — broader characterized logic-gate library
- Sigma-anti-sigma cascade (Anderson, Voigt & Arkin 2007 Mol Syst Biol 3:133) — combinatorial logic without hybrid promoters
Construct 4 (AND gate) — deferred
AND gates require two activators converging on one combinatorial promoter — same parts-library limitation with extra difficulty. Pursuing it would have replicated the I1-FFL lesson. Deferred to a future session with either domesticated hybrid promoters or Cello.
14. Design principles — six transferable lessons
| # | Principle | Where we saw it |
|---|---|---|
| 1 | Cooperativity > production rate. Hill coefficient at every node ≥ 2, or no limit cycle / bistability. Tune operator architecture before tuning RBS strength. | Repressilator iterations 1–6 (RBS changes did nothing); iteration 7 (pLacI variant with Hill ≥ 2 unlocked oscillation) |
| 2 | Build symmetrically first. Same RBS, terminator, backbone across functionally equivalent TUs. Tune asymmetry later. | Both Repressilator and toggle built symmetrically; worked first try once parts were right |
| 3 | Use canonical, well-characterized parts. Multiple parts in shared libraries can carry the same name with different sequences. Check the source repository. | The W&M vs CBP pLacI debacle — same name, qualitatively different Hill coefficient |
| 4 | Reporters are not passive. They can back-act on the circuit via molecular titration / retroactivity. Put reporters on separate plasmids when possible. | Repressilator bonus experiment: pTet → pTetR rescued reporter but damped the oscillator |
| 5 | Know your simulator’s limits. Kernel models repressor binding cleanly but apparently doesn’t model AraC-arabinose allosteric activation or aTc-TetR coupling beyond a certain regime. | Toggle (aTc couldn’t flip state); I1-FFL (arabinose didn’t activate pBad) |
| 6 | Document negative results. Failures point at constraints; successes hide them. | I1-FFL failure revealed CBP’s combinatorial-promoter sparsity; toggle’s flip-resistance taught basin-depth intuition |
15. Recommended reading — Part 2
- Elowitz, M. B. & Leibler, S. (2000). A synthetic oscillatory network of transcriptional regulators. Nature 403: 335–338. — The original Repressilator. The benchmark our recreated build was compared against.
- Gardner, T. S., Cantor, C. R. & Collins, J. J. (2000). Construction of a genetic toggle switch in Escherichia coli. Nature 403: 339–342. — The toggle switch, published in the same Nature issue. Bistability as biological memory.
- Del Vecchio, D., Ninfa, A. J. & Sontag, E. D. (2008). Modular cell biology: retroactivity and insulation. Mol Syst Biol 4: 161. — The theoretical framework for understanding why “passive” reporters break working circuits. Directly relevant to the Repressilator-reporter trade-off we observed.
- Nielsen, A. A. K., Der, B. S., Shin, J. et al. (2016). Genetic circuit design automation. Science 352: aac7341. — Cello, the most comprehensive characterized-parts EDA tool currently available. Directly relevant for students who hit Kernel’s parts-library limitations.
16. Course resources & links — Part 2
- Asimov Kernel — login portal [UNVERIFIED — confirm against course-issued credentials]
- Asimov Kernel documentation hub [UNVERIFIED]
- HTGAA Week 6 lab page (Asimov Kernel assignment) [UNVERIFIED — Jean to confirm against course site]
- Characterized Bacterial Parts (CBP) repository — accessible from within Kernel
- Bacterial Demos reference circuits — accessible from within Kernel
- Cello (alternative EDA tool): github.com/CIDARLAB/Cello-v2
- iBioSim (alternative EDA tool, open-source): github.com/MyersResearchGroup/iBioSim