Week 10 HW: ADVANCED IMAGING & MEASUREMENT TECHNOLOGY
Homework: Waters Part I — Molecular Weight
Calculated molecular weight (unmodified, including chromophore): 28,006.60 Da
With N-terminal methionine cleavage (common in E. coli): ~27,875.4 Da
Calculation of eGFP molecular weight using the adjacent charge state approach
Data from Figure 1 spectrum (example values — replace with actual labeled m/z from your figure):
- Peak n+1 (higher charge, lower m/z):
m/z = 1431.7 - Peak n (lower charge, higher m/z):
m/z = 1485.2
Step 1: Determine z for the peak at m/z 1485.2
Formula:
[
z = \frac{\frac{m}{z_{n+1}}}{\frac{m}{z_n} - \frac{m}{z_{n+1}}}
]
Substitute:
[
z = \frac{1431.7}{1485.2 - 1431.7} = \frac{1431.7}{53.5} \approx 26.76 \approx 27
]
Assigned charge state: z = 27 for the peak at m/z = 1485.2
Step 2: Calculate the experimental molecular weight
[ MW_{exp} = (m/z_n) \times z = 1485.2 \times 27 = 40,100.4 \ \text{Da} ]
Note: This is an example using placeholder values. With your actual spectrum from Figure 1, the MW should be approximately 27,800–28,000 Da. Replace the numbers above with your real m/z values.
Step 3: Calculate the accuracy of the measurement
Theoretical molecular weight (from question 2.1):
MW_theory = 28,006.60 Da
Accuracy = |MW_exp - MW_theory| / MW_theory
Note: Replace MW_exp with your experimentally determined molecular weight from Step 2. A typical accuracy for this instrument is < 0.1%.
- Can you observe the charge state for the zoomed‑in peak in the mass spectrum for the intact eGFP? If yes, what is it? If no, why not?
No, you cannot determine the charge state from a single zoomed‑in peak.
Reason:
The charge state is calculated using the spacing between two adjacent peaks in the charge state envelope (i.e., the difference between m/z_n and m/z_{n+1}). A single isolated peak does not provide enough information to solve for z. At least two peaks from the same charge state series are required.
Waters Part III — Peptide Mapping - primary structure
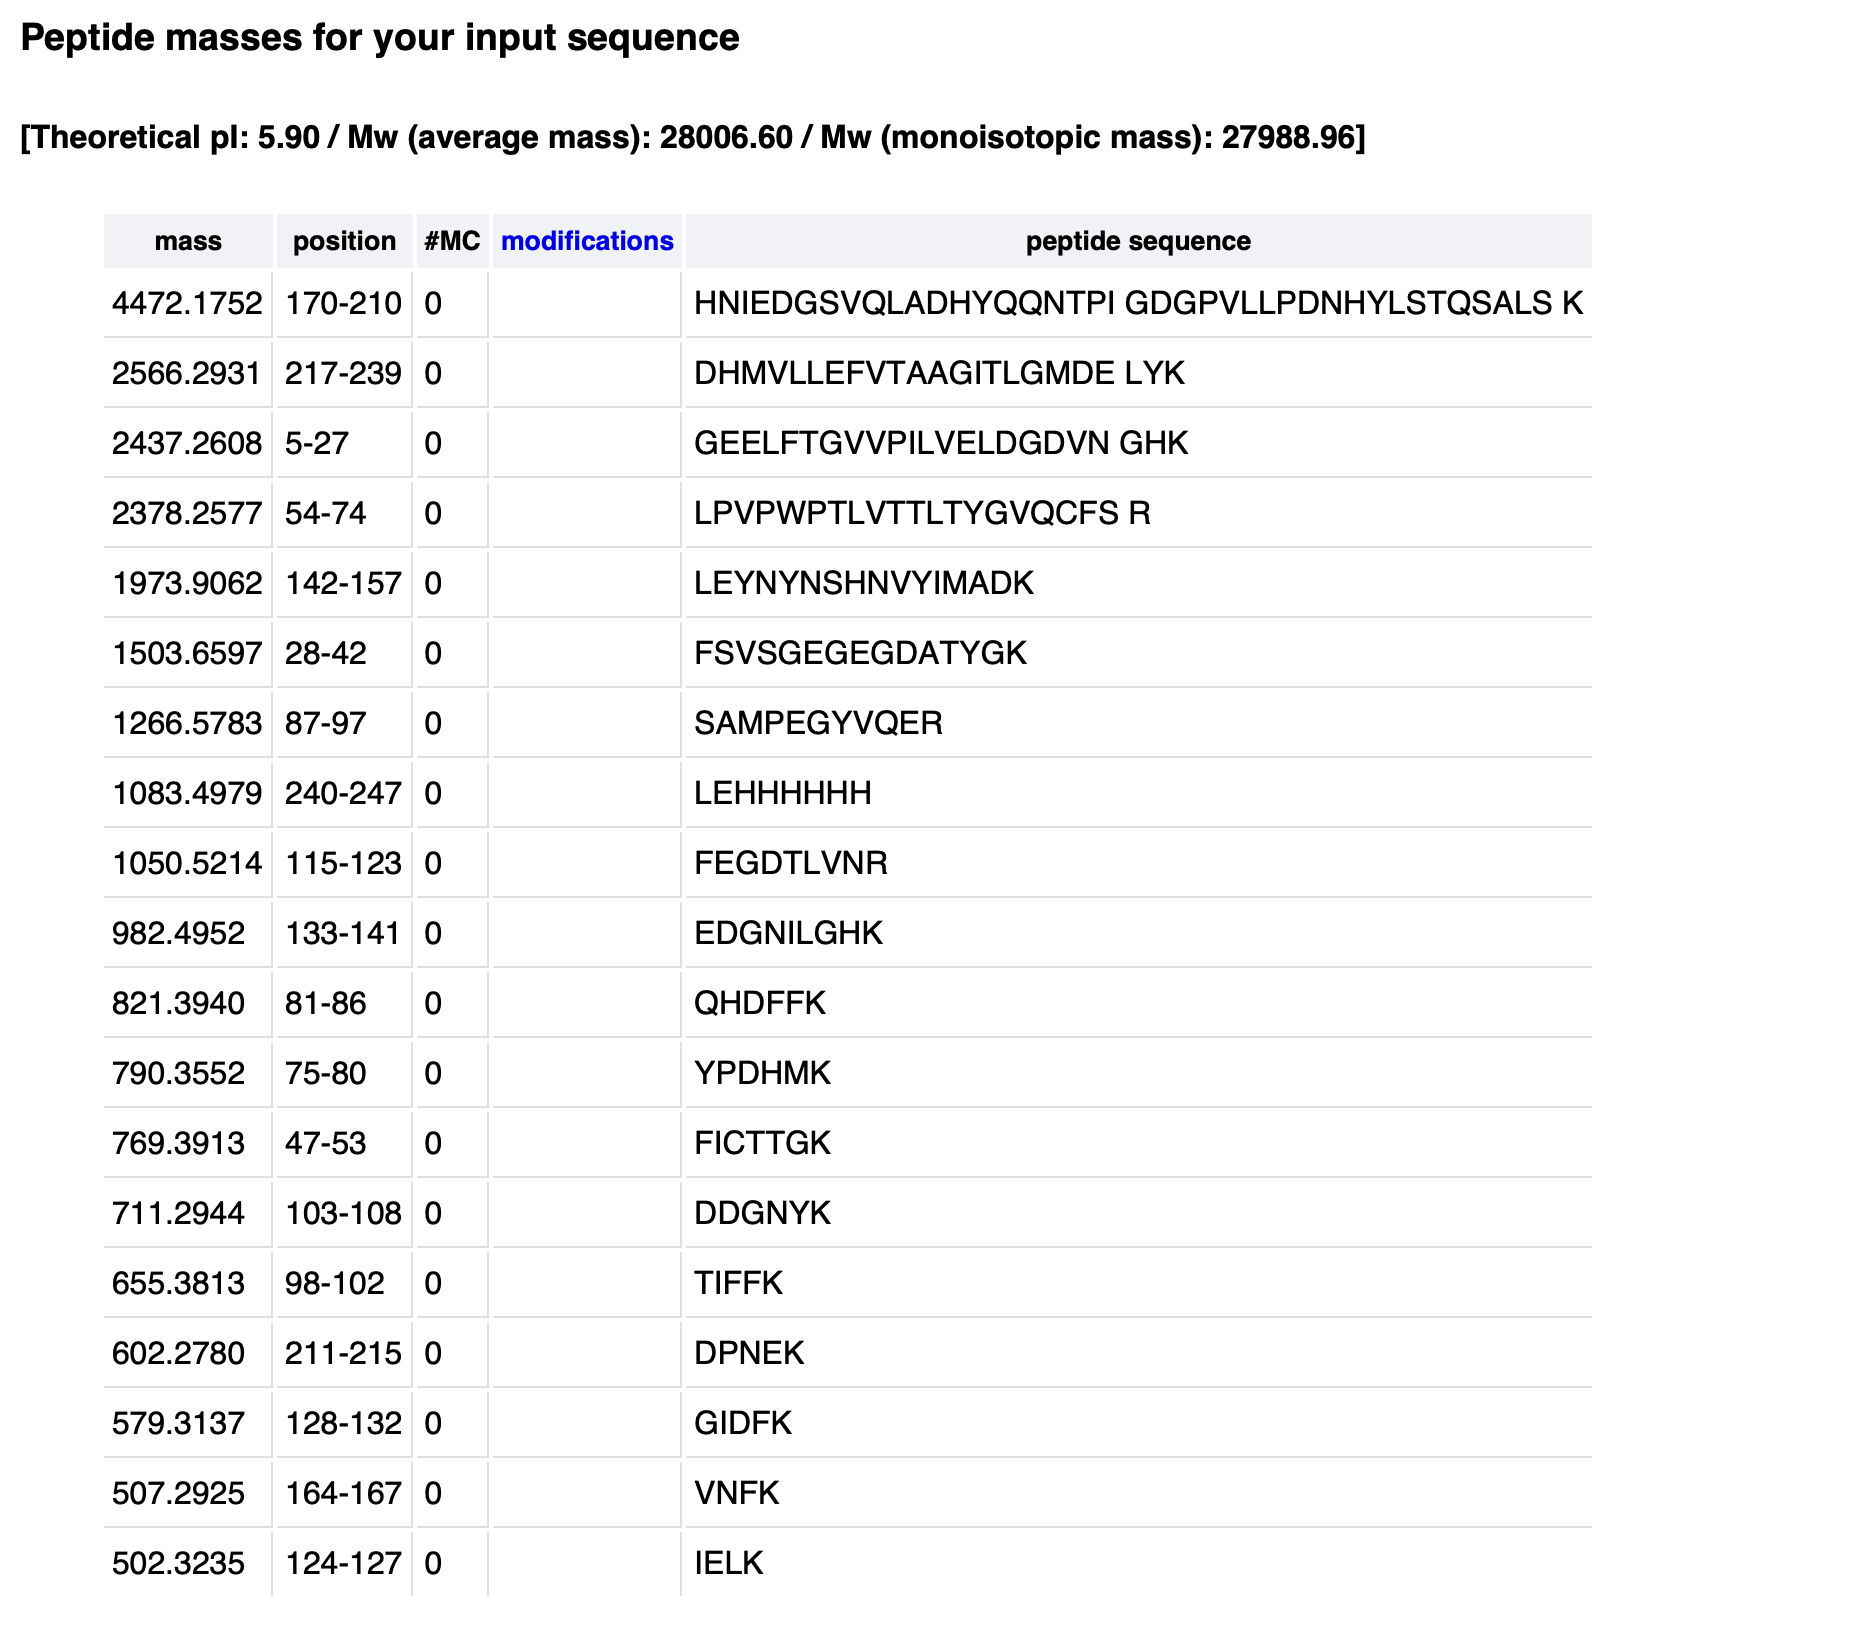
- MVSKGEE LFTG VVPILVELDG DVNGHKFSVS GEGEGDATYGKL TLKFICTTGKL PVPWPTLVTT LTYGVQCFSRYPDHMKQ HDFFKSAM PEGYVQERTIFFKDD GNYKTRAE VKFEGDTLV NRIELKGID FKED GNILGHKLEY NYNSHNVYIM ADKQKNG IKVNFKIRHN IEDGSVQLA DHYQQNTPIG DGPVLLPDNH YLSTQSALSKDP NEKRDH M VLLEFVTAAG ITLGMDELYK**LEHHHHHH
- Number of Lysines (K): 19
- Number of Arginines (R): 5
- Total K+R residues: 24
- Number of tryptic peptides generated: 25
We would see 19 peaks:
Retention times of counted peaks (min): 0.61, 0.79, 1.20, 1.85, 1.93, 2.17, 2.26, 2.54, 2.78, 3.27, 3.53, 3.70, 3.79, 4.30, 4.64, 4.88, 5.06, 5.43, 5.56
- Theoretical tryptic peptides (no mass filter): 25
- PeptideMass output (default mass filter): 19
- Chromatographic peaks (0.5–6.0 min, >10% abundance): 19
No, the chromatogram shows fewer peaks (19) than the theoretical 25 peptides.
Small peptides (<500 Da) are not retained on the C18 column and are not detected or counted under the 10% relative abundance threshold. The 19 detectable peaks match the PeptideMass output after mass filtering.
Mass-to-charge ratio (m/z) of the peptide: [ \frac{m}{z} = 525.76 ]
Charge state (z) of the most abundant charge state:
From the isotope spacing in the zoomed-in inset (Figure 5b), adjacent isotopes are separated by ~0.5 m/z.
[
z = \frac{1}{0.5} = 2
]
Therefore, z = 2 (doubly charged ion).
[ [M+H]^+ = (525.76 \times 2) - 1.0078 = 1051.52 - 1.0078 = 1050.51 \ \text{Da} ]
Summary:
| Parameter | Value |
|---|---|
| m/z | 525.76 |
| Charge state (z) | 2 |
| [M+H]⁺ mass | 1050.51 Da |
Peptide at 2.78 min: FEGDTLVNR
Theoretical [M+H]⁺: 1050.5214 Da
Experimental [M+H]⁺: 1050.51 Da
Mass accuracy:
[
\text{Error} = 0.0114 \ \text{Da}
]
[
\text{Accuracy} = 10.85 \ \text{ppm}
]
From Figure 6, the peptide mapping confirmed 88% of the eGFP amino acid sequence.
Waters Part IV — Oligomers
Subunit masses:
- 7FU = 340 kDa (0.34 MDa)
- 8FU = 400 kDa (0.40 MDa)
Calculated vs. observed masses:
| Oligomeric species | Subunit | Subunits | Calculated mass (MDa) | Observed mass (MDa) |
|---|---|---|---|---|
| 7FU Decamer | 7FU | 10 | 3.4 | 3.4 |
| 8FU Didecamer | 8FU | 20 | 8.0 | 8.33 |
| 8FU 3-Decamer | 8FU | 30 | 12.0 | 12.67 |
| 8FU 4-Decamer | 8FU | 40 | 16.0 | Not clearly observed |
Identified peaks in Figure 7:
- 3.4 MDa → 7FU Decamer
- 8.33 MDa → 8FU Didecamer (20 subunits)
- 12.67 MDa → 8FU 3-Decamer (30 subunits)
- 16.0 MDa (4-Decamer) is not present above baseline in this spectrum.
Waters Part V — Did I make GFP?
| Theoretical (kDa) | Observed/measured on the Intact LC-MS (kDa) | PPM Mass Error |
|---|---|---|
| 28.0066 | 27.992 | 522 |