My main interest in synthetic biology is getting organisms to glow, that is kind of what sent me down this whole path! As far as my background, I have a bachelor’s in Microbiology with a minor in Chemistry from Clemson University. Recently been making videos on personal lab projects that I am interested in check them out and my other socials while you are here!
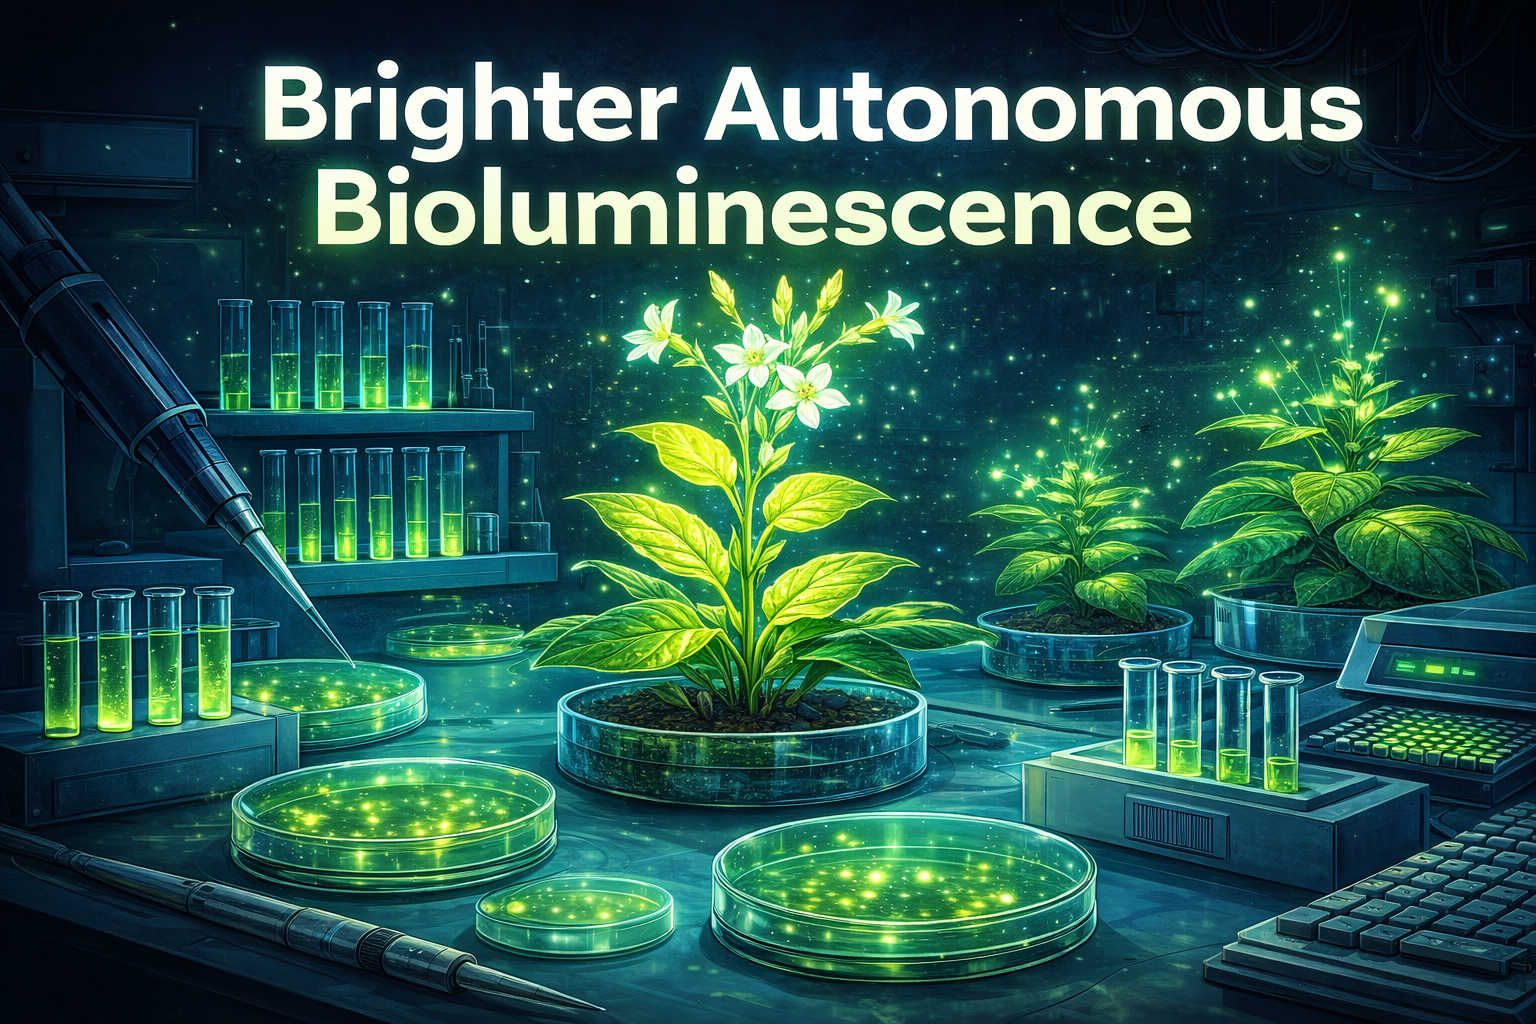
🦠Brighter Autonomous Bioluminescence🦠 I would love to improve the intensity of the glow that is emitted from autonomous bioluminescent organisms whether natural or synthetic.
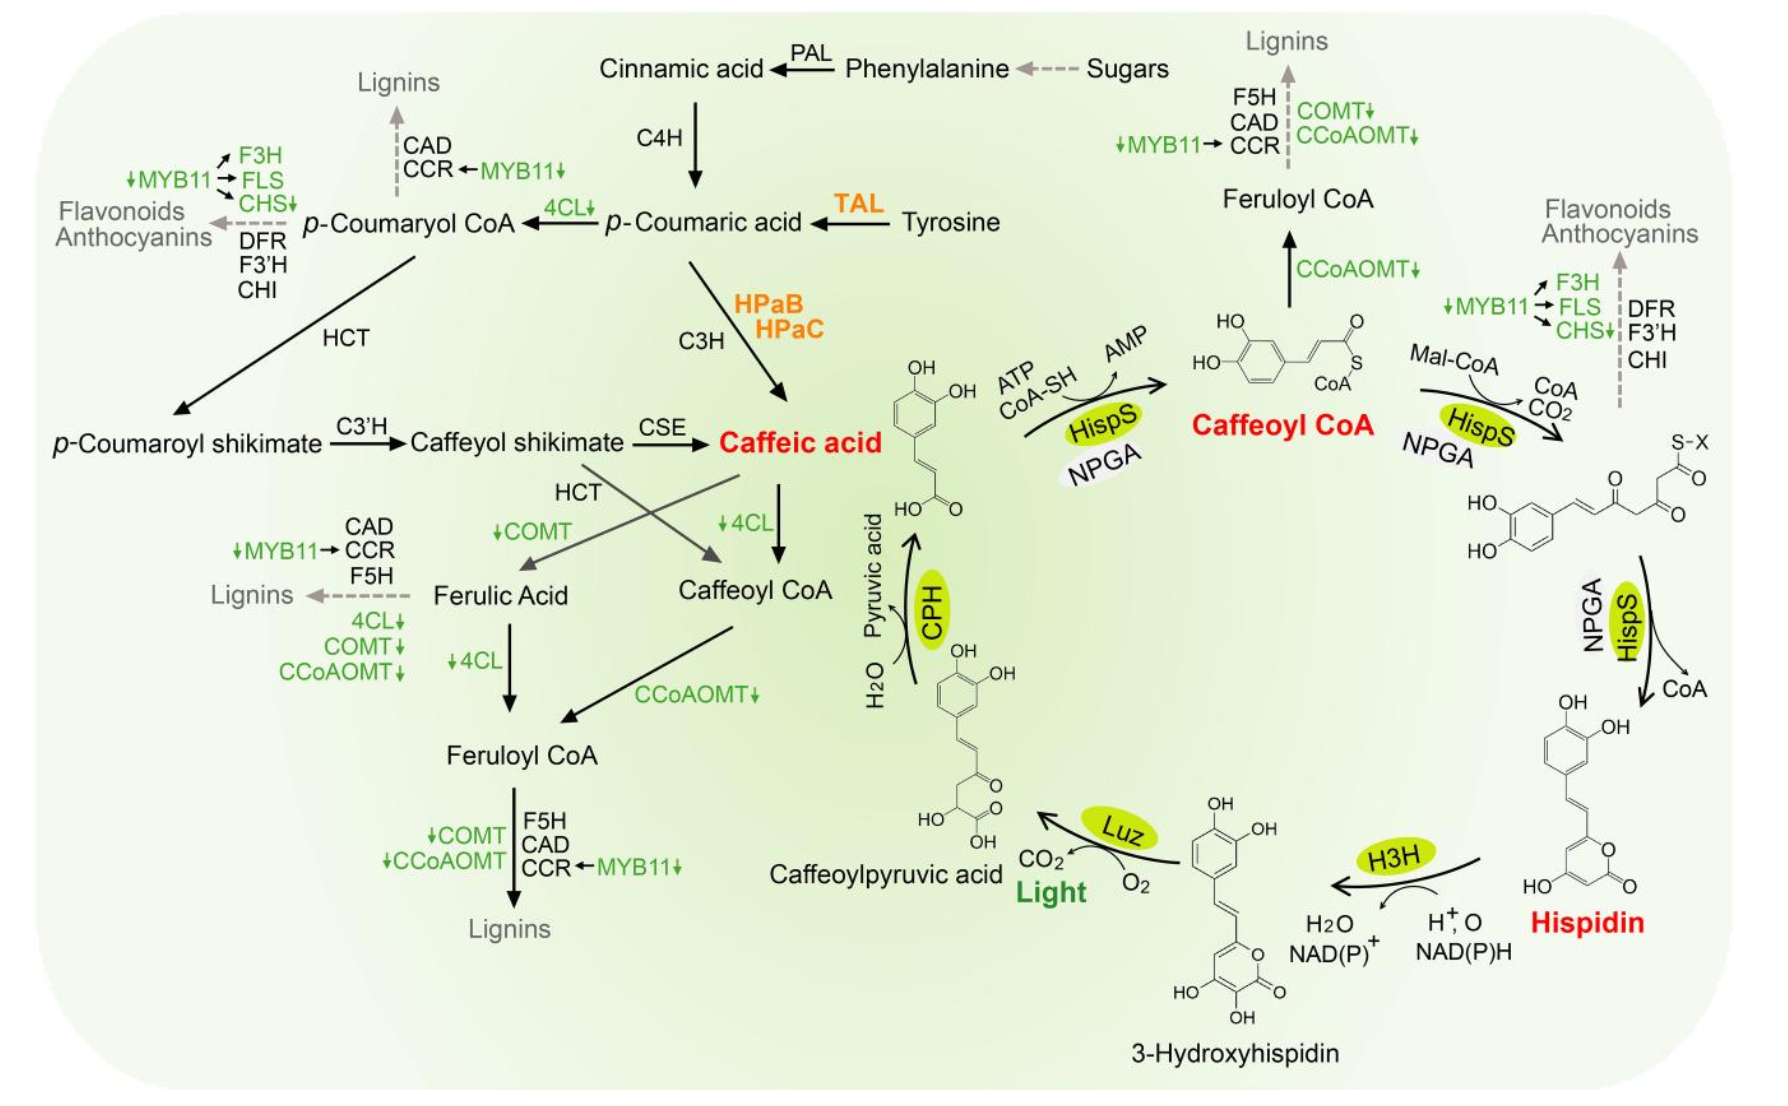
There are several different organisms that produce bioluminescence through various forms of luciferases (the enzyme that catalyzes the light emitting reaction) and luciferins (the substrate). However, most of them require the addition of the substrate to the growing medium to induce bioluminescence, typically coelenterazine or D-Luciferin. This to me just does not seem like the most convenient way to do this, so I am more interested in autonomous bioluminescent systems, such as Lux (bacterial luciferase) and Luz (fungal luciferase). These systems are the only two bioluminescent systems that have been fully elucidated. This means that they are fully genetically encoded, cells express luciferase and the enzymes necessary for substrate synthesis. This enables continuous supply of substrate without having to worry about adding the substrate to the growing medium or tissues to produce a glow.
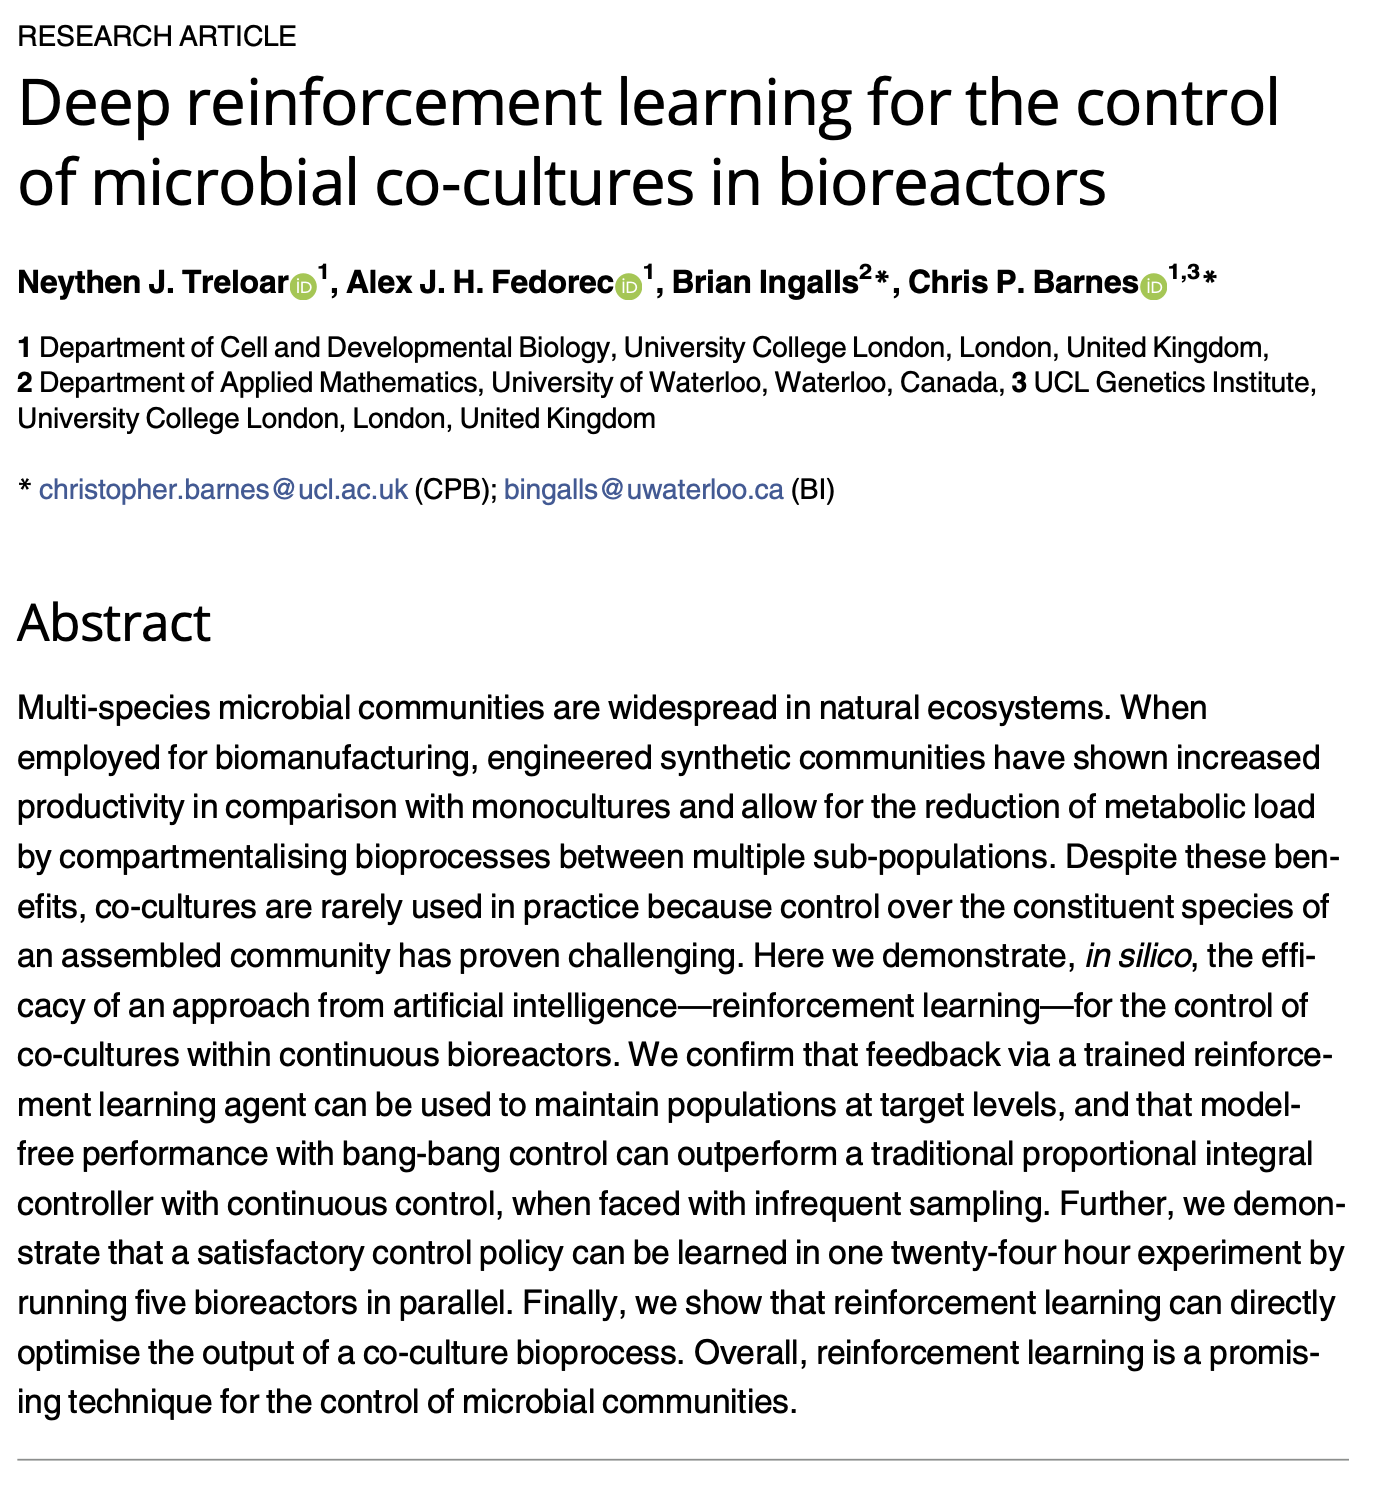
Lab Automation Article of Interest: Deep reinforcement learning for the control of microbial co-cultures in bioreactors This study uses an automation tool in the form of AI-based process control, deep reinforcement learning. Instead of manually tuning bioreactor conditions, the authors train an algorithm to make control decisions that regulate nutrient inputs and maintain stable microbial populations in co-culture. The novel biological application is dynamic control of multi-species microbial communities, which is a major challenge in synthetic biology and biomanufacturing because species can outcompete each other or become unstable over time. The paper shows that reinforcement learning can effectively stabilize co-cultures and optimize bioprocess performance in silico, demonstrating a promising path toward autonomous bioreactor operation. This is significant because reliable co-culture control could improve production efficiency and enable more complex engineered biological systems.
Conceptual Questions 1. Why are there only 20 natural amino acids?
There aren’t only 20 amino acids. There are just 20 that biology standardized early on in evolution. Proteins are built using translation. Once that system had evolved changing it was difficult because every protein in every organism depended on it. That creates evolutionary lock-in often referred to as a “frozen standard.” The current amino acids were selected due to their component atoms, functional groups, biosynthetic cost, use in a protein core or on the surface, solubility and stability. There are reasons for the selection of every amino acid. 2. Where did amino acids come from before enzymes that make them, and before life started?
Questions 1. What are some components in the Phusion High-Fidelity PCR Master Mix and what is their purpose?
Phusion DNA Polymerase: Catalyzes the synthesis of new DNA strands. Has 3′→5′ exonuclease proofreading activity, which removes incorrectly added nucleotides. Phusion polymerase is a genetically engineered DNA polymerase fused to a DNA-binding domain. The fusion domain increases DNA binding, which improves processivity. Reaction buffer: Help to maintain a stable pH. Also provides optimal ionic strength for polymerase activity. Stabilizes enzyme structure at high temperatures. Magnesium Chloride (MgCl₂): Essential cofactor for DNA polymerases. Coordinates with the phosphate groups of incoming nucleotides. Helps stabilize primer–template interactions. dNTPs: Provide the substrates used to synthesize new DNA strands. Each nucleotide carries three phosphates, providing the energy needed for polymerization. 2. What are some factors that determine primer annealing temperature during PCR?
Intracellular Artificial Neural Networks (IANNs) Questions What advantages do IANNs have over traditional genetic circuits, whose input/output behaviors are Boolean functions?
IANNs offer several advantages over traditional genetic circuits. Unlike the Boolean systems that produce binary ON/OFF outputs, IANNs generate continuous, graded responses that better reflect the analog nature of biological systems. They can also be trained by adjusting weights, allowing them to learn complex input–output relationships rather than relying on fixed logic. This enables IANNs to handle nonlinear interactions and integrate multiple inputs more effectively. Additionally, IANNs are more scalable and robust to biological noise, as their distributed architecture reduces sensitivity to fluctuations. Overall, IANNs enable more sophisticated information processing, such as pattern recognition and prediction, which is difficult to achieve with traditional genetic circuits. Describe a useful application for an IANN; include a detailed description of input/output behavior, as well as any limitations an IANN might face to achieve your goal.
General and Lecturer-Specific Questions General homework questions Explain the main advantages of cell-free protein synthesis over traditional in vivo methods, specifically in terms of flexibility and control over experimental variables. Name at least two cases where cell-free expression is more beneficial than cell production. Cell-free protein synthesis has a big advantage over in vivo methods because it gives you direct control over the reaction environment without needing to keep cells alive. You can precisely tune things like DNA concentration, energy sources, cofactors, salts, and even add or remove specific components in real time, which is much harder to do inside living cells where metabolism and regulation get in the way. It’s also faster since you skip cloning, transformation, and cell growth steps. This makes it especially useful for expressing toxic proteins that would kill or stress cells, and for rapid prototyping or screening large libraries of genetic constructs where you want quick, iterative testing without waiting on cultures to grow. Describe the main components of a cell-free expression system and explain the role of each component. A cell-free expression system is mainly made up of a cell extract, a DNA template, and a reaction mix that supports transcription and translation. The cell extract provides the core molecular machinery, like ribosomes, tRNAs, aminoacyl-tRNA synthetases, transcription and translation factors, which are all needed to actually make protein. The DNA template contains the gene of interest along with the regulatory sequences needed for expression. The reaction mix supplies the raw materials and energy needed to drive the system, including amino acids, nucleotides, salts, cofactors, ATP regeneration components, and buffering agents to keep conditions stable. Together, these components recreate the basic protein production machinery of a cell, but in a much more controllable format. Why is energy provision regeneration critical in cell-free systems? Describe a method you could use to ensure continuous ATP supply in your cell-free experiment. Energy provision and regeneration are critical in cell-free systems because transcription and translation burn through ATP and GTP fast, so without a way to replenish that energy, protein synthesis stalls. Since there are no living cells to continuously regenerate energy through metabolism, the reaction depends entirely on whatever energy system you build into it. Basically, if the reaction runs out of usable energy, the whole system stalls, so energy regeneration is what keeps protein production going for longer and improves overall yield. One common way to maintain ATP supply is to include an energy regeneration substrate such as phosphoenolpyruvate (PEP), which can be used to help regenerate ATP during the reaction. In the reaction, PEP transfers a phosphate group to ADP through the enzyme pyruvate kinase, which regenerates ATP that can then be used to keep transcription and translation going. Compare prokaryotic versus eukaryotic cell-free expression systems. Choose a protein to produce in each system and explain why. Prokaryotic and eukaryotic cell-free systems each have different strengths depending on the type of protein being produced. Prokaryotic systems, like E. coli extracts, are usually faster, cheaper, and great for making simple proteins that do not need complex folding or post-translational modifications. In contrast, eukaryotic cell-free systems are better for proteins that require more advanced folding, disulfide bond formation, or modifications that bacteria cannot do well. For a prokaryotic system, a strong candidate would be Luz (luciferase) from the fungal bioluminescence pathway, since it is a relatively compact enzyme that folds well in bacterial extracts and does not require eukaryotic post-translational modifications; producing it cell-free would allow rapid screening of variants and direct assay of luminescence activity by simply adding the 3-hydroxyhispidin substrate to the reaction. For a eukaryotic system, a suitable target would be H3H (hispidin-3-hydroxylase) or another upstream enzyme in the caffeic acid–to–luciferin pathway, since these fungal oxidative enzymes often depend on proper folding, cofactor incorporation, and a eukaryotic redox environment to remain active. Expressing the pathway enzymes in their appropriate systems enables modular prototyping of the bioluminescence circuit before committing to stable plant transformation. How would you design a cell-free experiment to optimize the expression of a membrane protein? Discuss the challenges and how you would address them in your setup. To optimize expression of a membrane protein in a cell-free system, I would design the reaction so it not only makes the protein but also gives it a membrane-like environment to fold into correctly. One of the main challenges with membrane proteins is that they tend to misfold, aggregate, or precipitate because their hydrophobic regions do not stay stable in plain aqueous solution. To deal with that, I would test conditions that include detergents, liposomes, or nanodiscs so the protein has somewhere to insert during or right after translation. I would also optimize variables like magnesium concentration, temperature, reaction time, and DNA concentration, since these can strongly affect yield and folding quality. On top of that, I would check expression using something like SDS-PAGE or a tagged reporter, then compare solubility and activity across conditions. Imagine you observe a low yield of your target protein in a cell-free system. Describe three possible reasons for this and suggest a troubleshooting strategy for each. Low protein yield in a cell-free reaction can arise from numerous sources, but three common causes are the following. First, degradation of the DNA template or mRNA transcript by nucleases present in the extract can sharply reduce output. This can be addressed by switching from linear PCR products to circular plasmid DNA, adding RNase inhibitors, and verifying template integrity by gel electrophoresis before use. Second, depletion of energy substrates or accumulation of inhibitory byproducts such as inorganic phosphate can stall translation mid-reaction. This is best addressed by switching to a more robust energy regeneration system (e.g., PEP/pyruvate kinase), adjusting the starting concentrations of NTPs and amino acids, and running time course sampling to identify when the reaction plateaus. Third, poor translation efficiency caused by suboptimal codon usage, weak ribosome binding site strength, or mRNA secondary structure near the start codon can limit ribosome loading. This can be addressed by codon optimizing the gene for the extract source, redesigning the 5’ UTR and RBS using established calculators, and introducing silent mutations to disrupt inhibitory secondary structures near the translation initiation site. Homework questions from Kate Adamala Design an example of a useful synthetic minimal cell as follows:
Homework: Final Project For your final project:
Please identify at least one (ideally many) aspect(s) of your project that you will measure. It could be the mass or sequence of a protein, the presence, absence, or quantity of a biomarker, etc.
For Aim 1 of my final project, there are several things I’ll need to measure, from confirming the construct is correct, to confirming the cells are expressing it, to ultimately quantifying the light output that defines success or failure of the experiment. The most important measurement is luminescence intensity from the IPTG-induced cells co-expressing nnLuz v4 truncated and nnH3H v2 after hispidin supplementation. This is the readout that directly tests my hypothesis that the v4 mutations stacked with the truncation produce a brighter enzyme pair than either modification alone. Light output alone isn’t enough without knowing the cells are actually doing what I think they’re doing, so I’ll also measure cell density (OD600) and perform a colony PCR to confirm the insert is present in transformed colonies.
Part A: The 1,536 Pixel Artwork Canvas | Collective Artwork I contributed a single pixel to the bioart project. It was one of the early additions—a red pixel placed in the bottom-left quadrant, about three rows down from the top of that section. At the time, the canvas was still mostly empty, and my contribution was eventually replaced as the artwork evolved into the final design, which included the word “Love.”
Subsections of Homework
Week 1 HW: Principles & Practices
🦠Brighter Autonomous Bioluminescence🦠
I would love to improve the intensity of the glow that is emitted from autonomous bioluminescent organisms whether natural or synthetic.
There are several different organisms that produce bioluminescence through various forms of luciferases (the enzyme that catalyzes the light emitting reaction) and luciferins (the substrate). However, most of them require the addition of the substrate to the growing medium to induce bioluminescence, typically coelenterazine or D-Luciferin. This to me just does not seem like the most convenient way to do this, so I am more interested in autonomous bioluminescent systems, such as Lux (bacterial luciferase) and Luz (fungal luciferase). These systems are the only two bioluminescent systems that have been fully elucidated. This means that they are fully genetically encoded, cells express luciferase and the enzymes necessary for substrate synthesis. This enables continuous supply of substrate without having to worry about adding the substrate to the growing medium or tissues to produce a glow.
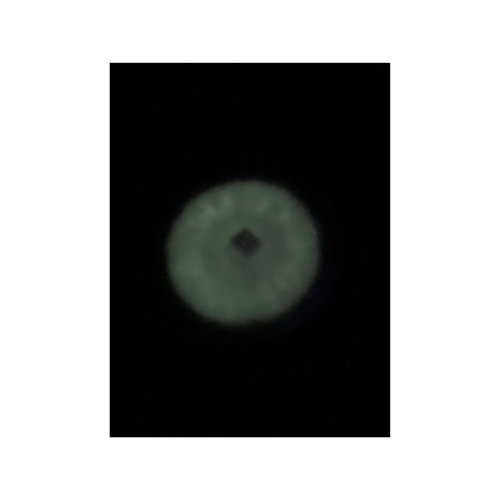
The first bioluminescent organism I ever cultivated was the fungus Panellus stipticus. The culture was given to me by a mycologist I was working with at the time. In order to get P. stipticus to glow I was directed to subculture onto bread crumb agar (simply agar and bread crumbs from the grocery store). Once cultured on the bread crumb agar the P. stipticus cultures did glow! However, this is where it should be noted that the glow that is produced from bioluminescence is typically not very bright. I will include a picture that I had taken of my first plate, the glow seems brighter than what it actually appears in person due to a longer exposure time on my iPhone camera settings.
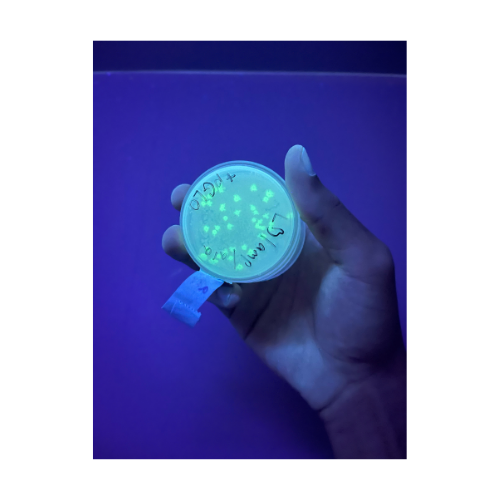
While in undergrad we transformed cells to produce GFP in an Advanced Microbiology Lab course.
You can see the difference in how bright the glow is even with the long exposure time on the photo for the bioluminescent fungus. However, it should be noted in order to get organisms to produce fluorescence with GFP light is used. Whereas the glow from the bioluminescence may not be as bright there is no need for any other light sources to see the glow. So, I would prefer to use bioluminescence as there is no need to use light.
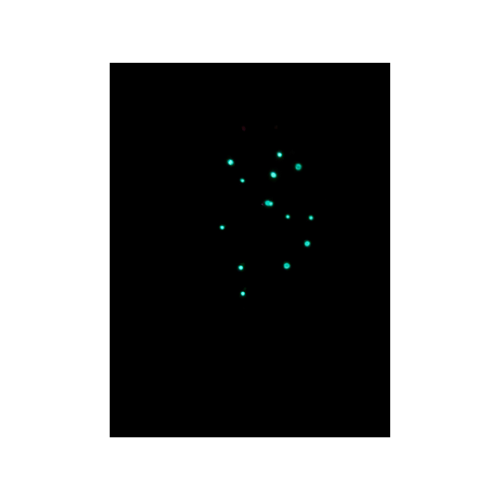
Then most recently, about a week ago, I transformed E. coli, on my own, with pVIB to produce bioluminescent cells. Again, I found myself with the same feeling that I had all those years ago when I first cultured P. stipticus, this is amazing but not exactly what I had imagined.
So now through this class I would like to take the opportunity to see if it would be possible to improve brightness/intensity of the glow produced from bioluminescent organisms!
Governance Goals
Goal 1: Ensure Safety & Prevent Harm
Biocontainment Standards: Making sure that containment strategies are in place that require genetic safeguards (e.g., inhibiting reproduction, auxotrophy or kill switches). This would prevent survival outside of intended environments. Safeguards should be validated and verified before deployment or release.
Operational Biosafety Protocols: Establish biosafety training and certification for anyone working with engineered bioluminescent organisms, including DIY biologists. This would mirror existing requirements in higher-biosafety labs and reduce risks posed by accidental exposure or poor technique.
Goal 2: Equity & Access
Equitable Access to Research Tools: Support public funding or bioluminescence kits for educational institutions and community labs with built-in safety guidelines, so that whoever is interested can participate responsibly in this area of science.
Ethics Education: Integrate ethics and governance training into the curriculum for any program funding or advising engineered organism projects, helping ensure researchers understand broader societal impact and their responsibilities.
Governance Actions
1) Community Driven Codes of Conduct for DIY and Institutional Labs
A community code of conduct would address the current gap between informal safety norms and clear expectations for work with engineered organisms. A coalition of academic groups, community labs, and DIYbio chapters could create a public code of conduct for responsible biodesign describing standards for organism handling, transparent documentation, and peer review, with voluntary adoption by spaces that host workshops or shared laboratories. This approach assumes that practitioners care about reputation and will align behavior with visible community values, though voluntary norms may struggle to reach groups that want independence over guidance. The main risk of failure is adoption without real behavioral change, while success could normalize safer habits and provide newcomers with a clear ethical baseline that reduces harm from inexperience.
2) Community Lab Micro-Grant Network
A micro-grant network would expand access to research by providing small, flexible funding to community labs, schools, and independent creators who lack institutional backing. Foundations, universities, or regional science hubs could distribute grants of $500–$2,000 paired with basic safety mentorship and simple reporting requirements, allowing projects in education, art, and environmental sensing to flourish. This approach assumes that modest resources can meaningfully broaden participation. The risk is that funds could be captured by already privileged groups or used without adequate guidance, but success would mean a more diverse ecosystem of synthetic biologist and ensure that the future of synthetic biology reflects many voices.
3) Peer Audit & Recognition Program for Safety Practices
A voluntary peer audit network would replace external enforcement with collaborative review, drawing on models from open source software and engineering design critique. Community organizations, DIYbio groups, iGEM teams, and university clubs could review one another’s safety documentation, containment strategies, and workflows, with participating projects receiving a public “Safety Verified” recognition. The model assumes that practitioners will invest time in mutual review and that social trust can motivate improvement, which may not hold equally across all groups. Audits could fail if reduced to paperwork exercises, yet success would foster a culture where safety is shared, allowing many eyes to strengthen emerging technologies.
Scoring of Governance Actions Against Policy Goals
Scale: 1 = best alignment, 2 = moderate, 3 = weak/indirect, N/A = not applicable
Goals & Sub-Goals
1) Codes of Conduct
2) Community Micro-Grants
3) Peer Audit & Recognition
Goal 1: Ensure Safety & Prevent Harm
Support biocontainment standards & safety-by-design
1
3
2
Encourage operational biosafety protocols
1
2
1
Reduce accidental exposure or misuse
1
2
1
Goal 2: Equity & Access
Equitable access to research tools
2
1
2
Integrate ethics & governance education
1
2
1
Broaden participation beyond elite labs
2
1
2
Other Considerations
Minimize costs and burdens
1
1
2
Feasibility
2
1
2
Not impede research
1
1
1
Promote constructive applications
1
1
1
Drawing on the scoring table, I would prioritize a combined approach centered on Community Driven Codes of Conduct, the Community Lab Micro-Grant Network, and Peer Audit & Recognition. The Codes of Conduct scored highest for fostering safety and preventing harm by establishing shared expectations around biocontainment and biosafety without restricting research. The Micro-Grant Network performed best for equity and access, directly lowering barriers for schools, community labs, and independent creators while including mentorship to support responsible practice. Peer Audit & Recognition complements both by reinforcing operational safety through collaborative review and practical ethics learning, helping translate norms into everyday lab behavior.
This combination reflects key trade-offs and it relies on voluntary incentives rather than formal enforcement, assuming that reputation, community trust, and access to resources could meaningfully shape the community. The approach may struggle if some actors do not value these social levers, and micro-grants could still be captured by already privileged groups. However, for audiences such as MIT leadership, community lab networks, and nonprofit funders, this strategy offers a feasible path that protects safety, expands participation, and promotes constructive uses of bioluminescence while keeping burdens on researchers low and innovation open.
Week 2 Prep Questions
Homework Questions from Professor Jacobson:
Nature’s machinery for copying DNA is called polymerase. What is the error rate of polymerase? How does this compare to the length of the human genome. How does biology deal with that discrepancy?
The error rate of polymerase is 1:10^6. The length of the human genome is 3.2 Gbp. Biology deals with this discrepancy by incorporating proofreading capabilities within the DNA polymerase. Certain DNA polymerases contain 3’ to 5’ exonuclease activity allowing them to remove any incorrect DNA bases. There are also other mismatch repair systems such as the MutS system that detect mismatched DNA bases and fixes them.
How many different ways are there to code (DNA nucleotide code) for an average human protein? In practice what are some of the reasons that all of these different codes don’t work to code for the protein of interest?
An average human protein can be encoded by an enormous number of different DNA sequences because most amino acids are specified by multiple codons. Even though DNA sequences could encode the same amino-acid chain, they are not functionally the same because for example, different codons are translated at different speeds due to tRNA abundance.
Homework Questions from Dr. LeProust:
What’s the most commonly used method for oligo synthesis currently?
Solid-phase syntheis using the phosphoramadite method.
Why is it difficult to make oligos longer than 200nt via direct synthesis?
Each step in the phosphoramadite method has an efficiency of about 99%, which means that even at an oligo length of just 200nt most products will be truncated or contain deletions and therefore not be usable.
Why can’t you make a 2000bp gene via direct oligo synthesis?
Once oligos start to reach this length there are issues with the strand starting to fold back on itself as well as the error issue mentioned in the answer to the previous question.
Homework Question from George Church:
What are the 10 essential amino acids in all animals and how does this affect your view of the “Lysine Contingency”?
Histidine, isoleucine, leucine, lysine, methionine, phenylalanine, threonine, tryptophan, valine, and arganine. Lysine is an essential amino acid which means that it cannot be synthesized by human or other animal cells. Therefore, it has to be obtained from the diet. This means the “Lysine Contingency” that was referenced within the Jurassic Park series makes no sense, as animals already do not synthesize lysine. So this edit would not do anything at all lol.
There are multiple codons that code for a single amino acid. Every organism has certain tRNAs associated with codons that will be more abundant than others. If an organism runs into a codon that it does not commonly see and has a low abundance of the associated tRNA then it can cause the production of the associated protein to stall. This is where codon optimization comes in. Codon optimization takes a DNA sequence and converts it into a sequence that contains codons that would be more commonly found in the host organism.
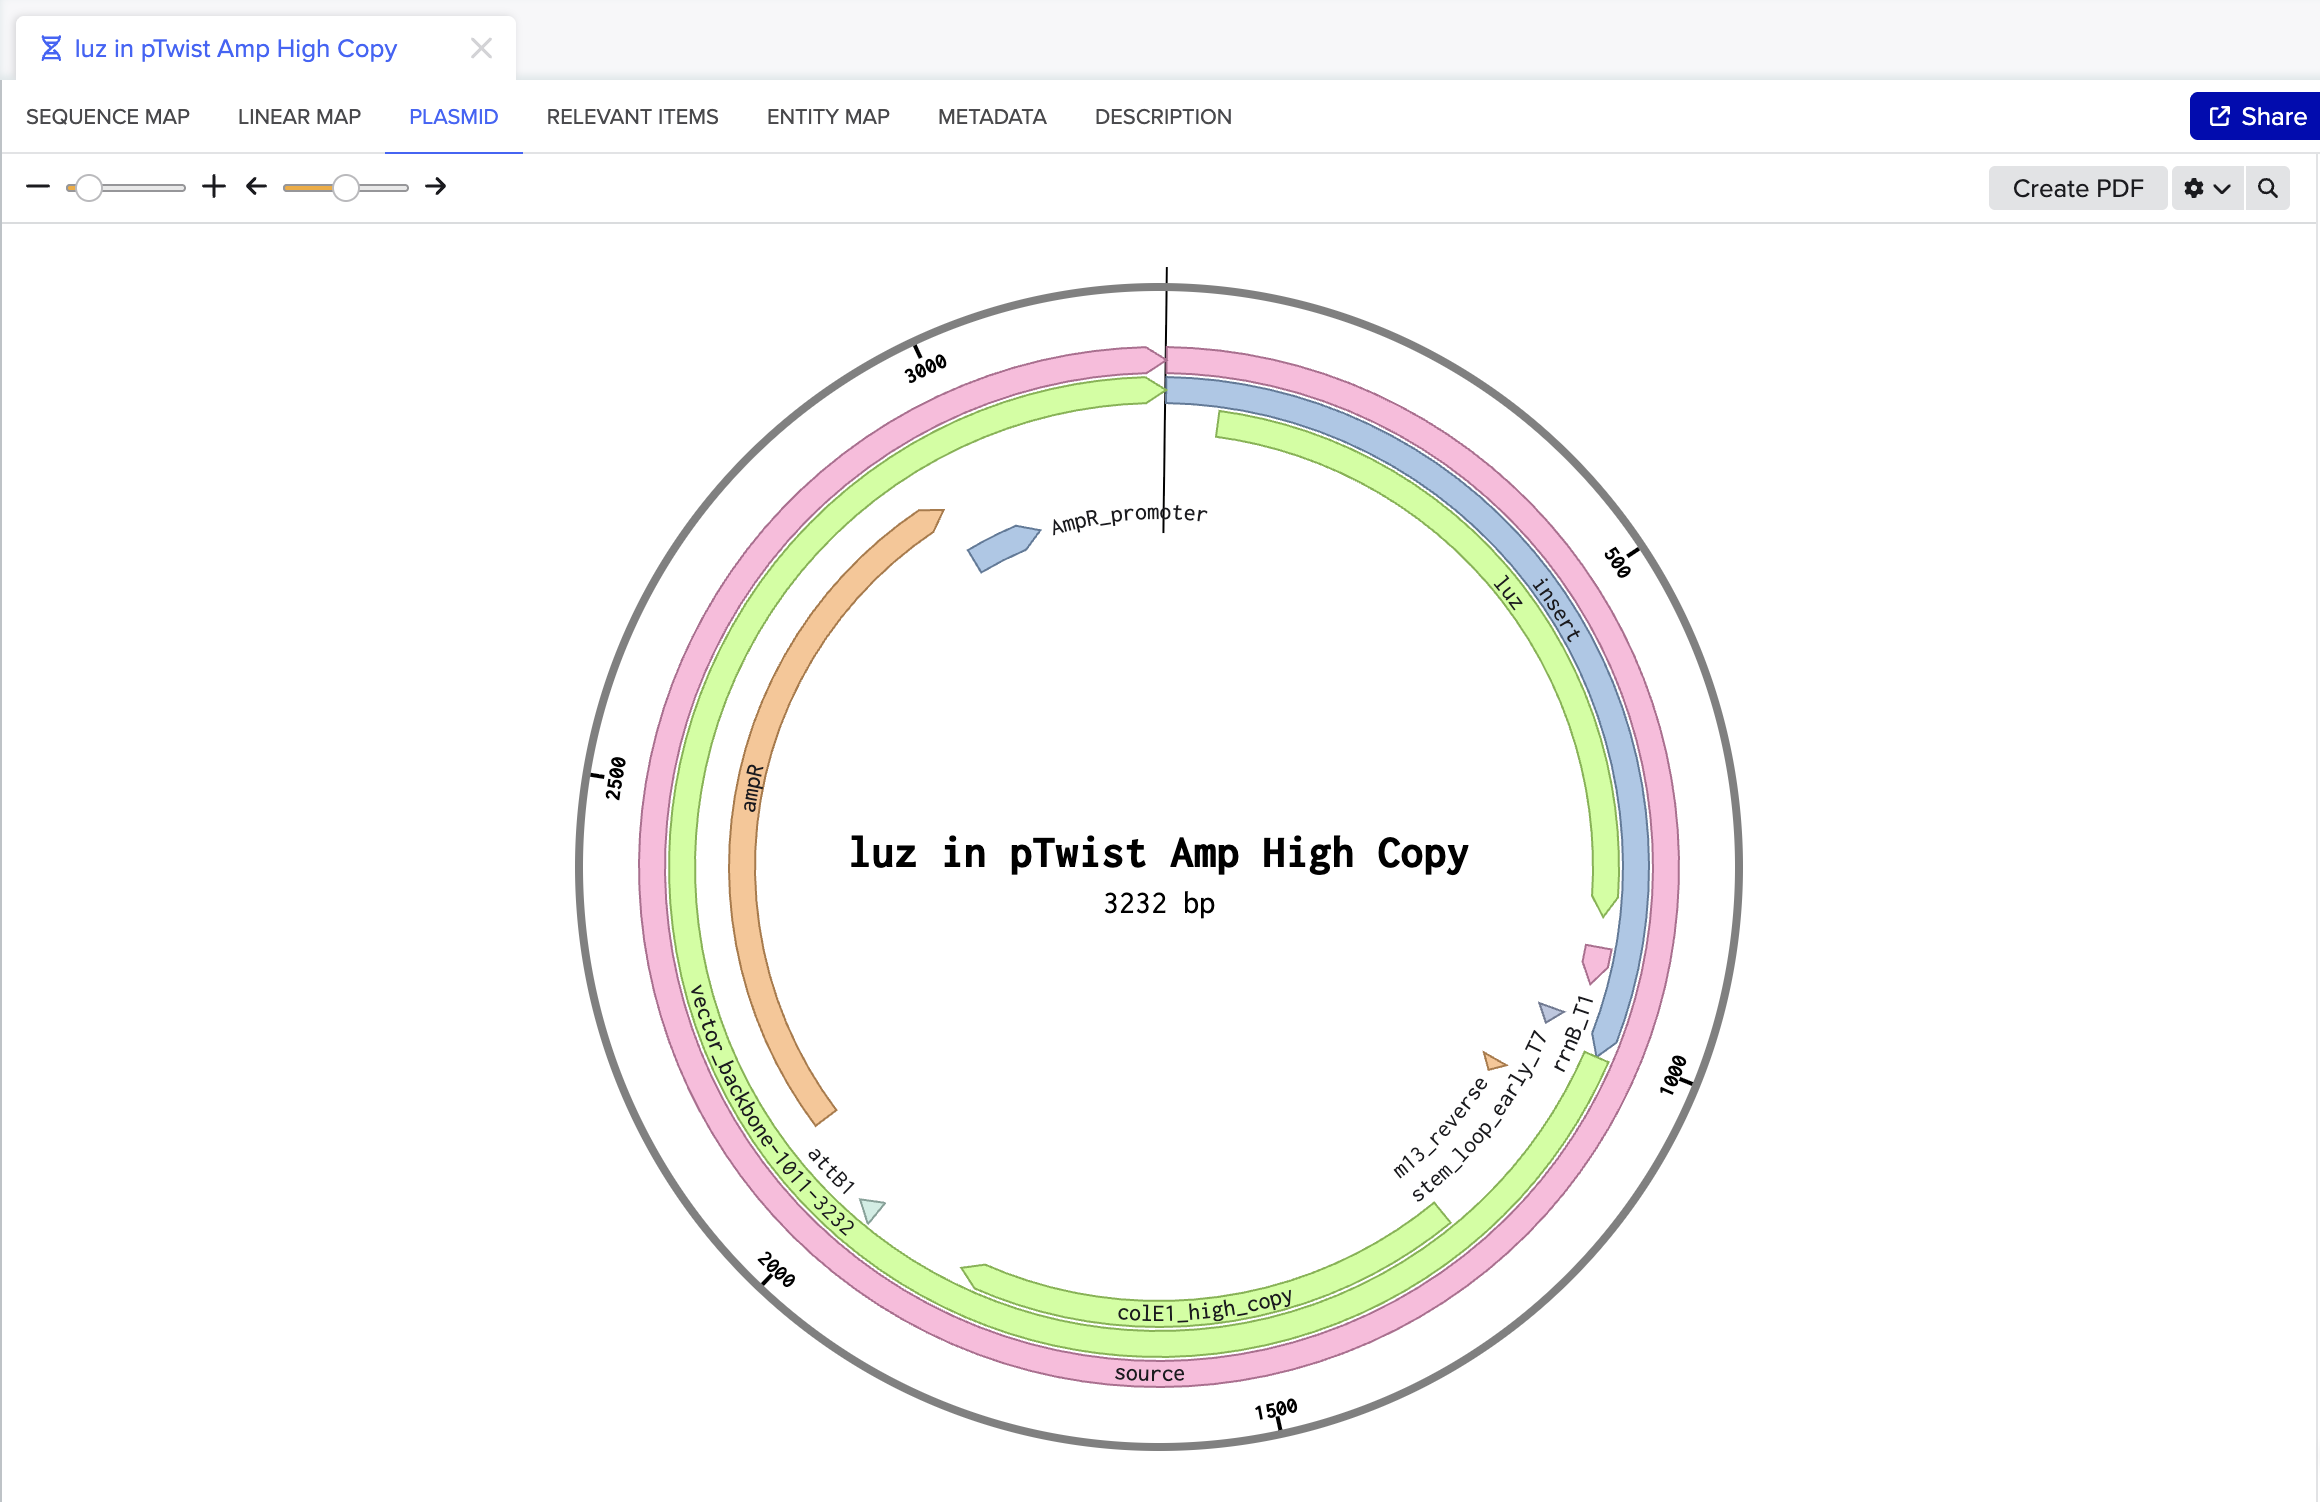
I chose to optimize the codon sequence for yeast (Saccharomyces cerevisiae) as this is a model microorganism used for synthetic biology and I would first just like to test if this would work to produce fungal luciferase.
The DNA sequence can now be sent to a DNA synthesis company such as, Twist Biosciences. Twist can provide either DNA fragments or clonal genes that already have the DNA sequence of interest inserted into a vector. If receiving DNA fragments instead of clonal genes, first the fragments will have to be inserted into a vector. Once the fragments have been inserted into a vector, or if clonal genes were ordered instead, this can then be introduced into an organism. For yeast a heat shock or electroporation are used to introduce the DNA into the cells. Once the yeast cells have successfully taken up the DNA, the cells will then proceed to transcribe the DNA into RNA and then translate that RNA into the protein of interest.
How does it work in nature/biological systems?
Describe how a single gene codes for multiple proteins at the transcriptional level.
In eukaryotic systems a single gene can code for multiple proteins because eukaryotic genes contain exons and introns. The exons are the segments of the gene that will end up in the final mRNA product and encode the final protein. When mRNA is being processed the exons can be spliced together in different combinations creating different proteins.
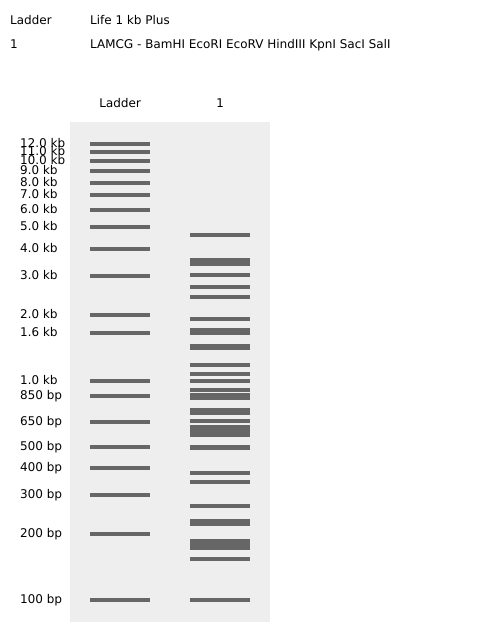
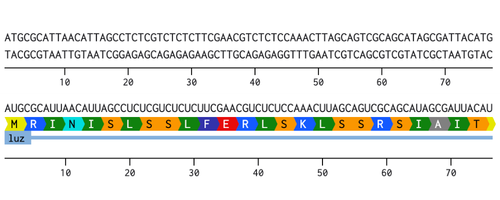
Try aligning the DNA sequence, the transcribed RNA, and also the resulting translated Protein!!!
Prepare a Twist DNA Synthesis Order
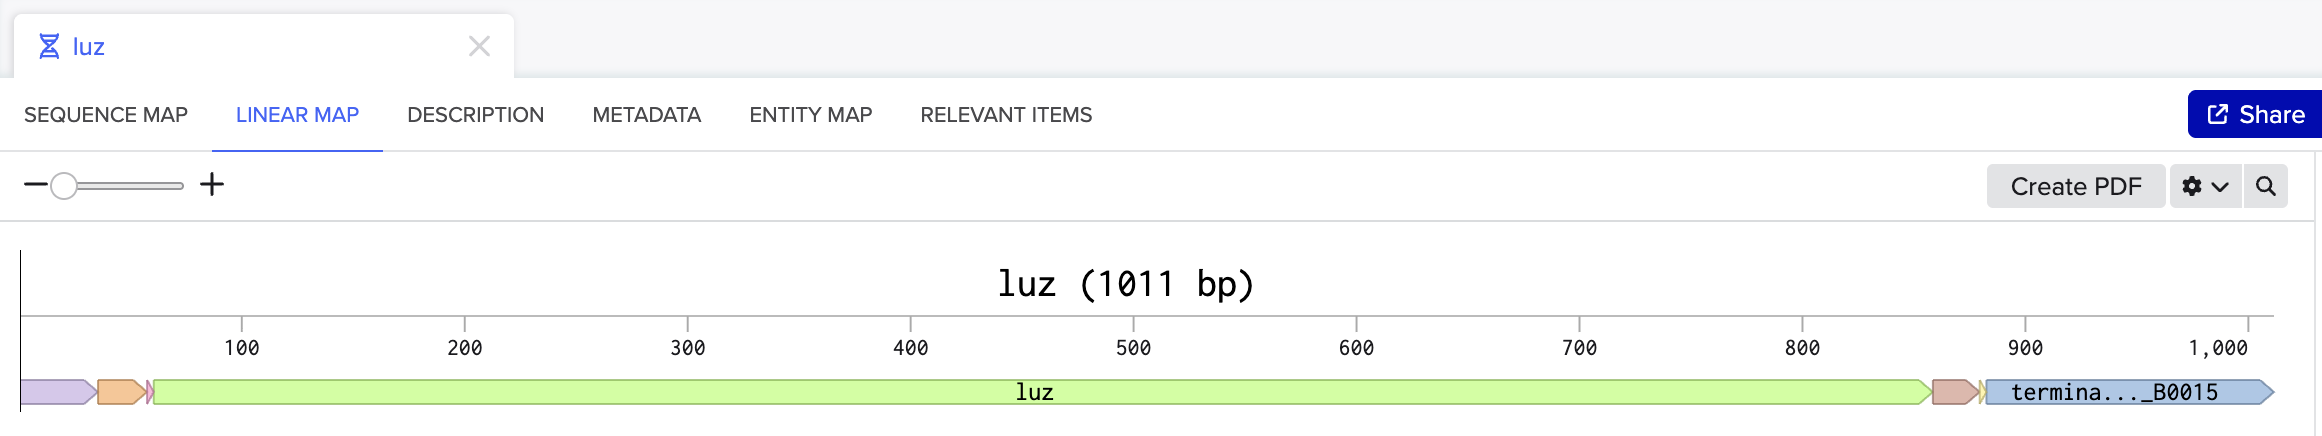
Fully annotated Benchling insert fragment
Twist cloning vector
DNA Read/Write/Edit
DNA Read
(i) What DNA would you want to sequence (e.g., read) and why?
I would want to sequence the DNA of all known bioluminescent fungi just to see all the different variations of this system that nature has come up with. Then compare how those differences impact the intensity of the glow or maybe certain variations would work better in certain cirumstances/organisms.
(ii) What technology or technologies would you use to perform sequencing on your DNA and why?
I would want to use use nanopore sequencing technology because it is a relatively low-cost sequencing method. Nanopore sequencing is a third-generation sequencing method because it can read long single DNA molecules directly in real time. The input for nanopore sequencing is typically DNA, RNA, amplicons, or cDNA. First the DNA/RNA is extracted then sequencing adapters are attached to the ends of the strands. The sequencing adapters are oligonucleotides that are loaded with a motor protein. The motor protein associates with the nanopore in the flow cell and controls the DNA or RNA strand movement through the nanopores at a defined speed. Samples are then ready to be loaded and sequenced.
The flow cells used for sequencing the samples contain ion-permeable nanopores embedded in an electrically-resistant membrane enabling an ionic current to pass through the nanopore when a voltage is applied across the membrane. This creates a measurable current that is disrupted when a strand of DNA or RNA passes through the nanopore. The disruption of current is measured and is used to identify the bases passing through the nanopore. The disruption produces a characteristic ‘squiggle’. The squiggle is then decoded using basecalling algorithms to determine the DNA or RNA sequence in real time.
DNA Write
(i) What DNA would you want to synthesize (e.g., write) and why?
I would synthesize the cluster of genes that are involved in the bioluminescence pathway in the fungus Neonothopanus nambi. There are four genes involved in the autonomous biolumiscent pathway in N. nambi. These are hispidin synthase (HispS), hispidin-3-hydroxylase (H3H), luciferase (Luz), and caffeylpyruvate hydrolase (CPH). Here are their associated genetic sequences:
(ii) What technology or technologies would you use to perform this DNA synthesis and why?
I would use chip-based oligonucleotide synthesis followed by assembly because it enables parallel production of many DNA fragments at relatively low cost. Here are the steps for chip-based oligonucleotide synthesis:
Coupling with phosphoramidite - a protected phosphoramidite is added to the unprotected 5’ OH end of the DNA strand
Capping unreacted sites - unreacted 5’ OH are acetylated to prevent further chain extension
Oxidation - oxidation of phosphite triester to phosphate using aqueous iodine
Deprotection - acid catalyzed removal of protective group to allow for subsequent base addition
Accuracy is the biggest technical limitation. Each base addition has a small failure probability. This means only shorter maximum reliable length DNA can be synthesized. Speed can also be a limitation as the chemistry is cycle-based, one nucleotide added per cycle, so the physical synthesis time scales with sequence length no matter how many sequences are on the chip. You can make millions at once, but you cannot make any single one faster than the chemistry allows.
DNA Edit
(i) What DNA would you want to edit and why?
I would want to edit the DNA of various organisms so that they would become bioluminescent. I would start with microorganisms such as E. coli and yeast. Then I would like to move to plants, I have not thought about modifying any other eukaryotic organisms beyond that. My main interest is just to see if this would work well in various organisms to produce autonomous bioluminescence.
(ii) What technology or technologies would you use to perform these DNA edits and why?
I would use CRISPR-Cas9 to make the edits. CRISPR-Cas9 works across kingdoms and it enables precise editing and insertion of DNA. CRISPR-Cas9 has the ability to find and cut specific DNA targets based on the sequence of its guide RNA. The guide RNA can be designed to be complementary to a particular target sequence in the genome. Cas9 will search the whole genome, eventually finding its target site and making a double-stranded break. The double-stranded break can then be repaired through homology-directed repair allowing for the donor DNA to be incorporated into the host organisms genome.
To prepare to edit with CRISPR-Cas9 the first step is to design a donor DNA template flanked by homology arms matching the target locus and guide RNA complementary to the region. Plasmids would then need to be constructed to express Cas9 and the guide RNA. All in all, the inputs required for the editing would include the Cas9 nuclease, guide RNA, donor DNA template, plasmids, primers, and the host cells to be edited. Additional components such as enzymes for DNA assembly and transformation or transfection reagents would also be required to introduce the editing system into the cells.
One limitation of CRISPR-Cas9 editing is the possibility of off-target effects. This is where Cas9 cuts at sites that are similar but not identical to the target sequence and could induce unintended mutations. Another limitation is that cells prefer to do non-homologous end joining over homology-directed repair, which can introduce insertions or deletions. The CRISPR-Cas9 editing system is also limited by the delivery problem, which involves getting the CRISPR-Cas9 system to the target cells. Some organisms or cell types are more difficult to transform or transfect, which can reduce the number of successfully edited cells.
Week 3 HW: Lab Automation
Lab Automation Article of Interest:
Deep reinforcement learning for the control of microbial co-cultures in bioreactors
This study uses an automation tool in the form of AI-based process control, deep reinforcement learning. Instead of manually tuning bioreactor conditions, the authors train an algorithm to make control decisions that regulate nutrient inputs and maintain stable microbial populations in co-culture. The novel biological application is dynamic control of multi-species microbial communities, which is a major challenge in synthetic biology and biomanufacturing because species can outcompete each other or become unstable over time. The paper shows that reinforcement learning can effectively stabilize co-cultures and optimize bioprocess performance in silico, demonstrating a promising path toward autonomous bioreactor operation. This is significant because reliable co-culture control could improve production efficiency and enable more complex engineered biological systems.
Final Project Automation
For my final project, I intend to use automation tools to identify the best construct architecture (single plasmid vs. multi-plasmid system, promoter/RBS combinations, and coding sequence variants) needed to make the fungal bioluminescence pathway (FBP) + BRET system function across multiple host organisms.
My goal is to build a scalable design-test-learn workflow rather than test only a few manual designs. I will use lab automation to generate and evaluate many candidate sequence/plasmid combinations in parallel, then iteratively improve designs using data from each round.
Planned automation workflow
Design Phase
Build a combinatorial library of FBP + BRET constructs (promoters, copy number, linkers, fluorescent acceptors, plasmid architecture).
Build Phase
Use automated liquid handling (or cloud-lab style protocols) for DNA assembly setup, transformation setup, and plate preparation.
Test Phase
Measure luminescence, fluorescence, and growth (OD) in microplate format.
Use standardized imaging conditions and, if needed, a simple 3D-printed holder/dark-box insert for reproducible camera-based signal capture.
Learn Phase
Use Python-based analysis to rank designs by brightness, brightness/OD, and BRET signal ratio.
Select top performers for the next iteration and/or for testing in additional hosts.
Optional scale-up plan (Ginkgo Nebula)
If available, I would use Ginkgo Nebula to scale beyond local throughput: submit top construct sets for higher-throughput build/test cycles across multiple organisms and feed those results back into my design loop.
Overall, automation is central to my project because it enables systematic, reproducible, and data-driven optimization of a complex FBP + BRET system across diverse biological hosts.
Final Project Aims
Aim 1.
Build an automated design-build-test workflow and demonstrate baseline fungal bioluminescence pathway expression initially in E. coli.
Include: at least a small construct panel (e.g., 4-12 variants)
Success metric:
Reproducible luminescence with automated assay + analysis pipeline working end-to-end
Aim 2.
Add BRET module and use automation to identify a better-performing construct architecture (single vs multi-plasmid and promoter/linker combinations) in both hosts.
Success metric:
Measurable spectral shift and improved BRET ratio vs donor-only control; identify at least one top-ranked architecture
BRET luminescence/fluorescence improvement >20% vs bioluminescence alone
Aim 3
Design and pilot multi-host optimization strategy (with Ginkgo Nebula as scale-up path)
Success metric:
Transfer top designs to additional hosts, sucha as Plants, and improve brightness/OD + stability through multiple rounds
Week 4 HW: Protein Design Part I
Conceptual Questions
1. Why are there only 20 natural amino acids?
There aren’t only 20 amino acids. There are just 20 that biology standardized early on in evolution. Proteins are built using translation. Once that system had evolved changing it was difficult because every protein in every organism depended on it. That creates evolutionary lock-in often referred to as a “frozen standard.” The current amino acids were selected due to their component atoms, functional groups, biosynthetic cost, use in a protein core or on the surface, solubility and stability. There are reasons for the selection of every amino acid.
2. Where did amino acids come from before enzymes that make them, and before life started?
Abiotic chemistry on early Earth. Amino acids are chemically natural products when carbon, nitrogen, hydrogen, oxygen, and energy mix. Meteorites can also contain amino acids, therefore, some could have come to Earth from space. Geochemical environments like hydrothermal vents, mineral surfaces, metal ions, heat gradients, and pH differences can drive reactions that form amino acids from simpler molecules. Before enzymes chemistry did the job.
3. If you make an α-helix using D-amino acids, what handedness (right or left) would you expect?
A helix made from D-amino acids will form a left-handed α-helix.
4. Can you discover additional helices in proteins?
Yes there are algorithms that can scan protein structures and assign different helices based on hydrogen-bond patterns and geometry. Proteins contain more than just the regular α-helix. There are also rarer helices such as 3₁₀ helices, π helices, polyproline helices, and collagen triple helices. With computational design or mutation experiments, you can often convert loops or disordered regions into helices.
5. Why are most molecular helices right-handed?
Most molecular helices are right-handed because the building blocks of life are chiral molecules, and biology chose one handedness early on. Once that choice locked in, the geometry of bonding and steric constraints naturally favor right-handed helices for those particular molecular configurations. A right-handed α-helix lets hydrogen bonds line up cleanly while avoiding atomic collisions.
A left-handed α-helix is theoretically possible but energetically unfavorable with L-amino acids.
6. Why do β-sheets tend to aggregate?
A β-sheet is a protein secondary structure where the backbone is stretched out into strands that sit next to each other, stabilized by hydrogen bonds between the backbone carbonyl and amide groups. The hydrogen-bond donors and acceptors often remain partially unsatisfied at the sheet edges. When another β-strand comes nearby, it can complete those hydrogen bonds. So strands stack. Then stacks stack. Then you get fibrils.
What is the driving force for β-sheet aggregation?
β-sheet aggregation is driven by the combination of unsatisfied backbone hydrogen bonds seeking partners, hydrophobic interactions between sheet faces, favorable side-chain packing, and nucleation-dependent polymerization that lowers free energy as aggregates grow.
7. How many molecules of amino acids do you take with a piece of 500 grams of meat? (on average an amino acid is ~100 Daltons)
6 × 10²³ amino acid molecules. Meat is usually about 20% protein by mass (varies by cut, fat content, species). So 500g of meat would contain about 100g of protein. We are given that on average an amino acid is about 100 Daltons (100 g/mol per amino acid).
100 g ÷ (100 g/mol per amino acid) = 1 mole of amino acids
Therefore, you are ingesting 6 × 10²³ amino acid molecules
8. Why do humans eat beef but do not become a cow, eat fish but do not become fish?
When you eat beef or fish your digestive system breaks them down biochemically. Proteins are broken into amino acids, fats into fatty acids, carbohydrates into simple sugars. By the time nutrients cross your intestinal wall, there is no “cow” left just raw chemical building blocks.
9. Why do many amyloid diseases form β-sheets?
Amyloid diseases happen when protein folding goes wrong. A β-sheet is essentially the most efficient way for a polypeptide backbone to hydrogen bond with itself when the protein is unfolded or partially misfolded. That creates a highly stabilized, repetitive lattice.
Can you use amyloid β-sheets as materials?
Yes, amyloid β-sheet structures can be used as materials. Amyloid fibrils have remarkable mechanical properties. Their stiffness rivals silk and even steel on a weight basis. They self-assemble spontaneously under mild conditions (water, room temperature). They’re nanoscale fibers with predictable dimensions. People are exploring amyloid-based materials for biomaterials and scaffolds for tissue engineering, nanowires and conductive materials, drug delivery systems, adhesives and coatings, and biodegradable plastics or films made from peptide assemblies.
Protein Analysis and Visualization
Briefly describe the protein you selected and why you selected it.
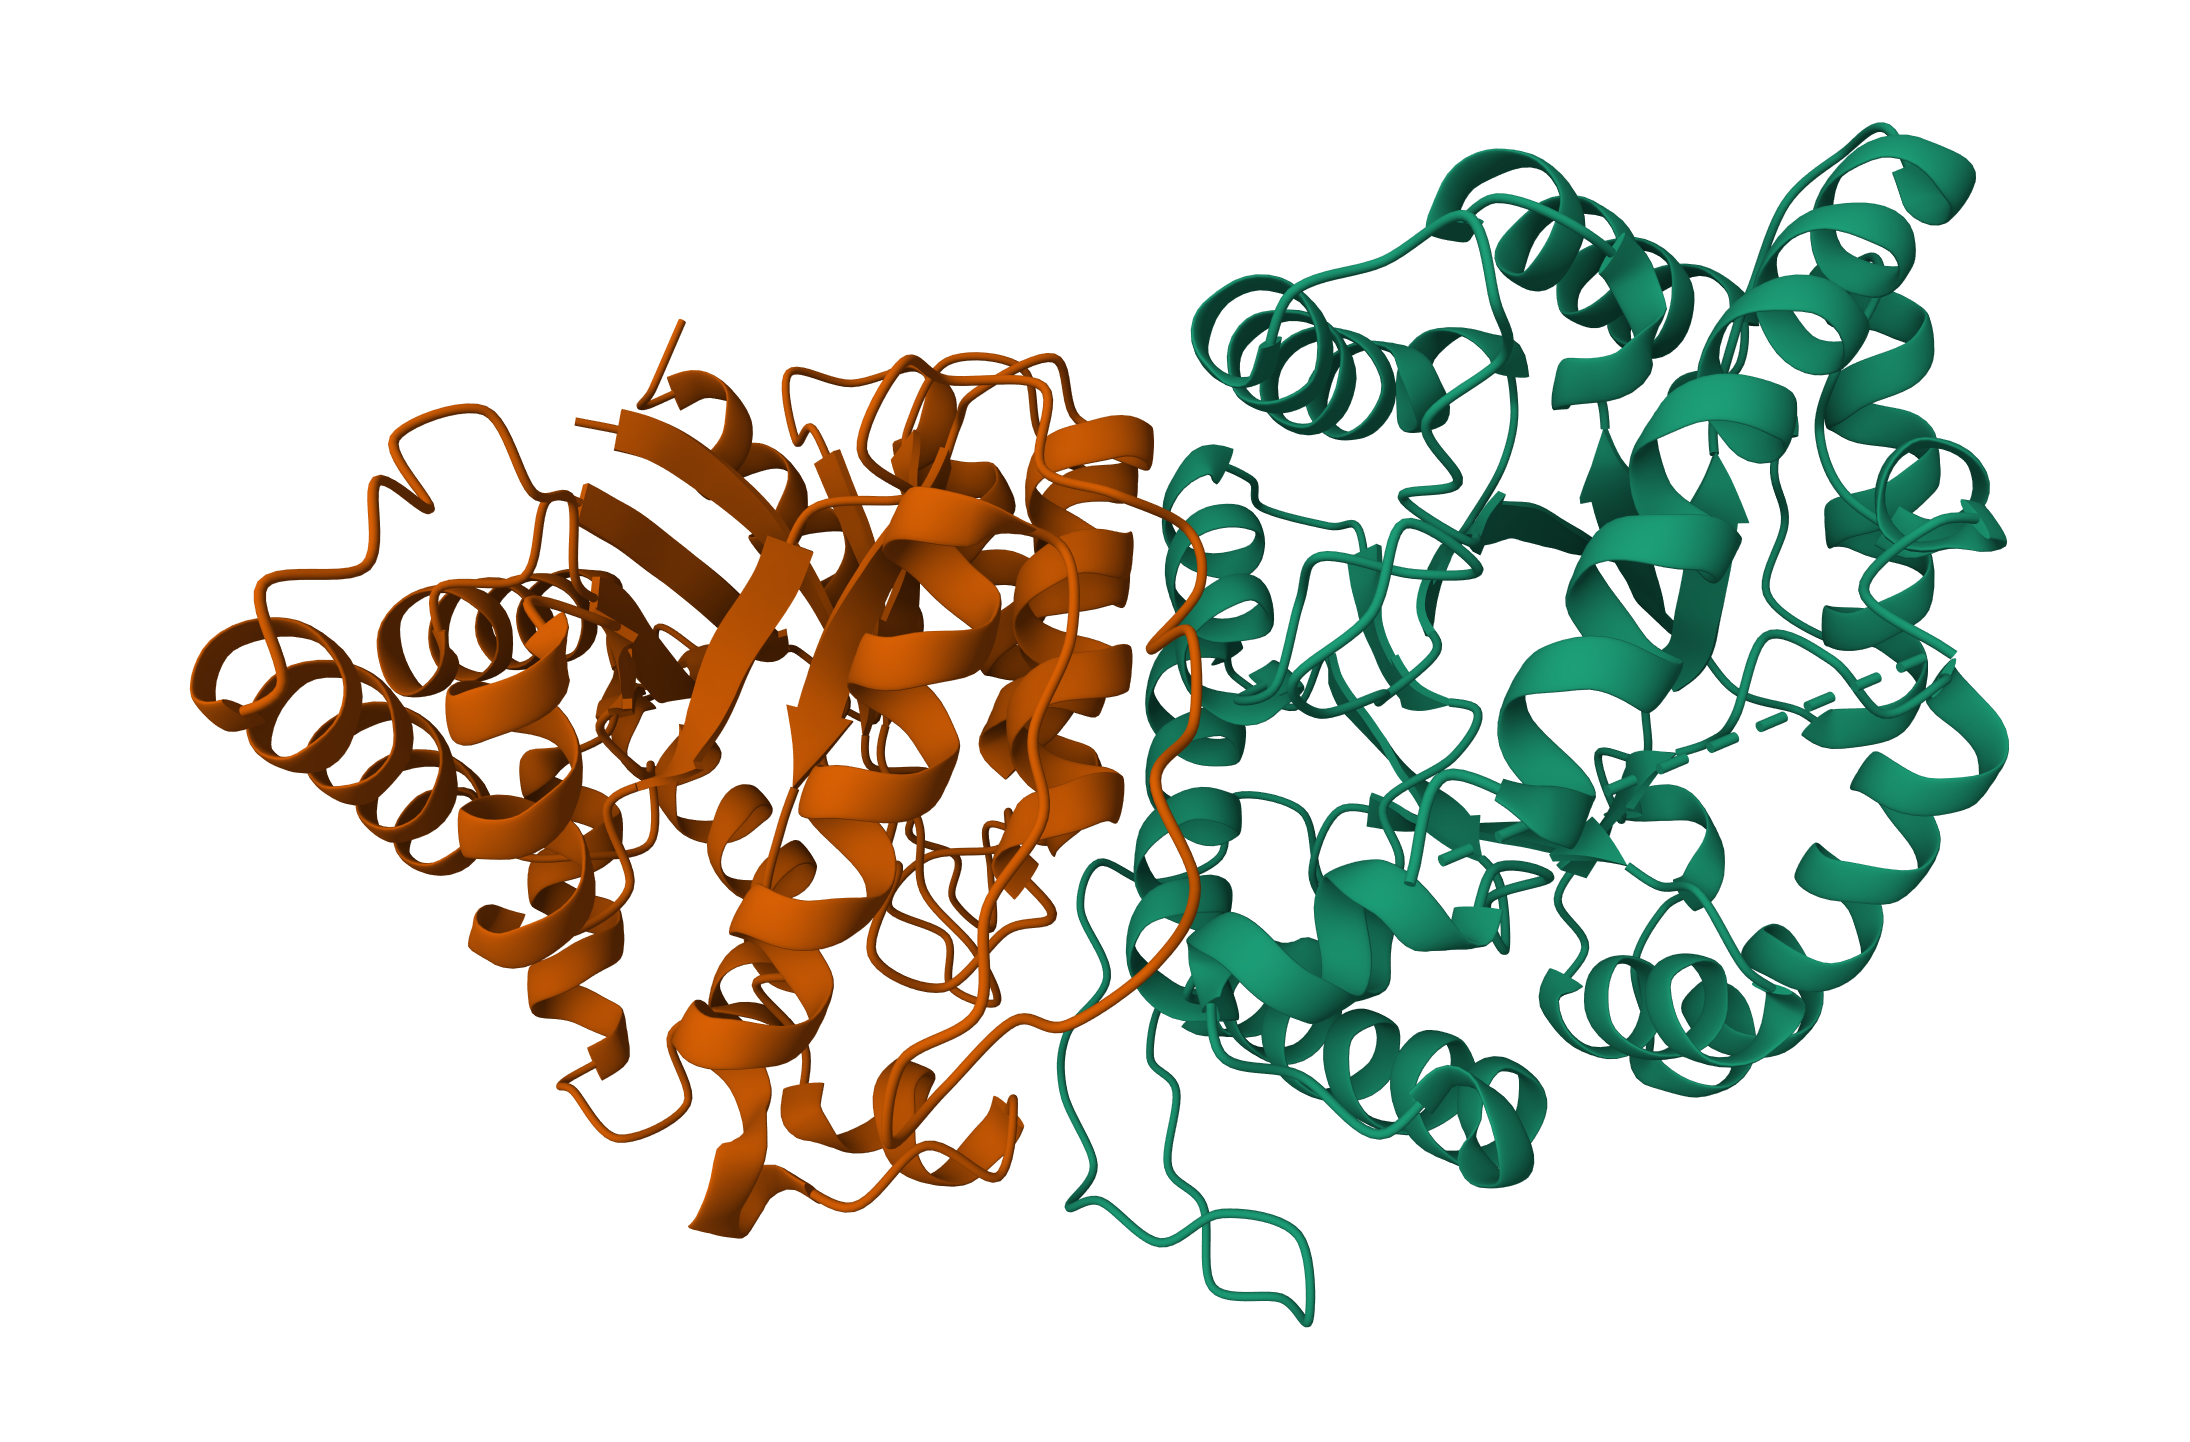
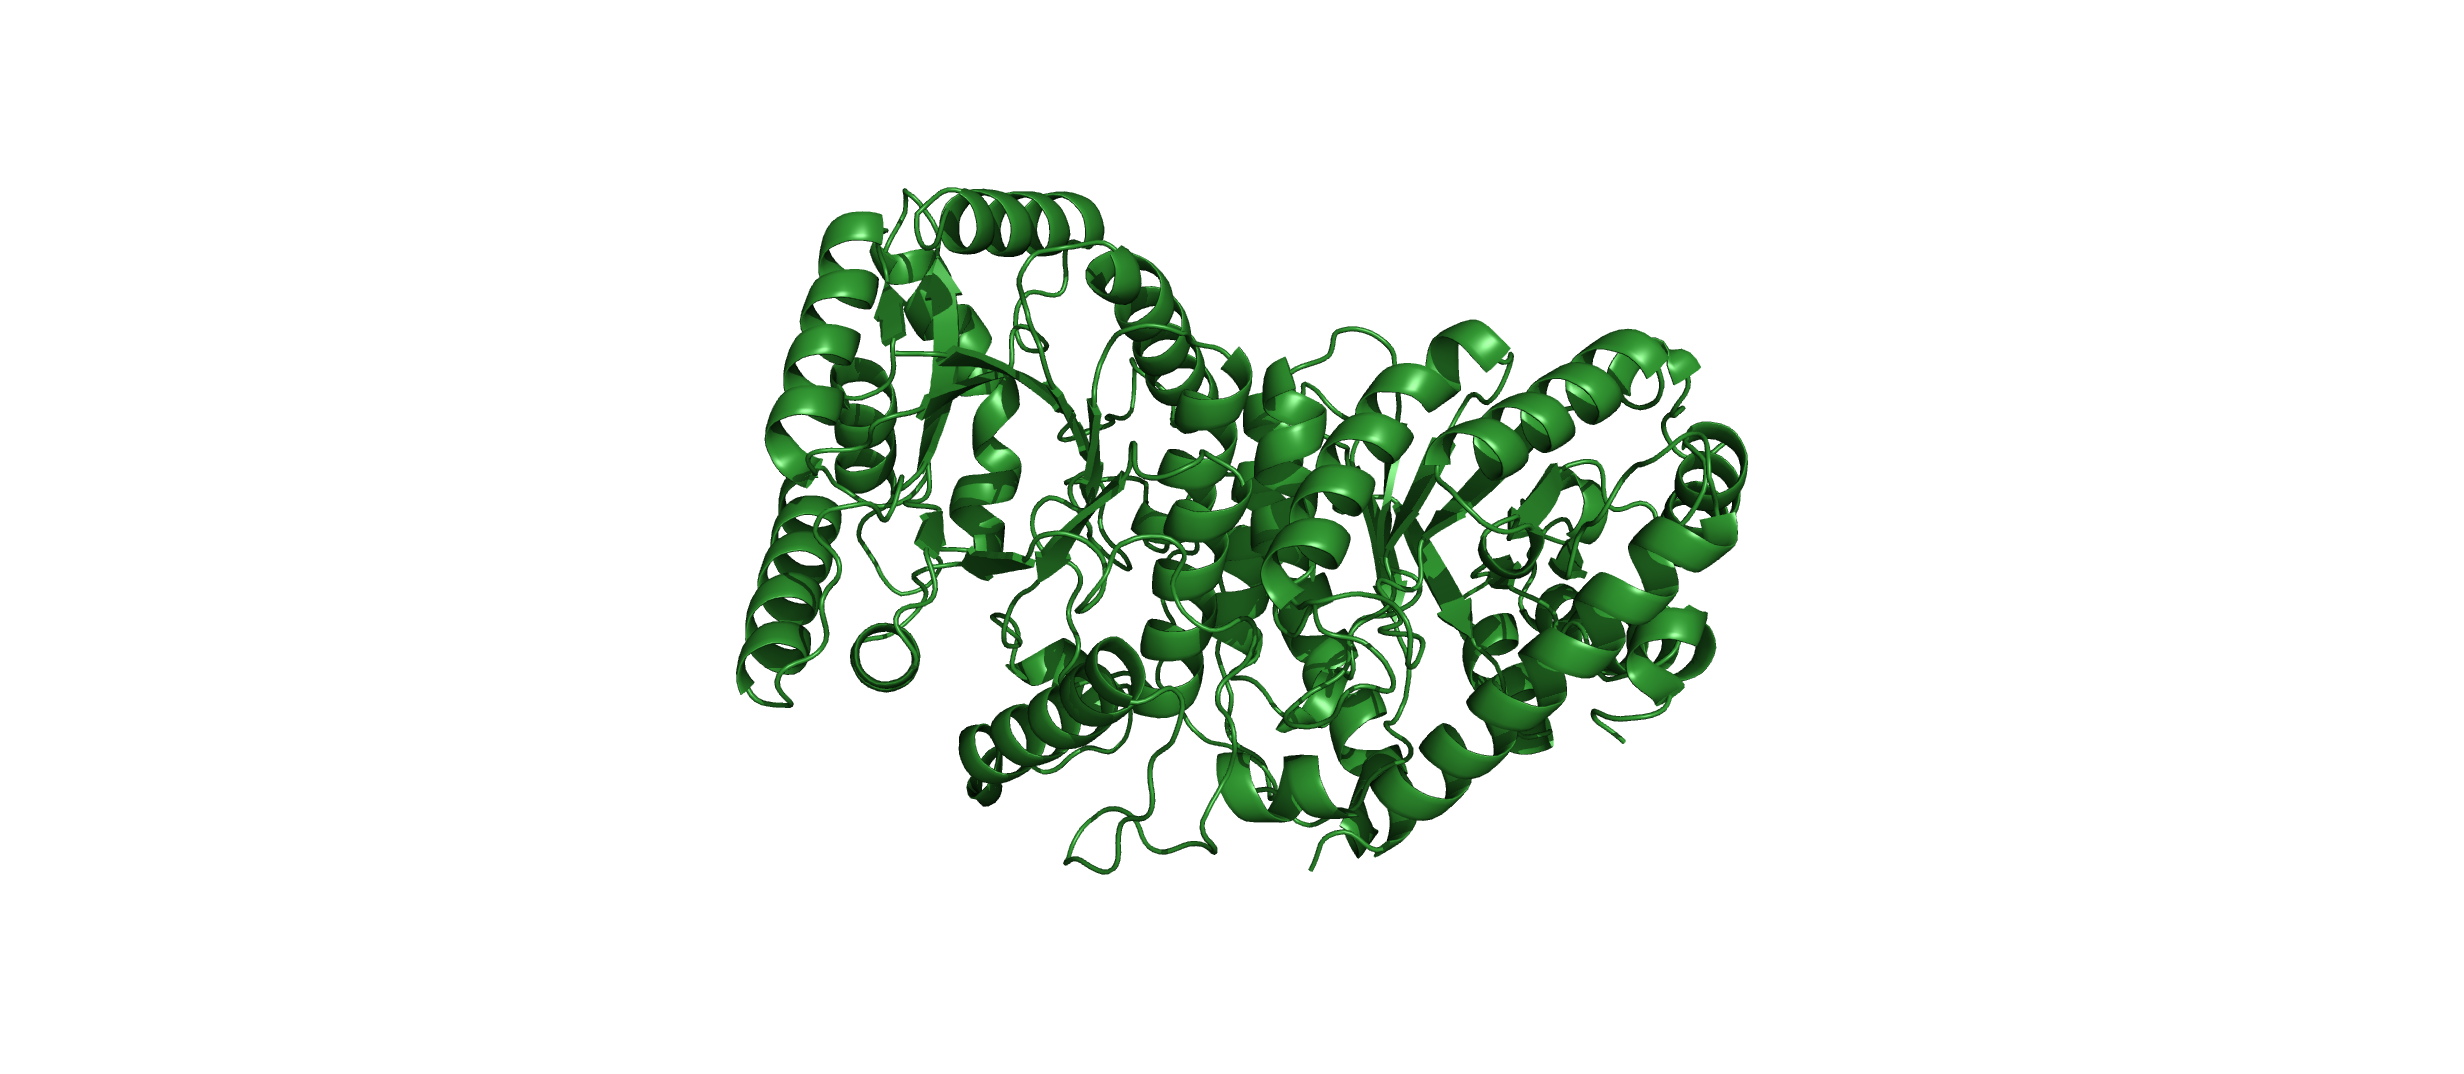
Luciferase (Luz)💡
For my protein I chose the fungal luciferase protein (Luz). I have selected this protein because it is responsible for the light producing reaction in the fungal bioluminescence pathway (FBP).
The length of the protein is 271 amino acids. The most common amino acid is: Leucine (L), which appears 24 times. There are 250 protein sequence homologs for this luciferase protein. This protein would be a part of the luciferase protein family.
Identify the structure page of your protein in RCSB
An RCSB structure entry could not be found for fungal luciferase. So instead I chose to do the bacterial luciferase (Lux) for this step.
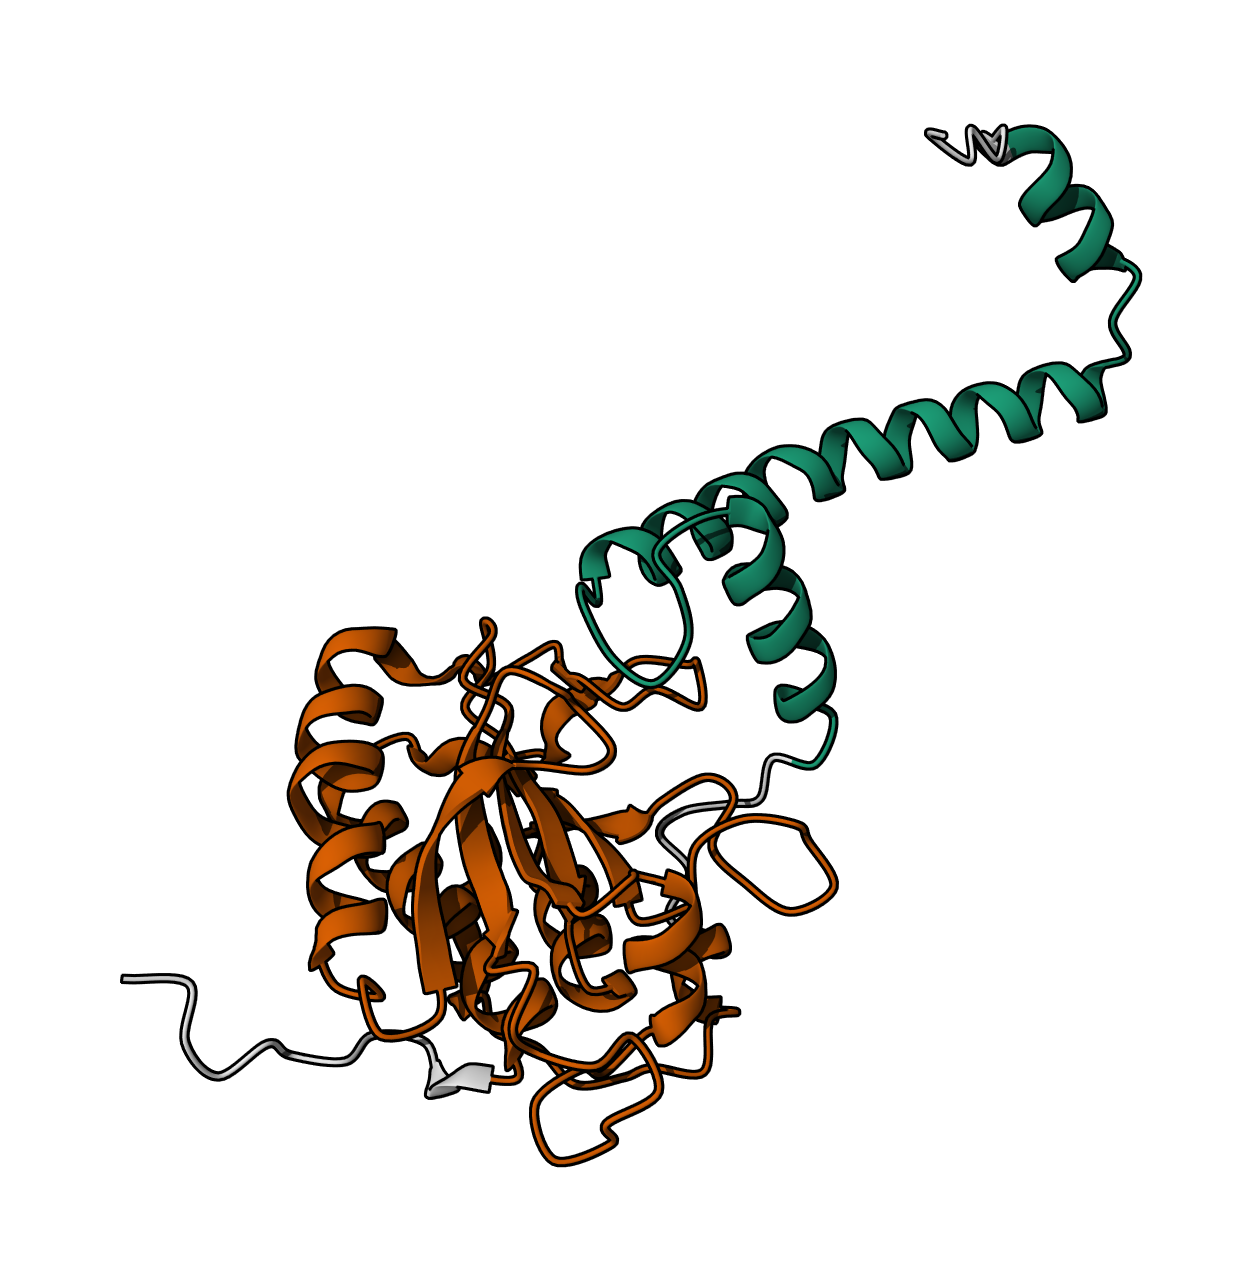
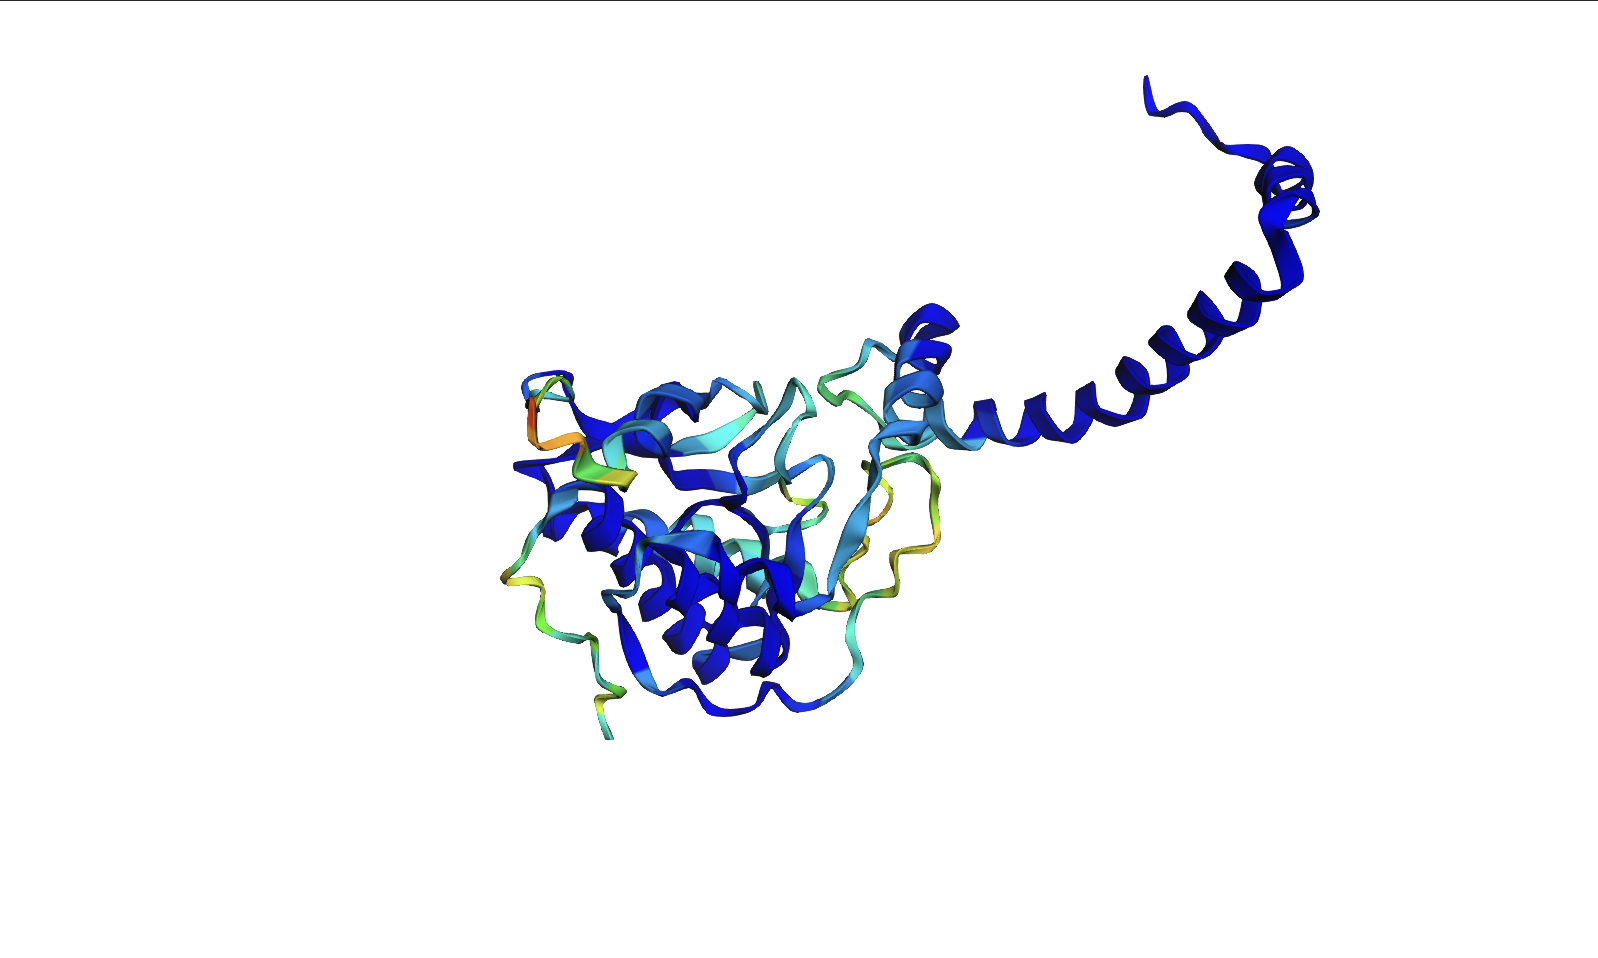
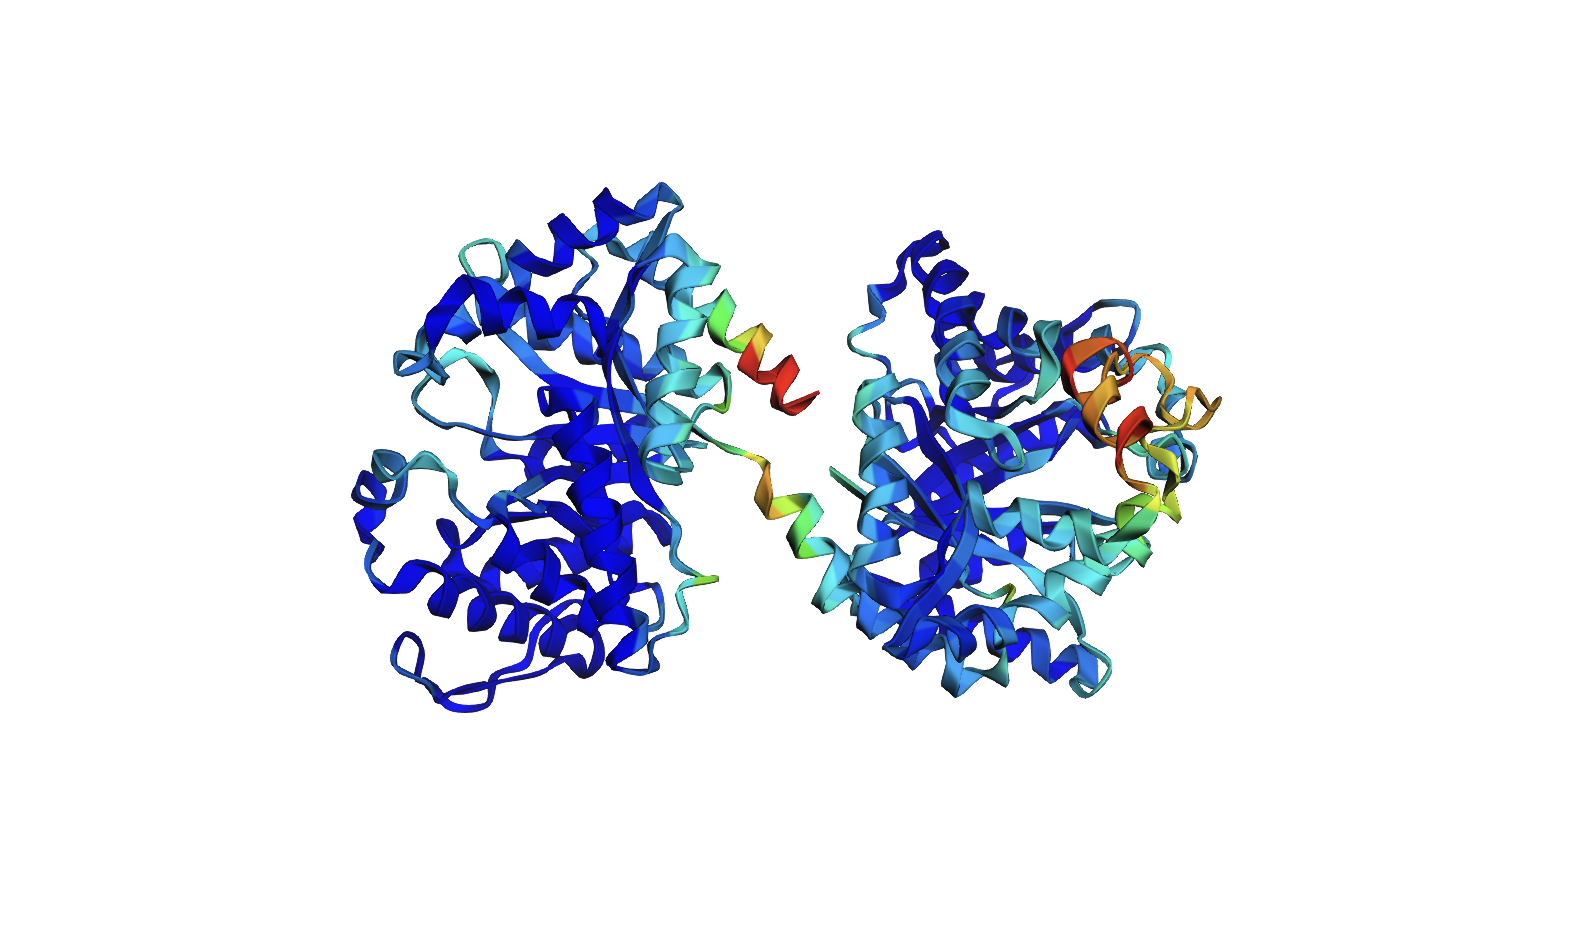
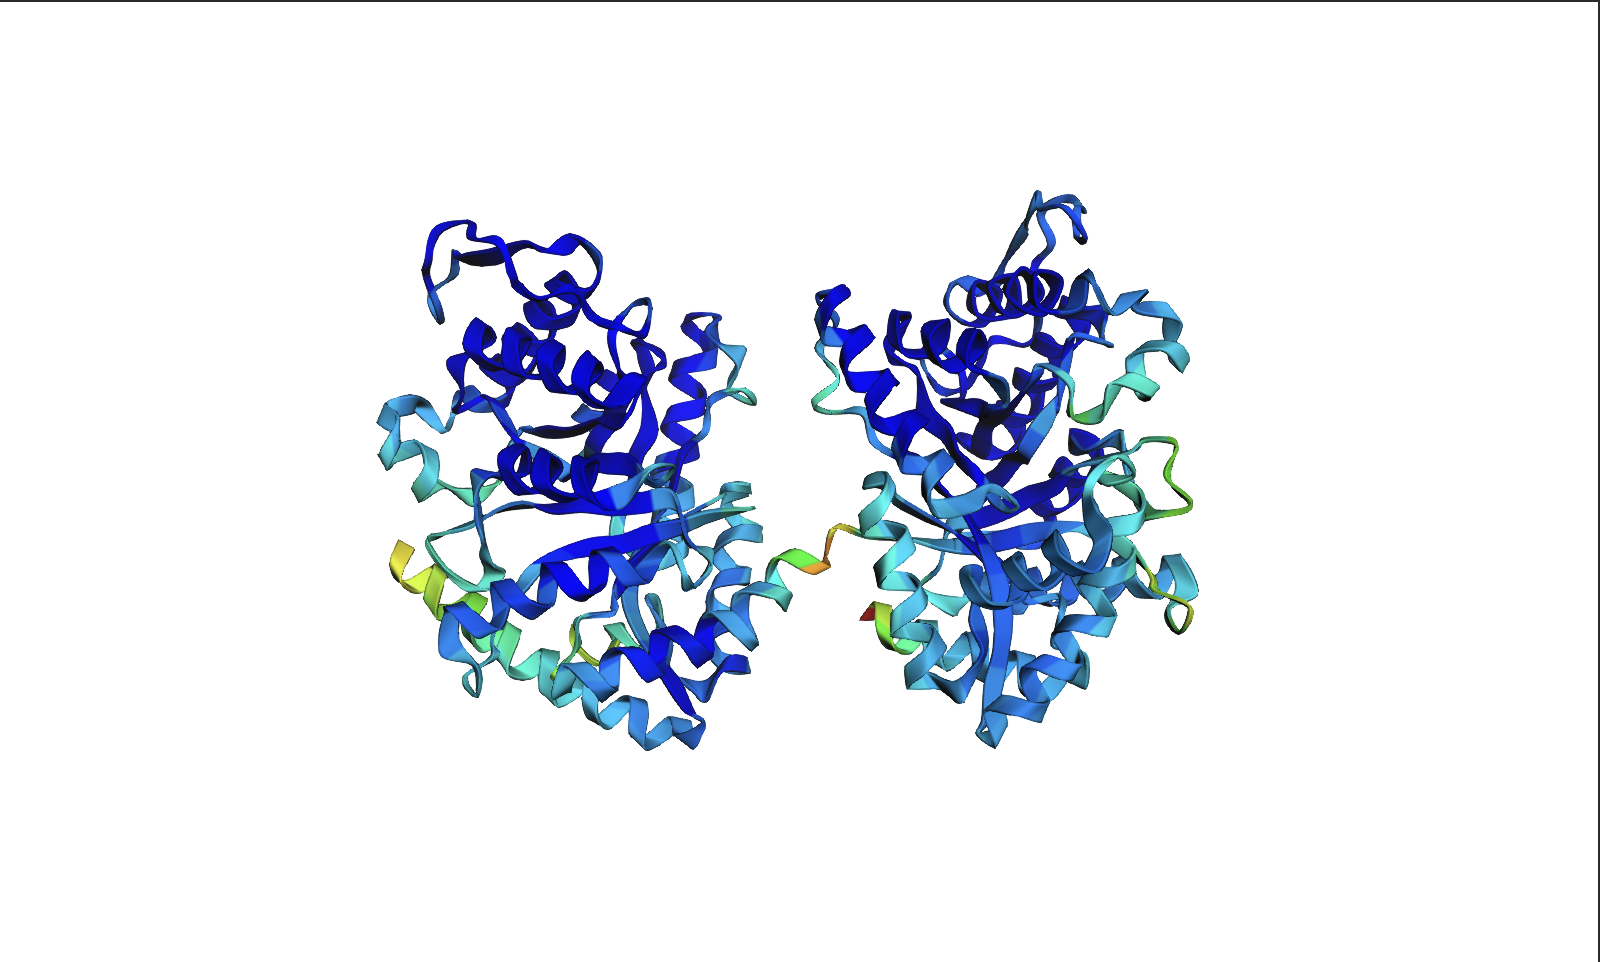
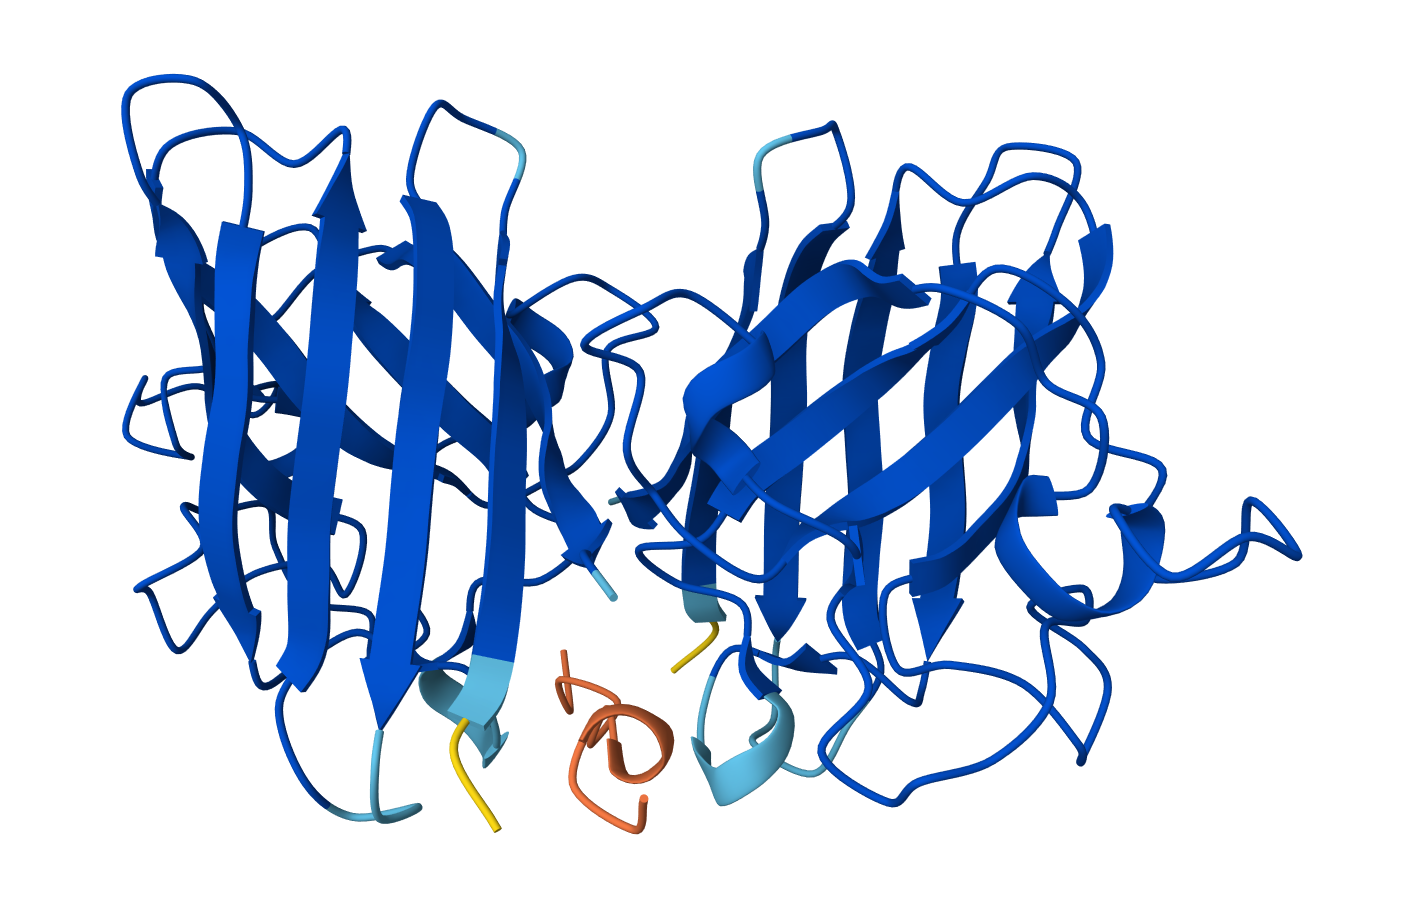
Bacterial Luciferase (Lux) 💡 RCSB Info:
The structure was solved in 1996. It is a good quality structure the resolution is 1.50 Å. The structure was determined in the absence of substrates. Bacterial luciferase (Lux) belongs to the alkanal monooxygenase family structure classification.
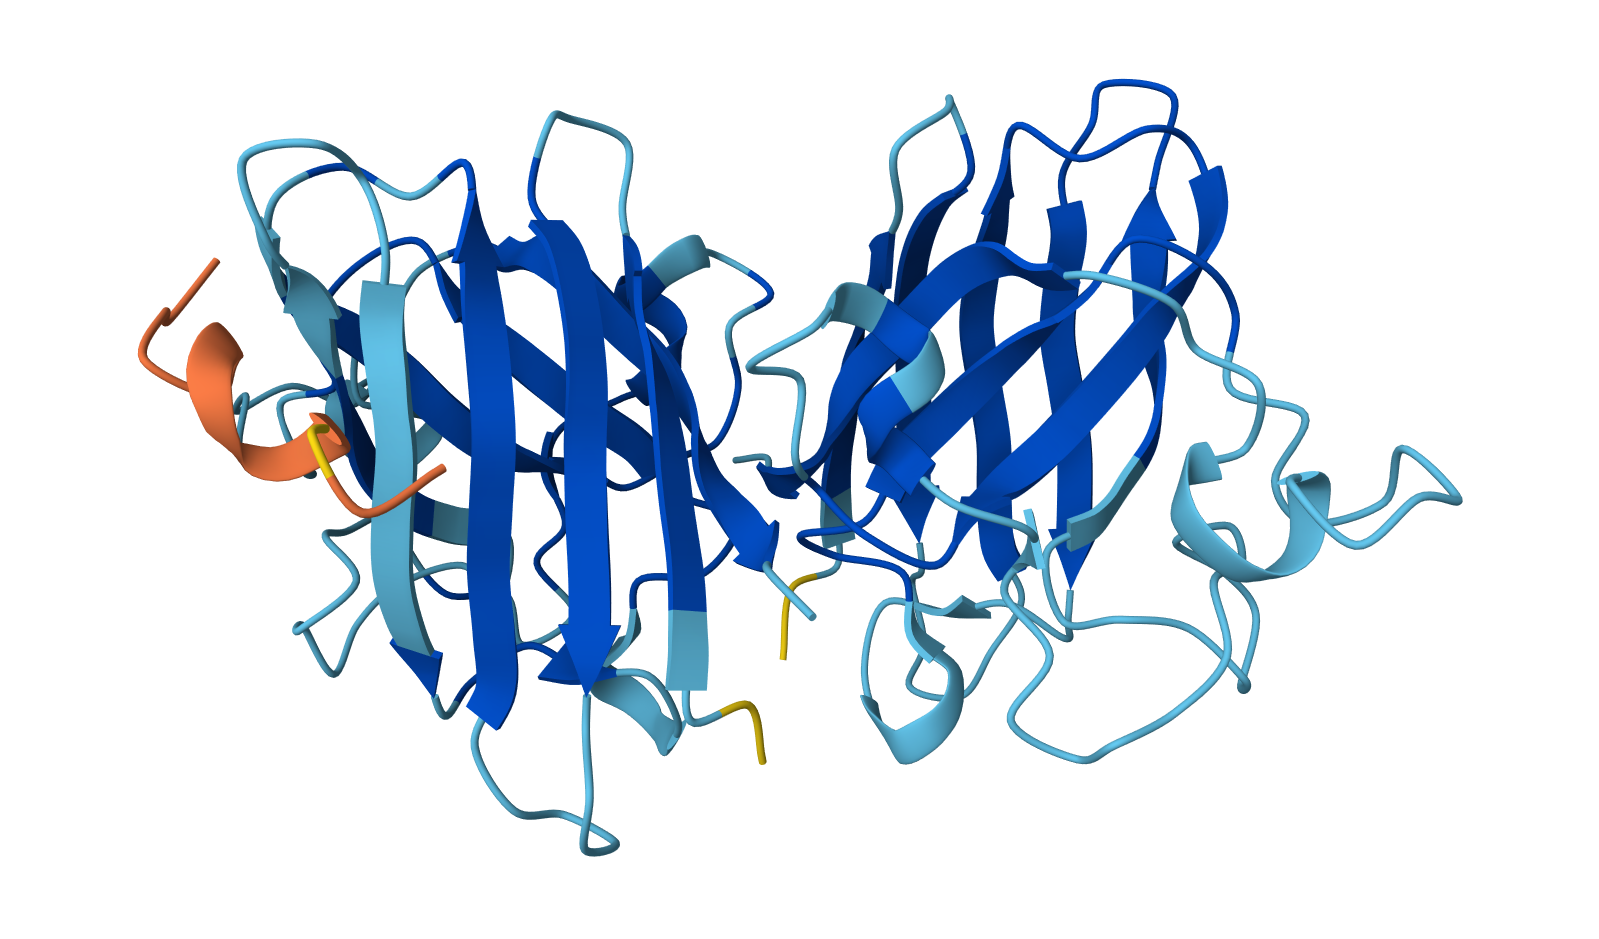
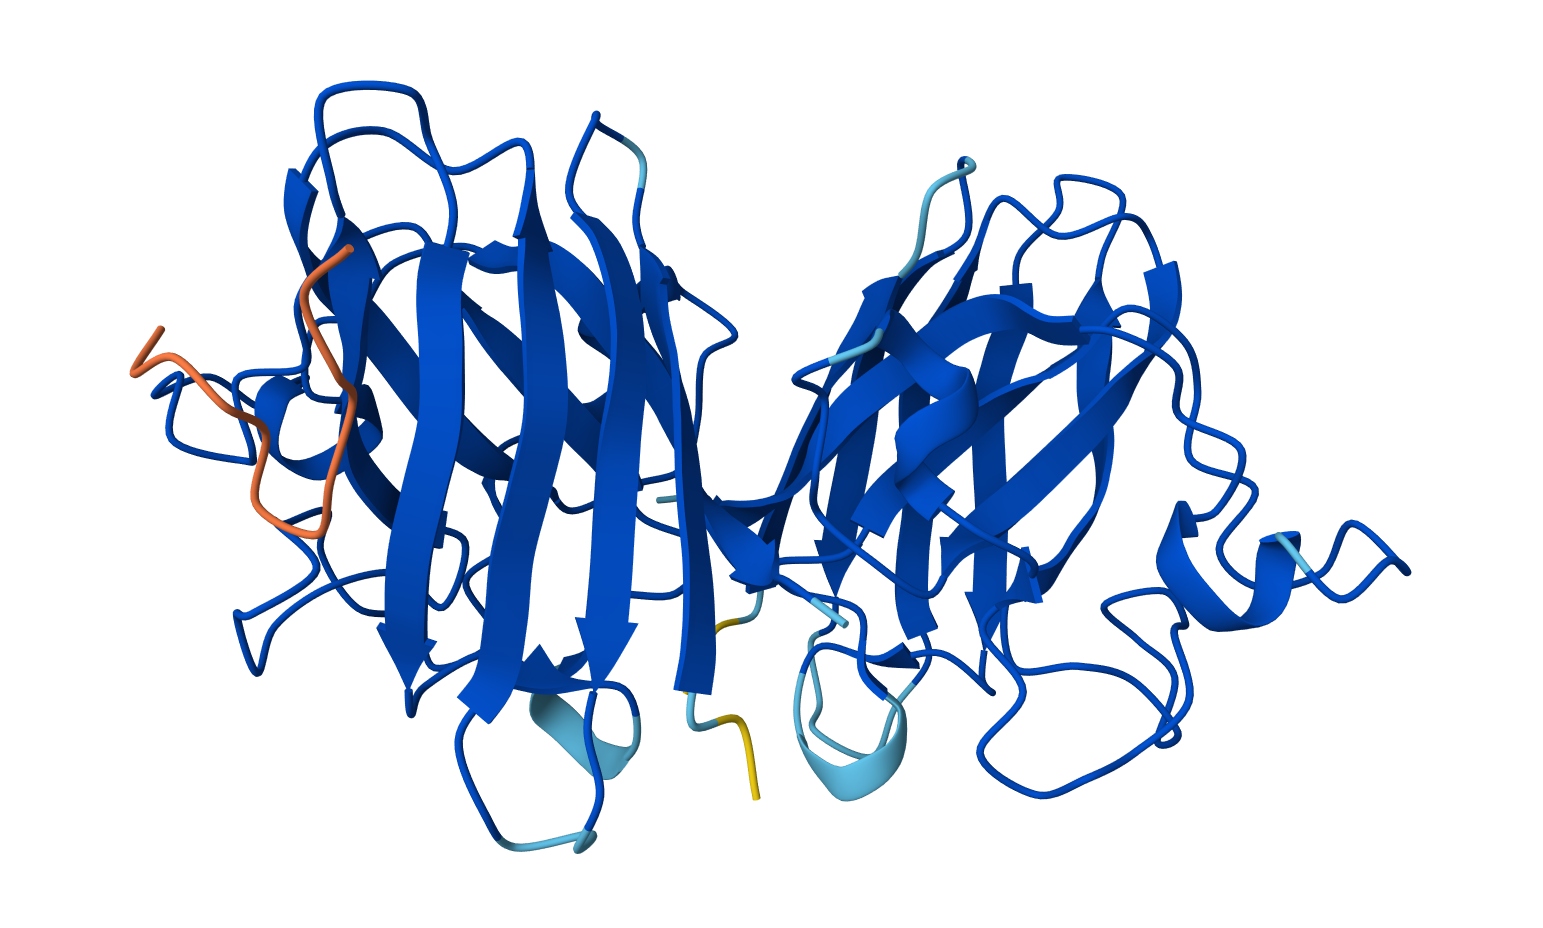
Open the structure of your protein in any 3D molecule visualization software:
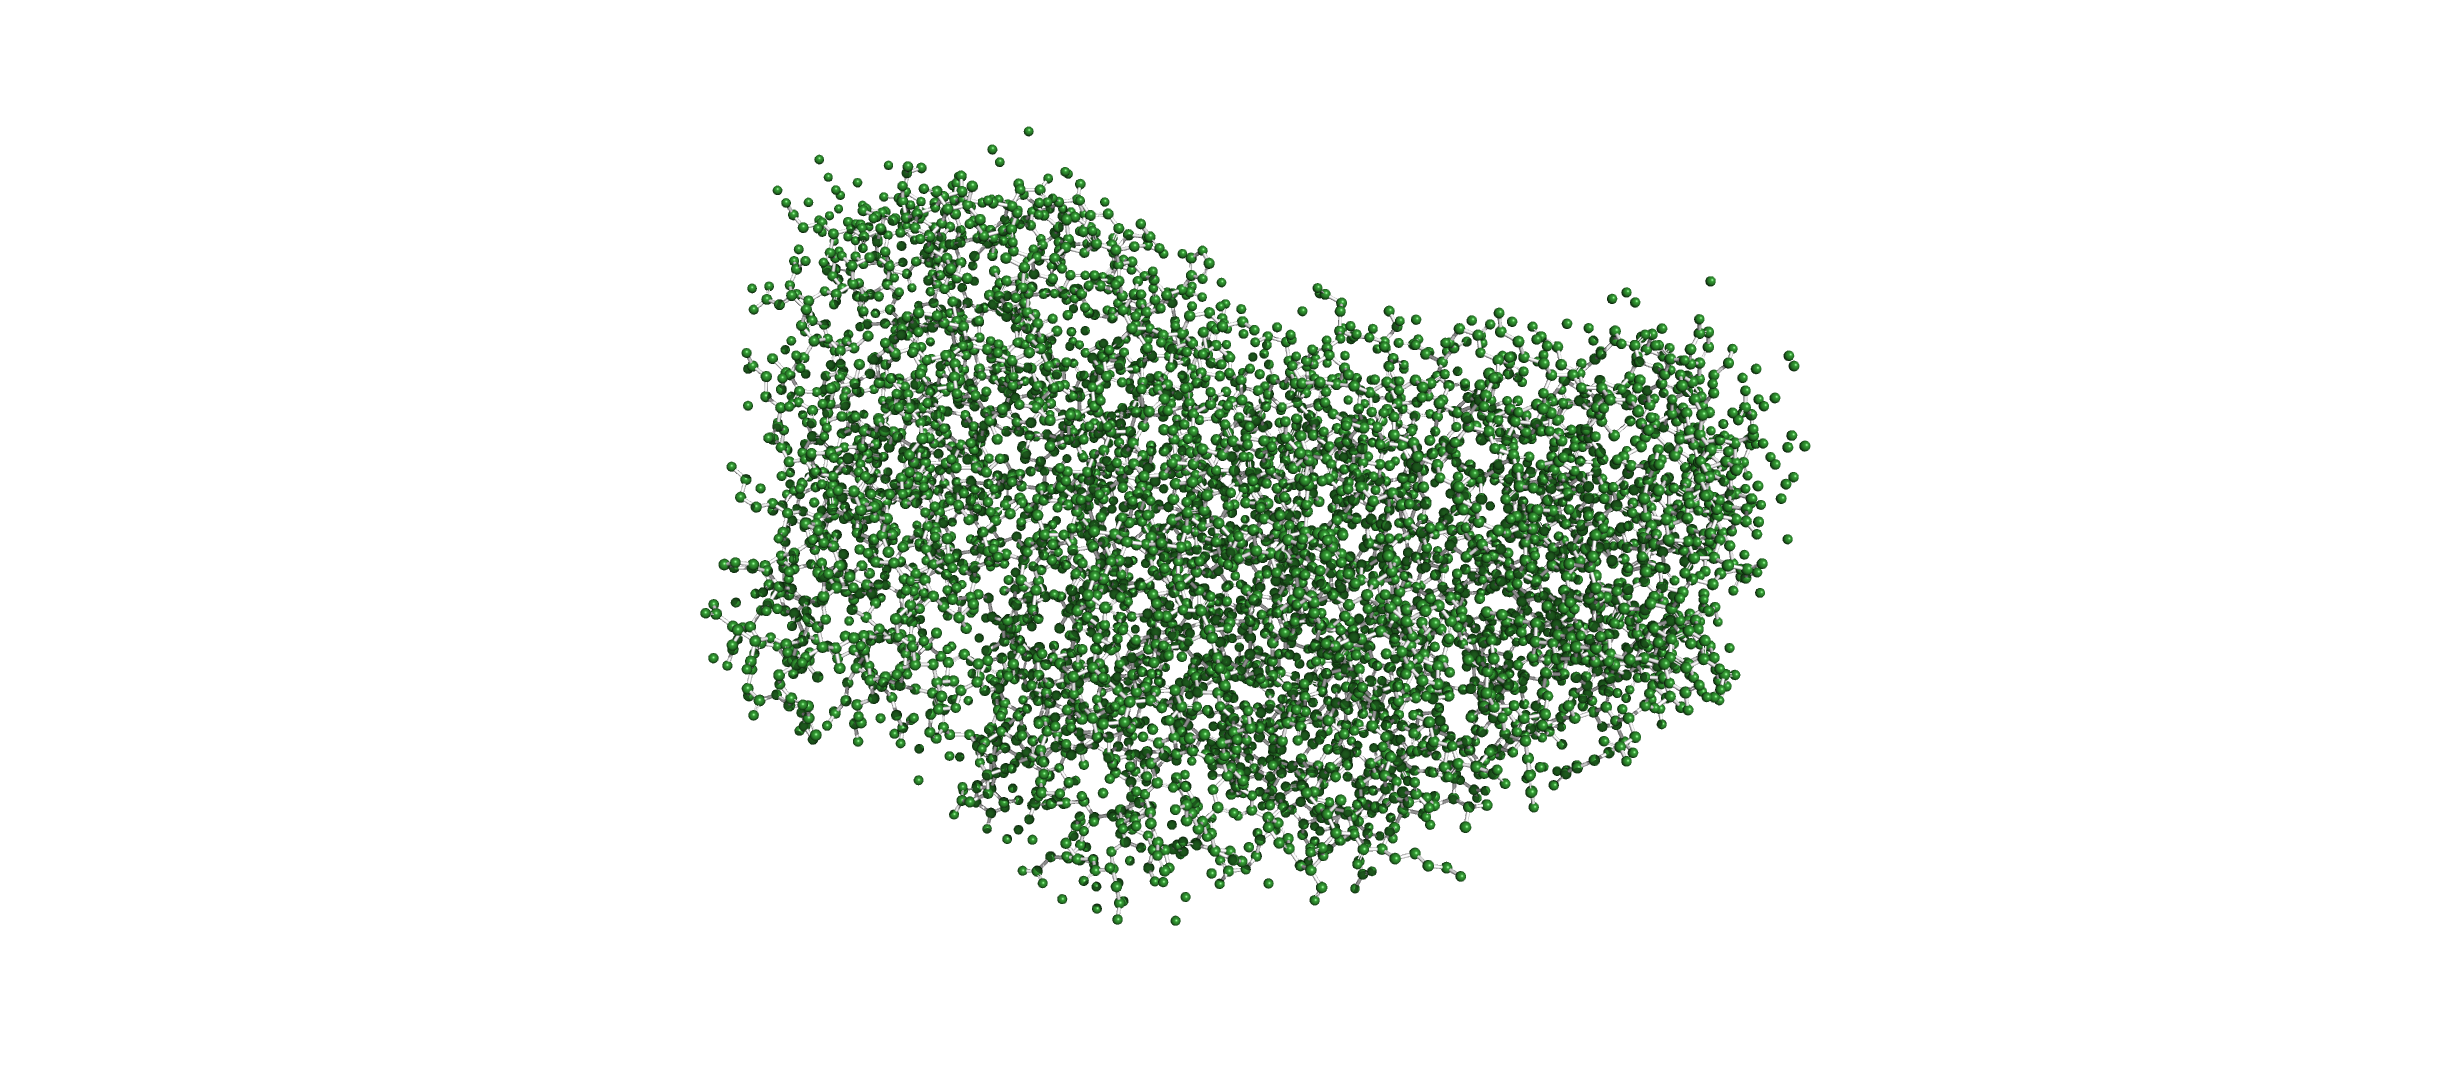
Visualize the protein as “cartoon”, “ribbon” and “ball and stick”.
Cartoon:
Ribbon:
Ball and Stick:
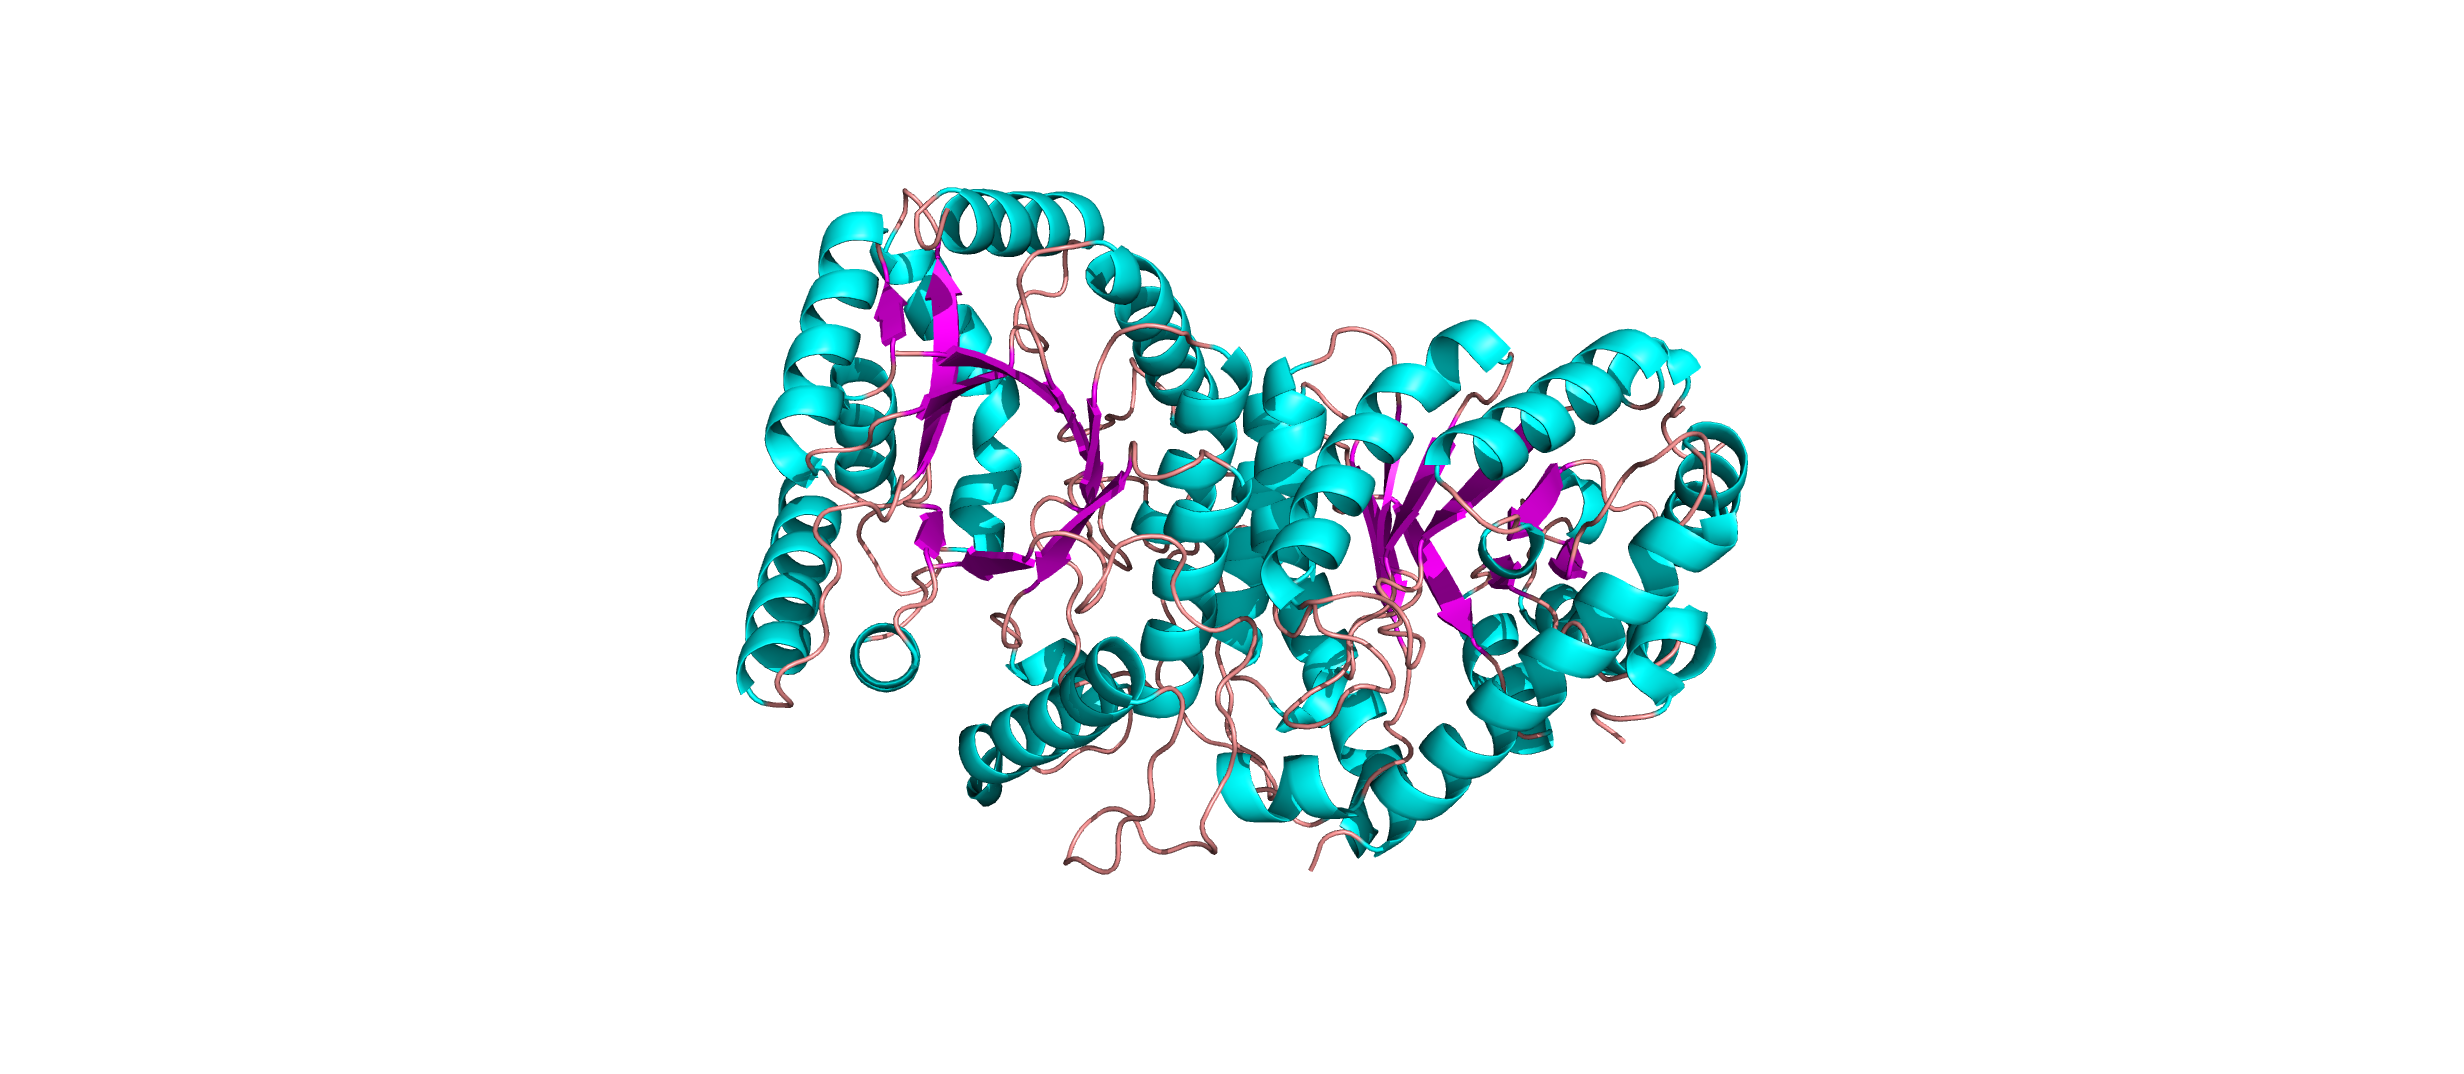
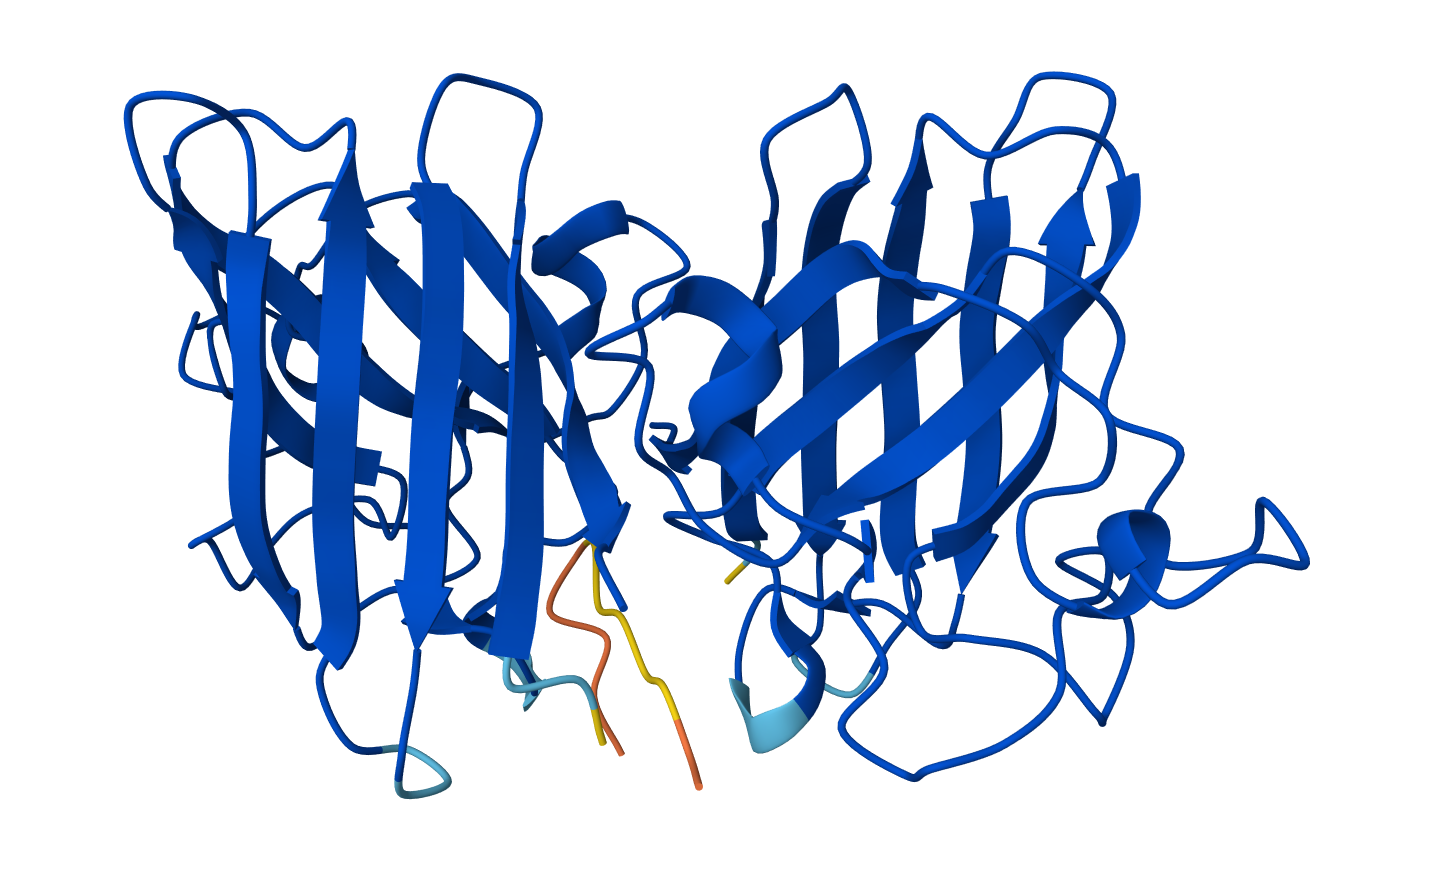
Color the protein by secondary structure. Does it have more helices or sheets?
The protein has more helices than sheets. I counted roughly 9 sheets and 24 helices.
Secondary structure:
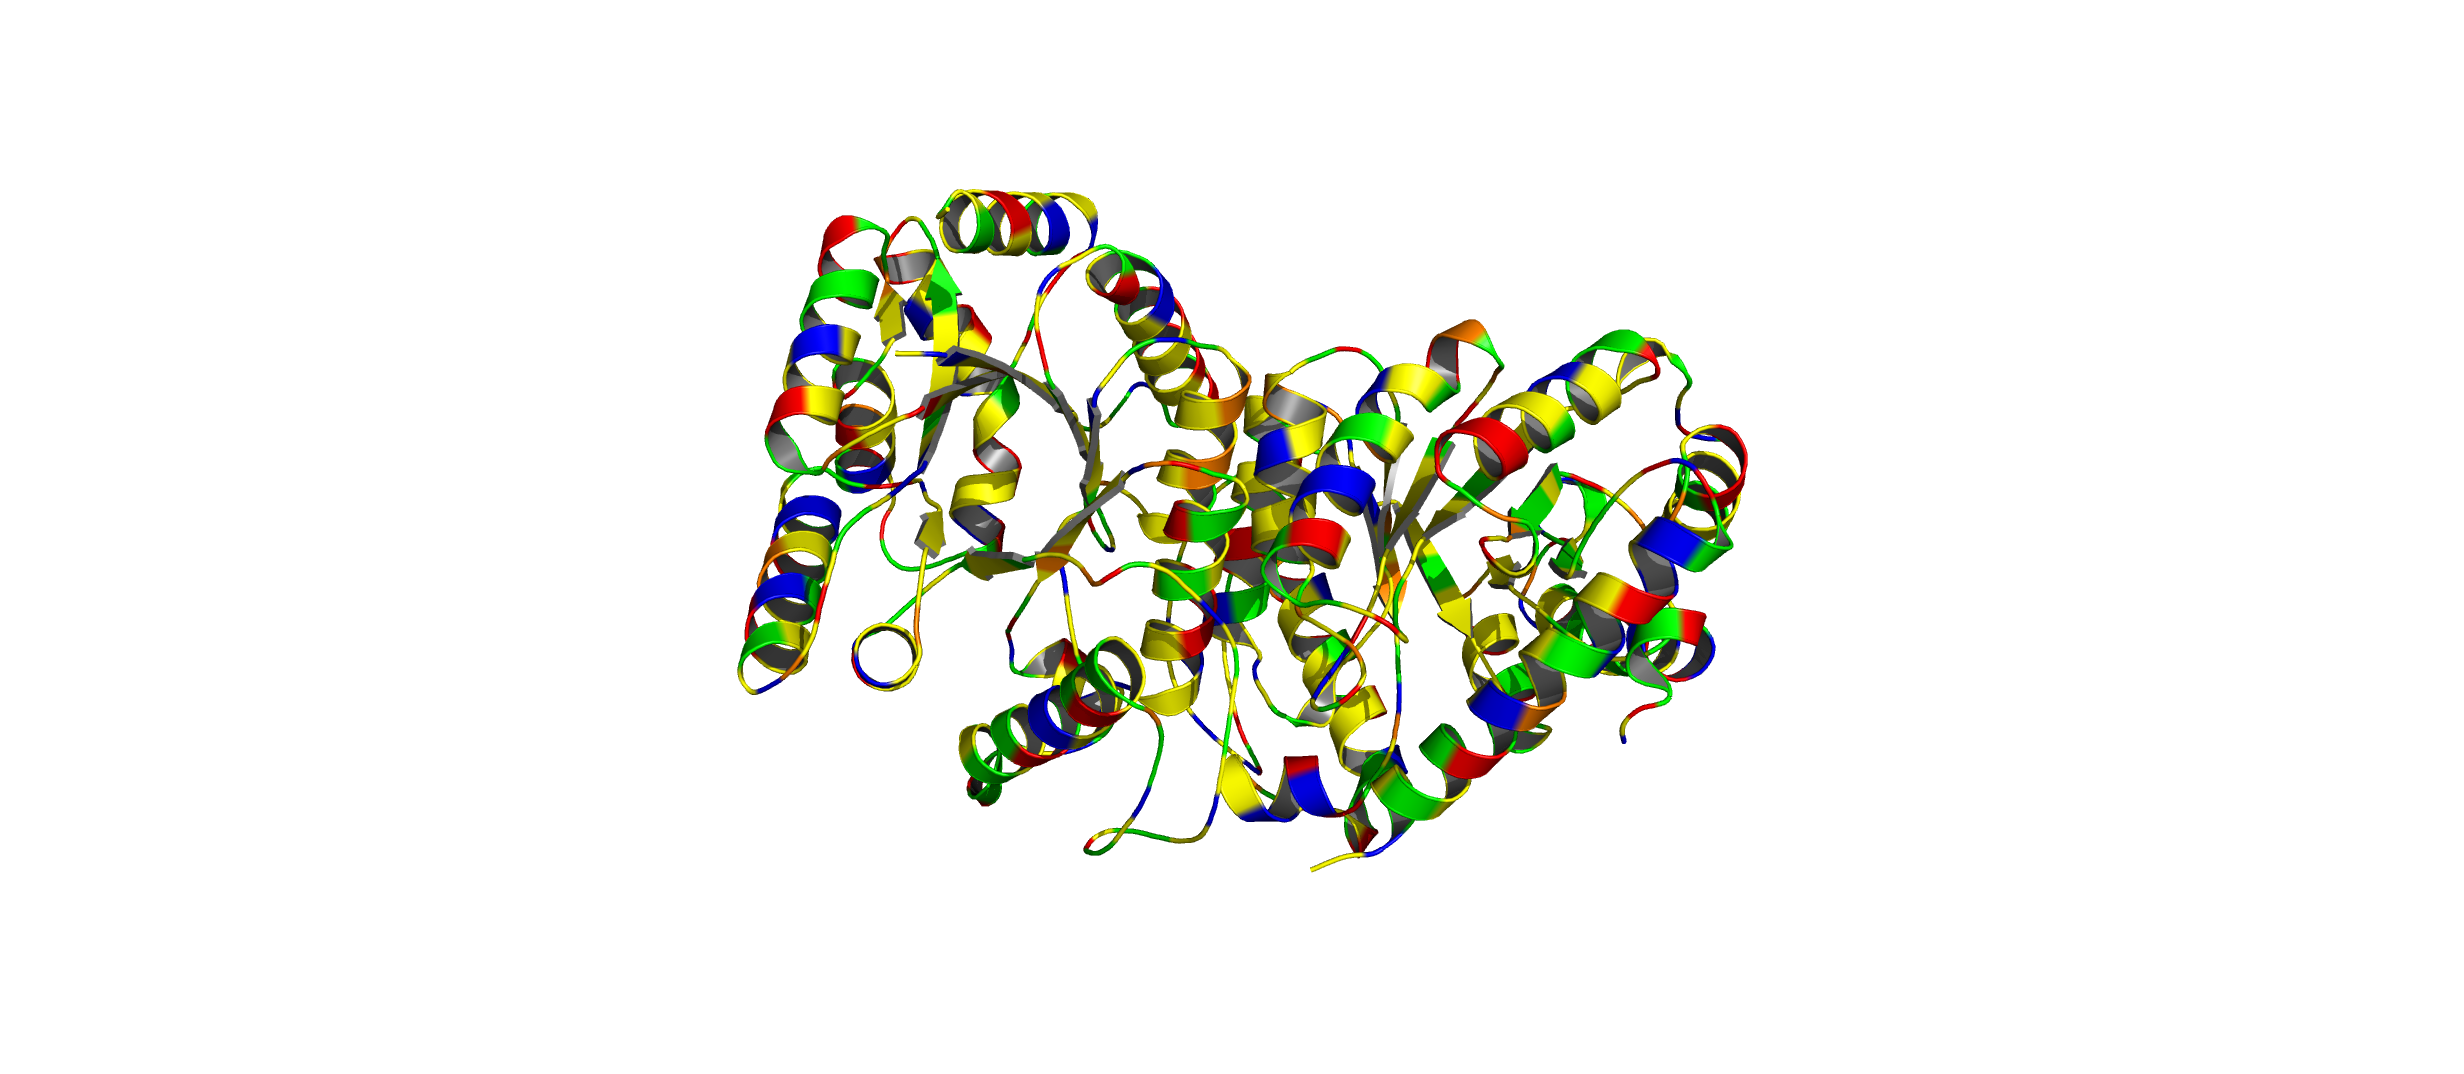
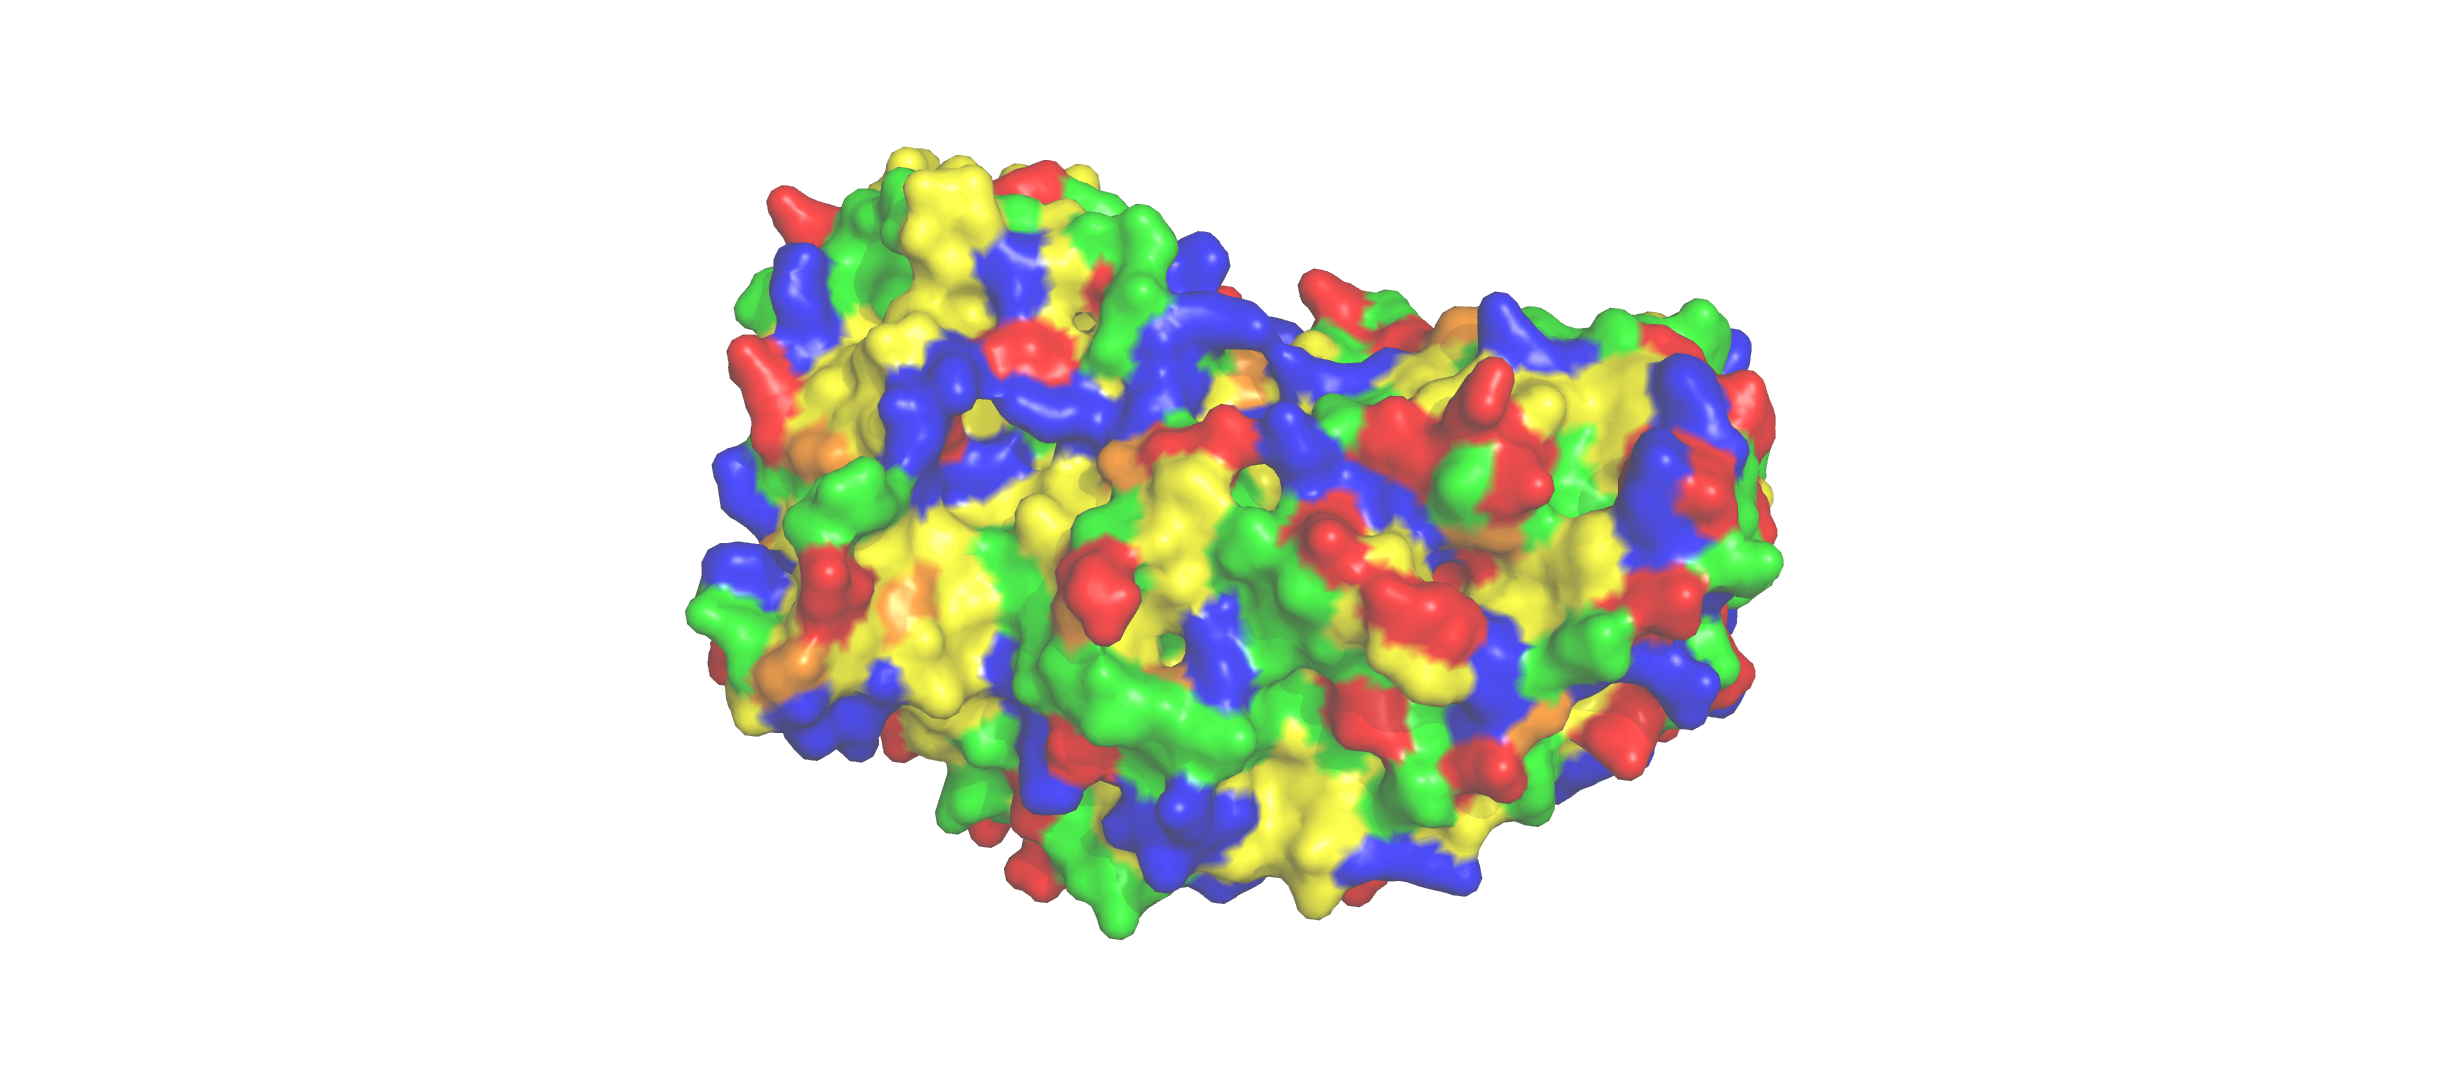
Color the protein by residue type. What can you tell about the distribution of hydrophobic vs hydrophilic residues?
The hydrophobic residues (yellow) cluster predominantly in the interior of the helical bundles and sheet cores, while the hydrophilic/charged residues (green, blue, red) decorate the surface and loop regions. That pattern tells us the protein has a well formed hydrophobic core. Also, the charged residues are surface-biased. The blue (positively charged) and red (negatively charged) patches tend to sit on solvent-exposed faces and flexible loops.
Visualize the surface of the protein. Does it have any “holes” (aka binding pockets)?
Yes there are holes.
Using ML-Based Protein Design Tools
Protein Language Modelling
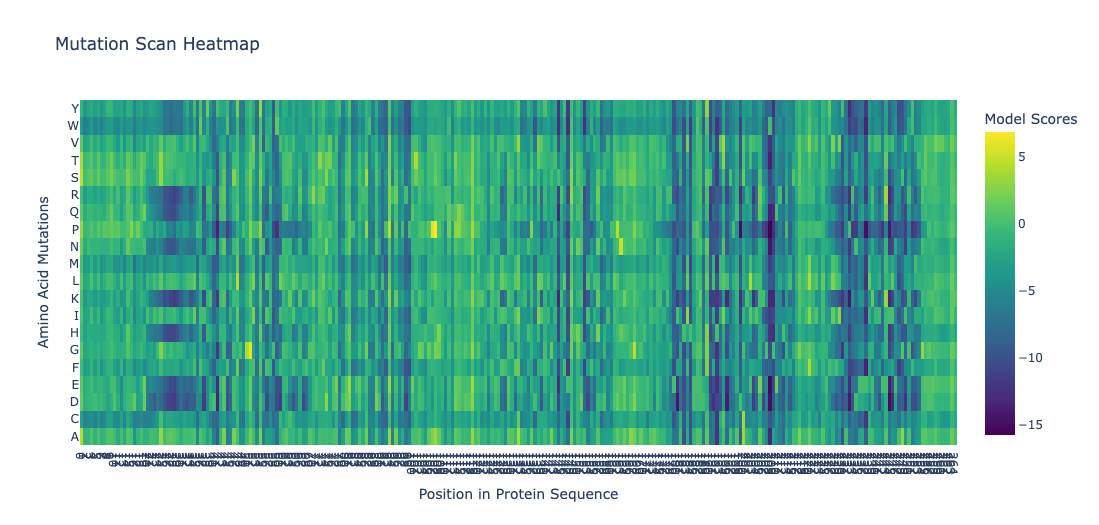
Deep Mutational Scans
Position 30 (Leucine) shows strongly negative scores for most substitutions. This indicatces that most mutations at this site are disfavored. Particularly proline and glycine, indicating this residue is highly conserved. This is consistent with the position being structurally or functionally critical. Proline would disrupt backbone geometry, and glycine would introduce excessive flexibility.
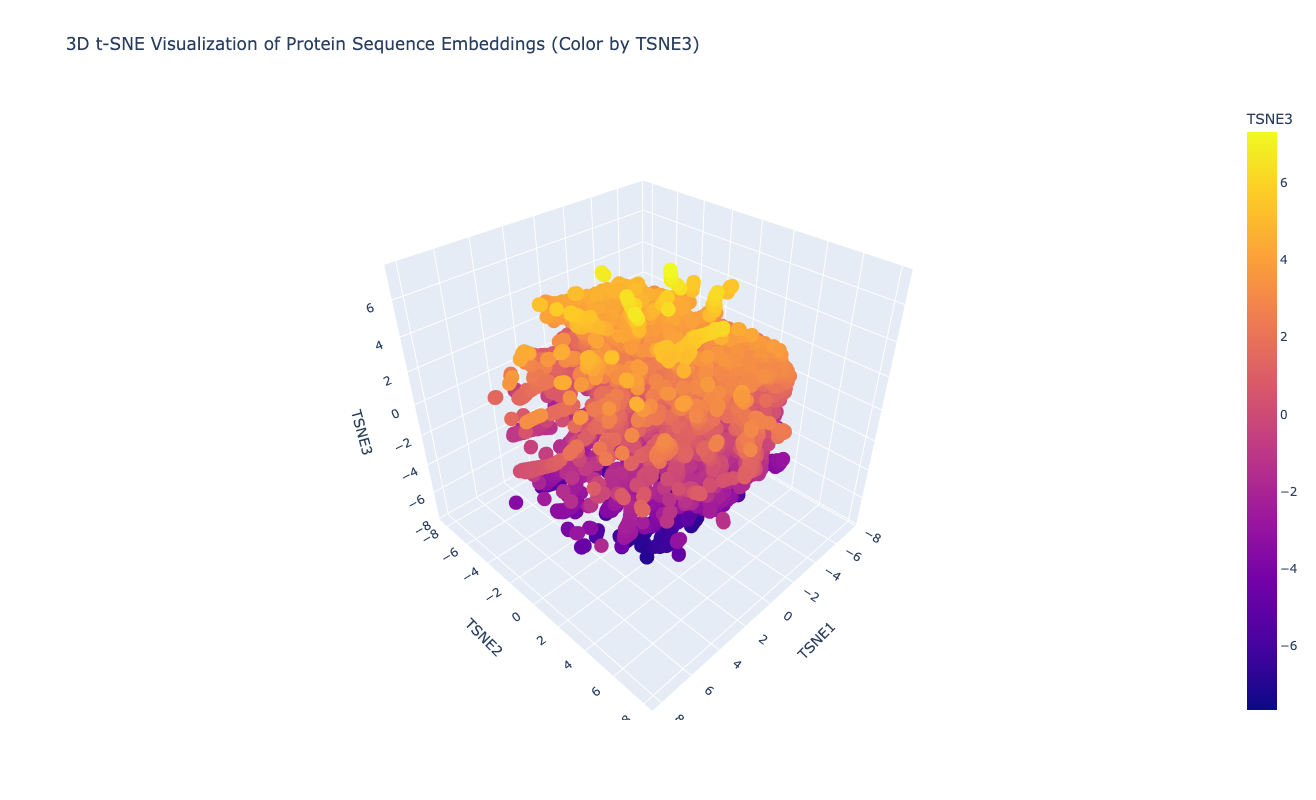
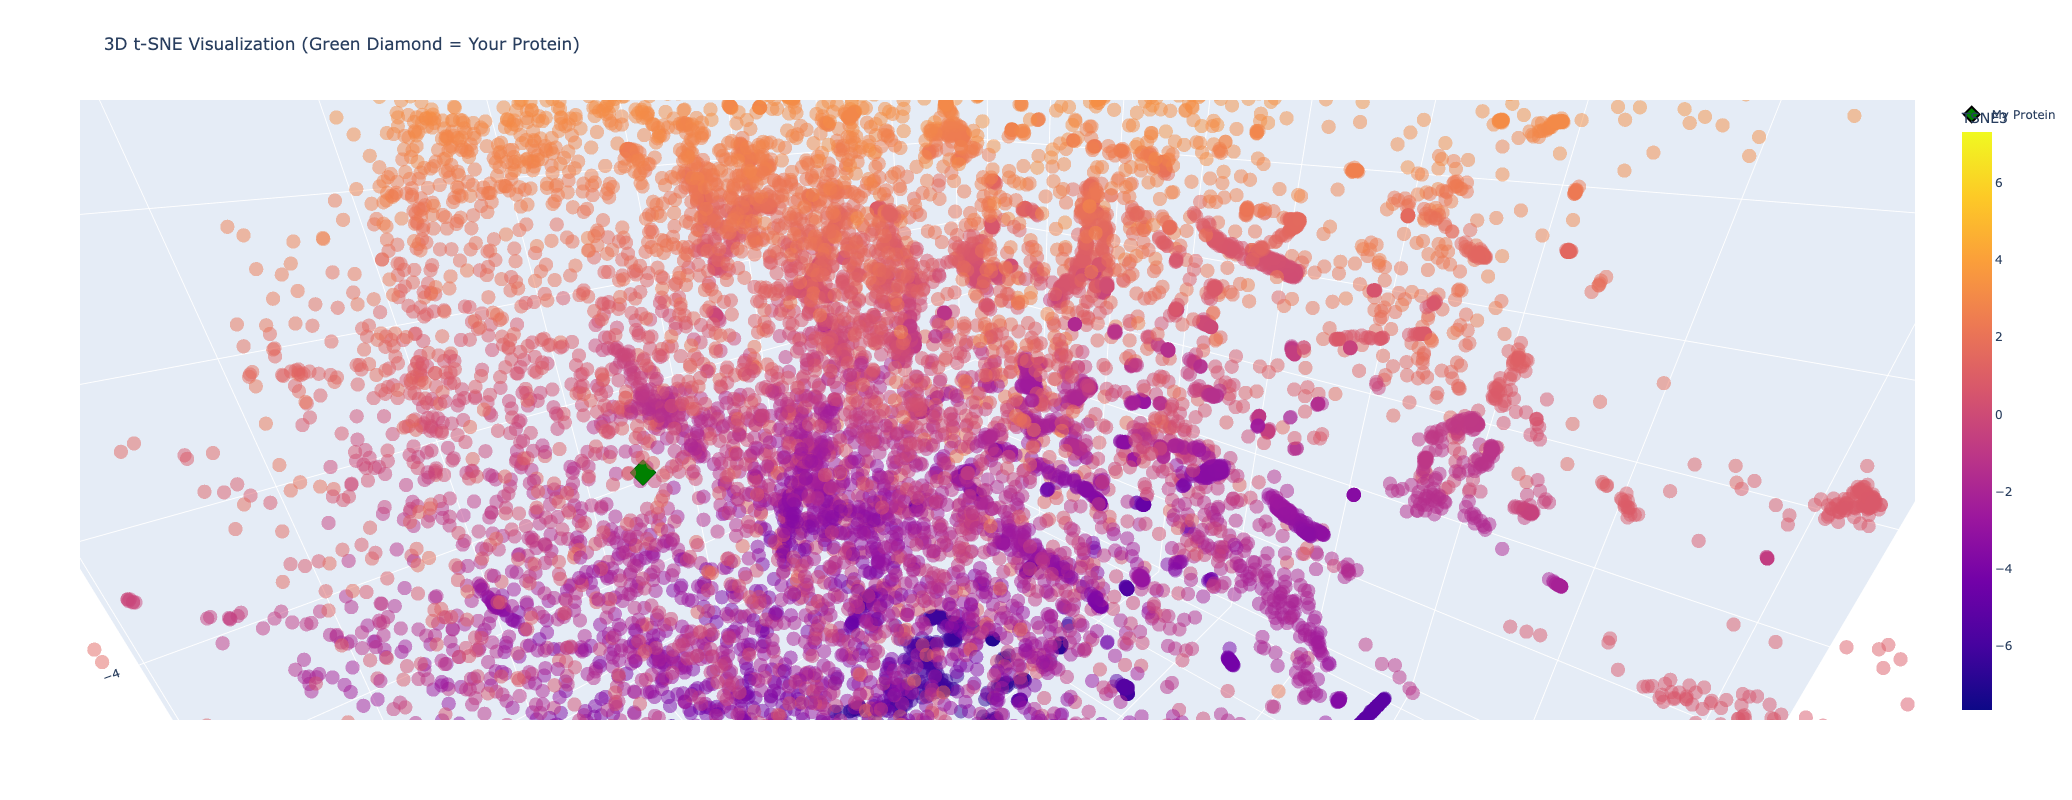
Latent Space Analysis
The latent space does approximates similar proteins. It appears to group them both by evolutionary origin (e.g., similar bacterial species) and biological function (e.g., repressors), demonstrating that the ESM2 embeddings capture meaningful biological features.
My protein (Luciferase) is positioned within a cluster of structurally related enzymes in the latent space. Its closest neighbors share similar structure classifications, indicating a shared evolutionary origin and structural fold, specifically relating to ATP-dependent ligation and metabolic signaling. This is interesting because luciferases are typically considered to be oxidoreductases. This could mean that the structure of fungal luciferase resembles ATP-dependent ligation and metabolic signaling enzymes more than classic oxidoreductases. Or it could also be possible that fungal luciferase might share an evolutionary ancestor with those enzyme families despite having diverged in function.
Protein Folding
The ESMFold predicted coordinates match the original structure. The protein structure is resilient to mutations. I attempted several single base mutations and even larger segments with no impact on the protein structure. It seems that you would have to make significant changes to the sequence to alter the structure of the protein. I did notice that the confidence started to decrease in certain areas however after various mutations.
Protein Generation
The ProteinMPNN amino acid heatmap shows that the model is highly confident at structurally constrained positions. Comparing the predicted sequence to the original, many positions share the same or chemically similar residues, indicating that ProteinMPNN recovers the biophysical constraints imposed by the backbone structure. There is a stretch of X residues in the predicted sequence that appears to correspond to a low confidence region in the heatmap, likely due to missing or poorly resolved coordinates in the input structure. Overall, the predicted sequence is not a reconstruction of the original but rather an alternative solution. A sequence that folds into a similar 3D structure, diverging at positions where the backbone tolerates variation.
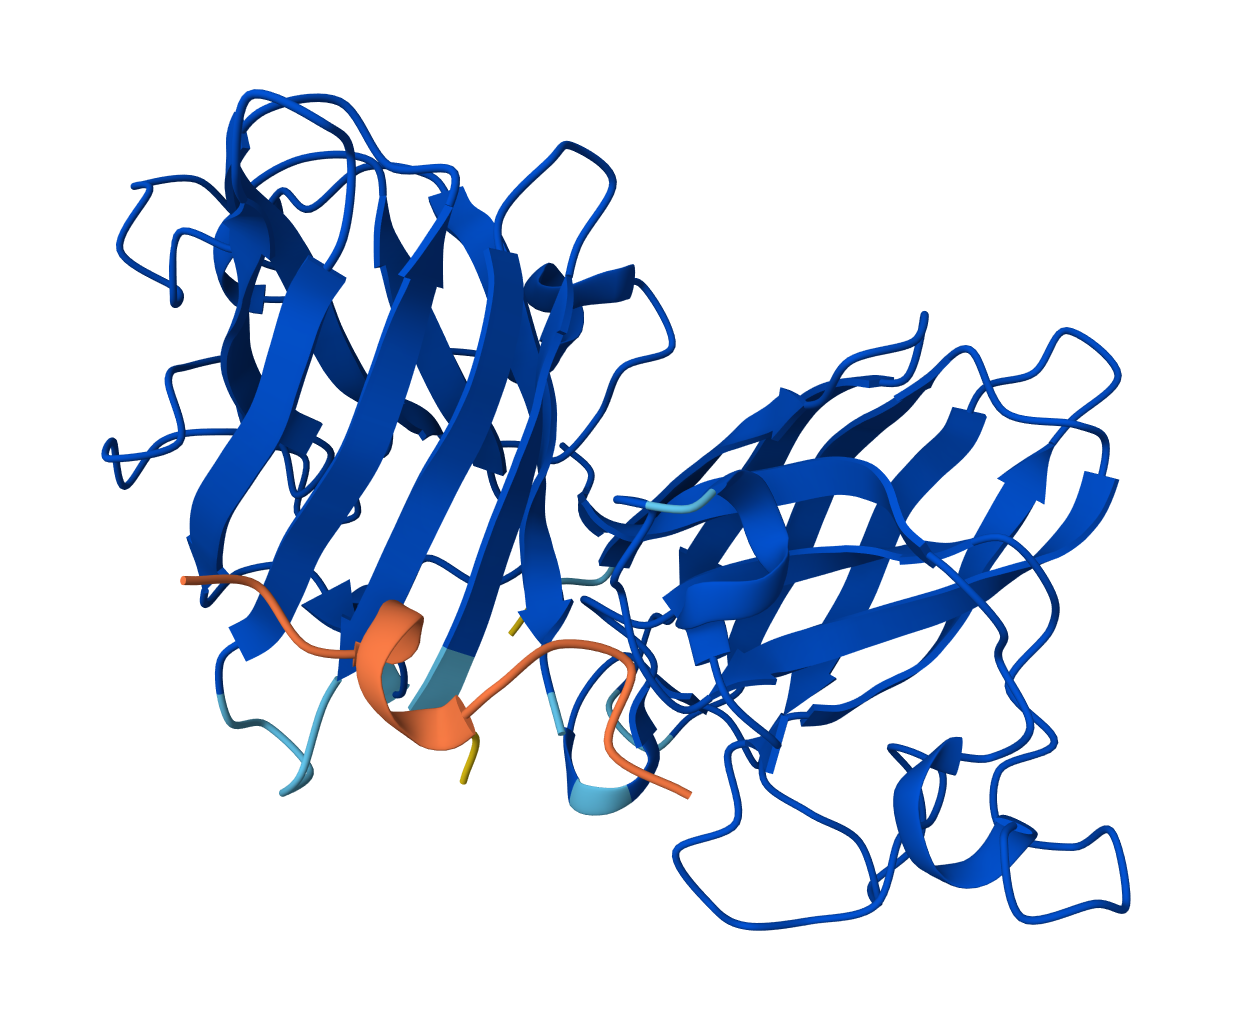
This peptide appears to bind near the N-terminus where A4V sits. The peptide engages with the β-barrel region of the SOD1 protein and is surface-bound.
Binder: WRVPAVAAAWKK
ipTM score: 0.75
This peptide appears to bind near the N-terminus where A4V sits. The peptide engages with the dimer interface and it appears to be partially buried.
Binder: WLYYVVALALWX
ipTM score: 0.81
This peptide does not appear to bind near the N-terminus where A4V sits. The peptide engages with the β-barrel region of the SOD1 protein and is surface-bound.
Binder: WLYGATGAEHKK
ipTM score: 0.78
This peptide does not appear to bind near the N-terminus where A4V sits. The peptide engages with the β-barrel region of the SOD1 protein and is surface-bound.
Binder: FLYRWLPSRRGG
ipTM score: 0.89
This peptide is a known SOD1-binding peptide that was added for comparison. It appears to bind near the N-terminus where A4V sits. The peptide engages with the dimer interface and it appears to be partially buried.
Across the five peptides, the known binder has the highest reported ipTIM = 0.89. The four PepMLM-generated peptides show ipTM values of 0.87 (KLYYPAALRHKE), 0.81 (WLYYVVALALWX), 0.78 (WLYGATGAEHKK), and 0.75 (WRVPAVAAAWKK). This means the designed peptides show moderately strong predicted interactions, but none match or exceed the known binder. The closest is KLYYPAALRHKE at 0.87, which is slightly below the reference.
Evaluating Properties of Generated Peptides in the PeptiVerse
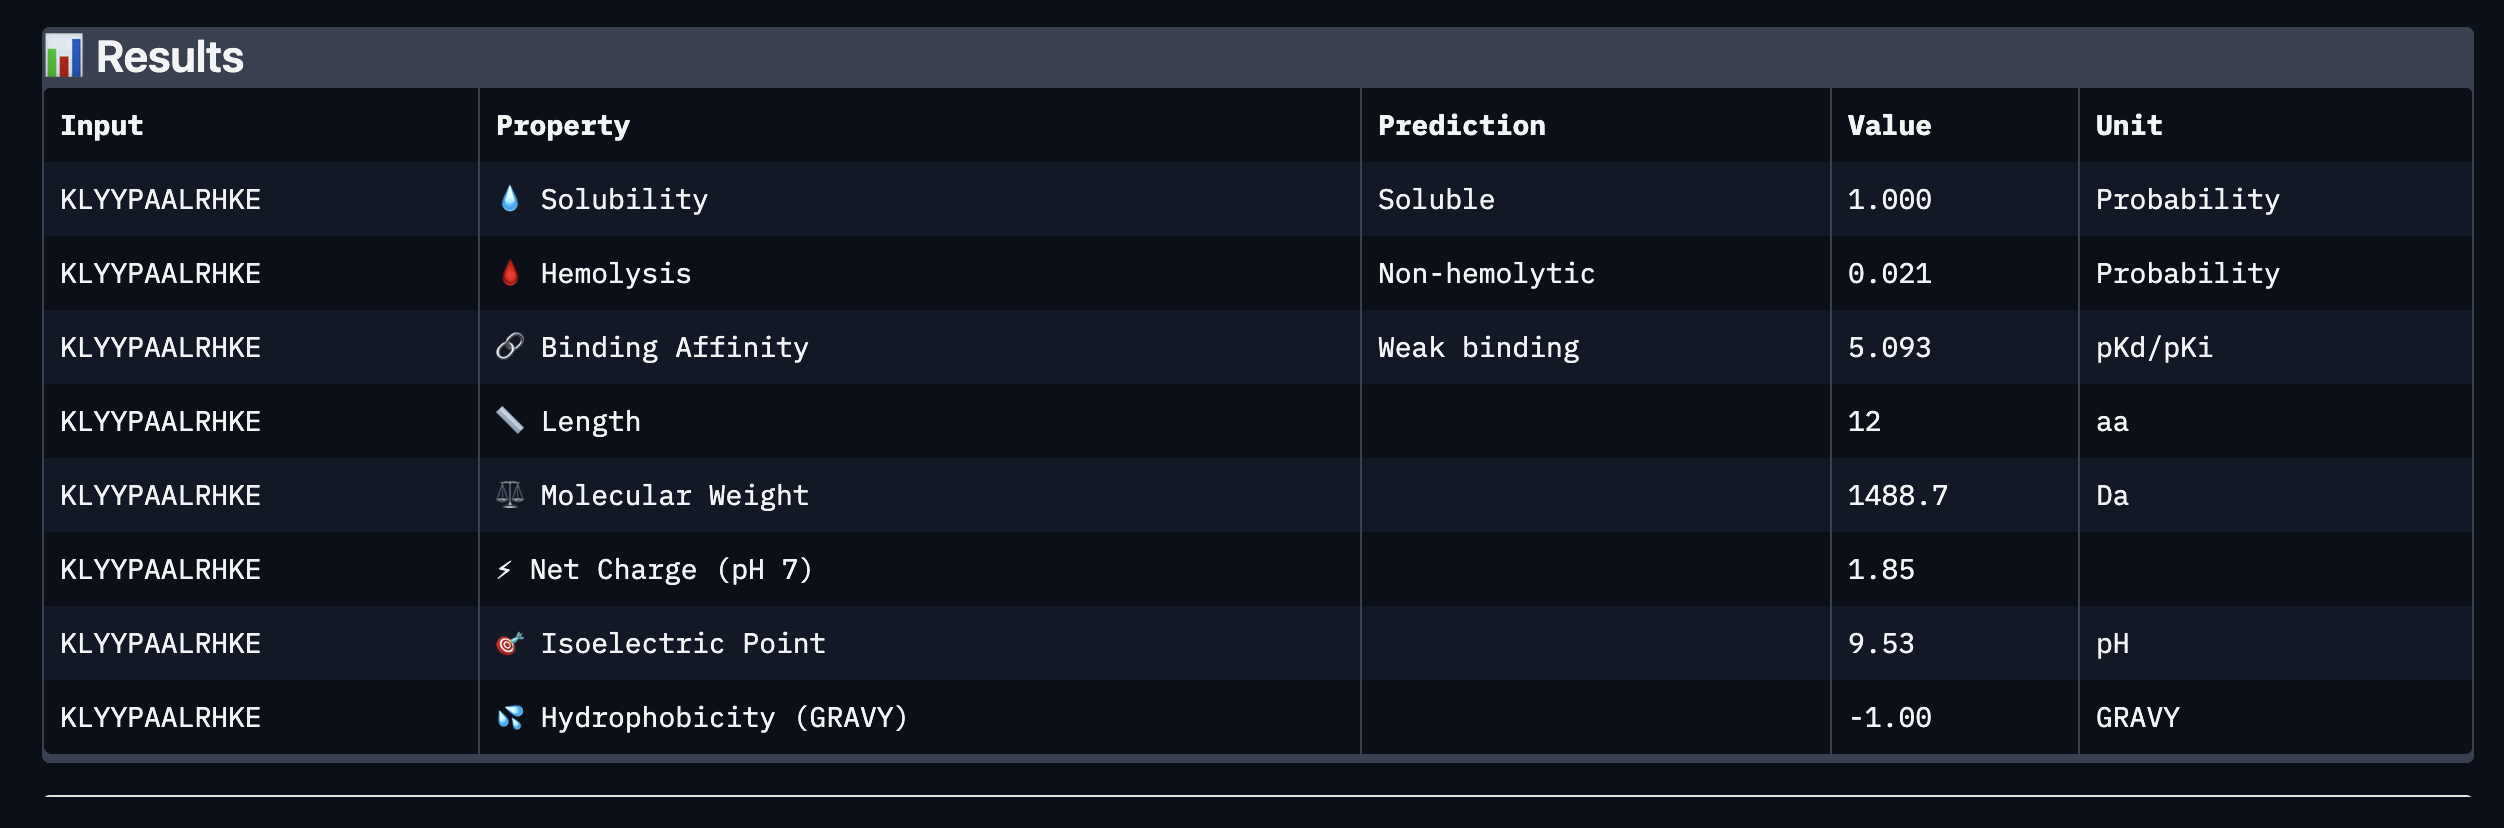
Binder: KLYYPAALRHKE
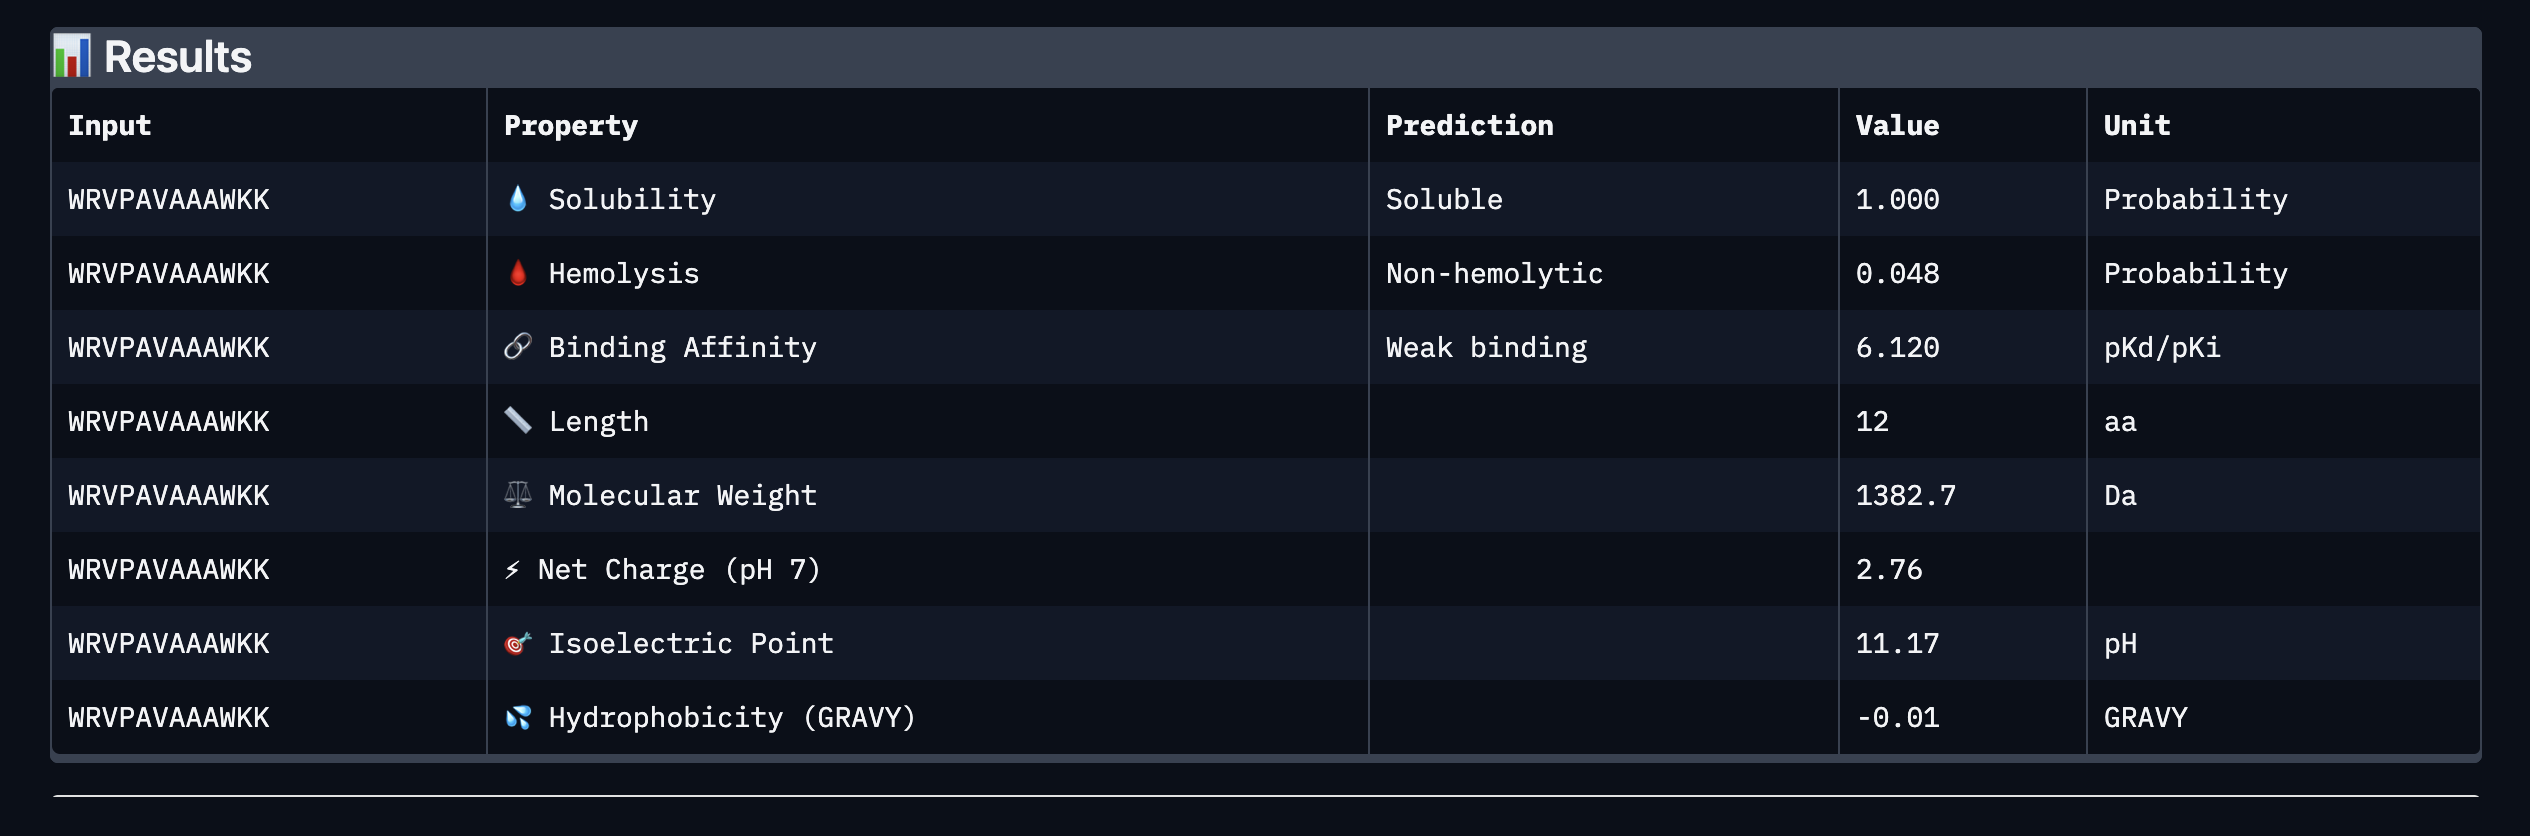
Binder: WRVPAVAAAWKK
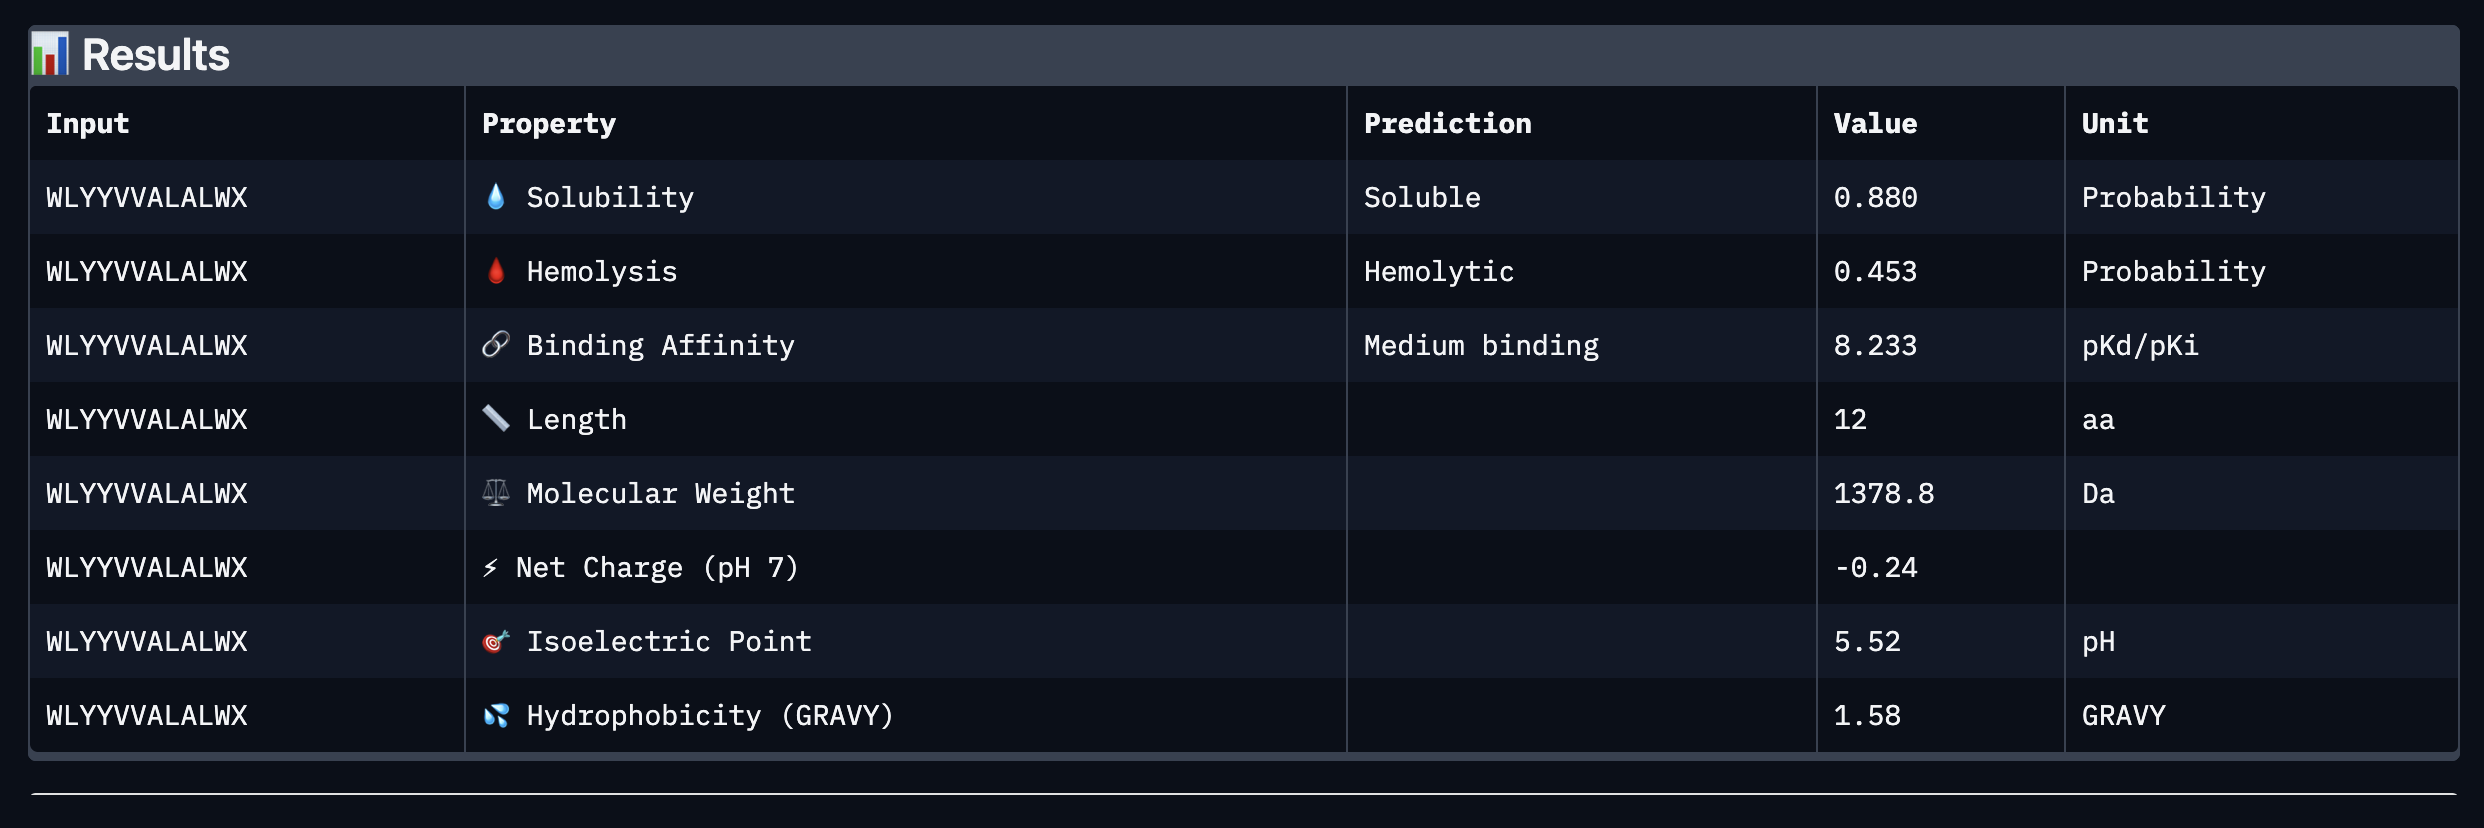
Binder: WLYYVVALALWX
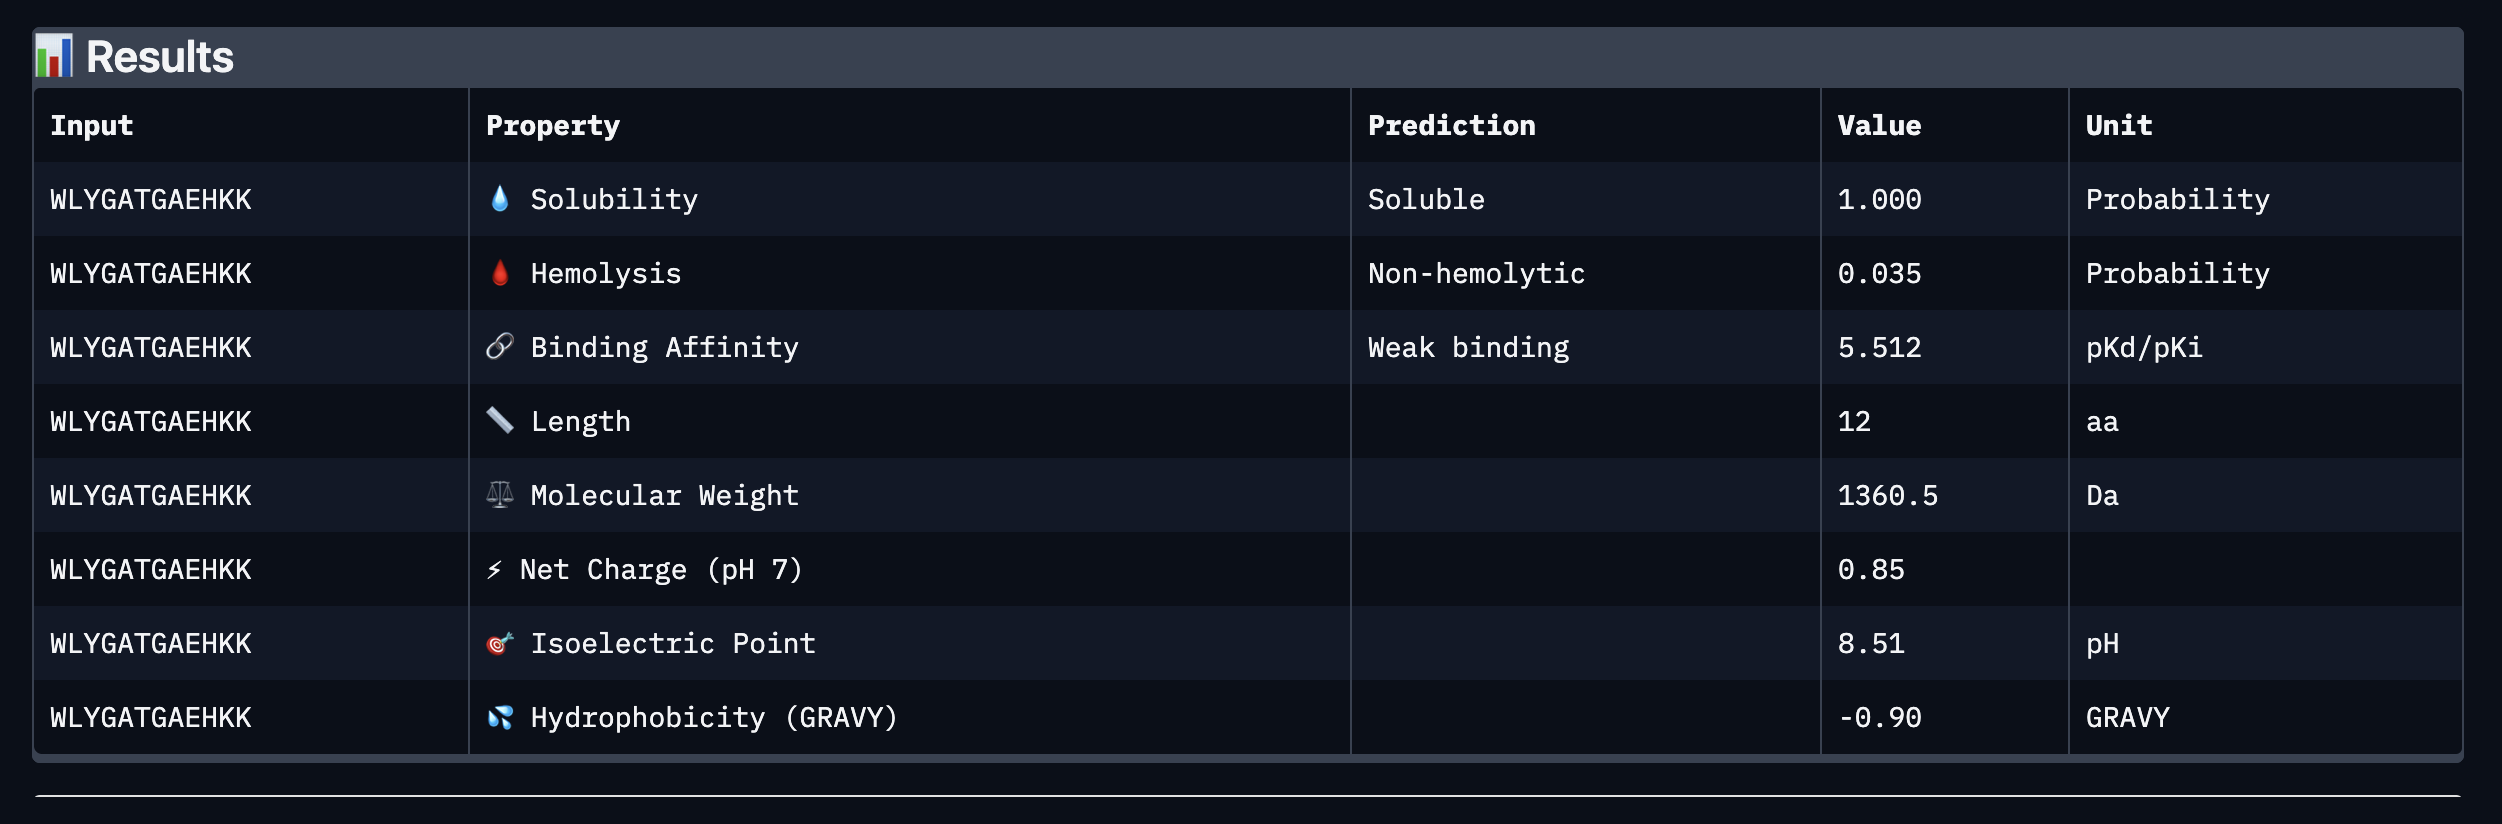
Binder: WLYGATGAEHKK
Comparing the AlphaFold3 structural predictions to the PeptiVerse therapeutic property predictions reveals that higher ipTM does not always correspond to stronger predicted binding affinity. KLYYPAALRHKE has the highest ipTM among the designed peptides (0.87) yet the weakest PeptiVerse binding affinity (pKd 5.093), while WLYYVVALALWX has a lower ipTM (0.81) but the strongest predicted affinity (pKd 8.233, medium binding). Notably, WLYYVVALALWX, the only peptide with medium binding, is also the only one flagged as hemolytic (0.453 probability) and has the highest hydrophobicity (GRAVY 1.58) and lowest solubility (0.880). This suggest that there is a trade-off between binding strength and therapeutic safety. Of the four PepMLM-generated peptides, I would advance KLYYPAALRHKE as it best balances predicted binding and therapeutic properties. It has the highest structural confidence from AlphaFold3, binds near the A4V site on SOD1, and has excellent solubility (1.000), the lowest hemolysis risk (0.021), and favorable hydrophilicity (GRAVY −1.00).
Generating Optimized Peptides with moPPIt
Binder
Hemolysis
Solubility
Affinity
Motif
NKENFPKKKCKW
0.9695186857134104
0.75
7.140074253082275
0.6160803437232971
KPCGRGKRDAEH
0.9709703326225281
0.8333333134651184
7.246584892272949
0.00822020135819912
EQRKTDGCLLKI
0.9666469506919384
0.75
6.097865581512451
0.8978230953216553
KQKVCETYFRKN
0.9696119148284197
0.8333333134651184
7.353872299194336
0.907169759273529
The moPPit generated peptides differ from the PepMLM peptides in several ways. The moPPit peptides show more consistent, moderate binding affinities (6.1–7.4) with uniformly high non-hemolytic probabilities (~0.97), while the PepMLM peptides had a wider spread. Additionally, moPPit provides motif scores indicating how well each peptide matches known binding motifs, with KQKVCETYFRKN (0.907) and EQRKTDGCLLKI (0.898) scoring highest. Before advancing any of these peptides to clinical studies, one would need to validate predictions experimentally through in vitro binding assays, cell-based hemolysis and cytotoxicity testing, solubility measurements, pharmacokinetic profiling (half-life, bioavailability), selectivity screening for off-target interactions, and ultimately in vivo efficacy and toxicology studies in animal models.
Does the experimental data correlate with the scores from the ESM2 model?
The experimental data seems to correlate with the notebook scores somewhat, but not perfectly. In some cases, the predictions match the experimental results pretty well. For example, mutations at the start methionine had very negative LLR scores, and experimentally those mutations completely got rid of protein production and lysis. There were also some mutations like P13L, S15A, A45P, and I46F where the notebook suggested the mutation would be tolerated, and the experimental data showed that those mutations still worked.
At the same time, there were definitely some cases where the notebook scores did not match the experimental results. Some mutations had high or favorable LLR scores but still lost function in the experimental data. This happened at positions like C29, Y39, and K50. In some of those cases, the protein still seemed to be made, but it no longer caused lysis. That makes me think the language model is better at predicting whether a mutation is generally tolerated in the sequence than whether the protein will still do its exact job.
So overall, I would say the embeddings do capture useful information about the protein, but they do not fully predict function. The scores are helpful as a guide, but the experimental data matters more when deciding which mutations are actually good candidates.
Five proposed mutations
I chose these mutations by looking for positions that either had a positive or near-neutral LLR score, showed a positive effect in the experimental data, or seemed to tolerate substitutions well.
Transmembrane region:
A45L: I picked A45L because position 45 seems pretty tolerant to mutation. The LLR score for leucine here is strongly positive, and experimentally A45P still worked, which means this position can handle substitutions. Since leucine is also a very common hydrophobic amino acid in transmembrane regions, I think this mutation has a good chance of working.
I46F: I chose I46F because it was already shown experimentally to keep both lysis activity and protein production. It is also a conservative hydrophobic substitution, which makes sense in the transmembrane region.
Soluble region:
P13L: I chose P13L because both the notebook score and the experimental data support it. It had a slightly positive LLR score, and experimentally it gave lysis = 1 and protein = 1, so this seems like a strong choice.
R18G: I chose R18G because it worked experimentally even though the LLR score was somewhat negative. Since both R18G and R18I were functional, that suggests this position is more flexible than the model predicted.
R30L: I chose R30L because it was functional in the experimental data and had a nearly neutral LLR score. Also, position 30 tolerated another mutation (R30Q) as well, so this looks like another flexible site where substitution is possible without losing function.
Overall, I picked these mutations by combining the notebook predictions with the experimental data, but I relied more on the experimental results whenever the two did not match. That seemed like the best way to choose mutations that actually have a chance of working.
Week 6 HW: Genetic Circuits Part I
Questions
1. What are some components in the Phusion High-Fidelity PCR Master Mix and what is their purpose?
Phusion DNA Polymerase: Catalyzes the synthesis of new DNA strands. Has 3′→5′ exonuclease proofreading activity, which removes incorrectly added nucleotides. Phusion polymerase is a genetically engineered DNA polymerase fused to a DNA-binding domain. The fusion domain increases DNA binding, which improves processivity.
Reaction buffer: Help to maintain a stable pH. Also provides optimal ionic strength for polymerase activity. Stabilizes enzyme structure at high temperatures.
Magnesium Chloride (MgCl₂): Essential cofactor for DNA polymerases. Coordinates with the phosphate groups of incoming nucleotides. Helps stabilize primer–template interactions.
dNTPs: Provide the substrates used to synthesize new DNA strands. Each nucleotide carries three phosphates, providing the energy needed for polymerization.
2. What are some factors that determine primer annealing temperature during PCR?
Annealing temperature is primarily determined by the melting temperature (Tm) of the primers. Tm is influenced by primer length and GC content, as well as, sequence composition and distribution of bases. Salt concentration in the reaction and secondary structures (hairpins) can also impact the annealing temperature.
3. There are two methods from this class that create linear fragments of DNA: PCR, and restriction enzyme digests. Compare and contrast these two methods, both in terms of protocol as well as when one may be preferable to use over the other.
PCR:
Amplifies DNA. Uses a thermostable polymerase, primers, and thermal cycling to amplify a specific DNA sequence exponentially.
Specificity: Determined by primer design and annealing temperature.
Error Introduction: Can introduce polymerase errors (even with high-fidelity enzymes).
Flexibility: Can amplify virtually any region with good primer design.
Uses: Amplifying a specific gene or region from a genome, generate large amounts of DNA from tiny starting quantities, genotyping, mutagenesis, add tags, restriction sites, or homologous sequences for cloning, and diagnostic applications
Restriction Enzyme Digests:
Cuts DNA at specific recognition sequences. Uses sequence specific endonucleases to cut DNA at defined recognition sites.
Specificity: Limited by recognition sites. The enzyme will cut everywhere its recognition site appears in the DNA.
Error Introduction: Doesn’t synthesize new DNA, so no new errors are introduced.
Flexibility: Constrained by where recognition sites occur.
Uses: Cut DNA at known recognition sites, prepare compatible sticky or blunt ends for cloning, verifiy plasmid constructs by restriction mapping, linearize or fragment dna in predictable ways, and library construction.
Protocol Comparison
Step
PCR
Restriction Enzyme Digest
Input DNA
Can work from nanogram or even picogram quantities
4. How can you ensure that the DNA sequences that you have digested and PCR-ed will be appropriate for Gibson cloning?
The DNA pieces that are generated need to be designed so that adjacent fragments share matching end sequences, usually about 20-40 bp of overlap. During PCR, primers are designed that add the overlaps. Make sure the overlaps only match the intended neighboring fragment and not some other region in the assembly. The vector needs to be linearized so its ends match the insert overlaps. PCR and digested DNA should be purified prior to use. As long as overlaps are correct, Gibson Assembly can chew back the ends, let complementary regions anneal, fill in gaps, and seal the nicks.
5. How does the plasmid DNA enter the E. coli cells during transformation?
Chemical Transformation (Heat Shock):
Cells are first treated with cold CaCl₂. DNA and the bacterial membrane are both negatively charged because of their phosphate groups. That means they normally repel each other electrostatically. Calcium ions shield those negative charges and allow plasmid DNA to approach and stick to the outer membrane surface. Then comes the heat shock step, you briefly shift them to 42°C for 30–90 seconds, then return them to ice. This rapid temperature change is thought to drive uptake of DNA through temporary pores or disruptions in the membrane.
Electroporation:
Typically considered more efficient than chemical transformation. Cells are placed in a cuvette with DNA and subjected to a brief, intense electrical pulse. This electric field temporarily creates nanoscale pores in the membrane. DNA present in the solution is driven through these pores by the electric field itself. After the pulse ends, the membrane reseals and the DNA remains inside.
6. Describe another assembly method in detail (such as Golden Gate Assembly)
1. Explain the other method in 5 - 7 sentences plus diagrams (either handmade or online).
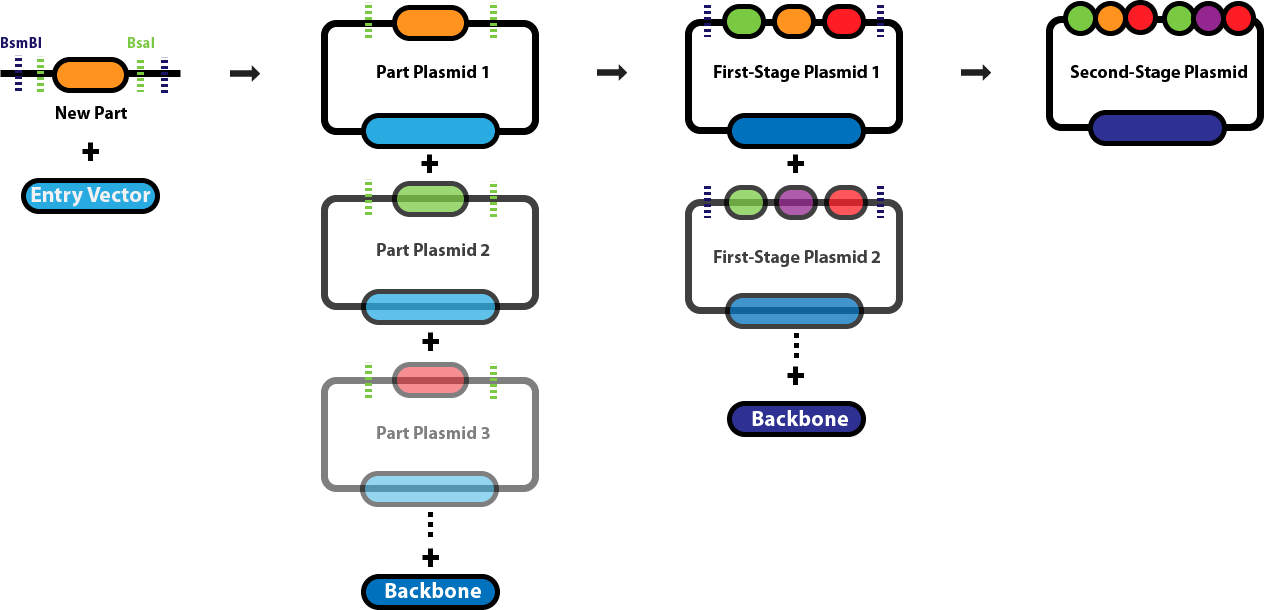
Golden Gate Assembly is a DNA assembly method that uses Type IIS restriction enzymes to cut DNA outside of their recognition sites, this allows for the design of custom overhangs that determine how fragments join together. Enzymes such as BsaI recognize a specific sequence but cleave a few bases away from it, producing programmable sticky ends. Because the overhang sequences can be chosen, multiple DNA fragments can be assembled in a precise order within a single reaction. The reaction mixture contains the restriction enzyme and a DNA ligase, and the protocol cycles between temperatures that allow cutting and ligation to occur repeatedly. When fragments join correctly, the recognition sites are removed from the final construct, preventing the enzyme from cutting the assembled product again. This design allows many fragments (often 5–10 or more) to be assembled simultaneously in a one pot reaction. Golden Gate Assembly is especially useful for modular cloning systems where standardized parts such as promoters, coding sequences, and terminators need to be assembled rapidly.
Diagram explanation:
A new DNA part is first inserted into an entry vector using Type IIS restriction enzymes such as BsaI, which cuts outside its recognition site to create specific overhangs.
This cloning step generates individual part plasmids, each containing a single genetic component (such as a promoter, coding sequence, or terminator) flanked by designed overhangs.
Multiple part plasmids are then mixed in a single reaction with BsaI and DNA ligase, allowing the enzyme to cut and generate complementary sticky ends.
The matching overhangs guide the DNA fragments to ligate together in a specific predetermined order, forming larger constructs called first-stage plasmids.
Because the restriction sites are removed during assembly, correctly assembled fragments are no longer cut by the enzyme, increasing assembly efficiency.
Finally, several first-stage plasmids can be combined with a backbone plasmid to form a second-stage plasmid containing many genetic parts arranged sequentially.
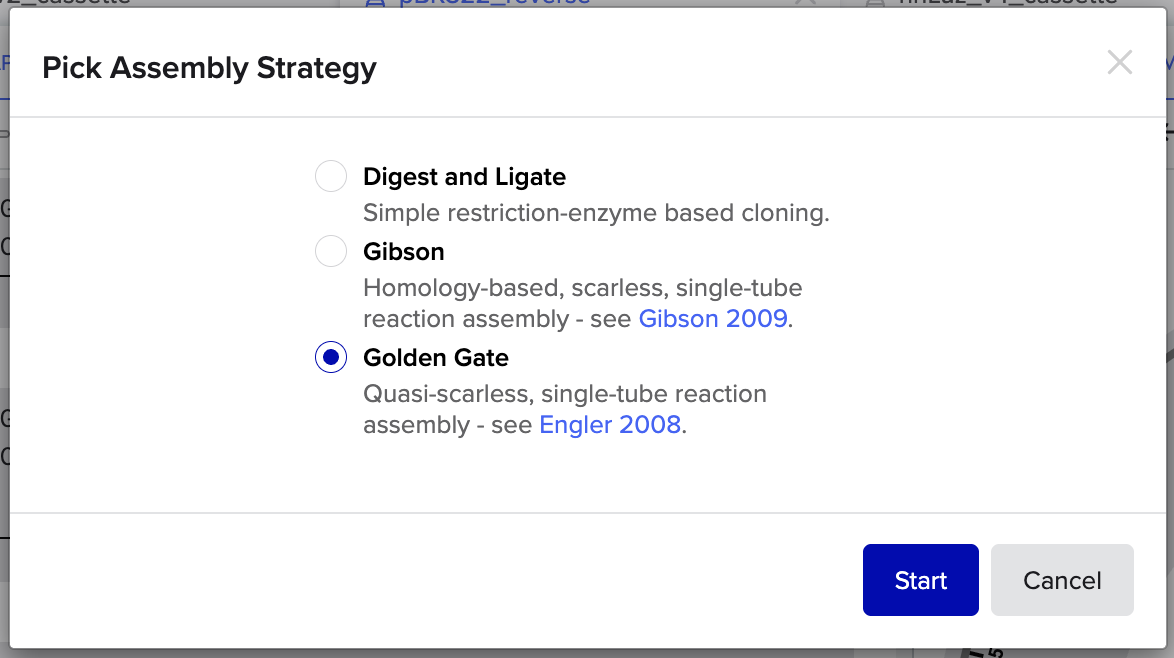
2. Model this assembly method with Benchling or Asimov Kernel!
Benchling Golden Gate Assembly Modelling:
Step 1: Select Assembly Strategy
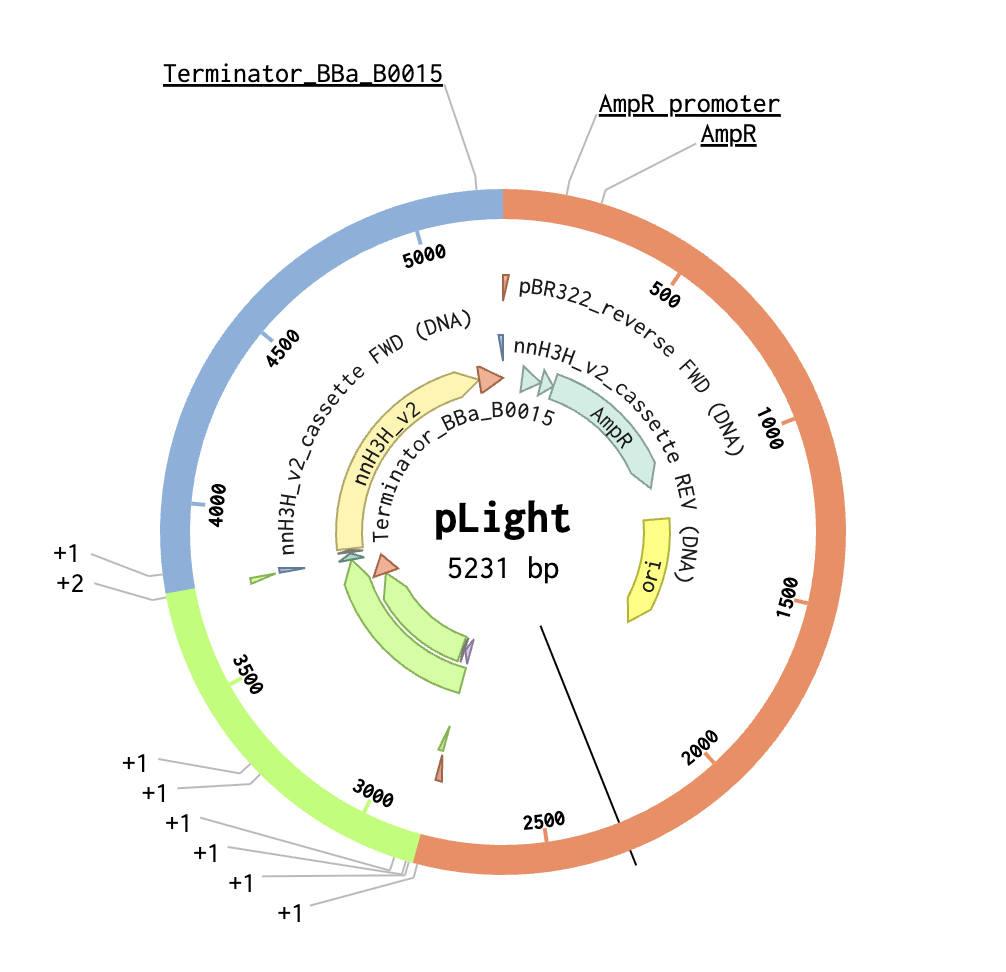
Step 2: Set Fragments
Step 3: Assemble DNA/Generate Plasmid
Week 7 HW: Genetic Circuits Part II
Intracellular Artificial Neural Networks (IANNs)
Questions
What advantages do IANNs have over traditional genetic circuits, whose input/output behaviors are Boolean functions?
IANNs offer several advantages over traditional genetic circuits. Unlike the Boolean systems that produce binary ON/OFF outputs, IANNs generate continuous, graded responses that better reflect the analog nature of biological systems. They can also be trained by adjusting weights, allowing them to learn complex input–output relationships rather than relying on fixed logic. This enables IANNs to handle nonlinear interactions and integrate multiple inputs more effectively. Additionally, IANNs are more scalable and robust to biological noise, as their distributed architecture reduces sensitivity to fluctuations. Overall, IANNs enable more sophisticated information processing, such as pattern recognition and prediction, which is difficult to achieve with traditional genetic circuits.
Describe a useful application for an IANN; include a detailed description of input/output behavior, as well as any limitations an IANN might face to achieve your goal.
A useful application of an Intracellular Artificial Neural Network (IANN) that aligns with my interest, would be a self-optimizing bioluminescent plant that dynamically adjusts its glow based on internal metabolic state and environmental conditions. The IANN could take continuous inputs such as glucose levels, ATP availability, oxygen concentration, and light exposure, and process them through weighted interactions to produce a graded output controlling expression of a bioluminescent pathway (e.g., fungal luciferase genes). Rather than a simple ON/OFF response, this system would enable fine-tuned luminescence, increasing brightness when energy is abundant and reducing it under stress to minimize metabolic burden, while also capturing complex interactions between inputs. However, implementing this system presents challenges, including biological noise, difficulty in precisely tuning network weights, increased metabolic load as network complexity grows, and the challenge of training or optimizing the network in living cells, especially when transferring designs between organisms such as microbes and plants.
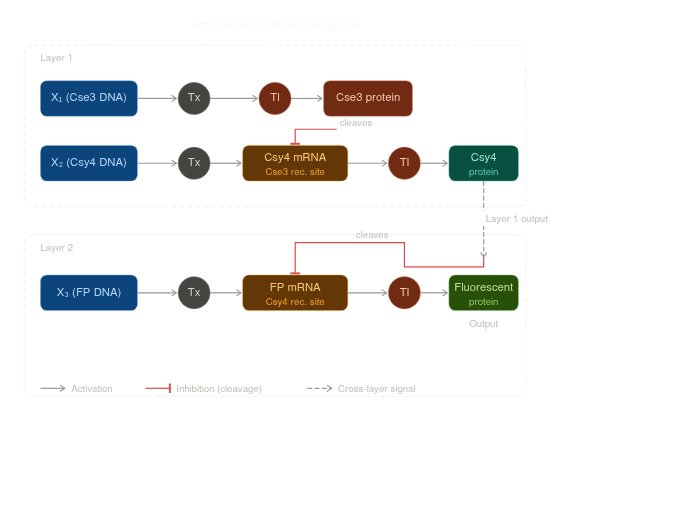
Draw a diagram for an intracellular multilayer perceptron where layer 1 outputs an endoribonuclease that regulates a fluorescent protein output in layer 2.
Fungal Materials
Questions
What are some examples of existing fungal materials and what are they used for? What are their advantages and disadvantages over traditional counterparts?
Fungal materials are being used for things like biodegradable packaging, leather alternatives, insulation, furniture, and some building materials. Their biggest advantage over traditional materials like Styrofoam, plastic, and animal leather is that they are more sustainable, can be grown from agricultural waste, and are biodegradable instead of sitting in landfills for years. They can also be lightweight and provide decent insulation. However, their main disadvantages are that they are often weaker, absorb water more easily, and can be less durable than traditional materials, which makes them harder to use in high-performance or structural applications. Overall, fungal materials are a really promising sustainable alternative, but they still are not always as strong or reliable as the materials they are trying to replace.
What might you want to genetically engineer fungi to do and why? What are the advantages of doing synthetic biology in fungi as opposed to bacteria?
If I were going to genetically engineer fungi, I would want to make them produce brighter bioluminescence or useful natural products, which is something I’m especially interested in. For example, engineered fungi could potentially be used to make self-reporting materials that glow when they are stressed, contaminated, or exposed to certain environmental conditions. Fungi are also attractive for synthetic biology because they are eukaryotes, so they are more similar to plants and animals than bacteria are, which makes them better for expressing more complex pathways and proteins. They can also naturally produce a lot of interesting metabolites and are often better at secreting proteins and enzymes. Compared to bacteria, fungi can be slower to grow and sometimes harder to engineer, but they offer a much better platform for building more complex biological systems and materials.
First DNA Twist Order
Insert:Backbone Vector: pBR322
Week 9 HW: Cell-Free Systems
General and Lecturer-Specific Questions
General homework questions
Explain the main advantages of cell-free protein synthesis over traditional in vivo methods, specifically in terms of flexibility and control over experimental variables. Name at least two cases where cell-free expression is more beneficial than cell production.
Cell-free protein synthesis has a big advantage over in vivo methods because it gives you direct control over the reaction environment without needing to keep cells alive. You can precisely tune things like DNA concentration, energy sources, cofactors, salts, and even add or remove specific components in real time, which is much harder to do inside living cells where metabolism and regulation get in the way. It’s also faster since you skip cloning, transformation, and cell growth steps. This makes it especially useful for expressing toxic proteins that would kill or stress cells, and for rapid prototyping or screening large libraries of genetic constructs where you want quick, iterative testing without waiting on cultures to grow.
Describe the main components of a cell-free expression system and explain the role of each component.
A cell-free expression system is mainly made up of a cell extract, a DNA template, and a reaction mix that supports transcription and translation. The cell extract provides the core molecular machinery, like ribosomes, tRNAs, aminoacyl-tRNA synthetases, transcription and translation factors, which are all needed to actually make protein. The DNA template contains the gene of interest along with the regulatory sequences needed for expression. The reaction mix supplies the raw materials and energy needed to drive the system, including amino acids, nucleotides, salts, cofactors, ATP regeneration components, and buffering agents to keep conditions stable. Together, these components recreate the basic protein production machinery of a cell, but in a much more controllable format.
Why is energy provision regeneration critical in cell-free systems? Describe a method you could use to ensure continuous ATP supply in your cell-free experiment.
Energy provision and regeneration are critical in cell-free systems because transcription and translation burn through ATP and GTP fast, so without a way to replenish that energy, protein synthesis stalls. Since there are no living cells to continuously regenerate energy through metabolism, the reaction depends entirely on whatever energy system you build into it. Basically, if the reaction runs out of usable energy, the whole system stalls, so energy regeneration is what keeps protein production going for longer and improves overall yield. One common way to maintain ATP supply is to include an energy regeneration substrate such as phosphoenolpyruvate (PEP), which can be used to help regenerate ATP during the reaction. In the reaction, PEP transfers a phosphate group to ADP through the enzyme pyruvate kinase, which regenerates ATP that can then be used to keep transcription and translation going.
Compare prokaryotic versus eukaryotic cell-free expression systems. Choose a protein to produce in each system and explain why.
Prokaryotic and eukaryotic cell-free systems each have different strengths depending on the type of protein being produced. Prokaryotic systems, like E. coli extracts, are usually faster, cheaper, and great for making simple proteins that do not need complex folding or post-translational modifications. In contrast, eukaryotic cell-free systems are better for proteins that require more advanced folding, disulfide bond formation, or modifications that bacteria cannot do well. For a prokaryotic system, a strong candidate would be Luz (luciferase) from the fungal bioluminescence pathway, since it is a relatively compact enzyme that folds well in bacterial extracts and does not require eukaryotic post-translational modifications; producing it cell-free would allow rapid screening of variants and direct assay of luminescence activity by simply adding the 3-hydroxyhispidin substrate to the reaction. For a eukaryotic system, a suitable target would be H3H (hispidin-3-hydroxylase) or another upstream enzyme in the caffeic acid–to–luciferin pathway, since these fungal oxidative enzymes often depend on proper folding, cofactor incorporation, and a eukaryotic redox environment to remain active. Expressing the pathway enzymes in their appropriate systems enables modular prototyping of the bioluminescence circuit before committing to stable plant transformation.
How would you design a cell-free experiment to optimize the expression of a membrane protein? Discuss the challenges and how you would address them in your setup.
To optimize expression of a membrane protein in a cell-free system, I would design the reaction so it not only makes the protein but also gives it a membrane-like environment to fold into correctly. One of the main challenges with membrane proteins is that they tend to misfold, aggregate, or precipitate because their hydrophobic regions do not stay stable in plain aqueous solution. To deal with that, I would test conditions that include detergents, liposomes, or nanodiscs so the protein has somewhere to insert during or right after translation. I would also optimize variables like magnesium concentration, temperature, reaction time, and DNA concentration, since these can strongly affect yield and folding quality. On top of that, I would check expression using something like SDS-PAGE or a tagged reporter, then compare solubility and activity across conditions.
Imagine you observe a low yield of your target protein in a cell-free system. Describe three possible reasons for this and suggest a troubleshooting strategy for each.
Low protein yield in a cell-free reaction can arise from numerous sources, but three common causes are the following. First, degradation of the DNA template or mRNA transcript by nucleases present in the extract can sharply reduce output. This can be addressed by switching from linear PCR products to circular plasmid DNA, adding RNase inhibitors, and verifying template integrity by gel electrophoresis before use. Second, depletion of energy substrates or accumulation of inhibitory byproducts such as inorganic phosphate can stall translation mid-reaction. This is best addressed by switching to a more robust energy regeneration system (e.g., PEP/pyruvate kinase), adjusting the starting concentrations of NTPs and amino acids, and running time course sampling to identify when the reaction plateaus. Third, poor translation efficiency caused by suboptimal codon usage, weak ribosome binding site strength, or mRNA secondary structure near the start codon can limit ribosome loading. This can be addressed by codon optimizing the gene for the extract source, redesigning the 5’ UTR and RBS using established calculators, and introducing silent mutations to disrupt inhibitory secondary structures near the translation initiation site.
Homework questions from Kate Adamala
Design an example of a useful synthetic minimal cell as follows:
Pick a function and describe it.
What would your synthetic cell do? What is the input and what is the output? I would design a synthetic minimal cell that acts as a biosensor for plant stress-related molecules, such as reactive oxygen species (ROS). The synthetic cell would detect ROS and respond by producing a bioluminescence as a direct output. Input: ROS or a plant stress-associated molecule. Output: light produced by the synthetic minimal cell itself.
Could this function be realized by cell-free Tx/Tl alone, without encapsulation? Yes, this could technically be done in a cell-free Tx/Tl system without encapsulation. However, encapsulation adds structure and allows better control over diffusion, stability, and modular design.
Could this function be realized by genetically modified natural cell? Yes, this could be achieved using a genetically engineered bacterium or yeast cell that senses ROS and produces light. However, using a synthetic minimal cell avoids the complexity of maintaining a living system and allows more precise control over the components.
Describe the desired outcome of your synthetic cell operation. The desired outcome is a controllable, cell-like biosensor that produces a visible light signal in response to plant stress molecules, which could be used in vitro to study stress signaling or to prototype synthetic biology circuits for future applications like glowing plants.
Design all components that would need to be part of your synthetic cell.
What would be the membrane made of? The membrane could be made from phospholipids, such as a liposome-based membrane, possibly with cholesterol added to improve stability.
What would you encapsulate inside? Enzymes, small molecules. A cell-free Tx/Tl system, a DNA construct containing a ROS-responsive regulatory element linked to a luciferase (Luz) reporter gene, amino acids, nucleotides, salts, cofactors, an energy regeneration system to support protein production, and the luciferin substrate 3-hydroxyhispidin so that bioluminescence occurs immediately upon luciferase expression.
Which organism your Tx/Tl system will come from? Is bacterial OK, or do you need a mammalian system for some reason? (hint: for example, if you want to use small molecule modulated promotors, like Tet-ON, you need mammalian) Bacterial (E. coli-based) is sufficient for this design because the goal is to sense a small molecule-related stress signal. ROS-responsive genetic elements function well in bacterial Tx/Tl systems, and the fungal luciferase does not require eukaryotic post-translational modifications to fold and function.
How will your synthetic cell communicate with the environment? (hint: are substrates permeable? or do you need to express the membrane channel?) The synthetic cell would communicate with the environment by allowing the input molecule, such as ROS or a small diffusible stress-related compound, to cross the membrane if it is membrane-permeable. The output would be light generated inside the synthetic cell itself, so no additional membrane channel would be needed for signal release.
Experimental details
List all lipids and genes. (bonus: find the specific genes; for example, instead of just saying “small molecule membrane channel” pick the actual gene.)
Lipids: POPC and cholesterol could be used to form a stable liposome membrane.
Genes: I would include the luz gene encoding fungal luciferase under the control of an ROS-responsive bacterial regulatory element, such as an OxyR-regulated promoter like PahpC or PkatG. If I wanted the system to make its own substrate instead of adding it directly, I could also include h3h and hisps, which are part of the fungal bioluminescence pathway upstream of luz.
Tx/Tl system: an E. coli-based cell-free transcription/translation system.
How will you measure the function of your system? I would measure the function of the system by monitoring light output with a plate reader or luminometer after adding the ROS input. The main readout would be bioluminescence intensity over time, comparing reactions with and without ROS to confirm that the synthetic cell is responding specifically to the stress signal. I could also compare different ROS concentrations to see how sensitive the system is.
Homework questions from Peter Nguyen
Freeze-dried cell-free systems can be incorporated into all kinds of materials as biological sensors or as inducible enzymes to modify the material itself or the surrounding environment. Choose one application field — Architecture, Textiles/Fashion, or Robotics — and propose an application using cell-free systems that are functionally integrated into the material. Answer each of these key questions for your proposal pitch:
Write a one-sentence summary pitch sentence describing your concept.
A freeze-dried cell-free dyeing patch integrated into fabric that produces natural pigments on demand when activated by moisture, enabling wearers to “grow” custom patterns and colors into their clothing without synthetic dyes or industrial processing.
How will the idea work, in more detail? Write 3-4 sentences or more.
The idea would work by embedding small freeze-dried cell-free reaction patches into specific regions of the clothing, either during fabrication or as add-on design modules. These patches would contain the transcription/translation machinery, DNA templates encoding pigment producing enzymes, and the chemical precursors needed to generate color when the system is activated by water or a moisture containing spray. Once activated, the cell-free system would begin producing the enzymes, which would then convert the stored precursors into visible natural pigments directly within the patch or fabric region. This would allow the wearer to trigger color formation only when desired, creating custom patterns or designs on demand without relying on conventional dye baths, harsh chemical processing, or synthetic dyes.
What societal challenge or market need will this address?
This concept addresses the environmental and sustainability problems associated with traditional textile dyeing, which often requires large amounts of water, harsh chemicals, and energy intensive industrial processing. It also responds to a growing market interest in sustainable fashion, customizable clothing, and ethically produced fashion. By allowing pigments to be generated on demand directly within the fabric, this system could reduce waste, lower the need for synthetic dyes, and give consumers a more personalized and low impact way to design or refresh their clothing.
How do you envision addressing the limitation of cell-free reactions (e.g., activation with water, stability, one-time use)?
I would address these limitations by designing the dyeing patches as sealed, modular units protected by a hydrophobic semi-permeable barrier, such as a thin silicone or wax coating, that blocks accidental activation from sweat, humidity, or rain. The patches would only activate when the wearer applies a specific spray containing both water and a co-activator, such as a mild surfactant or chemical trigger not normally present in sweat or laundry conditions. After pigment production, a fixative or heat setting step could be used to lock the color into the fabric and render the spent patch inactive, allowing the garment to be worn and washed more normally afterward. This would make the system more practical while preserving its customizable, on-demand function.
Homework questions from Ally Huang
Freeze-dried cell-free reactions have great potential in space, where resources are constrained. As described in my talk, the Genes in Space competition challenges students to consider how biotechnology, including cell-free reactions, can be used to solve biological problems encountered in space. While the competition is limited to only high school students, your assignment will be to develop your own mock Genes in Space proposal to practice thinking about biotech applications in space!
For this particular assignment, your proposal is required to incorporate the BioBits® cell-free protein expression system, but you may also use the other tools in the Genes in Space toolkit (the miniPCR® thermal cycler and the P51 Molecular Fluorescence Viewer). For more inspiration, check out https://www.genesinspace.org/ .
Provide background information that describes the space biology question or challenge you propose to address. Explain why this topic is significant for humanity, relevant for space exploration, and scientifically interesting. (Maximum 100 words)
Growing plants in space is a major challenge because microgravity, radiation, and limited resources can disrupt plant growth and trigger stress responses that are difficult to monitor in real time. This is significant because plants are essential for food production, oxygen generation, and long-term human survival during missions to the Moon and Mars. Current monitoring methods are limited in space, so there is a need for simple, portable tools. Cell-free systems like BioBits®, which can produce detectable proteins without living cells, offer a promising approach to developing on-demand biosensors to detect plant stress in space.
Name the molecular or genetic target that you propose to study. Examples of molecular targets include individual genes and proteins, DNA and RNA sequences, or broader -omics approaches. (Maximum 30 words)
Reactive oxygen species (ROS) responsive genetic elements, such as OxyR-regulated promoters, to detect oxidative stress signals in plants exposed to microgravity and radiation conditions.
Describe how your molecular or genetic target relates to the space biology question or challenge your proposal addresses. (Maximum 100 words)
Reactive oxygen species (ROS) are common indicators of plant stress and tend to increase when plants are exposed to challenging conditions such as radiation, altered gravity, and other environmental stresses associated with spaceflight. Because oxidative stress can occur before visible damage appears, ROS responsive genetic elements provide a useful early molecular target for monitoring plant health in space. By focusing on these stress response pathways, this proposal aims to detect when plants are beginning to experience harmful conditions, which could help support more reliable plant growth systems for long duration space missions.
Clearly state your hypothesis or research goal and explain the reasoning behind it. (Maximum 150 words)
My hypothesis is that a freeze-dried, BioBits® based cell-free biosensor containing a ROS responsive genetic element linked to a fluorescent reporter gene can detect oxidative stress in space grown plants earlier and more reliably than visual inspection alone. The reasoning behind this is that ROS accumulation is one of the earliest molecular responses to environmental stress in plants, often occurring before any visible symptoms appear. By coupling a ROS sensitive promoter to a fluorescent reporter visualized with the P51 Molecular Fluorescence Viewer, the biosensor would produce a measurable signal when exposed to ROS released by stressed plant tissue. Because BioBits® reactions are shelf stable, lightweight, and require no living cells, this approach is well suited to the resource limited environment of spaceflight and could provide astronauts with a simple, portable tool for monitoring crop health during long duration missions.
Outline your experimental plan - identify the sample(s) you will test in your experiment, including any necessary controls, the type of data or measurements that will be collected, etc. (Maximum 100 words)
I would test extracts collected from healthy plants and from plants exposed to a space relevant oxidative stress condition, along with a no sample negative control and a positive control containing a known ROS source. Each sample would be added to freeze-dried BioBits® reactions containing a ROS responsive promoter linked to a fluorescent reporter, then fluorescence would be measured with the P51 viewer and compared across conditions. If needed, miniPCR® could be used to amplify the DNA template before the BioBits reaction. The main data collected would be fluorescence intensity or visible signal strength for each treatment.
Please identify at least one (ideally many) aspect(s) of your project that you will measure. It could be the mass or sequence of a protein, the presence, absence, or quantity of a biomarker, etc.
For Aim 1 of my final project, there are several things I’ll need to measure, from confirming the construct is correct, to confirming the cells are expressing it, to ultimately quantifying the light output that defines success or failure of the experiment. The most important measurement is luminescence intensity from the IPTG-induced cells co-expressing nnLuz v4 truncated and nnH3H v2 after hispidin supplementation. This is the readout that directly tests my hypothesis that the v4 mutations stacked with the truncation produce a brighter enzyme pair than either modification alone. Light output alone isn’t enough without knowing the cells are actually doing what I think they’re doing, so I’ll also measure cell density (OD600) and perform a colony PCR to confirm the insert is present in transformed colonies.
Please describe all of the elements you would like to measure, and furthermore describe how you will perform these measurements.
First, I will confirm that transformed colonies contain the expected plasmid insert using colony PCR, followed by sequence verification if available. This checks that the DNA construct is present before moving into functional testing. Second, I will measure cell density using OD600 so that luminescence can be normalized to the amount of bacteria present rather than comparing raw light output from cultures with different growth levels. Third, I will measure bioluminescence intensity after IPTG induction and hispidin supplementation. This would be performed by imaging induced cultures in the dark using a sensitive camera or plate reader/luminometer if available. The signal could be quantified as relative light units or image intensity values, then normalized to OD600. Finally, I would compare induced versus uninduced cells, cells with and without hispidin, and any available control constructs. Together, these measurements would show whether the construct is present, whether the cells are growing comparably, and whether the engineered nnLuz v4 truncated / nnH3H v2 system produces detectable light.
What are the technologies you will use (e.g., gel electrophoresis, DNA sequencing, mass spectrometry, etc.)? Describe in detail.
The measurements I described in the previous question rely on a handful of standard molecular biology and analytical technologies. Here’s a detailed walkthrough of each one.
PCR: PCR will be used for confirming whether transformed E. coli colonies actually carry my insert before I commit time to growing them up for expression. The reaction works by using a thermostable DNA polymerase (NEB OneTaq 2X Master Mix in my case) along with a pair of primers that flank the insert region of pET-28a(+). Through repeated cycles of denaturation (~95 °C), annealing (~55 °C), and extension (~68 °C), the target region between the primers is amplified exponentially. Turning a tiny amount of template DNA from a single colony into enough product to visualize. For colony PCR specifically, the template is just a small amount of bacteria picked from a plate and resuspended in water; the initial denaturation step lyses the cells and releases the plasmid. This is fast, cheap, and scales easily to screening 8–16 colonies in parallel, which is exactly what I need at this stage.
Agarose Gel Electrophoresis: Once the colony PCR is done, I need a way to actually see whether the reaction produced a band of the expected size. Agarose gel electrophoresis works by casting a porous agarose gel (typically 1% for the size range I’m working with), loading PCR products into wells at one end, and applying an electric field across the gel. DNA is negatively charged, so it migrates toward the positive electrode, and the gel matrix acts as a sieve. Smaller fragments move faster and travel farther than larger ones. After running, the gel is stained with a DNA-binding dye (SYBR Safe or ethidium bromide) and visualized under UV or blue light. By running a DNA ladder of known sizes alongside my samples, I can confirm whether each colony’s PCR product matches the expected insert size. Colonies with the right band move forward; colonies with wrong-sized bands or no band get discarded.
DNA Sequencing (Sanger): Colony PCR confirms something of the right size is there, but it can’t tell me whether the actual nucleotide sequence is correct. For that, I’ll use Sanger sequencing on the assembled plasmid. Sanger sequencing works by running a reaction that incorporates fluorescently labeled chain-terminating dideoxynucleotides (ddNTPs). Each time one is incorporated, the growing DNA strand stops, producing a population of fragments of every possible length, each tagged with a fluorescent base at its terminus. Capillary electrophoresis then separates these fragments by size, and a laser reads off the fluorescence color at each position, generating a chromatogram that gives the exact base-by-base sequence.
UV-Vis Spectrophotometry: Measuring bacterial growth relies on the principle that a suspension of cells scatters light proportionally to the number of cells present. A spectrophotometer shines a beam of 600 nm light through a cuvette (or microplate well) containing the culture and measures how much light passes through versus how much is scattered or absorbed. The result, optical density at 600 nm (OD600), is a quick, non-destructive proxy for cell concentration. Six hundred nanometers is the standard wavelength because it’s long enough that E. coli cells don’t absorb it significantly through their natural pigments, so the reading reflects scattering (cell density) rather than chemistry. I’ll use this measurement at two key points: to determine when the culture has reached mid-log phase (OD600 ≈ 0.6) for IPTG induction, and at the time of luminescence measurement so I can normalize light output per cell.
Plate Reader/Luminometer: This is the technology that produces the actual scientific readout of the experiment. A microplate reader in luminescence mode is essentially a very sensitive photon counter with a photomultiplier tube (PMT) positioned over each well of a 96-well plate. Unlike fluorescence (which requires an excitation light source), luminescence detection has no excitation step. The instrument just sits in the dark and counts photons emitted by the sample. This makes it ideal for autonomous bioluminescence, since the only light reaching the detector is light produced by the enzymatic reaction itself. I’ll use Greiner #655076 96-well black plates, where the opaque walls prevent light from one well bleeding into adjacent wells, which would otherwise contaminate measurements between different conditions. The reader integrates photon counts over a defined time window per well (typically 1 second) and outputs the result in relative light units (RLU).
Homework: Waters Part I — Molecular Weight
We will analyze an eGFP standard on a Waters Xevo G3 QTof MS system to determine the molecular weight of intact eGFP and observe its charge state distribution in the native and denatured (unfolded) states. The conditions for LC-MS analysis of intact protein cause it to unfold and be detected in its denatured form (due to the solvents and pH used for analysis).
Based on the predicted amino acid sequence of eGFP (see below) and any known modifications, what is the calculated molecular weight?
eGFP Sequence: MVSKGEELFTG VVPILVELDG DVNGHKFSVS GEGEGDATYG KLTLKFICTT GKLPVPWPTL VTTLTYGVQC FSRYPDHMKQ HDFFKSAMPE GYVQERTIFF KDDGNYKTRA EVKFEGDTLV NRIELKGIDF KEDGNILGHK LEYNYNSHNV YIMADKQKNG IKVNFKIRHN IEDGSVQLAD HYQQNTPIGD GPVLLPDNHY LSTQSALSKD PNEKRDHMVL LEFVTAAGIT LGMDELYKLE HHHHHH Note: This contains a His-purification tag (HHHHHH) and a linker (the LE before it).
Calculated molecular weight: 28,006.60 Da
Calculate the molecular weight of the eGFP using the adjacent charge state approach described in the recitation. Select two charge states from the intact LC-MS data (Figure 1) and:
Determine $z$ for each adjacent pair of peaks $(n, n+1)$ using:
$$ {\large z} = {\Large \frac{\frac{m}{z_{n+1}}}{\frac{m}{z_n} - \frac{m}{z_{n+1}}}} $$
$$ z = \frac{1400.46}{1474.11 - 1400.46} $$
$$ z = \frac{1400.46}{73.65} \approx 19 $$
Determine the MW of the protein using the relationship between $\frac{m}{z_n}$, $MW$, and $z$
$$ M = 19(1474.11) - 19(1.0073) = 27,989 \text{Da} $$
Calculate the accuracy of the measurement using the deconvoluted MW from 2.2 and the predicted weight of the protein from 2.1 using:
$$ \text{Accuracy} = \frac{|MW_{\text{experiment}} - MW_{\text{theory}}|}{MW_{\text{theory}}} $$
$$ \text{Accuracy} = \frac{|27989 - 28006.60|}{28006.60} $$
$$ \text{Accuracy} = 0.000628 \approx 0.0628\text{%} $$
Can you observe the charge state for the zoomed-in peak in the mass spectrum for the intact eGFP? If yes, what is it? If no, why not?
Figure 1. Mass Spectrum of intact eGFP protein from the Waters Xevo G3 LC-MS (a mass spectrometer with 30,000 resolution) with individual charge state peaks labeled with $\frac{m}{z}$ values.
No, the charge state cannot be directly observed from the zoomed-in peak alone because the isotopic peaks are not sufficiently resolved to measure the spacing between them.
Homework: Waters Part II — Secondary/Tertiary structure
We will analyze eGFP in its native, folded state and compare it to its denatured, unfolded state on a quadrupole time-of-flight MS. We will be doing MS-only analysis (no liquid chromatography, also known as “direct infusion” experiments) on the Waters Xevo G3-QToF MS.
Based on learnings in the lab, please explain the difference between native and denatured protein conformations. For example, what happens when a protein unfolds? How is that determined with a mass spectrometer? What changes do you see in the mass spectrum between the native and denatured protein analyses (Figure 2)?
Figure 2. Comparison of the mass spectra between denatured (top) and native (bottom) eGFP standard on the Waters Xevo G3 QTof MS.
In the native conformation, the protein is folded into a compact structure, which buries many protonatable residues such as lysine, arginine, and histidine. As a result, fewer protons can be added during ionization, leading to lower charge states and peaks at higher $\frac{m}{z}$ values. In contrast, when the protein denatures, it unfolds and exposes these residues to the solvent, allowing more protons to attach. This results in higher charge states and peaks at lower $\frac{m}{z}$ values.
Mass spectrometry detects this difference indirectly through the charge state distribution. In the denatured spectrum (Figure 2, top), there is a broad distribution of peaks at lower $\frac{m}{z}$ values, indicating many high charge states. In the native spectrum (Figure 2, bottom), the peaks are fewer and shifted to higher $\frac{m}{z}$ values, indicating lower charge states. This shift in charge state distribution reflects the transition from a folded to an unfolded protein conformation.
Zooming into the native mass spectrum of eGFP from the Waters Xevo G3 QTof MS (see Figure 3), can you discern the charge state of the peak at ~2800 $\frac{m}{z}$? What is the charge state? How can you tell?
Figure 3. Native eGFP mass spectrum from the Waters Xevo G3 Q-Tof MS. The inset is a zoomed-in view of the charge state at ~2800 $\frac{m}{z}$ on a mass spectrometer with 30,000 resolution.
Yes, the charge state can be determined from the zoomed-in peak by measuring the spacing between adjacent isotopic peaks. The spacing between peaks is approximately 0.092 $\frac{m}{z}$. Since isotope spacing follows Δ($\frac{m}{z}$) = $\frac{1}{z}$, the charge state can be calculated as z ≈ $\frac{1}{0.092}$ ≈ 11. Therefore, the peak at ~2800 $\frac{m}{z}$ corresponds to a charge state of approximately 11+.
Homework: Waters Part III — Peptide Mapping - primary structure
We will digest the eGFP protein standard into peptides using trypsin (an enzyme that selectively cleaves the peptide bond after Lysine (K) and Arginine (R) residues. The resulting peptides will be analyzed on the Waters BioAccord LC-MS to measure their molecular weights and fragmented to confirm the amino acid sequence within each peptide – generating a “peptide map”. This process is used to confirm the primary structure of the protein.
There are a variety of tools available online to calculate protein molecular weight and predict a list of peptides generated from a tryptic digest. We will be using tools within the online resource Expasy (the bioinformatics resource portal of the Swiss Institute of Bioinformatics (SIB)) to predict a list of tryptic peptides from eGFP.
How many Lysines (K) and Arginines (R) are in eGFP? Please circle or highlight them in the eGFP sequence given in Waters Part I question 1 above. (Note: adding the sequence to Benchling as an amino acid file and clicking biochemical properties tab will show you a count for each amino acid).
Copy/paste the sequence above into the input box in the PeptideMass tool to generate expected list of peptides.
Use Figure 4 below as a guide for the relevant parameters to predict peptides from eGFP.
Click “Perform the Cleavage” button in the PeptideMass tool and report the number of peptides generated when using trypsin to perform the digest.
Figure 4. Example conditions for predicting the number of tryptic peptides from the eGFP standard. Please replicate all parameters shown above.
Peptides generated = 19
Based on the LC-MS data for the Peptide Map data generated in lab (please use Figure 5a as a reference) how many chromatographic peaks do you see in the eGFP peptide map between 0.5 and 6 minutes? You may count all peaks that are >10% relative abundance.
Figure 5a. Total ion chromatogram (TIC) of the eGFP peptide map. The peak at 2.78 minutes is circled, and its MS data is shown in the mass spectrum in Figure 5b, below.
Chromatographic Peaks = 16
Assuming all the peaks are peptides, does the number of peaks match the number of peptides predicted from question 2 above? Are there more peaks in the chromatogram or fewer?
The number of peaks does not match the number of peptides predicted from question 2. There are fewer peaks in the chromatogram.
Identify the mass-to-charge ($\frac{m}{z}$) of the peptide shown in Figure 5b. What is the charge ($z$) of the most abundant charge state of the peptide (use the separation of the isotopes to determine the charge state). Calculate the mass of the singly charged form of the peptide ($\small{[M\!\!+\!\!H]^+}$) based on its $\frac{m}{z}$ and $z$.
Figure 5b. Mass spectrum figure to show $\frac{m}{z}$ for the chromatographic peak at 2.78 min from Figure 5a above. The inset is a zoom-in of the peak at $\frac{m}{z}$ 525.76, to discern the isotope peaks.
The most abundant peptide peak is observed at $\frac{m}{z}$ 525.76712. The isotope spacing is approximately 0.5 $\frac{m}{z}$, so using Δ($\frac{m}{z}$) = $\frac{1}{z}$, the charge state is 2+. The mass of the singly charged form is calculated as:
$$ (\small{[M\!\!+\!\!H]^+}) = 2(525.76712) - 1.0073 = 1050.52694 $$
Therefore, the singly charged peptide has a mass of approximately 1050.53 $\frac{m}{z}$.
Identify the peptide based on comparison to expected masses in the PeptideMass tool. What is mass accuracy of measurement? Please calculate the error in ppm.
(Recall that $ \text{Accuracy} = \frac{|MW_{\text{experiment}} - MW_{\text{theory}}|}{MW_{\text{theory}}} $ )
The peptide is FEGDTLVNR because its theoretical ($\small{[M\!\!+\!\!H]^+}$) mass in the PeptideMass table is 1050.5214, which matches the observed peptide mass. Using the observed singly charged peak at 1050.52438, the mass error is:
Therefore, the peptide is identified as FEGDTLVNR with a mass accuracy of 2.84 ppm.
What is the percentage of the sequence that is confirmed by peptide mapping? (see Figure 6)
Figure 6. Amino Acid Coverage Map of eGFP based on BioAccord LC-MS peptide identification data.
The percentage of the sequence confirmed by peptide mapping is 88%, as indicated by the sequence coverage shown in Figure 6.
Homework: Waters Part IV — Oligomers
We will determine Keyhole Limpet Hemocyanin (KLH)’s oligomeric states using charge detection mass spectrometry (CDMS).
CDMS single-particle measurements of KLH allow us to make direct mass measurements to determine what oligomeric states (that is, how many protein subunits combine) are present in solution. Using the known masses of the polypeptide subunits (Table 1) for KLH, identify where the following oligomeric species are on the spectrum shown below from the CDMS (Figure 7):
7FU Decamer
8FU Didecamer
8FU 3-Decamer
8FU 4-Decamer
Polypeptide Subunit Name
Subunit Mass
7FU
340 kDa
8FU
400 kDa
Table 1: KLH Subunit Masses
Figure 7. Mass spectrum of Keyhole Limpet Hemocyanin (KLH) acquired on the CDMS.
The oligomeric species are identified by multiplying the subunit mass by the number of subunits in the assembly. The 7FU decamer is 3.4 MDa, matching the peak at 3.4 MDa. The 8FU didecamer is 8.0 MDa, which corresponds to the peak near 8.33 MDa. The 8FU 3-decamer is 12.0 MDa, matching the peak near 12.67 MDa. The 8FU 4-decamer is expected at 16.0 MDa and corresponds to the broad signal around 16 MDa.
Homework: Waters Part V — Did I make GFP?
Please fill out this table with the data you acquired from the lab work done at the Waters Immerse Lab in Cambridge, or else the data screenshots in this document if you were unable to have lab work done at Waters.
Theoretical
Observed/measured on the Intact LC-MS
PPM Mass Error
Molecular weight (kDa)
28.0066 kDa
27.989 kDa
628 ppm
Week 11 HW: Bioproduction & Cloud Labs
Part A: The 1,536 Pixel Artwork Canvas | Collective Artwork
I contributed a single pixel to the bioart project. It was one of the early additions—a red pixel placed in the bottom-left quadrant, about three rows down from the top of that section. At the time, the canvas was still mostly empty, and my contribution was eventually replaced as the artwork evolved into the final design, which included the word “Love.”
Even though my individual contribution was small, I think the project itself was a strong idea. It created a shared creative space where students across the HTGAA community could participate in building something collectively. This kind of setup is especially valuable since not everyone is physically located at MIT, Harvard, or a local node. It gave everyone a chance to contribute to a fun, interactive experiment while still being part of a larger collaborative effort.
One way this collaborative art experiment could be improved for next year is by adding a bit more structure or coordination without removing the creative freedom. For example, allowing students to preview or plan designs before placing pixels could reduce constant overwriting and lead to more intentional collaboration.
Part B: Cell-Free Protein Synthesis | Cell-Free Reagents
Cell-Free Protein Synthesis Reaction Components
E. coli Lysate
BL21 (DE3) Star Lysate (includes T7 RNA Polymerase) - Provides the ribosomes, tRNAs, aminoacyl-tRNA synthetases, and metabolic enzymes needed for transcription and translation. The DE3 strain supplies T7 RNA polymerase for high-yield transcription from T7 promoters, and the “Star” (RNase E mutant) background slows mRNA degradation to extend protein output.
Salts/Buffer
Potassium Glutamate - Maintains ionic strength and mimics intracellular conditions to stabilize proteins and ribosomes.
HEPES-KOH pH 7.5 - Buffers the reaction to maintain a stable pH optimal for enzymatic activity.
Magnesium Glutamate - Essential cofactor for ribosomes and enzymes; critical for translation and nucleotide interactions.
Potassium Phosphate Monobasic / Dibasic - Provides additional buffering capacity and helps maintain phosphate balance for metabolic reactions.
Energy/Nucleotide System
Ribose - Serves as a precursor for nucleotide synthesis in NMP-based energy systems.
Glucose - Fuels metabolic pathways in the lysate to regenerate energy (ATP).
AMP, CMP, UMP - Nucleoside monophosphates that the lysate’s endogenous nucleotide kinases phosphorylate up to NDPs and NTPs, supplying the ATP/CTP/UTP needed for transcription and translation.
GMP - Listed at 0 µM in the middle master mix composition. Would normally be the GTP precursor, but this formulation supplies guanine instead.
Guanine - Nucleobase used to support GMP/GTP synthesis for transcription and translation.
Translation Mix (Amino Acids)
17 Amino Acid Mix - The bulk substrate for protein synthesis; supplies all amino acids except the three broken out separately for solubility/stability reasons.
Tyrosine - Tyrosine is poorly soluble at neutral pH, so it’s added from a high-pH stock to keep it dissolved before it’s diluted into the reaction.
Cysteine - Added separately because it is prone to oxidation and needs controlled availability.
Additives
Nicotinamide - Supports redox balance by maintaining NAD+/NADH pools, improving metabolic efficiency and protein yield.
Backfill
Nuclease Free Water - Brings the reaction to the correct final volume without introducing nucleases that could degrade RNA or DNA.
The one hour PEP/NTP mix supplies energy and nucleotides directly as NTPs (ATP, GTP, CTP, UTP) with PEP-Mono and maltodextrin as the energy source, giving fast but short lived output because PEP is consumed quickly and phosphate buildup inhibits the reaction. The 20 hour NMP and Ribose mix instead feeds in cheap upstream precursors, ribose and glucose for energy regeneration, NMPs (AMP, CMP, UMP) and guanine that the lysate’s own kinases phosphorylate up to NTPs. So the system continuously regenerates its own ATP and NTPs rather than burning through a finite pool. The NMP and Ribose formulation also drops pricey additives like cAMP, NAD, folinic acid, spermidine, and DMSO in favor of just nicotinamide, making it dramatically cheaper and more sustainable at the cost of slower kinetics.
Bonus Question: Transcription can still occur because the cell-free lysate contains enzymes from the nucleotide salvage pathway that convert free guanine into GMP, and then further phosphorylate it into GDP and GTP. The produced GTP is the actual substrate used by RNA polymerase during transcription, so supplying guanine provides a precursor that the system can metabolically convert as needed.
Part C: Planning the Global Experiment | Cell-Free Master Mix Design
Fluorescent Proteins
sfGFP - chromophore maturation requires molecular oxygen for the final oxidation step (as with all avGFP-derived FPs), so in a sealed 36-hour cell-free reaction oxygen gets depleted and newly translated sfGFP accumulates as non-fluorescent apo-protein. Even with its fast folding, the readout plateaus once dissolved O₂ runs out.
mRFP1 - a somewhat slowly maturing monomer whose DsRed family chromophore requires two oxidation steps (not one), making it both oxygen hungry and slow; it’s also dimmer and less photostable than its parent DsRed. In cell-free reactions the slow, oxygen-dependent red chromophore formation means a lot of translated protein sits as the non-fluorescent green intermediate instead of reaching the mature red state.
mKO2 - strongly oxygen-dependent during chromophore maturation, with a pO₂·50 of 0.9%, meaning fluorescence drops by half at oxygen tensions that are easily reached inside a closed reaction tube. This makes it the most hypoxia sensitive FP on the list and a major liability in a long, sealed cell-free incubation where O₂ gets consumed by the lysate’s residual respiratory enzymes.
mTurquoise2 - The main cell-free weakness for mTurquoise2 is that its chromophore is built from a Tyr-Gly backbone cyclization plus oxidation, and like other avGFP derivatives that oxidation step consumes O₂ and produces H₂O₂ as a byproduct; over 36 hours in a closed reaction, both oxygen depletion and H₂O₂ accumulation can cap the mature fluorophore pool. Its excitation also sits in the near-UV/violet range where lysate components (flavins, NADH) contribute background that hurts signal-to-noise.
mScarlet_I - The T74I mutation gives mScarlet-I markedly faster maturation but at the cost of a reduced quantum yield (0.54) and shorter fluorescence lifetime (3.1 ns), and like all DsRed lineage RFPs its chromophore requires two sequential oxidation steps to reach the red state. Incomplete maturation (“dead-end” green intermediates) and oxygen limitation over a 36-hour reaction both suppress the final red signal.
Electra2 - a blue FP derived from mRuby3 (Entacmaea quadricolor lineage); its blue emission at ~456 nm overlaps heavily with the autofluorescence of lysate cofactors like NADH (~460 nm) and flavins, which tanks signal-to-noise in cell-free systems. It also inherits the eqFP611/DsRed family two step oxidative maturation, so oxygen depletion over 36 hours hurts yield just as it does for the RFPs.
Hypothesis
Hypothesis: Boost cysteine to accelerate Electra2 chromophore maturation and final fluorescence yield over 36 hours, as well as, boost guanine to relieve GTP bottleneck.
Protein: Electra2
Reagent adjustment: Cysteine 4.0 mM → 8.0 mM & Guanine 0.156 mM → 0.4 mM
Rationale and expected effect: Electra2 is derived from mRuby3, which descends from eqFP611, a DsRed/Anthozoa lineage chromophore. These chromophores form from an X-Tyr-Gly tripeptide and require oxidative cyclization to mature. Critically, the parent mRuby3 scaffold contains internal cysteines that participate in chromophore environment and folding, and free cysteine in solution is needed both as a building block (Electra2’s sequence still contains Cys residues) and as a reducing agent that prevents misoxidation of those internal thiols during the long folding/maturation window. In a 36-hour reaction, the free cysteine pool gets depleted and oxidized (cystine, mixed disulfides), which can stall folding of cysteine containing FPs and leave a larger fraction stuck as immature/misfolded protein. Doubling the cysteine pool extends the reducing capacity and amino acid availability across the full 36-hour window, which should increase the fraction of Electra2 that reaches the mature, blue fluorescent state. The expected effect is higher final Electra2 fluorescence intensity at 456 nm at the 36-hour endpoint, with the largest gains in the second half of the incubation (12–36 hr) when the baseline cysteine pool would otherwise be exhausted.
Secondly, for the boost guanine to relieve GTP bottleneck, translation elongation consumes 2 GTP per amino acid added, and Electra2 is a 236-residue protein, that’s ~470 GTP per molecule made. In a 36-hour reaction, GTP regeneration via the salvage pathway (guanine → GMP → GDP → GTP) becomes rate-limiting. The expected effect here is more guanine means more sustained GTP, means more Electra2 translated. Particularly relevant since GMP is set to 0 in this mix, so guanine is the entire GTP feedstock.
Section 1: Abstract Engineering Brighter Autonomous Bioluminescence Autonomous bioluminescence offers a major advantage over conventional bioluminescent systems because it eliminates the need for repeated addition of external luciferin. In plants, the fungal bioluminescence pathway is especially attractive because it uses caffeic acid, a metabolite that already exists in plant metabolism. However, current glowing plants are still limited by pathway flux, enzyme efficiency, and overall light output. The goal of this project is to engineer a brighter autonomous bioluminescence system by combining improved fungal bioluminescence enzymes with upstream metabolic enhancements that increase precursor availability. My hypothesis is that replacing the original pathway enzymes with brighter variants, including truncated nnLuz v4, nnH3H v2, and mcitHispS, and then increasing caffeic acid supply through added metabolic modules such as BnC3’H1 and TAL/HpaB/HpaC, will produce stronger self-sustained light emission than earlier fungal pathway designs. The specific aims are to first validate improved core pathway components, then compare enhancer strategies in modular construct designs, and finally identify the best architecture for future transient expression in Nicotiana benthamiana and stable transformation in Nicotiana tabacum. Methods include modular DNA design in Benchling, synthesis of gene cassettes, hierarchical DNA assembly, sequence verification, and comparative testing of optimized enzyme combinations. For the current class stage, an initial simplified test will evaluate whether nnLuz v4 truncated and nnH3H v2 can generate light in an inducible expression system, providing an early validation step before full plant pathway assembly.
Autonomous bioluminescence offers a major advantage over conventional bioluminescent systems because it eliminates the need for repeated addition of external luciferin. In plants, the fungal bioluminescence pathway is especially attractive because it uses caffeic acid, a metabolite that already exists in plant metabolism. However, current glowing plants are still limited by pathway flux, enzyme efficiency, and overall light output. The goal of this project is to engineer a brighter autonomous bioluminescence system by combining improved fungal bioluminescence enzymes with upstream metabolic enhancements that increase precursor availability. My hypothesis is that replacing the original pathway enzymes with brighter variants, including truncated nnLuz v4, nnH3H v2, and mcitHispS, and then increasing caffeic acid supply through added metabolic modules such as BnC3’H1 and TAL/HpaB/HpaC, will produce stronger self-sustained light emission than earlier fungal pathway designs. The specific aims are to first validate improved core pathway components, then compare enhancer strategies in modular construct designs, and finally identify the best architecture for future transient expression in Nicotiana benthamiana and stable transformation in Nicotiana tabacum. Methods include modular DNA design in Benchling, synthesis of gene cassettes, hierarchical DNA assembly, sequence verification, and comparative testing of optimized enzyme combinations. For the current class stage, an initial simplified test will evaluate whether nnLuz v4 truncated and nnH3H v2 can generate light in an inducible expression system, providing an early validation step before full plant pathway assembly.
Figure 1. Bioluminescence Pathway.
Section 2: Project Aims
Aim 1: Experimental Aim
The first aim of my final project is to validate that the optimized fungal bioluminescence enzymes nnLuz v4 truncated and nnH3H v2 produce measurable light when co-expressed in E. coli, by utilizing a pET-28a(+) expression plasmid (BamHI/HindIII cloning sites), BL21(DE3) competent E. coli cells, IPTG induction, and exogenous hispidin supplementation, with luminescence quantified in 96-well black plates on a plate reader. Because neither the v4 mutation set nor the ΔN20 truncation has previously been tested in combination, this experiment provides a fast, low-cost functional readout of whether the two independently-validated improvements stack and create a brighter enzyme pair before committing to full pathway assembly in plants. Tools and resources include Benchling for construct design and sequence verification (referenced against Shakhova et al. 2024, Nature Methods and Patent CN116732084A), Twist Bioscience for synthesis of the codon-optimized gene cassette, remote Opentrons automation for liquid handling, and standard molecular biology reagents (kanamycin selection, LB media, NEB OneTaq for verification PCR). A detailed step-by-step protocol for this aim is provided in the Experimental Design section.
Aim 2: Development Aim
The second aim of my final project is to assemble and compare modular versions of an improved autonomous bioluminescence pathway for plant expression by combining an upgraded fungal core pathway with different upstream precursor boosting modules. Following a successful Aim 1, I plan to build and test pathway versions containing the brighter core enzymes (mcitHispS, NpgA, nnLuz_v4 truncated, nnCPH, and nnH3H_v2) together with caffeic acid precursor enhancers, including BnC3’H1 and the bacterial TAL/HpaB/HpaC module, to determine which combination produces the strongest autonomous signal. These constructs will be assembled into pCAMBIA1300 and delivered via Agrobacterium tumefaciens (GV3101), first evaluated in Nicotiana benthamiana through transient agroinfiltration before selecting the best performing design for stable transformation in Nicotiana tabacum. This stage extends the project from an enzyme pair validation in E. coli into a complete, self-sustaining plant bioluminescence system, while systematically testing whether boosting upstream caffeic acid availability further amplifies the gains achieved through core enzyme optimization. Once a winning architecture is established, future work can layer in additional improvements such as a Bioluminescence Resonance Energy Transfer (BRET) module for emission tuning and miRNA-based silencing strategies to fine tune pathway flux.
Aim 3: Visionary Aim
The third aim of my final project is to develop a much brighter and more robust autonomous bioluminescence platform that could enable new classes of living reporters, biosensors, and potentially useful light producing plants. If fully realized, this project could push plant bioluminescence beyond novelty and toward practical applications by creating systems that are easier to detect, quantify, and deploy without external substrate addition. More broadly, a sufficiently bright autonomous system could expand the use of bioluminescence for noninvasive monitoring of biological processes and help establish living light producing systems as useful tools in synthetic biology, agriculture, and environmental sensing.
Section 3: Background
Background and Literature Context
The fungal bioluminescence pathway (FBP) was first fully characterized in Neonothopanus nambi by Kotlobay et al. (2018, PNAS), who identified the core enzymes hispidin synthase (HispS), hispidin-3-hydroxylase (H3H), luciferase (Luz), and caffeoyl pyruvate hydrolase (CPH). This was a landmark finding because caffeic acid is already produced natively by most plants, making FBP uniquely suited for engineering autonomous, substrate-free luminescence in plant hosts. Mitiouchkina et al. (2020, Nature Biotechnology) then demonstrated proof of concept by stably transforming Nicotiana tabacum with the wild type pathway, producing tobacco plants that glowed visibly without external substrate addition. Both studies, however, established the same critical limitation: the wild type fungal enzymes performed suboptimally in heterologous hosts, leaving brightness well below what would be needed for practical reporter, biosensing, or illumination applications. Shakhova et al. (2024, Nature Methods) directly addressed this by applying directed evolution and ortholog screening to the FBP enzymes, producing the optimized FBP3 pathway (mcitHispS, NpgA, nnLuz v4, nnCPH, nnH3H v2) that outperformed wild type FBP1 by one to two orders of magnitude across yeast, plant, and mammalian hosts. Independently, Patent CN116732084A reported that a 20 amino acid N-terminal truncation of wild type nnLuz (Luz ΔN20), designed from AlphaFold structural analysis, produced a 1.5- to 2-fold improvement in brightness by removing a predicted membrane associated α-helix that interferes with protein folding and accumulation.
Novelty and Innovation
The main novelty of this project is that it tests a new luciferase combination that has not yet been reported, nnLuz v4 ΔN20, that combines the seven beneficial point mutations from Shakhova et al. (2024) with the N-terminal truncation from Patent CN116732084A. The two improvements act through fundamentally different mechanisms, the v4 mutations enhance catalytic activity and thermostability, while the ΔN20 truncation increases functional protein accumulation by removing a membrane-associated α-helix that interferes with folding. So, there is a strong theoretical basis to expect at least additive, and potentially synergistic, gains in light output, but this has never been experimentally demonstrated. The project is also innovative in how it builds toward brighter autobioluminescent plants through a modular synthetic biology strategy, combining improved core fungal enzymes with upstream metabolic engineering modules such as BnC3’H1 and TAL/HpaB/HpaC to test whether enzyme optimization and precursor boosting can be layered together. This treats pathway brightness as a systems engineering problem rather than a single gene optimization problem, and directly tests whether the brightness ceiling of autonomous plant bioluminescence is set by enzyme efficiency, by substrate supply, or by both.
Significance and Impact
The core problem this project addresses is that autonomous bioluminescence, despite being one of the most visually striking achievements in synthetic biology, remains too dim to be practically useful. Current glowing plants work as proof of concept and novelty demonstrations, but their light output is far below what would be required for quantitative reporters, field deployable biosensors, or functional living light sources, and nearly every published study in the field, from Mitiouchkina et al. (2020) to Shakhova et al. (2024), explicitly calls out further brightness improvement as a priority. Solving this problem matters because autonomous bioluminescence offers a fundamentally different model for biological imaging than the dominant tools currently in use. Conventional luciferases like firefly luciferase and NanoLuc require continuous addition of expensive luciferin substrates, while fluorescent proteins require excitation light that causes phototoxicity and autofluorescence background. A bright autonomous system would eliminate both problems at once, enabling truly noninvasive, long-term monitoring of biological processes in ways no existing technology supports.
The broader societal contributions span multiple domains. In agriculture, bright autonomous reporter plants could give a real time visual readout of stress, nutrient status, or pathogen exposure without specialized equipment. In environmental sensing, engineered plants could function as living biosensors for soil contaminants or pollutants in places where electronic sensors are impractical. In basic research, brighter autonomous reporters could allow long-term imaging of gene expression and development without repeated substrate addition. And in the longest term, sufficiently bright autonomous bioluminescence could begin to challenge the paradigm of energy intensive artificial illumination. Taken together, the immediate scientific contribution (a brighter enzyme pair and a tested chimera), the methodological contribution (a screening first workflow), and the conceptual contribution (treating brightness as a systems level rather than enzyme level problem) could collectively reshape how the synthetic biology community approaches engineering of autonomous bioluminescence.
Ethical Implications
This project raises ethical issues related to environmental release, responsible genetic engineering, and unintended ecological effects. Although the immediate work is being done in controlled systems such as E. coli and laboratory grown Nicotiana, the long-term goal of brighter autobioluminescent plants creates questions about what could happen if such organisms were released outside containment. The most relevant ethical principles are non-maleficence, because the work should avoid ecological harm; responsibility, because engineered organisms should be designed and communicated carefully; beneficence, because the technology could create useful tools for research and agriculture; and justice, because the benefits of the technology should not be limited only to wealthy institutions or private companies.
To keep the project ethical, the work should proceed in a staged and containment focused way. Early testing should remain in bacterial systems, transient plant assays, or controlled greenhouse settings rather than open environmental release. If autobioluminescent plants are to be used in environmental deployment, concrete biocontainment strategies would need to be built into the organisms themselves. These could include reproductive sterility to prevent uncontrolled spread through seed or pollen, synthetic auxotrophy so that the organism depends on a nutrient not available in the wild and cannot survive outside managed conditions, or genetic kill switches that cause the organism to self terminate if containment conditions are no longer met. Any environmental release would also require staged deployment beginning with small scale controlled field trials, regulatory review, and post release ecological monitoring to detect unintended effects on local ecosystems, pollinators, or nocturnal wildlife. Beyond containment, the project should evaluate possible unintended effects on growth, metabolism, or fitness, since increasing pathway flux could create burdens on the host organism. It is also important to communicate the project honestly and not overstate near-term applications such as biological lighting when the more realistic near-term value is in imaging and biosensing. If increased brightness causes unacceptable tradeoffs, the ethical response would be to redesign the system or restrict its use to contained research settings rather than consumer or environmental deployment.
Section 4. Experimental Design, Techniques, Tools, And Technology
Step 1: DNA Design in Benchling (Timeline: Day 1, manual)
Design four pET-28a(+) plasmids, one encoding nnLuz v4 ΔN20 (with four of the Shakhova v4 substitutions T99P, T192S, A199P, I63T and a 20 amino acid N-terminal truncation) and nnH3H v2 (with four Shakhova v2 substitutions D37E, V181I, S323M, M385K). The other three pET-28a(+) plasmids will be the controls, wild type (WT) nnLuz & nnH3H WT (baseline), nnLuz v4 (full length) & nnH3H v2, and nnLuz ΔN20 (truncated, no v4 mutations) & nnH3H v2. Use codon optimization for each of the plasmids for E. coli expression. Insert both genes in each of the plasmids under T7 promoter control with a ribosome binding site (RBS) between them. Include BamHI and HindIII restriction sites flanking the insert for future cloning flexibility. Export the plasmid maps and sequence annotations. Expected result: Complete plasmid design files ready for Twist Bioscience submission.
Step 2: Order Whole Plasmid from Twist Bioscience (Timeline: Day 1–14)
Submit all four complete pET-28a(+) plasmid designs to Twist Bioscience for synthesis. Request all four plasmids in standard cloning vectors format with kanamycin resistance. Twist will synthesize all four plasmids (including backbone). Machine/Platform: Twist Bioscience synthesis platform. Expected result: Lyophilized plasmid DNA arrives within 10–14 business days. Timeline: 10–14 days turnaround.
Step 3: Resuspend and Transform Plasmid into BL21(DE3) (Timeline: Day 15, manual)
Resuspend lyophilized Twist plasmids in sterile nuclease-free water to 50–100 ng/µL. For each of the plasmids, transform 1 µL into 50 µL chemically competent BL21(DE3) cells using standard heat-shock protocol (42°C for 45 seconds). Recover in 250 µL SOC medium at 37°C for 1 hour. Plate 100 µL onto LB-agar plates supplemented with 50 µg/mL kanamycin. Incubate overnight at 37°C. Expected result: 50–200 colonies per plate.
Step 4: Colony PCR and Sanger Sequencing Verification (Timeline: Day 16–18)
Pick 3–5 colonies and perform colony PCR using NEB OneTaq 2X Master Mix with primers flanking the insert regions. Run PCR products on a 1% agarose gel to confirm correct insert size. Submit PCR products for Sanger sequencing to verify all four plasmids inserts are correct. Machine: ATC Thermal Cycler for colony PCR. Expected result: Correct insert size on gel; sequencing confirms all inserts are correct and no frame shifts exist. Timeline: 2–3 days including sequencing turnaround.
Step 5: Miniprep (Timeline: Day 18, manual)
Inoculate 5 mL LB + kanamycin (50 µg/mL) in separate tubes with sequence verified colonies. Grow overnight at 37°C with shaking (250 rpm). Perform plasmid miniprep using a commercial kit (e.g., Qiagen QIAprep). Quantify plasmids DNA by NanoDrop. Expected result: 50–200 ng/µL plasmid DNA.
Step 6: Prepare 96-Well Starter Cultures (Timeline: Day 19, automated)
Dispense 150 µL LB + kanamycin (50 µg/mL) into each well of a 96-well deep-well plate (96-v-eppendorf-951033502-deep) using Multiflo automated dispenser. Inoculate wells with sequence verified BL21(DE3) transformants for all 7 experimental conditions (wild-type nnLuz + nnH3H WT, nnLuz v4 only, nnLuz ΔN20 only, nnLuz v4 ΔN20, uninduced controls, hispidin only blank, no hispidin control). Include 6–8 replicate wells per condition. Machine: Multiflo automated dispenser. Plate type: 96-well deep-well plate. Expected result: Uniform liquid dispensing across all wells. Timeline: 30 minutes.
Step 7: Overnight Growth of Starter Cultures (Timeline: Day 19–20, automated incubation)
Seal the 96-well plate using Plateloc with a breathable A4s seal. Incubate overnight at 37°C with shaking (900 rpm) in the Cytomat shaking incubator. Machine: Cytomat (30°C shaking incubator, set to 37°C mode if available; otherwise use Inheco Plate Incubator + BioshakeD3000). Expected result: Turbid cultures at OD600 ~2–4 after 16 hours.
Step 8: Subculture into Fresh Media and Measure OD600 (Timeline: Day 20, automated)
Dilute overnight cultures 1:100 into fresh LB + kanamycin in a new 96-well deep-well plate (200 µL final volume per well) using Bravo-96 plate stamp or manual multichannel pipette. Transfer 5 µL of each well to a 96-well flat-bottom clear plate (1-flat-thermo-264728-omni-96) and add 195 µL LB using Multiflo. Measure OD600 using Spark Plate Reader to confirm starting density. Machine: Bravo-96 plate stamp, Multiflo, Spark Plate Reader. Expected result: OD600 ~0.02–0.05 post-dilution.
Step 9: Growth to Mid-Log Phase (Timeline: Day 20, 2–3 hours)
Incubate the subculture plate at 37°C with shaking until OD600 reaches ~0.4–0.6 (mid-log phase). Monitor OD600 every 30–60 minutes using Spark Plate Reader. Machine: Cytomat or Inheco + BioshakeD3000, Spark Plate Reader. Expected result: OD600 ~0.5 after 2–3 hours.
Step 10: IPTG Induction (Timeline: Day 20, automated)
Add IPTG to a final concentration of 0.5 mM using Multiflo or Echo525 acoustic liquid handler. If using Multiflo, prepare a 10 mM IPTG stock and dispense 10 µL per well. If using Echo525, prepare a 100 mM IPTG stock and transfer 1 µL per well. Mix gently by pipetting or brief shaking. Machine: Multiflo or Echo525. Expected result: Uniform IPTG addition across all wells.
Step 11: Protein Expression (Timeline: Day 20, 4–6 hours)
Incubate the induced cultures at 30°C (or 25°C for improved soluble protein expression) for 4–6 hours with shaking (900 rpm). Measure OD600 at the end of expression to confirm continued growth. Machine: Inheco Plate Incubator + BioshakeD3000. Expected result: OD600 ~1.5–2.5 post-induction; visible cell pellet.
Step 12: Transfer to 96-Well Black Assay Plate (Timeline: Day 20, automated)
Transfer 180 µL of induced culture from the deep-well plate into a 96-well black microplate with clear bottom (96-well black plates - Greiner # 655076) using Bravo-96 plate stamp or multichannel pipette. Retain 20 µL in the original plate for final OD600 measurement. Machine: Bravo-96 plate stamp or manual multichannel. Plate type: 96-well black assay plate. Expected result: Uniform transfer; black plate ready for luminescence measurement.
Step 13: Hispidin Substrate Addition (Timeline: Day 20, automated)
Prepare a 10 mM hispidin stock solution in DMSO. Dilute to 2 mM in sterile water immediately before use. Add 10 µL of 2 mM hispidin solution to each well (final concentration ~100 µM hispidin) using Multiflo or manual multichannel pipette. For no-hispidin controls, add 10 µL sterile water + DMSO vehicle. Mix gently by pipetting. Machine: Multiflo or manual multichannel. Expected result: Final hispidin concentration 100 µM; no precipitation.
Step 14: Kinetic Luminescence Measurement (Timeline: Day 20, 30–60 minutes)
Immediately transfer the 96-well black plate to the Spark Plate Reader or PHERAstar FSX. Configure the instrument for luminescence detection (open filter, no wavelength selection, integration time 1 second per well). Program a kinetic read: measure luminescence every 3–5 minutes for 30–60 minutes to capture signal rise, plateau, and decay. Machine: Spark Plate Reader or PHERAstar FSX. Expected result: Time course luminescence data for all wells; expected peak signal at ~10–20 minutes post-hispidin addition. Timeline: 30–60 minutes.
Step 15: Final OD600 Normalization (Timeline: Day 20, 10 minutes)
After kinetic luminescence measurement is complete, measure final OD600 for all wells in the original deep-well plate using Spark Plate Reader. Normalize luminescence data (RLU) to OD600 to calculate brightness per cell. Calculate integrated luminescence (area under the curve) using trapezoidal integration. Machine: Spark Plate Reader. Expected result: Normalized luminescence/OD600 values for all conditions; integrated AUC values for statistical comparison.
Plate Layout Diagram
Technique Checklist
The following techniques from the HTGAA curriculum are directly used or referenced in this project:
Technique Expansion 1: DNA Design and Codon Optimization in Benchling
DNA design in Benchling is a foundational technique for synthetic biology that allows researchers to computationally design, annotate, and optimize genetic constructs before committing to expensive DNA synthesis. For this project, Benchling was used to design all four of the pET-28a(+) plasmids encoding nnLuz v4 ΔN20 & nnH3H v2, wild type (WT) nnLuz & nnH3H WT (baseline), nnLuz v4 (full length) & nnH3H v2, and nnLuz ΔN20 (truncated, no v4 mutations) & nnH3H v2 with appropriate ribosome binding sites and codon optimization for E. coli expression. Codon optimization is particularly important because the fungal genes (from Neonothopanus nambi) have different codon usage than E. coli, and rare codons can lead to slow translation, ribosome stalling, and poor protein expression. Benchling’s codon optimization tool identifies rare codons, replaces them with synonymous high-frequency codons, avoids introduction of unintended restriction sites or secondary structures, and maximizes the Codon Adaptation Index (CAI) for the target organism. This computational step improves protein expression yield and reduces experimental variability, making it a critical design-phase intervention for heterologous expression projects.
Technique Expansion 2: Automated Luminescence Kinetics and Normalization
Luminescence kinetics is a powerful technique for measuring time-resolved light emission from bioluminescent enzymes, providing far more information than single-endpoint measurements. In this project, the Spark Plate Reader is programmed to measure luminescence from all 96 wells every 3–5 minutes for 30–60 minutes after hispidin substrate addition, capturing the rise, peak, and decay of the signal. This kinetic approach has several advantages: it is less sensitive to timing artifacts (since peak brightness varies slightly between wells), it allows calculation of integrated luminescence (area under the curve) as a robust metric of total photon output, and it reveals enzyme kinetics such as substrate turnover rate and signal stability. Raw luminescence data (RLU) must be normalized to cell density (OD600) because brightness depends both on enzyme activity and the number of cells present. Normalization to OD600 isolates the “brightness per cell” metric, making comparisons between conditions valid even if growth rates differ slightly. This combination of kinetic measurement and normalization is standard practice in bioluminescence research and was the method used by Shakhova et al. 2024 to quantify improvements in the v4 enzyme set.
Section 5. Results & Quantitative Expectations
Validation Choice
The validation experiment for this project is Sanger sequencing of the Twist delivered plasmid to confirm that all designed mutations and the N-terminal truncation are present and correct. This validation step is the most critical quality control checkpoint in the entire project because every downstream experiment depends on the construct being exactly as designed. If even one of the v4 mutations is missing or incorrect, or if the ΔN20 truncation boundary introduces a frameshift, the luminescence data become uninterpretable and the hypothesis cannot be tested.
Validation Protocol
Step 1: Pick 3–5 colonies from the transformation plate and perform colony PCR with primers flanking the nnLuz_v4_ΔN20 and nnH3H_v2 insert. Run PCR with the following cycling conditions: 94°C initial denaturation (3 min), then 30 cycles of [94°C denaturation (30 sec), 58°C annealing (30 sec), 68°C extension (2 min)], followed by 68°C final extension (5 min).
Step 2: Run 5 µL of each PCR product on a 1% agarose gel. Confirm that the insert size matches the expected length (nnLuz_v4_ΔN20 and nnH3H_v2 insert is ~2250 bp).
Step 3: Purify the PCR product using a commercial PCR cleanup kit. Elute in 30 µL nuclease-free water.
Step 4: Submit purified PCR product for Sanger sequencing using primers that cover the full insert region.
Step 5: Align sequencing chromatograms to the reference design file in Benchling. Verify that all mutations are present, no unexpected substitutions exist, and the reading frame is intact across the ΔN20 junction.
Step 6: If sequencing confirms the construct is correct, proceed with miniprep and expression experiments. If sequencing reveals errors, re-pick colonies or re-order the plasmid from Twist.
Techniques Used
Sanger sequencing is the gold standard for sequence verification of plasmid constructs. It uses chain terminating dideoxynucleotides (ddNTPs) to generate fluorescently labeled DNA fragments of different lengths, which are separated by capillary electrophoresis and detected as a chromatogram. This technique provides single nucleotide resolution across 600–1000 bp per read, making it ideal for confirming point mutations and deletion boundaries. For this project, Sanger sequencing is essential because the nnLuz_v4_ΔN20 chimera contains single nucleotide substitutions plus a 60-nucleotide deletion, and all of these must be verified before interpreting luminescence data. Unlike next-generation sequencing (which is better for whole-genome analysis), Sanger sequencing is fast (2–3 day turnaround), affordable ($5–15 per read), and provides unambiguous base calls at every position, making it the standard validation method for synthetic biology constructs ordered from commercial vendors like Twist Bioscience.
Hypothetical Data
The following table shows hypothetical luminescence data for the key experimental conditions after normalizing to OD600 and calculating integrated luminescence (area under the curve, AUC) over a 60-minute kinetic read. Values represent mean ± standard deviation.
Condition
Peak RLU/OD600
Integrated AUC (RLU·min/OD600)
Wild-type (nnLuz + nnH3H_WT)
1200 ± 150
52,000 ± 6,800
nnLuz_v4 + nnH3H_v2
4300 ± 420
188,000 ± 19,000
nnLuz_ΔN20 + nnH3H_v2
2800 ± 310
128,000 ± 14,500
nnLuz_v4_ΔN20 + nnH3H_v2
7100 ± 690
315,000 ± 28,000
Uninduced (no IPTG)
22 ± 8
980 ± 350
Hispidin alone (no cells)
3 ± 1
140 ± 50
Induced, no hispidin
6 ± 2
270 ± 90
Interpretation: The chimeric nnLuz_v4_ΔN20 enzyme produces ~7100 RLU/OD600 at peak brightness, which is 5.9-fold brighter than wild-type and 1.65-fold brighter than nnLuz_v4 alone. The integrated AUC shows a similar trend: the chimera is 6.1-fold brighter than wild-type and 1.68-fold brighter than nnLuz_v4 alone. This suggests that the v4 mutations and ΔN20 truncation stack with modest synergy (greater than additive). All controls show minimal background signal, confirming that luminescence depends on both luciferase expression and exogenous hispidin substrate.
Conclusion: The chimeric enzyme reaches peak brightness at ~15 minutes post-hispidin addition and maintains elevated signal for ~40 minutes, consistent with the kinetics reported by Shakhova et al. 2024. The data support the hypothesis that the v4 mutations and ΔN20 truncation combine to produce a brighter luciferase than either modification alone.
Troubleshooting
Several experimental challenges may arise during this project. If luminescence signal is absent or far lower than expected, the most likely causes are (1) incorrect plasmid sequence (resolved by Sanger sequencing validation), (2) poor protein expression due to insoluble aggregation (testable by SDS-PAGE or Western blot), or (3) degraded or impure hispidin substrate (testable by LC-MS or purchasing fresh hispidin from a different supplier). If background signal is high in negative controls, this may indicate autofluorescence from the microplate, media components, or hispidin oxidation; switching to a different plate type or preparing fresh substrate immediately before use can resolve this. If luminescence kinetics are inconsistent between replicates, this may reflect pipetting errors during hispidin addition; using automated liquid handling (Multiflo or Echo525) instead of manual multichannel pipettes improves reproducibility. If OD600 normalization reveals high variability, this suggests uneven cell growth; pre-warming media and ensuring uniform shaking during growth can reduce this. Finally, if the nnLuz_v4_ΔN20 chimera is not brighter than nnLuz_v4 alone, this would indicate that the two improvements do not stack, which is itself a publishable negative result that informs future enzyme engineering strategies.
Section 6. Additional Information
References
Ge, J., Lang, X., Ji, J., Qu, C., Qiao, H., Zhong, J., Luo, D., Hu, J., Chen, H., Wang, S., Li, S., Li, W., Zheng, P., Xu, J., & Du, H. (2024). Integration of biological and information technologies to enhance plant autoluminescence. The Plant Cell, 36(11), 4703–4715. https://doi.org/10.1093/plcell/koae236
Kotlobay, A. A., Sarkisyan, K. S., Mokrushina, Y. A., Marcet-Houben, M., Serebrovskaya, E. O., Markina, N. M., … & Yampolsky, I. V. (2018). Genetically encodable bioluminescent system from fungi. Proceedings of the National Academy of Sciences, 115(50), 12728-12732. https://doi.org/10.1073/pnas.1803615115
Mitiouchkina, T., Mishin, A. S., Somermeyer, L. G., Markina, N. M., Chepurnyh, T. V., Guglya, E. B., … & Sarkisyan, K. S. (2020). Plants with self-sustained luminescence. Nature Biotechnology, 38(8), 944-946. https://doi.org/10.1038/s41587-020-0500-9
Shakhova, E. S., Karataeva, T. A., Markina, N. M., Mitiouchkina, T., Palkina, K. A., Perfilov, M. M., Wood, M. G., Hoang, T. T., Hall, M. P., Fakhranurova, L. I., Alekberova, A. E., Malyshevskaia, A. K., Gorbachev, D. A., Bugaeva, E. N., Pletneva, L. K., Babenko, V. V., Boldyreva, D. I., Gorokhovatsky, A. Y., Balakireva, A. V., … Mishin, A. S. (2024). An improved pathway for autonomous bioluminescence imaging in eukaryotes. Nature Methods, 21, 406–410. https://doi.org/10.1038/s41592-023-02152-y
Zheng, P., Ge, J., Ji, J., Zhong, J., Chen, H., Luo, D., Li, W., Bi, B., Ma, Y., Tong, W., Han, L., Ma, S., Zhang, Y., Wu, J., Zhao, Y., Pan, R., Fan, P., Lu, M., & Du, H. (2023). Metabolic engineering and mechanical investigation of enhanced plant autoluminescence. Plant Biotechnology Journal, 21(8), 1671–1681. https://doi.org/10.1111/pbi.14068
Patent CN116732084A. (2023). Application of fungal luciferase truncations in improving fungal or plant bioluminescence intensity. China National Intellectual Property Administration.
Supplies and Budget
Item
Quantity
Estimated Cost
Supplier
Link
Twist Bioscience plasmid synthesis (pET-28a(+) with nnLuz_v4_ΔN20 & nnH3H_v2 + control plasmids)