Mass Spectrometry
1. Calculation of eGFP molecular weight
1a. Online calculator
Reference eGFP sequence:
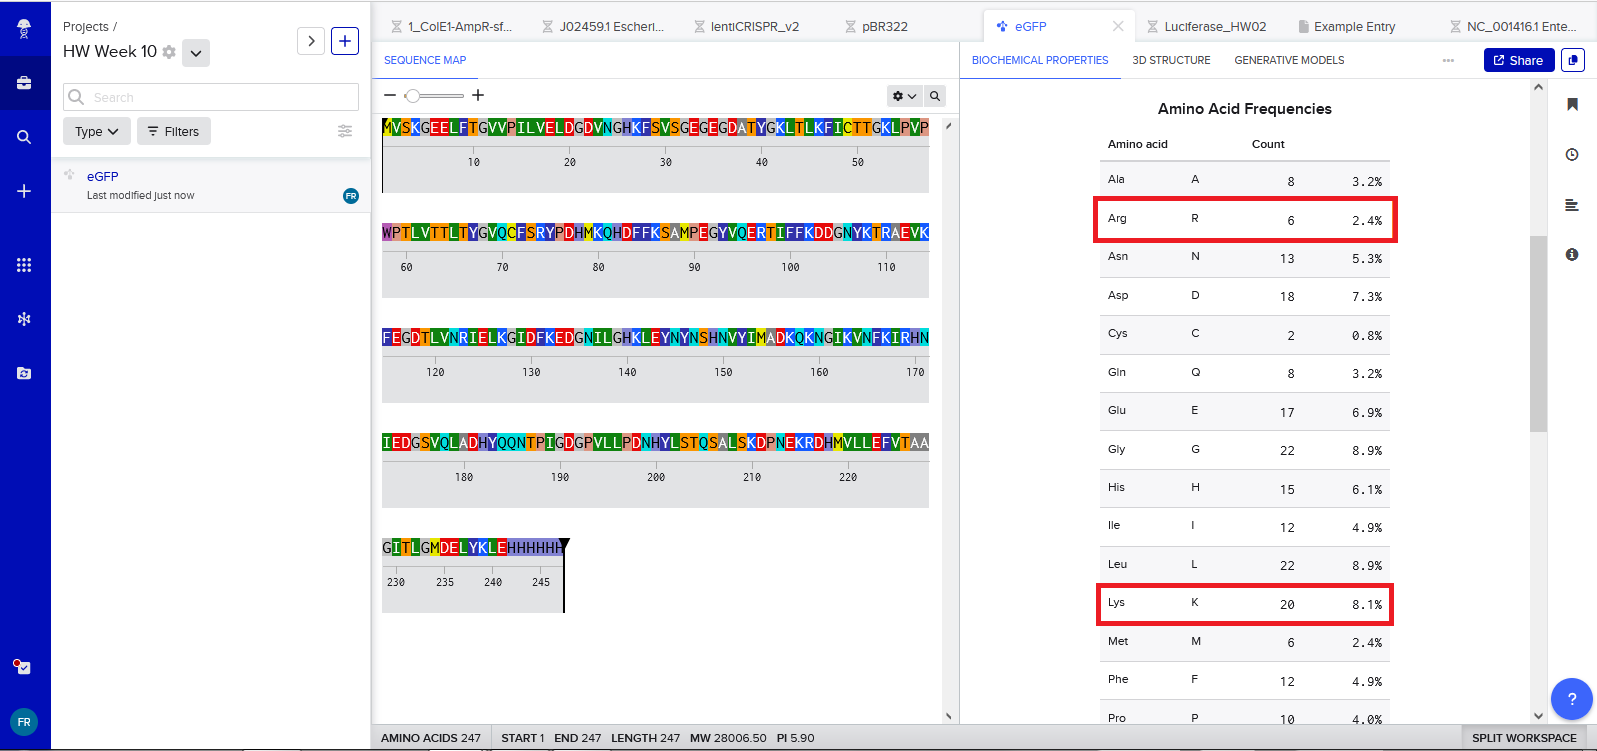
MVSKGEELFTG VVPILVELDG DVNGHKFSVS GEGEGDATYG KLTLKFICTT GKLPVPWPTL VTTLTYGVQC FSRYPDHMKQ HDFFKSAMPE GYVQERTIFF KDDGNYKTRA EVKFEGDTLV NRIELKGIDF KEDGNILGHK LEYNYNSHNV YIMADKQKNG IKVNFKIRHN IEDGSVQLAD HYQQNTPIGD GPVLLPDNHY LSTQSALSKD PNEKRDHMVL LEFVTAAGIT LGMDELYKLE HHHHHH
According to Gemini:
- In experimental settings, enhanced GFP (eGFP) is expressed with the start codon (N-terminal Methionine) as well as the His-purification tag (HHHHHH) and its linker (LE).
- For the calculation, one needs to calculate the summation of all the residues (linear Mw, that includes the addition of an extra hydrogen in N-terminal and an extra OH in C-term) and take into account the chromophore maturation (self-catalyzed backbone cyclization and oxidation of the tripeptide Thr65–Tyr66–Gly67 that allows eGFP to become fluorescent, see diagram below), which leads to the loss of one water molecule (-18.02 Da) during cyclization and the loss of two hydrogen atoms (-2Da) during oxidation.
- Average molecular weight is a best choice for the calculation because takes into account the natural distribution of all isotopes while monoisotopic weight only considers the single most abundant isotope for each atom. In simple words, the average estimation is closer to the natural distribution of isotopes present in nature.
Schematic diagram of the chromophore formation in maturing eGFP:
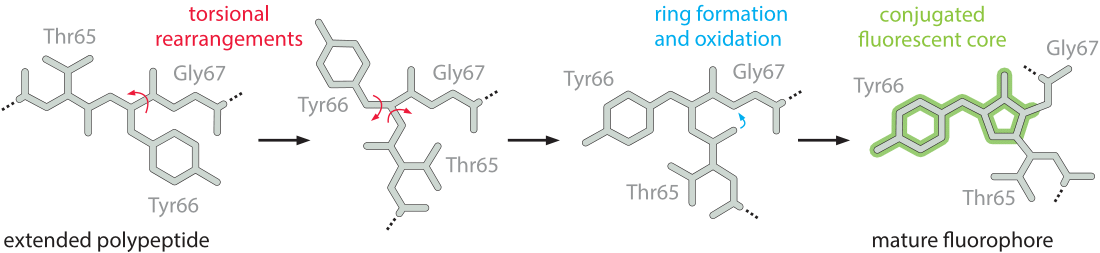
Source image: What is the maturation time for fluorescent proteins?
Calculation
When entering the full sequence in the online calculator one obtains a theoretical general molecular weight of ~ 28.006 kDa (“Th.Av. Mw” = 28006.60 Da)
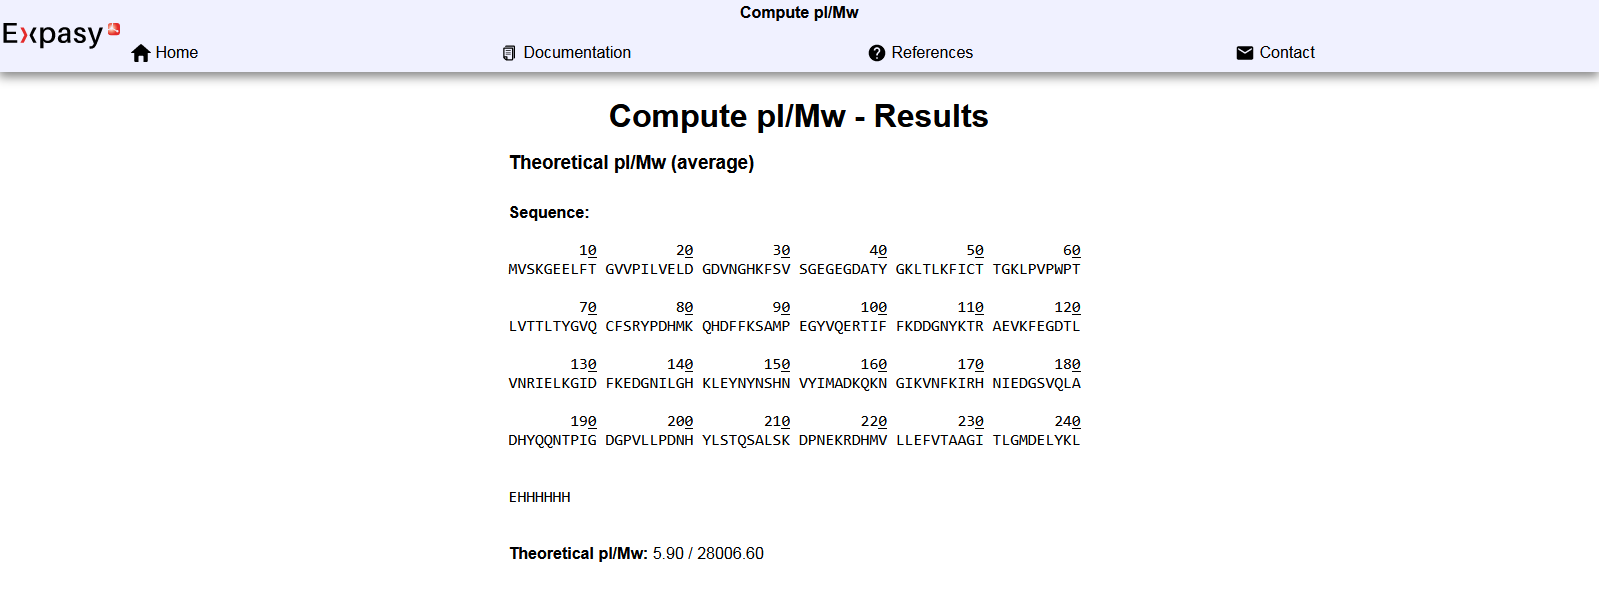
Integration of the fluorophore maturation: Th.Av. Mw - (H2O Mw + H2 Mw) = 28006.60 - (18.02 + 2) = 28006.60 - 20.02 = 27986.58 Da
In conclusion, the molecular weight of eGFP is estimated to 27.987 kDa.
1b. Adjacent charge state approach
Pair of adjacent peaks selected from the intact LC-MS data:
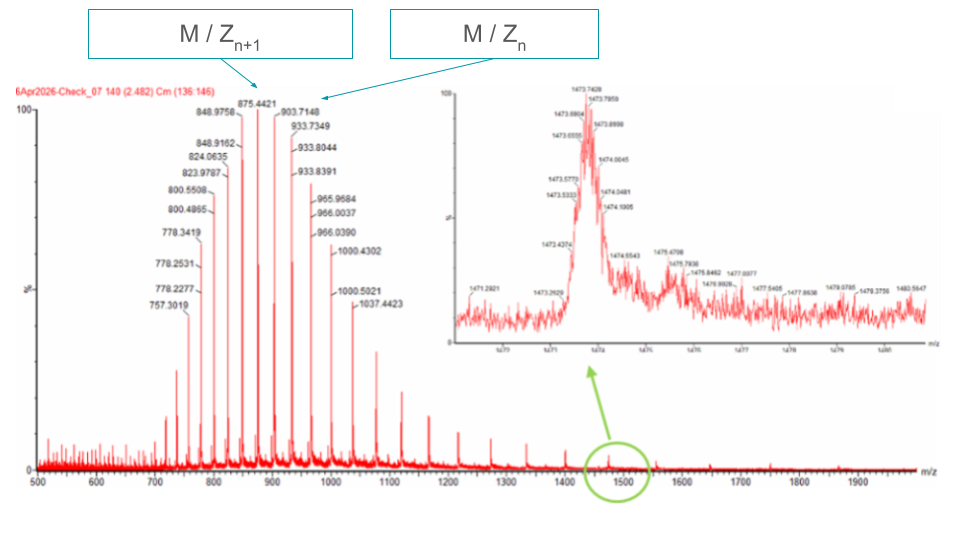
M/Zn+1 = 875.4421 and M/Zn = 903.7148
According to the adjacent charge state formula presented during recitation:
n = [ (M/Zn+1) -1 ] / [ (M/Zn) - (M/Zn+1) ]
n = (875.4421 -1) / (903.7148 - 875.4421) = 874.4421 / 28.2727 = 30.9289
Thus, charge state adjacent peaks:
Zn = ~31+ and Zn+1 = ~32+
According to molecular weight formula presented during recitation:
MW = ( n x M/Zn ) - n
MW (31+) = ( 31 x 903.7148 ) - 31 = 28015.1588 - 31 = 27984.1588 Da
MW (32+) = ( 32 x 875.4421 ) - 32 = 28014.1472 - 32 = 27982.1472 Da
Thus, average experimental molecular weight:
MW = 27.983 kDa
According to the mass accuracy formula presented during recitation:
Accuracy = | MW experiment - MW theory | / MW theory x 1’000’000
With MW experiment = 27’983 Da and MW theory = 27’987 Da
Accuracy = | 27983 - 27987 | / 27987 x 1’000’000 = 142.92 ppm
Conclusion: If accuracy > 50 ppm, either the protein is denatured or the mass spectrometer was not calibrated.
1c. Charge state zoomed-in peak
The values of the zoomed-in peak are not readable.
2. Secondary/tertiary structure
2a. Charge-state distribution
Analyze of eGFP in its native, folded state and comparison with its denatured, unfolded state on a quadrupole time-of-flight MS (lab experiment on Waters Xevo G3-QToF MS).
When a protein gets denatured, it loses the compact 3D (tertiary) structure of its native form. This unfolding process increases the protein surface exposed to the solvent, which acquires more charges during electrospray ionization. The extended shape of the protein also increases the drift time through the tube.
The mass spectrometer can detect this by measuring the protein’s charge-state distribution:
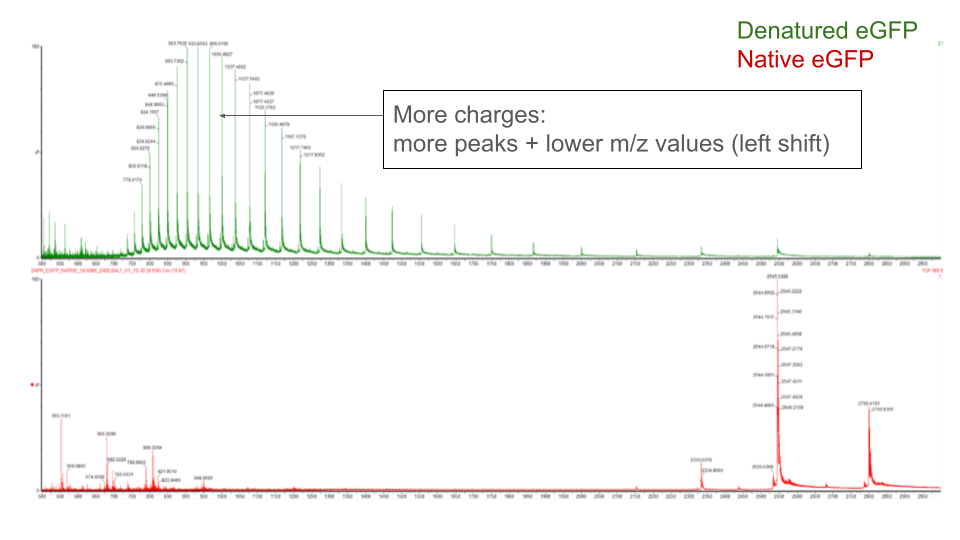
Reference: Lecture Week 10 by Lindsay Morrison
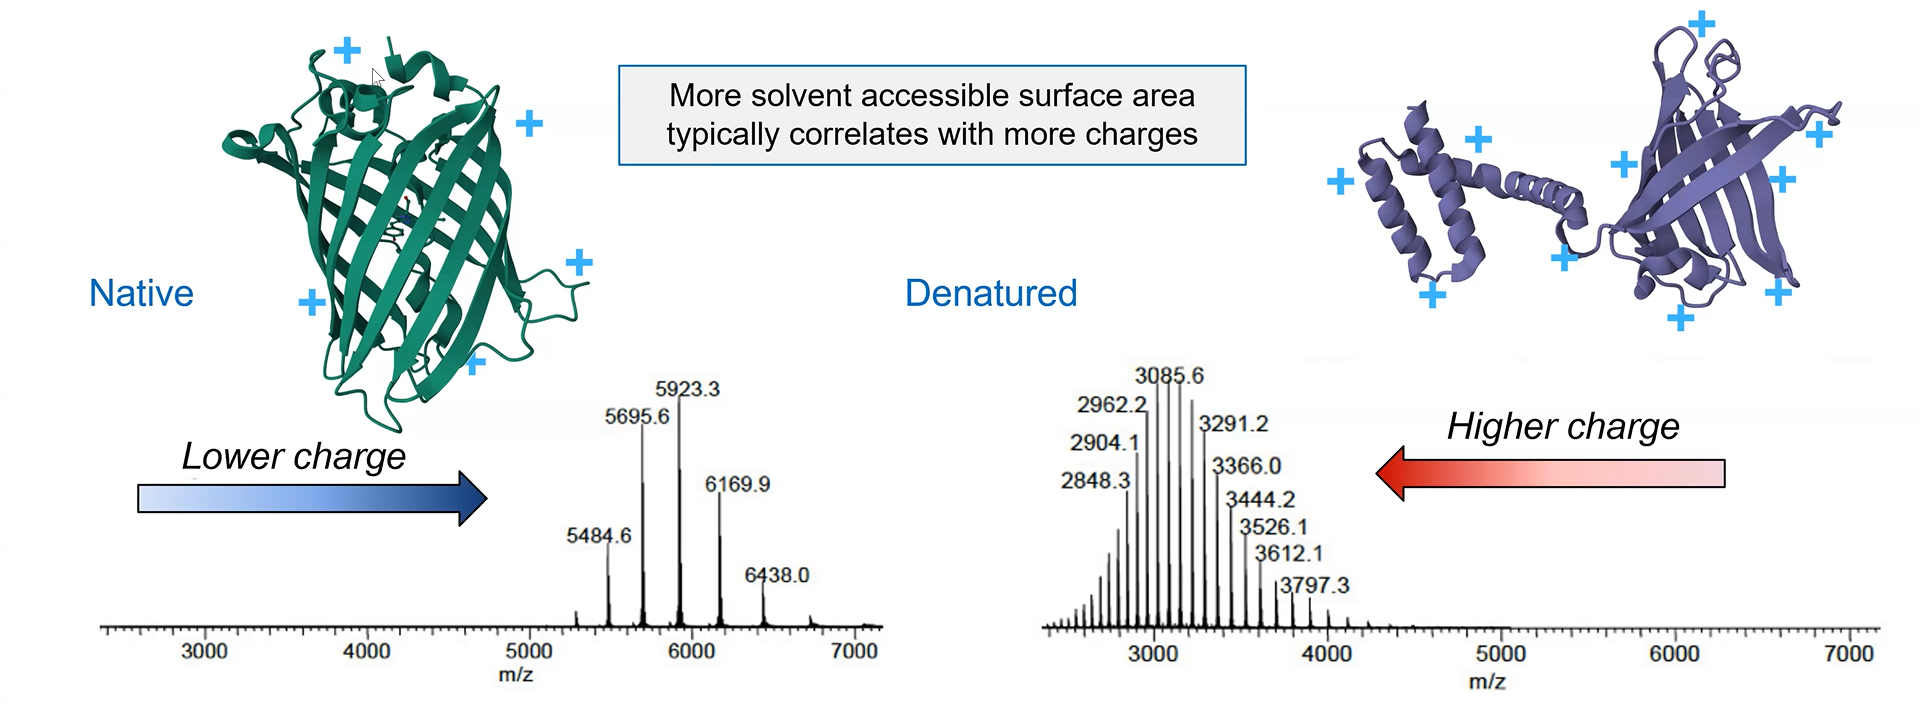
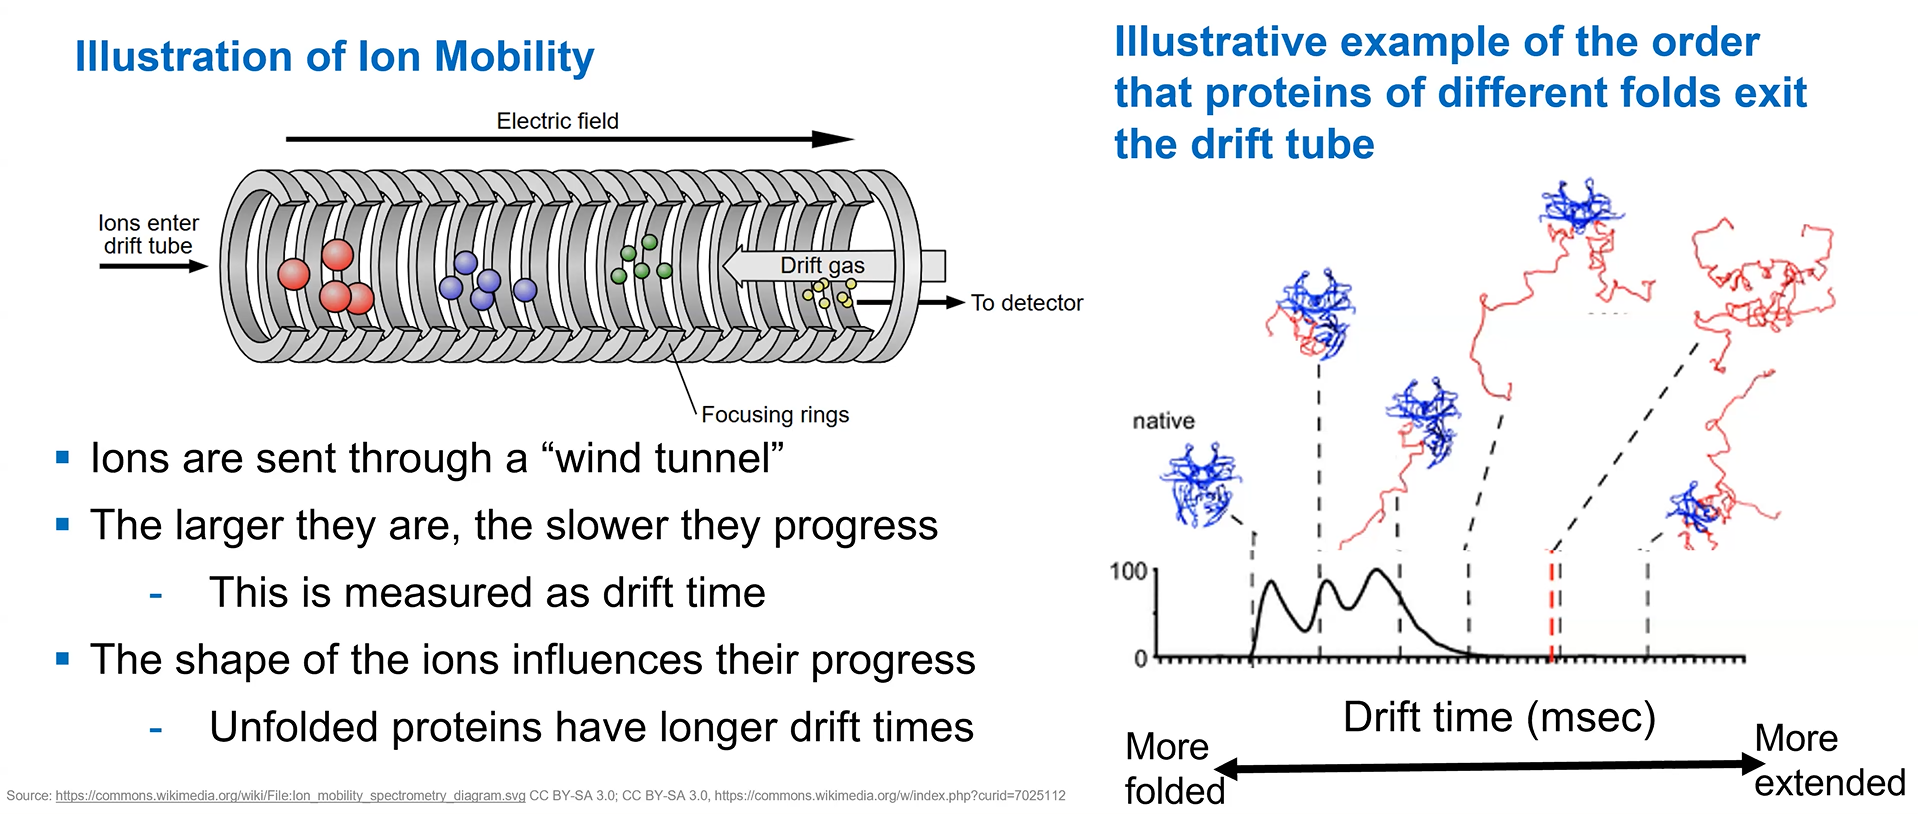
Image credit: Waters Corporation (slides from the lecture)
2a. Charge-state ~800 m/z peak
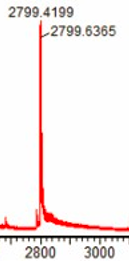
According to the formulas above, Zn = (MW + n) / M/Zn
With MW_theory = 27,986.57 Da and M/Zn = 2799.4199 for the peak ~800 M/Zn.
Thus, Zn = 27986.57 / 2799.4199 = 9.9973, i.e. Zn = ~ 10+
3. Peptide mapping: primary structure
3a. Lysine (K) and Arginine (R) residues count
Manual count:
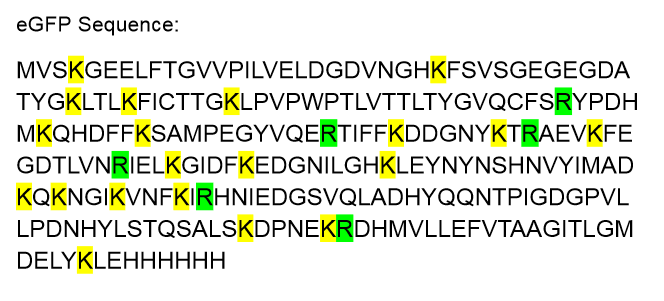
Lysine (K) = 20
Arginine (R) = 6
Results confirmed when analysing the peptide in Benchling
3b. Trypsin-generated peptides
Online tool used to predict the list of peptides generated from a tryptic digest: Expasy
Trypsin cuts after the Lysine (K) and Arginine (R) residues. If the digestion is complete, one can expect it to generate 27 (20+6+1) peptides.
However, when running the digestion in Expasy, the list only contains 19 peptides:
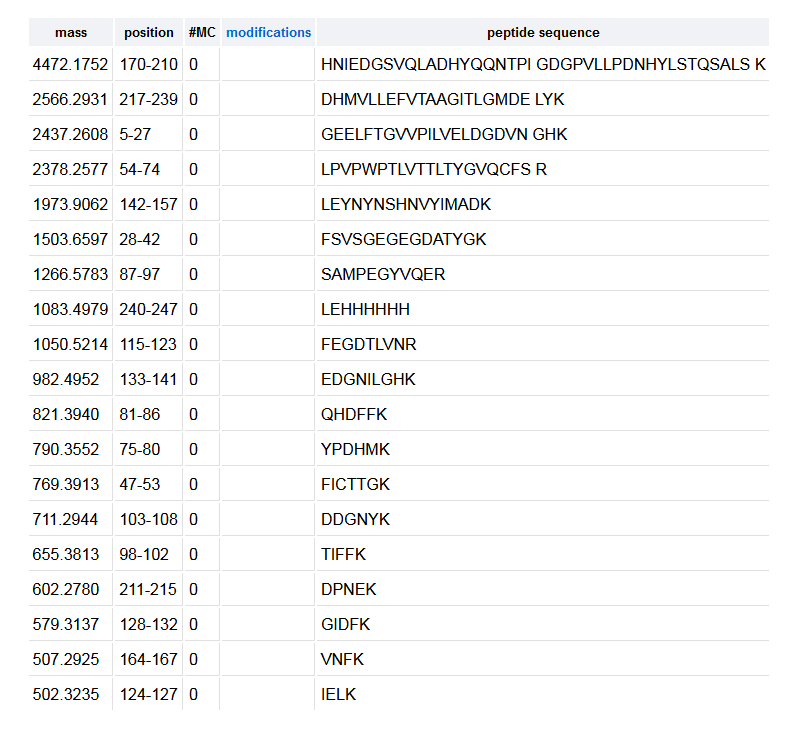
This discrepancy is explained by the application of a filter: PeptideMass only displays peptides above 500 Da.
So in conclusion:
Theoretical digest: 27 peptides
PeptideMass list (>500Da) = 19 peptides
3c. Peptide Map
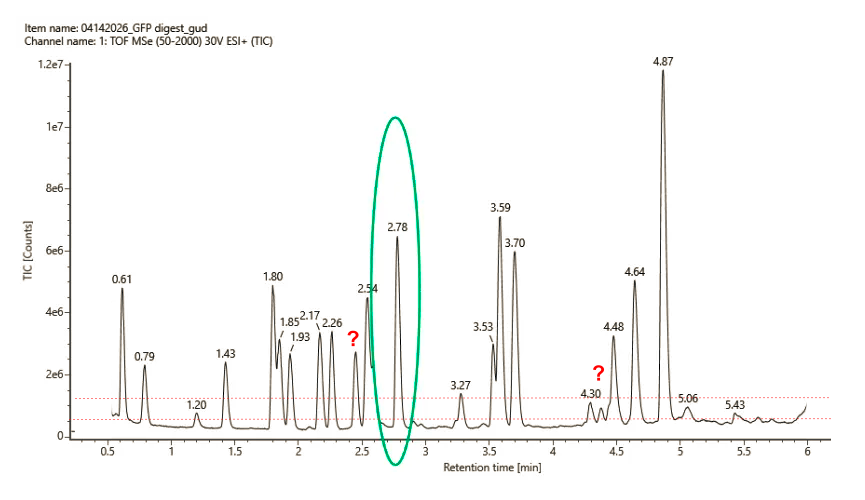
Peaks count:
- If the threshold is set relatively to the baseline intensity (10% above 5e^6): 21 to 23 peaks (depending if including unlabelled peaks or not)
- If the threshold is set relatively to the max peak intensity (10% of 1.2e7): 18 peaks
3d. Experiment vs theory
PeptideMass predicted 19 peptides (>500 Da) but the experimental data are slightly different (18-23 peptides, depending on threshold applied). The degree of mismatch appears reasonable and might be explained by:
- Peptides too small to be detected
- Miscleavage
- Sample degradation or modification (e.g. oxidation)
- Peaks merging due to similar elution time
- Impurities
3e. Analysis of the peptide 2.78 min retention time
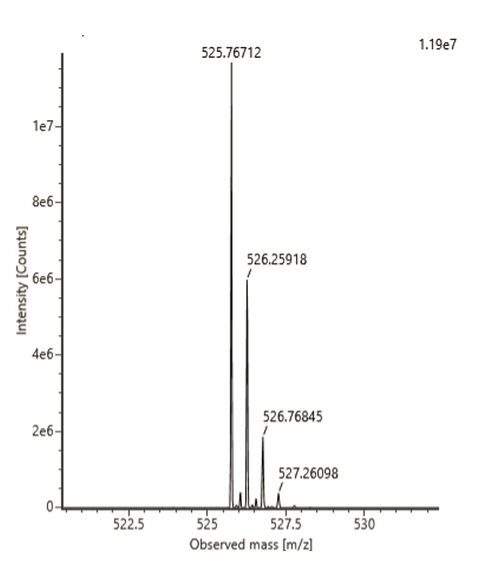
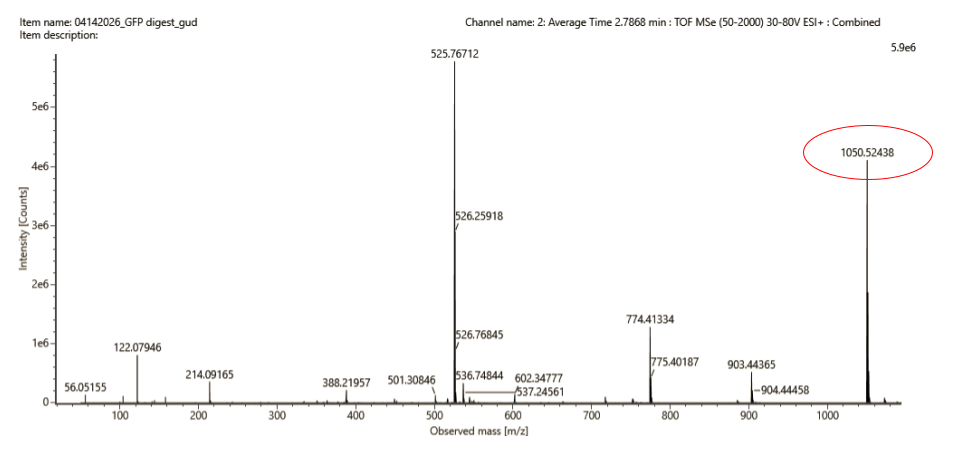
Charge State
The most abundant charge state for the peptide 2.78 min retention time is M/Z = 525.76712
According to formula [M/Z_adj - M/Z] = [M_adj -M] / Z and given that adjacent peak M/Z_adj = 526.25918,
M/Z_adj - M/Z= 526.25918 - 525.76712 = 0.4921
Thus, Z = 1 / 0.4921 = 2.03 = ~2+
Mass of the singly charged form of the peptide [M+H]+
[M+H]+ = Z x (M/Z) - (Z-1) x H
with M/Z = 525.767, Z = 2 and H+ = 1.00728 Da
[M+H]+ = 2 x 525.76712 - 1 x 1.00728 = 1050.52691 Da
This result match the singly charged peak m/z = 1050.52438 that can be observable in Fig.5c:
3f. Peptide identification & Mass Accuracy
Match with PeptideMass generated list (see above): Peptide FEGDTLVNR 1050.5214 Da (residues 115–123)
Accuracy: Accuracy = | MW experiment - MW theory | / MW theory x 1’000’000
With MW experiment = 1050.52438 Da and MW theory = 1050.5214 Da
Accuracy = | 1050.52438 - 1050.5214 | / 1050.5214 x 1’000’000 = 2.837 ppm
3g. Peptide map coverage
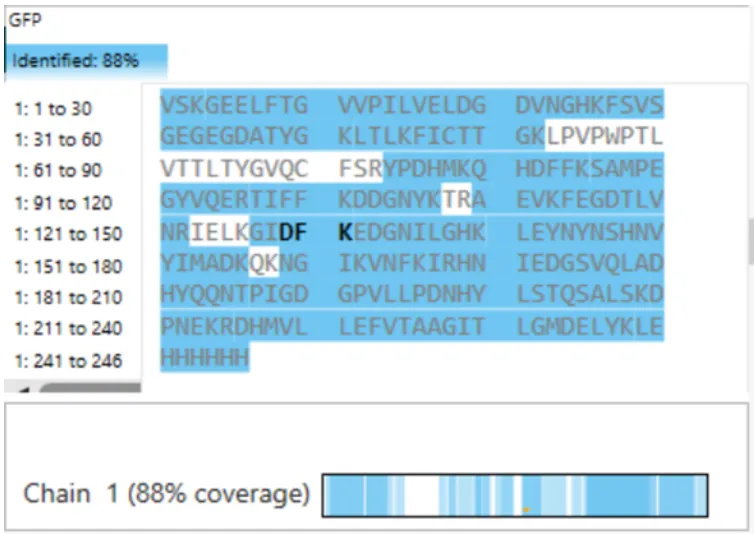
According to this last figure, 88% of the eGFP sequence was identified which is relatively close to the 90.2% predicted by PeptideMass.