Week 06 HW: Genetic Circuits Part I
DNA Assembly Assignment
1. Components of the Phusion High-Fidelity PCR Master Mix
The Phusion High-Fidelity PCR Master Mix contains the main components required for accurate DNA amplification. One key component is the Phusion DNA polymerase, which synthesizes new DNA strands with high fidelity. The mix also includes dNTPs, which serve as the nucleotide building blocks for DNA synthesis. In addition, it contains a reaction buffer that maintains the proper pH and salt conditions for enzyme activity, as well as magnesium ions, which are essential cofactors for polymerase function. Together, these components support efficient and accurate PCR amplification.
2. Factors that determine primer annealing temperature during PCR
Primer annealing temperature depends mainly on the melting temperature of the primers. This is influenced by primer length, GC content, sequence composition, and the degree of complementarity between the primer and the template DNA. Primers with higher GC content usually have higher melting temperatures because GC base pairs form stronger interactions than AT base pairs. The ionic conditions of the reaction can also affect annealing behavior. In practice, the annealing temperature is usually chosen a few degrees below the primer melting temperature to promote specific binding.
3. PCR and restriction enzyme digests as methods to create linear DNA fragments
PCR and restriction enzyme digestion can both be used to generate linear DNA fragments, but they do so in different ways. PCR creates a linear fragment by amplifying a specific region of DNA using primers and a DNA polymerase. This makes PCR highly flexible, since the user can define the exact fragment boundaries and can also introduce overlaps, mutations, or additional sequences through primer design. By contrast, restriction enzyme digestion produces linear DNA fragments by cutting DNA at specific recognition sites. This method is simpler when the correct restriction sites are already present, but it is less flexible because it depends on the natural or engineered location of those sites. PCR is preferable when custom fragment design is needed, whereas restriction digestion is useful for straightforward excision or plasmid linearization.
4. Ensuring that digested and PCR-generated DNA fragments are appropriate for Gibson cloning
To ensure that PCR-generated and digested DNA fragments are appropriate for Gibson cloning, the fragments must contain overlapping homologous ends. These overlaps are typically around 20 to 40 base pairs long and must match the adjacent fragment exactly so that they can anneal during the Gibson reaction. It is also important to verify that the fragments have the expected size and correct orientation. This can be checked by sequence design in Benchling and by confirming the fragment sizes experimentally, for example by gel electrophoresis. In addition, the DNA fragments should be clean and well purified to improve assembly efficiency.
5. How plasmid DNA enters E. coli cells during transformation
Plasmid DNA enters E. coli cells only after the cells have been made competent. In chemical transformation, the cells are treated to make their membranes more permeable, and a brief heat shock helps the plasmid DNA cross the membrane and enter the cell. In electroporation, a short electrical pulse creates temporary pores in the membrane that allow DNA uptake. After the DNA enters the cell, the bacteria recover in rich medium and begin expressing the antibiotic resistance marker carried by the plasmid. This makes it possible to select transformed cells on antibiotic-containing plates.
Another Assembly Method
6. Gibson Assembly
Gibson Assembly is a DNA assembly method that joins DNA fragments that share overlapping ends. The reaction contains three main enzymatic activities: an exonuclease, a DNA polymerase, and a DNA ligase. First, the exonuclease chews back the 5’ ends of the DNA fragments, exposing complementary single-stranded overlaps. These overlapping regions anneal to one another if they were designed correctly. Then the DNA polymerase fills in any missing nucleotides, and the ligase seals the remaining nicks in the DNA backbone. Because this method does not depend on restriction sites at the junctions, it allows seamless assembly of multiple DNA fragments in a single reaction.
7. Gibson Assembly explained in 5-7 sentences plus diagram
Gibson Assembly works by joining DNA fragments that share overlapping homologous ends. An exonuclease first creates single-stranded overhangs by chewing back the 5’ ends of each fragment. These exposed complementary regions then anneal to each other. After annealing, a DNA polymerase fills in the missing nucleotides. Finally, a DNA ligase seals the remaining nicks in the sugar-phosphate backbone. This method is efficient because it allows seamless joining of fragments without requiring restriction sites at the junctions. It is especially useful when assembling plasmids from PCR products and linearized backbones.
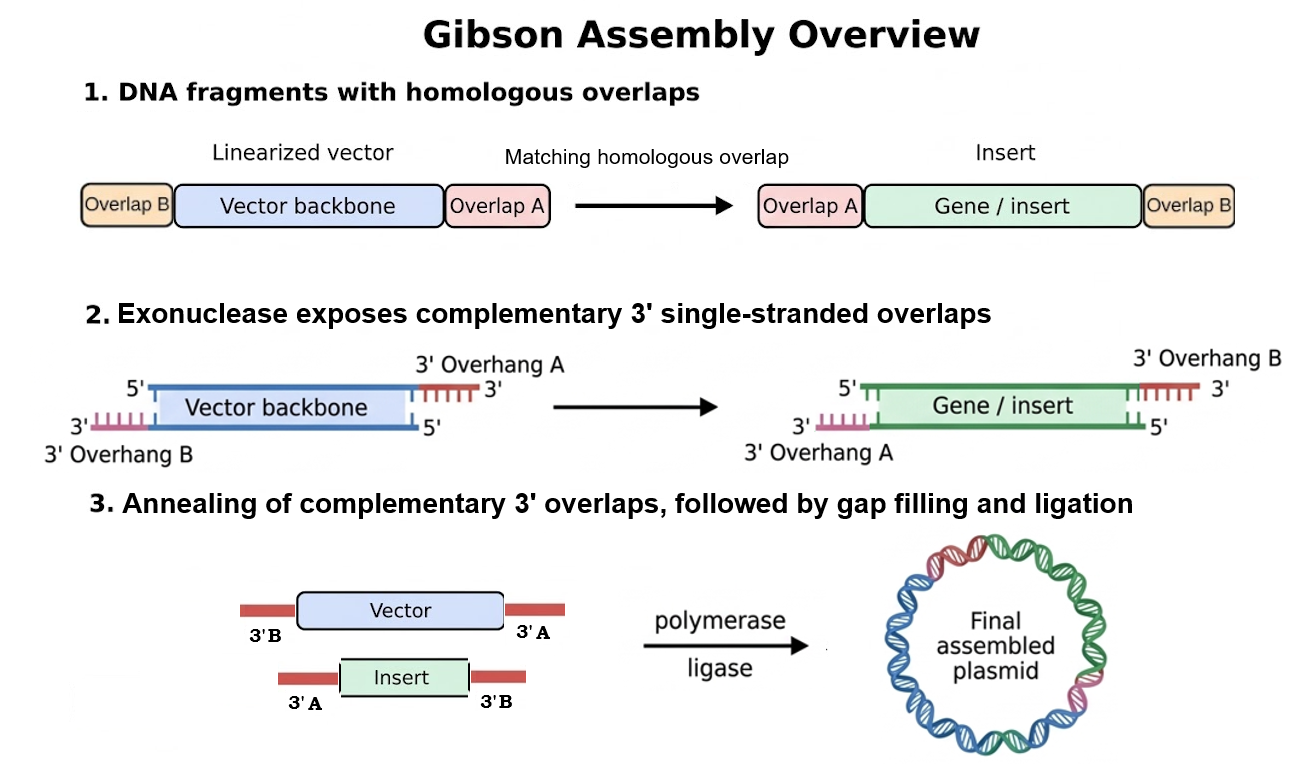 Figure 1. Overview of Gibson Assembly. (1) A linearized vector backbone and a DNA insert are designed with homologous overlap regions at opposite ends. (2) Exonuclease activity resects the 5’ ends of the DNA fragments, exposing complementary 3’ single-stranded overhangs. (3) These complementary 3’ overhangs anneal, DNA polymerase fills in the remaining gaps, and DNA ligase seals the remaining nicks, generating the final assembled plasmid.
8. Modeling this assembly method in Benchling
I modeled this assembly strategy in Benchling using a Gibson Assembly design from my project. In this design, I organized the vector backbone and the insert as separate DNA fragments and verified that they contained the appropriate overlap-compatible ends required for Gibson cloning. Benchling was useful for checking fragment orientation, overlap design, and the expected structure of the final construct before assembly. I then used the platform to inspect the final plasmid map and confirm the architecture of the assembled design.
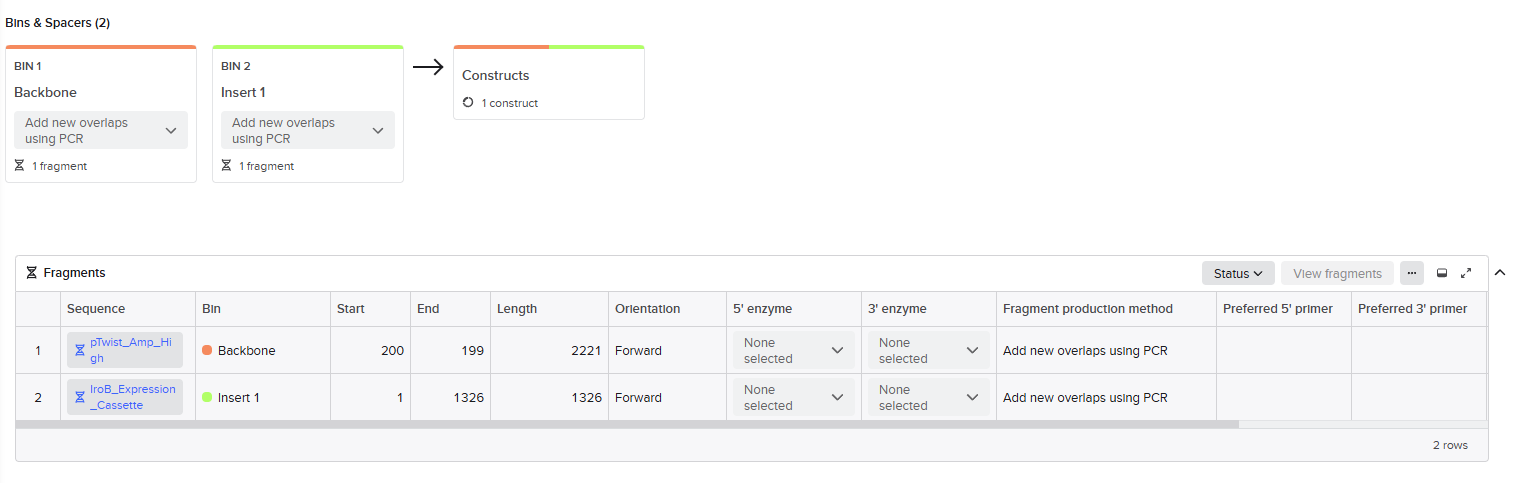 Figure 2. Benchling setup for Gibson Assembly design. The vector backbone and the iroB insert were organized as separate fragments in Benchling and prepared for Gibson Assembly by defining overlap-compatible ends. This setup was used to verify fragment identity, orientation, and the expected construct before generating the final plasmid design.
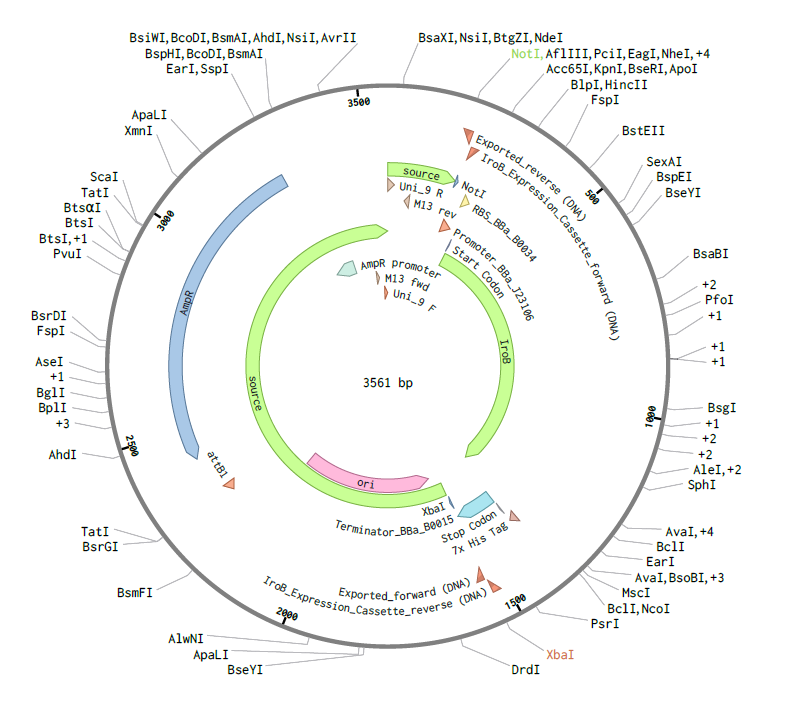 Figure 3. Final Benchling construct after Gibson Assembly design. Circular map of the assembled pTwist-iroB-cassette plasmid (3561 bp), showing the final construct architecture after insertion of the iroB modular cassette into the vector backbone. This map was used to confirm the final plasmid structure and annotation.
Asimov Kernel Homework
1. Repository and notebook setup
I created a dedicated repository for this homework in Asimov Kernel (Francisco_MC_HW6) and added a notebook entry to document the work.
2. Exploring the Bacterial Demos repository
I explored the Bacterial Demos repository and chose to inspect the NAND construct as an initial example (Figure 4), since NAND logic is directly relevant to the design of genetic circuits and to my broader interest in programmable circuit behavior.
From this construct, I observed that Kernel represents the design both as a linear arrangement of functional genetic parts and as a circular DNA map. This made it easier to identify how promoters, ribosome binding sites, coding sequences, and terminators are organized within the circuit.
3. Initial observations
The NAND example helped me understand how Kernel connects circuit logic with DNA architecture. In the linear view, the construct is represented as an ordered set of functional parts. In the circular map, the same construct can be interpreted as a plasmid-level design. This dual representation is useful for relating circuit structure to the physical organization of the DNA sequence.
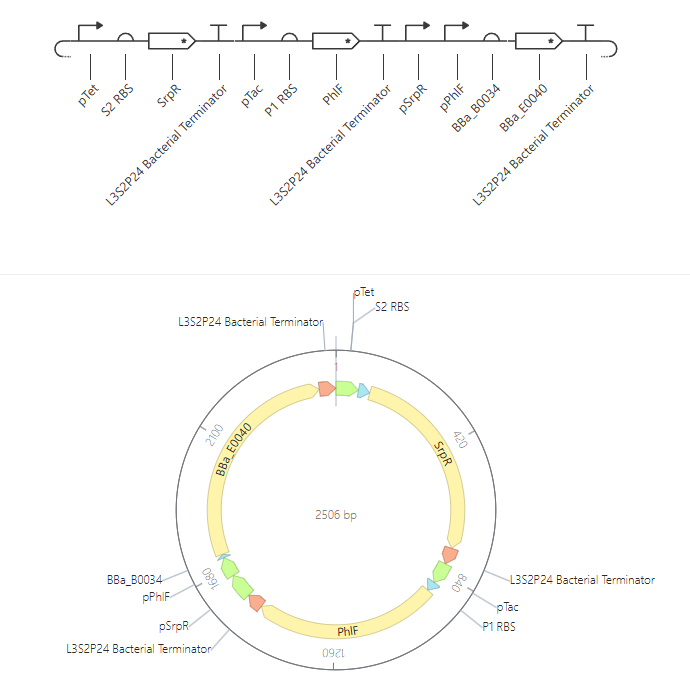 Figure 4. NAND construct from the Bacterial Demos repository in Asimov Kernel. The figure shows both the linear circuit architecture and the circular map of the construct. This view was useful for identifying the arrangement of promoters, ribosome binding sites, coding sequences, and terminators, and for relating circuit logic to the underlying DNA organization.
4.1 Recreate the Repressilator
I simulated the reconstructed repressilator in E. coli for 72 simulated hours using a 10-minute time step and no added ligand. The resulting RNA and protein concentration plots showed an initial transient phase followed by sustained oscillatory behavior over time. This indicates that the reconstructed circuit preserves the expected dynamic logic of the repressilator rather than converging to a single stable state. Both transcript and protein levels fluctuate over time, which is consistent with a cyclic repression network.
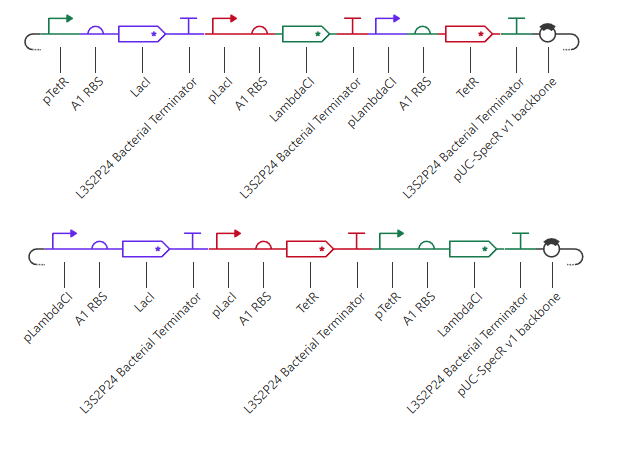 Figure 5. Comparison of repressilator architectures. The upper construct shows the original repressilator architecture, in which the promoter–repressor pairings follow the reference design from the Bacterial Demos repository. The lower construct shows a variant with altered promoter order while keeping the same general set of parts. This comparison was used to test how rewiring promoter arrangement affects the behavior of the oscillator.
4.2 Comparison of repressilator variants
I compared four repressilator configurations: the original reference architecture, a variant with a modified middle RBS, a variant with altered promoter order, and a combined variant containing both changes. In all four cases, the circuit still showed sustained oscillatory behavior in both RNA and protein concentration plots. This indicates that, in Kernel, the repressilator is qualitatively robust to these perturbations.
However, the variants did not behave identically. The main effect of both the RBS change and the promoter reordering was a redistribution of the quantitative balance among the three nodes. In particular, different variants shifted which transcriptional unit became most dominant in the final RNAP and ribosome flux plots. This suggests that these design changes affect the oscillatory regime quantitatively, even when they do not abolish oscillation altogether.
| Construct | Promoter order | Middle RBS | Oscillation observed? | Main observation |
|---|---|---|---|---|
| Reference repressilator | Original | Original | Yes | Baseline oscillatory regime |
| Variant 1 | Original | Altered | Yes | Oscillation preserved, but the middle module becomes more dominant |
| Variant 2 | Altered | Original | Yes | Oscillation preserved, with a shifted quantitative balance across nodes |
| Variant 3 | Altered | Altered | Yes | Oscillation preserved, with combined changes in node dominance and final flux distribution |
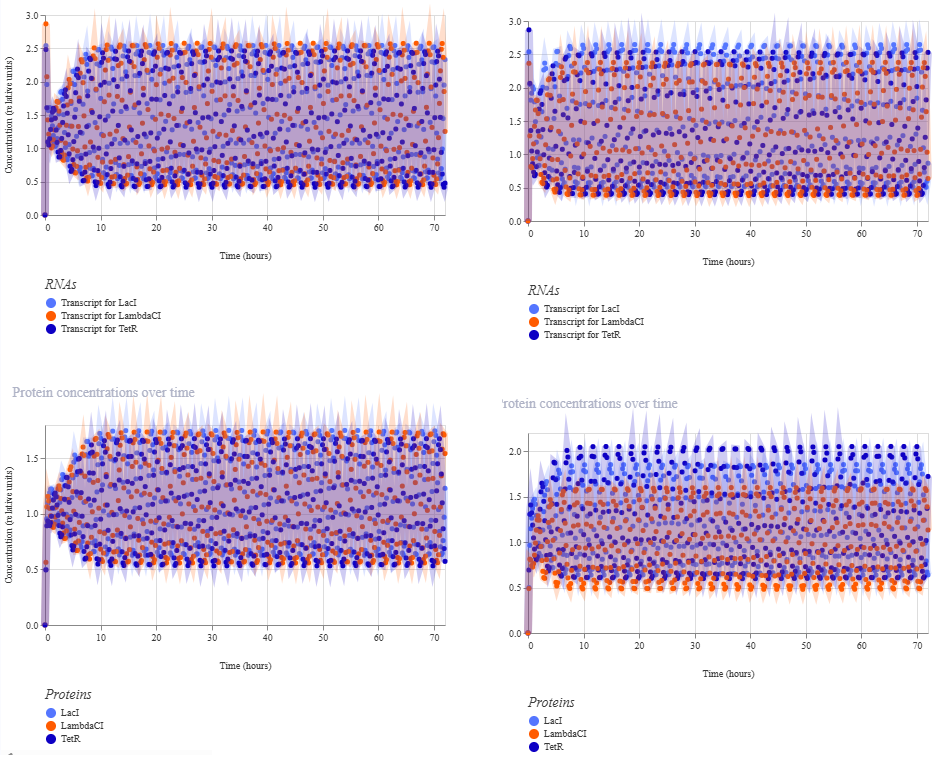 Figure 6. Oscillatory response under two modified repressilator configurations. The left panels show the RNA and protein time-course simulations for combination 1 in the comparison table, corresponding to the repressilator with the first modified condition. The right panels show combination 3, in which both variables were altered simultaneously. In both cases, the circuit retained sustained oscillatory behavior after an initial transient phase. However, the combined perturbation produced a more uneven quantitative distribution across the three nodes, especially at the protein level, indicating that these modifications affect the balance of the oscillatory regime even when oscillation is preserved.
5. Build three of your own Constructs using the parts in the Characterized Bacterial Parts Repo
5.1 First construct: Simplified Transcriptional AND Gate for Dual-Input Detection
The first construct implements a minimal transcriptional AND gate designed by streamlining the regulatory activation cascade. This circuit acts as a high-fidelity dual-input sensor that restricts output expression to conditions where both chemical inducers are simultaneously present in the culture.
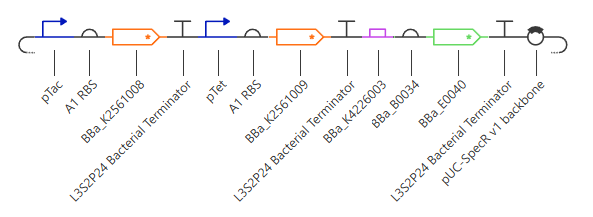 Figure 7. Simplified Transcriptional AND Gate assembled from modular components. The circuit uses the inducible input promoters pTac and pTet to drive the transcription of the regulatory coding sequences hrpR (BBa_K2561008) and hrpS (BBa_K2561009), respectively. In this configuration, the downstream reporter GFP (BBa_E0040) is wired to be driven directly by the pHrpL promoter (BBa_K4226003). As a result, transcriptional read-through and fluorescence emission are strictly dependent on the cooperative action of both inputs.
Piece-by-piece interpretation
| Part | Role in the circuit | Functional meaning |
|---|---|---|
| pTac | Input 1 promoter | Induced by IPTG |
| pTet | Input 2 promoter | Induced by aTc |
| BBa_K2561008 | hrpR | First regulator of the activation layer |
| BBa_K2561009 | hrpS | Second regulator of the activation layer |
| BBa_K4226003 | pHrpL | Promoter activated only when both HrpR and HrpS are present |
| BBa_B0034 | RBS | Enables translation of the reporter |
| BBa_E0040 | GFP | Fluorescent output reporter molecule |
Biological interpretation
The biological logic of this construct functions as a strict coincidence detector. The external inducer IPTG activates pTac to produce HrpR, while aTc activates pTet to synthesize HrpS. Neither regulator can initiate transcription independently. Only when both chemical signals diffuse into the cell do HrpR and HrpS form a functional heteromeric complex capable of binding and driving the pHrpL promoter. Since pHrpL directly controls the output module, GFP is turned ON exclusively in the double-input condition, successfully executing AND logic.
Truth table
| IPTG | aTc | HrpR | HrpS | pHrpL State | GFP Output | Phenotype |
|---|---|---|---|---|---|---|
| 0 | 0 | 0 | 0 | Inactive (Off) | 0 | OFF (No Fluorescence) |
| 1 | 0 | 1 | 0 | Inactive (Off) | 0 | OFF (No Fluorescence) |
| 0 | 1 | 0 | 1 | Inactive (Off) | 0 | OFF (No Fluorescence) |
| 1 | 1 | 1 | 1 | Active (On) | 1 | ON (Green Fluorescence) |
5.2 Second construct: transcriptional NAND gate
The second construct implements a transcriptional NAND gate using two inducible inputs, IPTG and aTc. These inputs activate pTac and pTet, leading to expression of hrpR and hrpS. Only the simultaneous presence of both regulators activates pHrpL, which produces the repressor AmtR. AmtR then represses the GFP output module driven by pAmtR, so fluorescence is lost only in the double-input condition.
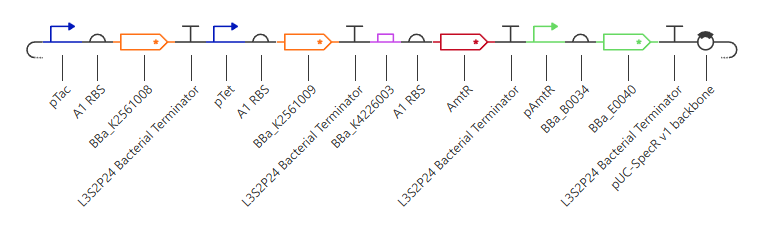 Figure 8. Synthetic NAND gate assembled from characterized bacterial parts. The construct uses pTac and pTet as two inducible input promoters controlling hrpR and hrpS. These two regulators jointly activate pHrpL (BBa_K4226003), which drives expression of the repressor AmtR. AmtR represses the output promoter pAmtR, thereby controlling the GFP reporter (BBa_E0040). As a result, GFP is expressed in all conditions except when both inputs are simultaneously present, consistent with NAND behavior.
The construct uses pTac and pTet as two inducible input promoters controlling hrpR and hrpS. These two regulators jointly activate pHrpL (BBa_K4226003), which drives expression of the repressor AmtR. AmtR represses the output promoter pAmtR, thereby controlling the GFP reporter (BBa_E0040). As a result, GFP is expressed in all conditions except when both inputs are simultaneously present, consistent with NAND behavior.
Piece-by-piece interpretation
| Part | Role in the circuit | Functional meaning |
|---|---|---|
pTac | Input 1 promoter | Induced by IPTG |
pTet | Input 2 promoter | Induced by aTc |
BBa_K2561008 | hrpR | First regulator of the AND layer |
BBa_K2561009 | hrpS | Second regulator of the AND layer |
BBa_K4226003 | pHrpL | Promoter activated only when both HrpR and HrpS are present |
AmtR | Final repressor | Represses the output promoter |
pAmtR | Repressible output promoter | Drives GFP unless repressed by AmtR |
BBa_B0034 | RBS | Enables translation of the reporter |
BBa_E0040 | GFP | Fluorescent output reporter |
Biological interpretation
The circuit detects two external inducers, IPTG and aTc. IPTG induces pTac and aTc induces pTet, producing HrpR and HrpS, respectively. Only when both are present is pHrpL activated, which drives expression of AmtR. AmtR then represses pAmtR, shutting off GFP expression. Therefore, the fluorescent output is turned OFF only when both inputs are present, which implements NAND logic.
Truth table
| IPTG | aTc | pTac | pTet | HrpR | HrpS | pHrpL | AmtR | GFP | Output |
|---|---|---|---|---|---|---|---|---|---|
| 0 | 0 | 0 | 0 | 0 | 0 | 0 | 0 | 1 | 1 |
| 1 | 0 | 1 | 0 | 1 | 0 | 0 | 0 | 1 | 1 |
| 0 | 1 | 0 | 1 | 0 | 1 | 0 | 0 | 1 | 1 |
| 1 | 1 | 1 | 1 | 1 | 1 | 1 | 1 | 0 | 0 |
5.3 Third construct: Oscillator-coupled NAND circuit for cyclic protein expression
This design couples a transcriptional NAND gate to a repressilator oscillator in order to generate cyclic protein expression. The NAND module determines whether output expression is permitted based on two external inputs, while the repressilator imposes a temporal oscillatory pattern on the system. As a result, the output protein is not produced continuously, but instead in periodic pulses and only under the logical conditions defined by the NAND gate.
Biological interpretation
Biologically, this construct can be understood as a programmable pulsatile expression system. The two external inputs first determine whether the cell is allowed to express the target protein, and the oscillator then determines when that expression occurs. This creates rhythmic bursts of protein production rather than constitutive accumulation, which could be useful for periodic secretion, controlled therapeutic delivery, or reducing metabolic burden during prolonged expression.
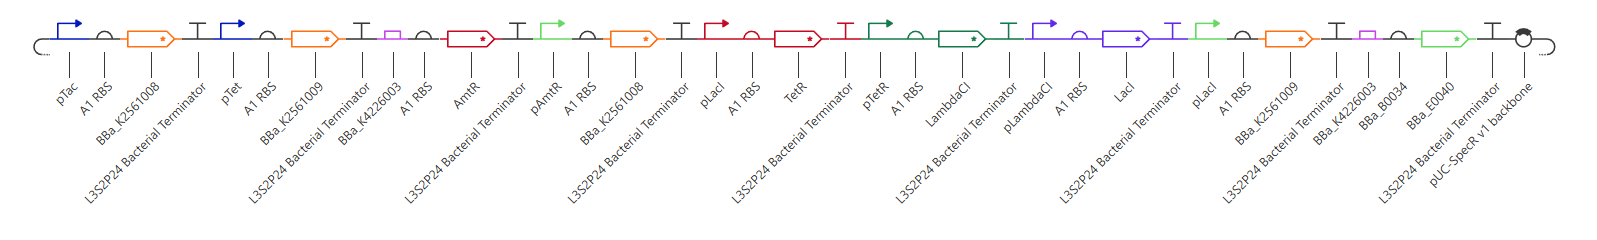 Figure 9. Oscillator-coupled NAND gate for pulsatile protein expression.
The NAND module determines whether output expression is permitted, while the repressilator provides a cyclic temporal signal. Together, these modules generate rhythmic protein expression only when the required logical input conditions are satisfied.
Limitations
This design is conceptually valid, but its experimental implementation may face several limitations. Reuse of repeated regulatory parts could increase the risk of recombination or construct instability. In addition, the large size and multilayered structure of the circuit may impose a significant metabolic burden on the host cell. Coupling the NAND module and the oscillator on the same plasmid could also introduce unintended interactions between components, and promoter leakiness may reduce the sharpness of both the logic response and the pulsatile output.