I’m Francisco, have a MSc in Biological Sciences in CINV, UV (Chile) with wet lab expertise in microbiology and energy metabolism, specifically studying C. elegans behavioral aversion to P. aeruginosa PA14. As an Electronic Engineer of UTFSM (Chile), I complement this by designing open-source hardware and microfluidics to bridge biological research with advanced instrumentation.
Oncological Bacteriotherapy: Iron Sequestration in the TME via Controlled Release of Stealth Siderophores under NAND Logic Gates and Biocontainment Circuits.
Python Script for Opentrons Artwork This artwork was generated using the HTGAA26 Opentrons Colab environment. opentron_code The design was implemented programmatically using geometric constructions and multi-color pipetting logic.
To properly render Devanagari text (e.g., “चित्”) using PIL in Google Colab, system-level fonts must be installed before executing the Opentrons script. The Noto Sans Devanagari font was installed using the following commands in a separate Colab cell:
Part A. Conceptual Questions from Shuguang Zhang 1) How many molecules of amino acids are in 500 g of meat? Assume meat is ~20–25% protein: 500 g meat → ~100–125 g protein.
Using ~100 Da per amino acid (given):
100 g / (100 g/mol) = 1.0 mol amino acids → ~6.0×10²³ molecules 125 g / (100 g/mol) = 1.25 mol amino acids → ~7.5×10²³ molecules Answer: ~10^23
Part A: SOD1 Binder Peptide Design Part 1: Generate Binders with PepMLM Begin by retrieving the human SOD1 sequence from UniProt (P00441) and introducing the A4V mutation. Original sequence
sp|P00441|SODC_HUMAN Superoxide dismutase
MATKAVCVLKGDGPVQGIINFEQKESNGPVKVWGSIKGLTEGLHGFHVHEFGDNTAGCTS
AGPHFNPLSRKHGGPKDEERHVGDLGNVTADKDGVADVSIEDSVISLSGDHCIIGRTLVV
HEKADDLGKGGNEESTKTGNAGSRLACGVIGIAQ
Variant: A4V
MATKVVCVLKGDGPVQGIINFEQKESNGPVKVWGSIKGLTEGLHGFHVHEFGDNTAGCTS
AGPHFNPLSRKHGGPKDEERHVGDLGNVTADKDGVADVSIEDSVISLSGDHCIIGRTLVV
HEKADDLGKGGNEESTKTGNAGSRLACGVIGIAQ
Generate four peptides of length 12 amino acids conditioned on the mutant SOD1 sequence. Using the mutant SOD1 sequence as input, PepMLM Colab generated four 12-residue candidate binders
DNA Assembly Assignment 1. Components of the Phusion High-Fidelity PCR Master Mix The Phusion High-Fidelity PCR Master Mix contains the main components required for accurate DNA amplification. One key component is the Phusion DNA polymerase, which synthesizes new DNA strands with high fidelity. The mix also includes dNTPs, which serve as the nucleotide building blocks for DNA synthesis. In addition, it contains a reaction buffer that maintains the proper pH and salt conditions for enzyme activity, as well as magnesium ions, which are essential cofactors for polymerase function. Together, these components support efficient and accurate PCR amplification.
Assignment Part 1: Intracellular Artificial Neural Networks (IANNs) 1. Advantages of IANNs over traditional Boolean genetic circuits IANNs can generate graded, weighted, and more flexible input/output responses instead of only ON/OFF logic. This makes them better suited for integrating multiple noisy biological signals and for approximating complex decision boundaries.
Homework Part A: General and Lecturer-Specific Questions Advantages: Cell-free systems allow direct control of reaction conditions without maintaining cell viability. They are especially useful for toxic proteins and membrane proteins.
Main components: Cell extract or Tx/Tl machinery, DNA template, amino acids, nucleotides, energy source, salts, and buffer. Together, these support transcription, translation, and reaction stability.
Energy regeneration: ATP and GTP are rapidly consumed during transcription and translation. Continuous supply can be maintained with phosphoenolpyruvate- or maltodextrin-based regeneration systems.
Waters Part I — Molecular Weight 1) what is the calculated molecular weight? Using the amino acid sequence provided in the assignment, I calculated the theoretical molecular weight of the construct with the ExPASy Compute pI/Mw tool.
The calculator (https://web.expasy.org/compute_pi/) returned the following values:
Part B: Cell-Free Protein Synthesis | Cell-Free Reagents Referencing the cell-free protein synthesis reaction composition (the middle box outlined in yellow on the image above, also listed below), provide a 1-2 sentence description of what each component’s role is in the cell-free reaction. 1.1 E. coli Lysate * BL21 (DE3) Star Lysate: Provides the essential molecular machinery, including ribosomes and translation factors, while the T7 RNA Polymerase drives the transcription of DNA into mRNA.
Subsections of Homework
Week 1 HW: Principles and Practices
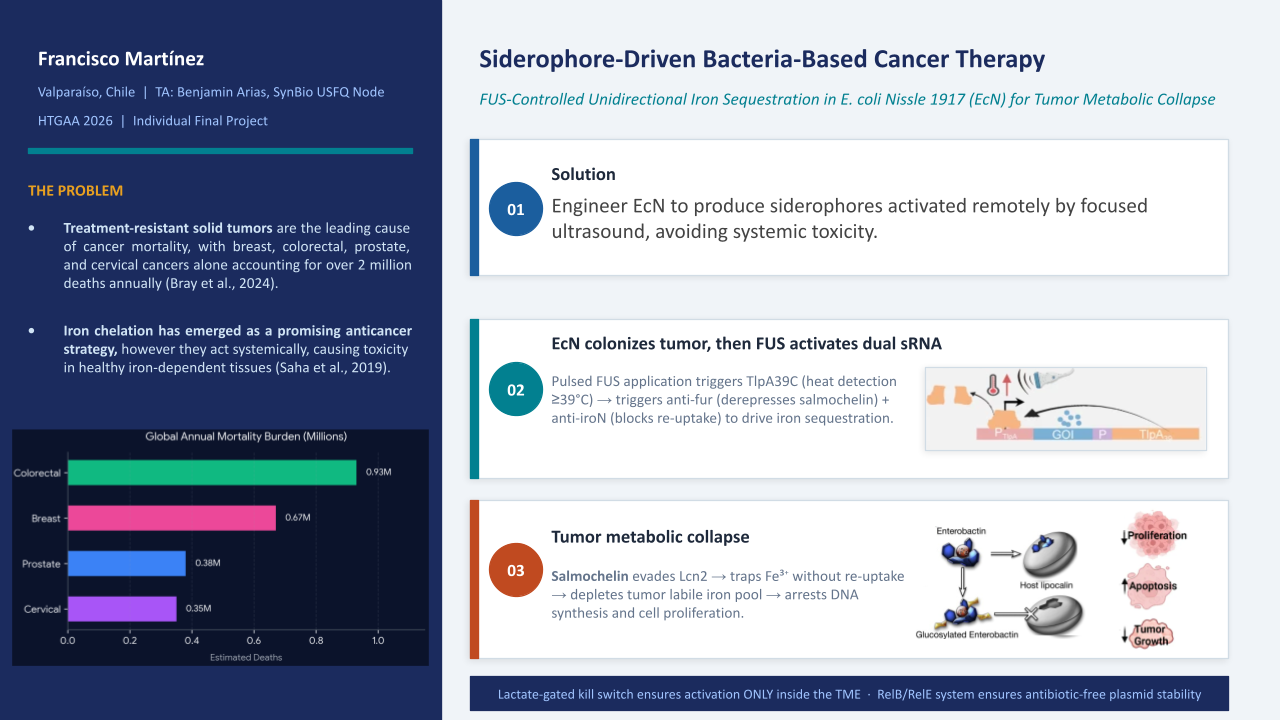
“Oncological Bacteriotherapy: Engineered Siderophore Secretion and Safety Kill-Switch via NAND Logic Gates”
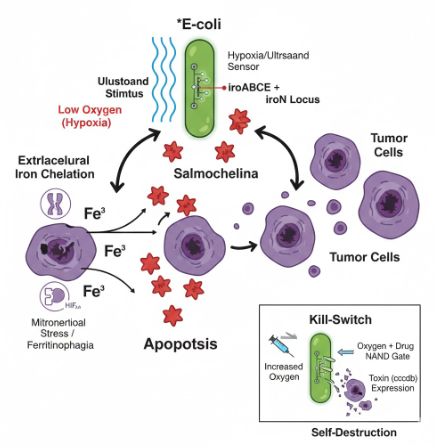
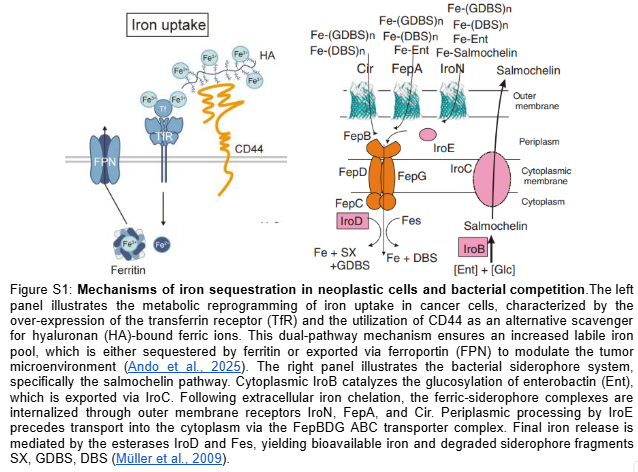
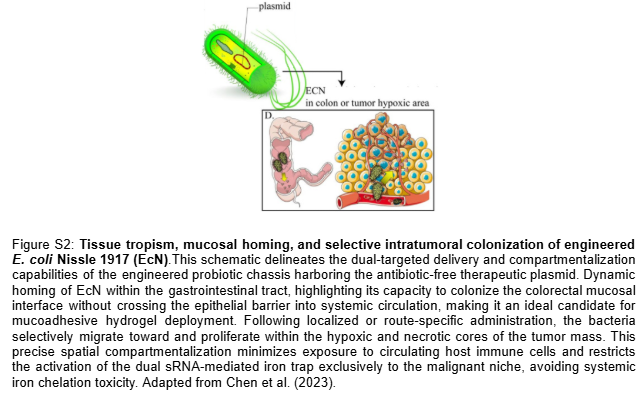
My project focuses on engineering a bacterial strain capable of sensing the tumor microenvironment and responding through the synthesis of siderophores (Salmochelin), integrated with a robust safety mechanism to prevent off-target effects.
1. General Objective
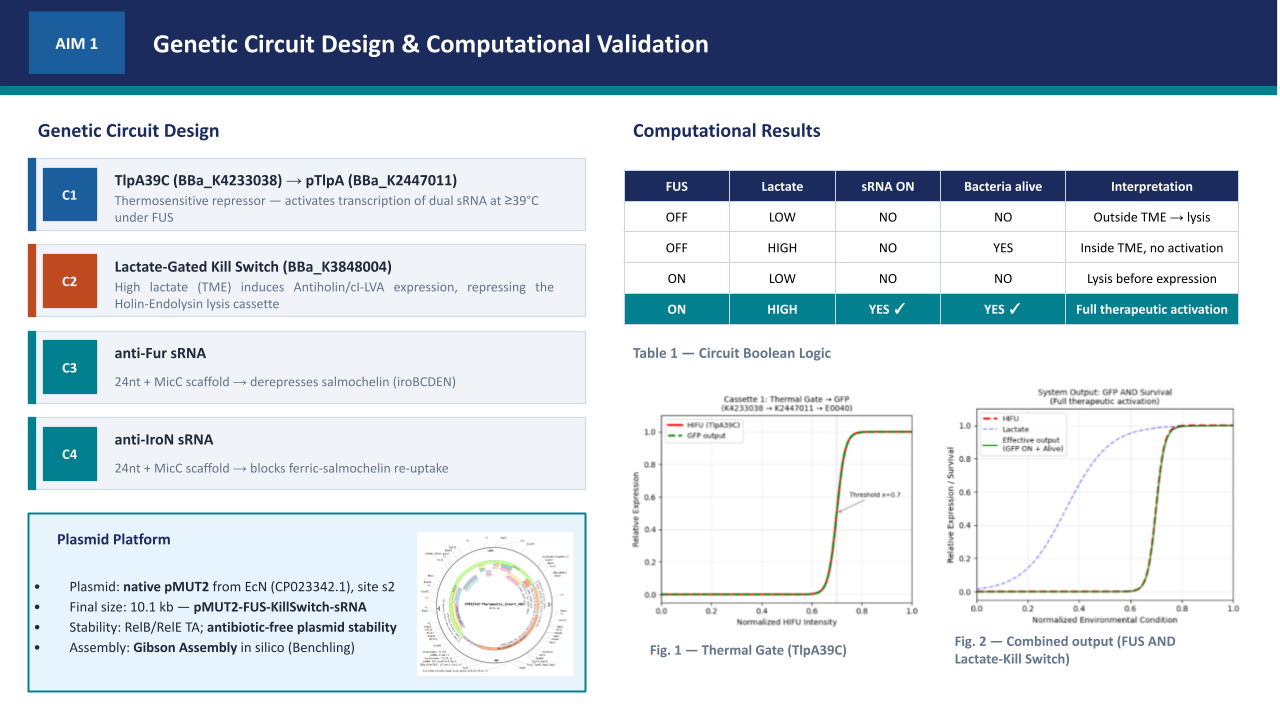
To induce the death of tumor cells through iron sequestration (Salmochelin), integrating spatial control logic circuits (NAND gate) so that the bacteria act exclusively under hypoxia and ultrasound conditions, and a biocontainment system (Kill-Switch) to guarantee host safety.
2. Experimental Design
2.1.- The effector agent: E. coli Nissle 1917 (Locus iroBCDE, iroN)
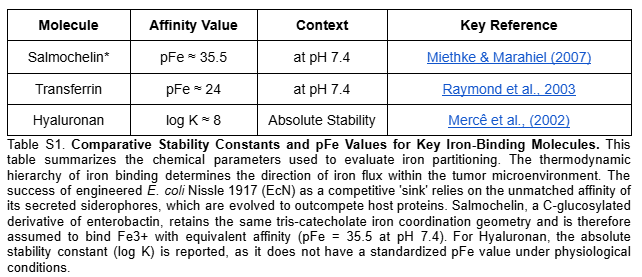
Siderophore Selection: Release Salmochelin (glycosylated) instead of the siderophore Enterobactin (ENT), which is known to be neutralized by host Lipocalin-2 (Lcn2) (Saha et al. 2019). The use of Pyoverdine is discarded after technical analysis, as its complex biosynthetic pathway represents excessive metabolic stress for the bacteria.
Competitive Advantage: Based on the findings of Raffatellu et al. 2010, salmochelin is a siderophore that can survive in an environment with high levels of Lcn2.
Cytotoxic Effect (hypothetical): By depleting the labile iron pool (LIP), ferritinophagy and HIF-1α are promoted, but given the high affinity of the siderophore, mitochondrial function collapses, triggering apoptosis of cancer cells.
2.2.- Spatial Control Circuit (NAND Gate)
To avoid systemic toxicity (Pita-Grisanti et al., 2022), Salmochelin production is subject to a double de-repression. In the normal state, two repressors (LacI and TetR) block the operon. Synthesis occurs when the following conditions are met:
Condition A (Hypoxia): The P_vgb promoter turns off → The bacteria stop producing LacI-LVA → The LacI lock degrades.
Condition B (Ultrasound): The stimulus inactivates the P_tlpA repression system → The bacteria no longer have functional TetR-LVA → The TetR lock degrades.
Result: The Salmochelin genes (iroBCDE, iroN) must be under a promoter with binding sites for LacI and TetR. Only when there is NO LacI (Hypoxia) AND NO TetR (Ultrasound) can the polymerase pass and produce Salmochelin and its receptor. Basal expression (leakiness) in healthy tissues is eliminated, protecting the patient’s iron homeostasis. The bacteria only release siderophores inside the tumor and when the physician decides.
2.3.- Biocontainment System (Biosafety Kill-Switch)
Implementation of a cascade activation mechanism. This design minimizes metabolic stress by not producing the drug sensor while the bacteria are colonizing the tumor.
Oxygen Sensor (Normoxia): P_cyo promoter → araC gene. In the tumor (Hypoxia), the P_cyo promoter is turned off, so the AraC protein is not produced. In healthy tissue or the bloodstream (Normoxia), the P_cyo promoter is activated and synthesizes the AraC protein, which acts as the “key” for the drug.
Drug Sensor: P_bad promoter → ccdB gene (Toxin). The P_bad promoter has an AND activation logic: it is only activated if the AraC protein is present (only in normoxia) AND Arabinose (the drug) is administered.
Result: As long as the bacteria remain in the hypoxic TME, they are immune to the drug, as they lack the AraC protein. If the bacteria escape to oxygenated tissues or if the tumor is significantly reduced, the presence of oxygen allows the synthesis of AraC, making the bacteria sensitive to the drug for their total elimination.
2.4.- Note
Lipocalin-2 (Lcn2) can deplete intracellular iron in macrophages, generating an inflammatory response and promoting an attack on bacteria (Manfred Nairz et al., 2016); however, in cancer, Tumor-Associated Macrophages (TAMs) have an altered transcriptional program, where they are instead immunosuppressed. When the tumor size is significantly reduced, it is likely that macrophages will reprogram toward an M1 phenotype, assisting in the elimination of the bacteria alongside the kill-switch.
3. Governance and Policy Goals
To ensure that this bacteriotherapy contributes to an ethical and safe future, I have defined the following goals:
Goal 1: Ensure Safety & Eficcacy
Sub-goal 1a: Implement multi-layered biocontainment (NAND gate + Kill-switch) to prevent systemic iron depletion in the host.
Sub-goal 1b: Prevent bacterial environmental persistence through strictly controlled clinical waste protocols (analogous to radioguided surgery) to ensure no bacterial escape into public sewage.
Sub-goal 2a: Develop the platform using probiotic E. coli Nissle 1917 to keep production costs low and accessible for developing regions.
4. Governance Actions Matrix
To manage the specific risks of genetic drift and metabolic stress associated with the AraC/CcdB cascade design (Kill-Switch only), I propose the following interconnected actions:
Aspect
Action 1: Technical (Biocontainment)
Action 2: Academic (Transparency)
Action 3: Regulatory (Standards)
Purpose
Implementation of a genetic circuit that prevents activation of the kill-switch when the synthetic bacteria is administered and at the same time minimizes metabolic stress in a hypoxic environment (TEM).
Establishment of a shared database focusing on the leakiness and metabolic burden of hypoxia-responsive sensors like P_cyo.
Development of standardized certification to ensure clinical reliability.
Design
Implementation of a cascade activation mechanism, where P_cyo promoter acts as a gatekeeper for AraC synthesis. P_bad then requires both AraC AND Arabinose to express the CcdB toxin.
Peer-reviewed publication of the “Stress-Safety Curve” of the AraC/CcdB cascade to define at what point mutation frequency increases.
Technical standards (e.g., ISO/TC 276) that define the Mean Time To Failure (MTTF) of the cascade before plasmid loss.
Assumptions
Assumes the AraC and ccdB genes remains functional. Risk of plasmid loss is acknowledged. Assumes the P_cyo promoter remains tightly repressed in hypoxia to prevent metabolic burden.
Assumes that labs will transparently share data when the P_cyo sensor leaks and kills the bacteria prematurely.
Assumes regulatory bodies (like ISP/FDA) have the expertise to audit compliance with established rules.
Risks
Genetic Drift: Loss-of-function mutations in araC or ccdB it generates bacteria that are immune to the drug. The overexpression of araC due to promoter mutations it generates Arabinose-sensitive bacteria even within the tumor.
Dual-Use: Detailed performance maps of the P_cyo sensor could be exploited to design oxygen-evading pathogens.
Innovation Lag: Excessive bureaucracy in certifying may delay new targeted gene therapies.
Note on Scope: While my policy goals include the NAND gate for spatial control, the following Governance Matrix focuses specifically on the Kill-switch (AraC/CcdB cascade). I have prioritized this component because it represents the highest risk for environmental escape and is the “weakest link” in terms of biocontainment due to potential genetic drift.
5. Scoring and Prioritization
I have scored my proposed governance actions against my specific Policy Goals (1=Best, 3=Worst):
Policy Goal
Action 1: Technical (Cascade Stability)
Action 2: Academic (Transparency)
Action 3: Regulatory (Waste & Standards)
Goal 1: Safety (Non-malfeasance)
2
2
2
Goal 2: Equity (Low-cost Access)
2
1
3
Feasibility (Implementation)
1
2
2
Technical Note: In this assessment, Action 1 is scored based on the current plasmid-based design. However, to minimize the probability of genetic drift, I propose that the final implementation should transition to genomic integration of the AraC/CcdB cascade. This would ensure that the safety circuits are permanently embedded in the bacterial DNA, significantly reducing the risk of mutants compared to episomal (plasmid) expression.
6. Final Recommendation and Prioritization
Based on the scoring, I prioritize a combination of Action 1 (Technical) and Action 3 (Regulatory).
Priority and Audience: My recommendation is directed to the authorities responsible for verifying the safety and efficacy of new gene therapies. The technical design alone is insufficient without a clear regulatory framework.
Trade-offs: I have chosen to prioritize these over Action 2 (Academic Transparency) to mitigate the Dual-Use risk. While sharing detailed performance data of the P_cyo and P_bad sensors would promote global equity, the risk of this information being exploited to design pathogens that evade oxygen-based immune barriers is a trade-off I consider necessary for public safety.
Assumptions and Uncertainties: One assumption and uncertainty regarding what is being proposed is that the safety and efficacy criteria defined by the respective authorities could have undetected safety biases due to a lack of evidence.
7. Ethical Reflection
The most significant ethical concern that arose for me is the Dual-Use Dilemma in the context of biocontainment. I realized that the very mechanisms I am designing to ensure a therapy is safe (like high-precision oxygen sensors) are the same tools that could be used to engineer biological threats that are harder to detect or neutralize.
8. References
Saha P., et al. (2019). “Enterobactin, an iron chelating bacterial siderophore, arrests cancer cell proliferation” Biochemical Pharmacology.
Raffatellu M., et al. (2010). “Lipocalin-2 resistance of Salmonella enterica serotype Typhimurium confers an advantage during life in the inflamed intestine” Cell Host & Microbe.
Pita-Grisanti V., et al. (2022). “Understanding the Potential and Risk of Bacterial Siderophores in Cancer” Frontiers in Oncology.
Nairz M., et al. (2015). “Lipocalin-2 ensures host defense against Salmonella Typhimurium by controlling macrophage iron homeostasis and immune response” Journal of Immunology.
9. AI Prompts
In compliance with HTGAA 2026 guidelines, I certify that this homework was developed with the assistance of Gemini (Google AI).
Image Generation: “Used Nano Banana to generate image “Abstract_Draw.png” from the detailed description of my project.”
Assessment: “Create a table in markdown format that allows me to compare the design of my logic circuit with a standard design.”
Troubleshooting: “Technical troubleshooting for personal profile configuration in the repository and helps to transfer the project in markdown format”
Week 2 HW: DNA-read-write-and-edit
1. Benchling & In-silico Gel Art
1.1 Extraction of Restriction Site Data
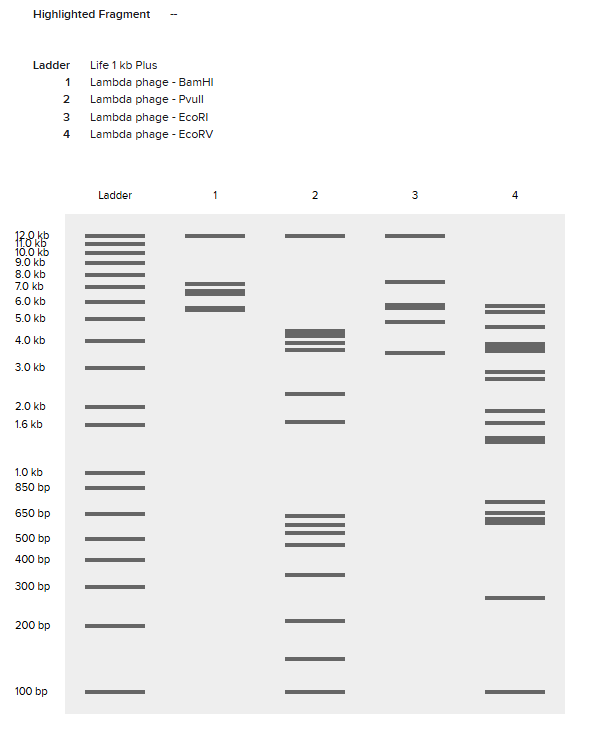
Restriction site positions for 10 enzymes were extracted from Benchling for the λ phage genome. Based on these cut positions, fragment sizes were calculated for each individual enzyme digestion.
All possible enzyme combinations were generated from the 10 enzymes (2¹⁰ − 1 = 1023 combinations).
For each combination:
Fragment sizes were computed.
A discrete size axis was built from all unique fragment lengths.
A binary matrix (combination × fragment sizes) was constructed, indicating presence/absence of each fragment.
This forms the complete “puzzle space” of available molecular weight distributions.
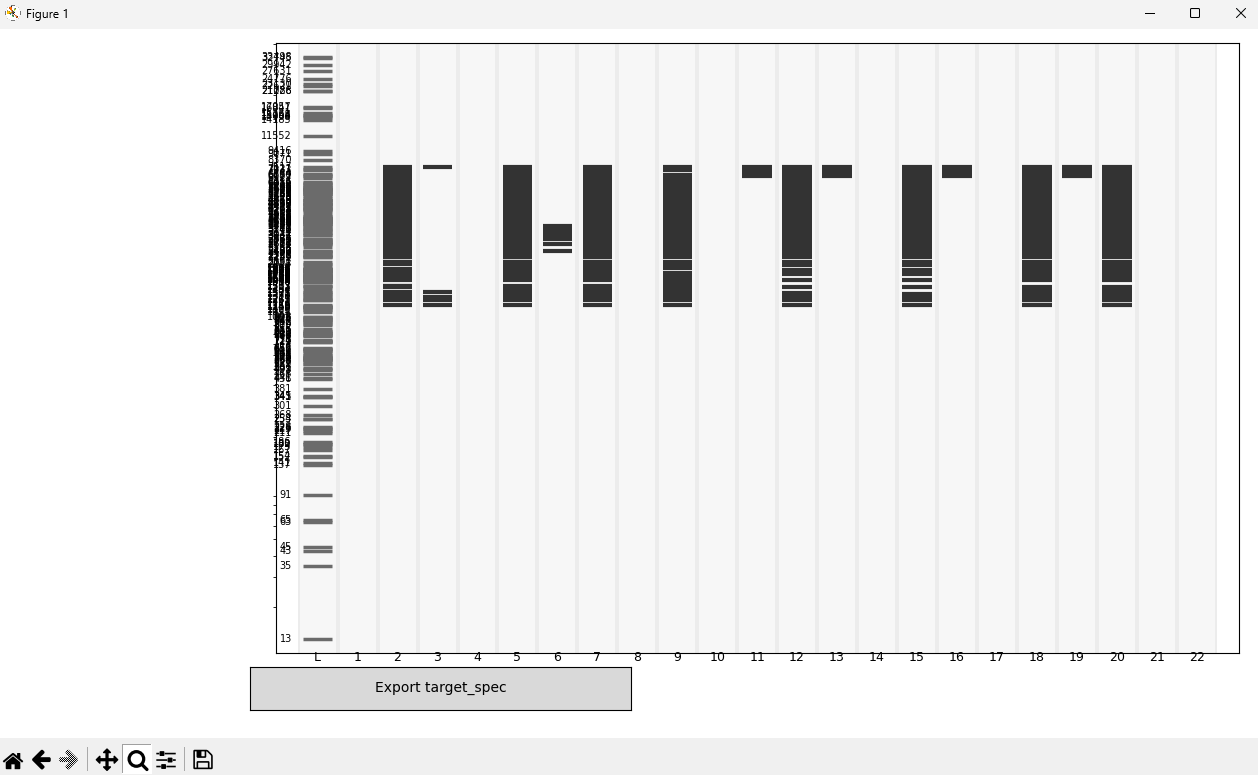
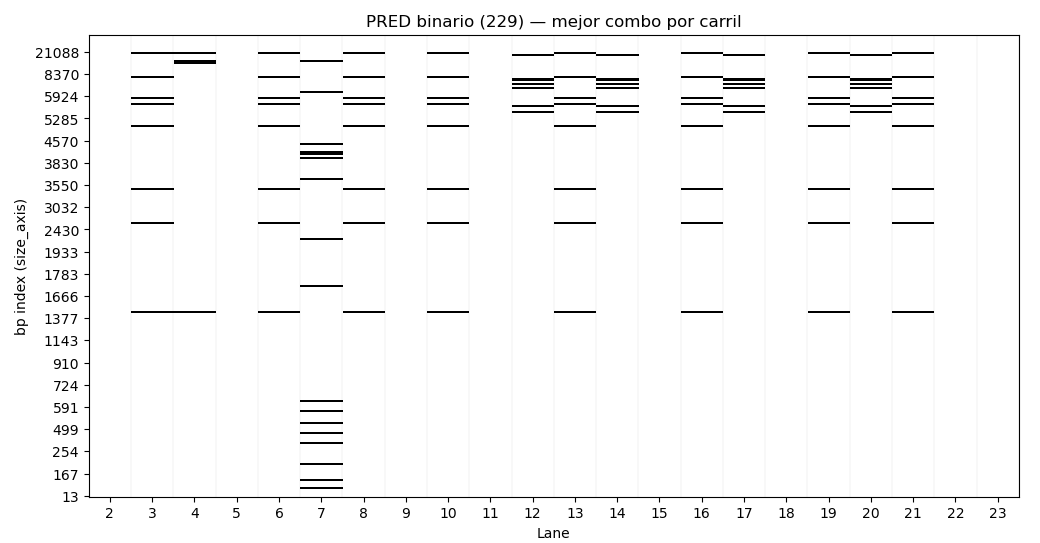
1.3. Definition of the Target Pattern
A desired visual pattern was manually designed using an interactive executable that allows activation/deactivation of bands on the real fragment size axis.
The output is a binary target matrix (lanes × fragment sizes).
(Image 2: manually designed target pattern)
The notebook used to manually design the target band pattern can be accessed here:
This demonstrates that complex visual structures can be reconstructed using only physically valid restriction enzyme digestion combinations drawn from the complete 1023-piece combinatorial space.
3. DNA Design Challenge
3.1. Gene Selection: E. coli IroB
For my final project, I am designing a therapeutic bacterium for solid tumor treatment using E. coli Nissle 1917 as the chassis. My goal is to synthesize the iroBCDEN operon, which is responsible for Salmochelin production, allowing the bacteria to scavenge iron more efficiently in the tumor microenvironment.
For this sequence design exercise, I am focusing on the key enzyme: IroB (C-glycosyltransferase). To ensure optimal gene expression, proper protein folding, and to minimize metabolic burden, I selected the native IroB sequence from Escherichia coli (Accession: WP_016242764.1). Utilizing a sequence native to the chassis species is a biologically superior approach compared to importing foreign variants.
3.2. Protein Sequence Input
By starting directly with the pure amino acid sequence, I utilized a Reverse Translation approach to build a pristine DNA sequence tailored for my chassis.
Using the Twist Bioscience Expression Optimization tool, I reverse-translated the E. coli protein sequence into an optimized DNA sequence. (https://www.idtdna.com/CodonOpt)
Optimization Parameters & Constraints:
Chassis:Escherichia coli.
Genetic Logic Compatibility: I explicitly removed internal restriction sites (GGTCTC for BsaI and GAAGAC for BbsI). This is a critical engineering step to ensure the synthesized gene is fully compatible with the Golden Gate Assembly method, which is required for assembling my NAND logic gate circuit.
To produce the IroB protein from the newly designed and optimized DNA sequence, two main technological approaches can be employed: cell-dependent (in vivo) and cell-free (in vitro) systems.
1. Cell-Dependent Method (In vivo expression)
This is the traditional recombinant protein production method. The optimized iroB DNA sequence would be cloned into an expression plasmid containing a strong promoter and a Ribosome Binding Site (RBS). This plasmid is then transformed into a bacterial host, such as Escherichia coli BL21(DE3) for massive lab-scale production, or directly into our therapeutic chassis, E. coli Nissle 1917. The living bacteria will act as bio-factories, using their native cellular machinery to express the protein during their growth phase.
2. Cell-Free Protein Synthesis (CFPS) (In vitro expression)
Alternatively, a cell-free system (such as the PURE system or an E. coli cell extract) can be used. This technology strips away the living cell and uses only the essential biological machinery (RNA polymerases, ribosomes, tRNAs, amino acids, and energy molecules) mixed in a tube. By adding our linear or plasmid DNA directly into this mixture, the IroB protein can be synthesized in a few hours. This method is highly advantageous for rapid prototyping and testing of genetic circuits, as it bypasses the need for cell transformation and culturing.
DNA sequence to Protein
Transcription: Under the control of a hypoxia-sensitive promoter (part of my NAND gate logic), the bacterial RNA Polymerase enzyme recognizes and binds to the specific promoter sequence located just upstream of our iroB gene. The enzyme unwinds the double-stranded DNA and uses the template strand to synthesize a single-stranded messenger RNA (mRNA). It reads through our optimized sequence, creating an exact RNA copy, and stops when it reaches a terminator sequence.
Translation: Once the mRNA is transcribed, the bacterial ribosome recognizes and binds to the Ribosome Binding Site (RBS) on the mRNA. The ribosome scans the mRNA until it finds the start codon (ATG). Because we performed codon optimization via reverse translation, the sequence is perfectly calibrated for E. coli. Transfer RNAs (tRNAs) carrying specific amino acids will efficiently recognize the optimized mRNA codons (three-letter nucleotide sequences) without stalling. The ribosome links these amino acids together through peptide bonds, moving along the mRNA until it reaches the stop codon (TAA, TAG, or TGA). At this point, the newly synthesized IroB C-glycosyltransferase protein folds into its 3D structure and is released to perform its catalytic function.
Function: Once folded, IroB will begin glycosylating enterobactin within the cytoplasm to produce the therapeutic Salmochelin.
3.5 How does it work in nature/biological systems?
Historically, the rule in biology was “one gene, one protein.” However, we now know that a single gene can produce multiple different protein variants (isoforms) through mechanisms that alter the mRNA transcript before it is translated. At the transcriptional (and early post-transcriptional) level, there are two primary mechanisms for this:
1. Alternative Splicing
In eukaryotic cells, genes are composed of coding regions (exons) and non-coding regions (introns). When RNA polymerase transcribes the gene, it creates a precursor mRNA (pre-mRNA) that contains both.
During a process called alternative splicing, a cellular complex called the spliceosome removes the introns and joins the exons together. However, the spliceosome can choose to include or skip certain exons. Depending on which combination of exons is spliced together to form the mature mRNA, the ribosome will translate completely different protein isoforms, each potentially having different structural domains or functions, all originating from the exact same DNA sequence.
2. Alternative Promoters (Alternative Transcription Start Sites)
A single gene can possess multiple promoters (the DNA sequence where RNA polymerase binds to initiate transcription). Depending on which promoter the cell activates—often influenced by environmental signals or tissue type—transcription will start at different points along the gene.
If transcription starts at a downstream promoter, the resulting mRNA will be shorter and will lack the initial genetic instructions. When translated, this produces a truncated version of the protein, often missing specific signaling sequences or regulatory domains present in the full-length version.
4. Plasmid Construction and In Silico Validation (Phase I: iroB)
This section documents the construction of the initial expression vector in Benchling, starting from the optimized iroB gene and culminating in a verified plasmid assembly ready for future expansion.
4.1. Genetic Cassette Design and Optimization
The expression cassette was built systematically in Benchling, starting with the codon-optimized sequence for the iroB gene. To ensure functionality, modularity, and future purifiability, specific genetic parts were integrated:
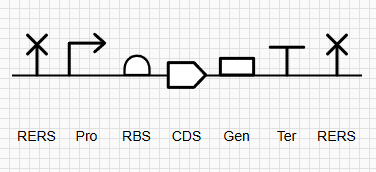
Components: The cassette includes a Promoter (Pro), Ribosome Binding Site (RBS), the iroB CDS, and a strong transcriptional Terminator (Ter).
C-Terminal tag: A 7xHis-tag was added immediately upstream of the STOP codon to allow for future protein purification via affinity chromatography.
Modular Restriction Sites: To create a standardized “BioBrick-like” part, the entire cassette was flanked with unique restriction enzyme sites: NotI (GCGGCCGC) at the 5’ end and XbaI (TCTAGA) at the 3’ end.
Figure 1: SBOL Diagram of the iroB Expression Cassette. The symbols denote (from left to right): NotI RERS, Promoter, RBS, iroB CDS, 7xHis-Tag, Terminator, and XbaI RERS.
Technical Note: The XbaI site was placed immediately following the terminator to encompass the entire modular cassette. It is important to note that since the selected terminator sequence ends in ‘TA’ (and not ‘GA’), the formation of a Dam methylation site (GATCTAGA) is avoided. This serendipitous sequence alignment ensures that the enzyme will not be blocked by methylation, allowing for efficient cleavage during laboratory procedures.
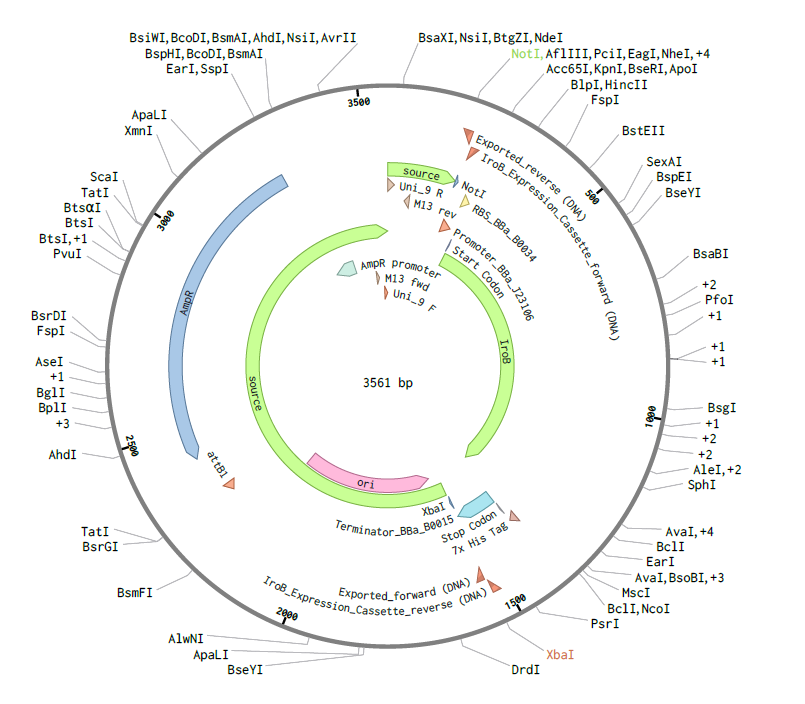
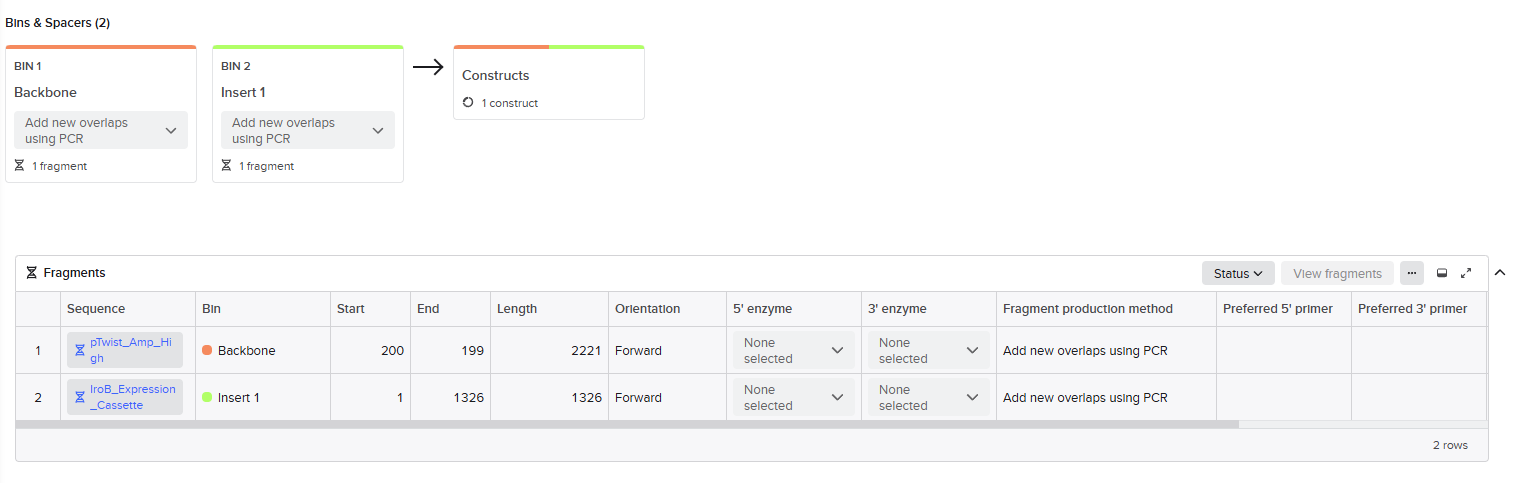
Backbone Preparation: The pTwist map was imported, identifying the Multiple Cloning Site (MCS:region between coordinates ~73 and ~245) as the optimal insertion point. Specifically, coordinate 200 was selected to ensure that critical elements like the origin of replication (ori) and the ampicillin resistance gene (AmpR) remained undisturbed.
Insert Preparation: The 1326 bpiroB modular cassette was defined using the flanking NotI (5’ end) and XbaI (3’ end) recognition sites. This allows any researcher to infer the intended Forward direction of the gene by identifying the positions of these specific landmarks on the plasmid map. Modularity is also ensured, allowing the entire expression cassette to be excised and transferred to different vectors in future iterations of the project.
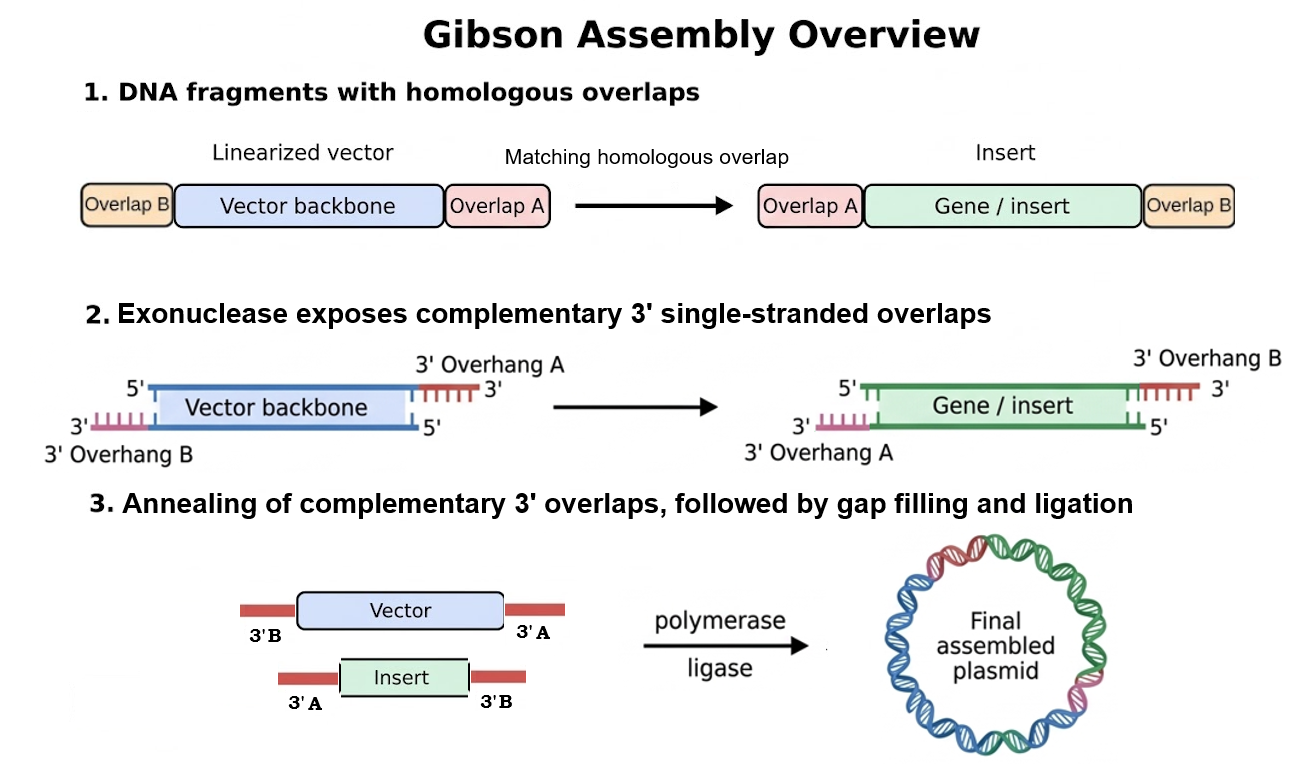
Assembly Simulation: Using Benchling’s molecular biology tools, a Gibson Assembly was simulated to insert the designed iroB modular cassette into the pTwist MCS, resulting in a final circular plasmid of exactly 3561 bp.
Figure 2: Circular map of the assembled pTwist-iroB-cassette plasmid (3561 bp).
4.3. Results and Validation: Virtual Digest
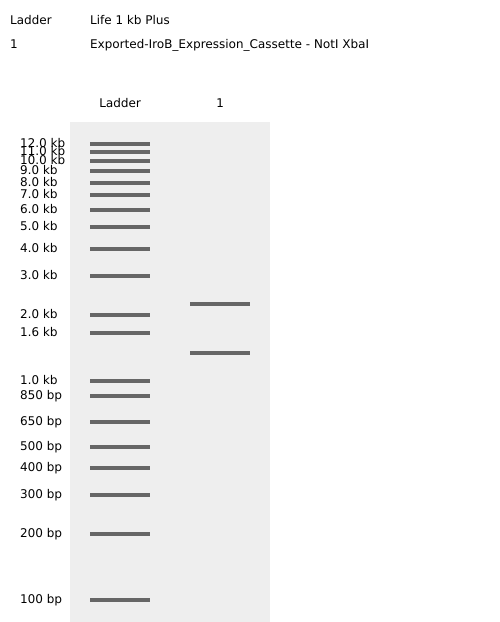
To validate the structural integrity of the design, a Virtual Enzymatic Digest was performed using NotI and XbaI. The simulation results account for the redistribution of nucleotides at the restriction sites following the cleavage:
Fragment 1 (Vector Backbone - pTwist):2228 bp. This represents the original 2221 bp pTwist sequence plus 7 bp derived from the flanking restriction site architecture.
Fragment 2 (iroB Expression Cassette):1333 bp. This comprises the 1326 bp optimized cassette plus 7 bp from the remaining restriction site sequences.
The sum of these fragments confirms a total plasmid length of 3561 bp.
Figure 3: Virtual agarose gel electrophoresis (1% agarose). Lane 1: DNA Ladder. Lane 2: pTwist-iroB digested with NotI/XbaI, yielding two distinct and sharp bands at 2228 bp and 1333 bp. This result confirms successful in silico assembly and validates that the iroB optimized sequence is free of internal restriction sites for the selected enzymes.
4.4. Future Work: Iterative Design
This validated plasmid serves as the foundational “chassis” for the project. The next engineering phases involve:
Promoter Re-engineering: Replacing the current constitutive promoter with a Boolean Logic (e.g., NAND gate) promoter designed to respond to hypoxia and ultrasound-linked stimuli.
Operon Completion: Sequentially assembling the remaining genes (iroC, iroD, iroE, and iroN) into the cassette to generate a single polycistronic iroBCDEN operon.
Clinical-Grade Vector Redesign: The current backbone includes an antibiotic-resistance marker, which is not ideal for therapeutic applications due to biosafety and regulatory concerns. Future versions of the construct should transition to a non-antibiotic plasmid maintenance system appropriate for clinical use.
Biocontainment Strategy (Kill Switch Evaluation): A toxin–antitoxin-based containment module is a candidate approach. In such systems, continuous expression of an antitoxin neutralizes a stable toxin; loss or inhibition of the antitoxin can result in growth arrest or cell death. The stability, leakiness, and escape frequency of this strategy must be experimentally evaluated.
Expression Burden Mitigation: Full expression of the iroBCDEN complex may impose significant metabolic and translational burden. Strategies such as orthogonal translation systems (e.g., orthogonal ribosomes) or alternative burden-mitigation approaches should be assessed to improve stability and performance.
5. Theoretical Questions: DNA Read, Write, & Edit
5.1 DNA Read
(i) What DNA would you want to sequence (e.g., read) and why?
Target: I would sequence the genome of the Panther Chameleon (Furcifer pardalis) and the Common Octopus (Octopus vulgaris), focusing on the gene families of reflectins and the regulatory proteins of iridophores/chromatophores.
Why: Current biological reporters, such as Fluorescent Proteins (FPs), have a fundamental limitation: high stability leads to poor temporal resolution. Once an FP is expressed or activated, it remains fluorescent for hours, “smearing” the signal and masking real-time dynamics. This makes it impossible to observe rapid “on/off” pulses in neural circuits (like serotonergic vs. octopaminergic crosstalk) or the precise timing of a synthetic logic gate.
By sequencing these organisms, I aim to discover the genetic basis of reversible structural color. Unlike fluorescence, which requires high-energy lasers that cause phototoxicity and photobleaching, reflectins change their optical properties through rapid conformational shifts. In the context of my cancer-targeting project, these proteins could serve as “dynamic reporters” for my NAND logic gate. They would allow me to observe, in vitro, the exact moment the bacteria detect ultrasound or hypoxia and—crucially—see the signal vanish the instant the stimulus stops. This would provide a level of kinetic resolution and biophysical feedback that is currently unattainable with standard fluorescence, enabling the study of fast enzymatic transitions and synaptic-like communications without “staining” the entire experimental field.
(ii) In lecture, a variety of sequencing technologies were mentioned. What technology or technologies would you use to perform sequencing on your DNA and why?
Selected Technology: PacBio HiFi Sequencing combined with Iso-Seq.
Rationale: Since the goal is to find functional proteins with specific structural kinetics, I need to resolve not just the genome, but the full-length isoforms of the proteins being expressed in the skin cells. PacBio HiFi provides the extreme accuracy (99.9%) and long reads necessary to assemble these complex, repetitive protein domains without the errors of short-read platforms.
Detailed Technical Questions:
Is your method first-, second- or third-generation or other? How so?
It is a third-generation technology (Single Molecule, Real-Time). It sequences individual DNA molecules as they are synthesized by a polymerase in a Zero-Mode Waveguide (ZMW), allowing for real-time observation of base incorporation.
What is your input? How do you prepare your input (e.g. fragmentation, adapter ligation, PCR)? List the essential steps.
Input: High Molecular Weight (HMW) genomic DNA and full-length mRNA (for Iso-Seq) from dermal tissue.
Preparation steps: 1. Extraction: Specialized lysis to maintain long-strand integrity. 2. SMRTbell Library Prep: Ligation of hairpin adapters to create circular DNA templates. 3. Size Selection: Ensuring only long fragments (>10kb) are loaded to maximize information per read.
What are the essential steps of your chosen sequencing technology, how does it decode the bases of your DNA sample (base calling)?
Process: A polymerase at the bottom of a ZMW incorporates fluorescently labeled nucleotides. As each base is added, it emits a light pulse.
Base Calling: The system records the color and duration of these pulses. Because the template is circular, the polymerase reads it multiple times (Circular Consensus Sequencing), which allows the software to “correct” any random errors and produce a HiFi read of extremely high quality.
What is your output of your chosen sequencing technology?
The output is a BAM file containing highly accurate, long-read sequences, ready for de novo assembly of the structural color gene clusters.
5.2 DNA Write
(i) What DNA would you want to synthesize (e.g., write) and why?
Target: I want to synthesize a modular genetic circuit containing a NAND logic gate that integrates two environmental sensores (ultrasound-responsive promoters and hypoxia-inducible factors) to drive the expression of the iroB cluster for salmochelin production, including a safety kill-switch.
Why: This construct is the core of my final project: a targeted cancer therapy. The goal is to engineer bacteria that only produce potent iron-sequestering siderophores (salmochelins) within the tumor microenvironment (hypoxia) and under external activation (ultrasound). This ensures the therapy is localized, minimizing systemic toxicity. Synthesizing this specific construct via Twist would allow me to perform the first in vitro validations of the logic gate’s precision.
Sequence: I don’t have the complete cassette sequence yet; I need to redesign the promoter, add the Kill-Switch and add the iroBCDEN complex. Preliminary sequence: TTTACGGCTAGCTCAGTCCTAGGTATAGTGCTAGCCATTAAAGAGGAGAAAGGTACCATGATGAGAATTTTATTTGTTGGACCGCCGCTCTACGGCCTGCTGTATCCGGTGCTGAGCCTGGCGCAGGCGTTCCGCGTCAACGGCCACGAGGTGCTGATTGCCTCCGGCGGGCAGTTTGCGCAGAAAGCGGCGGAAGCCGGTCTGGTGGTGTTTGATGCCGCGCCGGGCCTGGACTCTGAAGCGGGTTACCGCCATCACGAAGCGCAGCGCAAAAAAAGCAACATTGGCACCCAGATGGGTAACTTCAGCTTCTTCTCTGAAGAAATGGCCGATCACCTGGTTGAGTTTGCCGGTCACTGGCGTCCGGACCTGATTATCTATCCGCCGCTGGGTGTGATTGGTCCGCTGATTGCGGCAAAATATGACATCCCGGTGGTTATGCAGACCGTCGGCTTTGGTCACACGCCGTGGCACATCAAAGGCGTGACCCGCAGCCTGACCGATGCCTATCGCCGTCACAACGTTGGCACCACACCGCGTGATATGGCGTGGATCGACGTCACACCGCCAAGCATGAGCATCCTGGAAAACGACGGTGAGCCGATCATTCCGATGCAGTATGTGCCGTACAACGGTGGTGCGGTGTGGGAGCCGTGGTGGGAGCGTCGTCCGGAGCGCAAGCGCCTGCTGGTGAGCCTGGGTACGGTGAAACCGATGGTGGACGGTCTGGATCTGATTGCCTGGGTGATGGACAGCGCCAGCGAAGTTGATGCGGAGATCATCCTGCACATCTCTGCCAACGCGCGCAGCGACCTGCGCTCGCTGCCGAGCAACGTGCGCCTGGTTGATTGGATTCCGATGGGTGTGTTCCTGAACGGTGCGGACGGCTTTATCCACCACGGTGGTGCGGGTAACACCCTGACTGCGCTGCATGCCGGTATTCCGCAGATTGTCTTTGGTCAGGGTGCTGACCGCCCGGTTAATGCGCGTGTGGTGGCGGAGCGTGGCTGTGGGATCATCCCGGGTGATGTCGGCCTGTCCAGCAACATGATCAACGCCTTCCTGAACAACCGCTCGCTGCGTAAAGCCTCTGAAGAGGTTGCGGCAGAAATGGCGGCGCAGCCGTGCCCGGGTGAGGTGGCCAAATCGCTGATCACCATGGTTCAGAAAGGGCATCACCATCACCATCATCACTAACCAGGCATCAAATAAAACGAAAGGCTCAGTCGAAAGACTGGGCCTTTCGTTTTATCTGTTGTTTGTCGGTGAACGCTCTCTACTAGAGTCACACTGGCTCACCTTCGGGTGGGCCTTTCTGCGTTTATA
(ii) What technology or technologies would you use to perform this DNA synthesis and why?
Selected Technology: Silicon-based high-throughput chemical synthesis (Twist Bioscience platform).
Rationale: For a complex circuit involving multiple promoters, a CDS (iroB), and a kill-switch, I need extreme precision and the ability to synthesize large quantities of different variations of the circuit. Twist’s technology uses a silicon platform that miniaturizes the traditional phosphoramidite chemistry, allowing for the synthesis of thousands of genes simultaneously with high fidelity and low cost, which is ideal for prototyping complex logic gates like mine.
Detailed Technical Questions:
What are the essential steps of your chosen synthesis method?
Phosphoramidite Cycle: The DNA is built base-by-base (A, T, C, G) on a silicon chip. Each addition follows a cycle of 4 steps: De-protection (preparing the strand), Coupling (adding the base), Capping (preventing errors), and Oxidation (stabilizing the bond).
Assembly: Since the chemical process can only print short pieces (oligos), these pieces are harvested from the chip and assembled into the full 2.5 kb circuit.
Error Correction: The final DNA is “polished” using enzymes to ensure there are no mutations, delivering a 100% accurate sequence.
What are the limitations of your synthesis method (if any) in terms of speed, accuracy, scalability?
Speed: The chemical synthesis is fast, but the complete process (assembly, quality control, and shipping) takes about 2 to 3 weeks.
Accuracy: As the DNA strand gets longer, the chance of errors increases, which is why we must assemble smaller, verified fragments to build a large circuit.
Scalability: It is highly scalable (thousands of genes at once), but it still depends on traditional chemicals, unlike newer enzymatic methods.
5.3 DNA Edit
(i) What DNA would you want to edit and why?
Target DNA: The genome of a therapeutic strain of Escherichia coli (like E. coli Nissle 1917).
Why: I need to integrate my synthetic NAND-iroB circuit into the bacterial chromosome. If the circuit stays on a plasmid, it could be lost or vary in copy number. By editing the bacterial genome to insert the circuit into a “safe harbor” locus, I ensure the therapy is stable and the kill-switch works perfectly every time.
(ii) What technology or technologies would you use to perform these DNA edits and why?
Rationale: CRISPR-Cas9 is extremely precise at “cutting” the DNA at a specific site in the bacterial genome, and Recombineering allows us to “paste” my large 2.5 kb synthetic circuit into that gap with high efficiency.
Detailed Technical Questions:
How does your technology of choice edit DNA? What are the essential steps?
Targeting: A Guide RNA (gRNA) leads the Cas9 protein to the exact spot in the bacterial genome.
Cutting: Cas9 creates a double-strand break (DSB) in that spot.
Insertion: Using the cell’s repair machinery (and a template I provide), the synthetic NAND-iroB circuit is “pasted” into the cut, becoming a permanent part of the bacteria’s DNA.
What preparation do you need to do (e.g. design steps) and what is the input (e.g. DNA template, enzymes, plasmids, primers, guides, cells) for the editing?
Design steps: I need to design the gRNA (to target the genome) and the Homology Arms (flanking sequences that match the insertion site).
Input: The Cas9 enzyme, the gRNA, and my synthetic DNA construct (the circuit synthesized by Twist).
What are the limitations of your editing methods (if any) in terms of efficiency or precision?
Efficiency: In bacteria, the rate of successful “pasting” (HDR) can be low, often requiring selection markers (like antibiotic resistance) to find the edited cells.
Precision: There is a small risk of off-target effects, where Cas9 might cut in the wrong place, though this is rare in simple bacterial genomes.
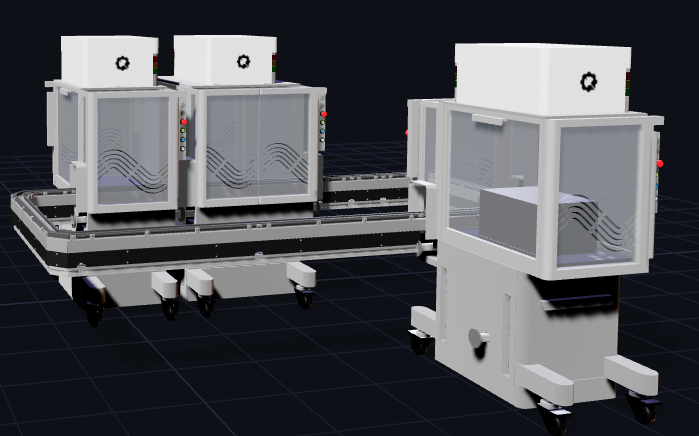
Week 03 HW: Lab-Automation
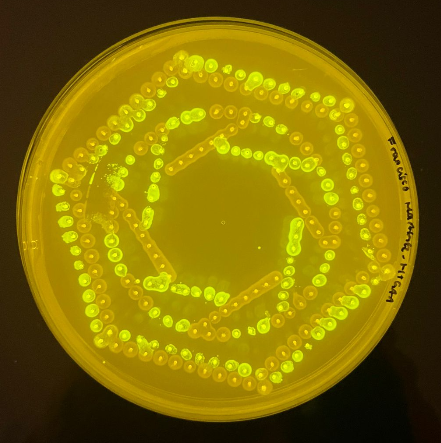
1. Python Script for Opentrons Artwork
This artwork was generated using the HTGAA26 Opentrons Colab environment. opentron_code
The design was implemented programmatically using geometric constructions and multi-color pipetting logic.
To properly render Devanagari text (e.g., “चित्”) using PIL in Google Colab, system-level fonts must be installed before executing the Opentrons script. The Noto Sans Devanagari font was installed using the following commands in a separate Colab cell:
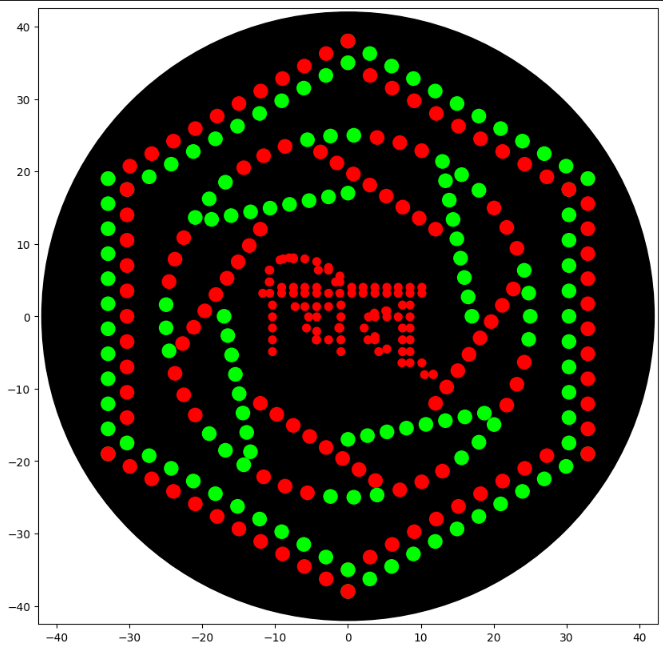
The multi-color bacterial culture profile demonstrates the programmatic execution of the automated pipetting grid mapped on a standard petridish agar matrix. The green and red fluorescent colonies reveal distinct localized clustering and spatial geometry coordinated via the Opentrons liquid handler toolchain. Based on experimental optimization runs, the initial Devanagari text string design was excised from the final plate layout due to localized fluidic resolution boundaries and translation constraints in automated dot-matrix tracking, optimizing the final pattern strictly around the stable geometric and concentric distribution arrays shown above (Chitra Neural).
Figure 1: High-throughput automated bacterial agar art validation via liquid handling robotics.
2. Post-Lab Questions
2.1 Find and describe a published paper that utilizes the Opentrons or an automation tool to achieve novel biological applications.
In this study, the authors developed an automated design–build–test workflow to systematically engineer genetic logic circuits in living cells. Rather than constructing gene circuits through manual trial-and-error, they integrated computational modeling, standardized genetic parts, and high-throughput experimental validation to design functional Boolean logic gates such as AND, OR, NOR, and more complex multi-layer circuits.
The key innovation was the automation of circuit design and screening. Computational tools were used to predict circuit behavior based on promoter strength, repressor activity, and regulatory architecture. These predictions were then experimentally validated using high-throughput plate-based assays, allowing many circuit variants to be constructed and tested in parallel. Automated measurement of reporter outputs (e.g., fluorescence) enabled quantitative evaluation of logic performance, signal thresholds, and leakiness.
Automation significantly reduced the combinatorial complexity inherent in multi-input genetic circuit design. Instead of manually constructing and testing a few variants, the workflow enabled systematic exploration of many possible architectures, improving robustness and reproducibility. This approach demonstrated that genetic logic circuits can be engineered in a scalable and programmable manner, similar to electronic circuit design.
This paper shows how automation transforms synthetic biology from artisanal genetic assembly into an engineering discipline with predictive modeling and systematic validation.
2.2 Write a description about what you intend to do with automation tools for your final project. You may include example pseudocode, Python scripts, 3D printed holders, a plan for how to use Ginkgo Nebula, and more. You may reference this week’s recitation slide deck for lab automation details.
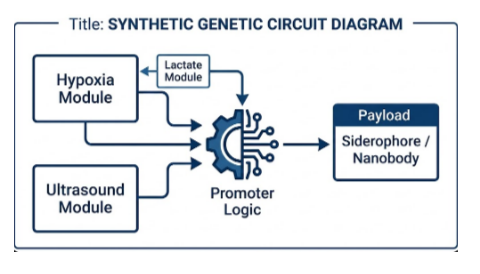
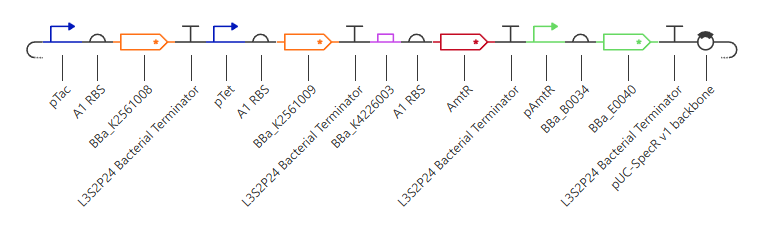
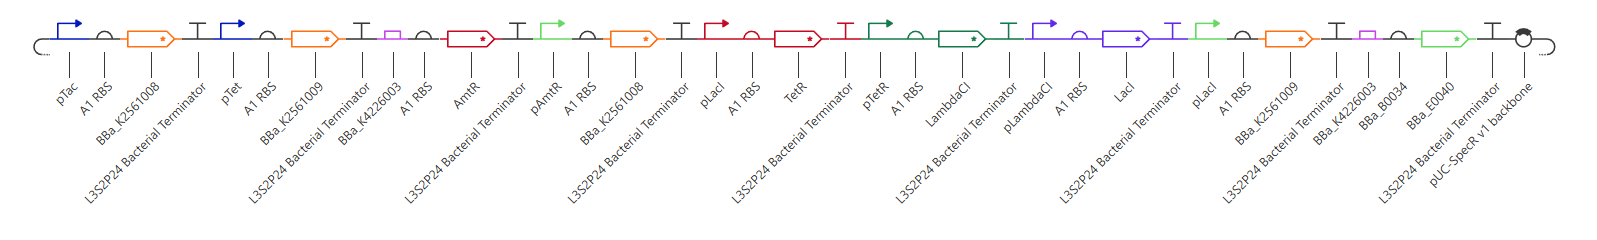
For my final project, I intend to engineer a bacterial therapeutic system for oncology applications. The core design involves a plasmid encoding a NAND logic gate integrating multiple tumor-associated inputs, including hypoxia, elevated lactate levels, and ultrasound stimulation. Only when specific tumor microenvironment conditions are satisfied would the circuit activate expression of a therapeutic cassette (e.g., the eriBCDEN complex).
Automation would be essential to systematically design and validate this multi-input logic system. I propose implementing an automated design–build–test workflow focused on high-throughput screening of circuit variants.
Combinatorial plasmid assembly
Promoter variants responsive to hypoxia, lactate, and ultrasound would be modularly assembled using combinatorial DNA assembly methods (e.g., Golden Gate). An acoustic liquid handler (e.g., Echo) could transfer defined promoter and RBS fragments into specified wells to systematically generate circuit variants.
RBS strength tuning
Ribosome binding site variants of defined translation strengths would be introduced to modulate repressor expression levels. This step allows fine control of expression thresholds and minimization of basal leakiness, which is critical for achieving accurate NAND logic behavior.
High-throughput culture setup
Following transformation and colony selection, bacterial variants would be distributed into 96-well plates using liquid handling robotics. This enables parallel testing of multiple architectures under standardized growth conditions.
Controlled environmental testing
Each well would be exposed to defined combinations of normoxia/hypoxia conditions, graded lactate concentrations, and ultrasound stimulation (applied externally). This systematic input matrix allows evaluation of all Boolean input states.
Automated reporter quantification
A fluorescent reporter would be used during circuit prototyping prior to therapeutic deployment. Fluorescence measurements using a plate reader (e.g., PHERAstar) would quantify output across all input combinations, enabling assessment of Boolean fidelity, dynamic range, activation thresholds, and leakiness.
Because multi-input genetic logic circuits require careful balancing of transcriptional and translational parameters, manual testing would be slow and prone to variability. Automation enables parallelized combinatorial screening and quantitative validation before integrating the therapeutic cassette.
By integrating automation into the circuit development pipeline, this approach would accelerate optimization of tumor-specific logic and improve safety and precision in engineered bacterial cancer therapies.
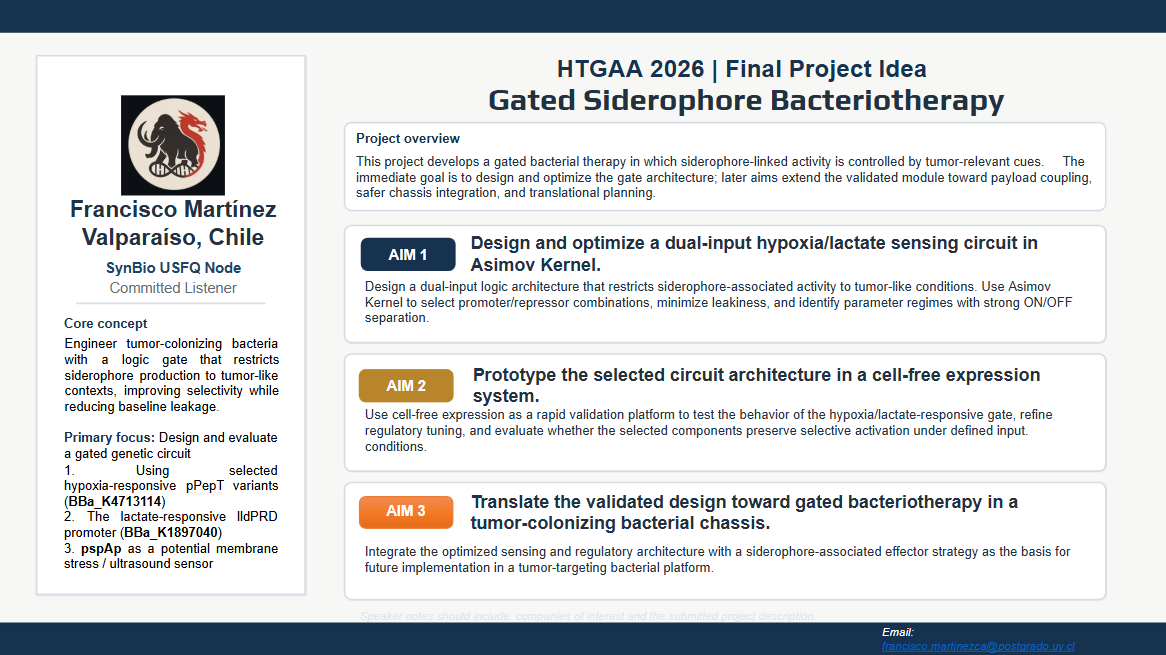
3. Final Project Ideas
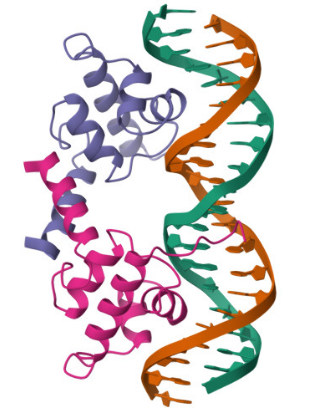
Gated Siderophore Bacteriotherapy: My First is a programmable bacterial therapy that targets tumors by expressing a salmochelin siderophore cassette only under highly controlled conditions. The control logic is a two-input gate: hypoxia provides spatial specificity, and ultrasound provides clinician timing. Mechanistically, both inputs are implemented through DNA-binding repressors that toggle promoter accessibility—this week I analyzed the lambda cI DNA-binding domain (PDB 1LMB) as a structural model for repressor–operator control, which maps directly onto the TlpA39–P_tlpA thermal switch used for ultrasound activation. Next, I’m integrating the dual-repressor logic into a single promoter architecture and validating it with sequence/structure design tools.
Neuroengineering - Metabolic Calcium Control: My second project is a closed-loop neuroengineering circuit to keep neuronal activity in a safe range. The input is lactate, a simple metabolic signal that rises in stressed tissue. I use a lactate-responsive promoter to drive a nanobody-based controller that tunes calcium entry when activity becomes too strong. I’ll test it in C. elegans touch neurons using the mec-4d degeneration model, where calcium dynamics can be imaged in vivo. The goal is a genetic feedback system that links metabolism to stable neural signaling.
Ultrasound-Triggered Genetic Switches: My third project is the enabling technology behind my tumor-targeting bacteria: using ultrasound as a non-invasive control signal. The core idea is to build biological transducers—such as gas vesicles and mechanosensitive channels—that convert focused ultrasound into a reliable genetic switch. That switch becomes an external “ON command” you can combine with internal signals like hypoxia to build multi-input logic in living cells. So this project turns ultrasound into a general remote-control layer, and my bacteriotherapy project is the first concrete use case.
Figure 2: High-level architecture of the genetic control system. Hypoxia, ultrasound, and lactate sensing modules feed into a promoter-logic layer that gates expression of the therapeutic payload (either a siderophore cassette or a nanobody), enabling multi-input control over when and where the output is produced.
Week 04 HW: Protein Design Part I
Part A. Conceptual Questions from Shuguang Zhang
1) How many molecules of amino acids are in 500 g of meat?
Assume meat is ~20–25% protein: 500 g meat → ~100–125 g protein. Using ~100 Da per amino acid (given):
2) Why do humans eat beef but do not become a cow, eat fish but do not become fish?
Food proteins are digested into amino acids/peptides, then your cells rebuild human proteins according to your genome and regulation. You recycle building blocks; you do not copy the animal’s body plan.
3) Why are there only 20 natural amino acids?
The translation system (genetic code + tRNAs + synthetases + ribosome) is optimized around a standard set that provides a broad, efficient chemical toolkit. Expanding it is costly because it would require coordinated changes across the whole decoding machinery (and most proteins). (Note: nature also uses rare genetically encoded additions like selenocysteine/pyrrolysine in some lineages.)
4) Can you make other non-natural amino acids? Design some new amino acids.
Yes—chemistry and engineered translation can incorporate noncanonical amino acids. Examples:
Azido-alanine (Ala–N3): bioorthogonal “click” handle for labeling.
p-benzoyl-phenylalanine: UV-activated crosslinker to trap interactions.
Bipyridyl-alanine: metal-chelating side chain for catalysis/materials.
Fluoroleucine: tunes hydrophobicity/stability and NMR/19F probes.
5) Where did amino acids come from before enzymes and before life started?
Abiotic synthesis from simple precursors (e.g., atmospheric/energy-driven reactions), mineral-catalyzed chemistry (e.g., hydrothermal settings), and extraterrestrial delivery (meteorites). Prebiotic chemistry can generate amino acids without enzymes.
6) If you make an α-helix using D-amino acids, what handedness would you expect?
A helix built from D-amino acids is the mirror of the L-form helix. Answer: D-amino-acid α-helices are expected to be left-handed (L-amino-acid α-helices are typically right-handed).
7) Can you discover additional helices in proteins?
Yes. Beyond the canonical α-helix, proteins can contain 3₁₀ helices, π helices, and short helical turns. They can be identified by backbone hydrogen-bond patterns and secondary-structure assignment algorithms (e.g., DSSP/STRIDE) and validated by structural data (X-ray/cryo-EM/NMR).
8) Why are most molecular helices right-handed?
Because proteins use L-amino acids, and for L-residues the right-handed α-helix minimizes steric clashes and optimizes backbone H-bond geometry and side-chain packing. Left-handed helices are generally less favorable for L-residues.
9) Why do β-sheets tend to aggregate? What is the driving force for β-sheet aggregation?
β-strands have backbone H-bond donors/acceptors; exposed “sheet edges” can form intermolecular H-bonds, effectively zipping molecules together. Driving forces: backbone hydrogen bonding + hydrophobic packing (and release of ordered water), often producing very stable “stacked” β-structures.
Part B: Protein Analysis and Visualization
1) Briefly describe the protein and why I selected it
I selected the lambda repressor (cI) (PDB 1LMB) because it is a well-resolved DNA-binding transcriptional repressor and provides a direct structural model for the TlpA/TlpA39–P_tlpA thermal switch used in ultrasound-triggered bacterial circuits. In both systems, a repressor binds an operator/promoter to block transcription, and regulation occurs by changing the repressor’s ability to bind DNA; therefore, cI is an ideal, structurally validated example to analyze DNA binding, secondary structure, and regulatory interfaces using 3D visualization tools. (rcsb.org)
Bacteriophage lambda repressor (cI), N-terminal DNA-binding domain bound to operator DNA RCSB PDB:1LMB (X-ray, 1.80 Å)
2) Identify the amino acid sequence of your protein.
How long is it?
Sequence length: 92 amino acids
What is the most frequent amino acid?
Most frequent amino acid:A (Alanine) — 11 occurrences
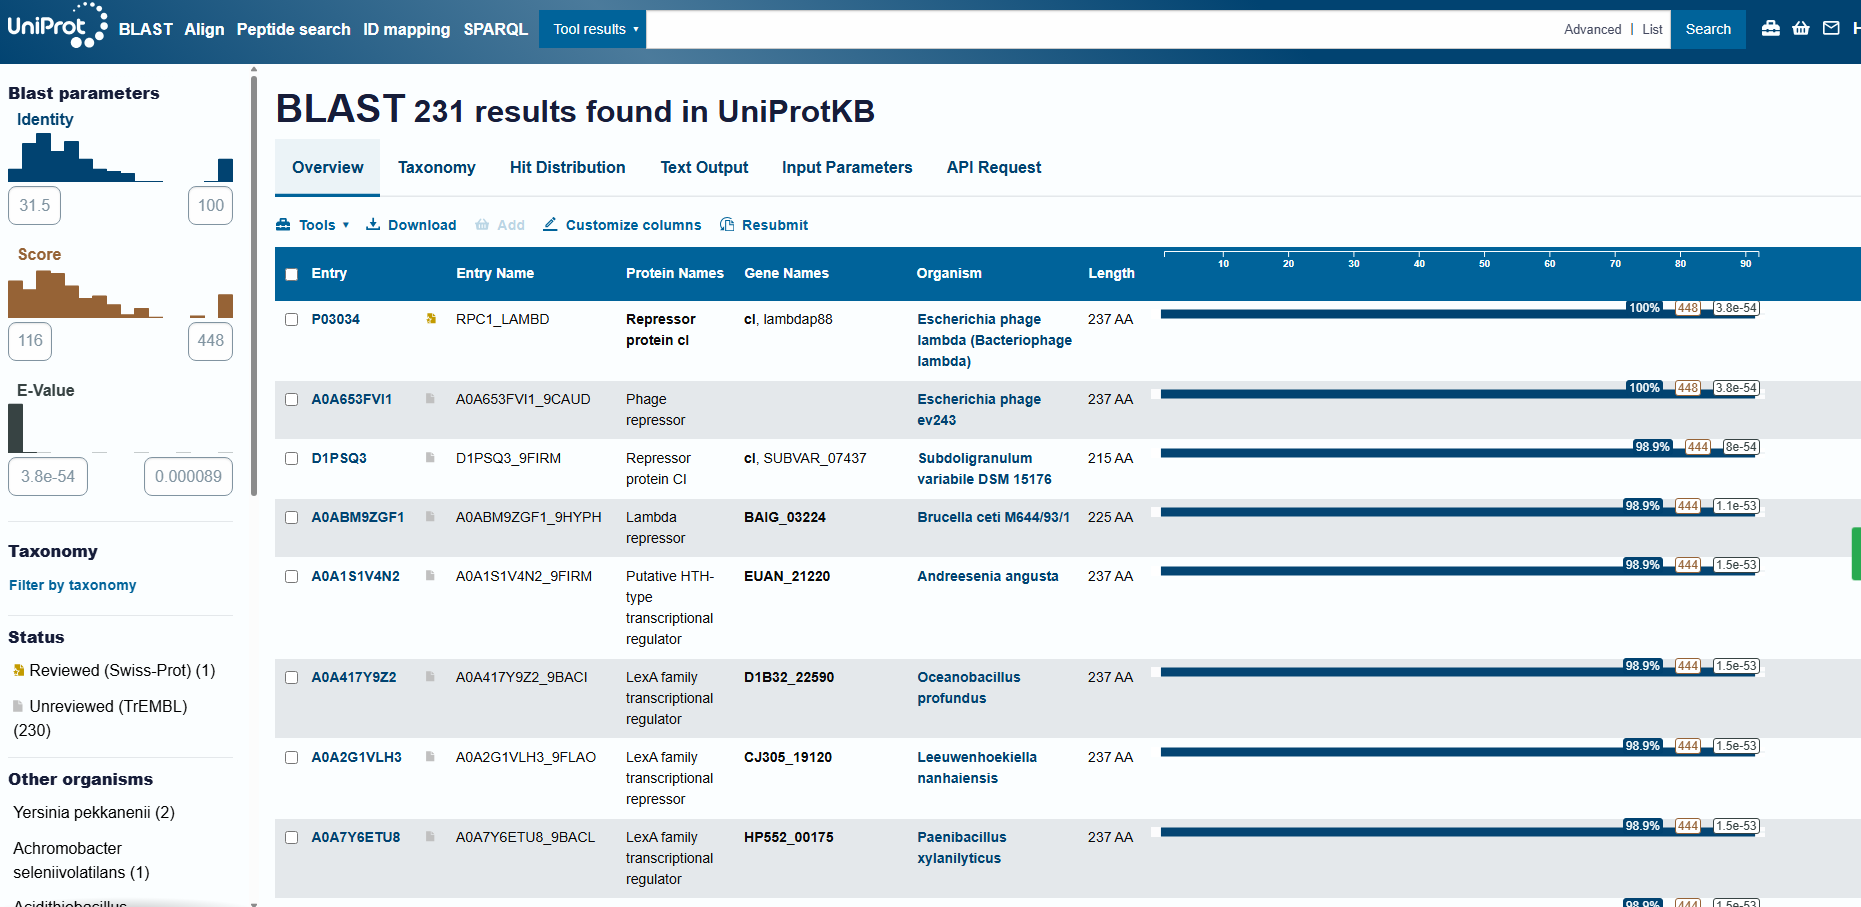
How many protein sequence homologs are there for your protein?
Running UniProt BLAST with the 1LMB protein sequence returned 231 homologous sequences (hits) in UniProtKB. The top matches are annotated as phage repressors / HTH-type transcriptional regulators (lambda/lambdoid-like repressors).
Protein family
cI is a helix-turn-helix (HTH) DNA-binding transcriptional repressor, part of the lambda/lambdoid phage repressor family that controls the lysis–lysogeny switch in temperate bacteriophages.
Part C. Using ML-Based Protein Design Tools
C1. Protein Language Modeling
Deep Mutational Scans (ESM2)
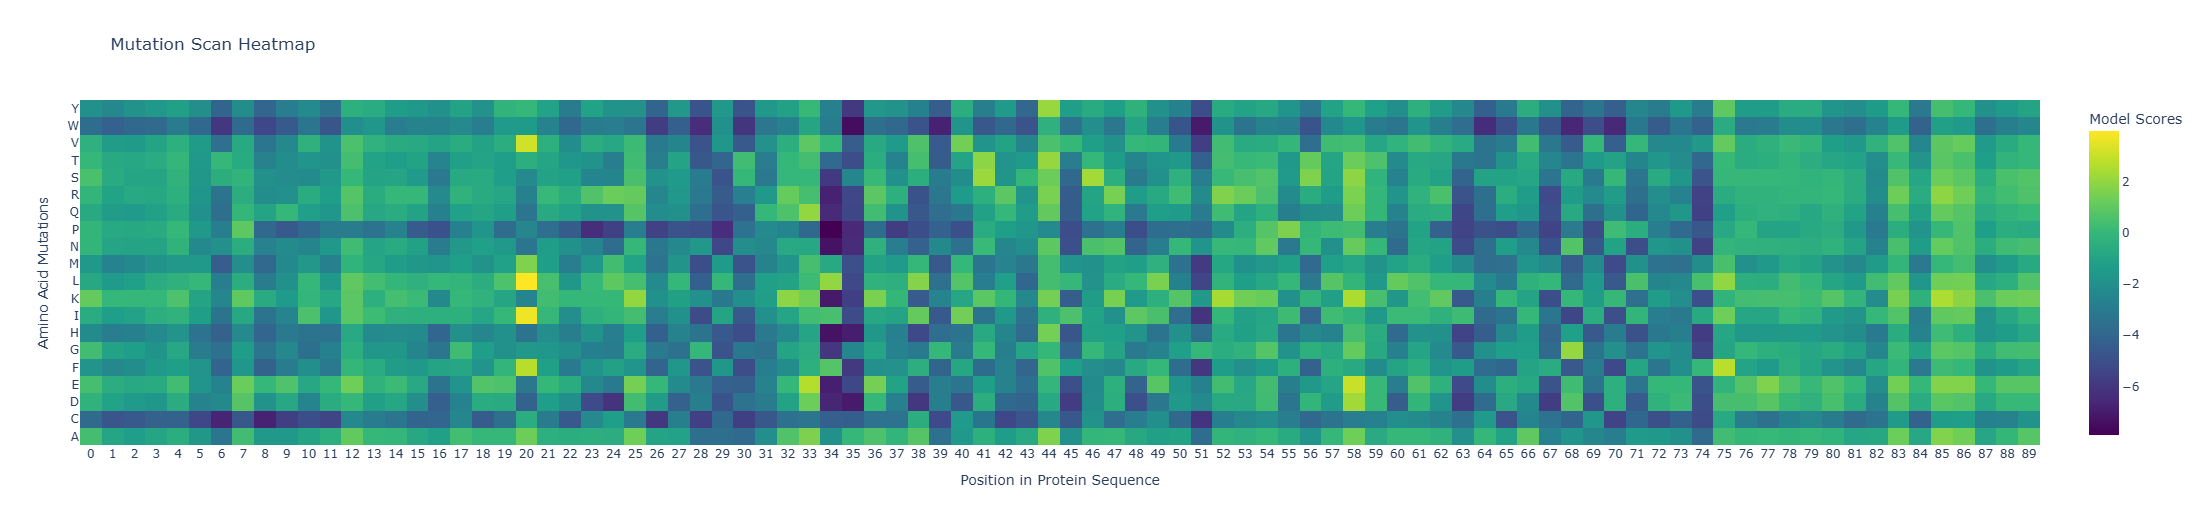
I used ESM2 to generate an unsupervised deep mutational scan of my protein based on language-model likelihood scores (heatmap of all single substitutions).
Pattern / standout example: Because the heatmap is plotted as heatmap[:, 2:], the x-axis starts at residue 3 (1-based).
Most deleterious mutation:D37→P (heatmap: x=34, y=P, z≈-7.89). Proline is strongly disfavored here, consistent with disruption of local secondary structure (proline is a common helix breaker).
Most favorable mutation:K23→L (heatmap: x=20, y=L, z≈+3.95), suggesting this substitution is well tolerated in the local sequence context according to the model.
Latent Space Analysis (protein embeddings + 3D t-SNE)
I embedded the provided dataset (n=15,177 proteins) using protein language model embeddings (320D) and reduced dimensionality with 3D t-SNE. The resulting map forms local neighborhoods where nearby points represent proteins with similar sequence features (t-SNE is most reliable for local similarity).
Do neighborhoods approximate similar proteins? Yes. Proteins in the same neighborhood tend to share related sequence motifs and often similar functions/families.
Placing my protein in the map (via nearest neighbors): My exact sequence is not present as a point in the provided dataset, so I embedded my sequence with the same model and located it by its closest neighbors in embedding space. The nearest neighbors include:
Nearest neighbors (top 5):
index
distance
TSNE1
TSNE2
TSNE3
annotation (short)
1124
0.607
1.152
1.019
-6.889
lambda cI repressor, DNA-binding domain
1152
1.080
1.113
1.027
-6.865
HTH-like match (Nostoc punctiforme)
1149
1.168
1.099
1.009
-6.878
HTH-like match (E. coli)
1153
1.224
1.065
0.997
-6.873
HTH-like match (P. aeruginosa)
1128
1.257
1.105
1.005
-6.878
HigA antitoxin (HTH regulator)
These neighbors are consistent with my protein being a helix-turn-helix (HTH) DNA-binding regulator, and indicate that my sequence lies in an HTH/transcription-factor neighborhood.
Colab notebook (Latent space section)
C2. Protein Folding
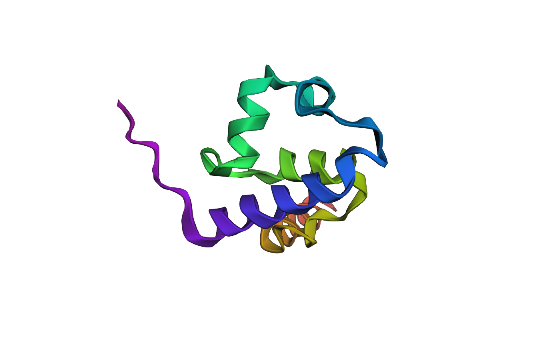
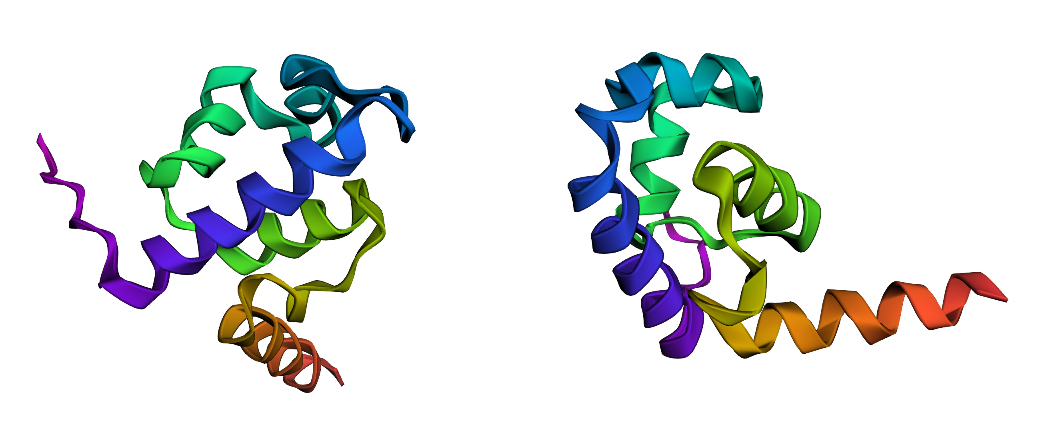
Fold your protein with ESMFold. Do the predicted coordinates match your original structure?
I folded the 92 aa lambda repressor DNA-binding domain using ESMFold and compared it to the experimental structure (PDB 1LMB). The prediction shows a mainly alpha-helical fold consistent with an HTH-like DNA-binding domain, so it matches the expected overall topology. Minor differences are expected because 1LMB is solved in a protein–DNA complex, while ESMFold predicts the protein without DNA.
3. Try changing the sequence, first try some mutations, then large segments. Is your protein structure resilient to mutations?
I tested ESMFold predictions for (i) a point mutation predicted as favorable by the ESM2 scan (K23L), (ii) a strongly disfavored point mutation (D37P), and (iii) a large-segment replacement (10-aa alanine stretch: positions 31–40 → AAAAAAAAAA).
Across all three variants, the predicted structures remain predominantly alpha-helical and preserve the same overall fold/topology by qualitative visual comparison. Differences, if any, appear mainly local (subtle shifts in helix/loop geometry), rather than a global collapse or refolding.
Conclusion: For this small HTH-like domain, the overall fold appears resilient to these mutations and to the tested segment-level replacement (at least at the level of ESMFold-predicted coordinates).
Note: ESM2 mutation scores reflect sequence plausibility, not a direct folding energy. In my tests, even a strongly disfavored mutation (e.g., D37→P) did not collapse the global fold in ESMFold, suggesting the overall topology is robust. The mutation scan is more informative for identifying specific constrained positions (likely functional/structural hotspots) than for predicting global unfolding from a single “worst-score” mutation.
C3. Protein Generation
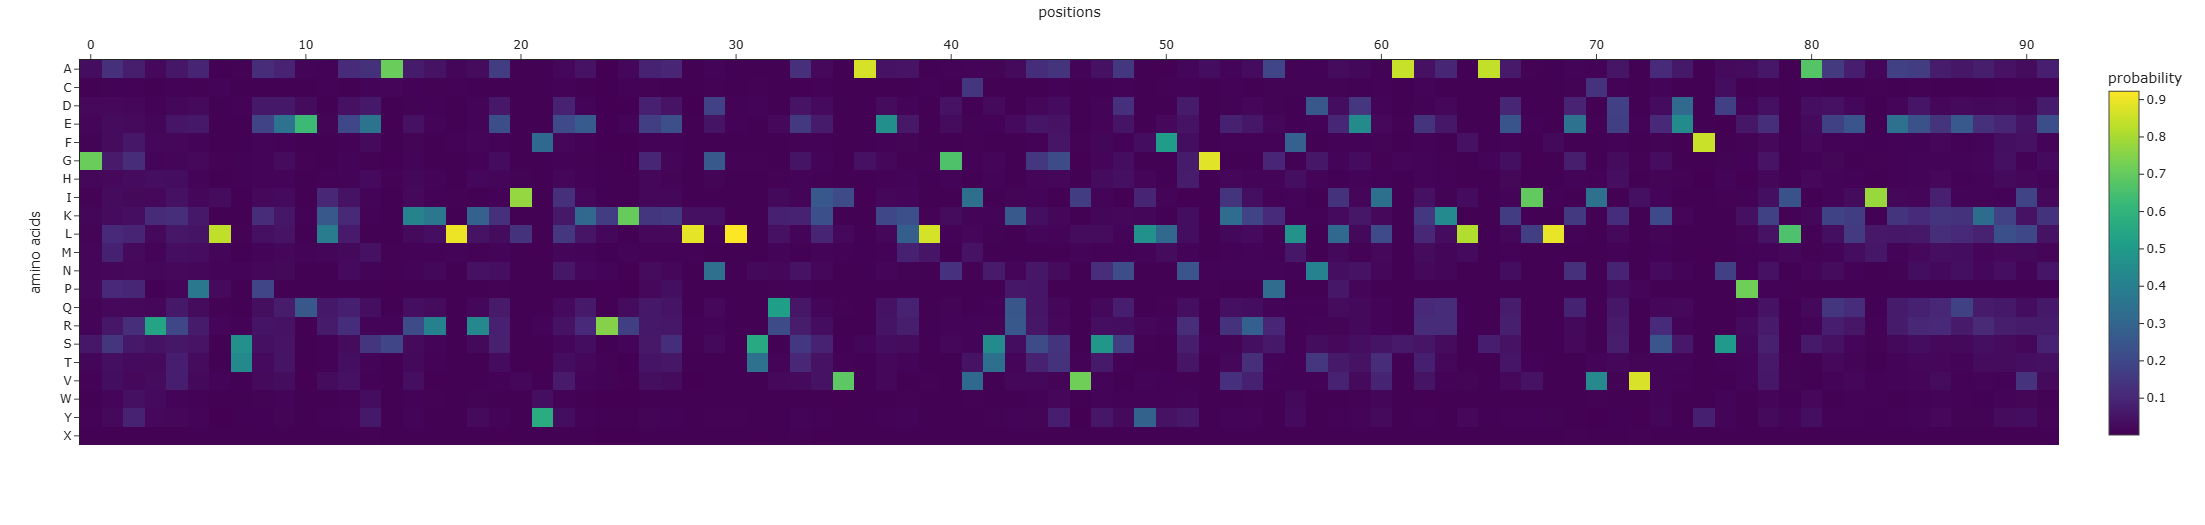
Analyze the predicted sequence probabilities and compare the predicted sequence vs the original one.
I used the backbone coordinates from PDB 1LMB (protein chain 4) as input to ProteinMPNN to generate sequence candidates compatible with the same fold.
Original (WT): STKKKPLTQEQLEDARRLKAIYEKKKNELGLSQESVADKMGMGQSGVGALFNGINALNAYNAALLAKILKVSVEEFSPSIAREIYEMYEAVS
Sequence recovery: 0.5109 (~51% of positions match the original).
Comparison (predicted vs original):Predicted sequence probabilities: The per-position amino-acid probability heatmap shows a mix of:
high-confidence positions (bright cells), where ProteinMPNN strongly prefers a specific residue given the backbone geometry, and
low-confidence positions (diffuse/darker columns), where multiple residues are plausible (more sequence flexibility).
Overall, ProteinMPNN preserves the general biochemical character expected for this fold (many helix-compatible and charged residues) while allowing substantial substitutions at less constrained positions.
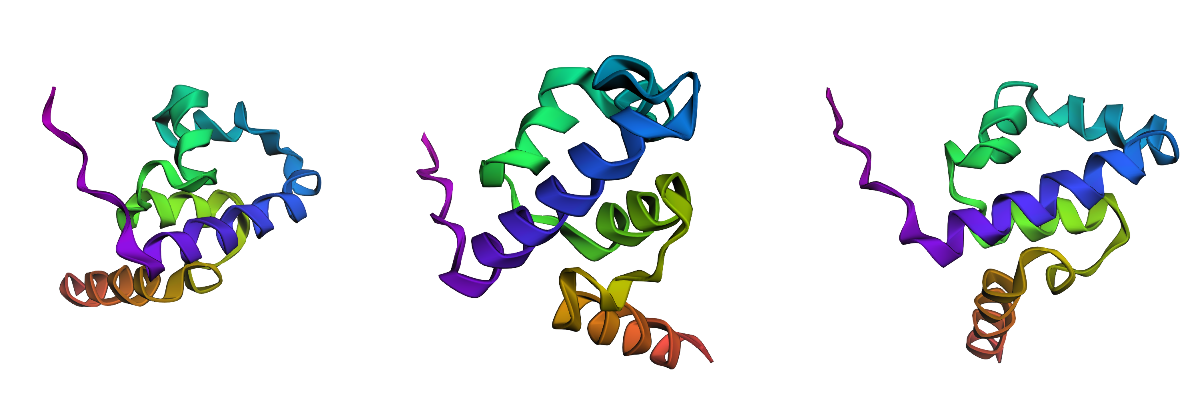
Input this sequence into ESMFold and compare the predicted structure to your original.
I folded the ProteinMPNN-designed sequence with ESMFold and compared it to the original fold (left). The designed sequence (right) produces a very similar, predominantly alpha-helical topology, consistent with the same HTH-like backbone. Differences are mainly local (helix lengths/orientations and terminal regions), rather than a complete refolding.
Conclusion: ProteinMPNN proposes a sequence that is compatible with the original backbone: despite ~50% sequence recovery, the predicted structure remains close to the original fold at the qualitative/topology level.
Part D. Group Brainstorm on Bacteriophage Engineering (Engineering MS2 Lysis Protein L via N-Terminal Modulation of DnaJ Dependence)
Selected Goals
Primary goal – Increased stability (functional robustness) Identify sequence variants of MS2 lysis protein L that maintain structural plausibility and membrane-competent architecture.
Secondary goal – Higher titers (mechanism-linked) Modulate the dependence of L on the host chaperone DnaJ by engineering the N-terminal regulatory segment that controls activation of the lysis protein.
Biological Motivation
Previous studies show that MS2 lysis protein L requires the host chaperone DnaJ for lytic activity, and that the N-terminal region plays a regulatory role in this dependence. However, no work has systematically explored how sequence variation in this region shapes the conformational constraints underlying host-assisted activation.
We hypothesize that DnaJ dependence emerges from sequence-encoded constraints within the N-terminal regulatory segment. By mapping mutational tolerance in this region, we aim to identify variants that alter host dependence while preserving the membrane-associated lytic function of L.
Computational Approach
Protein Language Models (ESM2 / ESM-3)
Perform an in silico mutational scan of the N-terminal region to identify sequence-plausible mutations. Language model likelihood scores provide a proxy for evolutionary constraints and help prioritize mutations that are unlikely to disrupt protein viability.
Structure Prediction (ESMFold or Boltz-1)
Predict structures for candidate variants and filter out mutations predicted to cause major structural disruption. These predictions act as a structural plausibility check rather than definitive structural validation.
Interaction Proxy (AlphaFold-Multimer)
Model complexes between MS2 L variants and the host chaperone DnaJ. While chaperone interactions are dynamic, these predictions provide a relative signal to compare potential effects of mutations on host interaction.
Sequence Conservation (BLAST + Clustal Omega)
Identify conserved residues to avoid mutating positions likely critical for function.
Potential Pitfalls
Membrane proteins are challenging for structure predictors.
Chaperone interactions may not be accurately captured by AlphaFold-Multimer.
Variants that alter lysis timing could negatively affect phage burst size.
Pipeline
WT MS2 L sequence ↓ BLAST / Clustal → identify conserved N-terminal residues ↓ ESM2 mutational scan → generate candidate variants ↓ ESMFold / Boltz → remove structurally implausible variants ↓ AlphaFold-Multimer → compare predicted interaction with DnaJ ↓ Shortlist variants for experimental testing of lysis timing and phage titers
Week 05 HW: Protein Design Part II
Part A: SOD1 Binder Peptide Design
Part 1: Generate Binders with PepMLM
Begin by retrieving the human SOD1 sequence from UniProt (P00441) and introducing the A4V mutation.
Original sequence sp|P00441|SODC_HUMAN Superoxide dismutase
Generate four peptides of length 12 amino acids conditioned on the mutant SOD1 sequence.
Using the mutant SOD1 sequence as input, PepMLM Colab generated four 12-residue candidate binders
index
Binder
Pseudo Perplexity
0
WRYPVAGARHWE
18.89836973999799
1
KLYYPVVVAWWK
17.203301905376957
2
HRYPVVVAALKE
11.315016775827807
3
WLYGAAVLRHGE
15.526728984710877
Record the perplexity scores that indicate PepMLM’s confidence in the binders.
PepMLM’s pseudo-perplexity scores indicate the model’s confidence in the generated binders, with lower values corresponding to higher confidence. Among the four generated peptides, HRYPVVVAALKE showed the highest confidence (lowest pseudo-perplexity, 11.315), whereas WRYPVAGARHWE showed the lowest confidence (highest pseudo-perplexity, 18.898). The reference peptide FLYRWLPSRRGG was included for comparison, but no pseudo-perplexity score for it was provided in the displayed output.
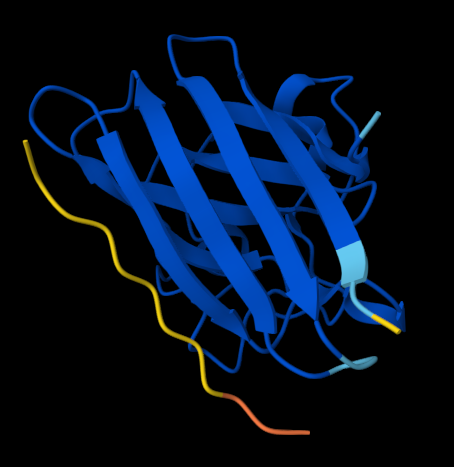
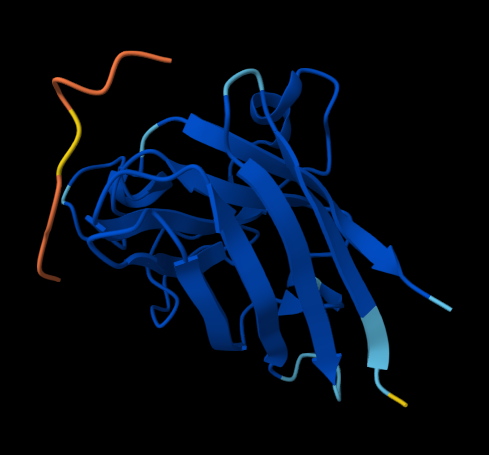
Part 2: Evaluate Binders with AlphaFold3
For each peptide, submit the mutant SOD1 sequence followed by the peptide sequence as separate chains to model the protein-peptide complex.
KLVYPVVVAWWK (ipTM = 0.59)
FLYRWLPSRRGG (ipTM = 0.33)
Figure 1. AlphaFold-predicted SOD1 A4V complexes shown side by side for comparison. Left: complex with the PepMLM-generated peptide KLVYPVVVAWWK. Right: complex with the known SOD1-binding peptide FLYRWLPSRRGG.
Record the ipTM score and briefly describe where the peptide appears to bind. Does it localize near the N-terminus where A4V sits? Does it engage the β-barrel region or approach the dimer interface? Does it appear surface-bound or partially buried?
WRYPVAGARHWE — ipTM = 0.35. The peptide appears loosely surface-bound on the SOD1 surface, with no clear evidence of a well-defined buried binding mode. It does not convincingly localize near the N-terminus/A4V region and instead appears to contact the β-barrel surface in a weakly resolved manner.
KLVYPVVVAWWK — ipTM = 0.59. This peptide showed the strongest predicted interface among the tested candidates. It appears mainly surface-bound and extended along the β-barrel region, rather than deeply buried in a pocket. It does not clearly localize near the N-terminus where A4V sits, and no strong interaction with the dimer-interface region is evident.
HRYPVVVAALKE — ipTM = 0.48. The peptide appears surface-associated with low-to-moderate interface confidence. It does not seem to bind near the N-terminal A4V region and instead contacts an exposed outer region of SOD1, consistent with a surface-bound interaction rather than a partially buried one.
WLYGAAVLRHGE — ipTM = 0.31. This peptide shows a very weak predicted interface and appears largely extended and surface-associated, without a defined binding pocket. It does not localize near the A4V-containing N-terminus, nor does it show a clear approach to the dimer interface. The interaction appears predominantly surface-bound.
FLYRWLPSRRGG — ipTM = 0.33. The known binder also showed a low-confidence interface in this AlphaFold prediction. The peptide appears loosely surface-bound rather than buried, with no strong evidence of localization near the N-terminus/A4V site or a clearly resolved interaction at the dimer-interface region.
In a short paragraph, describe the ipTM values you observe and whether any PepMLM-generated peptide matches or exceeds the known binder.
Overall, the predicted SOD1 A4V–peptide complexes showed low-to-moderate ipTM values, indicating that none of the modeled interfaces was predicted with high confidence. Among the PepMLM-generated candidates, KLVYPVVVAWWK produced the highest ipTM (0.59), followed by HRYPVVVAALKE (0.48), whereas WRYPVAGARHWE (0.35) and WLYGAAVLRHGE (0.31) showed weaker predicted interfaces. The known SOD1-binding peptide FLYRWLPSRRGG gave an ipTM of 0.33. Therefore, the best PepMLM-generated peptide, KLVYPVVVAWWK, exceeded the known binder in this AlphaFold-based comparison, and HRYPVVVAALKE and WRYPVAGARHWE also matched or surpassed it, whereas WLYGAAVLRHGE did not.
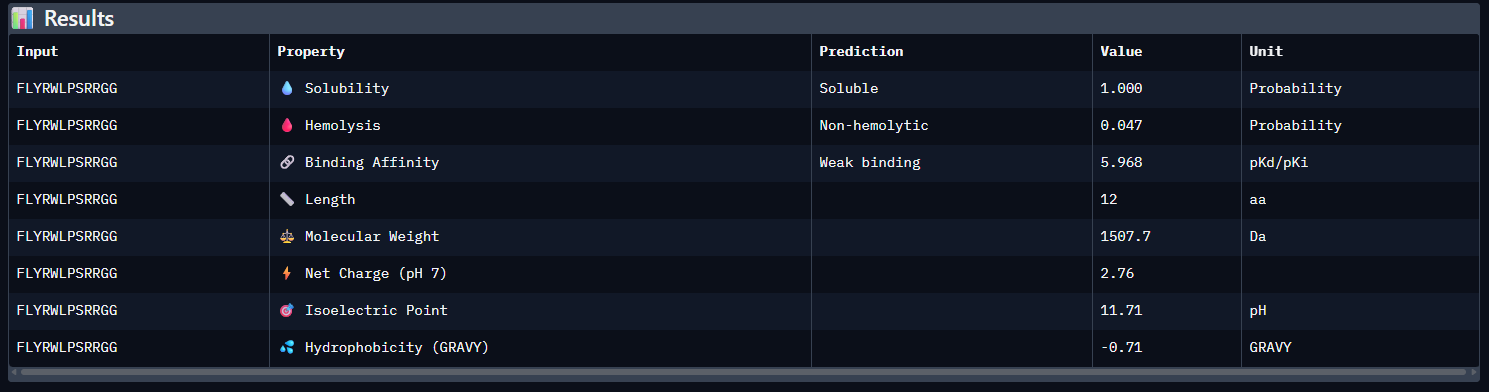
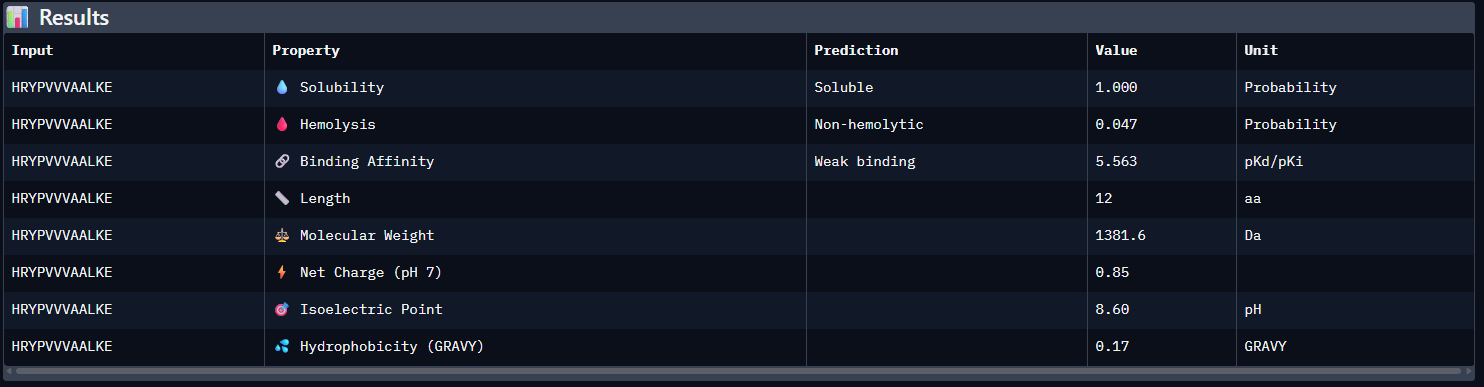
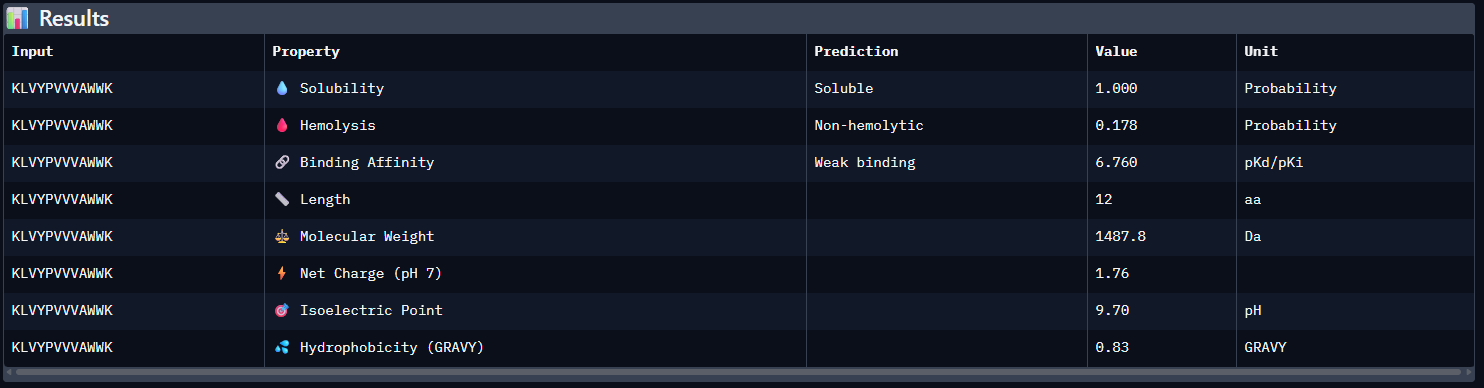
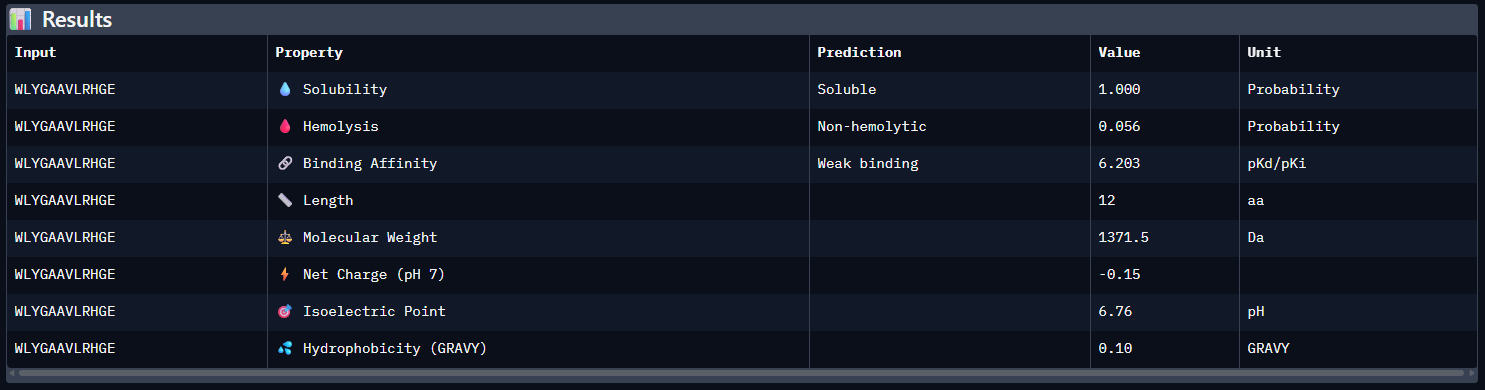
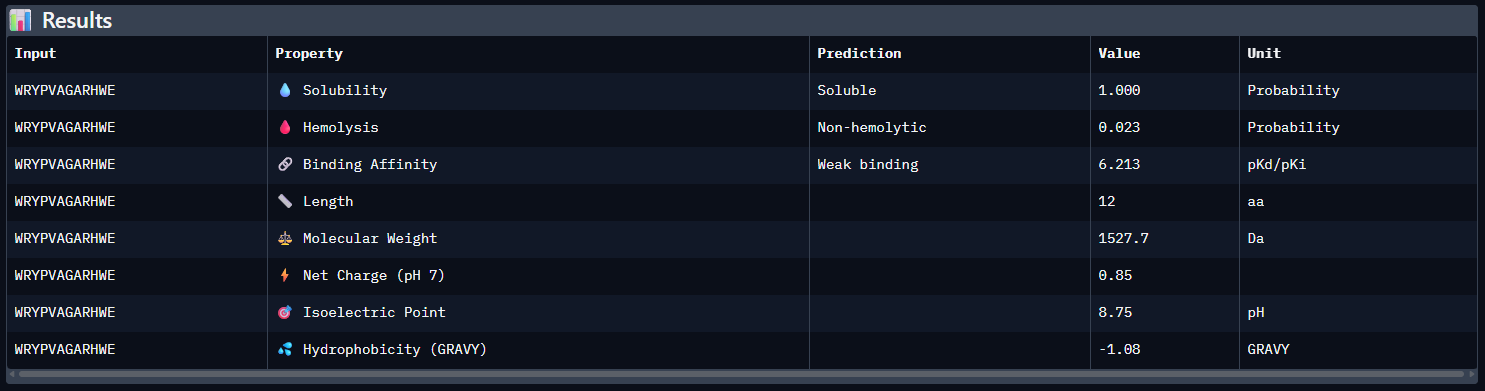
Part 3: Evaluate Properties of Generated Peptides in the PeptiVerse
Using PeptiVerse, let’s evaluate the therapeutic properties of your peptide! For each PepMLM-generated peptide:
Results
Compare these predictions to what you observed structurally with AlphaFold3. In a short paragraph, describe what you see. Do peptides with higher ipTM also show stronger predicted affinity? Are any strong binders predicted to be hemolytic or poorly soluble? Which peptide best balances predicted binding and therapeutic properties?
Compared with the AlphaFold3 models, the sequence-based peptide property predictions show only partial agreement with the structural results. The peptide with the highest structural confidence, KLVYPVVVAWWK (ipTM = 0.59), also has the strongest predicted binding affinity among the candidates (pKd/pKi = 6.760), so in that case the two methods are consistent. However, this trend is not perfect across all peptides: for example, WRYPVAGARHWE has a low AlphaFold3 interface score (ipTM = 0.35) but still a moderately favorable predicted affinity (6.213), while the known binder FLYRWLPSRRGG showed both low structural confidence (ipTM = 0.33) and the weakest predicted affinity (5.968). Importantly, all peptides were predicted to be soluble and non-hemolytic, so none of the better binders appears disqualified by poor solubility or overt hemolysis risk. Among them, KLVYPVVVAWWK appears to best balance predicted binding and therapeutic properties, since it combines the highest ipTM, the strongest predicted affinity, full solubility, and a non-hemolytic prediction, although its hemolysis probability (0.178) is somewhat higher than that of the other candidates and would still merit attention in follow-up validation.
Choose one peptide you would advance and justify your decision briefly.
I would advance KLVYPVVVAWWK. Among the tested peptides, it showed the highest AlphaFold3 interface confidence (ipTM = 0.59) and the strongest predicted binding affinity (pKd/pKi = 6.760), making it the most consistent top candidate across both structural and sequence-based evaluations. It was also predicted to be soluble and non-hemolytic, which supports its therapeutic potential. Although its hemolysis probability was somewhat higher than that of the other candidates, it remained below the threshold for a hemolytic prediction, so overall it provided the best balance between predicted binding performance and developability.
Part 4: Generate Optimized Peptides with moPPIt
After generation, briefly describe how these moPPit peptides differ from your PepMLM peptides. How would you evaluate these peptides before advancing them to clinical studies?
Peptide
Method
Target motif
Affinity score
ipTM
Interpretation
KLVYPVVVAWWK
PepMLM
None
6.760
0.59
Best overall PepMLM candidate
HRYPVVVAALKE
PepMLM
None
5.563
0.48
Intermediate
WRYPVAGARHWE
PepMLM
None
6.213
0.35
Weak interface
WLYGAAVLRHGE
PepMLM
None
6.203
0.31
Weak interface
FLYRWLPSRRGG
Known binder
None
5.968
0.33
Reference; weaker than best PepMLM candidate
RYTDIQQYCGKW
moPPIt
29–35
6.423
0.42
Moderate but not strong
GQSDYCTRQGKI
moPPIt
29–35
5.933
0.52
Best moPPIt structural result so far
KRGKTCLECYQY
moPPIt
29–35
7.286
0.28
Strong property scores but poor structural support
GCGYSRSYTKYE
moPPIt
107–115
7.286
0.44
Good score profile, but only moderate structural support
GDRSEYCSQKKQ
moPPIt
107–115
6.418
0.53
Best moPPIt structural result; moderate interface confidence
EQSRYGHKQDER
moPPIt
107–115
5.221
0.36
High motif score but weak structural support
Note: Residues 29–35; 107-115 were selected as a hypothesis-driven target motif based on their apparent mutational sensitivity in the ESM2 deep mutational scan. This choice does not demonstrate that the region is surface-exposed or experimentally validated as a peptide-binding site, but it highlights a segment that may be structurally or functionally important and therefore worth testing in a controlled design setting.
Before any clinical development, these peptides would require stepwise preclinical evaluation. First, their intended mechanism of action would need to be clarified: whether they are meant to bind mutant SOD1 merely as recognition molecules, to block a pathogenic interaction surface, to interfere with dimerization, or to reduce misfolding or aggregation. They would then need to be tested experimentally in biochemical and cellular assays to confirm real binding to mutant SOD1, measure affinity and selectivity relative to wild-type SOD1, and determine whether binding produces a meaningful functional effect. This should be followed by preclinical studies addressing stability, protease susceptibility, uptake or delivery, toxicity, hemolysis, immunogenicity risk, pharmacokinetics, and efficacy in relevant animal models of SOD1-associated disease before considering any first-in-human study. In other words, these computational results could justify preclinical follow-up, but they are far from sufficient to support direct clinical advancement.
Part C: Final Project: L-Protein Mutants
1. Project Objective and Biological Rationale
The primary objective of this assignment is to introduce rational single-point mutations into the MS2 bacteriophage lysis protein (L-protein) to overcome host resistance mechanisms. Resistant E. coli strains modify their DnaJ chaperone to prevent interaction with the N-terminal soluble domain of the L-protein, halting its folding cascade and evading viral lysis. To bypass this evolutionary barrier, we executed a comparative analysis benchmarking the theoretical predictions of the ESM-2 language model against an empirical wet-lab screening dataset (experimental_df). This dual-layer validation serves to discover functional variants that restore lysis or optimize membrane perforation kinetics.
2. Computational vs. Experimental Correlation Analysis
A critical outcome of this project is the identification of a severe dislocation between computational fitness predictions and empirical biological reality. General protein language models highly overrate thermodynamic stability in hydrophobic environments, leading to high-scoring false positives:
C29R Discrepancy:ESM-2 ranked the C29R substitution as the second-highest stabilization peak (Score: 2.395), yet empirical screening confirms a total loss of function (Lysis = 0, Protein Levels = 0).
Transmembrane Region Overestimation: Substitutions at position 50 (such as K50L, Score: 2.561) and position 53 (N53L, Score: 1.864) were predicted as highly advantageous. However, the experimental ledger reveals that any mutation at position 50 (K50E, K50N, K50I, K50Q) or position 53 (N53S, N53D, N53H, N53I, N53Q) results in complete functional inactivation (Lysis = 0).
Correlation Conclusion: While the machine learning model accurately identifies deleterious mutations in the early N-terminus (positions 1-10), it fails to predict functional phenotypes within the transmembrane helix. Consequently, uncalibrated computational scores were discarded, and variant selection was driven strictly by empirical functional validation.
3. Quantitative Selection Matrix and Biofrequent Justification
To isolate the optimal single-point mutations under strict structural constraints, the empirical screening dataset was filtered exclusively for active phenotypic outcomes. The matrix below aggregates every targeted mutation within the library that demonstrated successful bacterolytic execution:
Posición
Mutación
Región
Lysis
Proteína
13
P -> L
Soluble
1
1
15
S -> A
Soluble
1
1
18
R -> G
Soluble
1
1
18
R -> I
Soluble
1
1
19
R -> S
Soluble
1
0
19
R -> H
Soluble
1
0
20
R -> W
Soluble
1
0
20
R -> L
Soluble
1
0
23
K -> E
Soluble
1
0
25
E -> V/G/D
Soluble
1
0
26
D -> G
Soluble
1
0
30
R -> Q/L
Soluble
1
1
31
R -> I
Soluble
1
1
44
L -> P
TM
1
1
45
A -> P
TM
1
1
46
I -> F
TM
1
1
From this validated functional baseline, five distinct single-point substitutions were selected to satisfy the experimental criteria across the topography of the L-protein:
Transmembrane Region (Residues 41 to 75)
Mutation 1 (L44P): Lysis=1, Protein=1 experimentally. Proline introduces a structural kink in the TM helix that probably facilitates membrane perforation. The computational score does not appear in the top rankings, but the experimental data is clear.
Mutation 2 (A45P): Lysis=1, Protein=1 experimentally. Same rationale — proline in TM generates helical curvature that favors insertion and pore formation. Two consecutive prolines in TM is a known mechanism of holin activation.
Soluble Region (Residues 1 to 40)
Mutation 3 (R18G): Lysis=1, Protein=1 experimentally. Eliminating the positive charge of arginine at position 18 of the soluble domain keeps the protein functional and expressed. Glycine is the most flexible amino acid — it can improve the conformational dynamics of the soluble domain for interaction with DnaJ.
Mutation 4 (P13L): Lysis=1, Protein=1 experimentally. Proline at position 13 can create counterproductive structural rigidity in the soluble domain. Replacing it with leucine could increase local flexibility and improve interaction with DnaJ.
Free Variant (Domain Interface Boundary)
Mutation 5 (R30Q): Lysis=1, Protein=1 experimentally. Arginine at position 30, soluble/TM boundary. Glutamine maintains the ability to form hydrogen bonds but eliminates the positive charge, potentially optimizing the transition between domains.
4. Homo-Oligomeric Assembly Modeling via AlphaFold2-Multimer
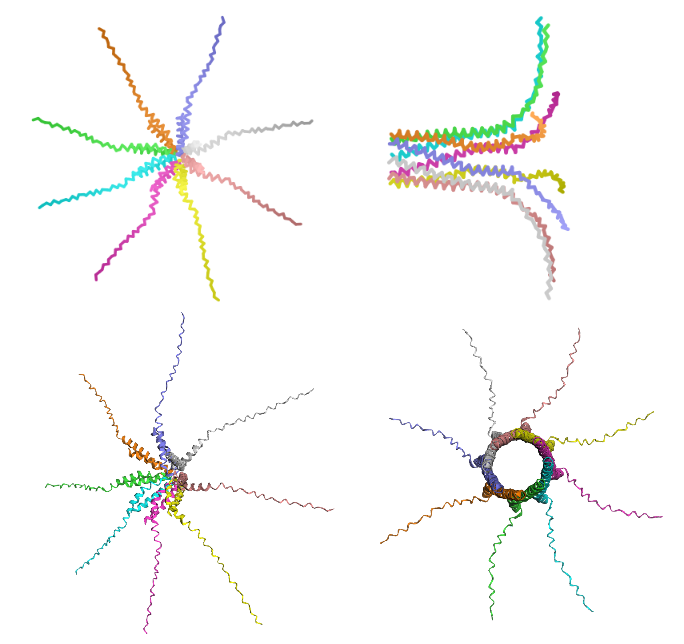
To evaluate the running structural hypothesis — where the L-protein functions by assembling into a multimeric pore complex to perforate the host lipid bilayer — the engineered A45P sequence was modeled as an 8-chain homomultimer in ColabFold. The predictive execution reached convergence after 3 recycles, with the top-ranked structural configuration (Rank 1, Model 2: pLDDT = 33.6, ipTM = 0.141) yielding an insightful spatial architecture:
C-Terminal Pore Core: The optimized transmembrane regions successfully aligned in a parallel arrangement, compacting into a defined cylindrical helical bundle that establishes the structural foundation of the lytic channel.
N-Terminal Soluble Funnels: The flexible loop domains extended outward from the membrane channel boundaries in a symmetrical funnel formation. While confidence metrics remain low (red structural domains) due to the computational absence of the coordinating host lipid matrix or native chaperones, the successful clustering of the core helices validates the structural viability of the library to execute cell-wall disruption.
Figure 1: Comparative multi-chain structural re-ranking of the engineered A45P L-protein octamer.
Left (Top & Bottom): Rank 5 structural configuration (Model 5), representing the lowest confidence prediction (pLDDT = 26.4). The architecture shows a symmetric star-like or spider morphology where the flexible soluble domains project outward horizontally.
Right (Top & Bottom): Rank 1 structural configuration (Model 2), validating the top-performing prediction (pLDDT = 33.6, ipTM = 0.141). The side view (top-right) shows a parallel alignment of the transmembrane alpha-helices into a cylindrical bundle, while the top-down axial view (bottom-right) shows a central, hollow pore channel.
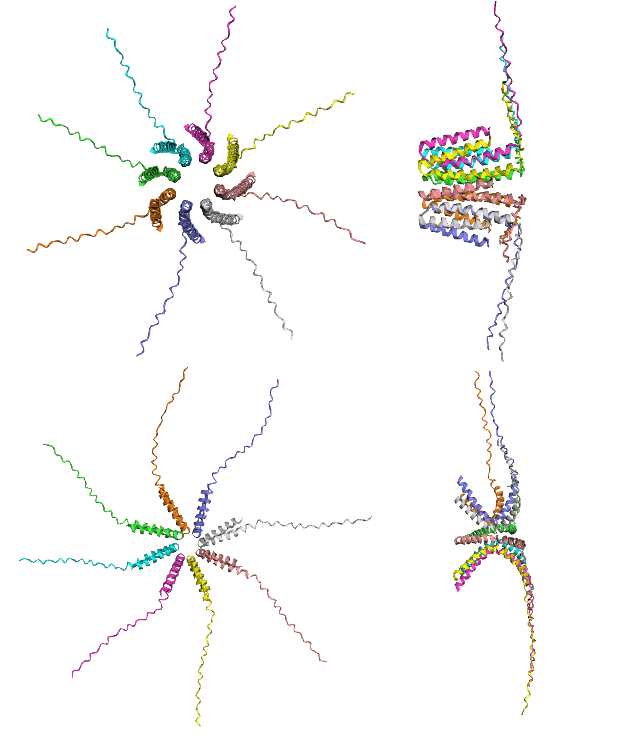
4.1 Negative Control Structural Profiling (K50L)
The non-functional K50L variant was executed under identical multi-chain parameters to analyze its structural topography. The execution completed successfully (Rank 1, Model 2), yielding an alternative configuration across its statistical models (Rank 1: pLDDT = 32.2, ipTM = 0.153).
Figure 2: Homo-oligomeric channel length and shearing analysis of the K50L negative control.
Top (Left & Right): Rank 1 structural configuration (Model 2), representing the top-performing prediction by ipTM metrics. The top-down axial view (top-left) shows the geometric formation of a hollow central channel, while the side view (top-right) shows longitudinal shearing and straight alignment in the transmembrane helices.
Bottom (Left & Right): Rank 5 structural configuration (Model 5), representing the lowest confidence prediction by ipTM metrics. The axial prediction (bottom-left) captures a centralized pore layout, while the side view (bottom-right) shows a tilted cross-like geometry where the vertical length of the core is compressed.
4.2 Discussion: Conformational Sampling Limits and Integrated Biophysical Hypotheses
The descriptive data from these multimeric assemblies reveals that relying on a limited batch of five predictive iterations is statistically insufficient to declare a single, definitive structural state. Crucially, the low-throughput structural channel profiles must be interpreted alongside the genetic boundaries outlined by Chamakura et al. (2017). The literature establishes that the N-terminal soluble domain of the native L-protein functions as an autologous inhibitor that requires host DnaJ coordination to prevent a destructive steric clash. In a resistant host (dnaJ P330Q), this chaperone rescue is abolished, leaving the baseline lytic cascade completely blocked (Lysis = 0).
When analyzing our computational results, the localized variations in cylinder length and vertical shearing observed in the inactive K50L control function as a compelling exploratory hypothesis regarding geometric mismatch. However, this structural interpretation is not mutually exclusive with the chemical constraints highlighted in the literature. Lysine 50 represents a highly atypical, positively charged residue buried directly within the hydrophobic transmembrane helix. While AlphaFold2-Multimer heavily prioritizes the straight, aliphatic packing of Leucine to generate an idealized circular barrel, substituting this Lysine removes a critical electrostatic hotspot. This charge deletion likely abrogates the mandatory chemical interaction with the unknown membrane target of the L-protein, rendering the rigid cylinder functionally inert regardless of its simulated geometric dimensions.
Conversely, our engineered variant A45P introduces a targeted Proline substitution. The Proline residue acts as a dynamic molecular hinge that breaks ideal helical symmetry, introducing structural flexibility that is scored with low local pLDDT metrics. This proline-mediated bending may provide the necessary conformational elasticity to bypass the autologous steric blockade of the unchaperoned N-terminus or dynamically realign the remaining interaction vectors with the membrane target, successfully rescuing lytic execution (Lysis = 1). Ultimately, this parallel simulation demonstrates that structural pore formation in predictive software is a geometric baseline rather than a guarantee of biological execution, establishing that future high-throughput sampling must balance macro-geometric length parameters with discrete electrostatic interface constraints.
Week 06 HW: Genetic Circuits Part I
DNA Assembly Assignment
1. Components of the Phusion High-Fidelity PCR Master Mix
The Phusion High-Fidelity PCR Master Mix contains the main components required for accurate DNA amplification. One key component is the Phusion DNA polymerase, which synthesizes new DNA strands with high fidelity. The mix also includes dNTPs, which serve as the nucleotide building blocks for DNA synthesis. In addition, it contains a reaction buffer that maintains the proper pH and salt conditions for enzyme activity, as well as magnesium ions, which are essential cofactors for polymerase function. Together, these components support efficient and accurate PCR amplification.
2. Factors that determine primer annealing temperature during PCR
Primer annealing temperature depends mainly on the melting temperature of the primers. This is influenced by primer length, GC content, sequence composition, and the degree of complementarity between the primer and the template DNA. Primers with higher GC content usually have higher melting temperatures because GC base pairs form stronger interactions than AT base pairs. The ionic conditions of the reaction can also affect annealing behavior. In practice, the annealing temperature is usually chosen a few degrees below the primer melting temperature to promote specific binding.
3. PCR and restriction enzyme digests as methods to create linear DNA fragments
PCR and restriction enzyme digestion can both be used to generate linear DNA fragments, but they do so in different ways. PCR creates a linear fragment by amplifying a specific region of DNA using primers and a DNA polymerase. This makes PCR highly flexible, since the user can define the exact fragment boundaries and can also introduce overlaps, mutations, or additional sequences through primer design. By contrast, restriction enzyme digestion produces linear DNA fragments by cutting DNA at specific recognition sites. This method is simpler when the correct restriction sites are already present, but it is less flexible because it depends on the natural or engineered location of those sites. PCR is preferable when custom fragment design is needed, whereas restriction digestion is useful for straightforward excision or plasmid linearization.
4. Ensuring that digested and PCR-generated DNA fragments are appropriate for Gibson cloning
To ensure that PCR-generated and digested DNA fragments are appropriate for Gibson cloning, the fragments must contain overlapping homologous ends. These overlaps are typically around 20 to 40 base pairs long and must match the adjacent fragment exactly so that they can anneal during the Gibson reaction. It is also important to verify that the fragments have the expected size and correct orientation. This can be checked by sequence design in Benchling and by confirming the fragment sizes experimentally, for example by gel electrophoresis. In addition, the DNA fragments should be clean and well purified to improve assembly efficiency.
5. How plasmid DNA enters E. coli cells during transformation
Plasmid DNA enters E. coli cells only after the cells have been made competent. In chemical transformation, the cells are treated to make their membranes more permeable, and a brief heat shock helps the plasmid DNA cross the membrane and enter the cell. In electroporation, a short electrical pulse creates temporary pores in the membrane that allow DNA uptake. After the DNA enters the cell, the bacteria recover in rich medium and begin expressing the antibiotic resistance marker carried by the plasmid. This makes it possible to select transformed cells on antibiotic-containing plates.
Another Assembly Method
6. Gibson Assembly
Gibson Assembly is a DNA assembly method that joins DNA fragments that share overlapping ends. The reaction contains three main enzymatic activities: an exonuclease, a DNA polymerase, and a DNA ligase. First, the exonuclease chews back the 5’ ends of the DNA fragments, exposing complementary single-stranded overlaps. These overlapping regions anneal to one another if they were designed correctly. Then the DNA polymerase fills in any missing nucleotides, and the ligase seals the remaining nicks in the DNA backbone. Because this method does not depend on restriction sites at the junctions, it allows seamless assembly of multiple DNA fragments in a single reaction.
7. Gibson Assembly explained in 5-7 sentences plus diagram
Gibson Assembly works by joining DNA fragments that share overlapping homologous ends. An exonuclease first creates single-stranded overhangs by chewing back the 5’ ends of each fragment. These exposed complementary regions then anneal to each other. After annealing, a DNA polymerase fills in the missing nucleotides. Finally, a DNA ligase seals the remaining nicks in the sugar-phosphate backbone. This method is efficient because it allows seamless joining of fragments without requiring restriction sites at the junctions. It is especially useful when assembling plasmids from PCR products and linearized backbones.
Figure 1. Overview of Gibson Assembly. (1) A linearized vector backbone and a DNA insert are designed with homologous overlap regions at opposite ends. (2) Exonuclease activity resects the 5’ ends of the DNA fragments, exposing complementary 3’ single-stranded overhangs. (3) These complementary 3’ overhangs anneal, DNA polymerase fills in the remaining gaps, and DNA ligase seals the remaining nicks, generating the final assembled plasmid.
8. Modeling this assembly method in Benchling
I modeled this assembly strategy in Benchling using a Gibson Assembly design from my project. In this design, I organized the vector backbone and the insert as separate DNA fragments and verified that they contained the appropriate overlap-compatible ends required for Gibson cloning. Benchling was useful for checking fragment orientation, overlap design, and the expected structure of the final construct before assembly. I then used the platform to inspect the final plasmid map and confirm the architecture of the assembled design.
Figure 2. Benchling setup for Gibson Assembly design. The vector backbone and the iroB insert were organized as separate fragments in Benchling and prepared for Gibson Assembly by defining overlap-compatible ends. This setup was used to verify fragment identity, orientation, and the expected construct before generating the final plasmid design.
Figure 3. Final Benchling construct after Gibson Assembly design. Circular map of the assembled pTwist-iroB-cassette plasmid (3561 bp), showing the final construct architecture after insertion of the iroB modular cassette into the vector backbone. This map was used to confirm the final plasmid structure and annotation.
Asimov Kernel Homework
1. Repository and notebook setup
I created a dedicated repository for this homework in Asimov Kernel (Francisco_MC_HW6) and added a notebook entry to document the work.
2. Exploring the Bacterial Demos repository
I explored the Bacterial Demos repository and chose to inspect the NAND construct as an initial example (Figure 4), since NAND logic is directly relevant to the design of genetic circuits and to my broader interest in programmable circuit behavior.
From this construct, I observed that Kernel represents the design both as a linear arrangement of functional genetic parts and as a circular DNA map. This made it easier to identify how promoters, ribosome binding sites, coding sequences, and terminators are organized within the circuit.
3. Initial observations
The NAND example helped me understand how Kernel connects circuit logic with DNA architecture. In the linear view, the construct is represented as an ordered set of functional parts. In the circular map, the same construct can be interpreted as a plasmid-level design. This dual representation is useful for relating circuit structure to the physical organization of the DNA sequence.
Figure 4. NAND construct from the Bacterial Demos repository in Asimov Kernel. The figure shows both the linear circuit architecture and the circular map of the construct. This view was useful for identifying the arrangement of promoters, ribosome binding sites, coding sequences, and terminators, and for relating circuit logic to the underlying DNA organization.
4.1 Recreate the Repressilator
I simulated the reconstructed repressilator in E. coli for 72 simulated hours using a 10-minute time step and no added ligand. The resulting RNA and protein concentration plots showed an initial transient phase followed by sustained oscillatory behavior over time. This indicates that the reconstructed circuit preserves the expected dynamic logic of the repressilator rather than converging to a single stable state. Both transcript and protein levels fluctuate over time, which is consistent with a cyclic repression network.
Figure 5. Comparison of repressilator architectures. The upper construct shows the original repressilator architecture, in which the promoter–repressor pairings follow the reference design from the Bacterial Demos repository. The lower construct shows a variant with altered promoter order while keeping the same general set of parts. This comparison was used to test how rewiring promoter arrangement affects the behavior of the oscillator.
4.2 Comparison of repressilator variants
I compared four repressilator configurations: the original reference architecture, a variant with a modified middle RBS, a variant with altered promoter order, and a combined variant containing both changes. In all four cases, the circuit still showed sustained oscillatory behavior in both RNA and protein concentration plots. This indicates that, in Kernel, the repressilator is qualitatively robust to these perturbations.
However, the variants did not behave identically. The main effect of both the RBS change and the promoter reordering was a redistribution of the quantitative balance among the three nodes. In particular, different variants shifted which transcriptional unit became most dominant in the final RNAP and ribosome flux plots. This suggests that these design changes affect the oscillatory regime quantitatively, even when they do not abolish oscillation altogether.
Construct
Promoter order
Middle RBS
Oscillation observed?
Main observation
Reference repressilator
Original
Original
Yes
Baseline oscillatory regime
Variant 1
Original
Altered
Yes
Oscillation preserved, but the middle module becomes more dominant
Variant 2
Altered
Original
Yes
Oscillation preserved, with a shifted quantitative balance across nodes
Variant 3
Altered
Altered
Yes
Oscillation preserved, with combined changes in node dominance and final flux distribution
Figure 6. Oscillatory response under two modified repressilator configurations. The left panels show the RNA and protein time-course simulations for combination 1 in the comparison table, corresponding to the repressilator with the first modified condition. The right panels show combination 3, in which both variables were altered simultaneously. In both cases, the circuit retained sustained oscillatory behavior after an initial transient phase. However, the combined perturbation produced a more uneven quantitative distribution across the three nodes, especially at the protein level, indicating that these modifications affect the balance of the oscillatory regime even when oscillation is preserved.
5. Build three of your own Constructs using the parts in the Characterized Bacterial Parts Repo
5.1 First construct: Simplified Transcriptional AND Gate for Dual-Input Detection
The first construct implements a minimal transcriptional AND gate designed by streamlining the regulatory activation cascade. This circuit acts as a high-fidelity dual-input sensor that restricts output expression to conditions where both chemical inducers are simultaneously present in the culture.
Figure 7. Simplified Transcriptional AND Gate assembled from modular components. The circuit uses the inducible input promoters pTac and pTet to drive the transcription of the regulatory coding sequences hrpR (BBa_K2561008) and hrpS (BBa_K2561009), respectively. In this configuration, the downstream reporter GFP (BBa_E0040) is wired to be driven directly by the pHrpL promoter (BBa_K4226003). As a result, transcriptional read-through and fluorescence emission are strictly dependent on the cooperative action of both inputs.
Piece-by-piece interpretation
Part
Role in the circuit
Functional meaning
pTac
Input 1 promoter
Induced by IPTG
pTet
Input 2 promoter
Induced by aTc
BBa_K2561008
hrpR
First regulator of the activation layer
BBa_K2561009
hrpS
Second regulator of the activation layer
BBa_K4226003
pHrpL
Promoter activated only when both HrpR and HrpS are present
BBa_B0034
RBS
Enables translation of the reporter
BBa_E0040
GFP
Fluorescent output reporter molecule
Biological interpretation
The biological logic of this construct functions as a strict coincidence detector. The external inducer IPTG activates pTac to produce HrpR, while aTc activates pTet to synthesize HrpS. Neither regulator can initiate transcription independently. Only when both chemical signals diffuse into the cell do HrpR and HrpS form a functional heteromeric complex capable of binding and driving the pHrpL promoter. Since pHrpL directly controls the output module, GFP is turned ON exclusively in the double-input condition, successfully executing AND logic.
Truth table
IPTG
aTc
HrpR
HrpS
pHrpL State
GFP Output
Phenotype
0
0
0
0
Inactive (Off)
0
OFF (No Fluorescence)
1
0
1
0
Inactive (Off)
0
OFF (No Fluorescence)
0
1
0
1
Inactive (Off)
0
OFF (No Fluorescence)
1
1
1
1
Active (On)
1
ON (Green Fluorescence)
5.2 Second construct: transcriptional NAND gate
The second construct implements a transcriptional NAND gate using two inducible inputs, IPTG and aTc. These inputs activate pTac and pTet, leading to expression of hrpR and hrpS. Only the simultaneous presence of both regulators activates pHrpL, which produces the repressor AmtR. AmtR then represses the GFP output module driven by pAmtR, so fluorescence is lost only in the double-input condition.
Figure 8. Synthetic NAND gate assembled from characterized bacterial parts. The construct uses pTac and pTet as two inducible input promoters controlling hrpR and hrpS. These two regulators jointly activate pHrpL (BBa_K4226003), which drives expression of the repressor AmtR. AmtR represses the output promoter pAmtR, thereby controlling the GFP reporter (BBa_E0040). As a result, GFP is expressed in all conditions except when both inputs are simultaneously present, consistent with NAND behavior.
The construct uses pTac and pTet as two inducible input promoters controlling hrpR and hrpS. These two regulators jointly activate pHrpL (BBa_K4226003), which drives expression of the repressor AmtR. AmtR represses the output promoter pAmtR, thereby controlling the GFP reporter (BBa_E0040). As a result, GFP is expressed in all conditions except when both inputs are simultaneously present, consistent with NAND behavior.
Piece-by-piece interpretation
Part
Role in the circuit
Functional meaning
pTac
Input 1 promoter
Induced by IPTG
pTet
Input 2 promoter
Induced by aTc
BBa_K2561008
hrpR
First regulator of the AND layer
BBa_K2561009
hrpS
Second regulator of the AND layer
BBa_K4226003
pHrpL
Promoter activated only when both HrpR and HrpS are present
AmtR
Final repressor
Represses the output promoter
pAmtR
Repressible output promoter
Drives GFP unless repressed by AmtR
BBa_B0034
RBS
Enables translation of the reporter
BBa_E0040
GFP
Fluorescent output reporter
Biological interpretation
The circuit detects two external inducers, IPTG and aTc. IPTG induces pTac and aTc induces pTet, producing HrpR and HrpS, respectively. Only when both are present is pHrpL activated, which drives expression of AmtR. AmtR then represses pAmtR, shutting off GFP expression. Therefore, the fluorescent output is turned OFF only when both inputs are present, which implements NAND logic.
Truth table
IPTG
aTc
pTac
pTet
HrpR
HrpS
pHrpL
AmtR
GFP
Output
0
0
0
0
0
0
0
0
1
1
1
0
1
0
1
0
0
0
1
1
0
1
0
1
0
1
0
0
1
1
1
1
1
1
1
1
1
1
0
0
5.3 Third construct: Oscillator-coupled NAND circuit for cyclic protein expression
This design couples a transcriptional NAND gate to a repressilator oscillator in order to generate cyclic protein expression. The NAND module determines whether output expression is permitted based on two external inputs, while the repressilator imposes a temporal oscillatory pattern on the system. As a result, the output protein is not produced continuously, but instead in periodic pulses and only under the logical conditions defined by the NAND gate.
Biological interpretation
Biologically, this construct can be understood as a programmable pulsatile expression system. The two external inputs first determine whether the cell is allowed to express the target protein, and the oscillator then determines when that expression occurs. This creates rhythmic bursts of protein production rather than constitutive accumulation, which could be useful for periodic secretion, controlled therapeutic delivery, or reducing metabolic burden during prolonged expression.
Figure 9. Oscillator-coupled NAND gate for pulsatile protein expression. The NAND module determines whether output expression is permitted, while the repressilator provides a cyclic temporal signal. Together, these modules generate rhythmic protein expression only when the required logical input conditions are satisfied.
Limitations
This design is conceptually valid, but its experimental implementation may face several limitations. Reuse of repeated regulatory parts could increase the risk of recombination or construct instability. In addition, the large size and multilayered structure of the circuit may impose a significant metabolic burden on the host cell. Coupling the NAND module and the oscillator on the same plasmid could also introduce unintended interactions between components, and promoter leakiness may reduce the sharpness of both the logic response and the pulsatile output.
week-07-hw-genetic-circuits-part-ii
Assignment Part 1: Intracellular Artificial Neural Networks (IANNs)
1. Advantages of IANNs over traditional Boolean genetic circuits
IANNs can generate graded, weighted, and more flexible input/output responses instead of only ON/OFF logic. This makes them better suited for integrating multiple noisy biological signals and for approximating complex decision boundaries.
2. Useful application of an IANN
A useful application would be tumor microenvironment sensing. Multiple inputs such as hypoxia, lactate, and acidity could be integrated to produce a selective therapeutic output only when the combined signal pattern matches a tumor-like state. A limitation is that biological components may have leakiness, limited dynamic range, crosstalk, and high variability, which can reduce classification accuracy.
3. Multilayer perceptron concept
In an intracellular multilayer perceptron, the first layer processes the input signals and produces an intermediate regulator, such as an endoribonuclease. That regulator then controls expression of the layer 2 output, for example a fluorescent protein, allowing hierarchical signal processing across layers.
Existing fungal materials include mycelium-based packaging, leather-like textiles, insulation panels, and construction composites. They are used as sustainable alternatives to plastic foams, animal leather, and some building materials. Their main advantages are biodegradability, low-energy production, and renewable growth. Their disadvantages include lower durability, moisture sensitivity, and less standardized performance compared with conventional materials.
2. Why genetically engineer fungi?
Fungi could be engineered to produce stronger, more water-resistant, or more functional materials, or to sense and respond to environmental signals. Synthetic biology in fungi is attractive because fungi naturally grow as structured biomaterials, secrete enzymes efficiently, and can process complex substrates such as agricultural waste. Compared with bacteria, fungi are often better suited for making large, fibrous, and mechanically useful living materials.
week-09-hw-cell-free-systems
Homework Part A: General and Lecturer-Specific Questions
Advantages: Cell-free systems allow direct control of reaction conditions without maintaining cell viability. They are especially useful for toxic proteins and membrane proteins.
Main components: Cell extract or Tx/Tl machinery, DNA template, amino acids, nucleotides, energy source, salts, and buffer. Together, these support transcription, translation, and reaction stability.
Energy regeneration: ATP and GTP are rapidly consumed during transcription and translation. Continuous supply can be maintained with phosphoenolpyruvate- or maltodextrin-based regeneration systems.
Prokaryotic vs eukaryotic cell-free systems: Prokaryotic cell-free systems are faster, simpler, and cheaper, making them useful for proteins such as GFP or bacterial enzymes. Eukaryotic systems are better for proteins that require more complex folding or post-translational modifications, such as membrane receptors or glycosylated proteins.
Optimizing membrane protein expression To optimize membrane protein expression, I would test the protein in a cell-free system supplemented with liposomes or nanodiscs to support folding and insertion. The main challenge is aggregation caused by hydrophobic regions, so providing a membrane-like environment and testing different reaction conditions would help improve yield and functionality.
Low yield: possible causes and troubleshooting One possible cause is poor DNA template quality, which can be addressed by improving template purity or concentration. A second cause is insufficient energy supply, which can be improved by optimizing the ATP regeneration system. A third cause is protein misfolding or aggregation, which can be addressed by changing temperature, adding chaperones, or using liposomes or nanodiscs.
Homework question from Kate Adamala
Function: A synthetic minimal cell that senses extracellular lactate and triggers reporter release.
Input / Output: Input = extracellular lactate. Output = fluorescence outside the vesicle after pore activation.
Cell-free alone?: Only partially. Encapsulation is needed for boundary formation and controlled release.
Natural engineered cell?: Yes, but a minimal cell is simpler and more controllable.
Desired outcome: OFF without lactate, ON with lactate.
Membrane: POPC + cholesterol.
Inside: Bacterial Tx/Tl system, amino acids, nucleotides, ATP regeneration system, DNA circuit.
Tx/Tl source: Bacterial.
Communication: Lactate enters by permeability or transport; output exits through a pore.
Readout: Measure fluorescence outside the vesicle with and without lactate.
Homework question from Peter Nguyen
A replaceable underarm textile patch with freeze-dried cell-free sensing chemistry that detects breast-cancer-associated sweat VOC patterns as an exploratory early-risk screening tool, producing a visible color change. :contentReference[oaicite:0]{index=0}
How it works: The patch would be embedded into the axillary region of a shirt and activated by sweat moisture during wear. The sensing layer would respond to a selected VOC proxy or small panel of sweat-associated metabolites linked to breast-cancer volatilomic signatures, generating a colorimetric readout visible on the fabric. This concept is exploratory rather than diagnostic, since current evidence supports altered sweat/VOC patterns in breast cancer but also shows major variability and the need for standardization and larger validation studies. :contentReference[oaicite:1]{index=1}
Need addressed: The idea targets the need for low-cost, noninvasive, wearable screening technologies that could complement—not replace—conventional breast-cancer detection. Current VOC research suggests promise for noninvasive screening, but not yet clinical readiness. :contentReference[oaicite:2]{index=2}
How to address cell-free limitations: The sensing module would be freeze-dried for storage stability, packaged as a replaceable one-time-use cartridge, and designed to activate only when hydrated by sweat. To reduce false positives, the patch would be framed as a research or screening-support device rather than a diagnostic tool, and future versions would likely need multiplexed sensing instead of relying on a single metabolite. :contentReference[oaicite:3]{index=3}
Relevant DOIs
10.3390/cancers15112939
10.1177/11772719221100709
10.1016/j.physbeh.2023.114307
Homework question from Ally Huang
Background: Long-term spaceflight causes bone loss because microgravity disrupts the balance between bone formation and bone resorption. This is significant for human health in space and for future long-duration missions. It is also scientifically interesting because bone loss reflects broader cellular stress and tissue adaptation under microgravity. :contentReference[oaicite:0]{index=0}
Relation to the challenge: CDKN1A/p21 has been reported to increase in bone under microgravity-associated conditions and is linked to osteogenic cell-cycle arrest. Detecting this target would provide a molecular readout connected to space-induced bone loss. :contentReference[oaicite:2]{index=2}
Hypothesis / goal: I hypothesize that a BioBits-based fluorescence assay can be used to detect a bone-loss-associated molecular marker relevant to microgravity stress. The goal is to create a simple proof-of-concept workflow in which a selected target sequence is amplified with miniPCR and linked to a fluorescent readout using BioBits and the P51 viewer. This would model how portable molecular tools could support astronaut health monitoring in resource-limited environments. :contentReference[oaicite:3]{index=3}
Experimental plan: I would test synthetic DNA samples representing negative, low, and high levels of the CDKN1A target, plus a no-template control. The target would be amplified with miniPCR, coupled to a BioBits fluorescence readout, and measured with the P51 viewer. The main data would be fluorescence intensity and signal-to-background differences across conditions. :contentReference[oaicite:4]{index=4}
Relevant DOIs
10.1371/journal.pone.0061372
10.1038/s41526-022-00194-8
Homework Part B: Individual Final Project
week-10-hw-imaging-and-measurement
Waters Part I — Molecular Weight
1) what is the calculated molecular weight?
Using the amino acid sequence provided in the assignment, I calculated the theoretical molecular weight of the construct with the ExPASy Compute pI/Mw tool.
and comparing the experimental value with the theoretical molecular weight from Question 1 (28,006.60 Da), the measurement error was 0.0813%.
3) Charge state of the zoomed-in peak
No, the charge state of the zoomed-in peak cannot be determined directly from the zoomed-in signal shown in Figure 1. To assign a charge state from a single zoomed peak, the isotopic peak spacing would need to be clearly resolved, because the spacing is approximately equal to 1/z. In this spectrum, the zoomed peak appears as a broad unresolved signal rather than a set of distinct isotopic peaks, so the spacing cannot be measured reliably. Therefore, the charge state must be inferred from adjacent charge-state peaks in the full envelope rather than from the zoomed-in peak itself.
Waters Part II — Secondary/Tertiary structure
1) Native vs denatured eGFP conformations
Native and denatured protein conformations differ in their degree of folding. In the native state, eGFP maintains a compact and folded three-dimensional structure. In the denatured state, the protein unfolds, exposing more of its amino acid side chains to the solvent. As a result, more protonatable sites become accessible during electrospray ionization, so the denatured protein acquires more charges than the native protein.
This difference can be detected by mass spectrometry through the charge-state distribution. A folded protein usually shows lower charge states because its compact structure limits protonation. In contrast, an unfolded protein shows higher charge states because more basic sites are exposed and can be protonated.
This pattern is visible in Figure 2. The denatured eGFP spectrum (top) displays a broad charge-state envelope with many peaks at lower m/z values, consistent with a highly charged, unfolded protein population. By contrast, the native eGFP spectrum (bottom) shows a much narrower distribution with fewer peaks at higher m/z values, indicating lower charge states and a more compact folded structure.
Overall, the main spectral difference is that denatured eGFP appears with higher charge states and a broader distribution, whereas native eGFP appears with lower charge states and a narrower distribution, consistent with retention of its folded conformation.
2) Charge state of the native peak near 2800 m/z
Yes, the charge state of the peak near 2800 m/z can be assigned as +10.
This can be determined because native eGFP has an intact mass of about 28 kDa, so a peak near 2800 m/z is consistent with a species carrying about 10 charges:
charge state ≈ MW / (m/z) charge state ≈ 28000 / 2800 charge state ≈ 10
This assignment is also consistent with the neighboring native peaks, which form a low-charge distribution typical of a compact, folded protein. In native MS, folded proteins usually retain fewer charges, so peaks appear at higher m/z values than in the denatured spectrum.
Waters Part III — Peptide Mapping - primary structure
1) Lysines and arginines in eGFP
The eGFP sequence contains:
20 Lysines (K)
6 Arginines (R)
These residues are important because trypsin cleaves on the C-terminal side of K and R, so they define the expected peptide fragments in a tryptic digest.
2) Number of peptides generated by tryptic digestion of eGFP
Using trypsin as the protease, the eGFP sequence is predicted to generate 27 peptides.
This is consistent with trypsin cleaving after lysine (K) and arginine (R) residues in the sequence.
3) Number of chromatographic peaks in the eGFP peptide map
Between 0.5 and 6.0 minutes, I observe approximately 16 chromatographic peaks with greater than 10% relative abundance in the eGFP peptide map.
Because this is based on visual inspection of the TIC, the exact count may vary slightly depending on how partially resolved shoulders are interpreted.
4) Comparison between observed and predicted peptide counts
No, the number of chromatographic peaks does not match the number of peptides predicted from Question 2. The chromatogram shows fewer peaks than the 27 peptides predicted from the tryptic digest.
This difference is expected because not every predicted peptide is necessarily detected as a clear chromatographic peak. Some peptides may be too small, too low in abundance, poorly ionized, or may co-elute with other peptides.
5) Peptide m/z, charge state, and singly charged mass
The most abundant peptide peak is observed at m/z 525.7671.
The isotope spacing is approximately 0.5 m/z (for example, from 525.7671 to 526.2592), which indicates a charge state of z = 2, since isotopic spacing is approximately 1/z.
Using this charge state, the singly charged form of the peptide was calculated as:
[M+H]+ = 1050.53
This is also consistent with the peak observed near m/z 1050.5244 in the spectrum.
6) Peptide identification and mass accuracy
Based on comparison with the expected tryptic peptide masses in PeptideMass, the peptide is FEGDTLVNR.
The experimental singly charged mass was m/z 1050.5244 and the theoretical mass for [M+H]+ of FEGDTLVNR is 1050.5214.
Therefore, the measurement error is approximately 2.8 ppm.
7) Sequence coverage confirmed by peptide mapping
The peptide mapping data confirms 88% of the eGFP sequence.
Waters Part IV — Oligomers
1) KLH oligomer assignments
Using the subunit masses from Table 1:
7FU = 340 kDa
8FU = 400 kDa
the expected oligomer masses are:
7FU decamer = 10 × 340 kDa = 3.4 MDa
8FU didecamer = 20 × 400 kDa = 8.0 MDa
8FU 3-decamer = 30 × 400 kDa = 12.0 MDa
8FU 4-decamer = 40 × 400 kDa = 16.0 MDa
Waters Part V — Did I make GFP?
Theoretical
Observed/measured on the Intact LC-MS
PPM Mass Error
Molecular weight (kDa)
28.0066
27.9838
812.7 ppm
week-11-hw-building-genomes
Part B: Cell-Free Protein Synthesis | Cell-Free Reagents
Referencing the cell-free protein synthesis reaction composition (the middle box outlined in yellow on the image above, also listed below), provide a 1-2 sentence description of what each component’s role is in the cell-free reaction.
1.1 E. coli Lysate
* BL21 (DE3) Star Lysate: Provides the essential molecular machinery, including ribosomes and translation factors, while the T7 RNA Polymerase drives the transcription of DNA into mRNA.
1.2 Salts/Buffer
* Potassium & Magnesium Glutamate: Essential for maintaining ionic balance; Magnesium specifically acts as a cofactor for ribosome stability and enzymatic functions.
* HEPES-KOH (pH 7.5) & Potassium Phosphates: Act as buffering agents to stabilize the pH, ensuring an optimal environment for biochemical reactions.
1.3 Energy / Nucleotide System
* Ribose & Glucose: Serve as carbon sources and secondary energy substrates to power the regeneration of ATP within the system.
* AMP, CMP, GMP, UMP & Guanine: These are the fundamental nucleotide building blocks required for the synthesis of mRNA during the transcription phase.
1.4 Translation Mix (Amino Acids)
* 17 Amino Acid Mix, Tyrosine & Cysteine: These are the primary monomers or “building blocks” that are polymerized to form the specific protein sequence.
1.5 Additives
* Nicotinamide: Helps maintain metabolic flux and prevents the degradation of key energy cofactors like NAD+.
1.6 Backfill
* Nuclease-Free Water: Used to adjust the reaction to its final volume while ensuring the absence of enzymes that could degrade DNA or RNA templates.
Main Differences (PEP-NTP vs. NMP-Ribose-Glucose)
The 1-hour PEP-NTP mix uses high-energy PEP and direct NTPs for immediate, rapid protein synthesis, whereas the 20-hour mix relies on slower, sustainable energy regeneration from Ribose and Glucose using NMPs. This shift from “ready-to-use” fuels to “precursor-based” metabolism allows the 20-hour system to maintain reaction stability for a significantly longer duration.
Bonus Question: Transcription without GMP
Transcription can still occur because the cell-free lysate contains endogenous enzymes (such as phosphoribosyltransferases) that can salvage Guanine by attaching it to a ribose-phosphate provider. This pathway converts the free Guanine base into GMP and subsequently into the GTP required by the RNA polymerase to build the mRNA strand.
Part C: Planning the Global Experiment | Cell-Free Master Mix Design
Properties of Fluorescent Proteins in Cell-Free Systems
1.1 sfGFP (superfolder GFP): Known for its exceptionally fast folding and high stability, which allows for rapid detection and high expression levels even in robust cell-free environments.
1.2 mRFP1: This protein has a relatively slow maturation time and lower photostability compared to newer variants, which can lead to a delayed or weaker signal readout during the reaction.
1.3 mKO2: It is highly bright and has fast maturation, but like many orange/red proteins, its fluorescence can be sensitive to the pH levels maintained by the buffer system.
1.4 mTurquoise2: Characterized by its high quantum yield and superior photostability, providing a very bright and consistent signal that is ideal for precise quantitative readouts.
1.5 mScarlet-I: One of the brightest red fluorescent proteins available, it features a fast maturation rate that is specifically optimized for efficient folding in various expression systems.
1.6 Electra2: Designed for high photostability and rapid maturation, making it particularly effective for real-time monitoring of protein synthesis in long-duration cell-free reactions.
Hypothesis for Improving Long-Term Fluorescence
Protein: Electra2
Reagent(s) Adjustment: Increase the initial concentration of Glucose and Nicotinamide in the master mix.
Expected Effect: By increasing these reagents, we enhance the secondary energy regeneration pathway, ensuring a steady ATP supply over the full 36-hour period. Combined with Electra2’s inherent rapid maturation and high photostability, this sustained energy flux will maximize the number of correctly folded fluorescent molecules throughout the entire reaction duration, maintaining a strong and consistent fluorescence signal without the reaction running out of fuel prematurely.
Final Phase Reaction Protocol
The final reaction will consist of a 20 µL total volume, incorporating 2 µL of custom reagent supplements. My experimental goal will be to use these 2 µL to deliver the adjusted concentrations of Glucose and Nicotinamide proposed in my hypothesis, maximizing ATP availability throughout the full 36-hour period to support Electra2’s rapid maturation and maintain consistent fluorescence signal over the entire reaction duration.
Reagent Roles & Hypothesis**
My project focuses on extending the protein synthesis reaction from 20 to 36 hours.
RAC-15 (Preparation): Used for the high-precision addition of the 2 µL custom supplements (Glucose/Nicotinamide) into the master mix.
RAC-16 (Incubator): Dedicated to maintaining a stable thermal environment for the entire 36-hour duration.
Lunatic (Analysis): Integrated into the loop to perform real-time fluorescence measurements without interrupting the experiment.
Workflow Logic: The circular Magnum Motion track allows for an automated, iterative cycle. Samples move from incubation (RAC-16) to measurement (Lunatic) and back to incubation without manual intervention or thermal shock. This ‘Infinite Loop’ design is critical for documenting the full 36-hour fluorescence curve and proving that the increased ATP availability from the adjusted reagents maximizes Electra2’s fluorescence output throughout the entire reaction duration.
Conclusion and Scalability:
The primary advantage of this automated circular design is its capacity for High-Throughput Screening (HTS). Beyond simple monitoring, the RAC-15 can be programmed to dispense a gradient of different Glucose and Nicotinamide concentrations across a single 96-well plate. By cycling this plate through the Lunatic every hour, the system will simultaneously characterize multiple experimental conditions. This allows us to identify the precise “sweet spot” for protein yield and maturation over the 36-hour window in a single, autonomous run.
FUS-Controlled Unidirectional Iron Sequestration in E. coli Nissle 1917 for Tumor Metabolic Collapse SECTION 1: ABSTRACT Solid tumors establish a metabolically distinct microenvironment (TME) characterized by hypoxia and necrosis—conditions that selectively favor the colonization of E. coli Nissle 1917 (EcN) (Stritzker et al., 2007). Once established, the bacteria encounter a niche defined by elevated lactate levels (Pérez-Tomás & Pérez-Guillén, 2020) and an intense demand for iron by cancer cells. While EcN typically upregulates enterobactin biosynthesis to compete for these resources, the host protein Lipocalin-2 neutralizes this siderophore, effectively limiting bacterial iron scavenging (Huang et al., 2024). This project engineers EcN to produce salmochelin—a Lipocalin-2-resistant siderophore (Fischbach et al., 2006) encoded by the iroBCDE/iroN locus, which is a key determinant of EcN’s competitive survival in iron-restricted environments (Massip et al., 2019). To implement this therapeutic logic, a FUS-controlled genetic circuit was designed in Asimov Kernel and digitally assembled in Benchling using the native pMUT2 backbone of EcN (CP023342.1). The circuit integrates a thermal activation cassette (TlpA39C/pTlpA) triggered by Focused Ultrasound, a lactate-gated lysis kill switch (BBa_K3848004) for tumor-specific biocontainment, and dual sRNA effectors targeting fur and iroN to drive unidirectional iron sequestration, that depletes the tumor’s labile iron pool, inducing cancer cell metabolic collapse (Pinnix et al., 2010; Saha et al., 2019). Boolean circuit logic was computationally simulated in Python and the complete 10,114 bp therapeutic vector was assembled in silico via Gibson Assembly at the s2 intergenic site of pMUT2, ensuring antibiotic-free stability through the endogenous RelB/RelE toxin-antitoxin system (Kan et al., 2021).
FUS-Controlled Unidirectional Iron Sequestration in E. coli Nissle 1917 for Tumor Metabolic Collapse
SECTION 1: ABSTRACT
Solid tumors establish a metabolically distinct microenvironment (TME) characterized by hypoxia and necrosis—conditions that selectively favor the colonization of E. coli Nissle 1917 (EcN) (Stritzker et al., 2007). Once established, the bacteria encounter a niche defined by elevated lactate levels (Pérez-Tomás & Pérez-Guillén, 2020) and an intense demand for iron by cancer cells. While EcN typically upregulates enterobactin biosynthesis to compete for these resources, the host protein Lipocalin-2 neutralizes this siderophore, effectively limiting bacterial iron scavenging (Huang et al., 2024). This project engineers EcN to produce salmochelin—a Lipocalin-2-resistant siderophore (Fischbach et al., 2006) encoded by the iroBCDE/iroN locus, which is a key determinant of EcN’s competitive survival in iron-restricted environments (Massip et al., 2019). To implement this therapeutic logic, a FUS-controlled genetic circuit was designed in Asimov Kernel and digitally assembled in Benchling using the native pMUT2 backbone of EcN (CP023342.1). The circuit integrates a thermal activation cassette (TlpA39C/pTlpA) triggered by Focused Ultrasound, a lactate-gated lysis kill switch (BBa_K3848004) for tumor-specific biocontainment, and dual sRNA effectors targeting fur and iroN to drive unidirectional iron sequestration, that depletes the tumor’s labile iron pool, inducing cancer cell metabolic collapse (Pinnix et al., 2010; Saha et al., 2019). Boolean circuit logic was computationally simulated in Python and the complete 10,114 bp therapeutic vector was assembled in silico via Gibson Assembly at the s2 intergenic site of pMUT2, ensuring antibiotic-free stability through the endogenous RelB/RelE toxin-antitoxin system (Kan et al., 2021).
SECTION 2: PROJECT AIMS
Aim 1 — Experimental Aim (This Project)
To design and computationally validate a genetic circuit in E. coli Nissle 1917, using Focused Ultrasound (FUS) as a remote thermal trigger to control dual sRNA-mediated iron sequestration, integrating a lactate-gated kill switch and antibiotic-free stability.
Aim 2 — Development Aim
To experimentally validate the therapeutic circuit by constructing and transforming the pMUT2-based plasmid into EcN, and quantifying iron sequestration efficiency through bacterial-cancer cell co-culture assays (e.g., HT-29 or CT26 lines). This will be performed under simulated TME conditions, using ΔFur and ΔiroN isogenic mutants as controls to define the optimal FUS duty cycle for cumulative tumor iron depletion.
Aim 3 — Visionary Aim
To deploy the validated therapeutic EcN as a Bacteria-Based Cancer Therapy (BBCT) for the treatment of solid tumors, leveraging tumor-selective colonization and physician-controlled FUS activation to achieve unidirectional iron sequestration across multiple tumor types and administration routes.
SECTION 3: BACKGROUND
Literature Context
Pita-Grisanti et al. (2023) / Torti & Torti (2013): Characterized the metabolic “iron addiction” of malignant cells, where tumors upregulate iron-binding import machinery (e.g., Transferrin receptor, Lipocalin-2) and downregulate the exporter ferroportin to drive proliferation. While exogenous iron chelation via bacterial siderophores triggers tumor metabolic collapse and p53/Bax-mediated apoptosis, traditional systemic treatments yield inconsistent clinical outcomes and severe, dose-limiting off-target toxicities due to a lack of spatial selectivity.
Stritzker et al. (2007): Evaluated tumor-specific colonization profiles, demonstrating that systemic administration of the probiotic Escherichia coli Nissle 1917 (EcN) results in exceptional intratumoral replication (>= 1 x 10^8 CFU/g tissue) specifically targeting the border of viable and necrotic tumor zones, without colonizing healthy organs like the liver or spleen. This innate, high-density tumor tropism solves the historical challenge of systemic chelation toxicity highlighted by Pita-Grisanti et al., validating EcN as an ideal localized cellular chassis to restrict aggressive iron starvation exclusively to the malignant microenvironment.
This research directly justifies the therapeutic rationale of iron sequestration as a selective anticancer strategy. By identifying this metabolic dependency, the authors provide the biological basis for intercepting iron trafficking to collapse tumor function.
Novelty and Innovation
While iron-chelating siderophores have been proposed as anticancer agents (Saha et al., 2019), and FUS has been used to activate thermal bioswitches in bacteria (Piraner et al., 2017), no prior design has combined FUS-controlled sRNA-mediated iron sequestration with simultaneous biocontainment in a single antibiotic-free plasmid system. This project introduces a multi-layered therapeutic paradigm for bacteria-based cancer therapy by integrating physical, metabolic, and genetic control systems into a single antibiotic-free platform. The core innovations comprise:
Unidirectional Siderophore Trap: A dual-targeting sRNA system simultaneously silences fur and iroN mRNAs. Knockdown of the Ferric Uptake Regulator (fur) constitutively desrepresses the iroA and ent operons to maximize salmochelin and enterobactin secretion, while the concurrent iroN blockade prevents iron re-import, rendering the chelated iron permanently inaccessible in the extracellular space, thereby starving the tumor microenvironment while preventing intracellular oxidative stress in EcN (Figure S1).
Boolean AND-Gate Activation: Precise spatial targeting pairs a Focused Ultrasound (FUS)-activated TlpA39C thermal gate—transitioning from its subcutaneous proof-of-concept [Piraner et al., 2017] to deep tissues—with an endogenous lactate-gated kill switch, restricting circuit expression strictly to the lactate-rich TME.
Clinical-Grade Biocontainment: The circuit is encoded on the native pMUT2 plasmid of E. coli Nissle 1917, stably maintained without antibiotic selection pressure via the endogenous RelB/RelE toxin-antitoxin system.
Compartmentalized Delivery: Translational scope extends beyond intravenous limits through route-specific biomaterials—degradable PLGA seeds for breast/prostate and mucoadhesive hydrogels for cervical/colorectal cancers—enabling localized administration without systemic bacterial dissemination.
Why This Project Matters
The Problem Addressed: Treatment-resistant solid tumors remain the leading cause of oncological mortality, with breast, colorectal, prostate, and cervical cancers accounting for over 2 million deaths annually (Bray et al., 2024). Conventional systemic therapies fail to eradicate these malignancies due to poor penetration into the dense, avascular tumor core and severe dose-limiting toxicities in healthy peripheral tissues.
Importance of the Problem and Critical Barriers: Neoplastic cells exhibit an aggressive “iron addiction,” selectively upregulating iron-binding import machinery to fuel rapid proliferation, DNA replication, and mitochondrial respiration (Liang & Ferrara, 2021). While exogenous iron chelation via traditional siderophores (e.g., enterobactin) has been validated to arrest cancer growth, its clinical translation represents a critical barrier due to low therapeutic efficacy and systemic off-target toxicities (Pita-Grisanti et al., 2023).
Advancement of Knowledge and Technical Capability: This project bypasses these historical delivery barriers by engineering E. coli Nissle 1917 (EcN) as a “Trojan Horse” that exploits innate tumor tropism to infiltrate the necrotic malignant core (Stritzker et al., 2007; Figure S2). We advance current genetic engineering capabilities by implementing a multi-layered “Passcode” logic architecture—inspired by Chan et al. (2016)—that pairs a physician-controlled Focused Ultrasound (FUS) thermal gate with an endogenous lactate-sensing kill switch. This Boolean AND-gate establishes an absolute biocontainment mechanism that prevents environmental escape and ensures that the engineered metabolic iron sink is activated strictly within the biochemical parameters of the tumor microenvironment (TME).
Field-Level Change and Paradigm Shift: If the aims are achieved, this research will shift the paradigm of bacteriotherapy from passive bacterial colonization to an active, precision-programmable living drug platform. Unlike existing optogenetic or chemical activation systems that cannot penetrate deep human tissues, the integration of clinically approved FUS provides millimeter-precision spatiotemporal control at depth (Piraner et al., 2017). Furthermore, the entire circuit operates on an antibiotic-free native plasmid system (Kan et al., 2021), proving that complex logic gates can be stably maintained in vivo without contributing to the global threat of antimicrobial resistance.
Broader Societal Contribution: On a societal scale, transitioning cancer treatment from systemic, high-toxicity chemotherapy to localized, autonomous microbial circuits could drastically reduce patient hospitalization rates, eliminate chemotherapy-related side effects, and provide an affordable, scalable option for refractory solid tumors worldwide.
Ethical Implications
The primary ethical principles governing this project are non-maleficence (preventing harm to the patient and the environment) and beneficence (providing a new treatment option for patients with limited alternatives). The most significant ethical concern is dual use: the same thermosensitive repressor (TlpA39C) and lactate sensor (LldR) that enable tumor-selective activation could theoretically be used to engineer pathogens that activate only within specific host thermal or metabolic environments. Responsible disclosure and selective publication of circuit performance data — particularly the exact thermal threshold and lactate concentrations at which each gate switches — are essential safeguards. Additionally, the use of a genetically modified organism with a kill switch does not eliminate all biocontainment risk: kill switches are known to fail through plasmid loss or loss-of-function mutations in toxin genes (Chan et al. 2016), and chromosomal integration is necessary for clinical-grade biocontainment.
Measures to ensure ethical conduct include: (1) all experiments with EcN in live animals must follow IACUC protocols with appropriate biosafety level (BSL-2) containment; (2) the kill switch must be validated for mutational escape frequency before any in vivo administration; (3) the project should engage regulatory review from the outset (ISP in Chile, FDA in the US) to establish safety criteria for engineered salmochelin-producing organisms; (4) equity considerations require that E. coli Nissle 1917 be used as the chassis — it is a probiotic with an established safety record and low-cost production profile, making future access possible for patients in developing regions. The ethical justification for using EcN as a delivery platform is further strengthened by recent clinical evidence (Gurbatri et al., 2024), which demonstrated that oral administration of EcN leads to selective colonization of tumor tissue in human colorectal cancer patients without significant adverse effects.
However, several unintended consequences and incorrect assumptions must be acknowledged. A critical unintended consequence is kill switch failure through loss-of-function mutations in the toxin genes or plasmid loss — if the lactate-gated lysis system fails, EcN could persist in healthy tissue post-therapy, raising significant safety concerns. A potentially incorrect assumption is that all targeted tumor subtypes maintain sufficient lactate concentrations to keep the bacteria viable within the TME, which could prematurely trigger the kill switch and compromise therapeutic efficacy. An alternative to the plasmid-based kill switch is chromosomal integration of the biocontainment system, which would eliminate plasmid loss as a failure mode and provide clinical-grade biocontainment, albeit at the cost of reduced modularity and more complex genetic engineering.
SECTION 4: EXPERIMENTAL DESIGN, TECHNIQUES, TOOLS, AND TECHNOLOGY
This section describes the experimental design, tools, and technologies employed across the three aims of this project. Aim 1 constitutes the core experimental work of this project — encompassing computational circuit design, in silico plasmid assembly, and Boolean logic simulation. Aims 2 and 3 define the development and translational roadmap required to advance the therapeutic circuit from computational validation to experimental characterization and clinical deployment. Each aim is described in terms of its experimental rationale, methodology, and the specific tools and technologies employed.
4.1 Aim 1: Genetic Circuit Design and Validation
Aim 1.1 — Circuit Design and Plasmid Assembly: The therapeutic circuit was designed in Asimov Kernel and digitally assembled in Benchling via simulated Gibson Assembly at the s2 intergenic site of the native pMUT2 backbone (CP023342.1), generating a 10,114 bp therapeutic vector. The design integrates two independent functional modules: a FUS-controlled thermal activation cassette (BBa_K4233038 -> BBa_K2447011) driving dual sRNA effectors targeting fur and iroN to promote unidirectional iron sequestration, and a lactate-gated kill switch (BBa_K3848004) for biocontainment. The 24nt antisense sequences were derived from the EcN genome (NZ_CP007799.1) — fur (position 757641–758087, minus strand) and iroN (position 1171492–1173669, plus strand) — and fused to a MicC scaffold (Na et al., 2013) for Hfq-mediated silencing. The pMUT2 backbone sequence was extracted from NCBI (CP023342.1), providing a ColE2-like origin of replication and endogenous RelB/RelE toxin-antitoxin system that ensures antibiotic-free plasmid stability (Kan et al., 2021). Specifically, the anti-Fur sRNA derepresses the endogenous ent and iro operons (entABCDEFH and iroBCDEN), promoting enterobactin biosynthesis and its IroB-mediated glucosylation to produce salmochelin — a Lipocalin-2-resistant siderophore that sequesters extracellular Fe3+ with higher affinity (Table S1). Simultaneously, the anti-IroN sRNA silences the outer membrane reimporter, preventing recovery of the ferric-salmochelin complex by the bacteria and creating a unidirectional iron trap that depletes the tumor extracellular labile iron pool.
Aim 1.2 — Computational Logic Validation: Circuit logic was validated computationally in Python using Hill function modeling of the thermal gate transfer function (k=60, x0=0.70, ~39°C) and kill switch sigmoid response (k=12, x0=0.35, ~10–12 mM lactate), confirming Boolean AND gate behavior — full therapeutic activation occurs exclusively when FUS is applied within the TME where lactate exceeds the kill switch threshold. Results are reported as normalized transfer functions across all four Boolean input states.
4.2 Aim 2: Experimental Validation and Therapeutic Characterization
The experimental validation of the therapeutic circuit requires four sequential phases, each building on the results of the previous one. The detailed activities, estimated costs, and execution timeline for these phases are summarized in Table 1.
Aim 2.1 — Physical Assembly and Thermal Gate Validation: The 10,114 bp therapeutic vector (pMUT2-FUS-KillSwitch-asRNA) will be physically assembled via Gibson Assembly, integrating the 4.6 kb synthetic insert into the s2 intergenic site of the pMUT2 backbone as specified in the Benchling reference. Following electroporation into EcN DpMUT2 and sequence verification, the TlpA39C/pTlpA thermal gate will be characterized via GFP fluorescence kinetics. We will determine the thermal activation threshold under a graduated stress (37°C to 42°C) to verify if the physical chassis replicates the Hill function model (x0=0.70, ~39°C) computationally simulated in Aim 1.2. Additionally, sRNA transcriptional activation will be directly quantified via stem-loop RT-qPCR under pulsed FUS ex vivo, comparing 37°C versus >=39°C thermal thresholds, to confirm that TlpA39C derepression leads to effective anti-Fur and anti-IroN sRNA expression above the thermal gate.
Aim 2.2 — Characterization of Salmochelin Production and Metabolic Remodeling Validation: Salmochelin biosynthesis will be quantified under simulated TME conditions—hypoxia (1% O2) and exogenous lactate (10–12 mM)—using the Chrome Azurol S (CAS) assay for quantitative siderophore detection. This phase validates the metabolic remodeling described by Salvail et al. (2010), where sRNA-mediated regulation optimizes siderophore production by redirecting metabolic flux—specifically redirecting serine building blocks from cysteine biosynthesis toward the nonribosomal peptide synthesis (NRPS) pathway for enterobactin/salmochelin assembly. To isolate the specific contribution of the dual sRNA effectors (anti-fur and anti-iroN) designed in Aim 1.1, we will compare the FUS-induced EcN against Dfur and DiroN isogenic mutants, constructed via CRISPR-Cas9 or Lambda Red recombineering. This phase establishes the ‘secretion ceiling’ by normalizing production rates by OD600/CFU, ensuring that the sRNA-induced metabolic optimization reaches competitive levels of iron sequestration comparable to constitutive genetic deletions.
Aim 2.3 — Competitive Co-culture, LIP Depletion, and Biocontainment Validation: Iron depletion efficacy is assessed in bacterial-cancer cell co-culture assays using HT-29 or CT26 lines. To simulate the continuous iron-recycling role of M2 macrophages (Liang & Ferrara, 2021), the TME will be challenged with calibrated pulses of 25 uM Ferric Citrate every 4 hours (at T0, T4, and T8) over a 12-hour observation window (Sohn et al., 2010). Ferric Citrate is selected due to its physiological relevance and low stability constant (log K approx 11.85), as characterized by Szlasa et al. (2022), ensuring a steady supply of bioavailable iron for competitive uptake. This experimental setup creates a dynamic competitive environment where the rate of bacterial sequestration must exceed the exogenous iron influx to prevent cancer cell uptake. Intracellular Labile Iron Pool (LIP) depletion will be measured via calcein fluorescence recovery, with data fitted to a Hill equation model to calculate the fold induction and the EC50 required to achieve cancer cell metabolic collapse under competitive pressure. Crucially, as cancer cell death leads to a reduction in exogenous lactate levels, the corresponding activation of the lactate-gated lysis kill switch will be monitored. Bacterial viability (CFU/mL) will be quantified post-therapeutic effect to validate that the depletion of the tumor-derived lactate signal successfully induces chassis biocontainment once the metabolic mission is complete.
Aim 2.4 — Characterization of Pulsatile Duty Cycles and Stress Robustness: This sub-aim defines the operational limits of the genetic circuit. We will quantify the ‘Time-to-Collapse’ of the bacterial chassis under therapeutic activation by exposing FUS-induced EcN to TME-simulated oxidative stress (H2O2 50–500 uM; Seaver & Imlay, 2001). Based on the regulatory feed-forward loop described by Semsey (2014), the circuit-induced silencing of fur derepresses the endogenous RyhB sRNA, which in turn represses the iron-dependent superoxide dismutase SodB (Massé & Gottesman, 2002), increasing ROS sensitivity under therapeutic activation. We will validate if 100 uM Mn2+ supplementation rescues viability by supporting SodA (Mn-SOD) activity (Privalle & Fridovich, 1988), establishing the optimal ON/OFF duty cycle required to maintain a negative iron balance in the TME without reaching the bacterial lethal threshold.
Expected Results Aim 2
The execution of Aim 2 is expected to demonstrate a high-fidelity correlation between computational design and experimental performance. In Aim 2.1, a sigmoidal GFP induction matching the Hill model x0=0.70 will confirm thermal gate precision. Aim 2.2 will show that FUS-induced EcN achieves salmochelin secretion rates per cell (normalized by OD600) comparable to the Dfur ceiling; crucially, the unidirectional trap will be validated by the extracellular accumulation of the ferric-salmochelin complex, mimicking the DiroN phenotype. In Aim 2.3, co-culture assays will show calcein fluorescence recovery in HT-29/CT26 cells, proving the sink outcompetes cancer iron uptake even under 25 uM ferric citrate pulses, followed by bacterial lysis upon lactate depletion. Finally, Aim 2.4 will establish the bacterial ‘Time-to-Collapse’ via Live/Dead kinetic assays using SYTO 9 and propidium iodide fluorescence in a plate reader, with parallel CFU/mL counts at defined time intervals, under H2O2 stress (50–500 uM). This collapse threshold defines the maximum FUS pulse duration — the window within which EcN must sequester sufficient iron to drive cancer cell metabolic collapse before ROS-induced bacterial death terminates the therapeutic effect. Mn2+ rescue experiments will confirm whether SodA activity can extend this operational window, enabling optimization of the ON/OFF duty cycle for cumulative iron depletion across multiple therapeutic sessions.
4.3 Aim 3: Visionary Deployment as Siderophore-Driven Bacteria-Based Cancer Therapy
To develop a highly effective and safe cancer therapy in humans using engineered iron-chelating bacteria deployed across four tumor types through route-specific local administration.
Aim 3.1 — Develop Specialized Delivery Platforms: Three route-specific delivery matrices will be developed and characterized. For breast and prostate cancer, degradable polymeric PLGA seeds will be fabricated and implanted via ultrasound-guided needle. For cervical cancer, a mucoadhesive vaginal gel will be formulated for topical application and for colorectal cancer, a mucoadhesive gel will be deposited directly onto the tumor site via colonoscopy.
PLGA Seeds (breast and prostate): PLGA seeds will be fabricated as cylindrical implants of approximately 0.8mm diameter by extrusion or micro-molding, compatible with standard implantation needle gauge used in clinical protocols. Multiple seeds will be implanted per session to ensure adequate spatial coverage of the tumor volume. EcN will be incorporated into the PLGA matrix during fabrication, and seed morphology and integrity will be confirmed by SEM prior to use. To characterize matrix degradation and validate tumor colonization, a dual-phase protocol will be executed. In vitro, PLGA seeds will be incubated in PBS at 37°C; polymer erosion and pore morphology will be evaluated via gravimetric mass loss and scanning electron microscopy (SEM) at defined timepoints (T0, T6, T12, T24, T48h), while viable bacterial release kinetics will be quantified by CFU counting on LB agar. In vivo, seeds will be intratumorally implanted into murine solid tumor models. Tumor colonization efficiency and spatial distribution within necrotic cores will be determined via histological Gram staining and quantitative CFU counts per gram of tumor tissue, while systemic biosafety will be confirmed by monitoring bacterial clearance in healthy off-target organs.
Mucoadhesive Gels (cervical and colorectal): Mucoadhesive gels will be formulated using biocompatible polymers such as chitosan or carbopol, optimized for viscosity and adhesion to mucosal surfaces. For cervical cancer, the gel will be designed for topical vaginal application. For colorectal cancer, the gel will be deposited directly onto the tumor site via colonoscopy using an open-channel spray catheter or endoscopic delivery catheter compatible with high-viscosity formulations. To characterize matrix performance and validate tumor colonization, a dual-phase protocol will be executed. In vitro, bacterial release kinetics will be characterized by depositing the gel in a two-compartment diffusion chamber with a semipermeable membrane simulating mucosal tissue. CFU will be quantified in the receptor compartment at defined timepoints (T0, T6, T12, T24, T48h). Mucosal penetration depth will be additionally assessed by confocal microscopy of fluorescently labeled EcN in ex vivo tissue sections. In vivo, gels will be administered to murine tumor models via their respective routes. Tumor colonization efficiency and spatial distribution will be confirmed by histological Gram staining and quantitative CFU counts per gram of tumor tissue, while systemic biosafety will be assessed by monitoring bacterial clearance in healthy off-target organs.
Post-encapsulation Viability: To confirm that the encapsulation process does not compromise bacterial fitness prior to in vivo deployment, post-encapsulation viability will be assessed for all three delivery matrices. CFU counts will be compared before and after encapsulation to quantify viable bacterial recovery. Growth curves of encapsulated versus free EcN will be measured under identical culture conditions (LB medium, 37°C, 200 rpm) to assess whether encapsulation affects growth kinetics. Additionally, plasmid retention will be confirmed by differential plating to verify the endogenous addiction system, ensuring that pMUT2 stability is maintained throughout the encapsulation process without the use of antibiotic selection pressure.
Aim 3.2 — Comparative Efficacy & Safety: Therapeutic efficacy and safety will be validated across four tumor types in human clinical settings using route-specific delivery protocols. For each indication, EcN will be administered via its corresponding delivery matrix — PLGA seeds for breast and prostate, mucoadhesive vaginal gel for cervical, and colonoscopic mucoadhesive gel for colorectal — followed by a colonization window and physician-controlled pulsed FUS activation. The primary clinical endpoint is >= 80% labile iron pool depletion within the tumor, triggering metabolic collapse and arrest of tumor cell proliferation without systemic iron depletion or off-target toxicity. Secondary endpoints include tumor volume reduction, patient tolerability, and absence of systemic bacterial dissemination. The long-term vision is to establish this platform as a physician-controlled, antibiotic-free, route-specific bacteria-based cancer therapy applicable across multiple solid tumor types, offering a non-toxic alternative to systemic iron chelation with minimal invasiveness and maximum tumor selectivity.
4.4 Techniques Checklist
4.5 Expanded Technique Description
Gibson Assembly: This is the core cloning strategy employed in this project to physically construct the 10,114 bp therapeutic vector pMUT2-FUS-KillSwitch-asRNA. The 4.6 kb synthetic insert — comprising four insulated transcriptional cassettes (TlpA39C thermal gate, lactate-gated kill switch, anti-Fur sRNA, and anti-IroN sRNA) — will be assembled into the s2 intergenic site of the native pMUT2 backbone, using primers designed with 30–40 bp homology overhangs at each junction. The assembled vector will be transformed into EcN DpMUT2 by electroporation, and successful assembly confirmed by colony PCR and Sanger sequencing across all four cassette junctions.
Benchling: This platform was used as the primary platform for in silico plasmid design and annotation of the therapeutic vector. The native pMUT2 backbone sequence (CP023342.1) was imported from NCBI and the s2 intergenic insertion site identified based on Kan et al. (2021). All four transcriptional cassettes were sequentially annotated, and Gibson Assembly primers were designed directly within Benchling, verifying homology overhang lengths, melting temperatures, and correct cassette orientation before any physical cloning was attempted. The final annotated plasmid map reported in the Results section of this project was generated and exported from Benchling.
4.6 Industry Council Companies
Asimov (Kernel): Used directly for the in silico design, simulation, and cellular logic modeling of the genetic circuit in Aim 1.1.
Twist Bioscience: Used for the high-fidelity de novo DNA synthesis of the 4.6 kb insert comprising the four insulated transcriptional cassettes.
Addgene: Used as the non-profit academic repository to acquire the physical pMUT2-based backbone vector from Kan et al. (2021) for use as the cloning backbone in Aim 2.
New England Biolabs: Provider of the NEBuilder HiFi DNA Assembly Master Mix, restriction enzymes, and Q5 High-Fidelity DNA Polymerase required for physical vector construction.
Thermo Fisher Scientific: Provider of electroporation cuvettes, cell culture media for human cancer lines, DNA purification kits, and Calcein-AM fluorescent probes for the intracellular LIP assay.
Millipore Sigma: Provider of basic microbiological reagents, LB medium, and chemical components required for the CAS assay and hydrogen peroxide H2O2 oxidative stress trials.
SECTION 5: RESULTS & QUANTITATIVE EXPECTATIONS
5.1 Genetic Circuit Design and Computational Logic Validation
The circuit comprises two independent cassettes (Figure 1). The first is a thermal activation cassette in which TlpA39C autorepressor (BBa_K4233038 - pTlpA2-RBS-TlpA39C) controls transcription through pTlpA (BBa_K2447011 - Temperature sensitive promoter pTlpA), driving GFP expression (BBa_E0040) as fluorescent output for the computational simulation of the thermal gate transfer function. The second is a lactate-gated lysis kill switch (BBa_K3848004) for biocontainment, which operates via an asymmetric holin-antiholin toxin-antitoxin system. In the presence of lactate — as found in the tumor microenvironment — a lactate-sensitive promoter drives expression of antiholin and cI repressor, the latter blocking transcription of the lytic cassette encoding holin and endolysin. Upon exit from the TME and consequent lactate depletion, cI repressor is rapidly degraded via its LVA degradation tag, derepressing holin and endolysin expression. Holin perforates the inner membrane, allowing endolysin to degrade the cell wall, inducing complete bacterial lysis within approximately 20 minutes. The asymmetric RBS design — medium strength for antiholin/cI and strong for holin/endolysin — ensures rapid and irreversible lysis upon TME exit, preventing environmental escape. Circuit logic was designed in Asimov Kernel and the Boolean transfer function was computationally simulated in Python, confirming the expected multi-input logic gate outputs across all physiological conditions (Table 2).
5.2 Plasmid Design for FUS-Controlled Fur and IroN Silencing and Iron Sequestration in EcN
The computational validation of the thermal gate transfer function in Section 5.1 establishes the logic framework for therapeutic activation. The therapeutic plasmid replaces the GFP reporter with two independent synthetic antisense RNA cassettes targeting the fur gene (genomic position 757641-758087, NZ_CP007799.1, negative strand) and the iroN gene (genomic position 1171492-1173669, NZ_CP007799.1, positive strand) of EcN Nissle 1917. Silencing fur derepresses the endogenous iroBCDEN operon under FUS-controlled conditions, driving salmochelin biosynthesis. Salmochelin, a C-glucosylated enterobactin produced by IroB, evades host Lipocalin-2 sequestration and competes for extracellular iron within the TME (Huang et al., 2024). Simultaneous silencing of iroN — the outer membrane receptor responsible for reimporting the ferric-salmochelin complex — prevents iron recovery by the bacteria, creating a unidirectional iron sequestration trap that depletes the extracellular labile iron pool of the tumor. Each sRNA cassette consists of a 24nt antisense targeting sequence fused to a MicC scaffold (BBa_K5176030), which recruits the endogenous Hfq chaperone to stabilize the sRNA and facilitate target mRNA degradation (Dam et al., 2017). To ensure optimal folding and independent function of each sRNA, both cassettes are placed under separate individual thermal promoters in tandem: BBa_K4233038 -> BBa_K2447011 -> [24nt anti-Fur + MicC] -> T1/TE -> BBa_K2447011 -> [24nt anti-IroN + MicC] -> T1/TE. The specific DNA sequences for these elements are detailed in Table 3.
To implement this logic, the complete therapeutic module—Therapeutic_Insert_4kb (4,600 bp)—was digitally assembled in Benchling as an insulated genetic unit. The internal architecture was engineered in a modular fashion, starting with an upstream BBa_B0015 bidirectional terminator to shield the circuit from backbone-derived noise. This is followed by the TlpA39C thermal autorepressor (BBa_K4233038) and the lactate-sensing Kill Switch (BBa_K3848004), which provides tumor-specific biocontainment. The downstream section of the insert contains the dual effector modules: the anti-Fur and anti-IroN asRNA cassettes, each independently driven by the BBa_K2447011 thermal promoter and fused to the MicC scaffold. To ensure transcriptional independence, the entire 4.6 kb module is flanked by a final T1/TE terminator (Figure 5). This 4.6 kb module was then integrated into the native pMUT2 (CP023342.1) plasmid of EcN via a simulated Gibson Assembly at the s2 intergenic site. By utilizing the native pMUT2 backbone, the final 10,114 bp therapeutic vector (Figure 6) ensures 100% antibiotic-free stability in vivo through its endogenous RelB/RelE toxin-antitoxin system, providing a robust clinical-grade platform as characterized by Kan et al. (2021).
To ensure maximum genetic stability and rapid prototyping, the therapeutic circuit was housed in the native pMUT2 plasmid of EcN instead of pursuing genomic integration. This decision is supported by the findings of Kan et al. (2021), who demonstrated that pMUT-based vectors maintain 100% stability in vivo without antibiotic selection. Specifically, our 4.6 kb synthetic insert falls well within the validated capacity of the pMUT2 backbone, which has been shown to accommodate up to 7 kb of recombinant DNA (total plasmid size ~13.1 Kbp) without compromising bacterial fitness (Kan et al., 2021). By utilizing the s2 intergenic site, the construct avoids disrupting essential mobility or replication functions, providing a robust, clinical-grade platform for the FUS-controlled iron sequestration system.
5.3 Validation Aspect
The computational logic of the therapeutic genetic circuit was validated by developing a Python-based Boolean simulation of the TlpA39C thermal gate and lactate-gated kill switch transfer functions using Hill function modeling. Additionally, the complete 10,114 bp therapeutic plasmid was digitally assembled and validated in Benchling via simulated Gibson Assembly.
5.4 Validation Protocol
Retrieved the TlpA39C thermal gate parameters from Piraner et al. (2017): Hill coefficient k=60, activation midpoint x0=0.70, corresponding to ~39°C.
Retrieved the lactate-gated kill switch parameters from BBa_K3848004 characterization data: k=12, x0=0.35, corresponding to ~10-12 mM lactate.
Implemented both transfer functions in Python using NumPy, defining normalized input arrays for FUS intensity and lactate concentration respectively.
Plotted each transfer function independently using Matplotlib to generate Figures 3 and 4.
Computed the combined Boolean AND gate output by multiplying the thermal gate and kill switch outputs across all four input state combinations.
Plotted the combined system output as Figure 5, confirming full therapeutic activation exclusively under simultaneous FUS and TME-level lactate conditions.
All figures were exported and incorporated into the Results section of this report.
The EcN genome (NZ_CP007799.1) was retrieved from NCBI and the 24nt antisense targeting sequences for fur and iroN were extracted and designed.
Both antisense sequences were fused in silico to the MicC scaffold to generate the complete sRNA cassettes.
The four transcriptional cassettes were sequentially assembled in Benchling via simulated Gibson Assembly into the pMUT2 backbone at the s2 intergenic site, generating the 10,114 bp therapeutic vector.
Junction integrity, homology overhang lengths (40 bp), cassette orientation, and transcriptional insulation were verified within Benchling.
The final annotated plasmid map (Figure 6) and linear insert map (Figure 5) were generated and exported from Benchling.
5.5 Synthetic Biology Techniques Used
The validation of this project utilized two core synthetic biology techniques. First, computational modeling in Python using Hill function mathematics to simulate the thermal gate and kill switch transfer functions, confirming Boolean AND gate behavior across all four input states. Second, DNA construct design, where the complete 10,114 bp therapeutic vector was digitally constructed via simulated Gibson Assembly at the s2 intergenic site of pMUT2, verifying junction integrity and cassette orientation.
5.6 Data and Analysis
Simulated data was generated and presented in Section 5 of this report, including the thermal gate transfer function (Figure 2), the lactate-gated kill switch sigmoid response (Figure 3), and the combined Boolean system output (Figure 4). These transfer functions were computationally derived using Hill function modeling in Python and confirm that full therapeutic activation occurs exclusively under simultaneous FUS and TME-level lactate conditions.
5.7 Challenges and Limitations
Two principal limitations have been identified in this project and are addressed through specific experimental and design strategies.
The first and most critical limitation concerns the metabolic burden imposed on EcN by therapeutic circuit activation. Upon FUS-induced derepression of fur, the endogenous RyhBsRNA is upregulated, which in turn represses SodB — the iron-dependent superoxide dismutase — rendering the bacteria significantly more susceptible to reactive oxygen species (ROS) at the precise moment of maximum therapeutic activity. This creates a fundamental tension between therapeutic efficacy and bacterial viability: the circuit must sequester sufficient iron to drive tumor metabolic collapse before oxidative stress reaches the bacterial lethal threshold. To address this, Aim 2.4 is specifically designed to define the optimal FUS duty cycle — alternating activation windows with metabolic recovery periods — that maintains a negative iron balance in the tumor microenvironment without compromising bacterial survival. The potential role of Mn2+ in sustaining SodA-mediated oxidative stress resistance during therapeutic activation will also be evaluated, leveraging the elevated endogenous Mn2+ concentrations characteristic of solid tumor microenvironments and EcN’s active Mn2+ uptake via MntH transporters. Whether endogenous TME Mn2+ is sufficient or whether supplementation is required remains an open question to be resolved experimentally in Aim 2.4.
The second limitation concerns tumor localization for FUS application. Following PLGA seed degradation and bacterial colonization — which occurs over 24-48 hours — no physical reference marker remains to guide millimetric FUS targeting at the time of therapy. This is partially addressed through prior imaging coordinates established by ultrasound-guided implantation for breast and prostate, and by direct endoscopic or colposcopic tumor mapping for colorectal and cervical cancers respectively, combined with real-time FUS guidance. An alternative strategy under evaluation is the incorporation of a second plasmid (pMUT1) encoding acoustic reporter genes (ARG1) — gas vesicles detectable by diagnostic ultrasound — that would enable real-time bacterial localization within the tumor prior to FUS activation (Bourdeau et al., 2018). However, this approach introduces additional metabolic burden on EcN and its feasibility must be evaluated against the therapeutic efficiency of the primary circuit in Aim 2 before adoption.
SECTION 6: ADDITIONAL INFORMATION
6.1 References
Seaver, L.C., & Imlay, J.A. (2001). Alkyl hydroperoxide reductase is the primary scavenger of endogenous hydrogen peroxide in Escherichia coli. Journal of Bacteriology, 183(24), 7173-7181. DOI: 10.1128/JB.183.24.7173-7181.2001
Salvail, H., Lanthier-Bourbonnais, P., Sobota, J.M., Caza, M., Benjamin, J.A., Mendieta, M.E., Lépine, F., Périard, G., Imlay, J.A., & Massé, E. (2010). A small RNA promotes siderophore production through transcriptional and metabolic remodeling. PNAS, 107(34), 15223-15228. DOI: 10.1073/pnas.1007805107
Massé, E., & Gottesman, S. (2002). A small RNA regulates the expression of genes involved in iron metabolism in Escherichia coli. PNAS, 99(7), 4620-4625. DOI: 10.1073/pnas.032066599
Semsey, S. (2014). A mixed incoherent feed-forward loop allows conditional regulation of response dynamics. PLOS ONE, 9(3), e91243. DOI: 10.1371/journal.pone.0091243
Sohn, Y.S., Mitterstiller, A.M., Breuer, W., Weiss, G., & Cabantchik, Z.I. (2011). Rescuing iron-overloaded macrophages by conservative relocation of the accumulated metal. British Journal of Pharmacology, 164(2), 406-418. DOI: 10.1111/j.1476-5381.2010.01120.x
Liang, W., & Ferrara, N. (2021). Iron metabolism in the tumor microenvironment: contributions of innate immune cells. Frontiers in Immunology, 11, 626812. DOI: 10.3389/fimmu.2020.626812
Szlasa, W., Gachowska, M., Kiszka, K., Rakoczy, K., Kiełbik, A., Wala, K., Puchała, J., Chorążykiewicz, K., Saczko, J., & Kulbacka, J. (2021). Iron chelates in the anticancer therapy. Chemical Papers. DOI: 10.1007/s11696-021-02001-2
Privalle, C.T., & Fridovich, I. (1988). Inductions of superoxide dismutases in Escherichia coli under anaerobic conditions. Journal of Biological Chemistry, 263(9), 4274-4279. PMID: 3279033
Bourdeau, R., Lee-Gosselin, A., Lakshmanan, A. et al. (2018) Acoustic reporter genes for noninvasive imaging of microorganisms in mammalian hosts. Nature 553, 86-90. https://doi.org/10.1038/nature25021
Torti, S. V., & Torti, F. M. (2013). Iron and cancer: more ore to be mined. Nature Reviews Cancer, 13(5), 342-355. https://doi.org/10.1038/nrc3495
Pita-Grisanti V. et al. (2022). Understanding the Potential and Risk of Bacterial Siderophores in Cancer. Frontiers in Oncology. https://doi.org/10.3389/fonc.2022.867271
Stritzker et al., (2007) Tumor-specific colonization, tissue distribution, and gene induction by probiotic Escherichia coli Nissle 1917 in live mice. International Journal of Medical Microbiology. Volume 297, Issue 3. DOI: 10.1016/j.ijmm.2007.01.008
Saha P. et al. (2019). Enterobactin, an iron chelating bacterial siderophore, arrests cancer cell proliferation. Biochemical Pharmacology, Volume 168, 71-81. https://doi.org/10.1016/j.bcp.2019.06.017
Chen et al. (2023). Advances in Escherichia coli Nissle 1917 as a customizable drug delivery system for disease treatment and diagnosis strategies. Materials Today Bio Volume 18. https://doi.org/10.1016/j.mtbio.2023.100543
Piraner D.I., Abedi M.H., Moser B.A., Lee-Gosselin A. & Shapiro M.G. (2017). Tunable thermal bioswitches for in vivo control of microbial therapeutics. Nature Chemical Biology 13:75-80. DOI: 10.1038/nchembio.2233
Bray F, Laversanne M, Sung H, et al. Global cancer statistics 2022: GLOBOCAN estimates of incidence and mortality worldwide for 36 cancers in 185 countries. CA Cancer J Clin. 2024;74(3):229-263. doi:10.3322/caac.21834
Kan, A., Gelfat, I., Emani, S., Beliveau, A., Way, J. C., Silver, P. A., & Joshi, N. S. (2021). Plasmid Vectors for in Vivo Selection-Free Use with the Probiotic E. coli Nissle 1917. ACS Synthetic Biology, doi: 10.1021/acssynbio.0c00466
Pérez-Tomás & Pérez-Guillén, (2020). Lactate in the Tumor Microenvironment: An Essential Molecule in Cancer Progression and Treatment. Cancers (Basel). 3;12(11):3244. doi: 10.3390/cancers12113244
Huang et al., (2024). Overcoming the nutritional immunity by engineering iron-scavenging bacteria for cancer therapy. eLife 12:RP90798. https://doi.org/10.7554/eLife.90798.3
Fischbach et al., (2006). The pathogen-associated iroA gene cluster mediates bacterial evasion of lipocalin 2. Microbiology 103 (44) 16502-16507. https://doi.org/10.1073/pnas.0604636103
Massip C, Branchu P, Bossuet-Greif N, Chagneau CV, Gaillard D, Martin P, et al. (2019) Deciphering the interplay between the genotoxic and probiotic activities of Escherichia coli Nissle 1917. PLoS Pathog 15(9): e1008029. https://doi.org/10.1371/journal.ppat.1008029
Pinnix et al., (2010). Ferroportin and Iron Regulation in Breast Cancer Progression and Prognosis. Sci Transl Med. 4;2(43):43ra56. doi: 10.1126/scisignal.3001127
Dam et al., (2017). Dual Regulation of the Small RNA MicC and the Quiescent Porin OmpN in Response to Antibiotic Stress in Escherichia coli. Antibiotics, 6(4), 33. https://doi.org/10.3390/antibiotics6040033
Na et al., (2013). Metabolic engineering of Escherichia coli using synthetic small regulatory RNAs. Nat Biotechnol. 31(2):170-4. DOI: 10.1038/nbt.2461
Gurbatri et al., (2024). Engineering tumor-colonizing E. coli Nissle 1917 for detection and treatment of colorectal neoplasia. Nat Commun 15, 646. https://doi.org/10.1038/s41467-024-44776-4
Ando et al., (2025). CD44: a key regulator of iron metabolism, redox balance, and therapeutic resistance in cancer stem cells. Stem Cells. 27;43(6):sxaf024. doi: 10.1093/stmcls/sxaf024.
Müller et al., (2009). Salmochelin, the long-overlooked catecholate siderophore of Salmonella. Biometals. 22:691-695 DOI 10.1007/s10534-009-9217-4
Miethke & Marahiel. (2007) Siderophore-based iron acquisition and pathogen control. Microbiol Mol Biol Rev. 71(3):413-51. doi: 10.1128/MMBR.00012-07.
Raymond et al., (2003) Enterobactin: An archetype for microbial iron transport. Proc. Natl. Acad. Sci. U.S.A. 100 (7) 3584-3588.https://doi.org/10.1073/pnas.063001810
Mercê, A. L. R., Carrera, L. C. M., Romanholi, L. K. S., & Recio, M. A. L. (2002). Aqueous and solid complexes of iron(III) with hyaluronic acid: Potentiometric titrations and infrared spectroscopy studies. Journal of Inorganic Biochemistry, 89(3-4), 212-218. https://doi.org/10.1016/S0162-0134(01)00422-6
Chan C.T., Lee J.W., Cameron D.E., Bashor C.J. & Collins J.J. (2016). Deadman and Passcode microbial kill switches for bacterial containment. Nature Chemical Biology 12:82-86. https://doi.org/10.1038/nchembio.1979
6.2 Supply List and Budget Summary
Phase 1 - Academic R&D and Preclinical Validation (Aims 2 and 3.1): The benchwork and murine in vivo evaluation operate under university laboratory scales, requiring localized funding for specialized materials and facility fees:
Phase 2 - Visionary Clinical Translation and Human Deployment (Aim 3.2)
Clinical-Grade Scaling & Regulatory Assays: Transitioning the platform to human clinical trials (Aim 3.2) expands the financial scope beyond university grant limits. This phase requires scaling to GMP (Good Manufacturing Practices) bacterial cultivation, international multicenter clinical trials across four target cancers, and structural regulatory filings (FDA/ISP Chile).
Projected Phase 2 Capital: $15,000,000 – $50,000,000 USD (To be secured via institutional venture capital, biopharma partnerships, or translational milestone-based government grants, moving from bench-top prototypes to clinical-grade living therapeutics). If human clinical trials (Aim 3.2) are executed through sovereign biotechnology consortia or established Contract Research Organizations (CROs) in emerging regions such as India, China, or Latin American medical hubs, the clinical capital requirements can be reduced by 60% to 90%.
Parallel Veterinary Translation: To further accelerate the translational timeline and mitigate clinical risk, the platform can be strategically deployed within veterinary oncology. Pet dogs and cats develop spontaneous, immunologically complex solid tumors that mimic human pathophysiology far better than engineered murine models. Because the regulatory framework managed by the FDA-CVM operates under a more flexible regulatory framework relative to the multi-year, sequential human phase checkpoints, validating this bacteria-based therapy in veterinary clinical trials can be achieved within 18 to 36 months with a minimal capital requirement of $300,000 – $500,000 USD. This comparative oncology approach offers an immediate, high-volume market to save millions of companion animals worldwide, while generating robust, real-world efficacy and safety data to fundamentally de-risk and fast-track subsequent human clinical approvals.
6.3 Final presentation HTGAA-2026
6.4 Using Programmable Bacteria to Detect and Treat Cancer
The integration of engineered cellular platforms represents a milestone in oncological synthetic biology. To contextualize the real-world execution of autonomous diagnostic and therapeutic loops, this section benchmarks our genetic circuit strategies against the pioneering work of synthetic biologist Tal Danino regarding programmable probiotics: