Week 4 HW: Protein design part 1
- Answer conceptual questions
- Learn basic concept of protein design
- Brainstorm how to apply these together in the group project
Part A - Conceptual questions
Amino Acid & Protein Structure Q&A
Part B - Protein analysis and visualization
- Briefly describe the protein you selected and why you selected it.
- I am analyzing and visualizing a thermoacidophillic extremozyme. Glucoamylases from Sulfolobus solfataricus, which are very heat seeking, and acidity seeking. Specifically $\beta$-glycosidase (SSO1353). source, this paper: Advances in Extremophile Research: Biotechnological Applications through Isolation and Identification Techniques | MDPI
- Identify the amino acid sequence of your protein
- MGRFAIYEAPQNCPYLGTIGACYEFGSLPVILMFPELEKSFLKLLIRHIREDGYVPHDLG YHSLDSPIDGTTSPPRWKDMNPSLILLVYRYFKFTNDIEFLKEVYPILVKVMDWELRQCK GNLPFMEGEMDNAFDATIIKGHDSYTSSLFIGSLIAMREIAKLVGDSNYVDFISEKLSSA REAFRRMFNGRYFKAWDSVDNASFLAQLYGEWFTTLVGLEDIVEEDIIKKALESIIRLNG NASPHCVPNLVDDNGKIVGLSVQTYSSWPRMVFAICWLAYKKGVGDLSFCKKEWDNLVKN GMVWDQPSRINGYNGKAEMNYLDHYIGSPSPWSFLF. Source: DNASU Plasmid | SSO1353 (S. solfataricus )
In pET21_NESG (His-tagged bacterial expression vector)
- How long is it? What is the most frequent amino acid? You can use this Colab notebook to count the frequency of amino acids.
- Total sequence length is 336, with L being the most frequent
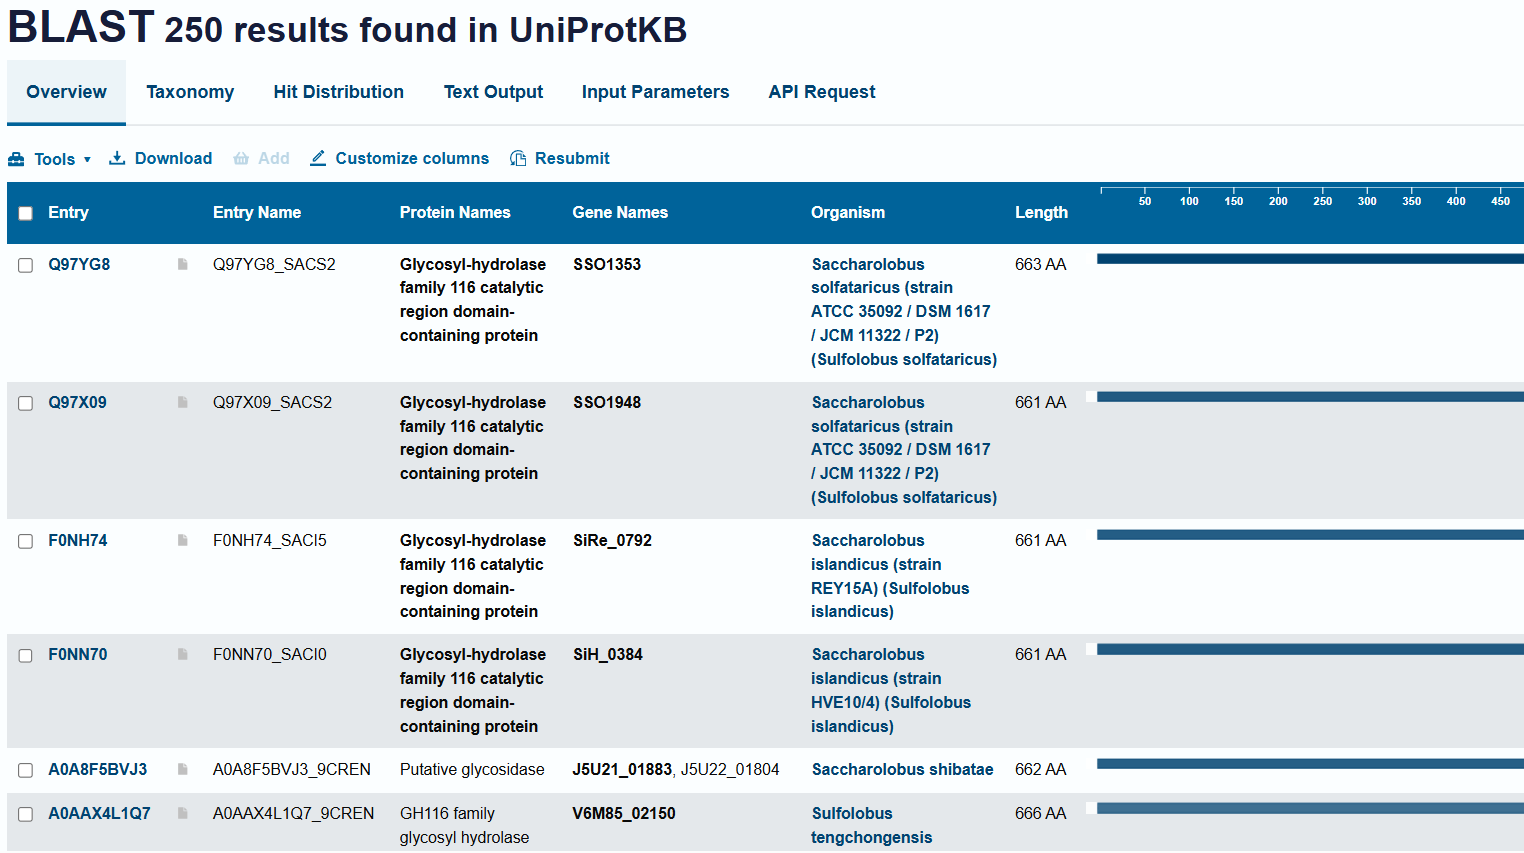
- How many protein sequence homologs are there for your protein? Hint: Use Uniprot’s BLAST tool to search for homologs.
- Around 250 Homologs are there
-
- Around 250 Homologs are there
-
- Does the protein belong to a family?
- Yes - GH116 Glycosyl-hydrolase family 116 catalytic region domain-containing protein
- MGRFAIYEAPQNCPYLGTIGACYEFGSLPVILMFPELEKSFLKLLIRHIREDGYVPHDLG YHSLDSPIDGTTSPPRWKDMNPSLILLVYRYFKFTNDIEFLKEVYPILVKVMDWELRQCK GNLPFMEGEMDNAFDATIIKGHDSYTSSLFIGSLIAMREIAKLVGDSNYVDFISEKLSSA REAFRRMFNGRYFKAWDSVDNASFLAQLYGEWFTTLVGLEDIVEEDIIKKALESIIRLNG NASPHCVPNLVDDNGKIVGLSVQTYSSWPRMVFAICWLAYKKGVGDLSFCKKEWDNLVKN GMVWDQPSRINGYNGKAEMNYLDHYIGSPSPWSFLF. Source: DNASU Plasmid | SSO1353 (S. solfataricus )
- Identify the structures page of your protein in RCSB - RCSB PDB - 1GOW: BETA-GLYCOSIDASE FROM SULFOLOBUS SOLFATARICUS
- When the structure was resolved
- Released: 1997-08-20 at resolution of 2.60 Å
- Are there any other molecules in the solved structure apart from protein
- No
- Does your protein belong to any structure classification family?
- Glycoside Hydrolase Family
- When the structure was resolved
- PYMOL section
- Download PDBX/mmCIF format of protein from RCSB
- in import section, select the above file
- Protein is visualized and can be seen in the main console. On the right side panel, there will be options to alter visualization “ASHLC” Which is what needs to be changed
- show cartoon, ribbon and sticks/stones view
- Color by secondary structure
- Color by residue type
- show holes
Pymol screenshots
Pymol protein visualizations
cartoon view of molecule Select, S, then cartoon view
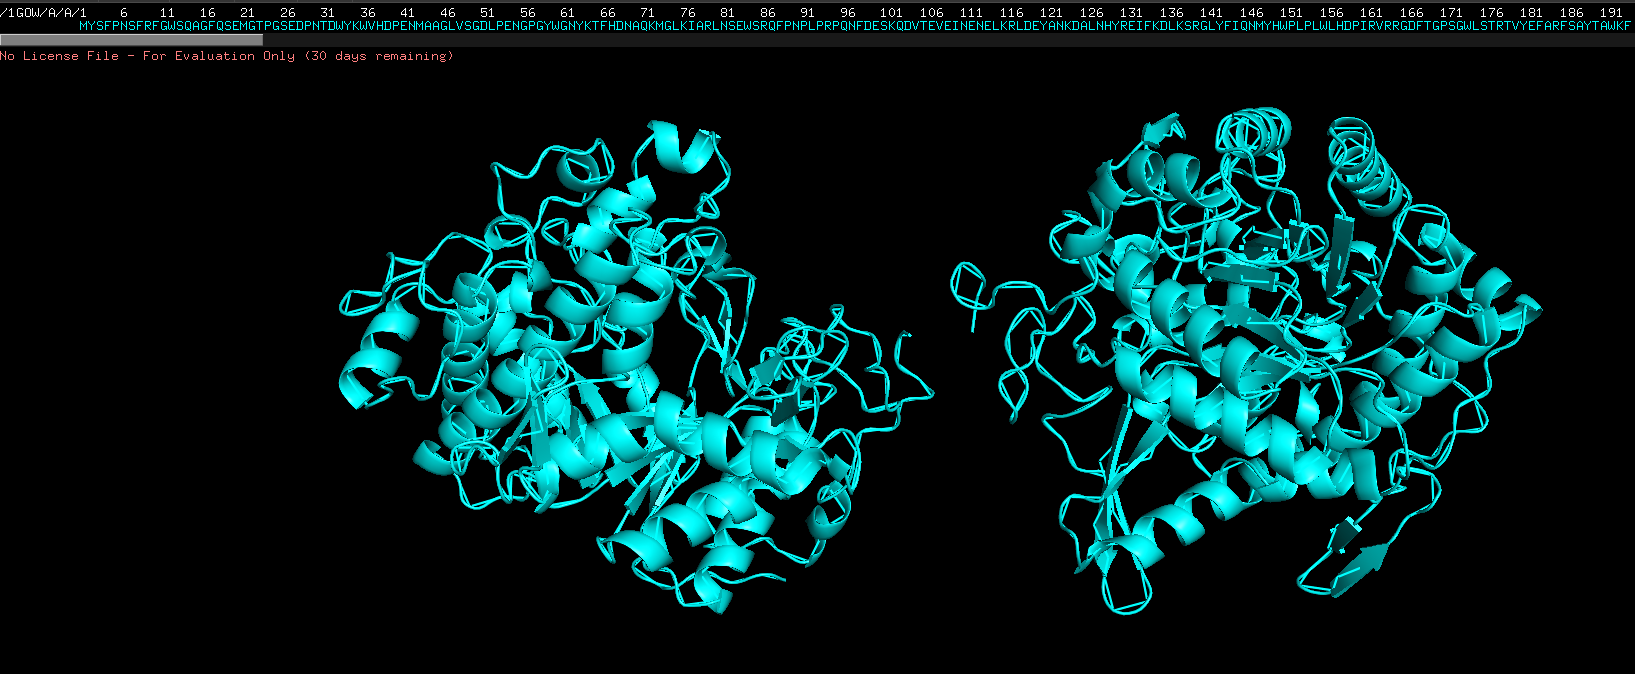
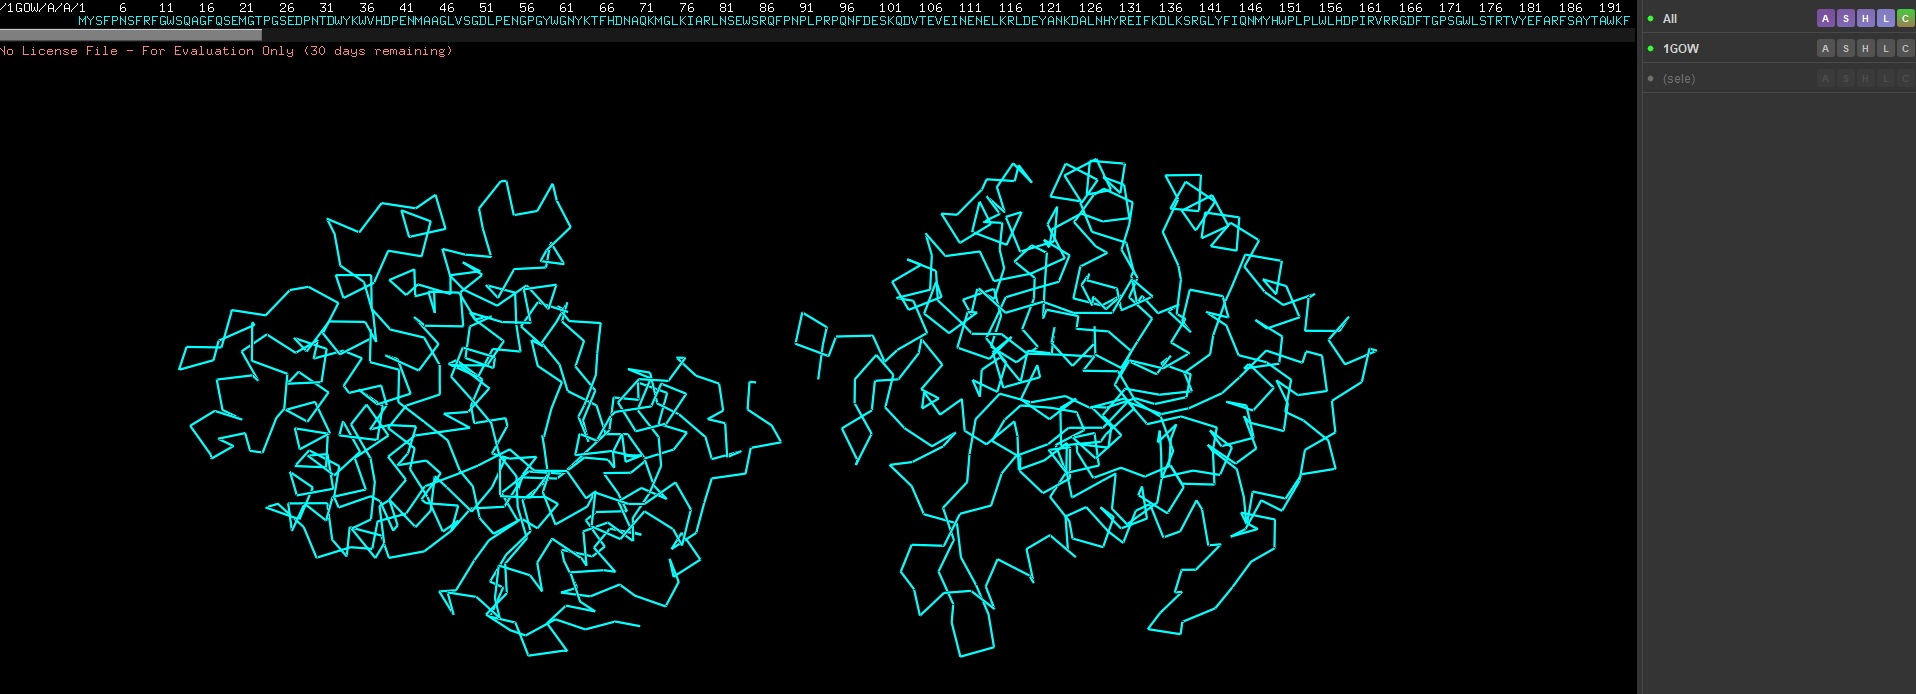
Ribbon view, select S then show as then ribbon view, on 1GOW, not on all
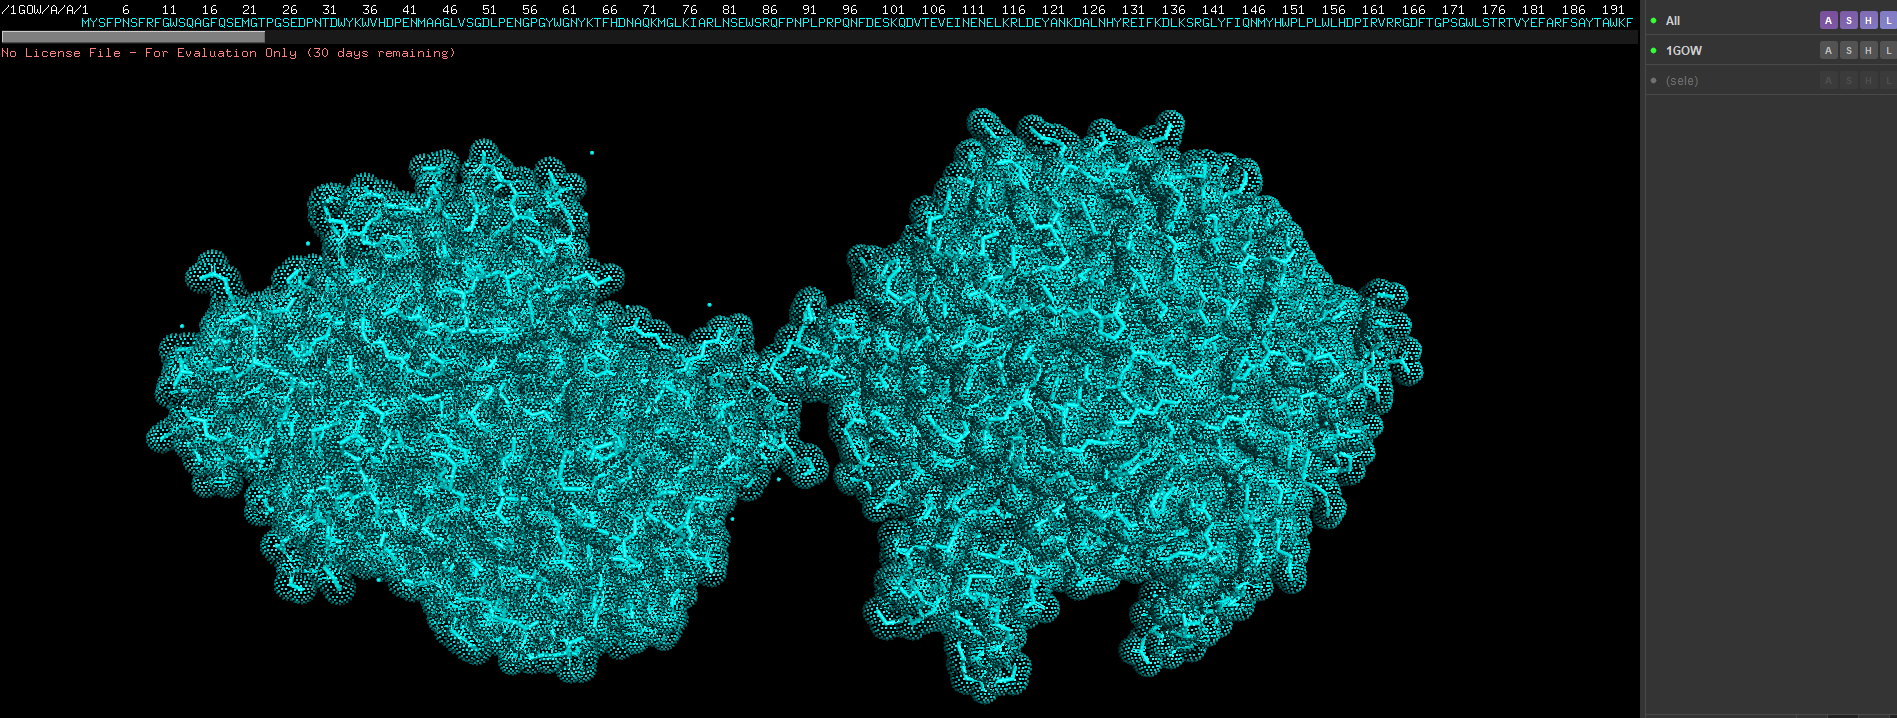
Show as spheres first, the in the previous drop down click on sticks as well
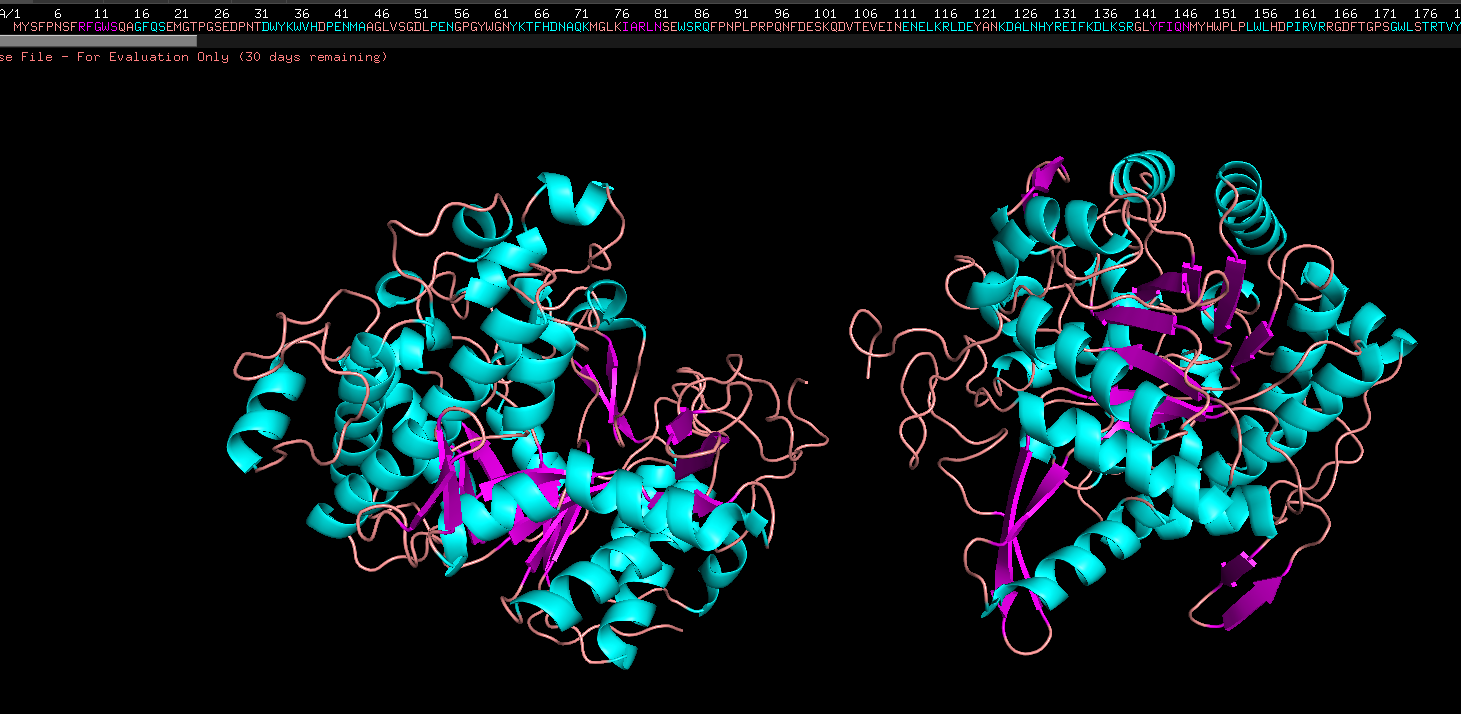
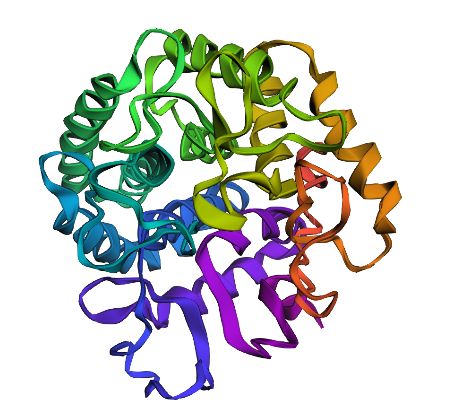
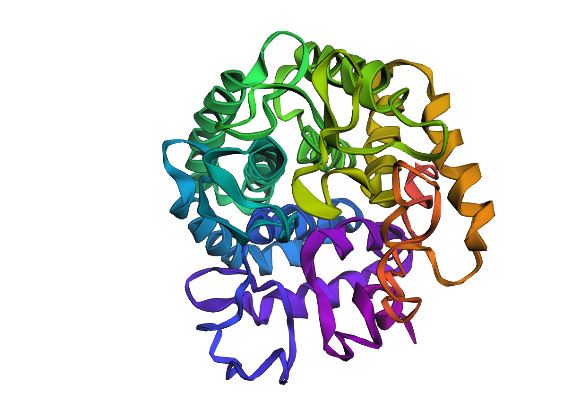
Color the protein by their secondary structure
Colored by ss structure. Seems like it has more helixes than sheets, but more loops than both. Cyan is helix, pink is sheets, orange is loops
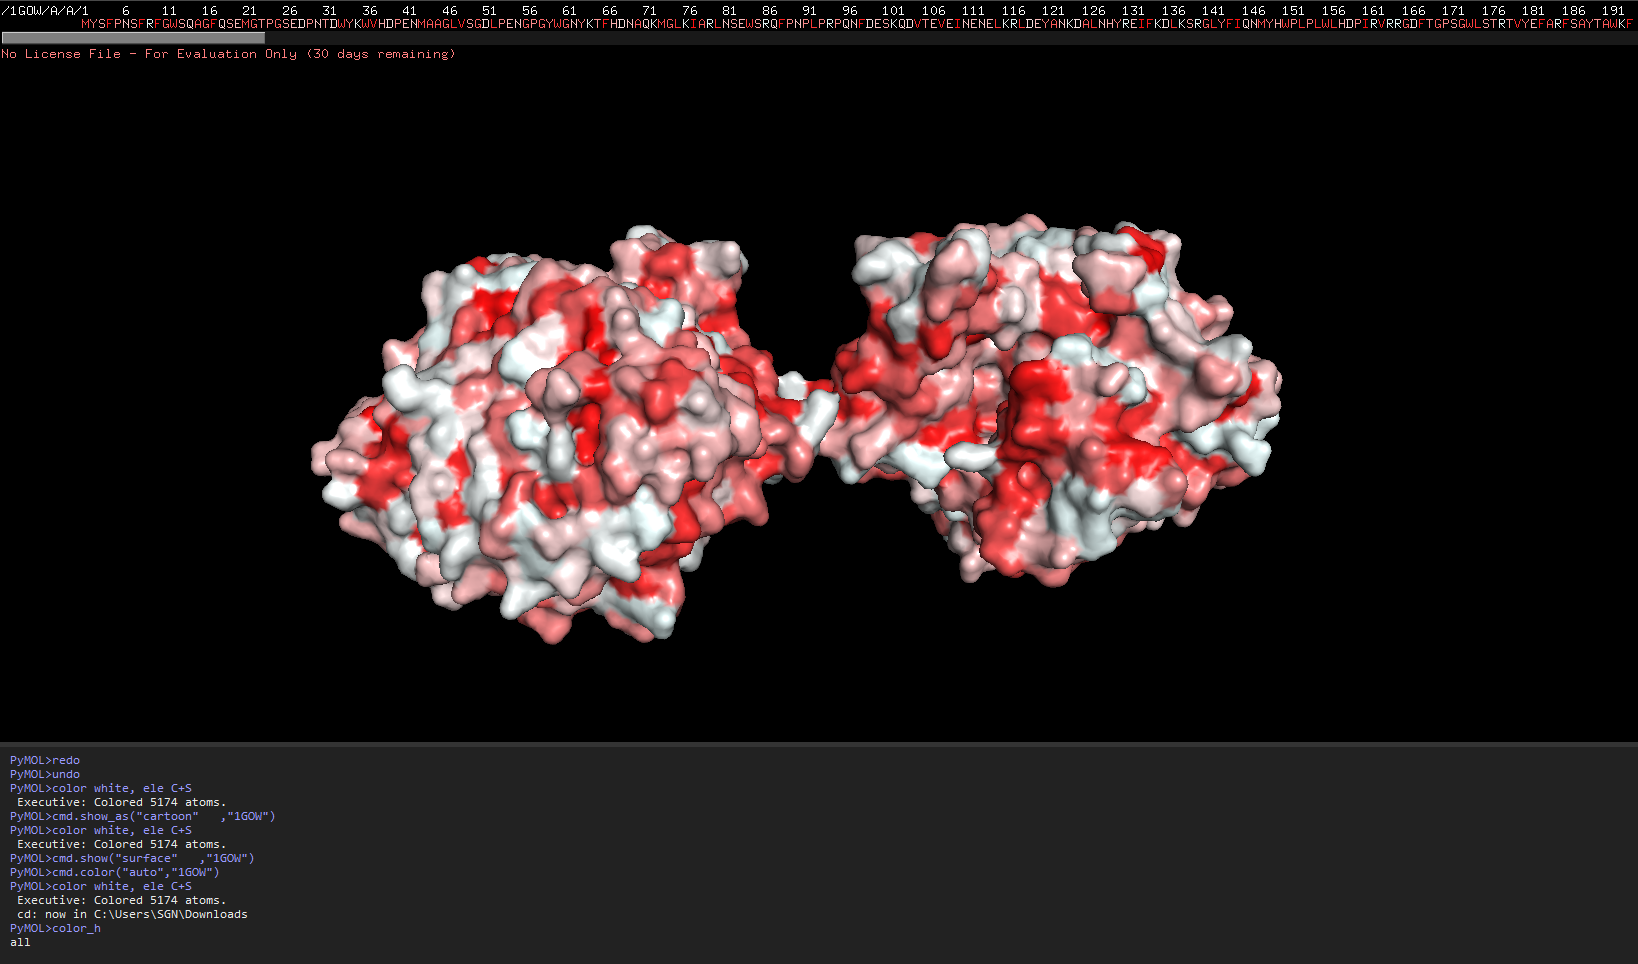
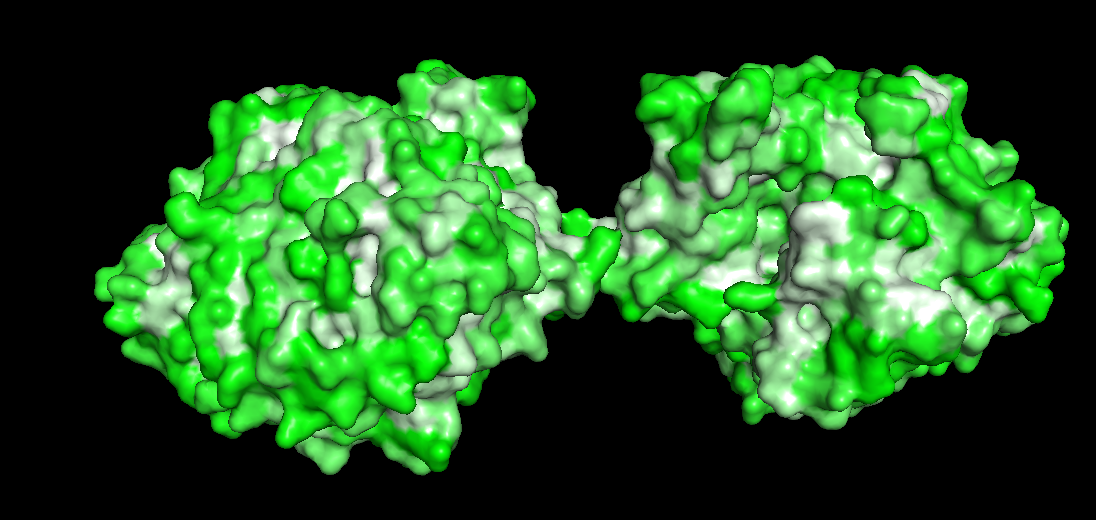
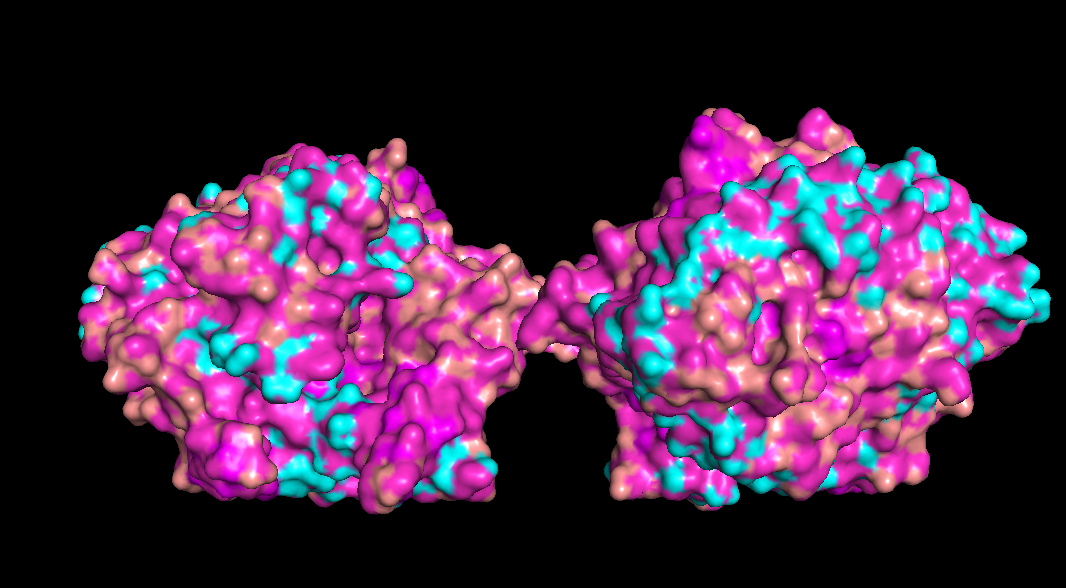
Color by Residue, hydrophobicity and hydrophilicity
- Import the python script and run it from files-run_script.
- In the command Palette below, run the file name, in this case color_h
Source:Mapping properties onto a structure: Electrostatic potential, conservation, hydrophobicity/polarity
The redder the part is, more hydrophobic it is, white is not necessarily hydrophilia. In the second image below, green are polar molecules, and white are non-polar molecules, so could indicate hydrophilia.
Check if any “holes” there
Doesn’t seem like any outright holes are there, but a lot of surfaces and gaps are there though for binding pockets
Part C - Using ML based protein design tools
Copy of google colab - https://colab.research.google.com/drive/1Hn82J2OK4n2e_SrKc0UW3Pw9U4y6dzv6?usp=sharing
C1 Protein Language Modelling
Deep Mutational scan
- Use ESM2 to generate an unsupervised deep mutational scan of your protein based on language model likelihoods.
- Can you explain any particular pattern? (choose a residue and a mutation that stands out)
Used ESM2 to run a mutational scan on above protein. Input the amino acid sequence into the code and just execute it with relative mode. The model that was run was esm2t68MUR50D
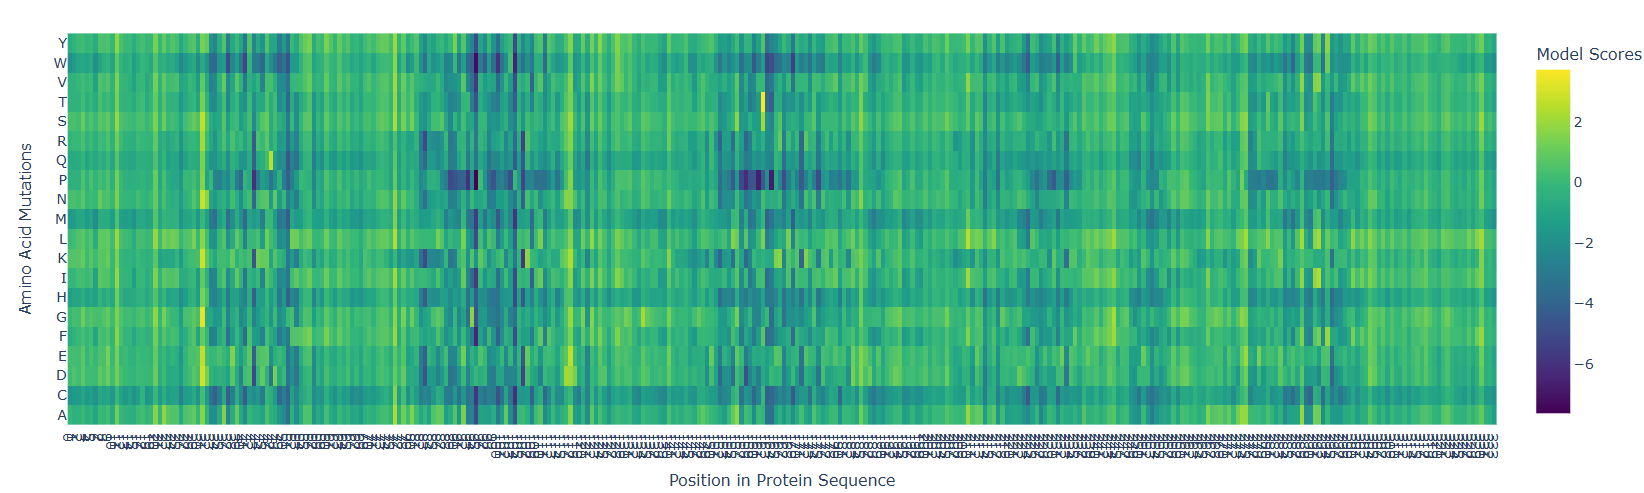
Interesting pattern, there are 5-6 major straits where mutation can cause detrimental effects, but just like that, right before those sites, there are points where mutation can cause beneficial effects. This is if the target amino acid is replaced by any other amino acid.
- According to the graph, the most dangerous amino acid to replace with seems to be P, because there is a horizontal line indicating P replacement causing a detrimental effect.
- Replacing 162nd amino Acid with T is a very beneficial mutation at one site.
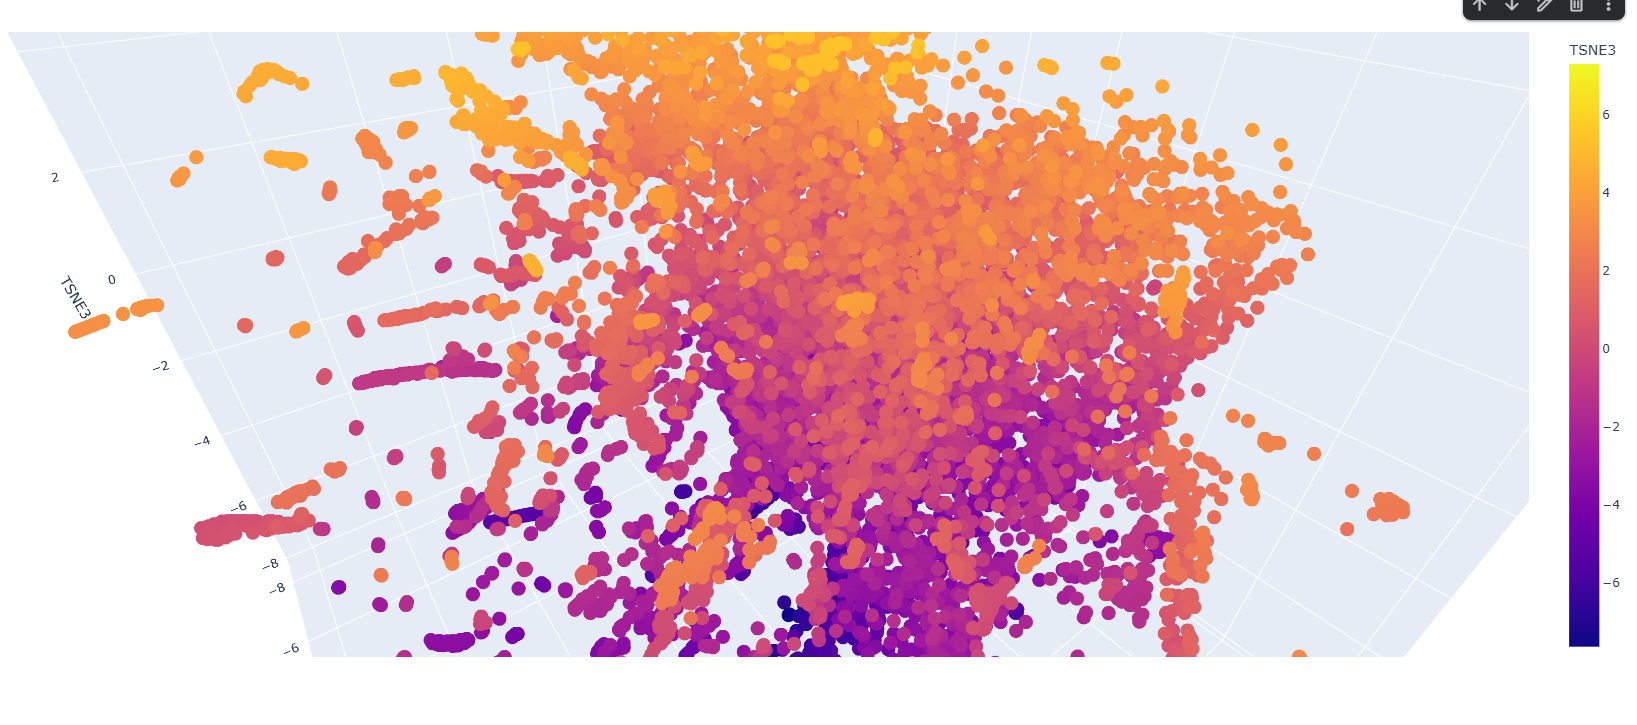 There are a few patterns along the latent space graph, but most proteins seem to be similar to each other. Clusters are often 10-15 proteins large are in the outskirts. Most proteins are also having TSNE heatmap along the vertical axis, so lower down the proteins are more likely they are along one other dimension also.
Added our protein the beta-glycosidase to the existing list of proteins.
Redone
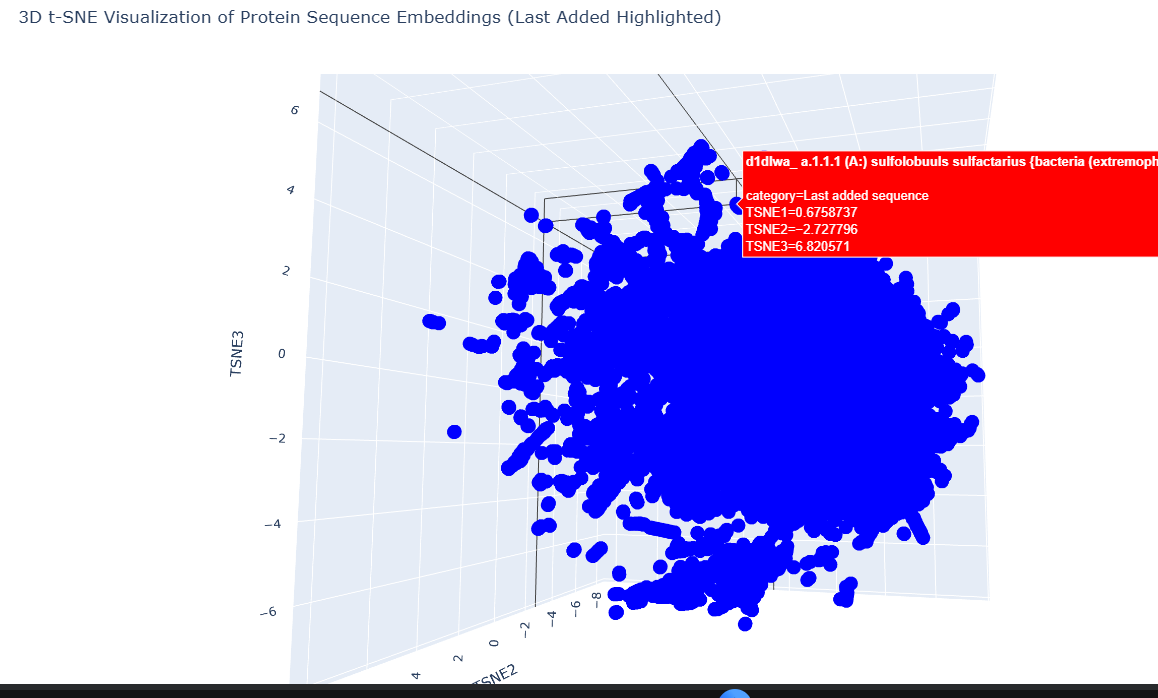 Our target is part of a small cluster at the edge of the graph, as shown by the red.
- It is grouped with 2 other yeast and bacteria based glucoamylase
- Nisin Biosynthesis protein
- arylamine N-acetyletransferase
- epimerase
- mannosidase
- putative NAG-isomerase
- endo b-1,4,glucanase
The below code was used to add it to the rest of the sequences, and the to create the graph.
C2 Protein Folding
- Fold your protein with ESMFold. Do the predicted coordinates match your original structure?
- Try changing the sequence, first try some mutations, then large segments. Is your protein structure resilient to mutations?
ESM fold generated protein looks very different from the pyMOL proteins.
Changed the 162nd amino acid to T since according to previous analysis, it was supposed to be very beneficial
C2 Protein Generation
- Analyze the predicted sequence probabilities and compare the predicted sequence vs the original one.
- Input this sequence into ESMFold and compare the predicted structure to your original.
Generated sequence:
T=0.1, sample=0, score=0.7474, seq_recovery=0.5031 MIEFPKDFKFGFSTHPYSSYMGTPGSENPNTDWYAWHRDPENIAAGLVSGDNIDNGPGWWGNYQKYIDAAKELGATIIRTSVDWSAIFPKPLPPDPDFDPASKRVDSVEINPERIAELKKYANQAAIAHYKKILTAIKDAGFHIILNIWAGPLPLWLFDALAVRKGDFSTPIGWLDPRTVVEFALYAGFIVSEFKDLIDEIEVMNEPNDYSYFGYIETEKGYPPGYKSEELSEIALRNLIQAIALARDAIKKVSDLPVGISINTRGFKPATPDDKEAVEKARYDNVDKFLDAIINGVYSEGGEEKTDPSLKGSLDFIGVNYYTYDVVKKEGGGYEILDGYGWRCKKNSVDANGNPTDEAGYEFYPEGLYDVLKYLYDKYKLPMYVTEFGIADKDGTMQPYYIVSNIAQVAKAIKDGVDIKGALYHHLADEYHWSKGWALQYGLLSVDFATKELSRKPAADVFKKIATNNAIPDEIAHLIAKPDVSPLPK
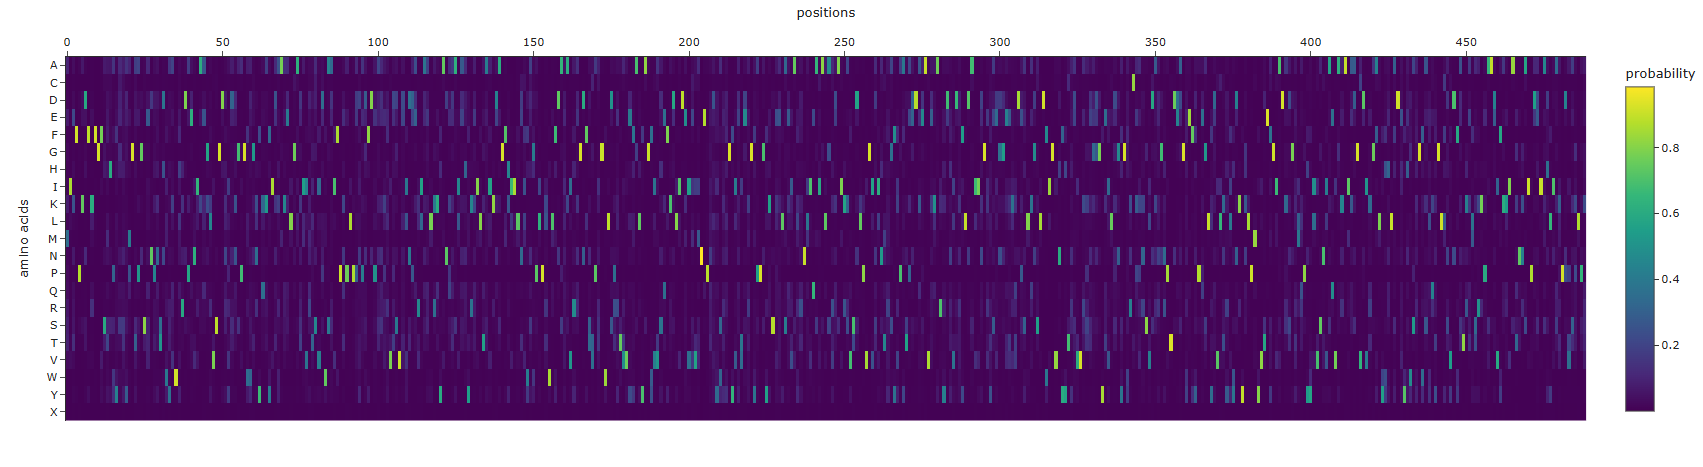 The sequence that is generate is completely different from the original, it is longer and has completely different sequences. amino acid probabilities seem completely random
Regenerated inverse folded protein:
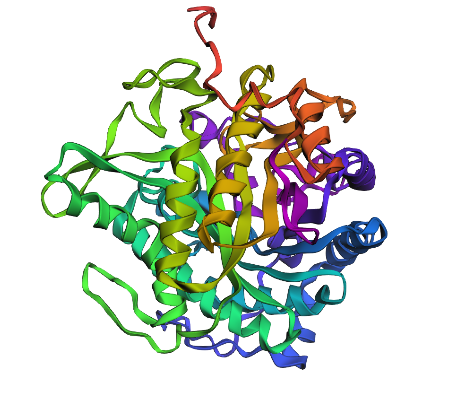
This looks drastically different, with one extra helix, and different placement for loops as well as sheets
Pard D - Group Brainstorm on bacteriophage engineering
- Form team of 3-4 people
- Read through phage reading resources
- Review bacteriophage final project goals for engineering the L-protein
- Do brainstorm session
- Include plan to engineer phage on the website
Group brainstorm result:
- Use esmfold to see in what ways the protein can mutate.
- Use analytical methods to find target protein regions.
- Using genomic language models for creating more lytic proteins and their target regions.
- Check folding again using alphafold