I am a recent graduate molecular biology engineer with a strong interest in genetic and protein engineering,
synthetic biology, and pharmacogenomics. Through my participation in HTGAA Spring 2026, I aim to strengthen my
understanding of DNA manipulation technologies and explore how they can be developed and applied responsibly,
with careful consideration of ethical, safety, and governance frameworks.
Art Presentation
Alongside my scientific work, I wanted this webpage to also become a space for creative expression — a place where biology can be experienced not only through research, but also through visual art 🎨🔬
Let me present to you my art: a collection of three-dimensional biological creations inspired by the hidden architecture of life 🧬✨, where DNA structures, cellular forms, and molecular systems are transformed into immersive digital designs 🌌💻
This collection reflects my fascination with the intersection of science, technology, and artistic visualization ⚛️🎥. Each model is an attempt to reveal the beauty, symmetry, and complexity that exist within microscopic life 🦠🧫, while making these invisible biological worlds more interactive, accessible, and visually engaging 🌿🔍
More than simple illustrations, these works represent a personal journey of translating molecular complexity into digital art 🎨🧪 — where scientific imagination meets creativity, motion, and three-dimensional storytelling 🚀🧬
HTGAA Homepage Carousel
Selected Portfolio
Biology in Three Dimensions - Where science meets the canvas of physical form.
The Microscopic Universe Exposed - Transforming invisible biological structures into immersive visual experiences.
Foundations of Life - From molecular complexity to digital art.
Viral Architectures - An exploration of the elegance, symmetry, and geometry underlying living systems.
Visualizing the Hidden Architecture of Life - Bridging the worlds of science, technology, and artistic expression.
Cellular Barriers and Systems - The intricate organization of life at the microscopic scale.
The Full Collection - Thank you for exploring the hidden beauty of the biological world.
1. Project Concept: In-Silico Design of a Lactase-Releasing Probiotic for Lactose Intolerance
First, describe a biological engineering application or tool you want to develop and why. This could be inspired by an idea for your HTGAA class project and/or something for which you are already doing in your research, or something you are just curious about.
I am interested in developing an engineered probiotic system designed to release the lactase enzyme on demand in the human gut for individuals with lactose intolerance. This project is entirely in silico, combining concepts from synthetic biology, microbiome modeling, and systems biology without any wet-lab implementation.
The system would simulate a probiotic chassis such as Lactobacillus or Bifidobacterium, equipped with virtual genetic circuits inspired by lactose metabolism. These circuits would model regulatory control of lactase expression based on local lactose concentration, using logic-gate–like behavior and feedback mechanisms. Enzyme production would increase when lactose is present and decrease once lactose is depleted, allowing adaptive and resource-efficient regulation.
Why Is This Idea Relevant?
In-silico modeling is a recognized and safe approach in synthetic biology that allows the exploration of engineered biological systems and gut microbiome interactions without experimental, ethical, or biosafety risks. Such computational frameworks enable hypothesis generation, system-level understanding, and educational visualization of complex biological behaviors before any real-world implementation.
Note
Lactose intolerance is one of the most common digestive disorders globally, caused by reduced or absent lactase activity in adulthood. It affects a large proportion of the world’s population, particularly in Africa, Asia, and South America, leading to gastrointestinal discomfort and dietary restrictions. Addressing this condition highlights a real, widespread health challenge that benefits from innovative and accessible solutions. (Lactose Intolerance - NIDDK, 2024); image reference
2. Governance / Policy Goals
2. Next, describe one or more governance/policy goals related to ensuring that this application or tool contributes to an “ethical” future, like ensuring non-malfeasance (preventing harm). Break big goals down into two or more specific sub-goals. Below is one example framework (developed in the context of synthetic genomics) you can choose to use or adapt, or you can develop your own. The example was developed to consider policy goals of ensuring safety and security, alongside other goals, like promoting constructive uses, but you could propose other goals for example, those relating to equity or autonomy.
Because this project represents an early, in-silico design phase, its governance goals focus on the responsible framing, communication, and interpretation of computational results rather than regulation of a finalized biological product.
1. Ensuring Ethical Transparency
In silico models can appear highly convincing, even though they rely on simplifying assumptions. Without transparency, such simulations may be mistakenly interpreted as real biological proof, reused incorrectly by others, or generate unjustified confidence in safety or effectiveness.
To prevent these risks, the project emphasizes:
Clear documentation of all modeling assumptions, including chosen parameters (e.g., lactose concentration thresholds, promoter sensitivity), simulation boundaries, and known limitations.
Explicit disclosure of the speculative nature of the work, clarifying potential real-world implications while emphasizing that the model does not represent a validated or deployable probiotic system.
2. Maintaining Scientific Integrity
Although the conceptual model may function optimally in simulation, real biological systems often behave unpredictably due to environmental variability and biological complexity. To maintain scientific integrity, it is essential to:
Avoid overstating the effectiveness or safety of real-world probiotics based solely on computational results, and clearly distinguish between theoretical design and experimentally validated outcomes.
3. Considering Public Health and Safety
Since biological behavior cannot be predicted with complete accuracy, the project addresses public health and safety by:
Highlighting potential risks of physical implementation, such as disruption of gut microbiome balance or unintended metabolic effects.
Including scenario-based analyses to explore possible unexpected consequences for gut microbiome health under different simulated conditions.
3. Potential Governance Actions
3. Next, describe at least three different potential governance “actions” by considering the four aspects below (Purpose, Design, Assumptions, Risks of Failure & “Success”). Try to outline a mix of actions (e.g. a new requirement/rule, incentive, or technical strategy) pursued by different “actors” (e.g. academic researchers, companies, federal regulators, law enforcement, etc). Draw upon your existing knowledge and a little additional digging, and feel free to use analogies to other domains (e.g. 3D printing, drones, financial systems, etc.).
Purpose: What is done now and what changes are you proposing?
Design: What is needed to make it “work”? (including the actor(s) involved - who must opt-in, fund, approve, or implement, etc)
Assumptions: What could you have wrong (incorrect assumptions, uncertainties)?
Risks of Failure & “Success”: How might this fail, including any unintended consequences of the “success” of your proposed actions?
PURPOSE
DESIGN
ASSUMPTIONS
RISKS OF FAILURE & “SUCCESS”
Providing mandatory transparency and documentation standards for in-silico biological models (by academic researchers, journals, funding bodies)
Require structured documentation sections describing modeling assumptions, parameter choices, simulation constraints, and known limitations of the model
Clear and standardized documentation reduces misuse, misinterpretation, and overconfidence in simulation results
Documentation may be superficial, misunderstood, or ignored by users
Encourage explicit labeling of projects as Conceptual, Exploratory, or Pre-experimental, and require clear statements that simulation outcomes do not constitute clinical or biological proof
Clear framing of claims improves scientific integrity, responsible communication, and public trust in synthetic biology research
Guidelines may be ignored outside formal academic or publishing contexts; excessive caution may slow translation of promising concepts into experimental research
Recommending scenario-based risk modeling as a design requirement (by researchers, synthetic biology educators)
Integrate scenario analysis into in-silico projects, exploring possible unintended outcomes such as microbiome imbalance, excessive enzyme expression, or metabolic side effects if the system were physically implemented
Early anticipation of risks improves downstream design decisions and promotes responsible innovation
Scenario analysis may oversimplify complex biological interactions
4. Scoring Governance Actions Against Policy Goals
4. Next, score (from 1-3 with, 1 as the best, or n/a) each of your governance actions against your rubric of policy goals. The following is one framework but feel free to make your own:
Action / Policy Goal
Ensuring Ethical Transparency
Maintaining Scientific Integrity
Considering Public Health and Safety
Providing Mandatory Transparency & Documentation Standards for In-Silico Biological Models
1
2
3
Providing Ethical Claim-Limitation Guidelines for Computational Synthetic Biology Projects
2
1
2
Recommending Scenario-Based Risk Modeling as a Design Requirement
3
2
1
5. Prioritization of Governance Options and Strategic Recommendations
5. Last, drawing upon this scoring, describe which governance option, or combination of options, you would prioritize, and why. Outline any trade-offs you considered as well as assumptions and uncertainties. For this, you can choose one or more relevant audiences for your recommendation, which could range from the very local (e.g. to MIT leadership or Cambridge Mayoral Office) to the national (e.g. to President Biden or the head of a Federal Agency) to the international (e.g. to the United Nations Office of the Secretary-General, or the leadership of a multinational firm or industry consortia). These could also be one of the “actor” groups in your matrix.
From my perspective, scenario-based risk modeling can be prioritized over the other governance options, because all three approaches address public health and safety either directly or indirectly. Scenario-based analysis explicitly explores what could go wrong if an in-silico model were physically implemented, making it the most direct mechanism for anticipating risks to gut microbiome balance or unintended metabolic effects. However, maintaining scientific integrity also plays a critical indirect role in protecting public health: by avoiding overclaiming the safety or effectiveness of a purely conceptual model, the transition from simulation to real-world application becomes more cautious, accurate, and oriented toward appropriate experimental validation, thereby reducing the likelihood of harmful misinterpretations. Similarly, ensuring ethical transparency through clear and accurate documentation of modeling assumptions, parameters, and limitations improves how the model is interpreted and reused by others, helping prevent incorrect applications that could ultimately pose health risks.
in this homework, AI ChatGPT assisted me in organizing and clearly articulating my answers and descriptions, ensuring that the content is well-structured and easy to understand.
Gingold-Belfer, R., Levy, S., Layfer, O., Pakanaev, L., Niv, Y., Dickman, R., & Perets, T. T. (2020). Use of a Novel Probiotic Formulation to Alleviate Lactose Intolerance Symptoms-a Pilot Study. Probiotics and Antimicrobial Proteins, 12(1), 112–118. https://doi.org/10.1007/s12602-018-9507-7
Khalil, A. S., & Collins, J. J. (2010). Synthetic biology: Applications come of age. Nature Reviews Genetics, 11(5), 367–379. https://doi.org/10.1038/nrg2775
Error rate and genome context
• From the slide N°= 8 , DNA polymerase has an error rate of ~1 in 10⁶ bases.
• With the human genome of ~3 × 10⁹ bp, this would result in ~3,000 errors per replication without repair.
• Biology reduces this discrepancy with proofreading activity of DNA polymerase (3′→5′ exonuclease) and post-replication mismatch repair like MutS, NER, BER…, which collectively reduce the final error rate to ~1 in 10⁹–10¹⁰.
Human protein: ~1036 bp (~345 amino acids), With ~3 codons per amino acid on average, the number of possible DNA sequences for an average human protein is ~3³⁴⁵ (~10¹⁶⁴ possible sequences).
Not all sequences work in practice because of Mutations: Insertions, deletions, transitions, and transversions that can introduce frameshifts or premature stop codons, making the protein non-functional. Also, there are some mechanism of regulations that make some Sequences creating unwanted secondary structures in mRNA, affect splicing, or introduce cryptic signals that disrupt translation.
Why it’s hard to make oligos longer than ~200 nt
Each step in chemical DNA synthesis is very efficient but not perfect, so small errors happen every time a base is added. As the oligo gets longer, these errors pile up, and beyond about 200 nucleotides it becomes very difficult to get a clean, full-length sequence.
https://pubs.rsc.org/en/content/articlepdf/2025/sc/d4sc06958g
All animals require the same 10 essential amino acids because they cannot synthesize them and must obtain them from their diet. These are: histidine, isoleucine, leucine, lysine, methionine, phenylalanine, threonine, tryptophan, valine, and arginine (arginine is essential for all animals and conditionally essential in adult humans).
The “lysine contingency” refers to the idea that lysine is often the limiting essential amino acid in plant-based diets, especially those dominated by cereals like wheat, rice, or maize. Since animals cannot make lysine, their growth and health are directly constrained by how much lysine is available in their food. So knowing that all animals share the same essential amino acid requirements makes lysine’s importance stand out even more. It shows that lysine is not just nutritionally important but evolutionarily critical.
Attend or watch all lecture and recitation videos. Optionally watch bootcamp
Part 1: Benchling & In-silico Gel Art
See the Gel Art: Restriction Digests and Gel Electrophoresis protocol for details. Overview:
Make a free account at benchling.com
Import the Lambda DNA.
Simulate Restriction Enzyme Digestion with the following Enzymes:
EcoRI
HindIII
BamHI
KpnI
EcoRV
SacI
SalI
Create a pattern/image in the style of Paul Vanouse’s Latent Figure Protocol artworks.
You might find Ronan’s website a helpful tool for quickly iterating on designs!
In this part, I imported The complete 48,502 bp linear genome of bacteriophage lambda from NCBI GenBank into Benchling. This sequence corresponds to the Lambda DNA sold by NEB (N3011) and will be used for in-silico restriction digestion.
Then simulated restriction enzyme digestion using EcoRI, HindIII, BamHI, KpnI, EcoRV, SacI, and SalI. By running in-silico gel electrophoresis . The resulting virtual gel shows discrete bands corresponding to these fragments, which demostrates how sequence information maps to physical separation in gel electrophoresis.
To create a pattern in the style of Paul Vanouse’s work, I experimented with different combinations of restriction enzymes to control the gel band patterns. By adjusting the number and length of the resulting DNA fragments, I explored how these parameters influence the final visual outcome. Through this process, I ultimately obtained a gel pattern resembling a butterfly shape.
This helped me understand how restriction digests and gels work before doing any real lab experiment. I treated this as both a technical exercise and a creative exploration, inspired by DNA gel art concepts.
Part 2: Gel Art - Restriction Digests and Gel Electrophoresis
Assignees for the following sections
MIT/Harvard students Required
Committed Listeners Optional (for those with Lab access)
Perform the lab experiment you designed in Part 1 and outlined in the Gel Art: Restriction Digests and Gel Electrophoresis protocol.
Part 3: DNA Design Challenge
Assignees for the following sections
MIT/Harvard students Required
Committed Listeners Required
3.1. Choose your protein.
In recitation, we discussed that you will pick a protein for your homework that you find interesting. Which protein have you chosen and why?
Using one of the tools described in recitation (NCBI, UniProt, google), obtain the protein sequence for the protein you chose.
[Example from our group homework, you may notice the particular format — The example below came from UniProt]
sp|P03609|LYS_BPMS2 Lysis protein OS=Escherichia phage MS2 OX=12022 PE=2 SV=1 METRFPQQSQQTPASTNRRRPFKHEDYPCRRQQRSSTLYVLIFLAIFLSKFTNQLLLSLL EAVIRTVTTLQQLLT
3.2. Reverse Translate: Protein (amino acid) sequence to DNA (nucleotide) sequence.
The Central Dogma discussed in class and recitation describes the process in which DNA sequence becomes transcribed and translated into protein.
The Central Dogma gives us the framework to work backwards from a given protein sequence and infer the DNA sequence that the protein is derived from. Using one of the tools discussed in class, NCBI or online tools (google “reverse translation tools”), determine the nucleotide sequence that corresponds to the protein sequence you chose above.
[Example: Get to the original sequence of phage MS2 L-protein from its genome phage MS2 genome - Nucleotide - NCBI]
Lysis protein DNA sequence atggaaacccgattccctcagcaatcgcagcaaactccggcatctactaatagacgccggccattcaaacatgaggattacccatgtcgaagacaacaaagaagttcaactctttatgtattgatcttcctcgcgatctttctctcgaaatttaccaatcaattgcttctgtcgctactggaagcggtgatccgcacagtgacgactttacagcaattgcttacttaa
3.3. Codon optimization.
Once a nucleotide sequence of your protein is determined, you need to codon optimize your sequence. You may, once again, utilize google for a “codon optimization tool”. In your own words, describe why you need to optimize codon usage. Which organism have you chosen to optimize the codon sequence for and why?
[Example from Codon Optimization Tool | Twist Bioscience while avoiding Type IIs enzyme recognition sites BsaI, BsmBI, and BbsI]
Lysis protein DNA sequence with Codon-Optimization
ATGGAAACCCGCTTTCCGCAGCAGAGCCAGCAGACCCCGGCGAGCACCAACCGCCGCCGCCCGTTCAAACATGAAGATTATCCGTGCCGTCGTCAGCAGCGCAGCAGCACCCTGTATGTGCTGATTTTTCTGGCGATTTTTCTGAGCAAATTCACCAACCAGCTGCTGCTGAGCCTGCTGGAAGCGGTGATTCGCACAGTGACGACCCTGCAGCAGCTGCTGACCTAA
3.4. You have a sequence! Now what?
What technologies could be used to produce this protein from your DNA? Describe in your words the DNA sequence can be transcribed and translated into your protein. You may describe either cell-dependent or cell-free methods, or both.
3.5. [Optional] How does it work in nature/biological systems?
Describe how a single gene codes for multiple proteins at the transcriptional level.
Try aligning the DNA sequence, the transcribed RNA, and also the resulting translated Protein!!! See example below.
[Example shows the biomolecular flow in central dogma from DNA to RNA to Protein] Special note that all “T” were transcribed into “U” and that the 3-nt codon represents 1-AA.
Rearranged snapshot of MS2 L-protein information flow from DNA to RNA to Protein. Captured from Ice’s Benchling and stitched together in a ppt
For the DNA design challenge, I chose a protein related to my project interest in engineered probiotics and conditional enzyme release in the gut.The enzyme β-galactosidase is well-characterized and commonly expressed in Escherichia coli, making it an ideal candidate for computational DNA design and expression modeling.
I first searched online database UniProt to obtain the amino acid sequence of the protein.
After selecting the protein, I converted the amino acid sequence of β-galactosidase (1024 residues) into the corresponding DNA sequence using the Sequence Manipulation Suite Reverse Translate tool. Because the genetic code is degenerate, multiple codons can encode the same amino acid. The resulting 3072 bp DNA sequence represents one valid nucleotide sequence capable of encoding the β-galactosidase protein.
the resulted DNA sequence was as follow:
>reverse translation of sp|P00722|BGAL_ECOLI Beta-galactosidase OS=Escherichia coli (strain K12) OX=83333 GN=lacZ PE=1 SV=2 to a 3072 base sequence of most likely codons.
atgaccatgattaccgatagcctggcggtggtgctgcagcgccgcgattgggaaaacccgggcgtgacccagctgaaccgcctggcggcgcatccgccgtttgcgagctggcgcaacagcgaagaagcgcgcaccgatcgcccgagccagcagctgcgcagcctgaacggcgaatggcgctttgcgtggtttccggcgccggaagcggtgccggaaagctggctggaatgcgatctgccggaagcggataccgtggtggtgccgagcaactggcagatgcatggctatgatgcgccgatttataccaacgtgacctatccgattaccgtgaacccgccgtttgtgccgaccgaaaacccgaccggctgctatagcctgacctttaacgtggatgaaagctggctgcaggaaggccagacccgcattatttttgatggcgtgaacagcgcgtttcatctgtggtgcaacggccgctgggtgggctatggccaggatagccgcctgccgagcgaatttgatctgagcgcgtttctgcgcgcgggcgaaaaccgcctggcggtgatggtgctgcgctggagcgatggcagctatctggaagatcaggatatgtggcgcatgagcggcatttttcgcgatgtgagcctgctgcataaaccgaccacccagattagcgattttcatgtggcgacccgctttaacgatgattttagccgcgcggtgctggaagcggaagtgcagatgtgcggcgaactgcgcgattatctgcgcgtgaccgtgagcctgtggcagggcgaaacccaggtggcgagcggcaccgcgccgtttggcggcgaaattattgatgaacgcggcggctatgcggatcgcgtgaccctgcgcctgaacgtggaaaacccgaaactgtggagcgcggaaattccgaacctgtatcgcgcggtggtggaactgcataccgcggatggcaccctgattgaagcggaagcgtgcgatgtgggctttcgcgaagtgcgcattgaaaacggcctgctgctgctgaacggcaaaccgctgctgattcgcggcgtgaaccgccatgaacatcatccgctgcatggccaggtgatggatgaacagaccatggtgcaggatattctgctgatgaaacagaacaactttaacgcggtgcgctgcagccattatccgaaccatccgctgtggtataccctgtgcgatcgctatggcctgtatgtggtggatgaagcgaacattgaaacccatggcatggtgccgatgaaccgcctgaccgatgatccgcgctggctgccggcgatgagcgaacgcgtgacccgcatggtgcagcgcgatcgcaaccatccgagcgtgattatttggagcctgggcaacgaaagcggccatggcgcgaaccatgatgcgctgtatcgctggattaaaagcgtggatccgagccgcccggtgcagtatgaaggcggcggcgcggataccaccgcgaccgatattatttgcccgatgtatgcgcgcgtggatgaagatcagccgtttccggcggtgccgaaatggagcattaaaaaatggctgagcctgccgggcgaaacccgcccgctgattctgtgcgaatatgcgcatgcgatgggcaacagcctgggcggctttgcgaaatattggcaggcgtttcgccagtatccgcgcctgcagggcggctttgtgtgggattgggtggatcagagcctgattaaatatgatgaaaacggcaacccgtggagcgcgtatggcggcgattttggcgataccccgaacgatcgccagttttgcatgaacggcctggtgtttgcggatcgcaccccgcatccggcgctgaccgaagcgaaacatcagcagcagttttttcagtttcgcctgagcggccagaccattgaagtgaccagcgaatatctgtttcgccatagcgataacgaactgctgcattggatggtggcgctggatggcaaaccgctggcgagcggcgaagtgccgctggatgtggcgccgcagggcaaacagctgattgaactgccggaactgccgcagccggaaagcgcgggccagctgtggctgaccgtgcgcgtggtgcagccgaacgcgaccgcgtggagcgaagcgggccatattagcgcgtggcagcagtggcgcctggcggaaaacctgagcgtgaccctgccggcggcgagccatgcgattccgcatctgaccaccagcgaaatggatttttgcattgaactgggcaacaaacgctggcagtttaaccgccagagcggctttctgagccagatgtggattggcgataaaaaacagctgctgaccccgctgcgcgatcagtttacccgcgcgccgctggataacgatattggcgtgagcgaagcgacccgcattgatccgaacgcgtgggtggaacgctggaaagcggcgggccattatcaggcggaagcggcgctgctgcagtgcaccgcggataccctggcggatgcggtgctgattaccaccgcgcatgcgtggcagcatcagggcaaaaccctgtttattagccgcaaaacctatcgcattgatggcagcggccagatggcgattaccgtggatgtggaagtggcgagcgataccccgcatccggcgcgcattggcctgaactgccagctggcgcaggtggcggaacgcgtgaactggctgggcctgggcccgcaggaaaactatccggatcgcctgaccgcggcgtgctttgatcgctgggatctgccgctgagcgatatgtataccccgtatgtgtttccgagcgaaaacggcctgcgctgcggcacccgcgaactgaactatggcccgcatcagtggcgcggcgattttcagtttaacattagccgctatagccagcagcagctgatggaaaccagccatcgccatctgctgcatgcggaagaaggcacctggctgaacattgatggctttcatatgggcattggcggcgatgatagctggagcccgagcgtgagcgcggaatttcagctgagcgcgggccgctatcattatcagctggtgtggtgccagaaa
After reverse translation, I verified the identity of the resulting nucleotide sequence by performing a BLASTn search against the reference lacZ gene from Escherichia coli K-12. The alignment showed 100% query coverage with an E-value of 0.0, confirming a highly significant match. The percent identity was ~84%, which is expected because reverse translation produces a synonymous DNA sequence that differs at the codon level while still encoding the same β-galactosidase protein. This result confirmed that the reverse-translated sequence correctly corresponds to the lacZ gene.
Next, I performed codon optimization of the sequence originates from E. coli K-12 to improve expression efficiency in a Lactobacillus probiotic strain (delbrueckii subsp. Bulgaricus), as this organism is the intended chassis for conditional lactase expression in the human gut, to ensure efficient translation in the final probiotic host organism.
Codon optimization was performed using a host-specific algorithm using the Vector Builder codon orimisation tool that adjusts synonymous codon usage to match the preferred codons of L. delbrueckii while preserving the original amino acid sequence.
Why codon optimization is necessary?
Codon optimization is required because different organisms preferentially use different synonymous codons. Optimizing the DNA sequence for the codon usage of the target host improves ribosome efficiency, protein yield, and reduces translational stalling.
To produce the protein from this DNA sequence, I would use a cell-dependent expression system based on bacterial transformation and expression. In this approach, This gene is then placed into an expression cassette with the necessary regulatory elements so it can be used by a biological system.
To produce the protein, I would use a cell-dependent expression system through bacterial cloning. The designed DNA sequence is inserted into a plasmid and introduced into a bacterial host by transformation. Inside the cell, the gene is transcribed into mRNA under the control of the selected promoter. The mRNA is then translated by ribosomes, which read the codons starting at the start codon and assemble the corresponding amino acids into the lactase protein. This approach follows the natural flow of genetic information (DNA to RNA to protein) and allows controlled production of the enzyme in living cells.
Part 4: Prepare a Twist DNA Synthesis Order
Assignees for the following sections
MIT/Harvard students Required
Committed Listeners Required
This is a practice exercise, not necessarily your real Twist order!
4.1. Create a Twist account, and Benchling account
4.2. Build Your DNA Insert Sequence
For example, let’s make a sequence that will make E. coli glow fluorescent green under UV light by constitutively (always) expressing sfGFP (a green fluorescent protein):
In Benchling, select New DNA/RNA sequence
Give your insert sequence a name and select DNA with a Linear topology (this is a linear sequence that will be inserted into a circular backbone vector of our choosing).
Go through each piece of the given DNA sequences highlighted below (Promoter, RBS, Start Codon, Coding Sequence, His Tag, Stop Codon, Terminator) and paste the sequences into the Benchling file one after the other (replacing the coding sequence with your codon optimized DNA sequence of interest!). Each time you add a new piece of the sequence, make sure to annotate by right clicking over the sequence and creating an annotation that describes what each piece (e.g., Promoter, RBS, etc.) is (see image below).
Promoter (e.g. BBa_J23106) TTTACGGCTAGCTCAGTCCTAGGTATAGTGCTAGC
RBS (e.g. BBa_B0034 with spacers for optimal expression) CATTAAAGAGGAGAAAGGTACC
Start Codon ATG
Coding Sequence (your codon optimized DNA for a protein of interest, sfGFP for example)
AGCAAAGGAGAAGAACTTTTCACTGGAGTTGTCCCAATTCTTGTTGAATTAGATGGTGATGTTAATGGGCACAAATTTTCTGTCCGTGGAGAGGGTGAAGGTGATGCTACAAACGGAAAACTCACCCTTAAATTTATTTGCACTACTGGAAAACTACCTGTTCCGTGGCCAACACTTGTCACTACTCTGACCTATGGTGTTCAATGCTTTTCCCGTTATCCGGATCACATGAAACGGCATGACTTTTTCAAGAGTGCCATGCCCGAAGGTTATGTACAGGAACGCACTATATCTTTCAAAGATGACGGGACCTACAAGACGCGTGCTGAAGTCAAGTTTGAAGGTGATACCCTTGTTAATCGTATCGAGTTAAAGGGTATTGATTTTAAAGAAGATGGAAACATTCTTGGACACAAACTCGAGTACAACTTTAACTCACACAATGTATACATCACGGCAGACAAACAAAAGAATGGAATCAAAGCTAACTTCAAAATTCGCCACAACGTTGAAGATGGTTCCGTTCAACTAGCAGACCATTATCAACAAAATACTCCAATTGGCGATGGCCCTGTCCTTTTACCAGACAACCATTACCTGTCGACACAATCTGTCCTTTCGAAAGATCCCAACGAAAAGCGTGACCACATGGTCCTTCTTGAGTTTGTAACTGCTGCTGGGATTACACATGGCATGGATGAGCTCTACAAA
7x His Tag (Let’s add a 7×His tag at the C-terminus of the protein to enable protein purification from E. coli) CATCACCATCACCATCATCAC
Stop Codon TAA
Terminator (e.g. BBa_B0015) CCAGGCATCAAATAAAACGAAAGGCTCAGTCGAAAGACTGGGCCTTTCGTTTTATCTGTTGTTTGTCGGTGAACGCTCTCTACTAGAGTCACACTGGCTCACCTTCGGGTGGGCCTTTCTGCGTTTATA
Once you’ve completed this, click on Linear Map to preview the entire sequence. If you intend to have a TA review a sequence in the future, this is a good way to verify that all sections are annotated!
(Optional) Share your final sequence link with a TA for review!
This insert sequence you built is commonly referred to as an expression cassette in molecular biology (a sequence you can drop into any vector and it’ll perform its function). Go ahead and download the FASTA file for the sequence you made.
It’s helpful to visualize DNA designs using SBOL Canvas (Synthetic Biology Open Language) to convey your designs. Here’s an example of what you just annotated in Benchling:
4.2. On Twist, Select The “Genes” Option
4.3. Select “Clonal Genes” option
For this demonstration, we’ll choose Clonal Genes. You’ll select clonal genes or gene fragments depending on your final project.
Historically, HTGAA projects using clonal genes (circular DNA) have reached experimental results 1-2 weeks quicker because they can be transformed directly into E. coli without additional assembly.
Gene fragments (linear DNA) offer greater design flexibility but typically require an assembly or cloning step prior to transformation. An advantage is If designed with the appropriate exonuclease protection, gene fragments can be used directly in cell-free expression.
4.4. Import your sequence
You just took an amino acid sequence of interest and converted it into DNA, codon optimized it, and built an expression cassette around it! Choose the Nucleotide Sequence option and Upload Sequence File to upload your FASTA file.
4.5. Choose Your Vector
Since we’re ordering a clonal gene, you will need to refer to Twist’s Vector Catalog to choose your circular backbone. You can think of this as taking your linear expression cassette for your protein of interest, and completing the rest of the circle!
The backbone confers many special properties like antibiotic resistance, an origin of replication, and more. Discuss with your node to decide on appropriate antibiotic options. At MIT/Harvard, you can use Ampicillin, Chloramphenicol, or Kanamycin resistance.
Twist vectors do not contain restriction sites near the insert fragment, so make sure to flank your design with cut sites if you are intending to extract this DNA insert fragment later.
For this demonstration, choose a Twist cloning vectors like pTwist Amp High Copy.
Click into your sequence and select download construct (GenBank) to get the full plasmid sequence:
Go back to your Benchling account. Inside of a folder, click the import DNA/RNA sequence button and upload the GenBank file you just downloaded.
This is the plasmid you just built with your expression cassette included. Congratulations on building your first plasmid!
Important
For your final projects, remember to include:
Fully annotated Benchling insert fragment
Desired Twist cloning vector
A lactose-inducible promoter was selected to enable conditional expression of lactase in response to lactose availability in the gut. The PlacA promoter region was extracted from the Lactococcus lactis lac operon upstream of the native ribosome binding site, with preserving lactose-responsive regulation.
For the RBS, I chose to keep the native Lactococcus lactis ribosome binding site (RBS) derived from the lacA operon which is the region immediately upstream of the coding sequence (CDS) and preserved its original spacer length to ensure efficient translation initiation in the probiotic host. Maintaining native RBS spacing is critical in Gram-positive bacteria, as ribosome binding and translation efficiency are highly sensitive to the distance between the Shine–Dalgarno sequence and the start codon.
the RBS sequence is as follow:
AGGAGGTAGTCCAA
I selected the transcription terminator from the tpi gene of Lactococcus lactis, a highly expressed native housekeeping gene, to ensure efficient and reliable transcription termination in the probiotic host.
While two related annotations are present in GenBank for this region, both correspond to the same rho-independent transcription terminator. Therefore, I chose the complete annotated terminator region (positions 958–988), which includes both the inverted repeat and the downstream poly-T tract, to ensure proper formation of the termination hairpin and robust termination of transcription.
A transcription terminator was included downstream of the lactase coding sequence to ensure proper termination of transcription. This prevents transcriptional read-through into adjacent sequences and improves the stability and predictability of gene expression, independent of promoter regulation.
ATG used as start codon and AAG as stop codon
From the selected elements, I built a linear expression cassette in Benchling containing a lactose-regulated promoter, native LAB ribosome binding site, codon-optimized lacZ, and a native transcription terminator. I exported this sequence as a FASTA file. Cassette_link_to_Benchling
When I first uploaded my expression cassette FASTA file to Twist Bioscience, I encountered an initial error related to the FASTA header name. The header exceeded the maximum allowed length (32 characters), which caused the sequence to be rejected. I fixed this issue by shortening the header name and re-uploading the file. After this correction, the sequence was accepted for further analysis.
However, after re-uploading the corrected file, additional synthesis warnings appeared. These warnings were related to large GC content variation, repetitive regions, and overall sequence complexity. These issues are mainly due to the codon-optimized lacZ gene and the presence of multiple regulatory elements such as the ribosome binding site and transcription terminator. Twist flagged these features as potential manufacturability risks.
Unfortunately, I was not able to resolve these additional issues at this stage. Fixing them would have required re-optimizing the enzyme sequence, possibly changing the host organism for codon optimization, and redesigning the regulatory architecture of the cassette. Due to time constraints and because this assignment focuses on learning the design and ordering workflow rather than producing a synthesis-ready construct, I chose not to redesign the sequence further.
For this exercise, I proceeded by selecting a Twist clonal vector (pTwist Amp High Copy) to complete the plasmid design. Although the insert sequence still contained manufacturability warnings. However, In a real DNA synthesis order, additional sequence optimization would be required to reduce GC content extremes and repetitive regions to meet synthesis constraints.
Part 5: DNA Read/Write/Edit
Assignees for the following sections
MIT/Harvard students Required
Committed Listeners Required
5.1 DNA Read
(i) What DNA would you want to sequence (e.g., read) and why? This could be DNA related to human health (e.g. genes related to disease research), environmental monitoring (e.g., sewage waste water, biodiversity analysis), and beyond (e.g. DNA data storage, biobank).
DNA-based digital data storage technology. Source: Archives in DNA: Workshop Exploring Implications of an Emerging Bio-Digital Technology through Design Fiction - Scientific Figure on ResearchGate. Available from: https://www.researchgate.net/figure/DNA-based-digital-data-storage-technology_fig1_353128454 [accessed 11 Feb 2025].
(ii) In lecture, a variety of sequencing technologies were mentioned. What technology or technologies would you use to perform sequencing on your DNA and why? Also answer the following questions:
Is your method first-, second- or third-generation or other? How so?
What is your input? How do you prepare your input (e.g. fragmentation, adapter ligation, PCR)? List the essential steps.
What are the essential steps of your chosen sequencing technology, how does it decode the bases of your DNA sample (base calling)
What is the output of your chosen sequencing technology?
5.2 DNA Write
(i) What DNA would you want to synthesize (e.g., write) and why? These could be individual genes, clusters of genes or genetic circuits, whole genomes, and beyond. As described in class thus far, applications could range from therapeutics and drug discovery (e.g., mRNA vaccines and therapies) to novel biomaterials (e.g. structural proteins), to sensors (e.g., genetic circuits for sensing and responding to inflammation, environmental stimuli, etc.), to art (DNA origamis). If possible, include the specific genetic sequence(s) of what you would like to synthesize! You will have the opportunity to actually have Twist synthesize these DNA constructs! :)
(ii) What technology or technologies would you use to perform this DNA synthesis and why? Also answer the following questions:
What are the essential steps of your chosen sequencing methods?
What are the limitations of your sequencing method (if any) in terms of speed, accuracy, scalability?
5.3 DNA Edit
(i) What DNA would you want to edit and why? In class, George shared a variety of ways to edit the genes and genomes of humans and other organisms. Such DNA editing technologies have profound implications for human health, development, and even human longevity and human augmentation. DNA editing is also already commonly leveraged for flora and fauna, for example in nature conservation efforts, (animal/plant restoration, de-extinction), or in agriculture (e.g. plant breeding, nitrogen fixation). What kinds of edits might you want to make to DNA (e.g., human genomes and beyond) and why?
(ii) What technology or technologies would you use to perform these DNA edits and why? Also answer the following questions:
How does your technology of choice edit DNA? What are the essential steps?
What preparation do you need to do (e.g. design steps) and what is the input (e.g. DNA template, enzymes, plasmids, primers, guides, cells) for the editing?
What are the limitations of your editing methods (if any) in terms of efficiency or precision?
DNA read:
I would want to sequence DNA used for digital data storage. In my knowledge, this technology enables the storage of digital information such as text, images, or files by encoding them into DNA sequences instead of being stored on hard drives. DNA is extremely stable and can store a huge amount of information in a very small space, which makes it interesting for long-term data storage. Reading this DNA by sequencing is necessary to retrieve the stored information and check that the data has not been damaged or changed over time.
For this porpose, I would use Illumina sequencing because it is very accurate and well suited for reading short DNA fragments, which is how DNA data storage is usually organized. this strategy can be performed following 4 crusial steps: Image_adress
Generation
This method is a second-generation sequencing technology. It sequences millions of short DNA fragments in parallel, which makes it fast and reliable, but it cannot read very long DNA molecules in one piece.
Input and preparation
The input is DNA that contains the encoded digital data.
To prepare it: The DNA is fragmented into short pieces, Adapters are added to both ends of the fragments, The fragments are amplified using PCR, The prepared DNA is loaded onto a flow cell
How the technology reads DNA (base calling)
Each DNA fragment is copied one base at a time using fluorescently labeled nucleotides. A camera records the color added at each step, and the machine translates these signals into DNA letters (A, T, C, G).
Output
The output is a large number of short DNA sequence reads saved as digital files. These reads are then assembled and decoded to recover the original stored data.
DNA write:
I am particularly interested in the genes in human genomic DNA related to pharmacogenomics and pharmacogenetics. These fields study how genetic variation affects how people respond to drugs. So, I would want to synthesize genes encoding drug-metabolizing enzymes, like human cytochrome P450 enzymes. Since, these genes are central to pharmacogenetics as variations in them strongly influence how drugs are processed in the body. Synthesizing these genes allows them to be studied, expressed, and tested in controlled systems.
So in order to synthetizing them , I would use chemical DNA synthesis combined with gene assembly, which is the standard approach used by commercial DNA synthesis companies.
Essential steps
DNA synthesis starts with the digital design of the DNA sequence. This is followed by the chemical synthesis of short oligonucleotides, which are then assembled into full-length genes (for example, using Gibson Assembly). The synthesized genes are cloned into plasmids and finally sequence-verified to confirm their accuracy before use.
This DNA synthesis method is easy to use and works well for many projects.However, it can sometimes make mistakes during the process. Parts of DNA that have lots of G and C letters or repeated sequences are harder to make. Very long DNA pieces also need to be built from many shorter fragments, which can be tricky and may cause errors.
DNA Edit:
I would want to edit DNA in human cell lines used for drug testing, focusing on genes that affect how drugs work. Changing these genes helps researchers see how different genetic variants influence drug effects and side effects, which is useful in pharmacogenomics.
The modification can be realised by CRISPR for editing because it allows precise and programmable changes to DNA. this stratigy works by using a guide RNA to find a specific DNA sequence. The Cas enzyme then makes a cut or nick, and the cell repairs it, introducing the change we want.
To use CRISPR, you need to design guide RNAs, prepare the CRISPR components (DNA, RNA, or protein), deliver them into cells, and then check which cells were correctly edited.
However, there are some limitations, like different editing efficiencies depending on cell type, and ethical or regulatory concerns when working with human cells.
in this homework, AI ChatGPT assisted me in organizing and clearly articulating my answers and descriptions, ensuring that the content is well-structured and easy to understand.
Sources:
Ahmad, E., Mahapatra, V., M, V. V., & Nagaraja, V. (2022). Intrinsic and Rho-dependent termination cooperate for efficient transcription termination at 3’ untranslated regions (p. 2022.07.21.500918). bioRxiv. https://doi.org/10.1101/2022.07.21.500918
Amin, A. A., Olama, Z. A., & Ali, S. M. (2023). Characterization of an isolated lactase enzyme produced by Bacillus licheniformis ALSZ2 as a potential pharmaceutical supplement for lactose intolerance. Frontiers in Microbiology, 14, 1180463. https://doi.org/10.3389/fmicb.2023.1180463
Bioinformatic Tools | VectorBuilder. (n.d.). Retrieved February 17, 2026, from https://en.vectorbuilder.com/tool/overview.html
Coenen, T. M. M., Bertens, A. M. C., de Hoog, S. C. M., & Verspeek-Rip, C. M. (2000). Safety evaluation of a lactase enzyme preparation derived from Kluyveromyces lactis. Food and Chemical Toxicology, 38(8), 671–677. https://doi.org/10.1016/S0278-6915(00)00053-3
De Jesus, L. C. L., Aburjaile, F. F., Sousa, T. D. J., Felice, A. G., Soares, S. D. C., Alcantara, L. C. J., & Azevedo, V. A. D. C. (2022). Genomic Characterization of Lactobacillus delbrueckii Strains with Probiotics Properties. Frontiers in Bioinformatics, 2, 912795. https://doi.org/10.3389/fbinf.2022.912795
de Vrese, M., Stegelmann, A., Richter, B., Fenselau, S., Laue, C., & Schrezenmeir, J. (2001). Probiotics—Compensation for lactase insufficiency123. The American Journal of Clinical Nutrition, 73(2), 421s–429s. https://doi.org/10.1093/ajcn/73.2.421s
Saqib, S., Akram, A., Halim, S. A., & Tassaduq, R. (2017). Sources of β-galactosidase and its applications in food industry. 3 Biotech, 7(1), 79. https://doi.org/10.1007/s13205-017-0645-5
Week 3 HW: Lab Automation
Assignment: Python Script for Opentrons Artwork
Assignees for this section
MIT/Harvard students Required
Committed Listeners Required
Your task this week is to Create a Python file to run on an Opentrons liquid handling robot.
Review this week’s recitation and this week’s lab for details on the Opentrons and programming it.
Generate an artistic design using the GUI at opentrons-art.rcdonovan.com.
Using the coordinates from the GUI, follow the instructions in the HTGAA26 Opentrons Colab to write your own Python script which draws your
design using the Opentrons. You may use AI assistance for this coding — Google Gemini is integrated into Colab (see the stylized star bottom center); it will do a good job writing functional Python, while you probably need to take charge of the art concept.
If you’re a proficient programmer and you’d rather code something mathematical or algorithmic instead of using your GUI coordinates, you may do that instead.
Ask for help early!
If you are having any trouble with scripting, contact your TAs as soon as possible for help.
Do not wait until your scheduled robot time slot or you may not be able to complete this assignment!
If the Python component is proving too problematic even with AI and human assistance, download the full Python script from the GUI website and submit that:
Use the download icon pointed to by the red arrow in this diagram.
If you use AI to help complete this homework or lab, document how you used AI and which models made contributions.
Sign up for a robot time slot if you are at MIT/Harvard/Wellesley or at a Node offering Opentrons automation. The Python script you created
will be run on the robot to produce your work of art!
At MIT/Harvard? Lab times are on Thursday Feb.19 between 10AM and 6PM.
At other Nodes? Please coordinate with your Node.
Submit your Python file via this form.
I created two different agar art designs using two Arabic calligraphy styles. For the first design, I used a simple calligraphy style and created it directly using Python scripting in a Google Colab notebook. For the second design, I used the Opentrons Automation Art interface to design the calligraphy and obtain the coordinates.
I used the Google Gemini AI tool in Colab to understand the logic of the example Opentrons scripts provided in the lab. It helped me understand how coordinates, loops, and pipetting commands work. I also used Gemini AI to help identify and correct mistakes in my Python script, such as indentation errors. I reviewed the suggestions and edited the final code myself.
Post-Lab Questions
Assignees for this section
MIT/Harvard students Required
Committed Listeners Required
One of the great parts about having an automated robot is being able to precisely mix, deposit, and run reactions without much intervention, and design and deploy experiments remotely.
For this week, we’d like for you to do the following:
Find and describe a published paper that utilizes the Opentrons or an automation tool to achieve novel biological applications.
Write a description about what you intend to do with automation tools for your final project. You may include example pseudocode, Python scripts, 3D printed holders, a plan for how to use Ginkgo Nebula, and more. You may reference this week’s recitation slide deck for lab automation details.
While your description/project idea doesn’t need to be set in stone, we would like to see core details of what you would automate. This is due at the start of lecture and does not need to be tested on the Opentrons yet.
Example 1: You are creating a custom fabric, and want to deposit art onto specific parts that need to be intertwined in odd ways. You can design a 3D printed holder to attach this fabric to it, and be able to deposit bio art on top. Check out the Opentrons 3D Printing Directory.
Example 2: You are using the cloud laboratory to screen an array of biosensor constructs that you design, synthesize, and express using cell
free protein synthesis.
Echo transfer biosensor constructs and any required cofactors into specified wells.
Bravo stamp in CPFS reagent master mix into all wells of a 96-well / 384-well plate.
Multiflo dispense the CFPS lysate to all wells to start protein expression.
PlateLoc seal the plate.
Inheco incubate the plate at 37°C while the biosensor proteins are synthesized.
XPeel remove the seal.
PHERAstar measure fluorescence to compare biosensor responses.
Featured Article: Automated Assembly of Programmable RNA-Based Sensors
The research aimed to solve the challenge of rapidly designing and building large libraries of RNA sensors that can “sense” specific viral RNA signatures. These sensors are crucial for diagnostic applications and understanding RNA-protein interactions. The authors focused on the biological validation of these sensors in both in vivo (bacteria) and cell-free systems.
They used the following lab automation:
Hardware: Hamilton Microlab STAR liquid-handling workstation.
Software: Custom Python scripts integrated with the liquid handler’s control software to manage complex plate layouts and reaction conditions.
The researchers used the automated system as a tool to facilitate:
High-Throughput Plasmid Assembly: The authors needed to construct 144 unique plasmids encoding different riboregulator designs. Doing this manually would be prone to pipetting errors and extremely time-consuming.
Library Preparation: Automation was used to prepare DNA libraries and reaction mixes for cell-free protein synthesis assays, ensuring consistent reagent volumes across hundreds of samples.
Normalization and Dilution: The Hamilton system handled the precise normalization of DNA concentrations across plates, which is critical for accurate comparative screening of sensor performance.
The study successfully identified several high-performing RNA sensors capable of detecting viral targets. The use of automation allowed the team to scale their construction phase by nearly 10-fold compared to manual workflows, enabling them to test a much wider range of biological designs than previously possible.
For understanding the content of this artical and which type of Lab automation the authors used in their research , i used the AI tool “SCISPACE”.
Final project Lab Automation:
My final project focuses on developing an in silico model of a lactose-responsive probiotic that produces lactase only when lactose is present. The physical implementation of this model would allow laboratory automation to verify its predicted results through experimental tests. A liquid-handling robot such as Opentrons could be used to prepare a multi-well plate containing a gradient of lactose concentrations. The robot would then inoculate each well with the engineered probiotic strain, and perform timed sampling to measure lactase activity or reporter output. The automated workflow enables scientists to perform systematic and repeatable tests on lactose responses of the genetic circuit. This helps them match their experimental results with their computer-based model. The project currently exists as a computational project which will use automation as a future extension of the project which does not require automation for its current research activities.
Final Project Ideas
Assignees for this section
MIT/Harvard students Required
Committed Listeners Required
As explained in this week’s recitation, add 1-3 slides in your Node’s section of this slide deck with 3 ideas you have for an Individual Final Project. Be sure to put your name, city, and country on your slide!
1st Idea: In-Silico Model of an Engineered Probiotic Producing Lactase in Response to Lactose
Problematic:
Many people cannot digest lactose because they lack enough lactase in their intestine. A possible solution is to use engineered probiotics that produce lactase only when lactose is present.
Before building such probiotics in the laboratory, it is important to understand how the genetic system would behave. So, without computational modeling, designing these systems requires trial-and-error experiments that are slow and expensive.
There is a need for a simple computational model that can predict how a lactose-responsive genetic circuit would control lactase production over time. Image_ref
Objectives:
The project is based on a lactose-responsive genetic cassette, who’s dynamic behavior is modeled as a genetic circuit in silico. The objectives of this project are:
–> To build an in-silico model of a lactose-responsive genetic circuit.
–> To simulate how lactose stimulate lactase production.
–> To study how changing key parameters affects lactose degradation.
–> To explore system behavior completely in silico.
Project Description:
The project develops a purely computational model of an engineered probiotic strain. The model is based on a lactose-responsive genetic cassette, whose dynamic behavior is represented in silico as a genetic circuit:
– a lacA promoter, operator, and native RBS from Lactococcus lactis for lactose sensing and regulation,
– the lacZ gene from Escherichia coli K-12, encoding β-galactosidase (lactase).
I used an AI tool (ChatGPT) to guide me about the repression mechanism I should use, and its response was as follows: To ensure realistic behavior in the model, the lacA promoter includes a native operator, normally repressed by a LacR-like protein in Lactococcus lactis. In the simulation, a repression term is included to prevent unnecessary accumulation of lacZ (lactase) when lactose is absent.
The model simulates how the presence of lactose activates the promoter, leading to lactase production, and how this enzyme then degrades lactose over time.
No DNA construction or wet-lab experiments are performed. All behavior is represented mathematically and simulated using a computer.
Model promoter activation based on lactose concentration.
Model lactase production and degradation over time.
Model lactose degradation by lactase.
Run simulations to observe system behavior.
Change parameters to study different scenarios.
Limitations:
The model does not include other gut microbes.
The gut environment is assumed constant.
Results are predictive, not experimentally validated.
2nd Idea:Engineering an E. coli Reporter Strain to Monitor Protein Aging During Heterologous Expression Using a Fluorescent Timer Protein
Problematic:
Escherichia coli BL21(DE3) is one of the most widely used hosts for heterologous protein expression in research and biotechnology.
Although protein expression levels can be easily measured, there are very limited tools to determine how long the expressed protein molecules have persisted inside the cell. During prolonged induction, proteins may accumulate, age, misfold, or lose functionality, even when expression appears successful.
Most current methods detect protein quality only after purification, making optimization of expression conditions slow and inefficient.
So, there is a need for a genetically encoded reporter system that can estimate protein aging in living cells during expression. Image_ref
Objectives:
This project is based on a fluorescent timer protein–based reporter system integrated into a heterologous protein expression strain. The objectives are:
–> To engineer a reporter strain capable of estimating protein age in vivo.
–> To use a fluorescent timer protein to distinguish newly synthesized and older proteins.
–> To monitor protein aging during prolonged heterologous expression.
–> To provide a practical tool for optimizing protein expression conditions.
Project Description:
The project focuses on the genetic engineering of a protein expression strain of E. coli BL21(DE3).
The reporter system is based on a genetic fusion between:
a protein of interest (POI) expressed under the T7 promoter, and
a fluorescent timer protein whose emission spectrum changes over time after synthesis.
The genetic construct consists of:
After induction, newly synthesized POI–timer fusion proteins initially emit one fluorescent signal. As time progresses, the timer protein matures and shifts to a second fluorescent signal. The ratio of the two fluorescence signals provides an estimate of the age distribution of the expressed protein population.
I used AI tool (ChatGPT) version to refine questions related to the necessary genetic elements required for T7-based heterologous expression in Escherichia coli BL21(DE3) and to determine the appropriate placement of a fluorescent timer gene for monitoring the age of the expressed protein.
Steps to Achieve the Project:
Select a heterologous protein suitable for expression in E. coli.
Design a genetic fusion between the protein of interest and a fluorescent timer protein.
Clone the fusion construct under a T7 promoter into an expression plasmid.
Transform the plasmid into E. coli BL21(DE3).
Induce protein expression using IPTG.
Monitor fluorescence signals over time using appropriate excitation/emission settings.
Calculate fluorescence signal ratios to estimate protein aging.
Compare protein aging under different induction times and expression conditions.
Limitations:
Fusion of the timer protein may affect protein folding or function.
Protein damage mechanisms are not directly measured.
3rd Idea:Engineering Houseplants for Atmospheric Carbon Monoxide (CO) Capture
Problematic:
Carbon monoxide (CO) is a toxic gas produced by cars, heaters, and incomplete combustion. It is dangerous for humans, especially in indoor environments. Current solutions such as CO detectors can detect the gas but cannot remove it.
Some bacteria naturally use CO as an energy source and convert it into carbon dioxide (CO₂). However, common houseplants cannot metabolize CO. If plants could be engineered to convert CO into CO₂, they could act as natural biological air filters. Image_ref
Objectives:
The objectives of this project are:
–> To engineer a houseplant capable of converting carbon monoxide into carbon dioxide.
–> To use microbial genes that naturally perform CO oxidation.
–> To ensure the system works safely in oxygen-rich (indoor) environments.
–> To allow the produced CO₂ to be reused by the plant’s normal photosynthesis.
–> To design a genetically stable and safe indoor plant system.
Project Description:
This project engineers a plant to express a bacterial enzyme called carbon monoxide dehydrogenase (CODH). This enzyme converts carbon monoxide (CO) into carbon dioxide (CO₂).
The CO₂ produced by this reaction is not wasted. Instead, it enters the plant’s natural photosynthetic pathway (Calvin cycle), where it can be fixed into sugars. The plant therefore detoxifies CO while continuing its normal metabolism.
The system is designed to work only when CO is present, to avoid unnecessary energy use.
Genetic Elements for construct design:
CO Oxidation Enzymes
The core of the system is the carbon monoxide dehydrogenase (CODH) enzyme, which is responsible for converting carbon monoxide (CO) into carbon dioxide (CO₂). This enzyme is composed of three subunits encoded by the genes coxL, coxM, and coxS. The coxL gene encodes the large catalytic subunit, coxM encodes a subunit involved in electron transfer, and coxS encodes a structural subunit that stabilizes the enzyme complex. These genes originate from Oligotropha carboxidovorans, a bacterium that can oxidize CO in the presence of oxygen, making it suitable for expression in plant cells.
Promoter (Gene Expression Control)
To drive the expression of the CODH genes in plant cells, the CaMV 35S promoter is used. This promoter originates from the Cauliflower mosaic virus and is one of the most widely used promoters in plant biotechnology. It enables strong and constitutive gene expression across many plant tissues and is well characterized, making it a reliable choice for this project.
Subcellular Targeting Signal
A chloroplast transit peptide is included to ensure that the CODH proteins are transported into the chloroplast after synthesis. This targeting signal is derived from the small subunit of the plant enzyme Rubisco, which naturally localizes to the chloroplast. By directing the CODH enzymes to the chloroplast, the CO₂ produced from CO oxidation is generated close to the photosynthetic machinery, allowing it to be efficiently reused by the plant during photosynthesis.
Transcription Terminator
The NOS terminator is used to ensure proper termination of transcription and stable gene expression. This terminator originates from Agrobacterium tumefaciens and is commonly used in plant genetic constructs. Its function is to signal the end of transcription, improving mRNA stability and ensuring reliable expression of the introduced genes.
Steps to Achieve the Project:
Select CO-oxidation genes from aerobic bacteria.
Adapt bacterial gene sequences for plant expression (codon optimization).
Confirm expression of CODH proteins in plant cells.
Evaluate CO removal and plant health in controlled conditions.
Assess whether produced CO₂ supports normal photosynthesis.
Limitations:
Plant genetic engineering is slow and complex.
CO uptake by plants may be limited.
CO metabolism efficiency may be low.
in this homework, AI ChatGPT also assisted me in organizing and clearly articulating my answers and descriptions, ensuring that the content is well-structured and easy to understand.
Hartl, F. U., Bracher, A., & Hayer-Hartl, M. (2011). Molecular chaperones in protein folding and proteostasis. Nature, 475(7356), 324–332. https://doi.org/10.1038/nature10317
Heiss, S., Hörmann, A., Tauer, C., Sonnleitner, M., Egger, E., Grabherr, R., & Heinl, S. (2016). Evaluation of novel inducible promoter/repressor systems for recombinant protein expression in Lactobacillus plantarum. Microbial Cell Factories, 15(1), 50. https://doi.org/10.1186/s12934-016-0448-0
Orina, F., Amukoye, E., Bowyer, C., Chakaya, J., Das, D., Devereux, G., Dobson, R., Dragosits, U., Gray, C., Kiplimo, R., Lesosky, M., Loh, M., Meme, H., Mortimer, K., Ndombi, A., Pearson, C., Price, H., Twigg, M., West, S., & Semple, S. (2024). Household carbon monoxide (CO) concentrations in a large African city: An unquantified public health burden? Environmental Pollution, 351, 124054. https://doi.org/10.1016/j.envpol.2024.124054
Robson, J. M., Arevalos, N. R., & Green, A. A. (2025). Automated Assembly of Programmable RNA-Based Sensors. bioRxiv, 2025.08.12.669972. https://doi.org/10.1101/2025.08.12.669972
week 04 HW: protein design-part-I
Part A. Conceptual Questions
Assignees for this section
MIT/Harvard students Required
Committed Listeners Required
Answer any NINE of the following questions from Shuguang Zhang: (i.e. you can select two to skip)
How many molecules of amino acids do you take with a piece of 500 grams of meat? (on average an amino acid is ~100 Daltons)
Why do humans eat beef but do not become a cow, eat fish but do not become fish?
Why are there only 20 natural amino acids?
Can you make other non-natural amino acids? Design some new amino acids.
Where did amino acids come from before enzymes that make them, and before life started?
If you make an α-helix using D-amino acids, what handedness (right or left) would you expect?
Can you discover additional helices in proteins?
Why are most molecular helices right-handed?
Why do β-sheets tend to aggregate?
What is the driving force for β-sheet aggregation?
Why do many amyloid diseases form β-sheets?
Can you use amyloid β-sheets as materials?
Design a β-sheet motif that forms a well-ordered structure.
Amino Acid Count in 500g Meat: Meat is roughly 20% protein by mass. (Human Nutrition - Protein, Vitamins, Minerals | Britannica, n.d.)
500g meat x 0.20 = 100g protein.
Using an average mass of 100 Daltons (Da) per amino acid: 100g / 100 Daltons (or g/mol) = 1 moles of amino acids
1x 6.022 x 1023 = 6.022 x 10²³ molecules /1 mole.
Why we don’t become cows: When we eat protein, our digestive system breaks it down into individual amino acids. Our body then uses its own DNA information to reassemble those amino acids into human proteins. The information which is coded by the sequence of AA is destroyed, but the building blocks or AA are reused.
Why only 20 amino acids: In nature, the use of 20 amino acids is often explained as a “frozen accident” that originated in the early RNA World. This set worked well very early in Earth’s history and then became fixed. These 20 amino acids were good enough to build strong and functional proteins. Even though many other amino acids exist, this small group provides enough variety to perform many functions while remaining simple, stable, and efficient for cells to use. (Doig, 2017)
Non-natural amino acids: Yes, scientists can make non-natural (unnatural) amino acids. They do this using chemical methods and special genetic tools that allow new amino acids to be added to proteins. These new amino acids can give proteins new properties that natural amino acids do not have. (Young & Schultz, 2010)
For example, A new amino acid could be made by taking a normal amino acid, like alanine, and adding a fluorine atom to its side chain. This fluorinated amino acid would make proteins more stable and less likely to break down, which is useful for drug design. (Adhikari et al., n.d.)
Pre-life origins of amino acids: According to Gutiérrez-Preciado, Romero, and Peimbert (2010) Before enzymes and living organisms existed, amino acids were probably formed naturally on early Earth. Energy from lightning, UV light, and volcanic heat helped simple gases react to make amino acids. Some amino acids were also brought to Earth by meteorites and comets. Together, these processes created a “primordial soup” of basic organic molecules. (Amino Acids, Evolution | Learn Science at Scitable, n.d.)
D-amino acid α-helix: In nature, L-amino acids form right-handed helices. If you used only D-amino acids, the stereochemistry would be mirrored, resulting in a left-handed $\alpha$-helix. (Zotti et al., n.d.)
Additional helices: Yes, additional helical structures besides the standard α-helix can be found in proteins. Studies show that other types of helices occur in many proteins, but they are often overlooked or mistaken for small distortions in α-helices. These helices are especially common in membrane proteins and are found in a significant number of known protein structures.(Vieira-Pires & Morais-Cabral, 2010)
Why right-handed helices: because this shape is the most stable for the natural building blocks of life. L-amino acids and D-sugars fit together best in a right-handed twist, which allows strong hydrogen bonds and reduces crowding between atoms. Left-handed helices are usually less stable or hard to form. (Right-Handed Alpha-Helix - an Overview | ScienceDirect Topics, n.d.)
β -sheet aggregation: β-sheets tend to aggregate because their edges have exposed hydrogen-bonding groups that easily stick to other β-strands. The main driving forces are hydrogen bonding between strands and the hydrophobic effect, which together make the stacked β-sheet structure very stable and allow fibrils to form.(Gsponer & Vendruscolo, 2006)
Part B: Protein Analysis and Visualization
Assignees for this section
MIT/Harvard students Required
Committed Listeners Required
In this part of the homework, you will be using online resources and 3D visualization software to answer questions about proteins. Pick any protein (from any organism) of your interest that has a 3D structure and answer the following questions:
Briefly describe the protein you selected and why you selected it.
Identify the amino acid sequence of your protein.
How long is it? What is the most frequent amino acid? You can use this Colab notebook to count the frequency of amino acids.
How many protein sequence homologs are there for your protein? Hint: Use Uniprot’s BLAST tool to search for homologs.
Does your protein belong to any protein family?
Identify the structure page of your protein in RCSB
When was the structure solved? Is it a good quality structure? Good quality structure is the one with good resolution. Smaller the better (Resolution: 2.70 Å)
Are there any other molecules in the solved structure apart from protein?
Does your protein belong to any structure classification family?
Open the structure of your protein in any 3D molecule visualization software:
PyMol Tutorial Here (hint: ChatGPT is good at PyMol commands)
Visualize the protein as “cartoon”, “ribbon” and “ball and stick”.
Color the protein by secondary structure. Does it have more helices or sheets?
Color the protein by residue type. What can you tell about the distribution of hydrophobic vs hydrophilic residues?
Visualize the surface of the protein. Does it have any “holes” (aka binding pockets)?
I chose the protein mCherry because it is a small red fluorescent protein that is easy to visualize and analyze using 3D protein visualization software. Its structure is well known and has a clear β-barrel shape, which makes it easy to study secondary structure, amino acid distribution, and surface features. This makes mCherry a good example protein for learning basic protein sequence and structure analysis.
The mCherry protein analyzed here is the standard red fluorescent protein and does not function as a fluorescent timer. However, according to the fluorescent protein database (FPbase), mCherry is the parent fluorescent protein for several timer-based reporters, including the medium fluorescent timer planned for my final project. Therefore, mCherry is used in this assignment as a reference protein to understand the structure and sequence properties of fluorescent proteins before working with fluorescent timer variants.
I obtained the amino acid sequence of mCherry from the FPbase, which links laboratory fluorescent protein names to biological databases. FPbase provided the UniProt identifier X5DSL3, which is now stored in UniParc (UPI000046F63B) because the UniProtKB entry was removed. And also, the same database provided the genebank identifier for this protein AAV52164, which from where I got the sequence in fasta format.
This is the obtained sequence :
>AAV52164.1 monomeric red fluorescent protein [synthetic construct]
MVSKGEEDNMAIIKEFMRFKVHMEGSVNGHEFEIEGEGEGRPYEGTQTAKLKVTKGGPLPFAWDILSPQF
MYGSKAYVKHPADIPDYLKLSFPEGFKWERVMNFEDGGVVTVTQDSSLQDGEFIYKVKLRGTNFPSDGPV
MQKKTMGWEASSERMYPEDGALKGEIKQRLKLKDGGHYDAEVKTTYKAKKPVQLPGAYNVNIKLDITSHN
EDYTIVEQYERAEGRHSTGGMDELYK
The protein sequence is 236 amino acids long and a molecular mass of approximately 26.7 kDa. It has been confirmed at the protein level, although the UniProt entry is currently unreviewed (TrEMBL).
Using the provided Colab notebook, I analyzed the amino acid composition of the sequence and found that glycine (G) is the most frequent amino acid, appearing 25 times.
Note
While analyzing the amino acid sequence of mCherry, I noticed a small difference between the sequence length reported by UniProt (236 amino acids) and the sequence obtained from the Colab notebook (241 amino acids). This discrepancy is likely due to the Colab sequence including extra residues from expression constructs, such as start codons, tags, or linkers, which are not part of the canonical protein. UniProt provides the biologically relevant, canonical sequence, which is what I used for further analysis and visualization in this homework.
To identify protein sequence homologs of mCherry, I used the BLAST tool available on UniProt.
Using the BLAST tool in UniProt, a total of 227 homologous protein sequences were identified for mCherry in the UniProtKB database. Among these results, 13 sequences are reviewed (Swiss-Prot) and 214 are unreviewed (TrEMBL). The homologs show a wide range of sequence identities, from about 23.6% up to 100%, with very low E-values (as low as 4.4 × 10⁻¹⁷⁵), indicating strong evolutionary relatedness.
Most homologous proteins have sequence lengths between 200 and 400 amino acids, which is similar to mCherry (236 amino acids). Many homologs originate from marine organisms, especially corals and sea anemones such as Porites lobata, Pocillopora meandrina, and Discosoma species, which are known natural sources of GFP-like fluorescent proteins. Some homologs also appear in bacteria and other organisms, reflecting that mCherry is an engineered protein that has been widely introduced into different hosts for research purposes. Overall, these results confirm that mCherry belongs to a well-conserved GFP-like fluorescent protein family with broad biological and biotechnological use.
The mCherry protein belongs to a known protein family. According to UniProt family and domain analysis, mCherry is part of the green fluorescent protein (GFP)-like family , even though it emits red light. This classification is supported by several databases, including InterPro, Pfam, Gene3D, and PRINTS, all of which identify mCherry as a GFP or GFP-related protein. Proteins in this family share a conserved structure and chromophore-forming mechanism.
The structure of the selected protein mCherry is available in the RCSB Protein Data Bank under the PDB ID 2H5Q, titled “Crystal structure of mCherry.” This structure represents the red fluorescent protein mCherry derived from Discosoma species and expressed in Escherichia coli. The structure was solved using X-ray diffraction and was deposited in May 2006 and released in August 2006.
The quality of this structure is very high. It was solved at a resolution of 1.36 Å, which is much better than the 2.70 Å threshold typically used to define a good-quality structure. Lower resolution values indicate more detailed and accurate atomic positions, so a resolution of 1.36 Å means the structure is very reliable. In addition, the reported R-values (R-work ≈ 0.15 and R-free ≈ 0.19) further support that this is a well-refined and high-quality crystal structure.
Besides the protein itself, the solved structure contains a modified residue that corresponds to the mature chromophore of mCherry. This chromophore is formed from amino acids within the protein chain and is responsible for fluorescence. No additional ligands, cofactors, or external small molecules are present. The biological assembly is a single monomer, which means that the protein functions as one chain and does not require binding to other protein subunits.
According to SCOP (Structural Classification of Proteins), mCherry is classified within the fluorescent protein family and the GFP-like superfamily. SCOP groups proteins based on their three-dimensional structure rather than their biological function or expression host. In this classification, mCherry contains a single domain (residues 6–224) that forms the characteristic β-barrel fold shared by GFP-like proteins. This confirms that mCherry belongs to the same structural superfamily as other green and red fluorescent proteins that use a similar fold to support fluorescence.
Note
The difference in the listed organism for mCherry between databases is not an error but is due to how engineered proteins are described. The Fluorescent Protein Database (FPbase) lists mCherry as originating from Discosoma species because mCherry was originally engineered from DsRed, a natural red fluorescent protein found in coral. FPbase focuses on the biological and evolutionary origin of fluorescent proteins. In contrast, UniProt lists mCherry under organisms such as Anaplasma marginale because the mCherry gene has been artificially inserted into this organism for experimental use. UniProt records the organism in which a protein sequence is present or expressed, even if the protein is not naturally produced by that organism. Therefore, both databases are correct and provide different but complementary information about the same engineered fluorescent protein.
The protein was visualized using cartoon, ribbon, and ball-and-stick representations to examine overall fold and atomic details.
Coloring by secondary structure shows that mCherry contains many β-sheets about 11 β-sheets and very few α-helices (only 3 helices) . The protein is dominated by a β-barrel fold, which is typical for GFP-like fluorescent proteins.
Using the PyMOL command line, I colored the hydrophobic residues yellow and the hydrophilic residues red. The resulting structure shows a clear alternating pattern along the β-strands, where hydrophilic side chains face the exterior to interact with the aqueous environment (supported by the presence of surrounding water molecules), while hydrophobic side chains face the interior. This internal hydrophobic core effectively shields the chromophore from the solvent, which is essential for its fluorescence.
Based on the surface visualization of the mCherry protein (PDB: 2H5Q), the protein does not show any clear holes or binding pockets. The surface is compact and smooth, forming a closed β-barrel structure that surrounds the chromophore inside the protein. Although small bumps and grooves are visible on the surface due to amino acid side chains, there are no deep openings that lead into the protein core. This sealed structure is important for mCherry’s function, because it protects the internal chromophore from water or oxygen that could interfere with fluorescence. The closed surface therefore supports the role of mCherry as a stable fluorescent protein.
Part C. Using ML-Based Protein Design Tools
Assignees for this section
MIT/Harvard students Required
Committed Listeners Required
In this section, we will learn about the capabilities of modern protein AI models and test some of them in your chosen protein.
Copy the HTGAA_ProteinDesign2026.ipynb notebook and set up a colab instance with GPU.
Choose your favorite protein from the PDB.
We will now try multiple things in the three sections below; report each of these results in your homework writeup on your HTGAA website:
C1. Protein Language Modeling
Deep Mutational Scans
a. Use ESM2 to generate an unsupervised deep mutational scan of your protein based on language model likelihoods.
b. Can you explain any particular pattern? (choose a residue and a mutation that stands out)
c. (Bonus) Find sequences for which we have experimental scans, and compare the prediction of the language model to experiment.
Latent Space Analysis
a. Use the provided sequence dataset to embed proteins in reduced dimensionality.
b. Analyze the different formed neighborhoods: do they approximate similar proteins?
c. Place your protein in the resulting map and explain its position and similarity to its neighbors.
C2. Protein Folding
Folding a protein
Fold your protein with ESMFold. Do the predicted coordinates match your original structure?
Try changing the sequence, first try some mutations, then large segments. Is your protein structure resilient to mutations?
C3. Protein Generation
Inverse-Folding a protein: Let’s now use the backbone of your chosen PDB to propose sequence candidates via ProteinMPNN
Analyze the predicted sequence probabilities and compare the predicted sequence vs the original one.
Input this sequence into ESMFold and compare the predicted structure to your original.
C1 Protein Language Modeling
Deep Mutational Scans
To analyze how different mutations affect my protein, I used the ESM-2 protein language model to generate a deep mutational scan. The output is shown as a heatmap, where each color represents how favorable or unfavorable a specific mutation is. The score (z-value) reflects how likely the mutation is to be stable: positive values mean the mutation is well tolerated, while negative values suggest the mutation may damage the protein.
To Understand the Heatmap Colors, these are some exmples:
The darkest color (black) represents the most harmful mutations.
For example, the mutation at position 92 to Cysteine (C) has a very low score (z = −5.01). This position is buried deep inside the protein. Changing it to cysteine is predicted to strongly disrupt the protein, likely causing misfolding or aggregation.
The dark blue color represents very risky mutations.
An example is position 180 mutated to Proline (P) with a score of z = −3.08. This residue lies in a β-strand. Proline is known to break regular protein structures, so inserting it here would likely distort or break the β-barrel.
The green color indicates neutral mutations.
For example, position 183 mutated to Threonine (T) has a score of z = 0, meaning the model predicts little to no effect on protein stability.
The yellow color represents favorable mutations.
At position 45 mutated to Valine (V), the score is z = 3.04, suggesting this mutation may slightly improve protein stability compared to the original amino acid.
When looking at the entire heatmap, many positions appear as vertical dark bands. These positions do not tolerate most mutations and are therefore highly conserved. These residues usually form the hydrophobic core of the protein and point inward to build the β-barrel structure.
Because mCherry has a tightly sealed β-barrel, mutations in these regions can disrupt proper folding or destabilize the barrel. If the β-barrel is damaged or becomes leaky, the chromophore inside can no longer be protected, which would stop the protein from fluorescing. So, this explains why mutations in these regions are strongly disfavored by the model.
My protein of interest is the Medium-FT variant, which is related to my final project and works as a protein “aging timer.” This behavior is controlled by specific mutations that change the chromophore chemistry without breaking the overall protein structure.
To explore the functional mutations in the parent protein mCherry (PDB: 2H5Q, the one I used to represent the heatmap), I focused on two important mutations: K69R, and A224S (F. V. Subach et al., 2009; O. M. Subach et al., 2022). So as indicated in the heatmap, they showed positive scores (z = 0.75 ; z = 1.08) respectively.
Both mutations appear as light green to yellow on the heatmap, meaning they are well tolerated. This confirms that these changes do not disrupt the β-barrel or overall stability. they adjust the protein’s function by slowing down fluorescence maturation while keeping the main structure intact.
Latent Space Analysis
To perform latent space analysis, I used the provided dataset of protein sequences from the SCOP database and generated numerical embeddings for each sequence using the ESM-2 protein language model, which results in a three-dimensional map where each point represents one protein.
When analyzing the resulting map, proteins do not appear randomly distributed. Instead, they form local neighborhoods where nearby points correspond to proteins with similar structural properties. These neighborhoods approximate similarities in protein fold and secondary structure rather than biological function. This shows that the language model organizes proteins based on shared “structural rules,” such as how alpha helices and beta sheets are arranged, even when the proteins come from different organisms or have different functions.
For example, the protein d2cw3a1 a.2.11.0 (A:4–90) from Perkinsus marinus has three closest neighbors that come from very different organisms, including Escherichia coli and cow. These neighboring proteins also have very different biological functions.
My protein of interest, mCherry (PDB: 2H5Q) which is represented by bleu dot, is located in a neighborhood dominated by proteins rich in β-sheet structures. Its closest neighbors include proteins such as the β-propeller domain of the enzyme PepX, the β-barrel domain of the chaperone protein Sis1, and other β-sheet–containing domains like transferrin-binding protein and latexin. Although these proteins perform very different biological roles, they share similar β-sheet-based structural architectures. The close proximity of mCherry to these proteins confirms that the ESM-2 model groups proteins based on structural similarity, correctly placing mCherry among other β-sheet and β-barrel-like proteins in the latent space.
C2. Protein Folding
The predicted coordinates matched the original structure very well. The overall shape, especially the β-barrel structure, was preserved, and the folding pattern looked almost identical. This shows that ESMFold can accurately predict the structure of mCherry from its amino acid sequence.
Next, I changed the protein sequence by introducing several mutations, including small amino acid changes and changes spread across the sequence. After folding the mutated sequence with ESMFold, the structure showed noticeable changes compared to the original protein. While the general β-barrel shape was still present, some regions were slightly distorted. This indicates that mCherry is partly resilient to mutations, but too many or poorly placed mutations can affect proper folding and reduce structural stability.
C3. Protein Generation
I used ProteinMPNN to do inverse folding on the mCherry protein (PDB: 2H5Q). I used the default settings and turned off the homomer option because this protein has only one chain. ProteinMPNN uses the 3D shape of the protein and suggests new amino acid sequences that can keep the same shape.
The output includes a probability heatmap, which shows the model’s confidence for each amino acid at every position in the sequence. In the heatmap, bright colors (yellow/green) indicate amino acids that are highly preferred at a specific position, while dark colors (blue/purple) indicate unlikely choices. Some positions show a strong preference for one amino acid, meaning they are important for maintaining the protein structure. Other positions show more flexibility, suggesting they can tolerate different amino acids without disrupting the fold.
ProteinMPNN generated a new sequence candidate with a sequence recovery of about 47.93 %, meaning nearly half of the amino acids are identical to the original mCherry sequence. The designed sequence received a lower score (0.8107) compared to the native sequence score (1.3913). Because lower scores indicate a better statistical fit to the backbone, this suggests that the designed sequence is predicted to be highly compatible and stable for the 11-stranded β-barrel structure of mCherry.
The native protein sequence and its score are shown below:
I attempted to refold the newly designed sequence using ESMFold in order to compare the predicted structure with the original mCherry structure. However, ESMFold requires GPU resources, and GPU access was not available at the time of execution. As a result, a direct structural comparison could not be performed. Despite this limitation, the strong sequence score and conserved structural regions indicate that the designed sequence would likely fold into a structure very similar to the original β-barrel if GPU resources were available.
Gemini AI tools integrated with Google Colab were used to help explain code errors, interpret the generated outputs such as heatmaps, and analyze the latent space by identifying the closest neighboring proteins through distance calculations between my protein and other sequences.
Part D. Group Brainstorm on Bacteriophage Engineering
Assignees for this section
MIT/Harvard students Required
Committed Listeners Required
Find a group of ~3–4 students
Read through the Phage Reading material listed under “Reading & Resources” below
Review the Bacteriophage Final Project Goals for engineering the L Protein:
Increased stability (easiest)
Higher titers (medium)
Higher toxicity of lysis protein (hard)
Brainstorm Session
Choose one or two main goals from the list that you think you can address computationally (e.g., “We’ll try to stabilize the lysis protein,” or “We’ll attempt to disrupt its interaction with E. coli DnaJ.”).
Write a 1-page proposal (bullet points or short paragraphs) describing:
Which tools/approaches from recitation you propose using (e.g., “Use Protein Language Models to do in silico mutagenesis, then AlphaFold-Multimer to check complexes.”).
Why do you think those tools might help solve your chosen sub-problem?
Name one or two potential pitfalls (e.g., “We lack enough training data on phage–bacteria interactions.”).
Include a schematic of your pipeline.
This resource may be useful: HTGAA Protein Engineering Tools
Each individually put your plan on your HTGAA website
Include your group’s short plan for engineering a bacteriophage
One-Page Proposal
in this homework, AI ChatGPT assisted me in organizing and clearly articulating my answers and descriptions, ensuring that the content is well-structured and easy to understand.
Sources:
Adhikari, A., Bhattarai, B. R., Aryal, A., Thapa, N., KC, P., Adhikari, A., Maharjan, S., Chanda, P. B., Regmi, B. P., & Parajuli, N. (n.d.). Reprogramming natural proteins using unnatural amino acids. RSC Advances, 11(60), 38126–38145. https://doi.org/10.1039/d1ra07028b
Chamakura, K. R., Tran, J. S., & Young, R. (2017). MS2 Lysis of Escherichia coli Depends on Host Chaperone DnaJ. Journal of Bacteriology, 199(12), e00058-17. https://doi.org/10.1128/JB.00058-17
Doig, A. J. (2017). Frozen, but no accident – why the 20 standard amino acids were selected. The FEBS Journal, 284(9), 1296–1305. https://doi.org/10.1111/febs.13982
Gsponer, J., & Vendruscolo, M. (2006). Theoretical Approaches to Protein Aggregation. Protein & Peptide Letters, 13(3), 287–293. https://doi.org/10.2174/092986606775338407
Mezhyrova, J., Martin, J., Börnsen, C., Dötsch, V., Frangakis, A. S., Morgner, N., & Bernhard, F. (2023). In vitro characterization of the phage lysis protein MS2-L. Microbiome Research Reports, 2(4), 28. https://doi.org/10.20517/mrr.2023.28
Strathdee, S. A., Hatfull, G. F., Mutalik, V. K., & Schooley, R. T. (2023). Phage therapy: From biological mechanisms to future directions. Cell, 186(1), 17–31. https://doi.org/10.1016/j.cell.2022.11.017
Subach, F. V., Subach, O. M., Gundorov, I. S., Morozova, K. S., Piatkevich, K. D., Cuervo, A. M., & Verkhusha, V. V. (2009). Monomeric fluorescent timers that change color from blue to red report on cellular trafficking. Nature Chemical Biology, 5(2), 118–126. https://doi.org/10.1038/nchembio.138
Subach, O. M., Tashkeev, A., Vlaskina, A. V., Petrenko, D. E., Gaivoronskii, F. A., Nikolaeva, A. Y., Ivashkina, O. I., Anokhin, K. V., Popov, V. O., Boyko, K. M., & Subach, F. V. (2022). The mRubyFT Protein, Genetically Encoded Blue-to-Red Fluorescent Timer. International Journal of Molecular Sciences, 23(6), 3208. https://doi.org/10.3390/ijms23063208
Vieira-Pires, R. S., & Morais-Cabral, J. H. (2010). 310 helices in channels and other membrane proteins. The Journal of General Physiology, 136(6), 585–592. https://doi.org/10.1085/jgp.201010508
Young, T. S., & Schultz, P. G. (2010). Beyond the Canonical 20 Amino Acids: Expanding the Genetic Lexicon. The Journal of Biological Chemistry, 285(15), 11039–11044. https://doi.org/10.1074/jbc.R109.091306
week-05-HW-protein-design-part-II
Part A: SOD1 Binder Peptide Design (From Pranam)
Assignees for this section
MIT/Harvard students Required
Committed Listeners Required
Superoxide dismutase 1 (SOD1) is a cytosolic antioxidant enzyme that converts superoxide radicals into hydrogen peroxide and oxygen. In its native state, it forms a stable homodimer and binds copper and zinc.
Mutations in SOD1 cause familial Amyotrophic Lateral Sclerosis (ALS). Among them, the A4V mutation (Alanine → Valine at residue 4) leads to one of the most aggressive forms of the disease. The mutation subtly destabilizes the N-terminus, perturbs folding energetics, and promotes toxic aggregation.
Your challenge:
Design short peptides that bind mutant SOD1.
Then decide which ones are worth advancing toward therapy.
You will use three models developed in our lab:
PepMLM: target sequence-conditioned peptide generation via masked language modeling
Begin by retrieving the human SOD1 sequence from UniProt (P00441) and introducing the A4V mutation.
Using the PepMLM Colab linked from the HuggingFace PepMLM-650M model card:
Generate four peptides of length 12 amino acids conditioned on the mutant SOD1 sequence.
To your generated list, add the known SOD1-binding peptide FLYRWLPSRRGG for comparison.
Record the perplexity scores that indicate PepMLM’s confidence in the binders.
Part 2: Evaluate Binders with AlphaFold3
Navigate to the AlphaFold Server: alphafoldserver.com
For each peptide, submit the mutant SOD1 sequence followed by the peptide sequence as separate chains to model the protein-peptide complex.
Record the ipTM score and briefly describe where the peptide appears to bind. Does it localize near the N-terminus where A4V sits? Does it engage the β-barrel region or approach the dimer interface? Does it appear surface-bound or partially buried?
In a short paragraph, describe the ipTM values you observe and whether any PepMLM-generated peptide matches or exceeds the known binder.
Part 3: Evaluate Properties of Generated Peptides in the PeptiVerse
Structural confidence alone is insufficient for therapeutic development. Using PeptiVerse, let’s evaluate the therapeutic properties of your peptide! For each PepMLM-generated peptide:
Paste the peptide sequence.
Paste the A4V mutant SOD1 sequence in the target field.
Check the boxes
Predicted binding affinity
Solubility
Hemolysis probability
Net charge (pH 7)
Molecular weight
Compare these predictions to what you observed structurally with AlphaFold3. In a short paragraph, describe what you see. Do peptides with higher ipTM also show stronger predicted affinity? Are any strong binders predicted to be hemolytic or poorly soluble? Which peptide best balances predicted binding and therapeutic properties?
Choose one peptide you would advance and justify your decision briefly.
Part 4: Generate Optimized Peptides with moPPIt
Now, move from sampling to controlled design. moPPIt uses Multi-Objective Guided Discrete Flow Matching (MOG-DFM) to steer peptide generation toward specific residues and optimize binding and therapeutic properties simultaneously. Unlike PepMLM, which samples plausible binders conditioned on just the target sequence, moPPIt lets you choose where you want to bind and optimize multiple objectives at once.
Open the moPPit Colab linked from the HuggingFace moPPIt model card
Make a copy and switch to a GPU runtime.
In the notebook:
Paste your A4V mutant SOD1 sequence.
Choose specific residue indices on SOD1 that you want your peptide to bind (for example, residues near position 4, the dimer interface, or another surface patch).
Set peptide length to 12 amino acids.
Enable motif and affinity guidance (and solubility/hemolysis guidance if available). Generate peptides.
After generation, briefly describe how these moPPit peptides differ from your PepMLM peptides. How would you evaluate these peptides before advancing them to clinical studies?
Part 1: Generate Binders with PepMLM
For the PepMLM analysis, the amino acid sequence of the normal Superoxide Dismutase 1 protein was obtained from UniProt using the accession number P00441.
To simulate the disease-associated variant, the A4V mutation was then manually introduced into the sequence to generate the mutant form of the protein used for the peptide design experiments. This mutation corresponds to the substitution of alanine by valine at position 4 of the protein sequence.
Original Superoxide dismutase 1 (SOD1) sequence from Uniprot:
The Problem: The A4V mutation you are studying is famous because it destabilizes the dimer interface. This causes the dimer to fall apart into monomers, which then misfold and aggregate into the toxic clumps seen in ALS patients.
After running the PepMLM model using mutant A4V sequence, I obtained four candidate peptide binder sequences. In the generated results, each sequence ended with the amino acid symbol ‘X’, which represents an undefined residue predicted by the model.
To proceed with the structural analysis and fold the predicted binders with the mutated SOD1 protein, I needed to assign a specific amino acid at this position. For this reason, I replaced the ‘X’ residue with alanine (A) in each sequence. I chose alanine because it is a small and neutral amino acid that generally has minimal effects on protein structure and interactions. This allowed me to obtain complete peptide sequences that could be used for the subsequent folding and interaction prediction with the A4V mutant SOD1 protein.
Binder
Original Sequence
Modified Sequence
Perplexity
Known binder
FLYRWLPSRRGG
///
///
1
WLSPAAGVEWKX
WLSPAAGVEWKA
14.764
2
WHYYVVVVRHWX
WHYYVVVVRHWA
28.661
3
WRSYVVVVELKX
WRSYVVVVELKA
20.402
4
WRYPAVVAAHGX
WRYPAVVAAHGA
5.136
Part 2: Evaluating Binders with AlphaFold3
The predicted peptide binders were evaluated using structural modeling. Each peptide was folded together with the A4V mutant of SOD1 to evaluate the potential protein–peptide interactions.
Note
pTM and ipTM scores: the predicted template modeling (pTM) score and the interface predicted template modeling (ipTM) score are both derived from a measure called the template modeling (TM) score. This measures the accuracy of the entire structure (Zhang and Skolnick, 2004; Xu and Zhang, 2010). A pTM score above 0.5 means the overall predicted fold for the complex might be similar to the true structure. ipTM measures the accuracy of the predicted relative positions of the subunits within the complex. Values higher than 0.8 represent confident high-quality predictions, while values below 0.6 suggest likely a failed prediction. ipTM values between 0.6 and 0.8 are a gray zone where predictions could be correct or incorrect. TM score is very strict for small structures or short chains, so pTM assigns values less than 0.05 when fewer than 20 tokens are involved; for these cases PAE or pLDDT may be more indicative of prediction quality.
The known binder (FLYRWLPSRRGG) showed a relatively low binding confidence, with an ipTM score of 0.28. The peptide binds mainly on the surface of the SOD1 β-barrel, close to the electrostatic loop and the zinc-binding loop. It does not bind near the N-terminus, where the A4V mutation is located, and it also does not interact with the dimer interface. The peptide remains mostly surface-bound rather than buried inside the protein structure. Several residues help stabilize the interaction. For example, Trp5 and Tyr3 can form aromatic contacts with the protein surface, while Arg8 and Arg9 may form hydrogen bonds with nearby residues of SOD1. However, the peptide does not form a strong or compact binding interface, which suggests that the interaction may be weak or transient.
Binder 1 (WLSPAAGVEWKA) showed a clear improvement compared with the known binder, with an ipTM score of 0.39. The peptide binds on a hydrophobic groove on the surface of the SOD1 β-barrel. In this interaction, Trp1 acts as an important anchoring residue, helping the peptide attach to a hydrophobic pocket on the protein surface. Other residues such as Ser3 and Pro4 help position the peptide backbone against the protein surface. In addition, Glu9 forms stabilizing hydrogen bonds with nearby residues on SOD1. Because of these interactions, the peptide forms a more compact and organized binding conformation than the known binder. Although the peptide still binds away from the A4V mutation site, the higher ipTM score and the stronger interaction network suggest that Binder 1 may represent a more promising peptide candidate.
Binder 2 (WHYYVVVVRHWA) showed a moderate interaction with SOD1, with an ipTM score of 0.33, which is higher than the known binder but lower than Binder 1. The peptide binds on a surface patch of the SOD1 β-barrel region. Several residues appear to contribute to this interaction. Trp1 participates in both hydrogen bonding and aromatic interactions with the protein surface, helping to anchor the peptide. Tyr3 and Arg9 also participate in hydrogen bonding that stabilizes the peptide orientation. In addition, the terminal residue Ala12 contributes to stabilizing the peptide backbone through hydrogen bonding with the protein surface. Compared with the known binder, Binder 2 shows a more localized and organized binding mode, although the peptide still binds mainly on the surface of the protein rather than deeply inside the structure.
Binder 3 (WRSYVVVVELKA) showed the lowest binding confidence among the designed peptides, with an ipTM score of 0.20, which is even lower than the known binder. The peptide still localizes on the surface of the SOD1 β-barrel, but the interaction appears weak and poorly defined. The interaction is mainly supported by Arg2 and Lys11, which can form hydrogen bonds with residues on the SOD1 surface. In addition, Tyr4 may contribute through aromatic interactions with the protein surface. However, the peptide forms only a limited number of stabilizing contacts, and the interaction appears less stable compared with Binder 1 and Binder 2. These results suggest that Binder 3 may not be a strong candidate for stable binding to the SOD1 mutant.
Binder 4 (WRYPAVVAAHGA) showed a moderate structural confidence, with an ipTM score of 0.33, similar to Binder 2 and higher than the known binder. The peptide binds on the surface of the SOD1 β-barrel region. Several residues contribute to this interaction. Trp3, Val6, and Gly11 appear to form hydrogen bonds with residues on the SOD1 surface, helping stabilize the interaction. In addition, an internal hydrogen bond between Val6 and His10 helps stabilize the peptide backbone and maintain its conformation. Compared with Binder 3, this peptide forms more defined interactions with the protein surface, which explains its higher predicted binding confidence. Although the peptide still binds away from the A4V mutation site, the interaction appears more organized and stable than the known binder.
To further explore whether peptide length influences binding stability, the same structural analysis was also performed using 11-residue versions of the peptides obtained by removing the final alanine that replaced the unknown residue X. For Binder 1, the ipTM score decreased from 0.39 (12 aa) to 0.27 (11 aa), indicating that the twelfth residue likely helps stabilize the interaction with the SOD1 surface. In contrast, Binder 2 showed a small increase in structural confidence, where the score changed from 0.33 (12 aa) to 0.35 (11 aa), suggesting that the slightly shorter peptide may adopt a somewhat better orientation on the protein surface. Binder 3 showed the strongest negative effect of shortening the peptide, with the score decreasing from 0.20 (12 aa) to 0.13 (11 aa), confirming that this peptide already forms weak interactions and becomes even less stable when shortened. Interestingly, Binder 4 showed the opposite trend, where the 11-residue version reached the highest score of all tested peptides (0.44) compared with 0.33 for the 12-residue version, suggesting that removing the last residue may allow the peptide to adopt a more favorable binding conformation. Overall, these exploratory results suggest that peptide length can influence binding stability, but the effect is sequence-dependent, since shortening the peptide reduced stability for some binders (Binder 1 and Binder 3) while improving it for others (Binder 2 and Binder 4).
Part 3: Evaluate Properties of Generated Peptides in the PeptiVerse
I evaluated the therapeutic properties of all 12-residue peptide binders using PeptiVerse.
The known binder FLYRWLPSRRGG showed weak binding affinity (pKd 5.97), good solubility, very low hemolysis probability (0.047), and a positive net charge of 2.76. Among the PepMLM-generated peptides, Binder 1 (WLSPAAGVEWKA) had weak binding affinity (pKd 5.61), excellent solubility, very low hemolysis (0.037), and a near-neutral net charge (-0.24). Binder 2 (WHYYVVVVRHWA) exhibited medium binding affinity (pKd 7.12), fully soluble, non-hemolytic (0.115), and slightly positive net charge (0.93). Binder 3 (WRSYVVVVELKA) showed weak binding (pKd 6.28), soluble, non-hemolytic (0.115), and net charge 0.76. Binder 4 (WRYPAVVAAHGA) had weak binding (pKd 5.22), soluble, non-hemolytic (0.037), and net charge 0.85.
Comparing these properties with the structural confidence from AlphaFold, we see that higher ipTM scores do not always directly match stronger predicted binding. For example, Binder 1 had the highest ipTM (0.39) but only weak predicted binding, while Binder 2 had slightly lower ipTM (0.33) but showed medium predicted binding. All generated peptides are soluble and non-hemolytic, which is favorable for therapeutic use. Considering both structural confidence and predicted properties, Binder 1 (WLSPAAGVEWKA) is the most promising overall: it has the highest structural stability on SOD1, is non-hemolytic, fully soluble, and has a near-neutral charge that may support safe and effective binding in a biological context.
Part 4: Generating Optimized Peptides with moPPIt
Mutations such as the A4V variant can destabilize the structure of Superoxide Dismutase 1, increasing the probability of protein misfolding, dissociation of the dimer, and toxic aggregation, which are processes associated with Amyotrophic Lateral Sclerosis (ALS). For this reason, the design strategy of this step focused on generating short peptides that can bind simultaneously to both monomers at the dimer interface, effectively acting as a molecular bridge that reconnects and stabilizes the two subunits. By reinforcing the interaction between the chains, these peptides may help restore a conformation closer to the native functional state of the SOD1 complex, while reducing the structural instability caused by the mutation.
To do so, several design parameters were selected before generating peptides. The peptide length was fixed at 12 amino acids. The motif position was focused on residues 3–10, meaning the central region of the peptide was encouraged to interact with the target protein. In addition, affinity guidance and solubility optimization were enabled, and hemolysis prediction was considered to reduce potential toxicity. These settings allow the model to design peptides that not only bind the protein but also have better therapeutic properties.
After generating the following peptides, their structures were evaluated using AlphaFold to predict how they interact with SOD1.
The generated sequences:
Optimized Binder
Sequence
IpTM Score
Binding Localization
1
KRQCEIFNQFMA
0.91
Interface between the two monomers
2
EKDNKWVITSQF
0.86
Interface between the two monomers
3
VCQFDYKTLFKK
0.87
Interface between the two monomers
4
GQQSLFKTKTLD
0.89
The outer surface of a single SOD1 monomer
Binder 1 – KRQCEIFNQFMA (ipTM: 0.91)
This peptide localizes at the dimer interface of the SOD1 homodimer and acts as a molecular bridge between the two monomers. Several residues of the peptide participate in stabilizing the interaction. Gln3 forms a hydrogen bond with residues on the first monomer, while Cys4 interacts with a cysteine residue on the second monomer. In addition, Asn8 forms multiple hydrogen bonds with residues on Chain A. These multiple contacts allow the peptide to connect both monomers simultaneously, which could help stabilize the dimer structure of SOD1.
Binder 2 – EKDNKWVITSQF (ipTM: 0.86)
This peptide also binds at the dimer interface and connects the two monomers. The interaction is mainly driven by the N-terminal region of the peptide. Glu1 forms several hydrogen bonds with residues on Chain B, creating a strong anchoring point. In addition, Ser10 interacts with residues on Chain A. Through these interactions with both monomers, the peptide may help maintain the stability of the SOD1 dimer.
Binder 3 – VCQFDYKTLFKK (ipTM: 0.87)
This peptide spans the interface between the two monomers, forming stabilizing contacts with both chains. Val1 forms a hydrogen bond with residues on Chain B, while Phe4 interacts with residues on Chain A. These interactions allow the peptide to bridge the two monomers and stabilize the interface region.
Binder 4 – GQQSLFKTKTLD (ipTM: 0.89)
Unlike the previous peptides, this binder attaches to the outer surface of a single SOD1 monomer, particularly near the β-barrel structure. The interaction is mainly driven by residues near the C-terminus of the peptide. Thr10 forms a hydrogen bond with the monomer, while Asp12 forms two hydrogen bonds with residues on Chain A. Lys9 also contributes to stabilization by forming an additional hydrogen bond. This peptide does not bridge the dimer but instead stabilizes the surface structure of the monomer.
The four peptides show two different binding strategies:
Three peptides (KRQCEIFNQFMA, EKDNKWVITSQF, and VCQFDYKTLFKK) bind at the dimer interface, where they interact with residues from both monomers. These peptides may help stabilize the SOD1 dimer by acting as a bridge between the two chains.
In contrast, GQQSLFKTKTLD binds only to one monomer, specifically on the β-barrel surface. Instead of bridging the two chains, this peptide may stabilize the structure of the individual monomer.
Among the peptides, KRQCEIFNQFMA shows the highest ipTM score (0.91), suggesting the strongest predicted interaction with the protein complex.
When comparing the peptides generated by PepMLM and moPPIt, the main difference lies in the design strategy. PepMLM mainly samples possible peptide sequences that could bind to the target protein based on patterns learned from protein sequence data. However, it does not allow the user to control exactly where the peptide should bind on the protein. As a result, the generated peptides are plausible binders, but their binding location and biochemical properties are not specifically optimized.
In contrast, moPPIt enables guided peptide design. In this approach, the user can select specific residues or regions on the protein where the peptide should bind, such as the dimer interface of Superoxide Dismutase 1 or regions near the A4V mutation. The model also optimizes several properties simultaneously, including binding affinity, solubility, hemolysis risk, and motif placement. Because of this multi-objective optimization, moPPIt peptides are designed to better satisfy several therapeutic requirements at the same time.
Part B: BRD4 Drug Discovery Platform Tutorial (Gabriele)
Assignees for this section
MIT/Harvard students Required
Committed Listeners Required
For this part, unfortunately, I was unable to access the BRD4 Drug Discovery Platform, as the access was not granted to me despite my request.
Part C: Final Project: L-Protein Mutants
Assignees for this section
MIT/Harvard students Required
Committed Listeners Required
Option 1 : Improve autofolding and lysis efficiency
The goal of this part was to design mutations in the L-protein in order to improve its function. Two main objectives were considered. The first objective was to improve the autofolding ability of the L-protein so that it can fold correctly without strong dependence on host chaperones. The second objective was to improve the lysis efficiency of the protein by enhancing its ability to form pores in the E. coli membrane and promote faster or more efficient bacterial lysis.
To identify possible mutations, the provided mutation scoring notebook was used. This notebook evaluates all possible amino-acid substitutions in the L protein and assigns a score to each mutation.
After running the notebook, the resulted mutation predictions are presented in the following dataset:
Position (DNA)
Position (Protein)
Wild Type AA
Mutation AA
LLR Score
989
50
K
L
2.561468
574
29
C
R
2.395427
769
39
Y
L
2.241780
575
29
C
S
2.043150
173
9
S
Q
2.014325
573
29
C
Q
1.997049
572
29
C
P
1.971029
569
29
C
L
1.960646
987
50
K
I
1.928801
1049
53
N
L
1.864932
1209
61
E
L
1.818098
1029
52
T
L
1.813968
984
50
K
F
1.802069
576
29
C
T
1.797247
568
29
C
K
1.795878
93
5
F
Q
1.795244
94
5
F
R
1.659717
560
29
C
A
1.648656
534
27
Y
R
1.628061
434
22
F
R
1.602028
92
5
F
P
1.596891
997
50
K
V
1.594576
995
50
K
S
1.574557
96
5
F
T
1.559024
95
5
F
S
1.556417
889
45
A
L
1.539248
775
39
Y
S
1.517457
535
27
Y
S
1.497053
789
40
V
L
1.477630
529
27
Y
L
1.474637
435
22
F
S
1.423358
563
29
C
E
1.383281
760
39
Y
A
1.364999
571
29
C
N
1.362601
980
50
K
A
1.357795
567
29
C
I
1.344121
89
5
F
L
1.332615
334
17
N
R
1.323651
767
39
Y
I
1.320103
776
39
Y
T
1.302804
514
26
D
R
1.268762
566
29
C
H
1.246107
764
39
Y
F
1.245851
777
39
Y
V
1.244390
454
23
K
R
1.236555
494
25
E
R
1.229350
474
24
H
R
1.227779
996
50
K
T
1.222131
533
27
Y
Q
1.218851
536
27
Y
T
1.215567
The predicted mutations were compared with the experimental dataset of L-protein mutants provided in the course material. This dataset contains mutations that were experimentally tested and their effect on lysis activity.
The goal of this comparison was to determine whether mutations with high prediction scores correspond to mutations that show improved lysis in experimental studies. This step helps evaluate the reliability of the prediction model.
The results of this comparison revealed a limited overlap between predicted beneficial mutations and experimentally tested mutations. Two mutations, C29R and K50I, appeared in both datasets. However, experimental data indicated that these substitutions did not improve lysis activity. This suggests that, while the protein language model captures sequence compatibility, it does not fully predict functional outcomes such as lysis efficiency. For this raison, experimental validation remains essential to confirm computational predictions.
To avoid mutations that could disrupt essential protein functions, sequence conservation analysis was performed. Multiple sequences related to the MS2 L protein obtained from the BLAST results provided in the course folder were uploaded to Clustal Omega and aligned.
The conserved regions of the L protein were identified after analyzing the multiple sequence alignment results. Highly conserved residues, which are the same across all sequences, were marked with stars (*) in the alignment output. while colon (:) indicates residues with strongly similar chemical properties. These positions were considered critical for protein function, so mutations at these residues were avoided. The remaining positions, which showed variability among sequences, were classified as non-conserved and were selected as potential sites for mutation. This approach ensured that the chosen mutations would minimize disruption of essential protein structure and function.
Mutations were selected using the resulted mutation scoring predictions and evolutionary conservation analysis. Only residues located in non-conserved positions were chosen in order to reduce the risk of disrupting essential protein functions. The selected mutations (F5Q, S9Q, F22S, Y27L, and A45L) -as represented in the following table- are distributed between the N-terminal region, the central region, and the transmembrane domain of the L protein. This distribution allows the exploration of potential effects on protein autofolding and membrane activity, while maintaining the overall structural integrity of the protein.
Mutation
LLR Score*
Protein Region
AA Property Change
Mutation Type
Conserved Residue?
Structural Risk
Rationale for Selection
S9Q
~2.01
N-terminal region
Small polar → Polar amide
Conservative
Unconserved
Low
Similar polarity; minimal structural disruption while potentially altering hydrogen bonding
F5Q
~1.80
N-terminal region
Hydrophobic aromatic → Polar amide
Moderate
Unconserved
Moderate
Introduces polarity which may affect folding and interaction with cytoplasmic environment
A45L
~1.54
Transmembrane helix
Small hydrophobic → Larger hydrophobic
Conservative
Unconserved
Low
Maintains hydrophobic nature; may stabilize helix packing in membrane
Y27L
~1.47
Near transmembrane region
Aromatic → Hydrophobic aliphatic
Moderate
Unconserved
Moderate
Maintains hydrophobicity but removes aromatic ring; could affect membrane insertion
F22S
~1.42
Cytoplasmic / near TM region
Hydrophobic aromatic → Small polar
Moderate
Unconserved
Moderate
Reduces hydrophobicity; may influence membrane interaction and folding
Because the L gene overlaps with other genes in the MS2 genome, the nucleotide changes corresponding to the selected mutations were checked to ensure that they do not introduce stop codons in the overlapping reading frames.
The mutations F5Q and S9Q are located in the region overlapping with the coat protein (CP) gene, near its C-terminal end, while the mutation A45L is located in the region overlapping with the replicase (Rep) gene, near its N-terminal region.
For each mutation, the possible codon substitutions were examined and confirmed not to generate stop codons in the overlapping genes. Therefore, these mutations are considered compatible with the genome organization of MS2.
Option 2: Achieve DnaJ independence
Here the goal was to reduce or eliminate the dependence of the L-protein on the host chaperone DnaJ. By designing mutations in the soluble N-terminal domain of the L-protein, i aimed to weaken its interaction with DnaJ while maintaining proper folding. This approach could potentially allow the phage to function even if DnaJ is mutated or absent in the host.
To study the interaction, i used the AlphaFold2-Multimer notebook in ColabFold to co-fold the soluble domain of the L-protein with the full sequence of E. coli DnaJ. The sequences used were:
The soluble domain of Lysis protein (N terminal Domain):
METRFPQQSQQTPASTNRRRPFKHEDYPCRRQQRSS
The first co-folding run generated five ranked models with the following parameters. Here, pLDDT reflects the confidence in the predicted structure of the L–DnaJ complex, pTM indicates the overall predicted quality of the complex, and ipTM estimates the predicted strength of the interaction between L-protein and DnaJ:
By comparing the different predicted models, the fourth model was identified as the best-ranked model because it showed the highest ipTM score, indicating the strongest predicted interaction between the L-protein and DnaJ.
Using PyMol I Analysed the predicted L–DnaJ complex of the best predicted model (rank 4) and the results revealed multiple interaction residues located in the N-terminal region of the L protein as summarized in the following table:
Residue
Type
Contacts with DnaJ
Typical Interaction Role
Met 1
Hydrophobic (non-polar)
ASP116, ARG113
Hydrophobic contact
GLU2
Negatively charged
ALA115, ASP116
Electrostatic / salt bridge
THR3
Polar (uncharged)
ASP116, LEU117, ARG118
Hydrogen bonding
ARG4
Positively charged
ALA115, ARG118, LEU117, GLU233, ASP116
Electrostatic / salt bridge
PHE5
Hydrophobic aromatic
ASN120, LEU117, ARG118
Hydrophobic packing
PRO6
Hydrophobic (rigid)
LEU117, ARG118, ASN120, TYR119, ASP116
Structural / hydrophobic contact
GLN8
Polar (uncharged)
ASN120, ARG118, TYR119
Hydrogen bonding
SER15
Polar (uncharged)
GLN252, GLU122, LYS251
Hydrogen bonding
ASN17
Polar (uncharged)
GLN252
Hydrogen bonding
ARG18
Positively charged
VAL250, GLN252, GLN249, GLU122, LYS251
Electrostatic interaction
ARG19
Positively charged
GLN252
Electrostatic interaction
ARG20
Positively charged
GLN252
Electrostatic interaction
PRO21
Hydrophobic
GLN252, GLU257
Structural / hydrophobic contact
PHE22
Hydrophobic aromatic
PRO254, GLU266, GLU257
Hydrophobic contact
LYS23
Positively charged
GLU266
Electrostatic interaction
HIS24
Positively charged / polar
VAL326, ARG324, GLU266
Electrostatic / hydrogen bond
GLU25
Negatively charged
GLU266
Electrostatic interaction
ASP26
Negatively charged
ARG324, GLU266, VAL326
Electrostatic interaction
TYR27
Aromatic polar
VAL327, THR329, GLU328
Hydrophobic + H-bond
Key residues such as Arg4, Thr3, Pro6, Phe5, Arg18, Lys23, His24, and Tyr27 were found to interact with several residues of DnaJ, including Asp116, Leu117, Arg118, Glu122, and Glu266. These interactions involve a combination of electrostatic, hydrophobic, and hydrogen-bond contacts. Residues forming multiple contacts were considered potential targets for mutagenesis aimed at reducing the dependence of the L protein on the DnaJ chaperone.
Two hydrophobic residues (Pro6 and Phe22), two positively charged residues (Arg4 and Arg18), and two negatively charged residues (Glu2 and Asp26) were selected for mutational analysis. These residues participate in multiple contacts with DnaJ and represent different physicochemical interaction types involved in stabilizing the L–DnaJ interface.
To evaluate the contribution of different interaction types at the L–DnaJ interface, selected residues were substituted with alanine using an alanine-scanning approach in order to remove their side-chain interactions while minimizing structural perturbation.
Original Residue
Mutation
Reason
PRO6
P6A
removes rigid hydrophobic contact
PHE22
F22A
removes aromatic hydrophobic interaction
ARG4
R4A
removes positive charge
ARG18
R18A
removes strong electrostatic interaction
GLU2
E2A
removes negative charge
ASP26
D26A
removes negative charge
The resulting N-terminal sequence of the lysis protein was used to re-predict the interaction with the DnaJ protein in order to evaluate whether the introduced mutations could reduce the dependence of the lysis protein on the host chaperone:
MATAFAQQSQQTPASTNARRPAKHEAYPCRRQQRSS
The mutated L-protein was co-folded again with DnaJ using AlphaFold2-Multimer. The five ranked models obtained were:
Rank
pLDDT
pTM
ipTM
3
78.7
0.579
0.291
4
78.4
0.574
0.235
5
77.1
0.569
0.233
2
79.1
0.581
0.219
1
79.4
0.568
0.206
When we compared the new models with the wild-type complex, we can see clearly that the ipTM values were slightly lower. In the wild-type prediction, the best model showed an ipTM value of 0.373, while after mutation the highest ipTM value decreased to 0.291. Since ipTM reflects the predicted strength of interaction between two proteins, this decrease suggests that the interaction between the L-protein and DnaJ became weaker after the mutations were introduced. This reduction is consistent with the mutation strategy, where several key residues involved in hydrophobic and electrostatic contacts were replaced with alanine in order to remove their side-chain interactions.
Despite these changes, the overall structural confidence of the models (pLDDT values were 78.9 to 78.6) remained similar to the wild-type predictions, indicating that the L-protein is still likely to fold correctly. Therefore, these results suggest that the designed mutations may reduce the dependence of the L-protein on the DnaJ chaperone while maintaining a stable protein structure.
This computational approach demonstrates how targeted mutagenesis combined with AlphaFold2-Multimer predictions can be used to design L-protein variants with potentially lower chaperone dependency.
in this homework, AI ChatGPT assisted me in organizing and clearly articulating my answers and descriptions, ensuring that the content is well-structured and easy to understand.
Week 06 HW: genetic circuits part-I
Assignment: DNA Assembly
Assignees for this section
MIT/Harvard students Required
Committed Listeners Required
Answer these questions about the protocol in this week’s lab:
What are some components in the Phusion High-Fidelity PCR Master Mix and what is their purpose?
What are some factors that determine primer annealing temperature during PCR?
There are two methods from this class that create linear fragments of DNA: PCR, and restriction enzyme digests. Compare and contrast these two methods, both in terms of protocol as well as when one may be preferable to use over the other.
How can you ensure that the DNA sequences that you have digested and PCR-ed will be appropriate for Gibson cloning?
How does the plasmid DNA enter the E. coli cells during transformation?
Describe another assembly method in detail (such as Golden Gate Assembly)
Explain the other method in 5 - 7 sentences plus diagrams (either handmade or online).
Model this assembly method with Benchling or Asimov Kernel!
Answer 01:image_ref
The Phusion High-Fidelity PCR Master Mix is a ready-to-use solution used for PCR amplification with high accuracy. It already contains the main components needed for DNA amplification.
image_ref
Phusion DNA Polymerase
Phusion DNA polymerase is the enzyme that copies the DNA during PCR. It synthesizes new DNA strands using the template DNA. This polymerase has proofreading activity, which helps detect and correct errors during DNA synthesis, making the amplification very accurate.
Reaction Buffer
The reaction buffer provides the optimal chemical environment for the polymerase to function properly. It maintains the correct pH and salt conditions needed for efficient DNA amplification. Different buffers can be used depending on the DNA template, such as HF buffer for standard templates or GC buffer for GC-rich DNA.
MgCl₂ (Magnesium Chloride)
Magnesium ions are essential cofactors for DNA polymerase activity. They help stabilize the interaction between the enzyme, the primers, and the DNA template during DNA synthesis.
dNTPs (Deoxynucleotide Triphosphates)
dNTPs are the building blocks used to synthesize new DNA strands. They include dATP, dTTP, dCTP, and dGTP. During PCR, the polymerase adds these nucleotides to the growing DNA strand according to complementary base-pairing rules.
Additional additives (e.g., DMSO)
Some reactions may include additives such as DMSO, which helps improve amplification of GC-rich DNA by reducing secondary structures and improving primer binding.
Answer 02:
The primer annealing temperature (Ta) is the temperature at which primers bind to the DNA template during PCR. It mainly depends on the primer melting temperature (Tm). In practice, the annealing temperature is usually set about 3–5 °C lower than the lowest primer Tm so that the primers can bind correctly to the DNA template.
Important factors (from the lab and lecture)
-Primer melting temperature (Tm):
image_ref
The melting temperature is the temperature at which 50 % of the primer–DNA duplex separates into single strands. It is the main factor used to determine the annealing temperature.
-Primer length (18–22 nucleotides):
image_ref
Primers are usually designed with a length of 18–22 bases. This length provides good specificity and stable binding to the template DNA.
-GC content (40–60 %)
Primers should contain about 40–60 % GC bases. GC pairs form stronger bonds than AT pairs, which increases the stability of primer binding.
-GC clamp (≤3 GC bases at the 3′ end)image_ref
A small number of GC bases at the 3′ end of the primer (called a GC clamp) helps the primer bind more strongly to the template DNA and improves PCR efficiency.
-Primer secondary structuresimage_ref
Primers should avoid forming hairpins, self-dimers, or cross-dimers. These structures prevent primers from binding properly to the template DNA.
Recommended primer Tm range (52–58 °C).
Primers are usually designed to have a melting temperature between 52 °C and 58 °C, which allows efficient and specific amplification.
-GC sequence composition
Primers with higher GC content bind more strongly because GC base pairs form three hydrogen bonds, while AT pairs form only two.
Additional factors
-Ionic environment (Mg²⁺ and salt concentration)
Ions such as Mg²⁺ and other salts stabilize the DNA double strand and influence primer binding. Changes in these concentrations can affect the optimal annealing temperature.
-Primer concentration
Higher primer concentrations increase the probability that primers will bind to the DNA template, which can influence the optimal annealing temperature.
-Optimization using gradient PCR
In many experiments, scientists perform gradient PCR to test different annealing temperatures and find the best one for efficient and specific amplification.
Answer 03:
PCR (Polymerase Chain Reaction) and restriction enzyme digestion are two common molecular biology methods used to produce linear DNA fragments, but they work in very different ways. PCR works by amplifying a specific DNA sequence, while restriction enzymes cut existing DNA at specific recognition sites. Both techniques are widely used in cloning and DNA assembly experiments, including methods such as Gibson Assembly.
image_ref
PCR is a technique used to copy a specific region of DNA many times. It starts with a small amount of template DNA and uses specific primers that bind to the target sequence. A heat-stable DNA polymerase enzyme (such as Taq or Phusion polymerase) then synthesizes new DNA strands. The reaction takes place in a thermal cycler, which repeatedly changes the temperature through three main steps: denaturation, where the DNA strands separate; annealing, where primers bind to the template DNA; and extension, where the polymerase enzyme copies the DNA. After many cycles, PCR produces large amounts of a specific linear DNA fragment. One advantage of PCR is that researchers can design primers to add new sequences to the ends of the fragment, such as restriction sites or overlapping regions for Gibson Assembly.
image_ref
Restriction enzyme digestion works differently. Instead of amplifying DNA, it cuts existing DNA molecules at specific short sequences called recognition sites. Restriction enzymes recognize these sequences and cut the DNA at or near those locations. In a typical protocol, the DNA (for example a plasmid) is mixed with the restriction enzyme and a specific buffer, and the reaction is incubated at a constant temperature, usually around 37 °C, for about one hour. The enzyme then cuts the DNA to produce linear fragments. Depending on the enzyme, the cut DNA can produce sticky ends (overhangs) or blunt ends, which can be used for cloning.
These two methods are used in different situations depending on the goal of the experiment. PCR is preferred when the DNA is present in low concentration, because it can amplify a very small amount of template into large quantities. PCR is also useful when researchers want to introduce new sequences, mutations, or overlaps into the DNA fragment. For example, primers can be designed to add restriction sites, promoter sequences, or homologous overlaps needed for Gibson Assembly. PCR is also commonly used when scientists want to isolate a specific gene or region from genomic DNA.
Restriction enzyme digestion is more suitable when the DNA is already available in large quantities, such as a purified plasmid. It is commonly used when researchers want to cut DNA at precise and known locations to isolate fragments or prepare a plasmid for cloning. Restriction enzymes are also often used for diagnostic analysis, such as verifying plasmid identity or checking the size of DNA fragments through restriction mapping.
Answer 04:
To ensure that DNA fragments produced by PCR or restriction digestion are suitable for Gibson Assembly, several preparation and verification steps must be followed. Gibson Assembly joins DNA fragments that contain overlapping homologous sequences, so the fragments must be designed carefully and purified before the assembly reaction.
The first and most important step is primer design. Primers used in PCR should include overlapping sequences of about 20–40 base pairs that match the ends of the neighboring DNA fragment. These overlaps allow the fragments to align and assemble correctly during the Gibson reaction. The overlapping regions should have similar melting temperatures (Tm) to allow stable annealing during the isothermal reaction. It is also important to design overlaps with a balanced GC content and to avoid strong secondary structures such as hairpins, because these structures can reduce assembly efficiency.
Another important step is using a high-fidelity DNA polymerase, such as Phusion or Q5 polymerase, during PCR amplification. These enzymes have proofreading activity and reduce the number of mutations introduced during amplification. This is important because Gibson Assembly is often used to construct precise DNA sequences or multi-fragment plasmids.
After PCR amplification, the DNA fragments should be verified using agarose gel electrophoresis to confirm that the fragments have the expected size. The correct DNA bands are then purified from the gel to remove primers, nucleotides, enzymes, and non-specific products that might interfere with the assembly reaction.
To reduce background contamination from the original template plasmid, PCR products can be treated with the restriction enzyme DpnI, which digests methylated template DNA but does not affect the newly synthesized PCR fragments.
If a plasmid backbone is used, the vector must be completely linearized before Gibson Assembly. This can be done by restriction enzyme digestion or PCR. When restriction enzymes are used, it is important to ensure that the digestion is complete so that no circular plasmid remains, because this could produce unwanted background colonies during transformation.
Another important step is DNA quantification. The concentration of each DNA fragment should be carefully measured using methods such as fluorometric quantification (for example Qubit) or gel analysis. The correct molar ratio of vector to insert fragments, often about 1:2 or 1:3, helps improve assembly efficiency.
Finally, after Gibson Assembly and bacterial transformation, the resulting plasmid constructs are usually verified by DNA sequencing to confirm that the fragments assembled correctly and that no mutations were introduced during PCR.
Answer 05:
Plasmid DNA enters Escherichia coli cells during a process called bacterial transformation. In this process, the bacterial cells must first be made competent, meaning their membranes become temporarily able to allow DNA molecules to enter.
image_ref
In the most common method, called chemical transformation, the cells are treated with a solution containing calcium chloride (CaCl₂). The calcium ions (Ca²⁺) play an important role because they neutralize the negative charges on both the plasmid DNA and the phospholipids of the bacterial membrane. Normally, DNA and the membrane repel each other because they are both negatively charged. The calcium ions reduce this repulsion and allow the plasmid DNA to attach to the surface of the bacterial cell.
After mixing the plasmid DNA with the competent cells, the mixture is kept on ice (around 0 °C) for a short time. The cells are then exposed to a brief heat shock, usually at about 42 °C for 30–60 seconds. This sudden temperature change creates a strong thermal gradient between the cold cells and the warm environment. As a result, the bacterial membrane becomes temporarily destabilized and small pores form, allowing the plasmid DNA to pass into the cell.
Immediately after the heat shock, the cells are placed back on ice. This rapid cooling helps close the pores and stabilize the membrane again. The cells are then transferred into a nutrient recovery medium and incubated for a short period. During this recovery step, the cells repair their membranes and begin expressing the antibiotic resistance gene carried by the plasmid.
Finally, the bacteria are plated on agar plates containing the appropriate antibiotic. Only the cells that successfully received the plasmid DNA will survive and form colonies.
Another alternative method used to introduce plasmid DNA into E. coli is electroporation. In this method, competent bacterial cells are mixed with plasmid DNA and placed in a special electroporation cuvette. A short electrical pulse is then applied using an electroporator.
The electrical pulse temporarily creates small pores in the bacterial cell membrane, allowing the plasmid DNA to pass directly into the cell.
After the pulse, the membrane quickly reseals and the cells recover in a nutrient medium. Electroporation is often more efficient than chemical transformation and is commonly used when transforming difficult DNA constructs or when very high transformation efficiency is required.
Answer 06:
Another DNA assembly method is Golden Gate Assembly, which allows several DNA fragments to be joined together in a single reaction. This technique uses special restriction enzymes called Type IIS restriction enzymes, such as BsaI or BsmBI, together with T4 DNA Ligase. Unlike traditional restriction enzymes, Type IIS enzymes cut outside their recognition sequence, which allows scientists to design custom 4-base pair overhangs at the ends of DNA fragments. These overhangs are designed so that fragments can only join with the correct neighboring fragment, ensuring the correct order and orientation of the assembled DNA. During the reaction, the restriction enzyme cuts the DNA fragments and creates the overhangs, and the DNA ligase joins the fragments together. The recognition sites of the restriction enzyme are removed during assembly, which means the final DNA construct cannot be cut again by the same enzyme. The digestion and ligation steps occur in the same tube using alternating temperatures, making Golden Gate Assembly a very efficient method for assembling multiple DNA fragments, especially in synthetic biology and modular cloning experiments.
image_ref
This diagram is a clear example of Golden Gate Assembly, a cloning method that joins several DNA fragments in one reaction. In the example, three DNA parts — Promoter (Fragment A), ORF (Fragment B), and Terminator (Fragment C) — are assembled into a final plasmid called the destination vector. The process uses the Type IIS restriction enzyme BsaI together with T4 DNA Ligase.
In the first step, each fragment is present in an entry vector that contains the BsaI recognition site (GGTCTC). Unlike classical restriction enzymes, BsaI cuts outside of its recognition site, generating specific 4-base pair sticky ends (overhangs). Because the cut occurs outside the recognition sequence, the recognition site is removed during assembly and does not remain in the final DNA construct.
The fragments are designed with specific overhangs so they connect in the correct order. For example, Fragment A ends with the overhang CCAC, which matches the beginning of Fragment B. Fragment B ends with CGAT, which matches the start of Fragment C. These complementary overhangs act like puzzle pieces, ensuring that the fragments assemble correctly and in the proper orientation.
All fragments, the destination vector, BsaI, and T4 DNA Ligase are mixed in a single tube. During the reaction, BsaI cuts the DNA fragments to create sticky ends, and T4 DNA ligase joins fragments with matching overhangs. The reaction cycles between temperatures that allow DNA digestion and ligation, gradually assembling the correct construct.
Once fragments are ligated together, the BsaI recognition sites are no longer present, so the final product cannot be cut again by the enzyme. This makes the process efficient and irreversible, allowing the formation of a seamless DNA construct containing Fragment A + Fragment B + Fragment C in the destination plasmid.
image_ref
Modeling Golden Gate Assembly in Benchling
In this part, I modeled a Golden Gate Assembly to construct a genetic circuit for my second project, which is the engineering of an Escherichia coli reporter strain to monitor protein aging using a fluorescent timer protein.
First, I selected all the genetic elements needed for my construct. The backbone plasmid was obtained from Addgene, and it already contains a T7 promoter, a ribosome binding site (RBS), and a T7 terminator, which are very suitable for strong expression of the inserted gene. This vector also includes the GST (Glutathione S-Transferase from Schistosoma japonicum), which I used as the protein of interest because it has stable folding and is suitable for initial testing of my genetic system.
Then, I designed two additional fragments: a flexible linker (Gly₄Ser)₃ and a fluorescent timer (FT) protein (Medium FT). Their sequences were also obtained from Addgene. The linker allows proper folding between the GST protein and the fluorescent timer, while the FT protein provides a signal that changes over time, allowing estimation of protein age inside the cell.
At the beginning, I manually designed the overhangs based on the coding sequence. I assumed that the last four nucleotides of the GST sequence (GAAG) would serve as the correct overhang to connect with the next fragment. Based on this assumption, I designed the linker fragment to have a compatible overhang (GAAG, GGTA). Similarly, I defined the overhangs between the linker and the fluorescent timer protein (GGTA) in order to maintain a continuous reading frame. During this step, I also verified that no frameshift was introduced at the junctions and that the coding sequence remained in frame across all fragments as indicated in the following table:
Junction
DNA Sequence
Resulting Amino Acids
Status
GST to Linker
...AAG GGT...
Lys - Gly
In Frame
Linker to FT
...TCT CCG GTA ATG...
Ser - Pro - Val - Met
In Frame
FT to 6xHis
...AAG AAG CAC...
Lys - Lys - His
In Frame
In addition, I checked that all BsaI restriction enzyme recognition sites were positioned outside of the fragments that would be recovered after digestion, ensuring that the internal sequences of the inserts would not be disrupted during the assembly process. the designed overhangs are as the following:
The designed overhangs are supposed to orient the assembly in the following order: the linker is placed immediately after the GST sequence, and the Medium FT is positioned just before the C-terminal His tag, as indicated in the following diagram:
After preparing the vector and all fragments, the designed vector digestion cuts were defined as follows:
The designed linker fragment sticky ends were defined as follows:
The designed Medium FT sticky ends were defined as follows:
Be careful !!
A critical point to consider during the design is the correct placement of BsaI restriction enzyme recognition sites. For the inserted fragments, the BsaI sites must be located outside of the sequences of interest so that they are removed during digestion and do not remain in the final construct. In contrast, for the backbone vector, the BsaI sites must be positioned within the region to be replaced, so that digestion removes this segment and allows the insertion of the designed fragments.
It is also essential to ensure that the BsaI recognition sites are oriented correctly (inverted orientation) to generate the desired overhangs and to cut the backbone precisely at the intended insertion site. Any incorrect placement or orientation of these sites can lead to incompatible sticky ends and result in assembly failure.
I imported all sequences into Benchling and created a new assembly using the Golden Gate cloning option. I selected the pET-28 plasmid as the backbone and added the designed fragments, including the linker and the fluorescent timer protein, as inserts. I specified the use of the BsaI restriction enzyme and defined the final construct as circular. Since all sequences were already designed with appropriate BsaI recognition sites, I selected the option to use existing restriction sites for fragment generation. I then attempted to run the assembly.
However, the assembly failed, and Benchling returned an error indicating that the sticky ends were incompatible. Specifically, the system showed a mismatch between the overhangs “AAGC” (from the vector) and “GAAG” (from the insert). This result indicated that the fragments could not ligate properly.
After analyzing this issue, I realized that the mistake came from misunderstanding how Golden Gate Assembly works. I initially assumed that the overhang corresponds directly to visible nucleotides in the sequence. In reality, the overhang is determined by the position of the BsaI cutting site, not simply by the sequence at the end of the gene. Since BsaI cuts outside of its recognition site, the actual generated overhang in the vector was “AAGC” and not “GAAG” as I had expected.
This mismatch between expected and real overhangs caused the failure of the assembly. Additionally, the cloning workflow in Benchling does not automatically correct or reinterpret overhangs; it strictly checks for compatibility. Therefore, any small design error leads to a complete assembly failure.
In order to overcome the limitations encountered in the first approach, I tried another method available in Benchling by using the Assembly tool dedicated to multi-fragment cloning. This method is specifically designed to simulate Golden Gate Assembly in a more automated and flexible way, allowing better handling of fragment compatibility and overhang generation.
First, I opened the Assembly tool from the bottom toolbar and created a new assembly. I then added all the required DNA sequences, including the pET-28 plasmid as the backbone and the designed fragments (linker and Medium FT) as inserts. After that, I selected the BsaI restriction enzyme as the Type IIS restriction enzyme used for the assembly.
Unlike the previous method, this approach automatically analyzed the positions of the BsaI recognition sites and simulated the digestion process. It generated the correct sticky ends based on the actual cutting positions of the enzyme and evaluated the compatibility between fragments. This allowed the system to correctly align and assemble the different parts according to their matching overhangs.
After running the assembly, the construct was successfully generated as a circular plasmid. I carefully verified that all fragments were assembled in the correct order and orientation. I also confirmed that no frameshift was introduced across the junctions and that the reading frame was maintained from the GST sequence through the linker and into the fluorescent timer protein. In addition, I checked that no unwanted BsaI sites remained inside the final construct and that all restriction sites had been properly removed during the assembly process.
in this homework, AI ChatGPT assisted me in organizing and clearly articulating my answers and descriptions, ensuring that the content is well-structured and easy to understand.
Assignment: Asimov Kernel
Assignees for this section
MIT/Harvard students Required
Committed Listeners Required
Create a Repository for your work
Create a blank Notebook entry to document the homework and save it to that Repository
Explore the devices in the Bacterial Demos Repo to understand how the parts work together by running the Simulator on various examples, following the instructions for the simulator found in the “Info” panel (click the “i” icon on the right to open the Info panel)
Create a blank Construct and save it to your Repository
Recreate the Repressilator in that empty Construct by using parts from the Characterized Bacterial Parts repository
Search the parts using the Search function in the right menu
Drag and drop the parts into the Construct
Confirm it works as expected by running the Simulator (“play” button) and compare your results with the Repressilator Construct found in the Bacterial Demos repository
Document all of this work in your Notebook entry - you can copy the glyph image and the simulator graphs, and paste them into your Notebook
Build three of your own Constructs using the parts in the Characterized Bacterials Parts Repo
Explain in the Notebook Entry how you think each of the Constructs should function
Run the simulator and share your results in the Notebook Entry
If the results don’t match your expectations, speculate on why and see if you can adjust the simulator settings to get the expected outcome
Alberts, B., Johnson, A., Lewis, J., Raff, M., Roberts, K., & Walter, P. (2002). Isolating, Cloning, and Sequencing DNA. In Molecular Biology of the Cell. 4th edition. Garland Science. https://www.ncbi.nlm.nih.gov/books/NBK26837/
Bird, J. E., Marles-Wright, J., & Giachino, A. (2022). A User’s Guide to Golden Gate Cloning Methods and Standards. ACS Synthetic Biology, 11(11), 3551–3563. https://doi.org/10.1021/acssynbio.2c00355
Erjavec, M. S. (2019). Annealing Temperature of 55°C and Specificity of Primer Binding in PCR Reactions. In Synthetic Biology—New Interdisciplinary Science. IntechOpen. https://doi.org/10.5772/intechopen.85164
Froger, A., & Hall, J. E. (2007). Transformation of Plasmid DNA into E. coli Using the Heat Shock Method. Journal of Visualized Experiments : JoVE, (6), 253. https://doi.org/10.3791/253
Hoseini, S. S., & Sauer, M. G. (2015). Molecular cloning using polymerase chain reaction, an educational guide for cellular engineering. Journal of Biological Engineering, 9, 2. https://doi.org/10.1186/1754-1611-9-2
SnapGene. (2022, June 30). Introduction à l’assemblée de Golden Gate [Video recording]. https://www.youtube.com/watch?v=aBcqev1NMMo
Sorida, M., & Bonasio, R. (2023). An efficient cloning method to expand vector and restriction site compatibility of Golden Gate Assembly. Cell Reports Methods, 3(8), 100564. https://doi.org/10.1016/j.crmeth.2023.100564
The Different Types of PCR Methods | Pipette.com. (n.d.). Retrieved March 30, 2026, from https://pipette.com/blog/types-of-pcr
Universal Annealing Temperature in PCR and its Impact on Amplification Results. (n.d.).
Week 07 HW: genetic circuits part-II
Assignment Part 1: Intracellular Artificial Neural Networks (IANNs)
Assignees for this section
MIT/Harvard students Required
Committed Listeners Required
What advantages do IANNs have over traditional genetic circuits, whose input/output behaviors are Boolean functions?
Describe a useful application for an IANN; include a detailed description of input/output behavior, as well as any limitations an IANN might face to achieve your goal.
Below is a diagram depicting an intracellular single-layer perceptron where the X1 input is DNA encoding for the Csy4 endoribonuclease and the X2
input is DNA encoding for a fluorescent protein output whose mRNA is regulated by Csy4. Tx: transcription; Tl: translation.Draw a diagram for an
intracellular multilayer perceptron where layer 1 outputs an endoribonuclease that regulates a fluorescent protein output in layer 2.
Traditional genetic circuits work using Boolean logic, where the output is binary (either ON or OFF). The output depends on whether the input signals pass a fixed threshold. For example, in a genetic AND gate, a protein is only produced when both transcription factors A and B are present above a certain level. If one of them is missing or below the threshold, the output is zero. This type of system is useful for simple decisions, but it has important limitations because real biological signals are usually continuous, variable, and noisy, not strictly ON or OFF.
Intracellular Artificial Neural Networks (IANNs) solve these limitations by mimicking artificial neural networks inside the cell. Instead of treating inputs as binary, IANNs assign a continuous weight to each input. These weighted inputs are then summed, and the result is passed through a biological activation mechanism (such as a riboswitch or a protease-regulated system) to generate a graded output.
IANN approach provides several important advantages:
Continuous output resolution: Unlike Boolean circuits that only produce ON or OFF outputs, IANNs generate different levels of expression depending on the strength of the inputs. This allows cells to respond in a more precise and dose-dependent way, which is important for applications like metabolic regulation or controlled therapeutic delivery.
Weighted signal integration: Each input does not contribute equally. Instead, every signal has a specific weight that determines how much it influences the final output. This allows the system to prioritize certain signals over others, which is not possible in traditional AND/OR gates where all inputs are treated equally.
Robustness to biological noise: Cellular environments are naturally noisy, and signals can vary between cells. Because IANNs work with continuous values rather than strict thresholds, they are more tolerant to noise and variability, making them more reliable in real biological conditions.
Greater computational power: A multilayer IANN can act as a universal function approximator, meaning it can represent very complex relationships between inputs and outputs. In contrast, Boolean circuits are limited to simple logical combinations, which restricts the complexity of decisions they can perform.
Rational tunability: The weights and biases in an IANN can be adjusted through DNA design (for example, by modifying promoters or regulatory elements) or improved through directed evolution. This makes it possible to “train” the system to recognize complex patterns, such as a specific combination of biomarkers, with much higher precision than traditional Boolean circuits.
Application of an IANN: Smart Lactase-Producing Probiotic System
As a highly relevant and practical application of an Intracellular Artificial Neural Network (IANN) I chose to apply it in the engineering of a probiotic bacterium capable of context-aware lactase production for the management of lactose intolerance. Unlike conventional synthetic circuits that respond to a single input in a binary manner, this system integrates multiple physiological signals from the gastrointestinal environment to produce a graded and condition-dependent enzymatic response.
The system incorporates multiple biologically relevant input signals, each representing a distinct physiological parameter of the gastrointestinal environment:
X1: Lactose concentration
This serves as the primary input signal, directly reflecting the presence and abundance of the substrate requiring enzymatic degradation.
X2: pH level
This input provides spatial context by distinguishing between different regions of the gastrointestinal tract. The acidic pH of the stomach versus the near-neutral pH of the intestine allows the system to restrict activation to physiologically appropriate locations, thereby preventing premature or energetically wasteful enzyme production.
X3: Inflammatory biomarkers
Molecules such as nitric oxide, reactive oxygen species or cytokine-associated metabolites act as indicators of intestinal stress or dysbiosis. This input enables modulation of the system’s response based on host physiological state, allowing adaptive tuning of output under pathological conditions.
Lactose sensitivity can be increased using a strong promoter or high-affinity regulator, corresponding to a positive weight. pH sensitivity may be implemented through a regulatory element that suppresses output under acidic conditions, corresponding to a negative or inhibitory weight. Inflammatory signals could be integrated via modulatory promoters or regulatory RNAs that amplify output under stress conditions, acting as an adjustable positive or negative weight depending on the desired response.
At the molecular level, each input is transduced into regulatory signals (e.g., transcription factors, small RNAs, or protease-mediated regulators). These signals are then integrated through combinatorial gene regulation, where promoter strengths, ribosome binding site efficiencies, and degradation dynamics collectively encode the effective weights.
The aggregated signal undergoes a transformation through a biological activation function, which may be implemented via nonlinear regulatory elements such as riboswitches, cooperative transcriptional regulators, or proteolytic cascades. This step introduces thresholding and saturation effects analogous to activation functions in artificial neural networks, thereby enabling continuous and nonlinear input–output relationships.
Output Layer: Graded Lactase Expression
The final output of the system is the expression of the lactase enzyme, with expression levels determined by the integrated and nonlinearly transformed input signal
This enables a spectrum of responses:
Sub-threshold activation: (e.g., low lactose concentration or inhibitory pH conditions) result in negligible or no enzyme production.
High activation: (e.g., high lactose concentration under optimal pH conditions, potentially combined with inflammatory signals) drive maximal enzyme production.
Functional Behavior and Decision-Making Capability
The system effectively implements a context-dependent decision-making process, wherein output is not determined by a single condition but by the weighted combination of multiple environmental cues. For example:
The presence of lactose alone is insufficient to trigger activation under acidic conditions, thereby preventing inappropriate expression in the stomach.
Under intestinal pH, lactose induces activation in a concentration-dependent manner.
In the presence of both high lactose and inflammatory signals, the system can upregulate lactase production, potentially enhancing digestive efficiency under stress conditions.
Limitations and Practical Constraints
Despite its conceptual advantages, the implementation of such an IANN-based system faces several challenges:
Stochastic gene expression: Intrinsic and extrinsic noise can introduce variability in circuit performance across individual cells.
Parameter tuning complexity: Precise calibration of weights and activation thresholds through genetic elements (e.g., promoters, RBSs) remains experimentally demanding.
Kinetic limitations: Transcriptional and translational processes impose temporal delays, limiting the speed of system response.
Regulatory crosstalk: Interactions between synthetic and endogenous pathways may lead to unintended behaviors.
Metabolic burden: The expression of complex regulatory networks can reduce host fitness and stability.
Environmental variability: Dynamic and heterogeneous gut conditions may challenge the robustness and predictability of the system.
Implementation of a Multilayer Perceptron Using Endoribonucleases
To implement a multilayer perceptron in a biological system, the output of one computational layer must regulate the activity of the next. This can be achieved using a cascade of endoribonucleases, where each layer processes inputs and produces a regulatory molecule that serves as the input for the subsequent layer.
Input Representation
The system integrates multiple biological inputs represented as molecular signals:
X1: Csy4 endoribonuclease (constitutively or inducibly expressed)
X2: an additional regulatory signal (e.g., inducible promoter or transcriptional activator)
X3: environmental or metabolic signal (e.g., pH, or inflammatory markers such as nitric oxide)
These inputs are converted into regulatory effects at the gene expression level, analogous to numerical inputs in an artificial neural network.
Layer 1: Intermediate Processing
In the first layer, the inputs jointly regulate the expression of an intermediate endoribonuclease (e.g., Cas6a).
The mRNA encoding this enzyme is engineered to contain specific recognition sites for Csy4. As a result:
–> The presence of Csy4 (X1) induces cleavage of the mRNA, leading to repression of Cas6a expression
–> The second input (X2) can act as an activator, promoting transcription of the Cas6a gene
Thus, Layer 1 integrates activating and inhibitory signals. The resulting expression level of Cas6a reflects a balance between these opposing regulatory effects, analogous to a weighted sum followed by a nonlinear activation function in a perceptron.
Layer 2: Output Generation
The output of Layer 1 (Cas6a protein) serves as the regulatory input for Layer 2.
The mRNA encoding a reporter protein (e.g., GFP) is engineered to contain Cas6a recognition sites. Consequently:
–> High levels of Cas6a lead to cleavage of GFP mRNA and repression of fluorescence
–> Low levels of Cas6a allow GFP expression
This establishes a second computational layer in which the input is not external, but derived from the processed output of the first layer.
System-Level Behavior
This cascading architecture enables hierarchical signal processing within the cell.
–> When Csy4 levels are high, Cas6a production is suppressed, allowing GFP expression
–> When Csy4 levels are low and activation dominates, Cas6a is produced and represses GFP
Therefore, the final output depends on both the original inputs and the intermediate computation performed in Layer 1.
Assignment Part 2: Fungal Materials
Assignees for this section
MIT/Harvard students Required
Committed Listeners Required
What are some examples of existing fungal materials and what are they used for? What are their advantages and disadvantages over traditional counterparts?
What might you want to genetically engineer fungi to do and why? What are the advantages of doing synthetic biology in fungi as opposed to bacteria?
Fungal Materials and Their Uses
Fungi, especially their root-like networks called mycelium, are becoming a surprisingly powerful source of sustainable materials. Unlike plastics or leather, which require heavy manufacturing and chemicals, mycelium-based materials are grown. The fungi take agricultural waste—things like sawdust, rice husks, or hemp—and weave it into solid, structured materials. It’s almost like nature is doing the 3D printing for us.
One of the most familiar uses today is in packaging. Mycelium can form lightweight, shock-absorbing foams that replace Styrofoam or plastic inserts. Fragile items like electronics, furniture, or delicate goods can be safely packed in these eco-friendly alternatives. Companies like Ecovative and IKEA have already begun experimenting with this approach, showing that sustainable materials don’t have to compromise practicality.
image_ref
Fungi are also stepping into the fashion world through myco-leather. By processing mats of mycelium into flexible sheets, it’s possible to make shoes, bags, and even clothing without harming animals. Myco-leather is fully biodegradable, reduces chemical waste, and offers a much lower environmental footprint than traditional leather production. It’s a great example of how biology can meet design.
image_ref
In construction, fungal materials are finding their place as well. Mycelium boards can provide thermal and acoustic insulation, or serve as lightweight panels for ceilings and walls. They are naturally fire-resistant, resistant to pests like termites, and completely biodegradable. This means that even in building applications, mycelium offers both functionality and sustainability.
The versatility doesn’t stop there. Designers and researchers are exploring fungal foams, textiles, and even furniture, taking advantage of mycelium’s ability to grow into complex shapes. People are also experimenting with specialty applications, like wearable electronics, wound dressings, filters, and acoustic panels. Fungi aren’t just materials—they’re living factories that can be shaped, molded, and sometimes even programmed to do more.
image_ref
Advantages and Disadvantages of Fungal Materials
Advantages
Disadvantages
Made from renewable agricultural waste and fully biodegradable
Lower mechanical strength compared to plastics, metals, or treated leather
“Grown” in controlled conditions with minimal energy and no toxic chemicals
Sensitive to moisture; can deform or degrade if untreated
Naturally fire-resistant and termite-resistant
Slower production—growing a material takes days or weeks
Lightweight with good strength-to-weight ratio
Batch-to-batch variability due to biological growth
Can return nutrients to the soil after disposal
Limited durability under extreme conditions without extra treatment
Genetic Engineering and Synthetic Biology in Fungi
Fungi are not just fascinating organisms—they are also incredibly versatile tools for engineering. If I were to genetically engineer fungi, I would aim to enhance the properties that currently limit their use while maximizing their natural strengths. For instance, one limitation of mycelium-based materials is their mechanical strength, which can make them less competitive compared to plastics or synthetic foams. I would focus on modifying the cell wall composition or growth patterns to produce stronger, more durable materials, making fungi a realistic alternative for packaging, textiles, and construction.
Another area I would target is environmental resilience. Fungal materials are naturally biodegradable, which is a huge advantage, but they can degrade too quickly in humid or wet environments. By engineering fungi to better tolerate moisture or extreme temperatures, it would be possible to create materials that maintain their structure and functionality in a wider range of conditions, expanding their practical applications.
Beyond materials, fungi can also be engineered for functional enhancements. I would consider adding traits like pigmentation for natural coloring, antimicrobial properties to extend shelf life, or even self-healing abilities so that minor damage doesn’t ruin the product. These modifications could transform mycelium into “smart materials” that are not only sustainable but also highly functional.
Why Use Fungi Instead of Bacteria?
Fungi offer several important advantages over bacteria when it comes to synthetic biology. First, as eukaryotic organisms, they have more advanced cellular machinery. This allows them to properly fold and modify complex proteins through processes like glycosylation, which is essential for many pharmaceuticals and functional biomolecules.
Another major advantage is their filamentous growth. Many fungi grow as long branching structures (hyphae), which makes them very efficient at secreting enzymes and other products into their environment. This simplifies downstream processing because the desired product is often already outside the cell.
Fungi also have a much richer and more diverse metabolism compared to most bacteria. They naturally produce a wide range of secondary metabolites, which means they can be engineered to generate a broader variety of useful compounds, from drugs to pigments to bioactive molecules.
In addition, fungi are generally more robust in industrial settings. They can grow on cheap, low-quality substrates like agricultural waste and tolerate harsher conditions than many bacteria, making them more practical for large-scale, sustainable production.
That said, working with fungi can be more complex. They tend to grow more slowly than bacteria, and genetic engineering tools are less standardized. However, despite these challenges, their unique capabilities make them extremely valuable for applications where bacteria fall short.
Assignment Part 3: First DNA Twist Order
Assignees for this section
MIT/Harvard students Required
Committed Listeners Required
Review the Individual Final Project documentation guidelines.
Submit this Google Form with your draft Aim 1, final project summary, HTGAA industry council selections, and shared folder for DNA designs. DUE MARCH 20 FOR MIT/HARVARD/WELLESLEY STUDENTS
Review Part 3: DNA Design Challenge of the week 2 homework. Design at least 1 insert sequence and place it into the Benchling/Kernel/Other folder you shared in the Google Form above. Document the backbone vector it will be synthesized in on your website.
for this part, I have developed three potential ideas for my final project and would greatly appreciate your feedback to help refine my direction. While I am still open to suggestions, I currently find myself most aligned with my second idea, as it feels both biologically intuitive and well-matched to the techniques we have learned throughout the course.
The idea I am leaning toward is focused on engineering an E. coli reporter system to monitor protein aging during heterologous expression using a fluorescent timer protein. I am particularly drawn to this concept because it allows me to integrate multiple core synthetic biology tools, including DNA construct design, protein engineering, and computational structure prediction, while also remaining experimentally feasible within the scope of the course. In addition, the system is mechanistically clear, which makes it easier to design, test, and interpret.
I have further refined this idea into a more specific and functional design: a time-dependent protein quality control system in which a fluorescent timer regulates the exposure of a degron, leading to the selective degradation of aged proteins. In this system, a protein of interest is fused to a fluorescent timer and a C-terminal degron. As the protein matures and the timer shifts from its “young” to “old” fluorescence state, conformational or structural changes are expected to increase the accessibility of the degron. This, in turn, allows recognition by the host proteolytic machinery, enabling targeted degradation of older protein populations.
The key modification from the original idea is the addition of a functional outcome—degradation—rather than only monitoring protein age. This transforms the system from a passive reporter into an active quality control mechanism. The purpose of this change is to address a limitation in current heterologous expression systems, where proteins can accumulate in misfolded or non-functional states over time. By selectively degrading older or potentially damaged proteins, this system could improve overall protein quality and stability.
The broader gap I am attempting to address is the lack of dynamic, time-resolved control over protein lifespan in bacterial systems. Most current approaches either measure protein expression statically or rely on constitutive degradation signals that do not account for protein age. This project introduces a strategy to link protein function, age, and degradation in a single genetically encoded system.
At this stage, I would greatly value any feedback on the conceptual design, feasibility, or potential improvements. In particular, I would appreciate input on whether the proposed mechanism for degron exposure is realistic, and whether there are alternative design strategies that could strengthen the system. Any suggestions on experimental design, protein choice, or construct optimization would also be extremely helpful.
Please feel free to share feedback through any preferred channel, including email or whatsApp. Thank you for your time and guidance.
Designing the isert sequence in Benchling:
for this idea i designed the genetic construct in Benchling that encodes a fusion protein consisting of GST as the protein of interest, followed by a flexible linker, a fluorescent timer protein, a second short linker, and a C-terminal ssrA degron whose sequences are represented in the following table:
Genetic Element
Function
DNA Sequence (5' → 3')
Start Codon
Initiates translation
ATG
Protein of Interest (GST - Schistosoma japonicum)
Reporter protein for studying protein aging and degradation
This design enables time-dependent exposure of the degron, allowing selective degradation of aged proteins by the host proteolytic system.
The designed insert will be cloned into a pET28 expression vector for protein expression in Escherichia coli BL21(DE3). This vector provides a T7 promoter, ribosome binding site, transcription terminator, and an N-terminal His₆ tag for protein purification. Therefore, only the coding sequence of the fusion protein was designed in Benchling.
In this homework, ChatGPT helped me structure and write the answers and descriptions clearly, while Cloud AI generated the diagrams comparing Boolean genetic circuits and INNAs, the example illustrating a multilayer perceptron application, and the diagram describing my final project idea proposal.
Gandia, A., van den Brandhof, J. G., Appels, F. V. W., & Jones, M. P. (2021). Flexible Fungal Materials: Shaping the Future. Trends in Biotechnology, 39(12), 1321–1331. https://doi.org/10.1016/j.tibtech.2021.03.002
Halužan Vasle, A., & Moškon, M. (2024). Synthetic biological neural networks: From current implementations to future perspectives. BioSystems, 237, 105164. https://doi.org/10.1016/j.biosystems.2024.105164
Hinneburg, H., Gu, S., & Naseri, G. (2025). Fungal Innovations—Advancing Sustainable Materials, Genetics, and Applications for Industry. Journal of Fungi, 11(10). https://doi.org/10.3390/jof11100721
Lim, H. G., Jang, S., Jang, S., Seo, S. W., & Jung, G. Y. (2018). Design and optimization of genetically encoded biosensors for high-throughput screening of chemicals. Current Opinion in Biotechnology, Analytical Biotechnology, 54, 18–25. https://doi.org/10.1016/j.copbio.2018.01.011
Mattern, D. J., Valiante, V., Unkles, S. E., & Brakhage, A. A. (2015). Synthetic biology of fungal natural products. Frontiers in Microbiology, 6, 775. https://doi.org/10.3389/fmicb.2015.00775
Moorman, A., Samaniego, C. C., Maley, C., & Weiss, R. (2019). A Dynamical Biomolecular Neural Network. 2019 IEEE 58th Conference on Decision and Control (CDC), 1797–1802. https://doi.org/10.1109/CDC40024.2019.9030122
Parhizi, Z., Dearnaley, J., Kauter, K., Mikkelsen, D., Pal, P., Shelley, T., & Burey, P. (Polly). (2025). The Fungus Among Us: Innovations and Applications of Mycelium-Based Composites. Journal of Fungi, 11(8), 549. https://doi.org/10.3390/jof11080549
Seak, L. C. U., Lo, O. L. I., Suen, W. C.-W., & Wu, M.-T. (2021). Next-generation biocomputing: Mimicking artificial neural network with genetic circuits (p. 2021.03.12.435120). bioRxiv. https://doi.org/10.1101/2021.03.12.435120
Secret fungi in everyday life | Kew. (n.d.). Retrieved March 30, 2026, from https://www.kew.org/read-and-watch/everyday-fungi-food-medicine
Stock, C. H., Harvey, S. E., Ocko, S. A., & Ganguli, S. (2022). Synaptic balancing: A biologically plausible local learning rule that provably increases neural network noise robustness without sacrificing task performance. PLoS Computational Biology, 18(9), e1010418. https://doi.org/10.1371/journal.pcbi.1010418
van der Linden, A. J., Pieters, P. A., Bartelds, M. W., Nathalia, B. L., Yin, P., Huck, W. T. S., Kim, J., & de Greef, T. F. A. (2022). DNA Input Classification by a Riboregulator-Based Cell-Free Perceptron. ACS Synthetic Biology, 11(4), 1510–1520. https://doi.org/10.1021/acssynbio.1c00596
Wang, X., Chen, Y.-Z., Qiu, X.-D., Chen, L., Teng, Y.-M., Ding, C., Huang, Y.-T., Wang, S.-Y., Liu, S.-Y., Ding, B., Laborda, P., & Zhu, S.-Q. (2026). Bioactivity and mechanisms of Ewingella americana for the control of Alternaria leaf spot on peanut. Physiological and Molecular Plant Pathology, 142, 103088. https://doi.org/10.1016/j.pmpp.2025.103088
Yang, P., Condrich, A., Lu, L., Scranton, S., Hebner, C., Sheykhhasan, M., & Ali, M. A. (2024). Genetic Engineering in Bacteria, Fungi, and Oomycetes, Taking Advantage of CRISPR. DNA, 4(4), 427–454. https://doi.org/10.3390/dna4040030
Week 09 HW: Cell Free Systems
Homework Part A: General and Lecturer-Specific Questions
General homework questions
Assignees for this section
MIT/Harvard students Required
Committed Listeners Required
Explain the main advantages of cell-free protein synthesis over traditional in vivo methods, specifically in terms of flexibility and control over experimental variables. Name at least two cases where cell-free expression is more beneficial than cell production.
Describe the main components of a cell-free expression system and explain the role of each component.
Why is energy provision regeneration critical in cell-free systems? Describe a method you could use to ensure continuous ATP supply in your cell-free experiment.
Compare prokaryotic versus eukaryotic cell-free expression systems. Choose a protein to produce in each system and explain why.
How would you design a cell-free experiment to optimize the expression of a membrane protein? Discuss the challenges and how you would address them in your setup.
Imagine you observe a low yield of your target protein in a cell-free system. Describe three possible reasons for this and suggest a troubleshooting strategy for each.
Main Advantages of Cell-Free Protein Synthesis (CFPS) Over Traditional In Vivo Methods
Cell-free protein synthesis removes the constraints of using living cells. You are working in a test tube, which gives you direct control over the reaction environment without worrying about cell viability.
image ref
Flexibility and Control:
Direct manipulation: You can easily change pH, salt concentration, redox potential, or add detergents, chaperones, or unnatural amino acids at any time. In living cells, these changes would kill the cells or fail to enter.
No cell walls or membranes: You add DNA directly to the extract. There is no need for transformation, selection, or cell lysis steps. This saves hours or days.
Toxic protein production: You can synthesize proteins that would kill living cells (e.g., membrane proteins, proteases, toxins).
Speed and efficiency: Protein production takes 2–4 hours instead of days. All energy goes into making your target protein, not cell growth.
Two cases where CFPS is more beneficial than cell production:
High-throughput screening of enzyme variants or genetic circuits – Because reactions are fast and can be done in 96- or 384-well plates, you can test hundreds of conditions or mutants in a single afternoon.
Production of toxic membrane proteins (e.g., GPCRs, viral ion channels) – These proteins kill E. coli or insect cells when produced in vivo. In CFPS, you can add detergents or nanodiscs directly to the reaction to keep the protein soluble and stable.
Main Components of a Cell-Free Expression System and Their Roles
A cell-free system combines cellular machinery with necessary nutrients and energy. Below are the key components and what each does.
Derived from broken cells (e.g., E. coli, wheat germ, rabbit reticulocytes). Provides ribosomes, tRNAs, aminoacyl-tRNA synthetases, initiation/elongation/termination factors, and native enzymes needed for transcription and translation.
Genetic template (DNA or mRNA)
The instruction manual. DNA (plasmid or linear PCR product) is transcribed into mRNA, then translated into protein. If you add mRNA directly, translation starts immediately without transcription.
Amino acids
The 20 building blocks that ribosomes link together to form the protein chain.
Energy source (ATP, GTP)
Provides the chemical energy needed for bond formation during translation, transcription, and tRNA charging.
Energy regeneration system
Converts spent ADP back to ATP. Without this, the reaction stops within 10–20 minutes. Common systems include creatine phosphate/creatine kinase or phosphoenolpyruvate (PEP)/pyruvate kinase.
RNA polymerase (e.g., T7 RNA polymerase)
If using a DNA template with a T7 promoter, you add this enzyme separately to transcribe DNA into mRNA efficiently.
Buffer solution (salts and cofactors)
Maintains optimal pH (usually 7.4–8.0) and ionic conditions. Magnesium (Mg²⁺) and potassium (K⁺) concentrations are critical – too little and ribosomes fall apart, too much and they stop working.
RNase and protease inhibitors
Protect your mRNA and protein from degradation by native enzymes present in the cell extract.
These components are combined either as a crude extract (fast and cheap) or a PURE system (reconstituted from purified components, cleaner but more expensive).
Why Energy Provision Regeneration Is Critical and a Method to Ensure Continuous ATP Supply
Why it is critical?
Cell-free systems lack the metabolic networks of living cells that continuously generate ATP. Translation consumes ATP rapidly – each peptide bond uses 2 ATP equivalents. Without regeneration, ATP drops to zero within 10–20 minutes, and protein synthesis stops. To produce protein for 2–6 hours, you need a way to keep making ATP from ADP.
Method for continuous ATP supply: Phosphoenolpyruvate (PEP) / Pyruvate Kinase system
What you add: Phosphoenolpyruvate (PEP) and the enzyme pyruvate kinase.
How it works: Pyruvate kinase transfers a high-energy phosphate group from PEP to ADP, regenerating ATP and producing pyruvate as a byproduct.
Why it works well: PEP has a higher phosphate transfer potential than ATP, so the reaction favors ATP formation. It is reliable and commonly used in E. coli systems.
Alternative methods (if PEP causes problems):
If the PEP system presents limitations, other options can be used:
Creatine phosphate / creatine kinase: Converts ADP + creatine phosphate → ATP + creatine. Very common and stable.
Glucose / hexokinase or maltodextrin – cheaper but can cause pH drops.
Comparison of Prokaryotic vs. Eukaryotic Cell-Free Expression Systems
Cell-free expression systems can be broadly divided into prokaryotic and eukaryotic platforms, and the choice between them mainly depends on the complexity of the target protein.
Prokaryotic system (e.g., Escherichia coli)
These systems are typically derived from E. coli and are widely used because they are fast, cost-effective, and produce high protein yields in a short time.
However, they lack the machinery needed for post-translational modifications such as glycosylation, and they often have difficulty forming correct disulfide bonds and folding complex proteins properly.
Eukaryotic system (e.g., rabbit reticulocyte lysate, wheat germ extract)
These systems provide a more suitable environment for protein folding. They contain molecular chaperones and can support disulfide bond formation and, in some cases, post-translational modifications.
However, they are generally more expensive, slower, and produce lower yields compared to prokaryotic systems.
Choosing proteins for each system
–> For prokaryotic systems:
The general rule is to choose proteins that are simple, relatively small, and do not require post-translational modifications or complex folding. These proteins should be able to fold easily in the cytoplasm.
Based on these criteria, bacterial luciferase is a suitable choice. This enzyme produces a measurable light signal, making it very useful as a reporter protein. It does not require glycosylation and can be efficiently expressed and folded in E. coli, allowing easy detection through luminescence assays.
–> For eukaryotic systems:
The selection criteria are different. Proteins are usually more complex, may contain multiple domains, require disulfide bonds, or need chaperones for correct folding. Some are also membrane proteins and need a suitable environment to function.
Membrane proteins, such as G protein-coupled receptors (GPCRs), are good examples. These proteins have complex structures with multiple transmembrane domains and require proper folding machinery and membrane-like conditions. Such requirements cannot be met by prokaryotic systems, while eukaryotic systems can support their correct folding and functionality
Complex human proteins, antibodies, secreted proteins, membrane proteins requiring PTMs
Designing a Cell-Free Experiment to Optimize Membrane Protein Expression
Optimizing the expression of a membrane protein in a cell-free system requires careful consideration of the protein’s complexity, folding requirements, and membrane integration. Membrane proteins are challenging to produce because of their hydrophobic transmembrane domains, tendency to aggregate, and need for a membrane-like environment and proper chaperones.
Choosing the right Expression System
The choice of a cell-free system depends on the nature and complexity of the membrane protein:
Prokaryotic system (e.g., Escherichia coli): Suitable for simpler membrane proteins with few transmembrane domains that do not require complex folding or post-translational modifications. Advantages include fast expression, high yield, and low cost. However, proper folding must be supported using membrane mimics such as liposomes, nanodiscs, or mild detergents.
Eukaryotic system (e.g., rabbit reticulocyte lysate, wheat germ extract): Preferable for complex membrane proteins with multiple transmembrane domains or disulfide bonds. These systems contain molecular chaperones and provide a more natural folding environment, reducing aggregation and increasing the chance of functional protein production. Limitations include higher cost, slower expression, and lower yields.
Providing a Membrane-Like Environment
Membrane proteins require an environment that mimics a lipid bilayer. In both prokaryotic and eukaryotic systems, this can be achieved by:
Adding liposomes or nanodiscs
Using mild detergents carefully optimized to prevent aggregation
This ensures proper insertion of the protein into a membrane-like environment, which is critical for correct folding and functionality.
Optimizing Folding and Expression
To further improve expression and functionality:
Add chaperones if the protein is prone to misfolding
Adjust reaction conditions such as temperature, Mg²⁺ concentration, and DNA template concentration
Use a continuous ATP regeneration system (e.g., PEP/pyruvate kinase) to sustain protein synthesis
Employ a Continuous Exchange Cell-Free (CECF) setup to extend reaction time up to 24 hours. This setup constantly provides fresh energy (ATP/GTP) and removes inhibitory byproducts, which significantly improves protein yield and folding efficiency
Challenges and how to address them:
Challenge
Why it happens
Solution
Protein aggregation
Membrane proteins are hydrophobic and clump together in water.
Add liposomes or nanodiscs from the start. Test different detergents (0.1–1% DDM, Brij-35, or LMNG).
Low yield
Detergents can inhibit ribosomes.
Titrate detergent concentration – start low, increase until protein is soluble but yield remains acceptable.
Ribosome stalling
The hydrophobic nascent chain sticks to the ribosome exit tunnel.
Optimize the N-terminal sequence. Use a fusion tag like Mistic (from Bacillus subtilis) that helps membrane proteins fold.
No activity (misfolding)
Protein inserted incorrectly or in wrong lipid environment.
Test different lipid compositions (e.g., POPC, POPG, or E. coli polar lipids). Add chaperones (GroEL/GroES).
Short reaction time
Energy runs out or inhibitors accumulate.
Use CECF (dialysis) format. Double the energy regeneration components.
Optimization checklist:
Titrate magnesium (8–16 mM) – critical for ribosome function.
Test temperatures (20°C, 25°C, 30°C, 37°C).
Try 2–3 different detergents or lipid preparations.
Run a small-scale (10 µL) screening reaction before scaling up.
Low Yield of Target Protein – Three Possible Reasons and Troubleshooting
If your cell-free reaction produces very low yield protein, check these common issues:
Reason 1: Low quality of DNA template
The DNA may contain inhibitors (salts, ethanol, phenol, agarose) or be degraded by nucleases. Without a good template, no mRNA is made.
Troubleshooting:
✅ Purify DNA using a spin column kit (not just alcohol precipitation).
✅ Avoid using DNA cut from agarose gels – re-extract if necessary.
✅ Check DNA concentration and run an agarose gel to see if it is intact.
✅ Use 10–20 µg of plasmid or 5–10 µg of linear PCR product per 1 mL reaction.
Reason 2: Codon bias (rare codons in the target gene)
If your gene contains many codons that are rare in the host (e.g., human gene expressed in E. coli extract), ribosomes stall or terminate early. This produces truncated or no protein.
Troubleshooting:
✅ Re-synthesize the gene with codons optimized for your extract (E. coli or wheat germ). Many online tools and services do this.
✅ Use an extract from a strain that supplies extra rare tRNAs (e.g., E. coli Rosetta or BL21 CodonPlus).
✅ Switch to a PURE system, which is less sensitive to codon bias.
Reason 3: Rapid energy depletion
ATP runs out after 30–60 minutes because the energy regeneration system is weak or missing. The reaction stops while plenty of template and amino acids remain.
Troubleshooting:
✅ Switch to a Continuous Exchange Cell-Free (CECF) format (dialysis membrane or two-chamber system). This constantly supplies fresh energy and removes waste.
✅ Increase the concentration of your energy regeneration components (e.g., double creatine phosphate from 50 mM to 100 mM).
✅ Use a more efficient energy source: PEP/pyruvate kinase or a maltodextrin-based system.
✅ Check the pH after the reaction – if it dropped below 7.0, your energy system may be producing acid. Switch to creatine phosphate (less pH drop).
Additional common reasons (if the above don’t help):
Protein aggregation: Lower temperature to 20–25°C. Add 0.5% detergent or 1 mM DTT.
RNase contamination: Use nuclease-free tubes, add RNase inhibitor (e.g., murine RNase inhibitor at 1 U/µL), and wear gloves.
Wrong magnesium concentration: Test a range from 8 to 16 mM Mg²⁺. Too low and ribosomes dissociate; too high and they lock up.
Homework question from Kate Adamala
Assignees for this section
MIT/Harvard students Required
Committed Listeners Required
Design an example of a useful synthetic minimal cell as follows:
Pick a function and describe it.
a. What would your synthetic cell do? What is the input and what is the output?
b. Could this function be realized by cell-free Tx/Tl alone, without encapsulation?
c. Could this function be realized by genetically modified natural cell?
d. Describe the desired outcome of your synthetic cell operation.
Design all components that would need to be part of your synthetic cell.
a. What would be the membrane made of?
b. What would you encapsulate inside? Enzymes, small molecules.
c. Which organism your Tx/Tl system will come from? Is bacterial OK, or do you need a mammalian system for some reason? (hint: for example, if
you want to use small molecule modulated promotors, like Tet-ON, you need mammalian)
d. How will your synthetic cell communicate with the environment? (hint: are substrates permeable? or do you need to express the membrane channel?)
Experimental details
a. List all lipids and genes. (bonus: find the specific genes; for example, instead of just saying “small molecule membrane channel” pick the actual gene.)
b. How will you measure the function of your system?
Pick a function and describe it.
a. What would your synthetic cell do? What is the input and what is the output?
My synthetic minimal cell (SMC) is a “killer biosensor” that detects the presence of Staphylococcus aureus and responds by producing and secreting lysostaphin, a specific anti-staphylococcal enzyme.
Input: AIP-1 (autoinducing peptide-1), a quorum sensing molecule secreted by S. aureus (Group I strains) when it reaches high cell density.
Output: Lysostaphin (27 kDa zinc metalloprotease from Simulans staphylolyticus), which specifically cleaves the pentaglycine cross-bridges in the S. aureus cell wall, causing bacterial lysis.
Overall function: The SMC acts as a sentinel that detects S. aureus quorum signaling and releases a targeted killer, preventing infection, biofilm formation, and the spread of antibiotic-resistant strains.
b. Could this function be realized by cell-free Tx/Tl alone, without encapsulation?
No. Without encapsulation, the cell-free reaction would produce lysostaphin immediately and continuously, regardless of whether AIP-1 is present. The SMC would release its output constitutively, wasting the enzyme and providing no sensing function. Encapsulation creates a barrier that allows the system to wait for the input signal before producing the output. Additionally, without a membrane: The membrane-bound receptor AgrC could not be properly inserted and oriented and Lysostaphin would diffuse away uncontrollably instead of being released only after detecting S. aureus.
c. Could this function be realized by genetically modified natural cell?
Yes, in principle, but with significant drawbacks compared to a synthetic minimal cell (SMC). Natural GMOs can grow, divide, and potentially spread in the environment, and they may transfer genes to other bacteria through horizontal gene transfer. They can also mutate over time and lose their function, and the produced antibacterial molecule (e.g., lysostaphin) might harm the host cell itself. In contrast, SMCs do not replicate, cannot transfer genes, and do not evolve, making them safer and more stable. Additionally, their activity is more controlled, since the toxic compound is produced only when needed and released outward, which makes SMCs more suitable for applications such as medical treatments or topical use.
d. Describe the desired outcome of your synthetic cell operation.
In the presence of S. aureus (which secretes AIP-1), the synthetic cell detects AIP-1 via the membrane-bound AgrC receptor. This triggers a phosphorylation cascade that activates AgrA, which then binds the P2 promoter and drives transcription of the lysostaphin gene. Lysostaphin is produced inside the vesicle and secreted into the environment. The released lysostaphin specifically cleaves the pentaglycine bridges in the S. aureus cell wall, causing bacterial lysis and death.
In the absence of AIP-1 (no S. aureus), the synthetic cell remains inactive. The P2 promoter is “off” (no leak), and no lysostaphin is produced. This ensures the toxin is only made when and where it is needed.
Design all components that would need to be part of your synthetic cell.
a. What would the membrane be made of?
The membrane needs to be stable but also allow the AgrC histidine kinase (a transmembrane protein) to insert properly. A suitable choice is liposomes composed of:
POPC (1-palmitoyl-2-oleoyl-sn-glycero-3-phosphocholine) – 60 mol% → Main structural lipid of the membrane
DOPG (1,2-dioleoyl-sn-glycero-3-phospho-(1’-rac-glycerol)) – 10 mol% → Adds negative charge, which helps the insertion and function of membrane proteins like AgrC
b. What would you encapsulate inside? Enzymes, small molecules.
Inside the synthetic cell, i would encapsulate the basic components needed for protein production and function. First, a cell-free transcription–translation system from Escherichia coli is included, which contains all the machinery such as ribosomes, tRNAs, enzymes, and T7 RNA polymerase to make proteins.
I also add the DNA templates: agrC and agrA genes (from Staphylococcus aureus) under a constitutive promoter to sense the signal and activate the response, and the lysostaphin (lys) gene (from Staphylococcus simulans) under the P2 promoter to produce the antibacterial protein. A secretion signal is fused to the lys gene so the protein can be exported outside the cell.
In addition, small molecules like:
ATP, GTP, CTP, UTP (nucleotide triphosphates for transcription)
20 amino acids (building blocks for protein synthesis)
c. Which organism will your Tx/Tl system come from?
The Tx/Tl system will come from a bacterial source, specifically an Escherichia coli extract. This is because the AgrC/AgrA system is naturally bacterial and works well in an E. coli cell-free system, where AgrC can insert into liposomes properly. In addition, lysostaphin is a bacterial enzyme that does not require complex modifications, so it can be produced efficiently in this system. Finally, using a bacterial extract is simpler, faster, and cheaper than using a mammalian system, which is not needed in this case.
d. How will your synthetic cell communicate with the environment?
This synthetic cell communicates with its environment in a simple and efficient way using natural bacterial mechanisms:
For input, the signaling molecule AIP-1 does not need to enter the cell; instead, it binds directly to the external part of AgrC, a membrane protein embedded in the liposome. This means the sensor is already on the surface, so no channels are needed.
For output, lysostaphin (a relatively large protein, about 27 kDa) cannot pass through the membrane by diffusion. To solve this, a secretion signal peptide is added to lysostaphin, which directs it to the membrane during its synthesis. The protein is then transported across the membrane through the SecYEG translocon, a natural protein channel present in the Escherichia coli extract. This allows the protein to be released outside the synthetic cell in a controlled and efficient way, without needing artificial pores.
Membrane histidine kinase that binds AIP-1 on the extracellular side
agrA
S. aureus (same strain)
Constitutive (T7)
Response regulator; when phosphorylated by AgrC, activates P2 promoter
lys (lysostaphin) Fused to sec-secretion signal
Simulans staphylolyticus
P2 promoter (from S. aureus agr operon)
Zinc metalloprotease that kills S. aureus, directed to be secreted across the membrane via the sec-secretion signal
Cell-free Tx/Tl system: All machinery for transcription and translation from E. coli extract (ribosomes, tRNAs, aminoacyl-tRNA synthetases, initiation/elongation/termination factors, T7 RNA polymerase).
b. How will you measure the function of your system?
Measurement 1: AIP-1 sensing (dose–response)
The synthetic cells can be exposed to different concentrations of AIP-1. After a few hours, lysostaphin production is measured using methods like ELISA, Western blot, or an enzyme activity assay. If the system works properly, higher AIP-1 levels should lead to higher lysostaphin production.
Measurement 2: Lysostaphin production (fluorescent reporter)
The lysostaphin gene can be replaced with GFP (green fluorescent protein) under the same promoter. The synthetic cells can then be monitored over time using a plate reader to measure fluorescence. Higher fluorescence indicates stronger gene expression.
Measurement 3: Killing of Staphylococcus aureus (functional assay)
The synthetic cells can be incubated with live bacteria in culture medium. After several hours, bacterial growth can be measured using OD600, colony counting (CFU), or live/dead staining. Reduced growth shows that the system is effective.
Measurement 4: Secretion efficiency
The synthetic cells can be centrifuged to separate them from the surrounding liquid. Lysostaphin activity is then measured both in the supernatant (outside) and inside the cells. A good system will show most of the protein in the supernatant.
Measurement 5: Promoter leakiness (control test)
The synthetic cells can be tested without adding AIP-1 to check background expression. Ideally, very little lysostaphin should be produced. If significant production is observed, the promoter may be leaky and require optimization.
Homework question from Peter Nguyen
Assignees for this section
MIT/Harvard students Required
Committed Listeners Required
Freeze-dried cell-free systems can be incorporated into all kinds of materials as biological sensors or as inducible enzymes to modify the material itself or the surrounding environment. Choose one application field — Architecture, Textiles/Fashion, or Robotics — and propose an application using cell-free systems that are functionally integrated into the material. Answer each of these key questions for your proposal pitch:
Write a one-sentence summary pitch sentence describing your concept.
How will the idea work, in more detail? Write 3-4 sentences or more.
What societal challenge or market need will this address?
How do you envision addressing the limitation of cell-free reactions (e.g., activation with water, stability, one-time use)?
One-sentence pitch
A wall paint containing synthetic minimal cells that detect toxic mold signals in damp walls and produce enzymes to neutralize mycotoxins and inhibit mold growth.
The paint is embedded with microcapsules containing freeze-dried synthetic minimal cells (SMCs). When the wall becomes damp, the SMCs are activated by chemical signals released by mold, such as those from Stachybotrys chartarum. Once triggered, the SMCs produce enzymes or antimicrobial proteins that either degrade mycotoxins or prevent further mold growth. This creates a self-protecting coating that actively reduces mold and mycotoxin levels in real-time, improving indoor air safety.
What societal challenge or market need does this address?
Toxic wall moisture is a serious indoor environmental problem. Persistent dampness encourages growth of black mold, which releases mycotoxins harmful to human health, causing respiratory issues, chronic fatigue, and neurological problems. Current paints only act as passive barriers and do not remove toxins. This smart paint provides active protection, reducing health risks and the need for costly remediation.
How will you address limitations of cell-free systems?
The SMCs are freeze-dried within protective microcapsules, remaining inactive until moisture activates them. Microcapsules shield the system during storage and paint application. Activation only occurs when mold is present, ensuring efficient use. The one-time-use limitation is addressed by applying fresh paint layers during regular maintenance, keeping the wall continuously protected.
Homework question from Ally Huang
Assignees for this section
MIT/Harvard students Required
Committed Listeners Required
Freeze-dried cell-free reactions have great potential in space, where resources are constrained. As described in my talk, the Genes in Space competition challenges students to consider how biotechnology, including cell-free reactions, can be used to solve biological problems encountered in space. While the competition is limited to only high school students, your assignment will be to develop your own mock Genes in Space proposal to practice thinking about biotech applications in space!
For this particular assignment, your proposal is required to incorporate the BioBits® cell-free protein expression system, but you may also use the other tools in the Genes in Space toolkit (the miniPCR® thermal cycler and the P51 Molecular Fluorescence Viewer). For more inspiration, check out https://www.genesinspace.org/ .
Provide background information that describes the space biology question or challenge you propose to address. Explain why this topic is significant for humanity, relevant for space exploration, and scientifically interesting. (Maximum 100 words)
Name the molecular or genetic target that you propose to study. Examples of molecular targets include individual genes and proteins, DNA and RNA sequences, or broader -omics approaches. (Maximum 30 words)
Describe how your molecular or genetic target relates to the space biology question or challenge your proposal addresses. (Maximum 100 words)
Clearly state your hypothesis or research goal and explain the reasoning behind it. (Maximum 150 words)
Outline your experimental plan - identify the sample(s) you will test in your experiment, including any necessary controls, the type of data or measurements that will be collected, etc. (Maximum 100 words)
One-sentence summary pitc
We will use a freeze-dried cell-free system to test how microgravity affects protein production using a GFP reporter, providing insight into reduced collagen synthesis in space.
How the idea works
Freeze-dried cell-free reactions containing a GFP reporter gene will be prepared in sealed chambers. In space, they will be rehydrated and incubated under microgravity conditions. GFP fluorescence will act as a direct indicator of protein synthesis efficiency. By comparing fluorescence levels between space and Earth conditions, we can determine whether microgravity directly affects the molecular machinery responsible for producing proteins such as collagen.
Societal challenge / market need
Long-duration space missions lead to bone loss and tissue weakening in astronauts, partly due to reduced production of structural proteins like collagen. Understanding whether this reduction is caused by fundamental limits in protein synthesis will help develop countermeasures for bone loss, injury prevention, and tissue regeneration, improving astronaut health during missions to Mars and beyond.
Limitation of cell-free reactions and how to address them
Cell-free reactions are single-use and require activation by water. To overcome this, we will freeze-dry the reactions in sealed chambers, ensuring long-term stability. The experiment will be activated by rehydration in space, allowing controlled and efficient protein production measurements under microgravity conditions.
Molecular or genetic target
Green Fluorescent Protein (GFP) gene used as a reporter to measure protein synthesis efficiency linked to collagen-related biological processes.
How the target relates to the space biology challenge
Collagen is essential for maintaining bone and tissue structure, but its production decreases in microgravity. Instead of directly expressing collagen, which is complex, GFP is used as a reporter to measure overall protein synthesis efficiency. If microgravity reduces GFP production, it suggests that the basic machinery needed to produce proteins like collagen is affected. This helps determine whether tissue weakening in space is caused by direct physical effects on protein production or by cellular regulation, providing clearer insight into astronaut health challenges.
Hypothesis or research goal
We hypothesize that microgravity reduces protein synthesis efficiency, which contributes to decreased production of structural proteins such as collagen in astronauts. The goal is to measure GFP production in a cell-free system under microgravity and Earth conditions. Since cell-free systems isolate transcription and translation from cellular signaling, any observed decrease in GFP fluorescence would indicate that physical factors—such as altered diffusion, molecular interactions, or protein folding—directly impact protein synthesis. This would suggest that microgravity imposes fundamental constraints on biological processes, helping explain tissue weakening. The results could guide the development of targeted countermeasures to maintain astronaut health during long-duration missions.
Experimental plan
Freeze-dried BioBits® reactions containing GFP DNA will be used. Samples include: (1) microgravity test reactions, (2) Earth-based positive controls, and (3) negative controls without DNA. Reactions will be rehydrated and incubated using the miniPCR®. GFP fluorescence will be measured with the P51 Molecular Fluorescence Viewer. Fluorescence intensity will be compared between conditions to determine whether microgravity reduces protein synthesis efficiency.
For this homework, I used DeepSeek and Google as sources of information. ChatGPT was used to improve the structure and clarity of the writing, while Cloud AI was used to generate the illustration of the synthetic minimal cell function.
Homework Part B: Individual Final Project
Assignees for this section
MIT/Harvard students Required
Committed Listeners Required
We’d like students to start exploring their final project in depth this week! Of your three Aims, for this week you should have at least Aim 1 decided and written down.
Put your chosen final project slide in the appropriate slide deck following the instructions on slide 1:
MIT/Harvard/Wellesley ONE FINAL PROJECT IDEA
Committed Listener ONE FINAL PROJECT IDEA
Submit this Final Project selection form if you have not already.
Begin planning how you will write your final project documentation based on these guidelines
Prepare your first DNA order and put it in the “Twist (MIT)” or “Twist (Nodes)” tab of the 2026 HTGAA Ordering: DNA, Reagents, Consumables spreadsheet, as appropriate.
First Twist order deadline for MIT/Harvard/Wellesley students is Friday, April 3 at 11PM ET
First Twist order deadline for Committed Listeners is Friday, April 10 at 11PM ET. (Your Node Lead will place the Twist order, so please work with them to finalize your constructs and ordering decisions.)
Brookwell, A., Oza, J. P., & Caschera, F. (2021). Biotechnology Applications of Cell-Free Expression Systems. Life, 11(12), 1367. https://doi.org/10.3390/life11121367
Chong, S. (2014). Overview of Cell-Free Protein Synthesis: Historic Landmarks, Commercial Systems, and Expanding Applications. Current Protocols in Molecular Biology / Edited by Frederick M. Ausubel … [et Al.], 108, 16.30.1-16.30.11. https://doi.org/10.1002/0471142727.mb1630s108
Jiang, Y., Geng, M., & Bai, L. (2020). Targeting Biofilms Therapy: Current Research Strategies and Development Hurdles. Microorganisms, 8(8), 1222. https://doi.org/10.3390/microorganisms8081222
Khambhati, K., Bhattacharjee, G., Gohil, N., Braddick, D., Kulkarni, V., & Singh, V. (2019). Exploring the Potential of Cell-Free Protein Synthesis for Extending the Abilities of Biological Systems. Frontiers in Bioengineering and Biotechnology, 7, 248. https://doi.org/10.3389/fbioe.2019.00248
Seki, E., Matsuda, N., Yokoyama, S., & Kigawa, T. (2008). Cell-free protein synthesis system from Escherichia coli cells cultured at decreased temperatures improves productivity by decreasing DNA template degradation. Analytical Biochemistry, 377(2), 156–161. https://doi.org/10.1016/j.ab.2008.03.001
Sitaraman, K., Esposito, D., Klarmann, G., Le Grice, S. F., Hartley, J. L., & Chatterjee, D. K. (2004). A novel cell-free protein synthesis system. Journal of Biotechnology, 110(3), 257–263. https://doi.org/10.1016/j.jbiotec.2004.02.014
Szaflarski, W., & Nierhaus, K. H. (2007). Question 7: Optimized Energy Consumption for Protein Synthesis. Origins of Life and Evolution of Biospheres, 37(4), 423–428. https://doi.org/10.1007/s11084-007-9091-4
Williams, P., Hill, P., Bonev, B., & Chan, W. C. (2023). Quorum-sensing, intra- and inter-species competition in the staphylococci. Microbiology, 169(8), 001381. https://doi.org/10.1099/mic.0.001381
Wu, J. A., Kusuma, C., Mond, J. J., & Kokai-Kun, J. F. (2003). Lysostaphin disrupts Staphylococcus aureus and Staphylococcus epidermidis biofilms on artificial surfaces. Antimicrobial Agents and Chemotherapy, 47(11), 3407–3414. https://doi.org/10.1128/AAC.47.11.3407-3414.2003
Week 10 HW: Imaging And Measurement
Homework: Final Project
Assignees for this section
MIT/Harvard students Required
Committed Listeners Required
For your final project:
Please identify at least one (ideally many) aspect(s) of your project that you will measure. It could be the mass or sequence of a protein, the presence, absence, or quantity of a biomarker, etc.
Please describe all of the elements you would like to measure, and furthermore describe how you will perform these measurements.
What are the technologies you will use (e.g., gel electrophoresis, DNA sequencing, mass spectrometry, etc.)? Describe in detail.
My project aims to express the carbon monoxide dehydrogenase (CODH) pathway from Oligotropha carboxidovorans in Nicotiana tabacum (tobacco) using a two-plasmid system. I need to measure whether the system works at every level — from DNA integration to enzyme function to plant health.
Below i included what I will measure, how I will measure it, and the technologies I will use:
1. Confirming DNA Integration and Sequence
What I measure:Whether the seven CODH genes are present in the tobacco genome and whether their sequences are correct.
How I measure it:
Genomic PCR: Extract DNA from leaves, design primers specific to each of my seven codon-optimized genes, run PCR, and look for bands on an agarose gel.
Border-specific PCR: Use one primer in the T-DNA border (LB or RB) and one primer in my gene to confirm the entire T-DNA integrated.
Sanger sequencing: Send PCR products to a sequencing facility, align the returned sequences against my Benchling design using SnapGene.
image ref
What I measure:Whether the seven genes are being transcribed into mRNA, and whether the three structural subunits (CoxL, CoxM, CoxS) are expressed at balanced levels.
How I measure it:
Extract total RNA from leaves using an RNA extraction kit.
Treat with DNase to remove genomic DNA.
Convert mRNA to cDNA using reverse transcriptase.
Run qPCR with gene-specific primers and SYBR Green.
Include reference genes for normalization.
Compare Ct values across the three structural subunits.
What I measure:Whether CoxL, CoxM, and CoxS are present, whether the chloroplast transit peptide was cleaved, and whether the three subunits assemble into the complex.
How I measure it:
Isolate intact chloroplasts using Percoll gradient centrifugation.
Lyse chloroplasts gently and perform Co-IP using anti-FLAG magnetic beads (FLAG is on CoxS).
Elute with FLAG peptide.
Split eluate: run on Tricine-SDS-PAGE (silver stain) to see individual subunits at 88 kDa (CoxL), 32 kDa (CoxM), and 18 kDa (CoxS) (Denatured conditions).
Run on Blue Native PAGE (Coomassie stain) to see the assembled complex at ~280 kDa (Undenatured conditions).
For maturation proteins: run anti-FLAG Western (detects CoxD) on total chloroplast extract.
Technologies:Ultracentrifuge, anti-FLAG magnetic beads, PAGE equipment, silver stain, Coomassie stain, Western blot transfer system, chemiluminescence imager.
What I measure:Whether the assembled CODH enzyme can oxidize CO to CO₂.
How I measure it:
Gas phase (whole plant): Place transformed plant in sealed transparent chamber, inject CO gas, record CO concentration in separate timelines using electrochemical CO sensor.
Methylene blue (purified enzyme): Purify CODH complex via anti-FLAG Co-IP, add to reaction with methylene blue and CO in anaerobic cuvette, measure absorbance at 600 nm at different timelines. Calculate specific activity (μmol CO/min/mg protein).
Technologies:Sealed gas chamber, electrochemical CO sensor, spectrophotometer, anaerobic cuvettes.
image ref
6. Confirming Cofactor Incorporation
What I measure:Whether the CODH complex contains molybdenum, copper, and iron-sulfur clusters.
How I measure it:
ICP-MS: Send purified CODH complex to core facility. Measure Mo, Cu, and Fe content. Calculate metal-to-protein stoichiometry.
UV-Vis spectroscopy: Measure absorbance spectrum of purified complex from 300-700 nm. Look for peak at 420 nm (Fe-S clusters).
What I measure:Whether electrons from CODH go to the photosynthetic electron transport chain or leak to oxygen.
How I measure it:
Compare CO oxidation rate in light vs. dark using the gas chamber setup.
Calculate light:dark ratio. Ratio >2 indicates electrons go to photosynthetic chain (requires light). Ratio ~1 indicates electrons go directly to oxygen (oxidative stress risk).
Technologies:Sealed gas chamber, electrochemical CO sensor, light source, dark cover.
8. Monitoring Plant Health
What I measure:Whether expressing CODH causes stress or benefits photosynthesis.
How I measure it:
Chlorophyll fluorescence (Fv/Fm): Dark-adapt leaf for 20 minutes, measure with PAM fluorometer. Healthy plant = 0.80-0.83.
CO₂ assimilation: Use infrared gas analyzer (IRGA) to measure net CO₂ uptake by leaf. Compare transformed vs. wild-type.
Biomass: Dry plants at 70°C for 48 hours, weigh shoot and root. Compare transformed vs. wild-type.
ROS detection: Stain leaf discs with NBT (detects superoxide, turns blue) and DAB (detects H₂O₂, turns brown). Photograph and quantify staining.
image ref
Histochemical detection of H2O2 by DAB staining (a), superoxide radical by NBT staining (b)
9. Monitoring Silencing Over Time
What I measure:Whether expression remains stable across generations (T0 → T1 → T2).
How I measure it:
Grow T0 plants (primary transformants), measure mRNA by RT-qPCR.
Self-pollinate T0 to obtain T1 seeds.
Grow T1 plants, repeat RT-qPCR.
Grow T2 plants, repeat RT-qPCR.
Calculate silencing index = Expression(T1)/Expression(T0). Index >0.8 = stable.
Technologies:RT-qPCR, plant growth facilities.
Homework: Waters Part I — Molecular Weight
Assignees for this section
MIT/Harvard students Required
Committed Listeners Required
We will analyze an eGFP standard on a Waters Xevo G3 QTof MS system to determine the molecular weight of intact eGFP and observe its charge state distribution in the native and denatured (unfolded) states. The conditions for LC-MS analysis of intact protein cause it to unfold and be detected in its denatured form (due to the solvents and pH used for analysis).
Based on the predicted amino acid sequence of eGFP (see below) and any known modifications, what is the calculated molecular weight? You can use an online calculator like the one at https://web.expasy.org/compute_pi/
eGFP Sequence:
MVSKGEELFTG VVPILVELDG DVNGHKFSVS GEGEGDATYG KLTLKFICTT GKLPVPWPTL VTTLTYGVQC FSRYPDHMKQ HDFFKSAMPE GYVQERTIFF KDDGNYKTRA EVKFEGDTLV NRIELKGIDF KEDGNILGHK LEYNYNSHNV YIMADKQKNG IKVNFKIRHN IEDGSVQLAD HYQQNTPIGD GPVLLPDNHY LSTQSALSKD PNEKRDHMVL LEFVTAAGIT LGMDELYKLE HHHHHH
Note: This contains a His-purification tag (HHHHHH) and a linker (the LE before it).
Calculate the molecular weight of the eGFP using the adjacent charge state approach described in the recitation. Select two charge states from the intact LC-MS data (Figure 1) and:
Determine z for each adjacent pair of peaks (n,n+1) using: n = (m/z(n+1)−1)/(m/z(n)−m/z(n+1))
Determine the MW of the protein using the relationship between m/zn, MW and z.
Calculate the accuracy of the measurement using the deconvoluted MW from 2.2 and the predicted weight of the protein from 2.1 using:
Accuracy = (|Calculated MW – Theoretical MW|) / (Theoretical MW) x 1,000,000
Can you observe the charge state for the zoomed-in peak in the mass spectrum for the intact eGFP? If yes, what is it? If no, why not?
Figure 1. Mass Spectrum of intact eGFP protein from the Waters Xevo G3 LC-MS (a mass spectrometer with 30,000 resolution) with individual charge state peaks labeled with m/z values.
Theoretical Molecular Weight Calculation
The theoretical molecular weight of eGFP was calculated using the online tool ExPASy Compute pI/Mw tool (Swiss Institute of Bioinformatics). The full amino acid sequence of eGFP, including the C-terminal His-tag (HHHHHH) and linker (LE), was entered into the calculator.
The computed molecular weight obtained from this tool was: 28006.60 Da
This value was used as the reference theoretical mass for comparison with the experimentally determined molecular weight obtained from LC-MS analysis.
Calculating the Experimental Molecular Weight (MW)
2.1. Identification of Adjacent Charge States
Step 1: Identifing Two Adjacent Peaks from Figure 01
let’s use the following values from this figure:
m/z(n) = 903.7148
m/z(n+1) = 875.4421
Step 2: Solve for the Charge State (n)
The relationship between the two peaks is:
n = (m/z(n+1)−1)/(m/z(n)−m/z(n+1))
Let’s plug in our example numbers:
n = 875.4421 – 1 / (903.7148 – 875.4421)
n = 874.4421/ (28.2727)
n = 30.93
Since the charge state must be a whole integer, we round this to the nearest whole number.
Therefore, n = 31. This means the peak at m/z 903.7148 is the +31 charge state.
From this value, we can extract the charge state for the second adjacent peak: n+1 = 32, which means the peak at m/z 875.4421 is the +32 charge state.
2.2. Calculating (MW)
Now that we know n, we can calculate M using the following formula, which accounts for the mass of the protons that are adding the charge:
m/z = MW of protein + mass of all added protons / total number of charges (n)
MW of protein = (m/z x total number of charges (n)) – (mass of all added protons)
Note: mass of all added protons is: the total number of charges (n) x the mass of a proton (approximately 1.0078 Da) (H)
Using the charge state of the first peak:
MW = (m/z(n) x zn) – (zn x H)
MW = (875.4421 x 32) - (32 x 1.0078)
MW = 28014.1472 – 32.2496
MW = 27981.8976 Da
Using the second peak, I found: MW = 27983.917 Da, so the average experimental molecular weight of this protein is ≈ 27982.9073 Da
By comparing the experimental result, we just calculated to the theoretical weight from Step 1, the resulted experimental molecular weight is approximate to the theoretical value calculated 28006.60 Da.
Accuracy = (|27982.9073 – 28006.60 |) / (28006.60) x 1,000,000
Accuracy = (9.56) / (28006.60) x 1,000,000
Accuracy = 845.96 ppm > 50 ppm
The measured accuracy (~846 ppm) is significantly higher than the acceptable threshold of 50 ppm.
This deviation is most likely due to instrumental factors, such as imperfect calibration of the mass spectrometer, which can lead to slight inaccuracies in measured m/z values. Since the theoretical mass was calculated directly from the provided amino acid sequence, it is unlikely that the discrepancy arises from errors in the protein sequence or its expression.
Charge State Determination (Zoomed Peak)
No, we cannot.
The inability to determine the charge state from the zoomed-in peak is mainly due to the relationship between isotope spacing and instrument resolution. Proteins are made of atoms that exist in different isotopic forms, such as 12C and 13C, which create small differences in mass. In their neutral state, these isotopes are separated by about 1 Da. However, in mass spectrometry, we measure the mass-to-charge ratio (m/z), so the space between isotopic peaks becomes (1/z), where (z) is the charge. This means that as the charge increases, the spacing between peaks becomes smaller.
For large proteins like eGFP (approximately 28 kDa), the charge state is relatively high. As a result, the spacing between isotopic peaks becomes extremely small. For example, if the charge is around (z ≈ 19), the spacing between peaks is only about 0.05 (m/z). These very small differences are difficult for the instrument to detect.
The limitation comes from the resolution of the mass spectrometer. Resolution refers to the ability of the instrument to distinguish between two very close peaks. In this case, the required spacing (around 0.05 (m/z)) is smaller than what the instrument can clearly resolve. Instead of observing distinct isotopic peaks, the signals merge together and appear as a single broad and jagged peak.
Because the individual isotope peaks are not visible, it is not possible to measure their spacing and determine the charge state directly. Therefore, an alternative approach, such as the adjacent charge state method, must be used to calculate the charge and molecular weight.
Homework: Waters Part II — Secondary/Tertiary structure
Assignees for this section
MIT/Harvard students Required
Committed Listeners Required
We will analyze eGFP in its native, folded state and compare it to its denatured, unfolded state on a quadrupole time-of-flight MS. We will be doing MS-only analysis (no liquid chromatography, also known as “direct infusion” experiments) on the Waters Xevo G3-QToF MS.
Based on learnings in the lab, please explain the difference between native and denatured protein conformations. For example, what happens when a protein unfolds? How is that determined with a mass spectrometer? What changes do you see in the mass spectrum between the native and denatured protein analyses (Figure 2)?
Figure 2. Comparison of the mass spectra between denatured (top) and native (bottom) eGFP standard on the Waters Xevo G3 QTof MS.
Zooming into the native mass spectrum of eGFP from the Waters Xevo G3 QTof MS (see Figure 3), can you discern the charge state of the peak at ~2800 ? What is the charge state? How can you tell?
Figure 3. Native eGFP mass spectrum from the Waters Xevo G3 Q-Tof MS. The inset is a zoomed-in view of the charge state at ~2800 m/z on a mass spectrometer with 30,000 resolution.
the difference between native and denatured protein conformations
What happens when a protein unfolds?
In its native state, a protein such as eGFP is folded into a compact three-dimensional structure (often described as a beta-barrel). In this conformation, many basic amino acid residues (such as lysine and arginine) are buried inside the protein and are not easily accessible. When the protein becomes denatured, typically due to acidic or organic solvents, it loses this structure and unfolds into a more extended chain. This unfolding exposes a larger surface area and reveals previously hidden basic sites.
How is this determined with a Mass Spectrometer?
Mass spectrometry detects the charge-to-mass ratio (m/z). Because an unfolded protein has more surface area and more exposed basic sites, it can pick up a much higher number of protons (H+) during Electrospray Ionization (ESI).
So, in simple way:
Denatured (unfolded) protein: Extended, flexible structure → More exposed basic sites → Binds more protons → high charge state (high z)
Changes Observed in the Mass Spectrum (Figure 2)
These differences in charge directly affect the mass-to-charge ratio (m/z): Since m/z= m x 1/z, a higher charge (z) results in a lower m/z
Denatured (in Green): The peaks are shifted to the left (lower m/z). This is because the charge (z) is high. Since z is the denominator in m/z, a higher charge results in a lower m/z value. The distribution is also very broad, indicating many different charge states are possible for a flexible, unfolded chain.
Native (in Red): The peaks are shifted to the right (higher m/z). A folded protein is “shielded,” so it can only pick up a few protons. Fewer protons mean a lower z, which results in a much higher m/z value.
When analyzing Figure 3 of the native mass spectrum of eGFP, I initially noticed a possible confusion in the question. The prompt refers to a zoomed-in region around m/z ~2800, however, the zoomed image shown in the figure is actually centered on the peak at m/z ~2545, not 2800.
Because of this mismatch, I decided to carefully analyze the figure in two complementary ways to ensure a complete and correct interpretation.
Case 1: Analysis of the zoomed-in region (m/z ~2545)
Although the question mentions ~2800, the zoomed panel clearly shows the peak at m/z ≈ 2545.
In this zoomed region, individual isotopic peaks are visible. This is important because isotopic resolution allows us to determine the charge state using peak spacing.
→ Method used: isotopic spacing
In mass spectrometry, isotopic peaks of a given charge state are separated by: Δ(m/z) = 1/z
From the zoomed spectrum, the spacing between adjacent isotopic peaks: Looking at the labeled values around ~2544–2545:
2544.8552 → 2544.7637 ≈ 0.0915 m/z
2544.7637 → 2544.6719 ≈ 0.0918 m/z
Average spacing ≈ 0.092 m/z
Calculation: z = 1/ 0.092 ≈ 10.86
Considering the measured values shown in the figure (around 2545.03–2545.22), the spacing is most consistent with: +11
Case 2: Interpretation of the peak at m/z ~2800 (main spectrum)
In the full (non-zoomed) spectrum, there is also a broader peak around m/z ~2800, but:
It is not zoomed in and the isotopic pattern is not resolved, Therefore, charge state cannot be directly read from spacing in this region
What I did to solve this
Since isotopic resolution is not available at ~2800, I used the adjacent peak relationship between charge states in native mass spectrometry:
Neighboring charge states follow predictable shifts in m/z
Using the relationship between the 2545 peak and the 2799 peak:
n = (m/z(n+1)−1)/(m/z(n)−m/z(n+1))
n = 2545 – 1 / (2799 – 2545)
n = 2544 / (254)
n = 10.01
This indicates that the peak at ~2800 corresponds to the next charge state after +10.
Homework: Waters Part III — Peptide Mapping - primary structure
Assignees for this section
MIT/Harvard students Required
Committed Listeners Required
We will digest the eGFP protein standard into peptides using trypsin (an enzyme that selectively cleaves the peptide bond after Lysine (K) and Arginine (R) residues. The resulting peptides will be analyzed on the Waters BioAccord LC-MS to measure their molecular weights and fragmented to confirm the amino acid sequence within each peptide – generating a “peptide map”. This process is used to confirm the primary structure of the protein.
There are a variety of tools available online to calculate protein molecular weight and predict a list of peptides generated from a tryptic digest. We will be using tools within the online resource Expasy (the bioinformatics resource portal of the Swiss Institute of Bioinformatics (SIB)) to predict a list of tryptic peptides from eGFP.
How many Lysines (K) and Arginines (R) are in eGFP? Please circle or highlight them in the eGFP sequence given in Waters Part I question 1 above. (Note: adding the sequence to Benchling as an amino acid file and clicking biochemical properties tab will show you a count for each amino acid).
How many peptides will be generated from tryptic digestion of eGFP?
Copy/paste the sequence above into the input box in the PeptideMass tool to generate expected list of peptides.
Use Figure 4 below as a guide for the relevant parameters to predict peptides from eGFP.
Click “Perform the Cleavage” button in the PeptideMass tool and report the number of peptides generated when using trypsin to perform the digest.
Figure 4. Example conditions for predicting the number of tryptic peptides from the eGFP standard. Please replicate all parameters shown above.
Based on the LC-MS data for the Peptide Map data generated in lab (please use Figure 5a as a reference) how many chromatographic peaks do you see in the eGFP peptide map between 0.5 and 6 minutes? You may count all peaks that are >10% relative abundance.
Figure 5a. Total ion chromatogram (TIC) of the eGFP peptide map. The peak at 2.78 minutes is circled, and its MS data is shown in the mass spectrum in Figure 5b, below.
Assuming all the peaks are peptides, does the number of peaks match the number of peptides predicted from question 2 above? Are there more peaks in the chromatogram or fewer?
Identify the mass-to-charge (m/z) of the peptide shown in Figure 5b. What is the charge (z) of the most abundant charge state of the peptide (use the separation of the isotopes to determine the charge state). Calculate the mass of the singly charged form of the peptide (M+H+) based on its m/z and z.
Figure 5b. Mass spectrum figure to show m/zfor the chromatographic peak at 2.78 min from Figure 5a above. The inset is a zoom-in of the peak at 525.76, to discern the isotope peaks.
Figure 5c. Fragmentation spectrum of the peptide eluting at retention time 2.78 minutes in Figure 5a (above).
Identify the peptide based on comparison to expected masses in the PeptideMass tool. What is mass accuracy of measurement? Please calculate the error in ppm. (Recall that Accuracy = (|Calculated MW – Theoretical MW|) / (Theoretical MW) x 1,000,000 )
What is the percentage of the sequence that is confirmed by peptide mapping? (see Figure 6)
Figure 6. Amino Acid Coverage Map of eGFP based on BioAccord LC-MS peptide identification data.
Bonus Peptide Map Questions
Can you determine the peptide sequence for the peptide fragmentation spectrum shown in Figure 5c? (HINT: Use your results from Question 2 above to match the peptide molecular weight that is closest to that shown in Figure 5b. Copy and paste its sequence into this tool online to predict the fragmentation pattern based on its amino acid sequence: http://db.systemsbiology.net/proteomicsToolkit/FragIonServlet.html. What is the sequence of the eGFP peptide that best matches the fragmentation spectrum in Figure 5c?
Does the peptide map data make sense, i.e. do the results indicate the protein is the eGFP standard? Why or why not? Consult with Figure 6, which depicts the % amino acid coverage of peptides positively identified using their calculated mass and fragmentation pattern.
Identification of Cleavage Sites (K and R residues)
To predict the tryptic digestion pattern of eGFP, I first analyzed the amino acid sequence and counted the number of lysine (K) and arginine (R) residues, since trypsin cleaves specifically after these amino acids.
From the sequence analysis:
Number of Lysine (K): 20
Number of Arginine (R): 6
Prediction of Tryptic Peptides
To determine the number of peptides generated after digestion, I used the ExPASy PeptideMass tool by inputting the full eGFP sequence and applying trypsin cleavage conditions.
The tool predicted a total of: 19 peptides
The theoretical molecular weight of eGFP used for reference was: Mw (average mass): 28006.60 Da
Chromatographic Peak Analysis
From the total ion chromatogram (TIC) shown in Figure 5a, I counted the number of peaks between 0.5 and 6 minutes, considering only peaks with a relative intensity greater than 10%. The number of observed peaks was: 18
Comparison Between Predicted Peptides and Observed Peaks
The theoretical digestion predicted 19 peptides, while the chromatogram shows 18 peaks.
There is slight difference between the theoretical digestion and the chromatogram, but overall, the numbers are very close, indicating good agreement between theoretical prediction and experimental data.
Peptide Mass and Charge Determination
From Figure 5b, the most abundant peak was observed at: m/z = 525.76
By analyzing the isotope spacing:
526.25918 – 525.76712 = 0.49
526.76845 - 526.25918 = 0.50
Δm/z ≈ 0.5 → z = 1/ Δm/z = 1/ 0.5 = 2
Thus, the peptide is doubly charged (z=2).
The molecular weight was calculated using:
MW = (m/z x z) – (z x H)
MW = (525.76 x 2) – (2 x 1.0078)
MW = 1049.5044 ≈ 1050
Peptide Identification
Using the predicted peptide list from the ExPASy tool, I compared the calculated experimental mass (1049.5044 Da) with theoretical peptide masses.
The closest match was:
Peptide sequence: FEGDTLVNR with Theoretical mass: 1050.5214 Da
This confirms that the detected peptide corresponds to this sequence.
Accuracy = (|1049.5044 – 1050.5214|) / (1050.5214) x 1,000,000
Accuracy = (1.017) / (1050.5214) * 1,000,000
Accuracy = 968.09 ppm > 10
Sequence Coverage (Figure 6)
From the coverage map shown in Figure 6, approximately: 88% of the eGFP sequence was identified
This high coverage indicates that most of the protein sequence was successfully confirmed through peptide mapping.
Bonus part:
Peptide Sequence Confirmation Using Fragmentation
To confirm the identity of the peptide, I used the mass obtained from the LC-MS analysis and matched it with the predicted tryptic peptides. The peptide with the closest theoretical mass was identified as FEGDTLVNR, with a theoretical mass of 1050.52149 Da.
To validate this identification, I used a fragmentation prediction tool to generate the expected b- and y-ion fragments of this peptide.
the resulted fragments are as following: I then compared these predicted fragments with the experimental MS/MS spectrum shown in Figure 5c. Several peaks in the spectrum matched the predicted fragments, especially the y-ions, like :1050.52149; 903.45308; 774.41049; 602.36208, which confirms that the sequence FEGDTLVNR is correct.
The experimental mass of the peptide was 1050.52438 Da, which is very close to the theoretical value. I calculated the mass accuracy using the ppm formula and obtained: accuracy ≈2.75 ppm This very low error (well below 10 ppm) indicates high measurement accuracy and strong agreement between experimental and theoretical data.
Sequence Coverage and Protein Confirmation
To evaluate whether the results confirm the identity of the protein, I analyzed the sequence coverage shown in Figure 6. The coverage percentage was approximately 88%, indicating that a large portion of the eGFP sequence was successfully identified.
Additionally, the identified peptide FEGDTLVNR (positions 115–123) is located within the covered regions of the sequence, confirming that this peptide contributes to the overall sequence identification.
This high sequence coverage, along with the accurate peptide identification and fragmentation matching, confirms that the analyzed protein is indeed eGFP. Although some regions are not covered (likely due to peptides that are too small or poorly ionized), the overall results provide strong confidence in the protein identification.
Homework: Waters Part IV — Oligomers
Assignees for this section
MIT/Harvard students Required
Committed Listeners Required
We will determine Keyhole Limpet Hemocyanin (KLH)’s oligomeric states using charge detection mass spectrometry (CDMS). CDMS single-particle measurements of KLH allow us to make direct mass measurements to determine what oligomeric states (that is, how many protein subunits combine) are present in solution. Using the known masses of the polypeptide subunits (Table 1) for KLH, identify where the following oligomeric species are on the spectrum shown below from the CDMS (Figure 7):
7FU Decamer
8FU Didecamer
8FU 3-Decamer
8FU 4-Decamer
Polypeptide Subunit Name | Subunit Mass |
7FU | 340 kDa
8FU | 400 kDa
Table 1: KLH Subunit Masses
Figure 7. Mass spectrum of Keyhole Limpet Hemocyanin (KLH) acquired on the CDMS.
Oligomer Identification Using CDMS
To determine the oligomeric states of Keyhole Limpet Hemocyanin (KLH), I used the subunit masses provided in Table 1 and calculated the expected total mass for each oligomeric form.
The given subunit masses are:
7FU = 340 kDa
8FU = 400 kDa
Mass Calculations
For each oligomer, the total mass was calculated by multiplying the subunit mass by the number of subunits:
Note: While assigning the oligomeric peaks in the CDMS spectrum (Figure 7), I noticed that for the first three oligomers there are clear red peaks, but for the fourth one (~16 MDa), there is only a small blue signal without a corresponding red peak. This made me question why there are two different colors in the spectrum and why the fourth oligomer does not have a red peak.
After looking into this, I understood that the two colors represent different types of data:
The blue line corresponds to the raw signal detected by the instrument. It includes all detected ions and therefore appears noisy and irregular.
The red peaks correspond to a fitted model (Gaussian fit) generated by the software. This fit is applied to the raw data to determine the most accurate position (center) of each mass peak.
This means that the red peaks represent the most reliable mass values, while the blue signal shows all detected data, including weaker or less clear signals.
Using this understanding, I assigned the oligomers as follows:
The peak at 3.4 MDa (red) corresponds to the 7FU decamer
The peak at 8.33 MDa (red) corresponds to the 8FU didecamer
The peak at 12.67 MDa (red) corresponds to the 8FU 3-decamer
For the fourth oligomer (~16.0 MDa), I observed only a small blue “hump” in the region between 16–17 MDa, without any red fitted peak.
This can be explained by the fact that:
The signal for this oligomer is much weaker compared to the others
There may be fewer particles detected at this mass
The signal may be too noisy or not well-defined
Because of this, the software was not able to confidently fit a Gaussian curve, and therefore no red peak was generated.
Despite this, the presence of the blue signal at the expected mass range (~16 MDa) still indicates the existence of the 8FU 4-decamer, even if it is less abundant or less stable.
Homework: Waters Part V — Did I make GFP?
Assignees for this section
MIT/Harvard students Required
Committed Listeners Required
Please fill out this table with the data you acquired from the lab work done at the Waters Immerse Lab in Cambridge, or else the data screenshots in this document if you were unable to have lab work done at Waters.
Parameter
Theoretical
Observed / Measured (Intact LC-MS)
PPM Mass Error
Molecular weight (kDa)
Parameter
Theoretical
Observed / Measured (Intact LC-MS)
PPM Mass Error
Molecular weight (kDa)
28.0066
27.9829
846
For this homework, I used AI tools such as ChatGPT and DeepSeek to help structure my ideas and improve the clarity of my writing. I also used NotebookLM to better understand the provided resources and supporting materials. For the final project measurements, DeepSeek suggested including the last four key measurements, which I integrated into my analysis.
Herminghaus, S., Schreier, P. H., McCarthy, J. E. G., Landsmann, J., Botterman, J., & Berlin, J. (1991). Expression of a bacterial lysine decarboxylase gene and transport of the protein into chloroplasts of transgenic tobacco. Plant Molecular Biology. https://agris.fao.org/search/en/records/65de1eb24c5aef494fd9fee5
Kim, Y. M., & Hegeman, G. D. (1981a). Purification and some properties of carbon monoxide dehydrogenase from Pseudomonas carboxydohydrogena. Journal of Bacteriology, 148(3), 904–911. https://doi.org/10.1128/jb.148.3.904-911.1981
Kim, Y. M., & Hegeman, G. D. (1981b). Purification and some properties of carbon monoxide dehydrogenase from Pseudomonas carboxydohydrogena. Journal of Bacteriology, 148(3), 904–911. https://doi.org/10.1128/jb.148.3.904-911.1981
Matzke, M. A., & Matzke, A. J. (1998). Epigenetic silencing of plant transgenes as a consequence of diverse cellular defence responses. Cellular and Molecular Life Sciences: CMLS, 54(1), 94–103. https://doi.org/10.1007/s000180050128
Maxwell, K., & Johnson, G. N. (2000). Chlorophyll fluorescence—A practical guide. Journal of Experimental Botany, 51(345), 659–668. https://doi.org/10.1093/jxb/51.345.659
Pahlow, S., Ostendorp, A., Krü, L., ß, el, & Kehr, J. (2018). Phloem Sap Sampling from Brassica napus for 3D-PAGE of Protein and Ribonucleoprotein Complexes. JoVE (Journal of Visualized Experiments), (131), e57097. https://doi.org/10.3791/57097
Recent Advances and Emerging Trends in Chlorophyll Fluorescence Parameter Fv/Fm. (2025). Phyton-International Journal of Experimental Botany, 94(9), 2615–2630. https://doi.org/10.32604/phyton.2025.069246
Remelli, W., Villafiorita, F., Casazza, A. P., & Santabarbara, S. (2018). Comparative excitation-emission dependence of the FV/FM ratio in model green algae and cyanobacterial strains. https://iris.cnr.it/handle/20.500.14243/365902
Schägger, H., & von Jagow, G. (1991). Blue native electrophoresis for isolation of membrane protein complexes in enzymatically active form. Analytical Biochemistry, 199(2), 223–231. https://doi.org/10.1016/0003-2697(91)90094-a
Smith, P. K., Krohn, R. I., Hermanson, G. T., Mallia, A. K., Gartner, F. H., Provenzano, M. D., Fujimoto, E. K., Goeke, N. M., Olson, B. J., & Klenk, D. C. (1985). Measurement of protein using bicinchoninic acid. Analytical Biochemistry, 150(1), 76–85. https://doi.org/10.1016/0003-2697(85)90442-7
Woo, J.-K., Hong, C. B., & Lee, J.-S. (1991). Chloroplast Targeting of Bacterial β-Glucuronidase with a Pea Transit Peptide in Transgenic Tobacco Plants. Molecules and Cells, 1(4), 451–457. https://doi.org/10.1016/S1016-8478(23)13893-3
Week 11 HW: Bioproduction & Cloud Labs
Part A: The 1,536 Pixel Artwork Canvas | Collective Artwork
Assignees for this section
MIT/Harvard students Required
Committed Listeners Required
Contribute at least one pixel to this global artwork experiment before the editing ends on Sunday 4/19 at 11:59 PM EST.
A personalized URL was sent to the email address associated with your Discourse account, and you can discuss the artwork on the Discourse.
If you did not have a chance to contribute, it’s okay, just make sure you become a TA this fall! 😉
Make a note on your HTGAA webpages including:
what you contributed to the community bioart project (e.g., “I made part of the DNA on the bottom right plate”)
what you liked about the project, and
what about this collaborative art experiment could be made better for next year.
Contribution to the Collective Bioart Project
I contributed to several designs during the experiment. My final contribution was trying to create a geometric pattern inspired by Islamic geometric art in the bottom-right corner of the pixel canvas. The design did not stay until the end because other participants kept modifying it, but it was interesting to see how the artwork kept changing with everyone’s input.
What I Liked About the Project
I really liked the collaborative aspect of this project. It was fun to work with others at the same time, contribute to different designs, and watch them change in real time. The canvas was dynamic and creative, and it encouraged experimentation and shared participation.
Suggestions for Improvement
One improvement could be to limit each participant to only one or two pixels. This would encourage more collaboration, because people would need to work together to create designs instead of working alone on bigger parts. It could make the final artwork more coordinated and truly collaborative.
Part B: Cell-Free Protein Synthesis | Cell-Free Reagents
Assignees for this section
MIT/Harvard students Required
Committed Listeners Required
Referencing the cell-free protein synthesis reaction composition (the middle box outlined in yellow on the image above, also listed below), provide a 1-2 sentence description of what each component’s role is in the cell-free reaction.
E. coli Lysate
BL21 (DE3) Star Lysate (includes T7 RNA Polymerase)
Salts/Buffer
Potassium Glutamate
HEPES-KOH pH 7.5
Magnesium Glutamate
Potassium phosphate monobasic
Potassium phosphate dibasic
Energy / Nucleotide System
Ribose
Glucose
AMP
CMP
GMP
UMP
Guanine
Translation Mix (Amino Acids)
17 Amino Acid Mix
Tyrosine
Cysteine
Additives
Nicotinamide
Backfill
Nuclease Free Water
Describe the main differences between the 1-hour optimized PEP-NTP master mix and the 20-hour NMP-Ribose-Glucose master mix shown in the Google Slide above. (2-3 sentences)
Bonus question: How can transcription occur if GMP is not included but Guanine is?
BL21 (DE3) Star Lysate:
Provides the core cellular machinery required for gene expression, including ribosomes, tRNAs, aminoacyl-tRNA synthetases, and metabolic enzymes. The BL21 (DE3) strain also supplies T7 RNA polymerase, enabling strong transcription from T7 promoters.
Salts / Buffer
Potassium Glutamate:
Maintains proper ionic strength and mimics the natural intracellular environment, helping stabilize proteins and support enzyme activity.
HEPES-KOH (pH 7.5):
Acts as a buffering agent to keep the pH stable, which is essential for maintaining enzyme function during long incubations.
Magnesium Glutamate:
Provides Mg²⁺ ions, which are essential cofactors for ribosome stability, RNA polymerase activity, and interactions with nucleic acids.
Potassium Phosphate (monobasic/dibasic):
Serves as a secondary buffer and provides inorganic phosphate needed for ATP regeneration and nucleotide metabolism.
Energy / Nucleotide System
Ribose:
Feeds into the pentose phosphate pathway to generate precursors (like PRPP) required for nucleotide synthesis.
Glucose:
Acts as the main energy source, supporting ATP production through metabolic pathways such as glycolysis.
AMP, CMP, UMP:
These nucleoside monophosphates (NMPs) are low-cost precursors that are enzymatically converted into NTPs (ATP, CTP, UTP) for RNA synthesis.
Guanine:
Supplied as a nucleobase that is converted into GMP through salvage pathways, then further phosphorylated into GTP for transcription.
Translation Mix (Amino Acids)
17 Amino Acid Mix + Tyrosine + Cysteine:
Provide all amino acids required for protein synthesis. Tyrosine and cysteine are added separately because they are less stable or less soluble in standard mixtures.
Additives / Backfill
Nicotinamide:
Acts as a precursor for NAD⁺, an important cofactor in metabolic reactions that support long-term energy regeneration.
Nuclease-Free Water:
Serves as the solvent to adjust final concentrations while preventing degradation of DNA or RNA by nucleases.
2. Differences Between 1-Hour PEP-NTP and 20-Hour NMP–Ribose–Glucose Systems
The 1-hour PEP-NTP system is designed for rapid protein production by providing ready-to-use NTPs and a high-energy phosphate donor (PEP), allowing fast transcription and translation but for a short duration due to quick depletion of resources.
In contrast, the 20-hour NMP–Ribose–Glucose system uses cheaper precursors (NMPs, ribose, glucose) and relies on the lysate’s metabolic pathways to gradually regenerate NTPs and energy, enabling longer and more sustained protein production.
3. Bonus Question
Transcription can still occur without GMP because the system includes guanine, which is converted into GMP through the salvage pathway. In this process, guanine is combined with PRPP (derived from ribose metabolism) to form GMP, which is then phosphorylated into GDP and GTP. The produced GTP is then used by T7 RNA polymerase for RNA synthesis.
Part C: Planning the Global Experiment | Cell-Free Master Mix Design
Assignees for this section
MIT/Harvard students Required
Committed Listeners Required
Given the 6 fluorescent proteins we used for our collaborative painting, identify and explain at least one biophysical or functional property of each protein that affects expression or readout in cell-free systems. (Hint: options include maturation time, acid sensitivity, folding, oxygen dependence, etc) (1-2 sentences each)
Create a hypothesis for how adjusting one or more reagents in the cell-free mastermix could improve a specific biophysical or functional property you identified above, in order to maximize fluorescence over a 36-hour incubation. Clearly state the protein, the reagent(s), and the expected effect.
The second phase of this lab will be to define the precise reagent concentrations for your cell-free experiment. You will be assigned artwork wells with specific fluorescent proteins and receive an email with instructions this week (by April 24). You can begin composing master mix compositions here.
The final phase of this lab will be analyzing the fluorescence data we collect to determine whether we can draw any conclusions about favorable reagent compositions for our fluorescent proteins. This will be due a week after the data is returned (date TBD!). The reaction composition for each well will be as follows:
6 μL of Lysate
10 μL of 2X Optimized Master Mix from above
2 μL of assigned fluorescent protein DNA template
2 μL of your custom reagent supplements
Total: 20 μL reaction
1. Fluorescent Protein Properties Affecting Cell-Free Expression
The biophysical properties of fluorescent proteins (FPs), including folding efficiency, maturation time, pH sensitivity, oxygen dependence, and structural stability, play a critical role in determining their fluorescence output in cell-free systems, especially during extended incubations such as 36 hours.
This protein exhibits very fast folding and high structural stability, with efficient chromophore maturation that is oxygen-dependent. Its resistance to misfolding and aggregation allows it to maintain strong and consistent fluorescence over long incubation periods, making it a reliable reference protein in cell-free systems.
It is characterized by slow maturation kinetics and incomplete chromophore formation, which delays the appearance of fluorescence. Additionally, it may form non-fluorescent intermediates, leading to lower overall signal intensity compared to more advanced red fluorescent proteins.
This protein shows relatively fast maturation and high brightness, but its chromophore formation is strongly dependent on oxygen availability and can also be influenced by temperature. In conditions with limited oxygen or suboptimal temperature, its fluorescence intensity may be reduced.
mTurquoise2
It has a complex maturation mechanism and high quantum yield but is sensitive to environmental conditions such as pH and oxygen levels. Acidic conditions can reduce fluorescence, while insufficient oxygen may limit proper chromophore formation.
This protein is known for its very high brightness due to an excellent extinction coefficient and quantum yield. However, its performance depends on proper folding, and it can be sensitive to temperature or conditions that promote misfolding, which may reduce fluorescence output.
Electra2 is engineered for rapid maturation and improved performance under reducing conditions commonly found in cell-free systems. Its stability in such environments allows it to maintain fluorescence where other proteins may struggle, although its long-term stability or photostability may vary depending on conditions.
2. Hypothesis (Electra2 Optimization)
For Electra2, fluorescence output over a 36-hour incubation may be limited by the availability of nucleotides and the sustainability of transcription in the cell-free system. I hypothesize that increasing the concentrations of ribose and nucleoside monophosphates (AMP, CMP, UMP, and guanine) will enhance the regeneration of nucleoside triphosphates (NTPs) through the lysate’s metabolic pathways.
Ribose can be converted into phosphoribosyl pyrophosphate (PRPP), which is required for nucleotide synthesis, while NMPs and guanine serve as precursors that are enzymatically converted into NTPs. By increasing these components, the system should maintain a continuous supply of NTPs, thereby sustaining transcription by T7 RNA polymerase and increasing mRNA production over time.
As a result, this enhanced transcriptional activity is expected to support prolonged translation and lead to higher cumulative protein production and fluorescence intensity over the 36-hour period. This strategy is particularly suitable for Electra2, which is designed for rapid maturation and can efficiently convert increased protein synthesis into measurable fluorescence.
To test this hypothesis, I designed three distinct reagent compositions to identify the “sweet spot” between fuel availability and metabolic stability.
Mix 1: The “Maximized” Fuel Mix (Well Q4-H20)
Goal: To test the absolute capacity of the system by pushing precursors to the high end.
Key Adjustments: Ribose was increased to 19.0 g/L (+63.4 %) and NMPs (AMP/CMP/UMP) were increased by 60-100 %. Guanine was doubled to 0.313 mM to provide a surplus of base molecules for the salvage pathway.
Mix 2: The “Intermediate” Mix (Well Q4-G21)
Goal: To establish a bridge between the standard mix and the maximum boost.
Key Adjustments: Ribose was set at 15.0 g/L (+29%) and NMPs/Guanine were increased by 20-33 %. This well helps determine if the “Max” mix is overkill or if a moderate increase is sufficient.
Mix 3: The “Direct Supply” Mix (Well Q4-I21)
Goal: To test if bypassing the enzymatic salvage of Guanine improves initial speed.
Key Adjustments: While maintaining the Intermediate fuel levels, I added 0.500 mM of pure GMP. This tests whether providing a direct nucleotide (GMP) is more efficient for Electra2 than relying solely on Guanine-to-GMP conversion.
Final Concentration Comparison Table
Component
Mix 1 (Max Fuel)
Mix 2 (Intermediate)
Mix 3 (Direct Boost)
Cell Lysate
1X (6.00 µL)
1X (6.00 µL)
1X (6.00 µL)
DNA Template
50 nM (2.00 µL)
50 nM (2.00 µL)
50 nM (2.00 µL)
Ribose
19.000 g/L
15.000 g/L
15.000 g/L
AMP
1.000 mM
0.750 mM
0.750 mM
CMP
0.750 mM
0.500 mM
0.500 mM
UMP
0.750 mM
0.500 mM
0.500 mM
GMP
0.000 mM
0.000 mM
0.500 mM
Guanine
0.313 mM
0.188 mM
0.156 mM
Potassium Glutamate
312.563 mM
312.563 mM
312.563 mM
Magnesium Glutamate
6.975 mM
6.975 mM
6.975 mM
HEPES-KOH (pH 7.5)
45.000 mM
45.000 mM
45.000 mM
17 Amino Acid Mix
4.063 mM
4.063 mM
4.063 mM
Glucose
1.250 g/L
1.250 g/L
1.250 g/L
Nicotinamide
3.125 mM
3.125 mM
3.125 mM
Backfill (NF Water)
0.175 µL
1.225 µL
1.150 µL
4. Data Analysis Strategy
Once the 36-hour fluorescence data is returned, I will compare the slopes and peak intensities of these three wells.
Validation: If Mix 1 > Mix 2 > Standard, the limiting factor was raw fuel.
Metabolic Insights: If Mix 3 reaches a plateau faster than Mix 2, it proves the enzymatic conversion of Guanine was a kinetic bottleneck for Electra2 production.
Part D: Build-A-Cloud-Lab | (optional) Bonus Assignment
Assignees for this section
MIT/Harvard students optional
Committed Listeners optional
Use this simulation tool to create an interesting looking cloud lab out of the Ginkgo Reconfigurable Automation Carts. This is just a minimal implementation so far, but I would love to see some fun designs!
Sources:
Banks, A. M., Whitfield, C. J., Brown, S. R., Fulton, D. A., Goodchild, S. A., Grant, C., Love, J., Lendrem, D. W., Fieldsend, J. E., & Howard, T. P. (2022). Key reaction components affect the kinetics and performance robustness of cell-free protein synthesis reactions. Computational and Structural Biotechnology Journal, 20, 218–229. https://doi.org/10.1016/j.csbj.2021.12.013
Burrington, L. R., Watts, K. R., & Oza, J. P. (2021). Characterizing and Improving Reaction Times for E. coli-Based Cell-Free Protein Synthesis. ACS Synthetic Biology, 10(8), 1821–1829. https://doi.org/10.1021/acssynbio.1c00195
Deng, H., Callender, R., Schramm, V. L., & Grubmeyer, C. (2010). Pyrophosphate Activation in Hypoxanthine-Guanine Phosphoribosyltransferase with Transition State Analogue. Biochemistry, 49(12), 2705–2714. https://doi.org/10.1021/bi100012u
Dopp, B. J. L., Tamiev, D. D., & Reuel, N. F. (2019). Cell-free supplement mixtures: Elucidating the history and biochemical utility of additives used to support in vitro protein synthesis in E. coli extract. Biotechnology Advances, 37(1), 246–258. https://doi.org/10.1016/j.biotechadv.2018.12.006
Dudzinska, W., Lubkowska, A., Dolegowska, B., Safranow, K., & Jakubowska, K. (2010). Adenine, guanine and pyridine nucleotides in blood during physical exercise and restitution in healthy subjects. European Journal of Applied Physiology, 110(6), 1155–1162. https://doi.org/10.1007/s00421-010-1611-7
Gregorio, N. E., Levine, M. Z., & Oza, J. P. (2019). A User’s Guide to Cell-Free Protein Synthesis. Methods and Protocols, 2(1), 24. https://doi.org/10.3390/mps2010024
Hashimura, H., Nakagawa, H., & Sawai, S. (2025). Use of blue fluorescent protein Electra2 for live-cell imaging in Dictyostelium discoideum. microPublication Biology. https://doi.org/10.17912/micropub.biology.001774
Hove-Jensen, B., Andersen, K. R., Kilstrup, M., Martinussen, J., Switzer, R. L., & Willemoës, M. (2016). Phosphoribosyl Diphosphate (PRPP): Biosynthesis, Enzymology, Utilization, and Metabolic Significance. Microbiology and Molecular Biology Reviews : MMBR, 81(1), e00040-16. https://doi.org/10.1128/MMBR.00040-16
Jiang, L., Zhao, J., Lian, J., & Xu, Z. (2018). Cell-free protein synthesis enabled rapid prototyping for metabolic engineering and synthetic biology. Synthetic and Systems Biotechnology, 3(2), 90–96. https://doi.org/10.1016/j.synbio.2018.02.003
Jiang, N., Ding, X., & Lu, Y. (2021). Development of a robust Escherichia coli-based cell-free protein synthesis application platform. Biochemical Engineering Journal, 165, 107830. https://doi.org/10.1016/j.bej.2020.107830
Krinsky, N., Kaduri, M., Shainsky-Roitman, J., Goldfeder, M., Ivanir, E., Benhar, I., Shoham, Y., & Schroeder, A. (2016). A Simple and Rapid Method for Preparing a Cell-Free Bacterial Lysate for Protein Synthesis. PLOS ONE, 11(10), e0165137. https://doi.org/10.1371/journal.pone.0165137
Vengut-Climent, E., Peñalver, P., Lucas, R., Gómez-Pinto, I., Aviñó, A., Muro-Pastor, A. M., Galbis, E., de Paz, M. V., Fonseca Guerra, C., Bickelhaupt, F. M., Eritja, R., González, C., & Morales, J. C. (2018). Glucose-nucleobase pairs within DNA: Impact of hydrophobicity, alternative linking unit and DNA polymerase nucleotide insertion studies †Electronic supplementary information (ESI) available. See DOI: 10.1039/c7sc04850e. Chemical Science, 9(14), 3544–3554. https://doi.org/10.1039/c7sc04850e
Zhang, Y., Huang, Q., Deng, Z., Xu, Y., & Liu, T. (2018). Enhancing the efficiency of cell-free protein synthesis system by systematic titration of transcription and translation components. Biochemical Engineering Journal, 138, 47–53. https://doi.org/10.1016/j.bej.2018.07.001
This document presents the complete final project report, including the design strategy, construct engineering workflow, structural analyses, and in silico validation steps.
For a more interactive and visually detailed presentation including animated rotating views of the predicted protein structures, enhanced figures, additional simulations, and direct access to all Benchling design files and cloning maps, please refer to the project documentation webpages associated with this final project.
These resources provide a more comprehensive visualization of the project beyond the static figures included in this PDF document.
Project Title: Engineering Houseplants for Atmospheric Carbon Monoxide Capture: Chloroplast-Targeted Expression of the Bacterial CODH Enzyme Complex in Nicotiana tabacum
The Problem This Project Addresses
Carbon monoxide (CO) is a colorless, odorless, tasteless toxic gas that cannot be detected by human senses. It is produced whenever something burns incompletely — gas heaters, stoves, car engines, fireplaces, and wood-burning appliances all release CO. Indoors, CO accumulates silently and can reach dangerous or fatal concentrations before anyone notices.
The current standard of protection is a battery-powered electrochemical CO detector. These devices are excellent at detecting CO and sounding an alarm , but they cannot remove the gas from the air. Once the alarm sounds, the occupants must evacuate and ventilate the space manually. Furthermore, CO detectors require regular battery replacement and eventually need to be replaced entirely. In low-income households worldwide, detectors are frequently absent, have dead batteries, or are past their useful lifespan.
–> This project proposes a fundamentally different approach: instead of detecting CO, make the plant remove it.
The Core Idea
Certain bacteria ,particularly Oligotropha carboxidovorans, have evolved the ability to use CO as a food source. They do this using an enzyme called Carbon Monoxide Dehydrogenase (CODH), which converts CO into CO₂ according to this reaction:
CO + H₂O → CO₂ + 2 electrons + 2 protons
The CO₂ produced by this reaction is not harmful at the quantities involved and supposed to be reused by a plant’s own photosynthesis through the Calvin cycle.
This project proposes to take the bacterial CODH system out of the bacterium and introduce it into a plant, specifically targeting it to the chloroplast (the organelle where photosynthesis happens). By placing CODH inside the chloroplast, two elegant outcomes occur simultaneously:
The plant actively breaks down CO from the surrounding air
The CO₂ produced by CODH is immediately captured by Rubisco and enters the Calvin cycle, making the plant slightly more productive
The scientific foundation for this idea is already established in the literature. Duffus et al. (2018) demonstrated that the complete CODH complex can be functionally expressed in Escherichia coli –> proving heterologous expression is achievable. South et al. (2019) demonstrated in Science that bacterial enzymes introduced into tobacco chloroplasts producing CO₂ directly in the stroma increased plant biomass by up to 40% –> proving that chloroplast-produced CO₂ is efficiently captured by photosynthesis. This project extends this logic to a new substrate: atmospheric CO.
The Complete Genetic System Required
The CODH enzyme from O. carboxidovorans is not a single protein. It is a complex system requiring seven genes organized into two functional groups:
Group 1 — Structural subunits (the enzyme itself):
coxL –> the large catalytic subunit (~88 kDa) where CO is actually oxidized. Contains the unique [CuSMoO₂] active site
coxM –> the medium subunit (~30 kDa) containing FAD, responsible for electron transfer
coxS –> the small subunit (~18 kDa) containing [2Fe-2S] iron-sulfur clusters, part of the electron relay chain
These three proteins assemble into a (CoxL·CoxM·CoxS)₂ heterohexamer — a complex of six protein subunits working together.
Group 2 — Maturation proteins (the assembly machinery):
coxD –> an AAA+ ATPase chaperone that acts as a “maturation protein,” responsible for the post-translational insertion of copper and the essential bridging sulfur into the apo-enzyme, converting it to active holo-enzyme.
coxE, coxF and coxG –> “final processing” and “sulfur addition” are part of a complex pathway. According to research, coxF plays a role in copper acquisition/mobilization, and coxE and coxG are involved in the maturation pathway that leads to the properly sulfurated and copper-inserted active site.
The exact individual functions of coxE and coxG are still being elucidated, though their role in the maturation complex is essential.
Overview of the Three Aims
AIM 1 — Computational Design and Validation of the Complete Genetic System
In simple terms: Design the complete genetic blueprint for the CO-capturing plant system on a computer, verify every element computationally, and produce a synthesis-ready design.
The seven bacterial genes cannot simply be pasted into a plant. They need to be comprehensively redesigned for plant expression:
Their DNA sequences must be rewritten in “plant language” through codon optimization
Each protein needs a molecular address label (chloroplast transit peptide) added to its beginning so it is directed to the correct location inside the plant cell
The address labels must be verified to ensure the plant’s processing machinery will correctly remove them after the protein arrives
Each gene needs its own promoter (an on-switch for gene expression) and terminator (an off-switch), carefully chosen to prevent the plant from silencing all the genes simultaneously
Translation enhancer sequences must be added to maximize protein production
Spacer sequences must be placed between genes to prevent one gene’s transcription from accidentally running into the next
The complete system must be distributed across two separate transformation vectors
All of this is done computationally using Benchling, A codon optimization tool, ChloroP 1.1, Boltz, and the Asimov Kernel –> producing a complete verified design ready for DNA synthesis through Twist Biosciences.
AIM 2 — Wet Lab Transformation and Functional Validation (The next step — beyond this course)
In simple terms: Actually build the constructs in the lab, put them into tobacco plants, and prove the enzyme works.
Aim 2 begins where Aim 1 ends. The Twist-synthesized multicassettes fragments are assembled into the pCAMBIA vectors using Gibson Assembly. The constructs are introduced into Nicotiana tabacum via Agrobacterium tumefaciens-mediated leaf disc transformation , the standard method for introducing genes into tobacco. Transgenic plants are selected on dual antibiotic medium (hygromycin + kanamycin, confirming both constructs integrated).
The experimental progression follows strict logic — each step must succeed before the next begins:
–> Step 1 — Chloroplast targeting validation
–> Step 2 — Gene integration and transcription
–> Step 3 — Protein expression and CTP cleavage
–> Step 4 — Complex assembly
–> Step 5 — CO oxidation activity
–> Step 6 — Plant health and photosynthesis
for more details, please take a look on part I of week 10 homework.
AIM 3 — Optimization, Transfer to Houseplants, and Real-World Deployment(The long-term vision)
In simple terms: Assuming Aim 2 succeeds, optimize the system, transfer it to real houseplants, and develop it toward real-world deployment.
If Aim 2 demonstrates functional CO oxidation in tobacco, Aim 3 pursues three parallel directions:
Direction 1 — Transfer to real houseplants:
The validated genetic architecture from tobacco is adapted for transformation into Epipremnum aureum (Pothos) and Spathiphyllum wallisii (Peace Lily) — widely kept, hardy, aesthetically acceptable houseplants. Agrobacterium-mediated transformation protocols established for tobacco are adapted for these species.
Direction 2 — System optimization:
Several improvements are pursued to increase CO removal efficiency and operational range:
A CO-responsive inducible promoter system replaces constitutive promoters, activating CODH expression only when CO is present and saving plant energy otherwise
Constitutively open stomata engineering to maintain CO uptake during nighttime hours when CO poisoning risk is highest
Expression levels are optimized based on the quantitative CO removal model to increase per-plant removal capacity
Direction 3 — Safety, containment, and deployment:
Genetic Use Restriction Technology (GURT): To prevent seed viability and uncontrolled environmental spread, I will implement Genetic Use Restriction Technology (GURT). This ensures that any engineered plants cannot reproduce outside controlled environments. Additional containment strategy — chloroplast genome integration:
As an alternative or complement to GURT, I can integrate the transgenes into the chloroplast genome instead of the nuclear genome. Chloroplast DNA is maternally inherited in most flowering plants, including tobacco (Nicotiana tabacum). This means the transgenes are not transmitted via pollen, virtually eliminating the risk of gene flow to wild relatives. This is a well-established biosafety strategy for plant synthetic biology.
Regulatory pathway planning begins under USDA APHIS (Regulation of genetically engineered plantsand) EPA (Regulation of plants producing pesticidal substances (if applicable))frameworks.
The deployment target is refined based on the quantitative CO removal analysis: rather than acute emergency protection in homes (which requires too many plants), the primary application is chronic CO reduction in high-exposure industrial and semi-industrial environments like workshops, garages, underground parking facilities, and developing-world indoor cooking spaces where CO concentrations are higher and more sustained.
The ethical framework for commercial deployment ,including informed consent, false assurance prevention, equity of access, and environmental risk, is fully developed and integrated into regulatory submissions.
Sources:
Bährle, R., Böhnke, S., Englhard, J., Bachmann, J., & Perner, M. (2023). Current status of carbon monoxide dehydrogenases (CODH) and their potential for electrochemical applications. Bioresources and Bioprocessing, 10(1), 84. https://doi.org/10.1186/s40643-023-00705-9
Dent, M. R., Weaver, B. R., Roberts, M. G., & Burstyn, J. N. (2023). Carbon Monoxide-Sensing Transcription Factors: Regulators of Microbial Carbon Monoxide Oxidation Pathway Gene Expression. Journal of Bacteriology, 205(5), e00332-22. https://doi.org/10.1128/jb.00332-22
Erb, T. J. (2024). Photosynthesis 2.0: Realizing New-to-Nature CO2-Fixation to Overcome the Limits of Natural Metabolism. Cold Spring Harbor Perspectives in Biology, 16(2), a041669. https://doi.org/10.1101/cshperspect.a041669
Kaufmann, P., Duffus, B. R., Teutloff, C., & Leimkühler, S. (2018). Functional Studies on Oligotropha carboxidovorans Molybdenum–Copper CO Dehydrogenase Produced in Escherichia coli. Biochemistry, 57(19), 2889–2901. https://doi.org/10.1021/acs.biochem.8b00128
Liu, C., Zhang, N., Sun, L., Gao, W., Zang, Q., & Wang, X. (2022). Potted plants and ventilation effectively remove pollutants from tobacco smoke. International Journal of Low-Carbon Technologies, 17, 1052–1060. https://doi.org/10.1093/ijlct/ctac081
Park, S., Mani, V., Kim, J. A., Lee, S. I., & Lee, K. (2022). Combinatorial transient gene expression strategies to enhance terpenoid production in plants. Frontiers in Plant Science, 13, 1034893. https://doi.org/10.3389/fpls.2022.1034893
Qin, S., Liu, Y., Yan, J., Lin, S., Zhang, W., & Wang, B. (2022). An Optimized Tobacco Hairy Root Induction System for Functional Analysis of Nicotine Biosynthesis-Related Genes. Agronomy, 12(2), 348. https://doi.org/10.3390/agronomy12020348
Schübel, U., Kraut, M., Mörsdorf, G., & Meyer, O. (1995). Molecular characterization of the gene cluster coxMSL encoding the molybdenum-containing carbon monoxide dehydrogenase of Oligotropha carboxidovorans. Journal of Bacteriology, 177(8), 2197–2203. https://doi.org/10.1128/jb.177.8.2197-2203.1995
Siebert, D., Busche, T., Metz, A. Y., Smaili, M., Queck, B. A. W., Kalinowski, J., & Eikmanns, B. J. (2020). Genetic Engineering of Oligotropha carboxidovorans Strain OM5—A Promising Candidate for the Aerobic Utilization of Synthesis Gas. ACS Synthetic Biology, 9(6), 1426–1440. https://doi.org/10.1021/acssynbio.0c00098
Tao, Y., Chiu, L.-W., Hoyle, J. W., Dewhirst, R. A., Richey, C., Rasmussen, K., Du, J., Mellor, P., Kuiper, J., Tucker, D., Crites, A., Orr, G. A., Heckert, M. J., Godinez-Vidal, D., Orozco-Cardenas, M. L., & Hall, M. E. (2023). Enhanced Photosynthetic Efficiency for Increased Carbon Assimilation and Woody Biomass Production in Engineered Hybrid Poplar. Forests, 14(4), 827. https://doi.org/10.3390/f14040827
Thagun, C., Odahara, M., Kodama, Y., & Numata, K. (2024). Identification of a highly efficient chloroplast-targeting peptide for plastid engineering. PLOS Biology, 22(9), e3002785. https://doi.org/10.1371/journal.pbio.3002785
Subsections of Individual Final Project
PHASE 1: Sequence Collection
Structural and maturation genes sequences:
To obtain the gene sequences, I used the accession number GenBank CP002827.1, which corresponds to the genome of Oligotropha carboxidovorans. I accessed this record through the National Center for Biotechnology Information platform.
Within the genome page, I used the graphical genome viewer to locate the genes of interest. I specifically identified the structural genes (coxL, coxM, coxS) and the maturation genes (coxD, coxE, coxF, coxG) involved in the CO dehydrogenase (CODH) system.
For each gene, I clicked on its corresponding feature in the graphical map, opened its detailed annotation page, and selected the FASTA format option. This allowed me to retrieve the nucleotide sequence of each gene individually.
All sequences were downloaded separately in FASTA format and then compiled for further analysis and use in my project.
Fe-S cluster-containing subunit for electron relay
Construct 1 (Structural)
coxD
CP002827.1 (32748–33635)
AEI08107.1
Molybdenum cofactor insertion and enzyme maturation
Construct 2 (Maturation)
coxE
CP002827.1 (33637–34836)
AEI08108.1
Assists in Mo-cofactor biosynthesis and assembly
Construct 2 (Maturation)
coxF
CP002827.1 (34840–35682)
AEI08109.1
Active site processing and enzyme activation
Construct 2 (Maturation)
coxG
CP002827.1 (35682–36299)
AEI08110.1
Sulfur ligand incorporation into the active site
Construct 2 (Maturation)
Promoter sequences:
TobUbi.U4 proximal promoter:
The 263 bp proximal promoter region of the Ubi.U4 gene from Nicotiana tabacum was obtained based on the study by Genschik et al., (1994)This region corresponds to the sequence spanning −263 to −1 relative to the transcription start site (TSS) and contains key cis-regulatory elements involved in transcriptional regulation.
The transcription start site (TSS, +1) was not directly annotated in the GenBank entry. Therefore, it was determined based on the promoter analysis presented in the original publication by Genschik et al. (1994), where the TSS was experimentally identified and illustrated in Figure 3.
The nucleotide sequence was retrieved from the GenBank database (accession: X77456.1), corresponding to positions 575–837 of the N. tabacum Ubi.U4 gene.
The D100 promoter is a synthetic construct derived from the Dahlia mosaic virus (DaMV) genome, as described by (Khadanga et al., 2021)based on the work of (Sahoo et al., 2015). It is designed by combining an upstream activation sequence with a core promoter region to enhance transcriptional activity.
DaMV14UAS (−203 to −33): an upstream activation sequence acting as a transcriptional enhancer
A short linker sequence (CCCGAC)
DaMV4CP (−474 to +82): a core promoter region required for basal transcription
The source promoter region corresponds to a 706 bp fragment (6579–7280) of the DaMV genome (GenBank: JX272320.1), with the transcription start site (TSS, +1) located at position 7053 based on coordinate mapping.
The following sequences were extracted based on coordinate mapping:
Initially, the promoter sequence was reconstructed using GenBank coordinates. However, slight discrepancies were observed when compared to the promoter structure illustrated in the published figure.
Therefore, the final D100 promoter sequence was generated using an Gemini AI tool based on the figure from Khadanga et al. (2021), as it accurately reflects the reported experimental construct:
The S100 promoter is a synthetic chimeric construct derived from the Soybean vein clearing virus (SVBV), as described by Khadanga et al., (2021)based on Pattanaik et al., (2004). It is designed by combining an upstream activation sequence with a core promoter region to enhance transcriptional activity.
SV10UAS (250 bp) (-352 to -102): This is the Upstream Activation Sequence that contains major regulatory elements contributing to transcriptional enhancement.
2.2. The Linker: CCCGAC sequence: A synthetic 6 bp linker (CCCGAC) inserted between the enhancer and core promoter, similar to the design used in the D100 promoter.
SV10CP (371 bp) (-352 to +19): The core promoter fragment (also referred to as SVBVFLt10) containing the TATA box (around −30) and the transcription start site (TSS, +1) required for transcription initiation.
The S100 promoter sequence was directly extracted from Figure 1 of Pattanaik et al. (2004), where the nucleotide sequence is explicitly provided in text format, and assembled in this order [SV10UAS] + [CCCGAC linker] + [SV10CP]:
The DaMV4CP fragment corresponds to a natural promoter region derived from the Dahlia mosaic virus (DaMV). It consists of a 556 bp sequence spanning positions −474 to +82 relative to the transcription start site (TSS) according to Sahoo et al., (2014) study.
This fragment was directly extracted from the DaMV genome available in the GenBank database (accession: JX272320.1), corresponding to genomic coordinates 6579–7134.
The SM promoter is a synthetic chimeric hybrid promoter constructed by combining regulatory elements from two plant viruses, as described by Kumari et al., (2024). It integrates an upstream activation sequence from Sugarcane bacilliform virus with an enhancer domain from Mirabilis mosaic virus to enhance transcriptional activity.
SUAS ( SCBV Upstream Activation Sequence): This fragment corresponds to the Upstream Activation Sequence (UAS) derived from Sugarcane bacilliform virus (SCBV), as described by Davies et al., (2014). The selected region spans −434 bp to −153 bp relative to the transcription start site (TSS), resulting in a fragment of 282 bp. This region functions as a transcriptional enhancer.
MUAS (MMV Upstream Activation Sequence): This fragment corresponds to the transcriptional enhancer domain derived from the full-length transcript (FLt) promoter of Mirabilis mosaic virus (MMV), as reported by Dey & Maiti, (1999).The sequence spans −297 to −38 relative to the TSS, with a total length of 259 bp, and contributes strong enhancer activity.
To find the first fragment SUAS, I first mapped both boundaries of the 839 bp SCBV promoter using the SCBV-F primer anchor (ATTGAATGG) and the complement of the SCBV-R primer (GAATTACACCTTTCCGCA) against the Sugarcane bacilliform virus (SCBV) Ireng Maleng isolate sequence (accession AJ277091). This allowed me to confirm the full span of the mother fragment from relative coordinate −770 to +69
Next, I identified the Transcription Start Site (TSS) based on the underlined leader sequence reported in the Figure 2 from the Davies (2014) study. I could identify the TSS (+1) as the 7528th nucleotide in the Sugarcane bacilliform virus (SCBV) Ireng Maleng isolate sequence:
7528 ATC GGTAGTTCAC CACATGAGTA TTTGAGTCAA 7560
To isolate the specific SUAS domain for the SM promoter, which the sources define as the segment from relative coordinates −434 to −153, I calculated the internal absolute indices within the 839 bp mother fragment. By mapping these relative coordinates back from the TSS, I determined the exact 282 bp enhancer sequence required to be joined directly to the MMV core promoter to build the chimeric SM promoter:
To find the second fragment MUAS, I first identified the source as the Mirabilis mosaic virus (MMV) full-length transcript (FLt) promoter from the Dey and Maiti (1999) article. Because the original study provided the literal nucleotide sequence in Figure 1 rather than a GenBank accession number, I used the printed sequence obtained from Gemini AI tool as my primary reference.
I then established the Transcription Start Site (TSS or +1) as the anchor point, which the researchers mapped via primer extension to a guanidine (G) residue located 24 nucleotides downstream of the TATATAA box. To isolate the specific MUAS fragment, which spans the relative coordinates −297 to −38, I counted upstream from the TSS to locate the nucleotide at position −297 and extracted the sequence through to the nucleotide at position −38. This process provided the 259 bp enhancer domain required for the construction of the SM and BM chimeric promoters:
The SM promoter was generated by directly fusing the SUAS fragment upstream of the MUAS enhancer sequence, as described by (Kumari et al., 2024a) based on the source sequence described in Dey & Maiti, (1999) study:
The BM promoter is a synthetic chimeric hybrid promoter constructed by the fusion of two regulatory elements, as described by (Kumari et al., 2024a). It combines an upstream activation sequence from Banana streak virus with an enhancer domain from Mirabilis mosaic virus to enhance transcriptional efficiency.
BUAS (BSV Upstream Activation Sequence) : This fragment corresponds to the Upstream Activation Sequence (UAS) derived from Banana streak virus (BSV), as reported by Remans et al., (2005). The selected region spans −1150 bp to −33 bp relative to the transcription start site (TSS), resulting in an expected length of approximately 1117 bp. This region functions as a strong transcriptional enhancer.
MUAS (MMV Upstream Activation Sequence): This sequence corresponds to the transcriptional enhancer domain derived from the full-length transcript (FLt) promoter of Mirabilis mosaic virus (MMV). It is identical to the MUAS element used in the SM promoter and contributes additional transcriptional activation capacity.
To find the first fragment BUAS, I first identified the source as the Banana streak virus (BSV) Cavendish isolate, which corresponds to GenBank accession AF215815. Although the current database entry for this accession may show a length of 1,287 bp, I noted that the sources utilize a 1,304 bp synthesized version of this isolate spanning from relative coordinates −1,150 to +154.
Next, I used the BSV-F primer anchor sequence (GGTTGCATGGAAGG) to locate the beginning of the promoter region within the GenBank file. By finding this exact sequence at the very start of the file, I established that Nucleotide 1 of the GenBank entry corresponds to the relative coordinate −1,150.
I then determined the Transcription Start Site (TSS or +1) by mapping the relative coordinates to the absolute indices of the 1,304 bp sequence. Since there are 1,150 bases upstream of the start site, the TSS is located at Nucleotide 1151. To isolate the specific BUAS domain, which the sources define as the segment from −1,150 to −33, I calculated the end index by subtracting 33 from the TSS (1151−33=1118).
Finally, I extracted the sequence from Nucleotide 1 to Nucleotide 1118, which provided the approximately 1,117 bp (mathematically 1,118 bp) enhancer fragment required to construct the BM chimeric promoter:
The MSD3 promoter is a “deletion-hybrid” construct composed of the following two fragments joined directly together as described in the study of (Kumari et al., 2024b):
MUAS (MMV Upstream Activation Sequence): This is the same sequence of the transcriptional enhancer domain isolated from the Mirabilis mosaic virus (MMV) full-length transcript (FLt) promoter, as used in SM and BM promoters.
SD3 (SCBV Deletion Fragment 3): This fragment is a truncated promoter region derived from the Sugarcane bacilliform virus (SCBV), as described by Davies et al., 2014. The SD3 sequence corresponds to the region spanning −340 bp to +69 bp relative to the transcription start site, resulting in a fragment of 409 bp. This region retains essential core promoter elements required for basal transcription.
The SD3 fragment was extracted from the SCBV genome (GenBank accession: AJ277091.1, positions 7188–7597):
The M24 promoter is a synthetic high-expression promoter derived from the Mirabilis mosaic virus (MMV), as described by (Sahoo et al., 2014). It was engineered to enhance transcriptional activity in plant systems. Based on the full-length transcript (FLt) promoter of MMV, the promoter was enhanced by duplication of upstream enhancer domains, leading to a significant increase in transcriptional strength.
The M24 promoter sequence was retrieved from the binary vector pSiM24 available in GenBank (accession: KF032933.1). The promoter corresponds to the region spanning positions 235–860 of the vector sequence.
The PClSV FLt promoter is a constitutive plant promoter derived from the Peanut chlorotic streak caulimovirus. It is composed of a basic full-length transcript (FLt) promoter region and upstream enhancer elements, which can be arranged in single or duplicated configurations to modulate transcriptional strength.
The promoter elements were identified from the PClSV genome (GenBank accession: U13988.1) as follows:
Basic FLt promoter (core region):
Spans positions 5852–6101 (~250 bp) and contains essential elements required for transcription initiation
Based on (Maiti & Shepherd, 1998), the double enhancer configuration was constructed by duplicating the enhancer region upstream of the core promoter: [Enhancer] + [Enhancer] + [Core promoter] (~428 bp)
The PClSV FLt promoter sequence was reconstructed from GenBank (U13988.1) and assembled in a double enhancer configuration based on the design described by Maiti & Shepherd (1998):
The double enhancer configuration of the PClSV FLt promoter results in an approximately threefold increase in transcriptional activity compared to the single enhancer version. Overall, this promoter exhibits strong constitutive expression in transgenic plants, with activity levels reported to be comparable to the FLt promoter of the Figwort mosaic virus and functionally similar to the widely used CaMV 35S promoter, making it a robust alternative for high-level gene expression in plant systems.
CVP1 and CVP2 promoters (Cassava vein mosaic virus, CsVMV):
The CVP1 and CVP2 promoters are constitutive plant promoters derived from the Cassava vein mosaic virus (CsVMV), as described by Verdaguer et al., (1996) and Verdaguer et al., (1998) based on the reference genome reported by Calvert et al., (1995). These promoters correspond to two fragments of different lengths within the viral genome and differ in their regulatory strength.
CVP1 (short fragment): corresponds to a 388 bp fragment spanning nucleotides 7235 to 7623, which maps to the region −368 to +20 relative to the transcription start site (TSS).
CVP2 (long fragment): represents a longer 511 bp fragment extending from nucleotides 7160 to 7675, corresponding to positions −443 to +72 relative to the TSS.
Both fragments contain core promoter elements, including the TATA box and upstream regulatory motifs, with CVP2 retaining additional upstream sequences that enhance transcriptional activity.
The sequences were directly retrieved from the CsVMV reference genome (GenBank accession: U20341.1) using the genomic coordinates reported in the original studies:
Functional analyses have demonstrated that CVP2 exhibits expression levels comparable to the enhanced CaMV 35S promoter (e35S), whereas CVP1 shows approximately half of this activity, indicating that CVP2 is about twofold more active than CVP1. These results highlight the importance of additional upstream regulatory sequences in driving stronger gene expression in plant systems.
FMV Sgt (34S) promoter (Figwort mosaic virus):
The Sgt (34S) promoter is a subgenomic promoter derived from the Figwort mosaic virus (FMV). It is located between ORF V and ORF VI and is responsible for driving the expression of ORF VI via a subgenomic transcript.
According to (Bhattacharyya et al., 2002) , a 301 bp fragment spanning −270 to +31 relative to the transcription start site (TSS) provides maximal promoter activity.
The promoter sequence was extracted from the published figure using an AI tool (Gemini), as it was only available in image format:
The PTSB1 promoter is a constitutive plant promoter I derived from the Arabidopsis thaliana tryptophan synthase β-subunit gene (TSB1). I identified this as a powerful alternative to the CaMV 35S promoter for high-level gene expression in tobacco (Shirasawa-Seo et al. 2002).
I retrieved this promoter from GenBank accession M23872, corresponding to a 1.5 kb fragement. I defined the exact boundaries of this fragment by mapping the reported PCR primers directly onto the reference sequence (Shirasawa-Seo et al. 2002):
3’ Border (Reverse primer): TCAGAGAGAGATTCATTCAGTA (This is the reverse complement of the primer sequence TACTGAATGAATCTCTCTCTGA listed in the sources.)
The resulted extracted sequence of PTSB1 promoter:
This region contains the core promoter and upstream regulatory elements responsible for its strong constitutive activity.
This promoter exhibited approximately 2.4-fold higher expression than the CaMV 35S promoter in mature tobacco leaves, with activity increasing in lower leaf positions (Shirasawa-Seo et al. 2002).
PPHYB promoter (Arabidopsis thaliana):
The PPHYB promoter is a constitutive promoter derived from the Arabidopsis thaliana phytochrome B (PHYB) gene (Goosey et al. 1997; Shirasawa-Seo et al. 2002).
I retrieved this sequence from GenBank accession L09262, which corresponds to a 2.3 kb fragment. The promoter boundaries were defined by mapping the experimentally reported primers onto the sequence (Shirasawa-Seo et al. 2002):
3’ Border (Reverse primer): CGGAGAAGAAGAACCGTCGTCA (This is the reverse complement of the primer sequence TGACGACGGTTCTTCTTCTCCG listed in the sources.)
The resulted extracted sequence of PPHYB promoter:
This fragment includes the core promoter and regulatory regions required for stable expression.
Functionally, PPHYB provides approximately 1.5-fold higher expression than the CaMV 35S promoter in mature tobacco leaves, with a more uniform expression pattern across leaf positions compared to PTSB1 (Shirasawa-Seo et al. 2002).
PNCR promoter (Soybean chlorotic mottle virus):
The PNCR promoter is a viral-derived constitutive promoter isolated from the large noncoding region of the Soybean chlorotic mottle virus (Conci et al. 1993).
Based on the reported genome size (~8,175 bp), I identified the corresponding genomic sequence and retrieved it from GenBank accession X15828.2.
I then defined the functional ~486 bp promoter fragment by mapping the reported PCR primers onto the genome (Conci et al. 1993):
3’ Border (Reverse primer): CAAGCACAAGAGAAAAGAAAGG (Note: This is the reverse complement of the primer sequence CCGGATCCTTTCTTTTCTCTTGTGCTTG provided in the source, after removing the restriction enzyme site.):
The extracted sequence of PNCR promoter:
This region contains key regulatory features including a TATA box, CAAT-like motifs, and multiple enhancer-related elements.
Functionally, this promoter exhibits approximately five-fold higher expression than the CaMV 35S promoter in tobacco protoplasts (Conci et al. 1993), while showing moderate constitutive activity (~67% of P35S) in mature leaves (Shirasawa-Seo et al. 2002).
FMV promoter (Figwort mosaic virus):
The FMV promoter is a constitutive viral promoter derived from the Figwort mosaic virus genome. In this work, I used the promoter sequence obtained directly from the supplementary Benchling file provided in (Shakhova et al., 2022):
To verify its genomic origin, I performed a BLAST analysis using the NCBI nblast, and obtained a 100% sequence match corresponding to coordinates 6358 to 6955 of the reference genome (GenBank accession NC_003554.1), confirming the exact location of the promoter fragment within the FMV genome.
According to (Shakhova et al., 2022), the FMV promoter exhibited lower activity compared to the CaMV 35S promoter under their experimental conditions, indicating that while it remains a functional constitutive promoter, it is not as strong as p35S in this specific system.
p35S (CAMV 35S promoter):
The p35S promoter is a canonical constitutive promoter derived from the Cauliflower mosaic virus and is one of the most widely used regulatory elements in plant biotechnology.
In my study, I used the specific p35S sequence provided in the supplementary Benchling file of (Shakhova et al., 2022):
The pAtUBQ10 promoter (version 0.8) is a strong constitutive plant promoter derived from the Arabidopsis thaliana ubiquitin-10 gene (At4g05320).
In this work, I used the exact ~800 bp upstream fragment as characterized in (Shakhova et al., 2022).
I obtained the sequence directly from the supplementary Benchling file provided in the study, ensuring that the construct corresponds precisely to the experimentally validated version used for expression analysis:
This fragment represents the regulatory region immediately upstream of the translation start site and includes key cis-regulatory elements responsible for its constitutive activity.
Functionally, in Nicotiana systems, this promoter provides high and stable expression levels, outperforming several endogenous plant promoters such as pAtAct2, pAtTCTP, and pAtPD7 (Shakhova et al., 2022). Although its activity is lower than the viral Cauliflower mosaic virus 35S promoter, it shows comparable expression strength to other viral promoters such as Figwort mosaic virus (FMV) and Cotton leaf curl Multan virus (CmYLCV), making it a reliable and predictable option for high-level gene expression in both Nicotiana benthamiana leaves and tobacco BY-2 cell packs.
pAtAct2 promoter (Arabidopsis thaliana):
The pAtAct2 promoter is a constitutive plant promoter derived from the Arabidopsis thaliana actin 2 gene (AT3G18780). In this work, I used the specific version characterized in (Shakhova et al., 2022).
I obtained the sequence directly from the supplementary Benchling file provided in the study, ensuring that the construct corresponds exactly to the experimentally tested version. In this configuration, the native promoter was fused to the 5′UTR omega sequence of the Tobacco mosaic virus (TMV), a common modification used to enhance translation efficiency in Nicotiana expression systems:
Functionally, although pAtAct2 is historically described as a strong constitutive promoter in Arabidopsis, the results of (Shakhova et al., 2022) show that it exhibits relatively low activity in tobacco systems. When compared to the 0.4 kb version of the Cauliflower mosaic virus 35S promoter (p35S) used as the reference in this study, pAtAct2 ranks among the weakest promoters in the tested set. This indicates that, despite its native strength in Arabidopsis, pAtAct2 behaves as a moderate-to-low strength promoter in Nicotiana, even after optimization via the TMV omega 5′UTR fusion.
NOS promoter (Agrobacterium tumefaciens nopaline synthase):
The NOS promoter is a constitutive plant promoter derived from the nopaline synthase (nos) gene of Agrobacterium tumefaciens, and is widely used in plant transformation vectors for moderate gene expression.
In this work, I retrieved the NOS promoter sequence from GenBank entry AF485783.1, corresponding to the binary vector pBI121, using the coordinates 2519 to 2825. This fragment represents the regulatory region upstream of the nos gene as commonly implemented in plant expression constructs.
The sequence was directly extracted from the annotated GenBank record, ensuring consistency with a well-established and experimentally validated vector backbone frequently used in plant biotechnology.
Functionally, the NOS promoter is considered a moderate-to low strength constitutive promoter, typically weaker than strong viral promoters such as the Cauliflower mosaic virus 35S promoter, but valued for its stable and reliable expression across different plant tissues.
Promoter
Origin
Relative Strength vs. CaMV 35S
Key Advantage / Note
Source
TobUbi.u4
Nicotiana tabacum (polyubiquitin)
~7× stronger
Native to tobacco; excellent stability for long-term expression
Genschik et al., 1994 (GenBank: X77456.1)
D100
Synthetic (Dahlia mosaic virus)
~2.2× stronger
One of the strongest synthetic promoters validated in tobacco
Khadanga et al., 2021; Sahoo et al., 2015
MSD3
Synthetic chimeric (MMV + SCBV)
~1.15× stronger
Works in both monocots and dicots; stable in tobacco
Kumari et al., 2024; Dey & Maiti, 1999
DaMVFLt4
Dahlia mosaic virus
~5× stronger
Very high activity in protoplasts and transgenic plants
Sahoo et al., 2014; GenBank: JX272320.1
M24
MMV-derived
~10× stronger
Extremely strong promoter with enhanced duplicated domains
Sahoo et al., 2014
S100
Synthetic (Strawberry vein banding virus)
~1.8× stronger
Strong synthetic alternative; slightly weaker than D100
Khadanga et al., 2021; Pattanaik et al., 2004
SM
Synthetic chimeric (SCBV + MMV)
~2.1× stronger
Highly effective in dicots like tobacco
Kumari et al., 2024; Davies et al., 2014
BM
Synthetic chimeric (BSV + MMV)
~1.72× stronger
Good alternative synthetic promoter for dicots
Kumari et al., 2024; Remans et al., 2005
FMV 34S
Figwort mosaic virus
~2× stronger
Widely used constitutive promoter in dicots
Bhattacharyya et al., 2002
CaMV 35S
Cauliflower mosaic virus
1× (reference)
Gold standard promoter for plant expression
Odell et al., 1985; Shakhova et al., 2022
PTSB1
Arabidopsis thaliana (TSB1)
~2.4× stronger
Very strong in mature leaves; tissue-dependent variation
Shirasawa-Seo et al., 2002
PPHYB
Arabidopsis thaliana (PHYB)
~1.5× stronger
Uniform expression across tissues
Shirasawa-Seo et al., 2002; Goosey et al., 1997
PNCR
Soybean chlorotic mottle virus
~5× (protoplasts), moderate in plants
Strong viral promoter distinct from CaMV and FMV
Conci et al., 1993; Shirasawa-Seo et al., 2002
PCisV
PClSV FLt promoter
~2× stronger
Strong constitutive promoter comparable to FMV
Maiti & Shepherd, 1998
dPCisV
Double enhancer PCisV
~6× stronger
Highly powerful promoter due to enhancer duplication
Maiti & Shepherd, 1998
CPV1
Cassava vein mosaic virus
~0.5× of CPV2
Moderate activity; tissue-specific expression
Verdaguer et al., 1996; Calvert et al., 1995
CPV2
Cassava vein mosaic virus
~1× (similar to e35S)
Stronger version; high activity in vascular tissues
Verdaguer et al., 1998
pFMV
Figwort mosaic virus
<1 (weaker than 35S)
Common alternative but weaker in this system
Shakhova et al., 2022
AtUBQ10 (0.8)
Arabidopsis thaliana
<1 (similar to pFMV)
Stable expression across tissues
Shakhova et al., 2022
AtAct2
Arabidopsis thaliana
Moderate to low
Constitutive but weak in tobacco system
Shakhova et al., 2022
P-Nos
Agrobacterium tumefaciens
Weak to moderate
Commonly used for selectable marker genes
GenBank: AF485783
Terminator sequences:
The sequences of the tOCS, tHSP18.2, tATPase, tAtAct2, and tRBCS3C terminators were retrieved from the supplementary Benchling file provided in the study by Shakhova et al. Using this source ensured that the exact versions correspond to those experimentally validated in the study, maintaining consistency with the reported expression data.
tOCS terminator (Agrobacterium tumefaciens)
The tOCS terminator originates from the octopine synthase gene of Agrobacterium tumefaciens. In the comparative analysis reported by Shakhova et al. (2022), this terminator consistently showed the highest performance among all tested elements. It produced the strongest and most stable expression levels across both Nicotiana benthamiana leaves and tobacco BY-2 cell systems, making it the most reliable option when maximal transgene expression is required.
The tHSP18.2 terminator is derived from the heat shock protein 18.2 gene of Arabidopsis thaliana. According to Shakhova et al. (2022), it performs at a very high level, ranking just below tOCS in both experimental systems. Although previously considered optimal in Arabidopsis and rice, its activity in tobacco remains strong but slightly less efficient than tOCS.
The tATPase terminator, originating from a tomato (Solanum lycopersicum) ATPase gene, belongs to the group of high-performing terminators. Experimental data from Shakhova et al. (2022) indicate that it supports robust expression levels comparable to tHSP18.2 in Nicotiana systems. This makes it a solid alternative when strong but not necessarily maximal expression is sufficient.
The tAtAct2 terminator comes from the actin 2 gene of Arabidopsis thaliana. Despite the widespread use of actin-related regulatory elements, this terminator showed relatively weak performance in the tested tobacco systems. In Shakhova et al. (2022), it consistently resulted in low expression levels in both plant leaves and cell cultures, indicating limited efficiency for high-expression constructs.
The tRBCS3C terminator is derived from the small subunit (3C) of the Rubisco gene in tomato. Similar to tAtAct2, it exhibited low expression output in all experimental conditions described by Shakhova et al. (2022). The data suggest that this terminator can significantly limit overall transcriptional efficiency, especially when paired with strong promoters.
Important note!
The study highlights that terminators do not act independently but interact strongly with the chosen promoter. With highly active promoters, the difference between a strong terminator (such as tOCS) and a weak one (such as tRBCS3C) can lead to expression changes of more than 50-fold. While this effect is less pronounced with weaker promoters, it remains an important factor in construct design.
T-35S (Cauliflower mosaic virus)
The T-35S terminator is a widely used viral transcriptional terminator derived from the Cauliflower mosaic virus (CaMV).
For my construct, I retrieved its sequence from the binary vector pEAQ-HT available in GenBank under accession GQ497234.1. The fragment corresponds to the region spanning positions 2889 to 3588, which contains the full termination and polyadenylation signals commonly used in plant expression systems. This sequence was directly extracted from the annotated GenBank entry to ensure accuracy and consistency with experimentally validated vector designs.
The T-E9 terminator originates from the small subunit of the Rubisco gene (rbcS) in pea (Pisum sativum) and is known for its efficient transcription termination and mRNA stabilization in plant systems. I obtained this sequence from the binary vector pKM24KH, using the GenBank accession HM036220.1. The selected region corresponds to positions 10721 to 11366, as defined in the annotated sequence. This fragment was directly extracted from the GenBank record to ensure that the version used matches the one functionally validated in plant transformation vectors.
Most stable and strongest expression in Nicotiana systems; best overall choice
Shakhova et al., 2022 (supplementary Benchling file)
tHSP18.2
Arabidopsis thaliana (heat shock protein 18.2)
Very high (slightly below tOCS)
Strong expression; highly efficient but slightly less than tOCS in tobacco
Shakhova et al., 2022 (supplementary Benchling file)
tATPase
Solanum lycopersicum (ATPase gene)
High
Robust and consistent performance; comparable to tHSP18.2
Shakhova et al., 2022 (supplementary Benchling file)
tAtAct2
Arabidopsis thaliana (actin 2)
Low
Weak expression in Nicotiana; not suitable for high-expression constructs
Shakhova et al., 2022 (supplementary Benchling file)
tRBCS3C
Solanum lycopersicum (Rubisco small subunit 3C)
Low
Limits transcription efficiency; weakest among tested terminators
Shakhova et al., 2022 (supplementary Benchling file)
T-35S
Cauliflower mosaic virus
Moderate to high
Widely used standard terminator; reliable polyadenylation signal
GenBank: GQ497234.1 (pEAQ-HT vector)
T-E9
Pisum sativum (Rubisco small subunit)
High
Efficient transcription termination and mRNA stabilization in plants
GenBank: HM036220.1 (pKM24KH vector)
CTP (Chloroplast Transit Peptde) sequences:
The three chloroplast transit peptides (RbcS CTP, Ferredoxin-2 CTP, and RecA CTP) were identified from Arabidopsis thaliana proteins using the UniProt database. For each protein, I first retrieved the corresponding entry (accessions P10795, P16972, and Q39199), then examined the “Features” section, specifically under PTM/Processing, to locate the annotated transit peptide regions.
The CTP sequences were directly extracted from the annotated transit peptide segments, which correspond to the N-terminal targeting signals responsible for directing proteins to the chloroplast. This approach ensures that the selected sequences match experimentally curated annotations and represent functional chloroplast-targeting peptides.
These sequences were selected to provide alternative chloroplast targeting signals with potentially different import efficiencies, enabling flexibility in construct design.
CTP
Source Protein
Organism
UniProt Accession
Length (aa)
Key Function
RbcS CTP
Ribulose-1,5-bisphosphate carboxylase/oxygenase small subunit
Arabidopsis thaliana
P10795
57
Targets proteins to chloroplast stroma (photosynthetic pathway)
Ferredoxin-2 CTP
Ferredoxin-2 (chloroplastic)
Arabidopsis thaliana
P16972
53
Directs proteins to chloroplast electron transport system
RecA CTP
DNA repair protein RecA homolog 1
Arabidopsis thaliana
Q39199
57
Targets proteins to chloroplast nucleoids (DNA maintenance)
Vector Backbones
pCAMBIA2300 (Construct 1: Structural genes – coxL, M, S)
The pCAMBIA2300 vector (GenBank accession AF234315.1) was used as the backbone for the structural gene construct. It is a binary plant expression vector with an approximate size of 8.7 kb, designed as an empty cloning system without any reporter gene, allowing full customization of inserted expression cassettes.
This vector carries the nptII gene, which confers kanamycin resistance in plants, making it suitable for selecting transformants expressing the structural genes (coxL, coxM, coxS). For bacterial propagation, it also includes a kanamycin resistance marker, enabling selection in E. coli prior to Agrobacterium transformation.
The cloning region consists of a pUC18-derived multiple cloning site (MCS) containing standard restriction sites. Additionally, the presence of the pVS1 origin of replication ensures high plasmid stability in Agrobacterium. This vector is well-suited for accommodating multi-cassette inserts, such as the structural gene assembly used in this project.
pCAMBIA1300 (Construct 2: Maturation genes – coxD, E, F, G)
The pCAMBIA1300 vector (GenBank accession AF234296.1) was selected as the backbone for the maturation gene construct. Similar to pCAMBIA2300, it is an empty binary vector (~8.9 kb) designed for flexible insertion of custom genetic elements.
Its key feature is the presence of a hygromycin resistance gene (HygR) for plant selection, which complements the kanamycin resistance used in pCAMBIA2300. This enables the implementation of a dual-selection strategy for identifying co-transformed plants carrying both constructs.
For bacterial selection, pCAMBIA1300 also carries a kanamycin resistance marker, allowing propagation in E. coli. The vector includes a standard pUC18-derived MCS, suitable for inserting large DNA fragments such as the multi-gene maturation cassette (coxD, coxE, coxF, coxG).
Dual-Vector Strategy and Considerations
The combined use of pCAMBIA2300 and pCAMBIA1300 allows efficient co-expression of multiple genes through independent constructs:
Construct
Genes
Vector
Plant Selection
Structural
coxL, coxM, coxS
pCAMBIA2300
Kanamycin
Maturation
coxD, coxE, coxF, coxG
pCAMBIA1300
Hygromycin
This dual-selection system enables reliable identification of plants carrying both constructs.
An important technical consideration is that both vectors use kanamycin for bacterial selection, which prevents simultaneous selection of both plasmids in E. coli. Therefore, each construct must be cloned and verified independently before being introduced into Agrobacterium. Co-transformation can then be achieved, followed by selection at the plant level using both antibiotics.
Plant Expression Vectors: pCAMBIA2300 and pCAMBIA1300
For my plant transformation system, I selected two complementary binary vectors: pCAMBIA2300 and pCAMBIA1300, enabling the independent construction and co-expression of structural and maturation gene cassettes. Detailed technical specifications for both vectors can be found in their respective datasheets provided by Abcam for pCAMBIA1300 and pCAMBIA2300.
Feature
pCAMBIA2300
pCAMBIA1300
Construct Use
Structural genes (coxL, coxM, coxS)
Maturation genes (coxD, coxE, coxF, coxG)
Approx. Size
~8.7 kb
~8.9 kb
Plant Selection Marker
Kanamycin (nptII)
Hygromycin (HygR)
Bacterial Selection
Kanamycin
Kanamycin
Reporter Gene
None (empty vector)
None (empty vector)
Cloning Site
pUC18-derived MCS
pUC18-derived MCS
Replication in Agrobacterium
pVS1 origin (high stability)
pVS1 origin (high stability)
Insert Capacity
Suitable for large multi-cassette inserts
Suitable for large multi-cassette inserts
Main Advantage
Compatible with kanamycin-based plant selection
Enables dual selection with hygromycin
AMV RNA4 Translation Enhancer Design
Sequence Selection and Modification Strategy
The AMV RNA4 enhancer sequence was selected based on the work of Jobling & Gehrke (1987), which demonstrated that this viral leader sequence can strongly enhance translation efficiency in plant systems.
The original viral RNA sequence reported in the article was:
5'-GUUUUUAUUUUUAAUUUUCUUUCAAAUACUUCCAUCAUGA-3’
Because the enhancer naturally exists as RNA, the sequence was converted into its complementary DNA (cDNA) equivalent for incorporation into the double-stranded DNA constructs designed for Twist Bioscience synthesis:
5'-GTTTTTATTTTTAATTTTCTTTCAAATACTTCCATCATGA-3’
During sequence analysis, the native terminal ATG codon present at the 3′ end of the enhancer was identified as a potential problem. If retained, this endogenous ATG could initiate translation before the intended chloroplast transit peptide coding sequence, potentially producing non-functional proteins or frame-shifted translation products.
To prevent this issue, the terminal ATG codon was manually removed, generating the final modified enhancer sequence:
5′-GTTTTTATTTTTAATTTTCTTTCAAATACTTCCATCA-3′
This modification ensured that the first translation initiation codon encountered by the ribosome corresponded to the optimized start codon of the chloroplast transit peptide fusion construct.
Sequence Verification and Validation
Several validation steps were performed after enhancer modification.
First, restriction enzyme screening was conducted to verify that problematic restriction sites such as EcoRI, BamHI, HindIII and XbaI were not unintentionally introduced into the final fused constructs. This step was important for preserving compatibility with downstream cloning verification and diagnostic digestion workflows.
Next, the modified enhancer sequence was evaluated for secondary structure formation to ensure that removal of the terminal ATG did not generate stable hairpins or inhibitory RNA structures that could interfere with ribosome binding or translation initiation.
The final modified AMV enhancer sequence remained structurally suitable for efficient translational enhancement and integration into the multi-cassette CODH system.
To improve protein production from the engineered CODH expression cassettes, the 5′ untranslated region (UTR) of Alfalfa Mosaic Virus (AMV) RNA4 was incorporated as a translational enhancer upstream of each coding sequence. The objective of this element was to increase translational efficiency and improve ribosome recruitment in Nicotiana tabacum cells.
Phage-Derived Stuffer/Spacer Sequences
Spacer Design Strategy and Selection
To minimize unwanted interactions between adjacent expression cassettes, neutral spacer sequences were introduced between transcriptional units in the final multi-gene constructs.
Rather than reusing the same spacer repeatedly, four different spacer sequences were designed for the different cassette junctions (Spacer 1–4). Using identical spacer sequences multiple times is generally discouraged because repeated DNA regions can increase the probability of homologous recombination during bacterial cloning or after plant transformation, potentially leading to construct rearrangement or partial deletion.
For this reason, unique spacer sequences were selected for each junction to improve structural stability of the final constructs.
To generate biologically neutral spacers, fragments derived from the genome of Enterobacteria phage lambda NC_001416.1) were used. Lambda phage DNA is commonly utilized in synthetic biology as inert “stuffer DNA” because it lacks known regulatory activity in plant cells, contains no plant-specific coding regions, is well characterized, and minimizes unintended interactions within eukaryotic systems.
Each spacer was designed to be approximately 100 bp long. Although this represents the minimal recommended spacer size, it was considered sufficient to physically separate neighboring transcriptional units, reduce transcriptional and steric interference between cassettes, and improve overall construct organization during multi-cassette assembly.
Spacer Validation and Optimization
Before final selection, several validation steps were performed to ensure that the spacer sequences were suitable for stable multi-cassette assembly and plant expression.
First, all spacer sequences were designed to be different from one another in order to reduce repeated DNA regions and minimize the risk of homologous recombination within the construct.
Next, each spacer was analyzed against the Nicotiana tabacum reference genome GCF_000715075.1) using BLASTn to verify genome neutrality. The analysis confirmed the absence of significant similarity with endogenous tobacco genes or regulatory regions, reducing the risks of off-target recombination, post-transcriptional gene silencing (PTGS), and unintended genomic interactions.
The spacer sequences were also screened to avoid problematic restriction enzyme recognition sites that could interfere with downstream cloning and Gibson Assembly workflows.
Finally, GC content was maintained within moderate ranges (~37–48%) to avoid extremely AT-rich or GC-rich regions that could negatively affect DNA synthesis stability, PCR amplification, or secondary structure formation.
The final validated spacer sequences are presented below:
To improve the structural stability and transcriptional insulation of the multi-cassette CODH constructs, neutral spacer sequences were introduced between adjacent expression cassettes. These spacers were designed to reduce promoter and terminator interference, minimize homologous recombination risks, and prevent unwanted interactions between neighboring transcriptional units during cloning and plant expression.
Sources:
Bhattacharyya, S., Dey, N., & Maiti, I. B. (2002). Analysis of cis-sequence of subgenomic transcript promoter from the Figwort mosaic virus and comparison of promoter activity with the cauliflower mosaic virus promoters in monocot and dicot cells. Virus Research, 90(1), 47–62. https://doi.org/10.1016/S0166-0934(02)00146-5
Calvert, L. A., Ospina, M. D., & Shepherd, R. J. (1995). Characterization of cassava vein mosaic virus: A distinct plant pararetrovirus. Journal of General Virology, 76(5), 1271–1278. https://doi.org/10.1099/0022-1317-76-5-1271
Conci, L. R., NISHIZAWA, Y., SAITO, M., DATE, T., HASEGAWA, A., MIKI, K., & HIBI, T. (1993). A strong promoter fragment from the large noncoding region of soybean chlorotic mottle virus DNA. Japanese Journal of Phytopathology, 59(4), 432-437.
Davies, J. P., Reddy, V., Liu, X. L., Reddy, A. S., Ainley, W. M., Thompson, M., Sastry-Dent, L., Cao, Z., Connell, J., Gonzalez, D. O., & Wagner, D. R. (2014). Identification and use of the sugarcane bacilliform virus enhancer in transgenic maize. BMC Plant Biology, 14(1), 359. https://doi.org/10.1186/s12870-014-0359-3
Dey, N., & Maiti, I. B. (1999). Structure and promoter/leader deletion analysis of mirabilis mosaic virus (MMV) full-length transcript promoter in transgenic plants. Plant Molecular Biology, 40(5), 771–782. https://doi.org/10.1023/A:1006285426523
Genschik, P., Marbach, J., Uze, M., Feuerman, M., Plesse, B., & Fleck, J. (1994). Structure and promoter activity of a stress and developmentally regulated polyubiquitin-encoding gene of Nicotiana tabacum. Gene, 148(2), 195–202. https://doi.org/10.1016/0378-1119(94)90689-0
Goosey, L., Palecanda, L., & Sharrock, R. A. (1997). Differential patterns of expression of the Arabidopsis PHYB, PHYD, and PHYE phytochrome genes. Plant physiology, 115(3), 959–969. https://doi.org/10.1104/pp.115.3.959
Jobling, S. A., & Gehrke, L. (1987). Enhanced translation of chimaeric messenger RNAs containing a plant viral untranslated leader sequence. Nature, 325(6105), 622–625. https://doi.org/10.1038/325622a0
Khadanga, B., Chanwala, J., Sandeep, I. S., & Dey, N. (2021). Synthetic Promoters from Strawberry Vein Banding Virus (SVBV) and Dahlia Mosaic Virus (DaMV). Molecular Biotechnology, 63(9), 792–806. https://doi.org/10.1007/s12033-021-00344-5
Kumari, K., Sherpa, T., & Dey, N. (2024a). Analysis of plant pararetrovirus promoter sequence(s) for developing a useful synthetic promoter with enhanced activity in rice, pearl millet, and tobacco plants. Frontiers in Plant Science, 15. https://doi.org/10.3389/fpls.2024.1426479
Kumari, K., Sherpa, T., & Dey, N. (2024b). Analysis of plant pararetrovirus promoter sequence(s) for developing a useful synthetic promoter with enhanced activity in rice, pearl millet, and tobacco plants. Frontiers in Plant Science, 15. https://doi.org/10.3389/fpls.2024.1426479
Norris, S. R., Meyer, S. E., & Callis, J. (1993). The intron of Arabidopsis thaliana polyubiquitin genes is conserved in location and is a quantitative determinant of chimeric gene expression. Plant molecular biology, 21(5), 895–906. https://doi.org/10.1007/BF00027120
Maiti, I. B., & Shepherd, R. J. (1998). Isolation and Expression Analysis of Peanut Chlorotic Streak Caulimovirus (PClSV) Full-Length Transcript (FLt) Promoter in Transgenic Plants. Biochemical and Biophysical Research Communications, 244(2), 440–444. https://doi.org/10.1006/bbrc.1998.8287
Pattanaik, S., Dey, N., Bhattacharyya, S., & Maiti, I. B. (2004). Isolation of full-length transcript promoter from the Strawberry vein banding virus (SVBV) and expression analysis by protoplasts transient assays and in transgenic plants. Plant Science, 167(3), 427–438. https://doi.org/10.1016/j.plantsci.2004.04.011
Remans, T., L. Grof, C. P., Ebert, P. R., & Schenk, P. M. (2005). Identification of functional sequences in the pregenomic RNA promoter of the Banana streak virus Cavendish strain (BSV-Cav). Virus Research, 108(1), 177–186. https://doi.org/10.1016/j.virusres.2004.09.005
Sahoo, D. K., Dey, N., & Maiti, I. B. (2014). pSiM24 Is a Novel Versatile Gene Expression Vector for Transient Assays As Well As Stable Expression of Foreign Genes in Plants. PLOS ONE, 9(6), e98988. https://doi.org/10.1371/journal.pone.0098988
Sahoo, D. K., Sarkar, S., Raha, S., Das, N. C., Banerjee, J., Dey, N., & Maiti, I. B. (2015). Analysis of Dahlia Mosaic Virus Full-length Transcript Promoter-Driven Gene Expression in Transgenic Plants. Plant Molecular Biology Reporter, 33(2), 178–199. https://doi.org/10.1007/s11105-014-0738-9
Shakhova, E. S., Markina, N. M., Mitiouchkina, T., Bugaeva, E. N., Karataeva, T. A., Palkina, K. A., Fakhranurova, L. I., Yampolsky, I. V., Sarkisyan, K. S., & Mishin, A. S. (2022). Systematic Comparison of Plant Promoters in Nicotiana spp. Expression Systems. International Journal of Molecular Sciences, 23(23), 15441. https://doi.org/10.3390/ijms232315441
Shirasawa-Seo, N., Mitsuhara, I., Nakamura, S., Murakami, T., Iwai, T., Nishizawa, Y., … & Ohashi, Y. (2002). Constitutive promoters available for transgene expression instead of CaMV 35S RNA promoter: Arabidopsis promoters of tryptophan synthase protein β subunit and phytochrome B. Plant Biotechnology, 19(1), 19-26.
Verdaguer, B., de Kochko, A., Beachy, R. N., & Fauquet, C. (1996). Isolation and expression in transgenic tobacco and rice plants, of the cassava vein mosaic virus (CVMV) promoter. Plant Molecular Biology, 31(6), 1129–1139. https://doi.org/10.1007/BF00040830
Verdaguer, B., de Kochko, A., Fux, C. I., Beachy, R. N., & Fauquet, C. (1998). Functional organization of the cassava vein mosaic virus (CsVMV) promoter. Plant Molecular Biology, 37(6), 1055–1067. https://doi.org/10.1023/A:1006004819398
Phase 2: Codon Optimization
The Codon Optimization and Its Critical Role:
Codon Optimization and Sequence Adaptation processes:
1. Start Codon Verification and Correction
As an initial step, all seven CODH genes were carefully inspected to verify the presence of a valid translation initiation codon. A critical adjustment was required for the coxM gene, which was the only gene using an alternative bacterial start codon (GTG) instead of the canonical ATG.
Since plant translation machinery, particularly in Nicotiana tabacum, strictly recognizes ATG as the initiation codon, the native GTG was manually corrected to ATG during the optimization process. This modification ensures proper translation initiation while preserving the original amino acid sequence of the CoxM protein.
2. Codon Optimization Strategy
Codon optimization was performed using the Benchling Codon Optimization Tool, applying the “Match Codon Usage” algorithm. This approach was selected because it reproduces the natural codon distribution of the target organism rather than overusing only the most frequent codons, thereby improving mRNA stability and translation efficiency.
The optimization process was carried out under the following parameters:
Target organism: Nicotiana tabacum
Restriction site filtering: Removal of common restriction enzyme recognition sites (EcoRI, HindIII, BamHI, XbaI, PstI, and SpeI) to facilitate downstream cloning
Golden Gate compatibility: Elimination of BsaI and Esp3I sites to ensure compatibility with Modular Cloning (MoClo) systems
RNA stability optimization: Implementation of uridine depletion and avoidance of stable hairpin structures to reduce ribosomal stalling and improve translation efficiency
3. Results and Validation
Following optimization, all sequences were evaluated using CAIcal to assess codon adaptation and overall sequence quality.
The analysis demonstrated consistently strong performance across all seven genes as showed in the following table:
Gene Name
Length (bp)
CAI Score
Total GC%
GC at 3rd Position
Nc Value
Expression Potential
CoxL
2430
0.773
46.3%
40.0%
57.0
Excellent
CoxE
1200
0.762
49.8%
40.5%
61.0
Very Good
CoxG
618
0.760
46.9%
40.8%
61.0
Very Good
CoxS
501
0.759
47.7%
43.1%
61.0
Very Good
CoxD
888
0.756
46.8%
40.5%
61.0
Very Good
CoxF
843
0.748
49.5%
39.9%
61.0
Very Good
CoxM
867
0.747
49.5%
39.1%
61.0
Very Good
The Codon Adaptation Index (CAI) values ranged from 0.747 to 0.773, indicating a high level of similarity to codon usage patterns found in highly expressed genes of Nicotiana tabacum. This suggests that the optimized sequences are well-suited for efficient translation in the plant host.
The overall GC content was successfully adjusted to a range of 46.3% to 49.8%, aligning with the typical GC composition of plant genes. This represents a significant improvement compared to the original bacterial sequences and contributes to better transcriptional stability and compatibility with the host genome.
The Effective Number of Codons (Nc) values ranged from 57.0 to 61.0, reflecting a balanced codon usage without excessive repetition. This indicates that the sequences maintain sufficient variability, which is important for avoiding issues such as tRNA depletion or translational bottlenecks.
Additionally, the GC content at the third codon position was maintained at approximately 40%, which is considered optimal for the “wobble” position. This balance supports efficient recognition by plant tRNAs and contributes to overall translation efficiency.
To further validate the integrity of the optimization process, both the raw bacterial sequences and the codon-optimized sequences were translated into their corresponding amino acid sequences.
A pairwise comparison was then performed using BLASTp alignment to assess sequence similarity.
The results confirmed that all optimized proteins are identical to their native counterparts, with no changes in amino acid sequence.
This verification step ensures that codon optimization only affected synonymous codon usage without altering protein structure or function, preserving the biological activity of all seven CODH components.
The resulting codon-optimized cox genes sequences are as follows:
Back-Translation and Codon Optimization of Engineered CTP Sequences
After designing and validating the engineered chloroplast transit peptides (CTPs) at the amino acid level, the next step was to convert these protein sequences into DNA sequences that are fully compatible with the plant expression system. This process ensures that the “targeting signals” (CTPs) are translated efficiently in Nicotiana tabacum, just like the CODH subunits.
Since these CTPs are fused directly to the N-terminus of the CODH proteins, it is essential that they follow the same genetic design rules as the rest of the system to guarantee consistent expression and proper chloroplast targeting.
Back-Translation Strategy
The engineered CTP amino acid sequences (RbcS, Fer2, and RecA), including the modified junction motifs (VNA–AM, VTA–AM, and TVY–AA), were back-translated into DNA sequences using the Benchling Codon Optimization tool.
This step converted the peptide sequences into nucleotide sequences optimized for expression in Nicotiana tabacum, ensuring compatibility with the plant’s codon usage preferences and translation machinery.
Codon Optimization Consistency
The same optimization framework used for the seven CODH genes was applied to the CTP sequences to maintain full compatibility and expression uniformity across the entire multigene construct. This guarantees that all components of the system follow the same expression logic within the plant cell.
Key Adjustment: Hairpin Structure Control
A specific adjustment was introduced during this step due to the short length of CTP sequences. The standard secondary structure analysis settings were not optimal for short peptide-encoding regions, which can lead to inaccurate prediction of stable RNA hairpins near the translation start site.
To address this, the hairpin analysis window was reduced to 100 to improve sensitivity for short sequences and to ensure that no stable secondary structures form at the 5’ region that could interfere with ribosome binding or early translation.
The following are the final codon-optimized CTP sequences generated in this step:
RbcS CTP Sequence (engineered and codon optimized):
Codon optimization is a fundamental step in synthetic biology when expressing genes across different organisms. Although the genetic code is universal, meaning that most organisms use the same codons to encode the same amino acids, the frequency at which specific codons are used varies between species. This phenomenon is known as codon usage bias.
Each organism has evolved to preferentially use certain codons over others, largely reflecting the abundance of corresponding transfer RNAs (tRNAs). As a result, a gene originating from one organism may be inefficiently translated when introduced into another if its codon usage does not match the host’s preferences.
In this project, the seven genes encoding the Carbon Monoxide Dehydrogenase (CODH) system originate from a bacterium and are being expressed in a plant (Nicotiana tabacum). Without codon optimization, several issues can arise:
Reduced translation efficiency due to rare codons
Ribosome stalling or premature termination
Lower protein yield or misfolding
Overall failure of the multi-subunit complex to assemble correctly
Because the CODH system depends on the coordinated expression of multiple subunits and maturation proteins, balanced and efficient expression of each gene is essential. Even a single poorly expressed component could compromise the functionality of the entire enzyme complex.
Therefore, codon optimization is not just a technical adjustment but a critical requirement for functional expression. In this step, each gene sequence is redesigned to match the codon usage preferences of Nicotiana tabacum, while preserving the exact amino acid sequence of the encoded proteins. Additional considerations, such as avoiding mRNA secondary structures, eliminating cryptic splice sites, and maintaining appropriate GC content, are also taken into account.
Sources:
Belinky, F., Rogozin, I. B., & Koonin, E. V. (2017). Selection on start codons in prokaryotes and potential compensatory nucleotide substitutions. Scientific Reports, 7(1), 12422. https://doi.org/10.1038/s41598-017-12619-6
Chowdhury, T., Saha, A., Saha, A., Chakraborty, A., & Das, N. (2025). NeuralCodOpt: Codon optimization for the development of DNA vaccines. -Computational Biology and Chemistry, 116, 108377. https://doi.org/10.1016/j.compbiolchem.2025.108377
Ho, A. T., & Hurst, L. D. (2022). Unusual mammalian usage of TGA stop codons reveals that sequence conservation need not imply purifying selection. PLoS Biology, 20(5), e3001588. https://doi.org/10.1371/journal.pbio.3001588
Jacobson, G. N., & Clark, P. L. (2016). Quality over quantity: Optimizing co-translational protein folding with non-‘optimal’ synonymous codons. Current Opinion in Structural Biology, New Constructs and Expression of Proteins • Sequences and Topology, 38, 102–110. https://doi.org/10.1016/j.sbi.2016.06.002
Jenkins, M. C., Parker, C., O’Brien, C., Campos, P., Tucker, M., & Miska, K. (2023). Effects of codon optimization on expression in Escherichia coli of protein-coding DNA sequences from the protozoan Eimeria. Journal of Microbiological Methods, 211, 106750. https://doi.org/10.1016/j.mimet.2023.106750
Puigbò, P., Guzmán, E., Romeu, A., & Garcia-Vallvé, S. (2007). OPTIMIZER: A web server for optimizing the codon usage of DNA sequences. Nucleic -Acids Research, 35(Web Server issue), W126–W131. https://doi.org/10.1093/nar/gkm219
Subcellular Targeting and Chloroplast Transit Peptide Engineering:
1. Selection of Chloroplast Transit Peptides
To improve targeting efficiency and avoid using repeated sequences, three different plant CTPs were selected:
RbcS CTP: is derived from the Rubisco small subunit, one of the most abundant proteins in the chloroplast, and is widely used as a strong and reliable targeting signal.
Fer2 CTP: comes from Ferredoxin-2, a chloroplast protein involved in electron transfer during photosynthesis, and is known for efficient import into the chloroplast stroma.
RecA CTP: is derived from a chloroplast-localized RecA protein, which plays a role in DNA repair and maintenance within the chloroplast, and provides an alternative targeting signal with a different sequence composition.
These CTPs are derived from naturally chloroplast-targeted plant proteins (Arabidopsis thaliana) and are known to efficiently direct proteins into the chloroplast. Instead of using the same CTP for all seven genes, different peptides were intentionally distributed across the CODH subunits.
2. Fusion Design and Junction Engineering
Each CODH protein was fused to a CTP at its N-terminus. To make sure the protein folds correctly after cleavage, the fusion included the first 60 amino acids of each CODH protein, which were obtained using the ExPASy ProtParam tool.
A very important step was designing the junction between the CTP and the CODH protein. This region was carefully modified to include a cleavage motif recognized by the chloroplast enzyme responsible for removing the transit peptide:
(Val/Ile)-X-(Ala/Cys) ↓ Ala
To create this motif, small changes were made at the end of the CTP sequence as showed in the following sequences:
Overall, the results indicate successful design of functional targeting signals for all CODH subunits:
All constructs were confidently predicted as chloroplast-targeted proteins, confirming that the added CTPs are functional.
The cleavage sites align well with the engineered junction motifs, demonstrating that the proteins are likely to be correctly processed after import.
The coxM fusion showed the highest cleavage probability (Pr = 0.7188), indicating highly efficient targeting and processing.
Other subunits showed moderate probabilities (around 0.48–0.59), which are still within acceptable ranges for functional targeting.
The coxE fusion presented a lower probability (Pr = 0.3172). Although this suggests potentially less efficient cleavage, the sequence still satisfies the required motif and is expected to remain functional, as variability in cleavage efficiency is common in heterologous systems.
Most constructs showed cleavage occurring exactly at the designed motif, typically between amino acid positions 51–56, depending on the transit peptide used.
However, a notable observation was made for two constructs, coxF and coxS, where the predicted cleavage site occurred slightly upstream of the engineered junction, specifically just before the designed alanine-alanine region rather than directly within it.
This slight variation in cleavage position is consistent with the known behavior of the chloroplast Stromal Processing Peptidase. Rather than recognizing a single fixed sequence, the enzyme identifies a broader structural and sequence context, which allows for some flexibility in the exact cleavage position. As a result, small shifts of one or two amino acids relative to the designed motif are commonly observed in both native and engineered proteins.
In this case, although the cleavage in coxF and coxS occurs marginally earlier than expected, it remains within a functionally acceptable region. The resulting mature proteins retain nearly identical N-terminal sequences and are not expected to lose any essential structural or functional elements. Importantly, the targeting prediction remains strong, confirming that the proteins are still efficiently directed to the chloroplast.
Therefore, this variability does not compromise the overall design. All fusion constructs are considered valid, and no redesign was required. Instead, this observation reflects the inherent flexibility of chloroplast protein processing and further validates the robustness of the engineered system.
Objective
Subcellular targeting is a critical step in synthetic biology when expressing proteins in a new host organism. In plant cells, proteins must be directed to the correct organelle in order to function properly. This is especially important for metabolic pathways that depend on specific cellular environments.
In this project, the seven proteins forming the Carbon Monoxide Dehydrogenase (CODH) system originate from a bacterium. However, in plant cells, these proteins need to function inside the chloroplast, where photosynthesis occurs and where the produced CO₂ can be directly reused.
Bacterial proteins do not naturally contain signals that allow them to enter plant organelles. As a result, if they are expressed without modification, they will remain in the cytosol, where they may not fold correctly, may not interact properly with other subunits, and may fail to form a functional enzyme complex.
To solve this problem, each CODH protein must be fused to a chloroplast transit peptide (CTP). These short sequences are naturally found in plant proteins and act as targeting signals that guide newly synthesized proteins into the chloroplast. Once the protein reaches the chloroplast, the transit peptide is cleaved, releasing the mature protein in its functional form.
Sources:
An optimized transit peptide for effective targeting of diverse foreign proteins into chloroplasts in rice | Scientific Reports. (n.d.). Retrieved May 5, 2026, from https://www.nature.com/articles/srep46231
Caspari, O. D. (2022). Transit Peptides Often Require Downstream Unstructured Sequence for Efficient Chloroplast Import in Chlamydomonas reinhardtii. Frontiers in Plant Science, 13. https://doi.org/10.3389/fpls.2022.825797
Caspari, O. D., Garrido, C., Law, C. O., Choquet, Y., Wollman, F.-A., & Lafontaine, I. (2023). Converting antimicrobial into targeting peptides reveals key features governing protein import into mitochondria and chloroplasts. Plant Communications, 4(4), 100555. https://doi.org/10.1016/j.xplc.2023.100555
Chung, B. K.-S., & Lee, D.-Y. (2012). Computational codon optimization of synthetic gene for protein expression. BMC Systems Biology, 6, 134. https://doi.org/10.1186/1752-0509-6-134
Dietel, A.-K., Merker, H., Kaltenpoth, M., & Kost, C. (2019). Selective advantages favour high genomic AT-contents in intracellular elements. PLoS Genetics, 15(4), e1007778. https://doi.org/10.1371/journal.pgen.1007778
Lee, S., Weon, S., Lee, S., & Kang, C. (2010). Relative Codon Adaptation Index, a Sensitive Measure of Codon Usage Bias. Evolutionary Bioinformatics Online, 6, 47–55. https://doi.org/10.4137/ebo.s4608
Li, Q., Luo, Y., Sha, A., Xiao, W., Xiong, Z., Chen, X., He, J., Peng, L., & Zou, L. (2023). Analysis of synonymous codon usage patterns in mitochondrial genomes of nine Amanita species. Frontiers in Microbiology, 14. https://doi.org/10.3389/fmicb.2023.1134228
Monjezi, Z., Rooshanfekr, H. allah, Nazari, M., Salabi, F., & Tabandeh, M. R. (2024). Codon optimization of voraxin α sequence enhances the immunogenicity of a recombinant vaccine against Hyalomma anatolicum infestation in rabbits. Veterinary Immunology and Immunopathology, 275, 110817. https://doi.org/10.1016/j.vetimm.2024.110817
Puigbò, P., Bravo, I. G., & Garcia-Vallve, S. (2008). CAIcal: A combined set of tools to assess codon usage adaptation. Biology Direct, 3, 38. https://doi.org/10.1186/1745-6150-3-38
Richter, S., & Lamppa, G. K. (1999). Stromal Processing Peptidase Binds Transit Peptides and Initiates Their Atp-Dependent Turnover in Chloroplasts. The Journal of Cell Biology, 147(1), 33–44. https://doi.org/10.1083/jcb.147.1.33
Supek, F., & Šmuc, T. (2010). On Relevance of Codon Usage to Expression of Synthetic and Natural Genes in Escherichia coli. Genetics, 185(3), 1129–1134. https://doi.org/10.1534/genetics.110.115477
Thagun, C., Odahara, M., Kodama, Y., & Numata, K. (2024). Identification of a highly efficient chloroplast-targeting peptide for plastid engineering. PLOS Biology, 22(9), e3002785. https://doi.org/10.1371/journal.pbio.3002785
Willems, T., Hectors, W., Rombaut, J., De Rop, A.-S., Goegebeur, S., Delmulle, T., De Mol, M. L., De Maeseneire, S. L., & Soetaert, W. K. (2023). An exploratory in silico comparison of open-source codon harmonization tools. Microbial Cell Factories, 22, 227. https://doi.org/10.1186/s12934-023-02230-y
Phase 4: Promoter-Terminator Pairing and Expression Simulation (Asimov Kernel)
Promoter–Terminator Pairing and Expression Design:
Initial Design Strategy
I first assembled a promoter library containing 20 plant promoters with different reported expression strengths, together with a smaller library of seven plant terminators.
The initial strategy was to generate multiple promoter–terminator combinations for each CODH gene and then computationally simulate their predicted expression behavior using the Asimov Kernel platform. This simulation step was intended to help compare the different expression architectures before final construct selection.
The design process was based on several important principles:
Stronger genes or more critical proteins should receive stronger promoters
Structural subunits should maintain relatively balanced stoichiometry
Strong promoters should generally be paired with stronger terminators
Construct size should remain compatible with cloning and synthesis workflows
Extremely high expression should be avoided when possible to reduce metabolic stress and instability risks
Using these principles, multiple candidate expression sets were generated for both the structural genes and the maturation genes.
Structural Gene Expression Sets
The structural construct contains the three genes directly forming the CODH enzyme complex:
coxL —> the large catalytic subunit
coxM —> the electron transfer medium subunit
coxS —> the iron-sulfur small subunit
Set 1 — High Balanced Expression (Primary Candidate)
Gene
Promoter
Relative Strength
Recommended Terminator
Reasoning
coxL
dPCisV
6×
tOCS
Strongest terminator paired with the strongest promoter to maximize CoxL expression. CoxL is the largest catalytic subunit and requires the highest transcriptional support.
coxM
PNCR
5×
tHSP18.2
Second strongest terminator matched with a highly active promoter to maintain balanced expression relative to CoxL.
coxS
DaMVFLt4
5×
tATPase
High-performance terminator selected to provide expression levels comparable to coxM while preserving subunit stoichiometry.
This configuration was designed to maximize structural gene expression while maintaining relatively balanced production between the three subunits.
Set 2 — Medium-High Balanced Expression (Alternative)
Gene
Promoter
Relative Strength
Recommended Terminator
Reasoning
coxL
D100
2.2×
tOCS
Again, the strongest terminator was paired with the lead structural gene to maximize transcriptional output and support high CoxL accumulation.
coxM
SM
2.1×
tHSP18.2
Promoters and terminators with similar strengths were combined to maintain balanced intermediate expression levels.
coxS
FMV 34S (Sgt)
2×
tATPase
The same stepwise promoter–terminator pairing strategy was maintained to preserve proportional expression among structural subunits.
This set provided a more moderate expression profile. Although weaker than Set 1, it was expected to reduce cellular burden and lower the risks associated with excessive transgene expression.
Set 3 — Very High Expression Configuration
Gene
Promoter
Relative Strength
Recommended Terminator
Reasoning
coxL
M24
10×
tOCS
M24 is an extremely strong promoter and therefore requires pairing with the strongest terminator to ensure efficient transcription termination and prevent premature transcript instability.
coxM
CPV 2
Comparable to e35S
tHSP18.2
tHSP18.2 was selected to support stable expression; however, CPV2 is substantially weaker than M24, creating a potential stoichiometric imbalance between CoxL and CoxM expression levels.
coxS
TobUbi.u4
7×
tATPase
A strong terminator was retained to match the high activity of the TobUbi.u4 promoter and maintain efficient expression of the coxS subunit.
This configuration aimed to maximize expression output. However, because of the extremely strong promoters involved, it also carried higher risks of stoichiometric imbalance, metabolic stress, transcriptional instability, and possible silencing effects.
Maturation Gene Expression Sets
The maturation construct contains four accessory genes involved in CODH assembly and activation:
coxD
coxE
coxF
coxG
Unlike the structural genes, these proteins are not part of the final catalytic complex itself but are essential for proper enzyme maturation, sulfur insertion, and cofactor incorporation.
Special attention was given to coxD because it plays a central role in active-site maturation.
Set 4 — Balanced Maturation Expression
Gene
Promoter
Relative Strength
Recommended Terminator
Reasoning
coxD
PTSB1
~2.4×
tOCS
The strongest promoter in this maturation construct was paired with the strongest terminator because CoxD is the most critical maturation protein and should not become rate-limiting during enzyme assembly.
coxE
D100
2.2×
tHSP18.2
The second strongest promoter was matched with a highly efficient terminator to maintain balanced and stable expression of the coxE maturation factor.
coxF
SM
2.1×
T-35S
A moderately strong viral terminator was selected to support stable transcription while avoiding repeated use of the same terminator combinations across constructs.
coxG
FMV 34S (Sgt)
2×
tATPase
The strong tATPase terminator was used to compensate for the relatively weaker promoter and maximize final transcript accumulation for coxG.
This set was designed to maintain balanced maturation-protein production while prioritizing coxD expression because of its importance in catalytic-site activation.
Set 5 — Lower Expression Configuration
Gene
Promoter
Relative Strength
Recommended Terminator
Reasoning
coxD
S100
1.8×
tOCS
Weaker promoters benefit the most from highly efficient terminators; therefore, tOCS was selected to compensate for the lower promoter strength and maximize transcript stability.
coxE
BM
1.72×
tHSP18.2
The same compensation strategy was applied by pairing a moderately weak promoter with a high-performance terminator to improve overall expression efficiency.
coxF
PPHYB
~1.5×
tATPase
A robust terminator was retained to stabilize transcripts produced from the moderate-strength PPHYB promoter.
coxG
MSD3
1.15×
T-E9
The T-E9 terminator was selected as a reliable transcriptional terminator to support expression from the weakest promoter within this construct set.
This configuration represented a weaker-expression alternative intended to minimize cellular burden and reduce possible stress associated with transgene overexpression.
The original plan for this phase was to computationally simulate all designed expression sets using the Asimov Kernel platform.
The objective of these simulations was to:
Predict relative expression behavior
Evaluate stoichiometric balance between genes
Identify potential bottlenecks in the pathway
Detect excessive or insufficient expression levels
Refine promoter–terminator combinations before DNA synthesis
At the current stage of the project, access to the Asimov Kernel platform is still pending. To avoid delaying the workflow, provisional promoter–terminator combinations were selected manually based on promoter strength, expected biological balance, construct compactness, and cloning feasibility.
If access to Asimov Kernel becomes available later, the selected systems will still be computationally validated, and additional adjustments may be introduced if simulation results suggest improved expression architectures.
Final Selected Expression Systems
Final Structural Construct Selection
For the structural genes, Set 2 was selected as the final configuration.
Although Set 1 and Set 3 could potentially generate stronger expression, Set 2 was considered more biologically balanced and technically safer. The moderate promoter strengths reduce the likelihood of excessive chloroplast burden, instability, or transcriptional silencing while still maintaining relatively balanced subunit expression.
Final structural configuration:
Gene
Promoter
Terminator
coxL
D100
tOCS
coxM
SM
tHSP18.2
coxS
FMV 34S
tATPase
Final Maturation Construct Selection
For the maturation genes, a modified version of Set 4 was selected.
Initially, the promoter PTSB1 was assigned to coxD because of its relatively strong expression profile. However, this promoter was approximately 1.5 kb long, which significantly increased construct size and cloning complexity.
To maintain a more compact and synthesis-friendly construct, PTSB1 was replaced with D100 while preserving the overall balanced-expression strategy.
Final maturation configuration:
Gene
Promoter
Terminator
coxD
D100
tOCS
coxE
SM
tHSP18.2
coxF
S100
tATPase
coxG
FMV 34S
T-35S
This final configuration aimed to preserve balanced maturation-gene expression while improving construct compactness and compatibility with downstream Gibson Assembly and DNA synthesis workflows.
Objective
After completing sequence collection, codon optimization, chloroplast transit peptide fusion, and cleavage site verification, the next objective was to design the regulatory architecture controlling expression of the seven CODH genes inside Nicotiana tabacum cells.
The CODH pathway is composed of multiple interacting structural and maturation proteins that must function together in a coordinated manner. Because of this, maintaining balanced expression between the genes is critical. Excessive or insufficient expression of specific subunits could negatively affect protein folding, complex assembly, chloroplast burden, and overall enzyme functionality.
Therefore, the main goal of this phase was to design a biologically balanced expression system by selecting suitable promoter–terminator combinations capable of driving efficient and coordinated expression of all seven CODH genes.
The initial plan for this phase was to:
Build multiple promoter–terminator combinations for each gene
Simulate their expression behavior using the Asimov Kernel platform
Compare predicted expression outputs
Select the most balanced and stable expression architecture for the final constructs
The final promoter–terminator combinations were selected based on relative promoter strengths, functional compatibility between regulatory elements, and expected expression balance across the CODH pathway. Terminator efficiency values were taken from reported comparative plant expression data in Shakhova et al. (2022). The overall performance scores were predicted using an AI-based evaluation (Claude AI) integrating promoter strength, terminator efficiency, and expected transcriptional balance.
Each expression cassette was designed using the same general architecture: Promoter → AMV Enhancer → Chloroplast Transit Peptide (CTP) → CODH Gene → Tag (if applicable) → Terminator
All seven cassettes were designed individually in Benchling before being assembled into the larger Structural and Maturation multicassette constructs.
Selection of Regulatory and Functional Elements
Promoter–Terminator Combinations
The promoter–terminator pairs selected during the previous phase were incorporated into the final cassette designs to drive constitutive expression in tobacco cells.
Different promoter strengths were intentionally distributed across the genes to maintain balanced expression between structural and maturation proteins.
AMV RNA4 Translational Enhancer
Each cassette included the modified AMV RNA4 translational enhancer immediately downstream of the promoter.
The endogenous ATG codon was previously removed from the enhancer sequence to ensure that translation initiates only at the intended chloroplast transit peptide start codon.
This enhancer was incorporated to improve ribosome recruitment and increase translational efficiency of the engineered mRNAs.
Chloroplast Transit Peptides (CTPs)
Because the CODH pathway must function inside chloroplasts, chloroplast transit peptides were fused upstream of each CODH coding sequence.
These CTPs act as molecular targeting signals directing the newly synthesized proteins from the cytoplasm into the chloroplast after translation.
Different transit peptides were selected based on predicted compatibility and chloroplast import efficiency.
CODH Gene Fusion
Each codon-optimized CODH gene was fused directly downstream of its corresponding chloroplast transit peptide in order to generate a continuous translational fusion protein.
This design ensures that the targeting peptide is translated first and recognized by the chloroplast import machinery before cleavage by stromal processing peptidase (SPP).
Epitope Tag Integration
Specific epitope tags were incorporated into selected cassettes to facilitate downstream protein detection, purification, and complex characterization.
The following tags were used: FLAG tag for coxL and coxD; His tag for coxS
These tags were included to support future protein purification, Co-IP experiments, PAGE analysis, and enzyme characterization workflows during the experimental validation phase.
Final Cassette Components
The final regulatory combinations and chloroplast targeting peptides used for each cassette are summarized below.
Gene
Promoter
CTP Source
Terminator
Tag
coxL
D100
RbcS
tOCS
FLAG
coxM
SM
Fer2
tHSP18.2
—
coxS
FMV 34S
RecA
tATPase
His
coxD
D100
RbcS
tOCS
FLAG
coxE
SM
Fer2
tHSP18.2
—
coxF
S100
RecA
tATPase
—
coxG
FMV 34S
RbcS
T-35S
—
The objective of this step was to design each cox gene as an independent plant expression cassette containing all the required regulatory elements for efficient expression in Nicotiana tabacum. This included selecting appropriate promoters, terminators, chloroplast transit peptides (CTPs), translational enhancers, purification tags, and spacer sequences, while organizing the multicassette constructs in a modular format compatible with DNA synthesis and Gibson Assembly.
Vector Linearization and Homology Arm Design:
Before assembling the large Structural and Maturation multicassette inserts, the next objective was to identify suitable insertion sites within the pCAMBIA backbones and generate homology arms compatible with Gibson Assembly.
This step was essential to ensure seamless integration of the final multicassette constructs into the plant transformation vectors.
Selection of the Restriction Site
To determine the optimal vector opening site, the multiple cloning site (MCS) maps of both pCAMBIA1300 and pCAMBIA2300 were analyzed in Benchling.
The restriction enzymes previously excluded during gene and cassette design (“Clean List”) were cross-referenced against the vector maps to avoid conflicts with internal restriction sites present in the final constructs.
Following this analysis, XbaI was selected as the universal linearization site for both vectors because:
It was absent from the designed multicassette inserts
It produced a clean single-cut linearization
It was positioned appropriately within the MCS regionIt simplified downstream Gibson Assembly design
Both pCAMBIA vectors were virtually digested in Benchling using XbaI:
pCAMBIA2300 → designated for the Structural multicassette
pCAMBIA1300 → designated for the Maturation multicassette
This generated linearized vector backbones with defined left and right insertion junctions.
Homology Arm Design
To enable Gibson Assembly, homology arms were generated directly from the terminal sequences of the XbaI-linearized vectors.
For each construct, 40 bp regions located at the ends of the digested vectors were extracted and incorporated as terminal overlaps (“tails”) on the outer fragments of the multicassette inserts.
These homology arms provide complementary regions between the vector backbone and the insert, allowing seamless enzymatic assembly during Gibson Assembly.
Because both vectors were linearized at the same XbaI site, the resulting homology arms were identical for the two constructs.
Final Homology Arms
Left Homology Arm : gaccatgattacgaattcgagctcggtacccggggatcct
Right Homology Arm: ctagagtcgacctgcaggcatgcaagcttggcactggccg
These sequences were directly extracted from the terminal regions of the XbaI-digested pCAMBIA vectors after virtual linearization in Benchling.
The objective of this step was to prepare the pCAMBIA2300 and pCAMBIA1300 backbones for Gibson Assembly by virtually linearizing the vectors at a selected restriction site and generating homologous overlap regions. These homology arms were designed to guide the precise insertion and seamless assembly of the multicassette fragments into the plasmid backbones.
Twist Fragment Preparation & Troubleshooting:
After finishing the design of all seven expression cassettes in Benchling, I prepared the sequences for synthesis by Twist Bioscience.
The objective of this step was to divide the large multicassette constructs into smaller DNA fragments compatible with DNA synthesis and Gibson Assembly.
Initially, I tried to submit each complete fragment directly to the Twist synthesis platform. Although several fragments were accepted immediately, others were rejected because the algorithm detected highly repetitive DNA regions.
The major problem came from the synthetic promoters D100 and S100, which contain repeated enhancer motifs. Repetitive DNA is problematic for commercial DNA synthesis because it can:
Reduce synthesis accuracy
Increase recombination risks
Create instability during cloning
Interfere with sequence assembly algorithms
To solve these issues, I performed several optimization and troubleshooting steps directly in Benchling.
Fragment A
Fragment A was designed for the structural multicassette construct cloned into the pCAMBIA2300 backbone.
This fragment initially contained: [Left Homology Arm] – [Spacer 1] – [coxL Cassette] – [40 bp Spacer 2]
The fragment was rejected by the Twist algorithm because the D100 promoter contained two repeated enhancer regions.
To solve this issue, I first tried to identify the functional transcription factor binding regions inside the promoter sequence. Using the promoter map from the original publication, I localized the consensus sequences (functional boxes) and carefully avoided modifying them.
I then introduced small nucleotide substitutions only in the non-functional repeated regions.
The modifications included: A ↔ T, G ↔ C substitutions
I specifically used complementary substitutions in order to maintain approximately the same GC content and preserve promoter stability.
These modifications reduced the number of repeated regions detected by Twist, but the fragment was still rejected.
I also tried to optimize the repeated region located near the end of the coxL cassette. Several synonymous sequence modifications were tested: GGAGAGCAACTTGGACTT→ GGTGAACAGCTGGGTTTG→ GGCGAGCAACTTGGACTT→ GGAGAACAGCTCGGCTTG
However, the Twist algorithm continued detecting problematic repeats.
Final Solution: Fragment Splitting
Since sequence optimization alone was insufficient, I decided to split Fragment A into two smaller fragments, A1 and A2.
The objective was to physically separate the repeated enhancer regions of the D100 promoter into different synthesis fragments.
After splitting the construct, both fragments were accepted successfully by Twist Bioscience without additional problems.
Final Fragment Design
Fragment A1 :[Left Homology Arm] – [Spacer 1] – [First Part of D100]
Fragment B was accepted directly by the Twist algorithm without requiring any optimization. This fragment contained: [Spacer 2] – [Full coxM Cassette] – [Spacer 3]
The fragment already satisfied all synthesis requirements because it did not contain repetitive regions or problematic GC-rich structures.
This overlap design ensured proper assembly continuity during Gibson Assembly.
Fragment C was also accepted directly without major issues.
This fragment contained: [Last 40 bp of Spacer 3] – [Full coxS Cassette] – [Right Homology Arm]
The fragment was designed to terminate the structural multicassette assembly inside the pCAMBIA2300 backbone.
This organization ensured proper circularization of the final plasmid during Gibson Assembly.
Fragment D
Fragment D belonged to the maturation multicassette construct cloned into pCAMBIA1300. Initially, the fragment contained: [Left Homology Arm] – [Spacer 1] – [coxD Cassette] – [Spacer 2]
Like Fragment A, this fragment was rejected because the D100 promoter contained repeated enhancer regions detected by the Twist algorithm.
Instead of modifying the sequence extensively, I decided to split the fragment into two smaller fragments. The objective was again to physically separate the repeated promoter regions.
Final Fragment Design
Fragment D1: [Left Homology Arm] – [Spacer 1] – [First Part of D100]
I introduced 40 bp overlaps between the fragments to allow Gibson Assembly reconstruction of the complete cassette.
After splitting, both fragments were accepted successfully by Twist Bioscience.
I designed the overlaps carefully to maintain assembly continuity with the neighboring fragments. The fragment did not contain problematic repeats or synthesis instability regions.
Unlike the previous problematic fragments containing the D100 or S100 promoters, this fragment used the SM promoter, which did not contain repetitive enhancer regions.
Therefore, Fragment F was accepted directly by the Twist Bioscience algorithm from the first submission without requiring any optimization, sequence modification, or fragment splitting.
The fragment was synthesized as a complete cassette exactly as originally designed in Benchling.
Fragment G
Fragment G corresponded to the coxF cassette region.
Initially, I designed the complete coxF cassette as a single large fragment containing the S100 promoter. However, the Twist algorithm rejected the sequence because the S100 promoter contained repetitive enhancer regions similar to those previously observed with the D100 promoter.
To solve this problem, I divided the large region into multiple smaller fragments. Some fragments were accepted immediately, while the fragment containing the S100 promoter continued to fail.Therefore, I followed the same strategy previously used for the D100 promoter.
First, I localized the functional consensus regions inside the S100 promoter using the original promoter publication.
Then, I introduced minimal nucleotide substitutions only outside the functional boxes: A ↔ T, G ↔ C substitutions
These modifications preserved: GC content balance, Promoter architecture, Functional regulatory motifs
After these adjustments, the fragment was finally accepted by the Twist algorithm.
Fragment G corresponded to the coxF cassette region. Initially, I designed the fragment as a single large sequence, but the S100 promoter repeats again caused synthesis rejection.
To solve this issue, I split the region into two smaller fragments:
Fragment G1: [First 40 bp of Spacer 4] – [First Part of coxF Cassette]
The 40 bp overlap allowed seamless Gibson Assembly between both fragments. After splitting and promoter optimization, both fragments were accepted successfully.
Final twist validated fragments:
Fragment
Construct
Main Components
Special Notes
A1
Structural construct (pCAMBIA2300)
Left homology arm + Spacer 1 + First part of D100 promoter
Fragment created after splitting Fragment A to separate repeated enhancer regions
A2
Structural construct (pCAMBIA2300)
40 bp overlap from A1 + Remaining D100 promoter + Complete coxL cassette + First 40 bp of Spacer 2
Accepted after promoter splitting
B
Structural construct (pCAMBIA2300)
Spacer 2 + Complete coxM cassette + Spacer 3
Accepted directly without optimization
C
Structural construct (pCAMBIA2300)
Last 40 bp of Spacer 3 + Complete coxS cassette + Right homology arm
Accepted directly without optimization
D1
Maturation construct (pCAMBIA1300)
Left homology arm + Spacer 1 + First part of D100 promoter
Generated after splitting Fragment D to separate repeated promoter regions
D2
Maturation construct (pCAMBIA1300)
40 bp overlap from D1 + Remaining D100 promoter + Complete coxD cassette + Spacer 2
Accepted after fragment splitting
E
Maturation construct (pCAMBIA1300)
Last 40 bp of Spacer 2 + Complete coxG cassette + Spacer 3
Accepted directly without optimization
F
Maturation construct (pCAMBIA1300)
Last 40 bp of Spacer 3 + Complete coxE cassette + Spacer 4
Contains SM promoter; accepted directly from the first submission
G1
Maturation construct (pCAMBIA1300)
First 40 bp of Spacer 4 + First part of coxF cassette
Fragment generated after splitting the coxF region because of S100 promoter repeats
G2
Maturation construct (pCAMBIA1300)
40 bp overlap from G1 + Remaining coxF cassette + Right homology arm
Accepted after S100 promoter optimization and fragment splitting
The objective of this step was to adapt the designed multicassette constructs to the synthesis requirements of Twist Bioscience by identifying and resolving problematic repetitive regions, optimizing synthesis compatibility, and ensuring that all final fragments could be successfully synthesized and assembled through Gibson Assembly.
Phase 6: Twist Bioscience Order Simulation
Twist Bioscience Order Simulation:
After completing the design and optimization of all fragments in Benchling
, I exported the finalized sequences in FASTA format. Each fragment corresponded to a specific part of the structural or maturation multicassette constructs and already contained the required overlaps for Gibson Assembly.
I then uploaded the FASTA files into the Twist Bioscience Platform
using the gene synthesis workflow. The platform automatically analyzed each sequence to evaluate synthesis compatibility, including repetitive regions, GC balance, and sequence complexity.
Fragments that failed the screening due to repetitive promoter regions were optimized during the previous phase either by introducing minimal nucleotide modifications in non-functional regions or by splitting the constructs into smaller fragments. After re-uploading the corrected sequences, all fragments were successfully accepted by the Twist algorithm.
This final simulation confirmed that the complete multicassette constructs were synthesis-compatible and ready for downstream Gibson Assembly and cloning experiments.
The objective of this phase was to simulate the commercial DNA synthesis workflow by exporting the finalized multicassette fragments from Benchling
in FASTA format and evaluating their compatibility with the synthesis requirements of Twist Bioscience. This step aimed to verify sequence manufacturability, detect potential synthesis issues such as repetitive regions or sequence complexity, and confirm that all fragments were fully ready for commercial synthesis and downstream Gibson Assembly.
After preparing and validating all the synthesis fragments, I moved to the in silico assembly step in Benchling to digitally reconstruct the complete Structural and Maturation multicassettes before any physical cloning work. For this step, I used the native Gibson Assembly tool available in Benchling because all fragments were already designed with 40 bp overlaps to enable seamless assembly.
First, I opened Benchling and clicked on the Create (+) button from the left sidebar. Then, from the Assembly options, I selected “Assemble DNA sequences by cloning.” This opened the Gibson Assembly workflow interface where I configured all the assembly parameters.
For the assembly settings, I selected the destination project folder dedicated to the multicassette constructs. Since I wanted to generate standalone insert sequences rather than circular plasmids at this stage, I set the construct topology to Linear. Then, I selected Gibson Assembly as the cloning method. For fragment joining, I chose the option “Find existing overlaps” because all overlaps had already been engineered during the previous fragment preparation phase.
Next, I adjusted the homology parameters to match the overlaps used in my fragment design. I fixed both the minimum and maximum overlap length to 40 bp, corresponding to the overlaps added between all neighboring fragments. I also kept the minimum melting temperature around 39°C to ensure proper overlap recognition during the digital assembly process.
After configuring the assembly settings, Benchling generated a linear assembly lane containing several fragment bins. I then imported all fragments sequentially from left to right according to their assembly order.
For the Structural multicassette, I imported the fragments in the following order:
Fragment_A1
Fragment_A2
Fragment_B
Fragment_C
For the Maturation multicassette, I imported:
Fragment_D1
Fragment_D2
Fragment_E
Fragment_F
Fragment_G1
Fragment_G2
Inside each bin, I used the “Search for sequences” option to retrieve the fragments directly from my Benchling project files. I also ensured that every junction remained configured on “Find existing overlaps” so Benchling could automatically detect and validate the engineered Gibson homology regions between adjacent fragments.
Once all fragments were added, Benchling automatically analyzed the overlaps between neighboring fragments.
When all homology regions matched correctly, the assembly status changed from 0 constructs to 1 construct, confirming that the fragments were compatible and could assemble successfully into a continuous sequence. I then clicked the “Assemble” button to generate the final multicassette sequences. Benchling created new linear DNA constructs corresponding to the complete Structural and Maturation inserts assembled from all validated sub-fragments.
Finally, I opened the resulting linear maps to verify the integrity of both assembled structural and maturation multicassettes. I carefully checked that all annotations were preserved correctly across the final constructs, including promoters, AMV enhancers, chloroplast transit peptides (CTPs), coding sequences, purification tags, spacers, and terminators. I also verified that all junctions were seamless and that no gaps, inversions, or frame disruptions appeared between adjacent fragments.
This final in silico Gibson Assembly simulation confirmed that both multicassette inserts were correctly designed and fully ready for downstream cloning and plasmid integration steps.
The objective of this phase was to digitally assemble all synthesized DNA fragments into the final structural and maturation multicassette constructs using Gibson Assembly simulation in Benchling
. This step allowed me to verify fragment compatibility, overlap integrity, correct orientation, and successful reconstruction of the complete plasmids before experimental cloning.
Phase 8: Full Construct Assembly (insert into pCAMBIA1300 and pCAMBIA2300)
Full Construct Assembly:
After successfully assembling the Structural and Maturation multicassette inserts in Phase 7, I moved to the final cloning step where I inserted each complete multicassette block into its corresponding binary vector backbone using in silico Gibson Assembly in Benchling.
For this phase, I followed the same general Gibson Assembly workflow previously used for multicassette reconstruction. However, instead of assembling several independent fragments together, I assembled only two major components: the linearized pCAMBIA vector backbone and the complete multicassette insert.
I first opened the Benchling Assembly tool by selecting Create (+) → Assemble DNA sequences by cloning. Then, I configured the assembly parameters similarly to the previous phase. The cloning method was set to Gibson Assembly, and the overlap detection mode remained configured on “Find existing overlaps.”
Unlike Phase 7, where the constructs were generated as linear inserts, I configured the topology of the final constructs as Circular because the insert and vector backbone needed to re-circularize to form complete binary plasmids.
For the Structural construct, I imported:
–> The linearized pCAMBIA2300 backbone digested at the XbaI site
–> The complete Structural multicassette insert assembled in Phase 7
For the Maturation construct, I imported:
–> The linearized pCAMBIA1300 backbone digested at the XbaI site
–> The complete Maturation multicassette insert assembled in Phase 7
Benchling automatically analyzed the homology regions between the insert ends and the vector backbone extremities to validate correct assembly compatibility.
Once both components were loaded into the assembly bins, Benchling successfully detected the overlap regions and generated one valid construct for each assembly. I then clicked the “Assemble” button to create the final circular plant expression plasmids.
The resulting constructs were then analyzed using both the Plasmid Map and Linear Map visualization modes in Benchling. This final verification step allowed me to confirm that the multicassette inserts were correctly integrated into the vectors without inversions, sequence interruptions, or junction mismatches.
The final Structural construct generated a circular plasmid of approximately 16,488 bp, while the final Maturation construct generated a circular plasmid of approximately 18,070 bp.
During the final quality-control inspection, I verified that the entire multicassette payload was correctly positioned between the Left Border (LB) and Right Border (RB) T-DNA sequences, ensuring compatibility with future Agrobacterium-mediated plant transformation.
I also confirmed that all original backbone features remained intact after assembly. In pCAMBIA2300, the nptII kanamycin resistance cassette used for plant selection was preserved correctly. Similarly, the hygromycin resistance cassette of pCAMBIA1300 remained unaffected.
Finally, I checked the integrity of the essential bacterial backbone elements outside the T-DNA region, including the pVS1 replication/stability regions, the pBR322 origin of replication, and the bacterial antibiotic resistance marker. All these elements remained fully conserved after circularization of the final plasmids.
The objective of this phase was to digitally assemble the fully reconstructed Structural and Maturation multicassette inserts into their corresponding binary plant expression vectors, pCAMBIA2300 and pCAMBIA1300, using in silico Gibson Assembly in Benchling. This step aimed to generate complete circular plant transformation plasmids, verify the integrity of all assembly junctions and vector backbone elements, and confirm that the final constructs were fully compatible with downstream cloning, bacterial propagation, and Agrobacterium-mediated plant transformation applications.
To comprehensively evaluate the structural integrity, predictive confidence, and purification tag behavior of my engineered plant-targeted constructs, I performed an integrated macro-scale monomer analysis using AlphaFold 3. For this first verification step, I analyzed each engineered fusion protein separately as an individual monomeric prediction. This allowed me to specifically evaluate the local structural effects of the added chloroplast transit peptides (CTPs) and purification tags on each protein independently before studying higher-order assembly behavior in later verification steps.
For each fusion protein, I systematically cross-examined four key design parameters within a single diagnostic profile:
Core Catalytic Domain Structure & Folding: Ensuring the functional enzyme and chaperone cores fold into active configurations without structural collapse or internal blockages.
Per-Residue Confidence & Color Mapping: Utilizing AlphaFold’s Predicted Local Distance Difference Test (pLDDT) scoring matrix to map local modeling certainty. Residues with absolute structural reliability score above 90 (dark blue), while highly flexible, intrinsically disordered regions register below 50 (bright orange).
Secondary Structures Within the CTP: Confirming that the added N-terminal Chloroplast Transit Peptides (CTPs) maintain a flexible configuration necessary to interact cleanly with the chloroplast Toc/Tic translocon complexes.
Epitope Tag Spatial Exposure and Accessibility: Verifying that my engineered purification/detection tags (HA and FLAG) protrude freely into the solvent as unstructured random coils, allowing immediate antibody recognition without steric hindrance from the folded protein body.
Structural Subunits Analysis
CoxL Monomer
Core Catalytic Domain Structure & Colors: The massive core domain of CoxL is highly structured, composed of complex beta-sheets and flanking alpha-helices. The entire core mass is uniformly shaded in dark blue ribbons (pLDDT > 90), demonstrating absolute model confidence in the catalytic scaffold.
CTP Region Structure & Colors (RbcS CTP): Located at the N-terminus, this 53aa sequence is displayed as a loose loop shaded entirely in bright orange (pLDDT < 50).
Secondary Structures within CTP: Close inspection reveals that this CTP behaves entirely as an intrinsically disordered random coil. There are no hidden or unintended alpha-helices or beta-strands within the orange tail. It stays completely open and unbonded, keeping it fully solvent-accessible for import machinery.
Epitope Tags Protrude Freely: The HA tag is attached to the extreme C-terminus of the subunit. It projects directly outward away from the folded alpha/beta catalytic body into the surrounding solvent. It is mapped as a low-confidence profile (pLDDT < 50, bright orange), confirming it acts as a hyper-flexible, disordered “tether” that is perfectly exposed for anti-HA antibody binding during Western blots.
–> Design Verdict: PASSED ✅.
CoxM Monomer
Core Catalytic Domain Structure & Colors: CoxM folds as a dense alpha-helical bundle (long corkscrew-like spirals). The entire core is uniformly colored in deep dark blue (>90 pLDDT), showing that AlphaFold is highly certain of this arrangement.
CTP Region Structure (Fer2 CTP) & Colors: The Fer2 transit peptide projects outward from the top of the bundle. It begins as a highly flexible, un-bonded string shaded in bright orange (<50 pLDDT).
Secondary Structures within CTP: As the sequence approaches the junction where it merges into the core domain, it transitions to yellow (50 – 70 pLDDT) and forms a distinct, short alpha-helix segment. This temporary micro-helix is a common biological feature in Fer2 transit peptides, often aiding membrane docking during chloroplast translocation. Because it points directly out into the solvent and does not collapse back into or bury the main helical core, it is completely non-disruptive.
–> Design Verdict: PASSED ✅. The Fer2 transit peptide preserves necessary terminal flexibility despite containing a brief, non-interfering junctional alpha-helix.
CoxS Monomer
Core Catalytic Domain Structure & Colors: The small iron-sulfur cluster-binding core consists of short, rigid beta-hairpins and alpha-helices, mapped entirely in high-confidence dark blue (pLDDT > 90).
CTP Region Structure & Colors (RecA CTP): The N-terminal RecA CTP (51aa) projects outward as an extended loop colored in bright orange (pLDDT < 50).
Secondary Structures within CTP: The RecA CTP is mostely devoid of secondary structures, forming a random disordered coil. It exists as a highly dynamic, whipping tail.
Epitope Tags Protrude Freely: The C-terminal FLAG epitope tag (9aa) appears as a dangling loop colored in yellow and orange (pLDDT 50 – 70). It is completely unstructured, forms a pure random coil, and projects cleanly into the solvent without wrapping back onto the cluster core, making it fully optimized for anti-FLAG antibody binding during downstream assays.
–> Design Verdict: PASSED ✅.
Maturation Component Analysis
CoxD Fusion Monomer
Core Catalytic Domain Structure & Colors: The main core of CoxD is a large, globular alpha/beta mixed domain. The entire core is beautifully map-colored in dark blue ribbons (pLDDT > 90), confirming absolute confidence in the structural stability of this maturation factor.
CTP Region Structure & Colors (RbcS CTP): The N-terminal RbcS CTP is visible as a loose string colored in bright orange (pLDDT < 50).
Secondary Structures within CTP: The transit peptide is a 100% disordered random coil containing zero secondary structures, ensuring it remains unconstrained.
Epitope Tags Protrude Freely: The C-terminal FLAG tag projects outward as an extended, highly flexible random coil colored in yellow (pLDDT 50 – 70) and orange (pLDDT < 50). It floats cleanly away from the blue functional body, guaranteeing unhindered accessibility for antibody capture.
–> Design Verdict: PASSED ✅.
CoxE Fusion Monomer
Core Catalytic Domain Structure & Colors: The structural core of CoxE is a complex, multi-domain chaperone factor. In its native state (CoxE Alone), the protein exhibits two distinct rigid terminal domains separated by an intrinsically disordered, highly flexible central linker.
Global vs. Segmented Alignment Metrics: When running a global alignment on the core sequence, the engineered CoxE Fusion matches the control with a sequence identity of 99 % across 257 residues, returning a global backbone RMSD = 1.93 Å and a TM-score = 0.64. To investigate the source of this 1.93 Å coordinate displacement, I executed a high-resolution segmented alignment targeting the individual rigid blocks:
o The N-Terminal Domain Block: Aligning native residues 1 – 85 against engineered residues 53 – 136 confirmed a highly preserved structural match (RMSD = 0.4 Å and a TM-score = 0.98).
o The C-Terminal Domain Block: Aligning native residues 138 – 399 against engineered residues 190 – 451 yielded an identical, unwarped topology (RMSD = 0.95 Å and a TM-score = 1.48).
Mathematical Proof of Chaperone Hinge Dynamics: This segmented analysis provides flawless mathematical proof of my design’s success. The individual functional blocks are rigidly identical to the native control. The minor 1.93 Å global shift is not a folding failure; it is a signature of native structural dynamics. The flexible linker loop situated between the two domains acts as a molecular hinge. Because this loop is completely unconstrained, it adopts a slightly alternative bend in the prediction window when accommodating the adjacent N-terminal Fer2 CTP. Crucially, the internal folds of the functional chaperone targets remain pristine.
CTP Region Structure & Colors (Fer2 CTP): The attached Fer2 CTP maps entirely as a low-confidence loop (pLDDT < 50, bright orange) projecting cleanly away from the main body.
Secondary Structures within CTP: The transit peptide acts as a pure disordered random coil, preserving the native flexibility required to engage chloroplast translocation machinery.
Epitope Tags Protrude Freely: N/A. To maintain this highly precise, native inter-domain flexibility and avoid interface crowding, CoxE was intentionally engineered without terminal epitope tags.
–> Design Verdict: PASSED ✅. Segmented domain matching confirms the rigid blocks are structurally pristine, and the global variation is mathematically proven to be a harmless reflection of native hinge flexibility.
CoxF Fusion Monomer
Core Catalytic Domain Structure & Colors: CoxF forms an exquisite, compact globular fold dominated by prominent alpha-helices. The entire core mass is a solid block of dark blue ribbons (>90 pLDDT), proving superb structural configuration.
CTP Region Structure (RecA CTP) & Colors: The N-terminal RecA CTP is clearly visible as an extended loop extending out from the bottom corner of the protein, colored mostly in orange (<50 pLDDT).
Secondary Structures within CTP: The RecA transit peptide exhibits a 100% disordered random coil conformation. There are no hidden alpha-helices or sheets. It acts as an open, loose string perfectly suited for interacting with the chloroplast envelope channels.
–> Design Verdict: PASSED ✅.
CoxG Fusion Monomer
Core Catalytic Domain Structure & Colors: The structural core of the maturation factor CoxG displays a dense alpha/beta mixed core domain. While the structural scaffolds are mapped in high-confidence dark blue (pLDDT > 90), the core contains a localized low-confidence loop region shaded in orange (pLDDT < 50). To verify that this orange pocket does not indicate structural failure, I executed a pairwise structural alignment isolating the core of my engineered CoxG Fusion against a native CoxG Alone control.
Alignment Metric Analysis: The quantitative alignment yielded a sequence identity of 97 % across 156 aligned residues, returning a global backbone RMSD = 1.6 Å and a highly reliable TM-score = 0.76. Because the TM-score sits well above the 0.50 structural biology threshold, both models are mathematically proven to share the exact same global structural topology.
Justification of Internal Core Flexibility: The minor coordinate displacement (RMSD = 1.6 Å) and unaligned residue window capture a native functional mechanism. As an accessory maturation chaperone, CoxG natively utilizes localized, flexible loop segments to bind and process its target enzyme partners. The orange patch you see inside the core is an intrinsically flexible docking loop. AlphaFold models this loop in alternative sweeping orientations when accommodating the added N-terminal RbcS CTP, confirming that the structural framework remains completely uncompromised.
CTP Region Structure & Colors (RbcS CTP): The N-terminal RbcS CTP spans outward as a long peripheral loop structure, colored primarily in bright orange (pLDDT < 50).
Secondary Structures within CTP: This CTP forms a completely unstructured random coil with no secondary structure elements (no helices or strands), meaning it remains highly flexible, dynamic, and solvent-exposed for transit channels.
–> Design Verdict: PASSED ✅. Control alignments mathematically validate that the core fold is conserved (TM-score = 0.76), and the internal core orange region is verified as a native, flexible chaperone loop.
Verification 2 — Is the Core Enzyme Domain Fold Preserved?
Objective & Methods
To verify that my engineered, codon-optimized plant-targeted fusions folded into their native, active bacterial conformations, I performed a high-resolution pairwise structural alignment. I compared each predicted monomer structure against the corresponding chain from the Oligotropha carboxidovorans gold-standard crystal structure (PDB: 1N5W) using the RCSB PDB alignment server.
To achieve this, I isolated the core catalytic domains of my models to bypass the unaligned, highly flexible synthetic additions (specifically the N-terminal chloroplast transit peptides (CTPs) and C-terminal purification tags) allowing the algorithm to evaluate the true functional enzyme scaffolds.
Results & Quantitative Metrics
The alignment yielded exceptionally strong quantitative validation metrics across all three structural blocks:
CoxL Subunit
An RMSD of 0.19 Å alongside a perfect global TM-score of 1.00 is a flawless mathematical result. This proves that out of the 809 total native residues, the 804 modeled positions share an identical structural topology with the native bacterial active fold. The engineered addition of my N-terminal RbcS CTP and C-terminal HA tag caused absolutely zero structural drift or conformational distortion within the mature catalytic scaffold.
CoxM Subunit
By achieving a global TM-score of 1.00 and a backbone trace deviation of just 0.17 Å across 287 out of 288 residues, the mature flavoprotein core is verified to be completely identical to the bacterial template. My added N-terminal Fer2 transit peptide sequence does not introduce any structural warps or constraints to the vital FAD-binding fold.
CoxS Subunit
This alignment provides an honest and highly refined math profile. A TM-score of 0.98 confirms that the global fold of the iron-sulfur subunit is completely conserved. The backbone RMSD stands at 0.87 Å, and the sequence identity registers at 99 % across 159 aligned residues. This slight variance is a predictable mathematical signature of my dual-ended terminal modifications (N-terminal RecA CTP and C-terminal FLAG tag).
Verification 3 — Is the Active Site Geometry of CoxL Preserved?
Objective & Methods
While global backbone alignments (Verification 2) verify macroscopic folding, true enzymatic function strictly depends on the micro-spatial positioning of active site side-chains. To prove that my plant-targeted, codon-optimized fusions preserve these crucial chemical environments, I executed a high-resolution, atom-by-atom visual audit using the Mol* molecular viewer.
For each subunit, I applied a two-tiered inspection method:
Macroscopic Volume Assessment (Cartoon Ribbon Presentation): Used to confirm that the secondary structure frameworks wrapping around the internal binding clefts remain uncollapsed and geometrically accommodating.
Microscopic Trajectory Assessment (Ball-and-Stick Presentation): Used to explicitly analyze side-chain rotamers, hydrogen-bonding networks, and backbone trajectories. I rendered my engineered variants’ residues and superimposed them directly onto the native bacterial template coordinates (PDB: 1N5W).
Note on Sequence Numbering: Due to the engineered addition of N-terminal chloroplast transit peptides (CTPs) required for organelle targeting, the amino acid coordinates in my custom fusions are shifted forward relative to the historical bacterial literature numbering:
CoxL: Shifted forward by exactly 56 residues (+56) due to the RbcS CTP.
CoxM: Shifted forward by exactly 52 residues (+52) due to the Fer2 CTP.
CoxS: Shifted forward by exactly 53 residues (+53) due to the RecA CTP.
Literature Context & Key Residues
According to foundational structural data (Schübel et al., 1995; Dobbek et al., 1999):
L Subunit (Molybdoprotein Subunit)
The massive CoxL subunit forms the catalytic heart of the carbon monoxide dehydrogenase complex. It coordinates the unique bimetallic molybdenum-copper [CuSMoO_2] cluster and a molybdopterin cytosine dinucleotide (MCD) cofactor:
Cys388L (S-selanylcysteine): This is a highly unusual modified residue where a selenium group is attached to the sulfur of Cys388. It is essential for the catalytic oxidation of CO, likely reacting with CO to form a selenocarbonyl species.
Gln240L: This highly conserved residue forms a hydrogen bond with the apical oxo-group of the molybdenum ion.
Glu763L: A conserved glutamate that is part of the molybdenum ion’s second coordination sphere, positioned trans to the apical oxo group.
Ala385L: The amide nitrogen of this residue helps stabilize selenium/selenocyanate through hydrogen bonding.
VAYRC388LSFR Loop: This sequence forms the active-site loop, which is unique to CO dehydrogenases and may be involved in substrate binding.
M Subunit (Flavoprotein Subunit)
The CoxM flavoprotein subunit binds a flavin adenine dinucleotide (FAD) cofactor to facilitate electron transport from the molybdenum center to downstream cellular acceptors:
Tyr193M: This residue is part of a “Q loop” and shields the isoalloxazine ring of FAD from the solvent, though the ring remains accessible from one side for potential hydride transfer.
FAD-Binding Motifs: Two conserved double-glycine motifs, 32MAGGHS36 and 111MTIGG114, interact with the pyrophosphate and adenosine portions of FAD.
Arg29, Pro30, Leu37, Ala102, Asn115, Asp124, Leu167, and Lys185: These residues are specifically identified as forming hydrogen bonds with different parts of the FAD cofactor.
Gly119M, Asn123M, and Ala156M: These residues cluster near the solvent-exposed side of the FAD and are thought to define the docking site for NAD+, as mutations in equivalent residues in other enzymes affect NAD+ affinity.
S Subunit (Iron-Sulfur Subunit)
The small CoxS subunit acts as an electronic wire, channeling electrons from the molybdenum active site in CoxL to the FAD cofactor in CoxM via two distinct iron-sulfur ([2Fe-2S]) clusters. Literature establishes that CoxS is split into two rigid functional domains:
Residues 3–76 (N-terminal domain): This domain binds the distal [2Fe–2S] cluster (FeS II), which is exposed to the solvent and mediates electron transfer from the proximal cluster to the FAD in the M subunit
Residues 77–161(C-terminal domain): This domain binds the proximal [2Fe–2S] cluster (FeS I), which is buried 11 Å below the surface at the interface with the L subunit to receive electrons from the molybdenum center.
CoxL Subunit Molybdoprotein Active Site Validation
The Catalytic Core Anchor (Cys-444L & Ala-441L)
VAYRC388LSFR Loop sequence forms the active-site loop, which is unique to CO dehydrogenases and may be involved in substrate binding, it includes two critical amino acides : Cys388L (S-selanylcysteine) and Ala385L:
Ball-and-Stick Analysis: Cys-444L is the single most critical residue in the enzyme, responsible for supplying the sulfur atom that binds directly to the active site Copper (Cu) atom. The atomic overlay shows that its side-chain thiol group projects along the exact same spatial vector as the native structure, ensuring the copper-coordination sphere remains perfectly intact. Additionally, the backbone amide nitrogen of Ala-441L aligns flawlessly, preserving the hydrogen bonding network necessary to stabilize the active site selenium intermediate.
Ball-and-Stick Analysis: This highly conserved glutamine forms an essential electrostatic shield, using its side-chain amide nitrogen to create a hydrogen bond with the apical oxo-group (M=O) of the molybdenum ion. The carboxamide functional group is perfectly rigidified in the active rotamer orientation, guaranteeing the pocket can accept and secure the molybdenum center without clashing.
Ball-and-Stick Analysis: Situated trans to the apical oxo group in the molybdenum ion’s second coordination sphere, Glu-819L must be positioned with extreme accuracy to help activate and deprotonate the incoming water molecule during CO oxidation. The atomic stick overlay shows that its terminal carboxylate group snaps approximately into position with no twisting or spatial displacement, preserving its chemical trajectory.
The plant-targeted, codon-optimized CoxL subunit is an exact spatial duplicate of the native Oligotropha carboxidovorans enzyme. The structural preservation proven macroscopically in Verification 2 holds true all the way down to individual chemical atoms in Verification 3. The addition of the N-terminal RbcS CTP and the C-terminal HA-tag induces no structural tension or side-chain displacement inside the catalytic core, ensuring that the engineered enzyme is fully capable of binding its cofactors and conducting chemical carbon monoxide oxidation.
In Verification 2, the global alignment of the CoxM flavoprotein subunit achieved a backbone trace matching down to a 0.17 Å RMSD. To verify that this structural preservation translates to biochemical functionality, we must confirm that the micro-spatial positioning of the FAD cofactor cage is maintained.
Ball-and-Stick Analysis: Tyr-245M plays a crucial gatekeeping role by shielding the reactive isoalloxazine ring of FAD from unwanted solvent interactions. The phenolic ring of this tyrosine shows excellent spatial overlay with no steric conflicts, preserving its native capacity to swing out slightly during hydride transfer pathways.
By switching to a ball-and-stick rendering, the engineered variant’s residues (rendered in light green) were compared directly to the native bacterial template (rendered in pink).
The Pyrophosphate-Binding Motif (AGGHS loop):
Residues Verified: Native 32MAGGHS36 on the M subunit Engineered 84MAGGHS88 (32 + 52).
Ball-and-Stick Analysis: This loop contains a highly conserved double-glycine fingerprint. Because glycine lacks a bulky side-chain, its backbone is highly flexible, allowing it to wrap closely around the charged pyrophosphate arm of the FAD molecule. The atomic overlay demonstrates a very similar match, ensuring that the main anchoring loop for the FAD center remains unwarped.
The Adenosine-Binding Motif (TIGG loop):
Residues Verified: Native 111TIGG114 on the M subunit Engineered 163TIGG166 (111 + 52).
Ball-and-Stick Analysis: This second double-glycine motif interacts precisely with the adenosine moiety of the FAD molecule to secure it inside the pocket. The light green custom model maps atom-for-atom onto the template, confirming that the structural pocket is fully capable of stabilizing the cofactor.
Ball-and-Stick Analysis: This extensive network of amino acids acts as the physical “glue” holding the massive FAD cofactor tail inside CoxM. As you can see in the screenshots, every single one of these light-green side-chains locks flawlessly onto the pink reference coordinates. Functional side-chain groups (like the basic guanidinium of Arg-81 and the acidic carboxylate of Asp-176) display no rotamer deviation, fully preserving the exact hydrogen-bonding distances needed to secure the cofactor.
Ball-and-Stick Analysis: These residues cluster together on the solvent-exposed side of CoxM, creating the physiological landing pad where mobile NAD+ molecules dock to receive electrons from FAD. The atomic models verify that this entire interface surface is pristine. By preserving this exact landscape, the plant-targeted complex remains fully optimized for downstream biochemical electron transfers without losing affinity for its co-substrates.
Subunit S Iron-Sulfur Subunit validation
Globally, when looking at the cartoon representations, the engineered variant’s ribbon layout (light green) matches the native bacterial template beautifully. Both the N-terminal domain (FeS II) and the C-terminal domain (FeS I) fold into their correct secondary structure orientations. This macroscopic overlay proves that the general physical envelope required to cradle the two vital [2Fe-2S] clusters is fully preserved.
Residues 3–76 (56-129) (the N-terminal domain)
Residues 77–161 (130-214) (The C-terminal domain)
However, when we zoom in to inspect the explicit amino acid trajectories using stick representations, we can find clear structural divergences in some specific amino acids at both the absolute N-terminus and C-terminus boundaries.
These local mismatches are predictable computational phenomena that do not compromise enzymatic function. The absolute terminal ends of CoxS directly border the engineered modifications: the RecA transit peptide junction at the N-terminus and the 9-amino-acid FLAG epitope tag at the C-terminus. Terminal tails are inherently highly dynamic, flexible “flapping tails” that lack fixed secondary structure constraints in monomeric predictions. While they adopt alternative loop paths in a relaxed fluid simulation, the core alpha-helices and beta-sheets holding the iron-sulfur clusters remain stable and unwarped.
Verification 4 — Complex Assembly and Interface Accessibility Analysis
Objective & method
To verify whether the engineered system correctly assembles into its expected functional macromolecular complex, I performed a full structural validation of the predicted heterohexameric enzyme. The goal was to confirm that all engineered subunits properly assemble without disrupting native-like interaction networks, and that chloroplast targeting sequences and fusion modifications do not interfere with oligomerization.
Instead of analyzing isolated subunits, the full biological assembly was evaluated as a complete six-chain heterohexameric complex predicted by AlphaFold Multimer.
System Architecture (Hexameric Model)
The modeled system corresponds to a functional symmetric heterohexamer composed of two trimeric units:
Chain A, B → CoxL subunits (L)
Chain C, D → CoxM subunits (M)
Chain E, F → CoxS subunits (S)
This defines a complete (LMS)₂ assembly, representing two identical trimeric functional units forming a higher-order oligomer.
Global Structural Validation (AlphaFold Multimer)
The full six-chain complex was first evaluated using AlphaFold Multimer prediction.
The model shows: A stable and symmetric heterohexameric assembly with proper organization of all six subunits. The model displayed well-defined packing between the functional chains, indicating that the proteins assemble correctly into the expected complex. The Predicted Aligned Error (PAE) analysis revealed low-error values at the different interfaces, supporting a high level of confidence in the inter-chain interactions and overall oligomeric arrangement. No signs of chain dissociation, structural deformation, or collapse were observed in the predicted structure. In addition, the chloroplast transit peptides were oriented outward toward solvent-exposed regions and remained separated from the structural core, indicating that the introduced targeting sequences do not interfere with protein folding or complex assembly.
These results confirm that the global architecture is structurally consistent with a functional oligomeric enzyme.
To identify all possible atomic interactions without bias toward predefined interfaces, I used a fully unrestricted contact-scan approach in PyMOL.
Instead of selecting specific interfaces manually, the script:
Scanned all atoms in every chain
Calculated all inter-chain distances within a 4.0 Å cutoff
Automatically classified interactions based on residue chemistry: Hydrophobic contacts, Polar interactions / hydrogen bonds, Salt bridges, General atomic contacts.
This approach ensured an unbiased, global detection of all physically relevant interfaces across the full hexamer.
Although all possible chain combinations were allowed in the script (A–B–C–D–E–F), the analysis naturally converged into only four physically meaningful interaction networks, indicating that only specific interfaces are structurally stable and biologically relevant:
A–C Interface (CoxL ↔ CoxM core interaction)
CoxL (Chain A) and CoxM (Chain C) form a strong central interface where both proteins are tightly packed together and build the structural core of the trimer.
This interface is stabilized by different types of interactions, including salt bridges, hydrogen bonds, and hydrophobic contacts. The residues listed below are examples taken from the full interaction set identified in PyMOL (not the complete list):
Salt bridge: ASP725(A) <–> ARG329(C) | 3.58 Å
Polar/H-bond: THR728(A) <–> TYR318(C) | 3.48 Å
Salt bridge: ASP786(A) <–> ARG240(C) | 3.74 Å
Contact: GLU794(A) <–> ILE242(C) | 3.61 Å
These interactions show that CoxL and CoxM are strongly connected through a combination of electrostatic attraction and hydrophobic packing, which stabilizes the core structure of each trimer unit.
A–E Interface (CoxL ↔ CoxS interaction)
CoxS (Chain E), the smaller functional subunit, interacts with CoxL on the external surface of the complex. This interface ensures that CoxS is properly anchored and positioned for its functional role.
The residues shown below are representative examples from the full set of interactions detected in PyMOL (not exhaustive):
Salt bridge: ASP99(A) <–> ARG83(E) | 3.54 Å
Contact: TYR183(A) <–> HIS80(E) | 3.93 Å
Polar/H-bond: ARG357(A) <–> GLY94(E) | 3.02 Å
Contact: PRO790(A) <–> TYR195(E) | 3.73 Å
These interactions confirm that CoxS is firmly attached to the main complex and is not loosely associated or freely moving.
CoxM (Chain C) and CoxS (Chain E) form additional stabilizing interactions that reinforce the outer structure of each trimer unit.
The interactions below are examples selected from the complete interaction network detected by PyMOL (not the full list):
Contact: PRO55(C) <–> ARG75(E) | 3.52 Å
Salt bridge: LYS94(C) <–> ASP96(E) | 3.35 Å
Salt bridge: ASP155(C) <–> LYS113(E) | 3.96 Å
Contact: GLN157(C) <–> ASN188(E) | 3.67 Å
These interactions indicate that the outer surface of the trimer is stabilized by multiple weak and strong forces working together.
A–B Interface (CoxL ↔ CoxL dimerization axis)
This interface represents the central dimerization boundary where two trimeric units assemble into the full hexameric structure. The interaction is highly symmetric and indicates a strong and specific docking interface.
The residues shown below are examples from the full symmetric interaction network identified in PyMOL (not exhaustive):
Contact : GLY558(A) <–> ASN690(B) | 3.64 Å
Contact : TYR619(A) <–> TYR689(B) | 3.70 Å
Salt bridge : LYS642(A) <–> GLU697(B) | 3.18 Å
Polar/H-bond : ASN704(A) <–> GLU697(B) | 3.25 Å
These interactions are further stabilized by nearby charged residues, including ASP605 and ASP606, which contribute to the electrostatic stability of the interface.
This confirms that the two trimer halves assemble in a highly specific and symmetric manner, forming a stable functional hexamer.
I used the Gemini AI tool to interpret the structural results and to predict how these specific CTP modifications and AA junctions influence protein folding, stability, and chloroplast targeting efficiency. while ChatGPT was employed for technical editing, ensuring the documentation was clear, concise, and grammatically precise.
Objective:
The objective of this verification step was to evaluate whether the engineered fusion subunits retained their ability to correctly assemble into the complete functional enzyme complex after the addition of chloroplast transit peptides (CTPs) and purification tags. Instead of predicting only the CoxL–CoxM–CoxS trimer, I modeled the entire (LMS)2 heterohexameric complex using AlphaFold 3 in order to perform a more realistic structural validation of the final engineered system.
This analysis aimed to verify that all modified subunits still formed stable inter-chain interactions comparable to the native enzyme architecture, while also confirming that the added CTP regions remained solvent-exposed and spatially separated from the subunit–subunit interaction interfaces. In addition, this step was used to assess whether the native assembly surfaces between CoxL, CoxM, and CoxS remained structurally accessible and unaffected by the engineered modifications, ensuring that the final enzyme complex could theoretically self-assemble correctly inside the chloroplast environment.
Sources:
Dobbek, H., Gremer, L., Meyer, O., & Huber, R. (1999). Crystal structure and mechanism of CO dehydrogenase, a molybdo iron-sulfur flavoprotein containing S-selanylcysteine. Proceedings of the National Academy of Sciences, 96(16), 8884-8889.
Schübel, U., Kraut, M., Mörsdorf, G., & Meyer, O. (1995). Molecular characterization of the gene cluster coxMSL encoding the molybdenum-containing carbon monoxide dehydrogenase of Oligotropha carboxidovorans. Journal of bacteriology, 177(8), 2197–2203. https://doi.org/10.1128/jb.177.8.2197-2203.1995
Phase 10: CTP-GFP Reporter Constructs Design
Golden Gate Assembly of Reporter Constructs:
Golden Gate Assembly Design Strategy
To enable modular Golden Gate Assembly, all fragments were flanked with BsaI recognition sites and custom-designed overhangs. These overhangs were selected to guide the ordered assembly of the fragments into the pCAMBIA1300 backbone after digestion.
The same assembly architecture was used for all three constructs, with the only difference being the CTP sequence.
The pCAMBIA1300 vector was linearized using XbaI digestion. The last four nucleotides remaining from the digested vector (“TCCT”) were directly incorporated as the assembly scar between the vector backbone and the FMV promoter fragment.
This strategy avoided unnecessary sequence modifications and maintained compatibility with the Golden Gate assembly design.
Promoter–Enhancer Junction (TACT)
A custom “TACT” overhang was designed between the FMV promoter and the AMV RNA4 enhancer.
This sequence functioned as a neutral assembly scar that allowed directional ligation while preserving the integrity of both regulatory elements.
Enhancer–CTP Junction (AATG)
The “AATG” overhang was designed between the AMV enhancer and the chloroplast transit peptide (CTP) sequence.
This overhang was selected because it contains the ATG start codon required for translation initiation. The design therefore allowed the translational start site to be incorporated directly into the assembly junction while preserving the correct reading frame.
CTP–eGFP Junction (GCTA)
The junction between the CTP coding sequence and eGFP was designed carefully to preserve the open reading frame and avoid frameshift mutations.
Because this junction connected two coding sequences, the overhang was designed using:
“GCT” from the last codon of the CTP sequence
“A” from the ATG start codon of eGFP
Together, these nucleotides formed the “GCTA” overhang.
For the RbcS chloroplast transit peptide construct, the last two alanine codons were simply rearranged by switching: GCT↔GCG
Because both codons encode alanine, this modification did not alter the amino acid sequence of the transit peptide. The change was performed only to expose the required “GCT” sequence needed for the Golden Gate Assembly overhang at the CTP–eGFP junction while preserving the correct reading frame and maintaining the native peptide composition.
This strategy allowed the translational reading frame to remain continuous across the fusion protein while minimizing unnecessary amino acid changes.
The reading frame continuity was verified during sequence design, as represented by the “|” positions in the coding sequences.
eGFP–Terminator Junction (CGCT)
For the junction between eGFP and the tE9 terminator, the “CGCT” overhang was designed.
In this case:
“GCT” originated from the beginning of the terminator-associated region
An additional “C” nucleotide was added to complete the 4 bp overhang
This overhang was added at the end of the eGFP fragment after the stop codon, ensuring proper assembly without affecting the translated protein sequence.
Golden Gate Assembly of Reporter Constructs in Benchling
First, I opened Benchling and clicked on the Create (+) button from the left sidebar. From the cloning options, I selected “Assemble DNA sequences by cloning”, then chose the Golden Gate Assembly workflow. This opened the assembly interface where all cloning parameters were configured.
For the assembly settings, I selected the destination project folder dedicated to the reporter constructs. Since the final products were designed as plasmids, I set the construct topology to Circular. I then selected Golden Gate Assembly as the cloning method and specified BsaI as the Type IIS restriction enzyme used for assembly.
Next, I imported all DNA fragments in their correct assembly order. The fragments included:
Linearized pCAMBIA1300 backbone
FMV promoter
AMV RNA4 enhancer
Chloroplast transit peptide (RbcS, Fer2, or RecA depending on the construct)
eGFP reporter gene
tE9 terminator
After importing all fragments, Benchling automatically analyzed the BsaI digestion products and checked the compatibility of all adjacent overhangs. When all overhangs matched correctly and fragment orientation was valid, Benchling generated a complete circular assembly product corresponding to the final reporter plasmid.
I then clicked the “Assemble” button to generate the final constructs.
Benchling created three independent circular plasmid sequences corresponding to:
Finally, I opened the resulting plasmid maps to verify construct integrity. I carefully checked that all annotations were preserved correctly across the assembled plasmids, including promoters, enhancers, transit peptides, coding sequences, and terminators. I also verified that all junctions were seamless, that the reading frame remained continuous across fusion regions, and that no inversions, missing fragments, or unintended mutations were introduced during the assembly simulation.
Objective
The objective of this step was to design three plant expression constructs that could be efficiently assembled into circular plasmids using the Golden Gate Assembly (GGA) method. All three constructs were designed with the same regulatory and reporter elements, while only the chloroplast transit peptide (CTP) sequence was changed in order assess the correct localization of the three engineered ctp sequences using a GFP reporter and confocal microscopy. The final constructs were designed as follows:
Each construct was assembled using BsaI-mediated Golden Gate cloning with specifically designed 4 bp overhangs to ensure correct orientation and seamless ligation between adjacent fragments.


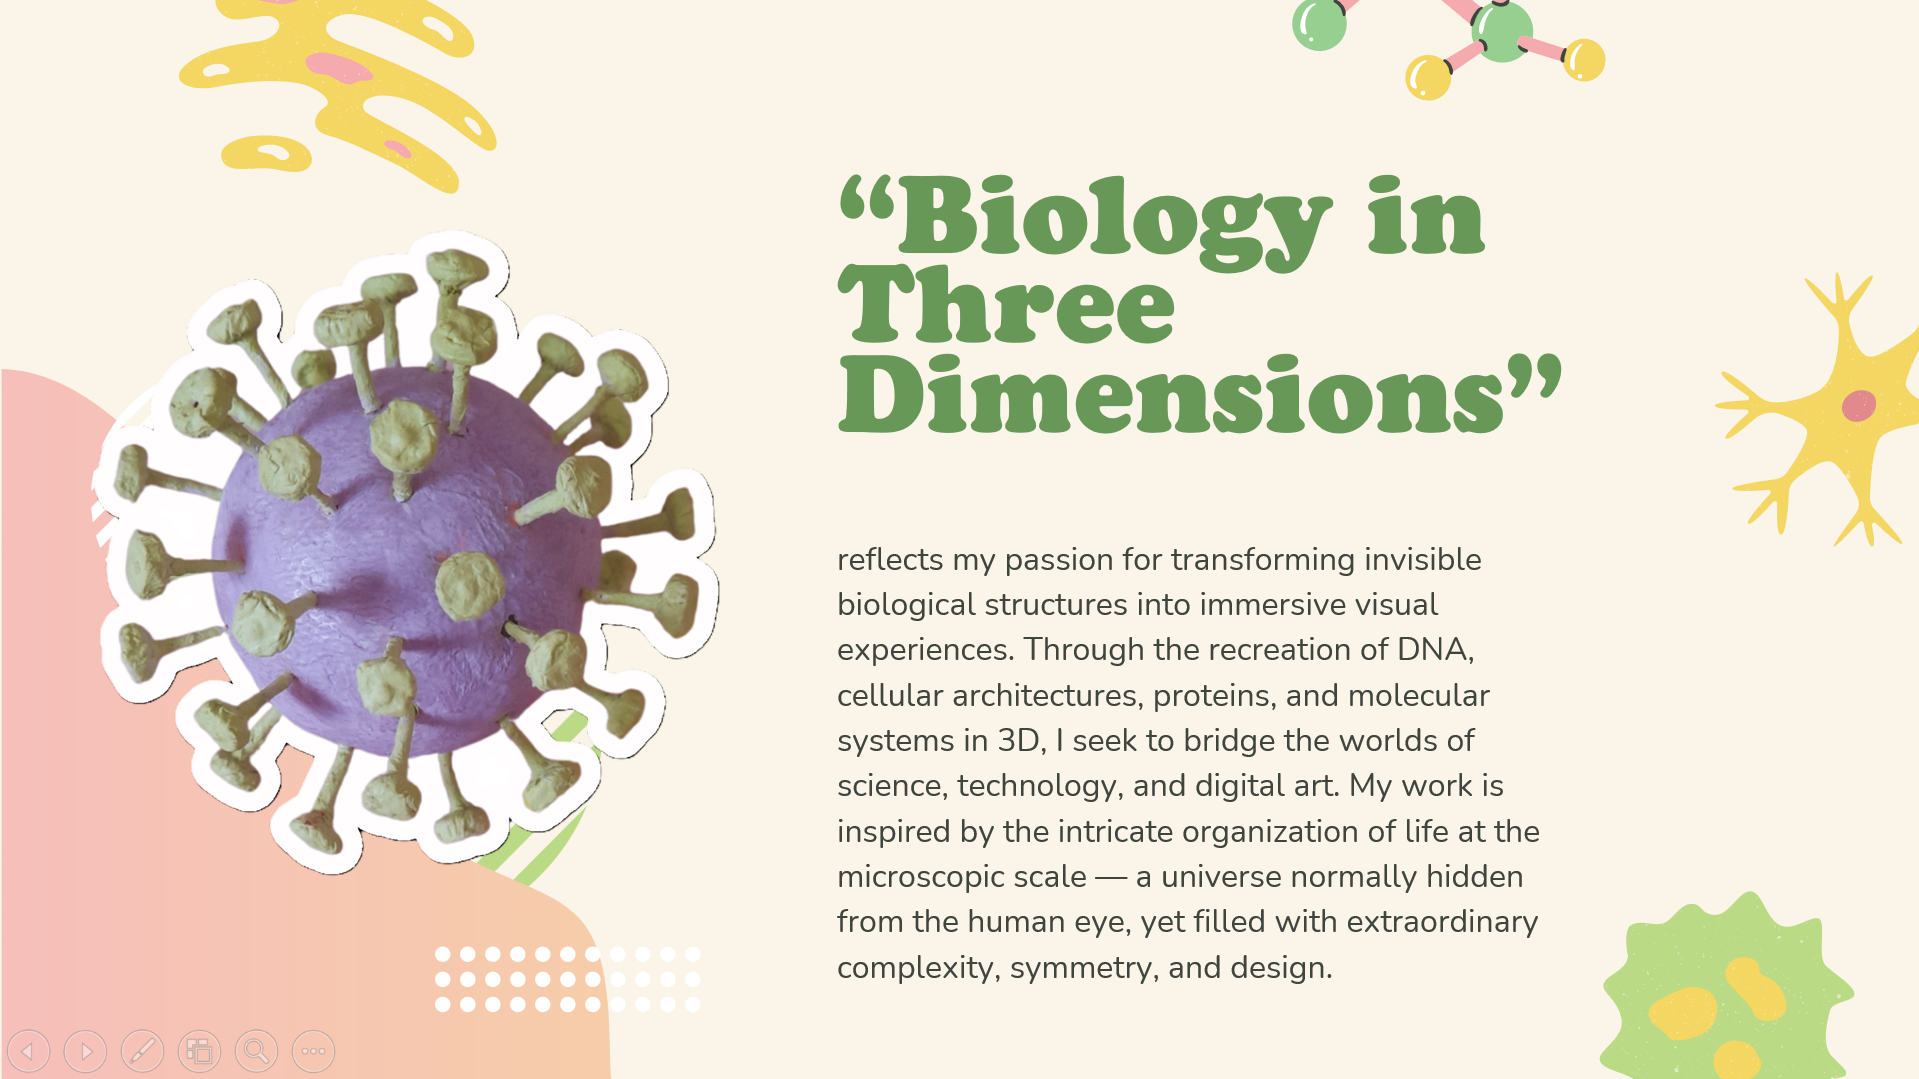
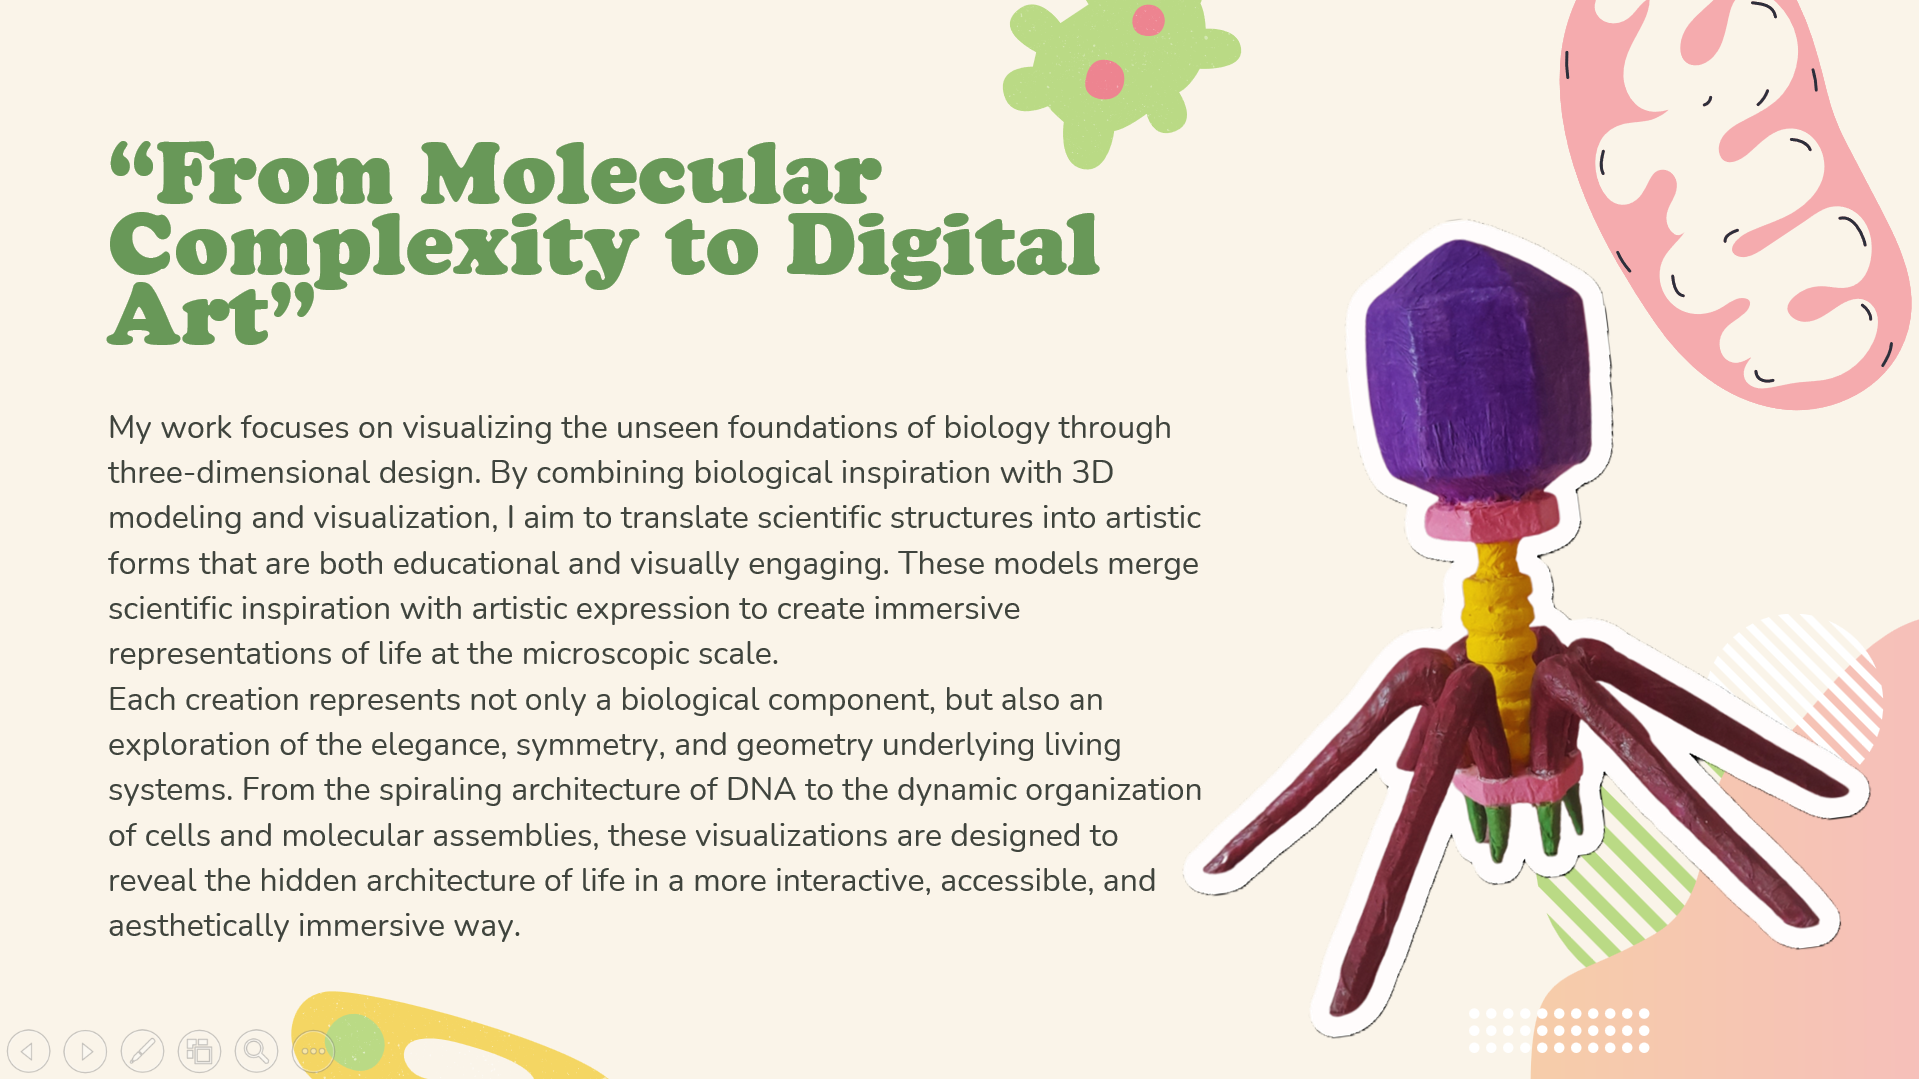
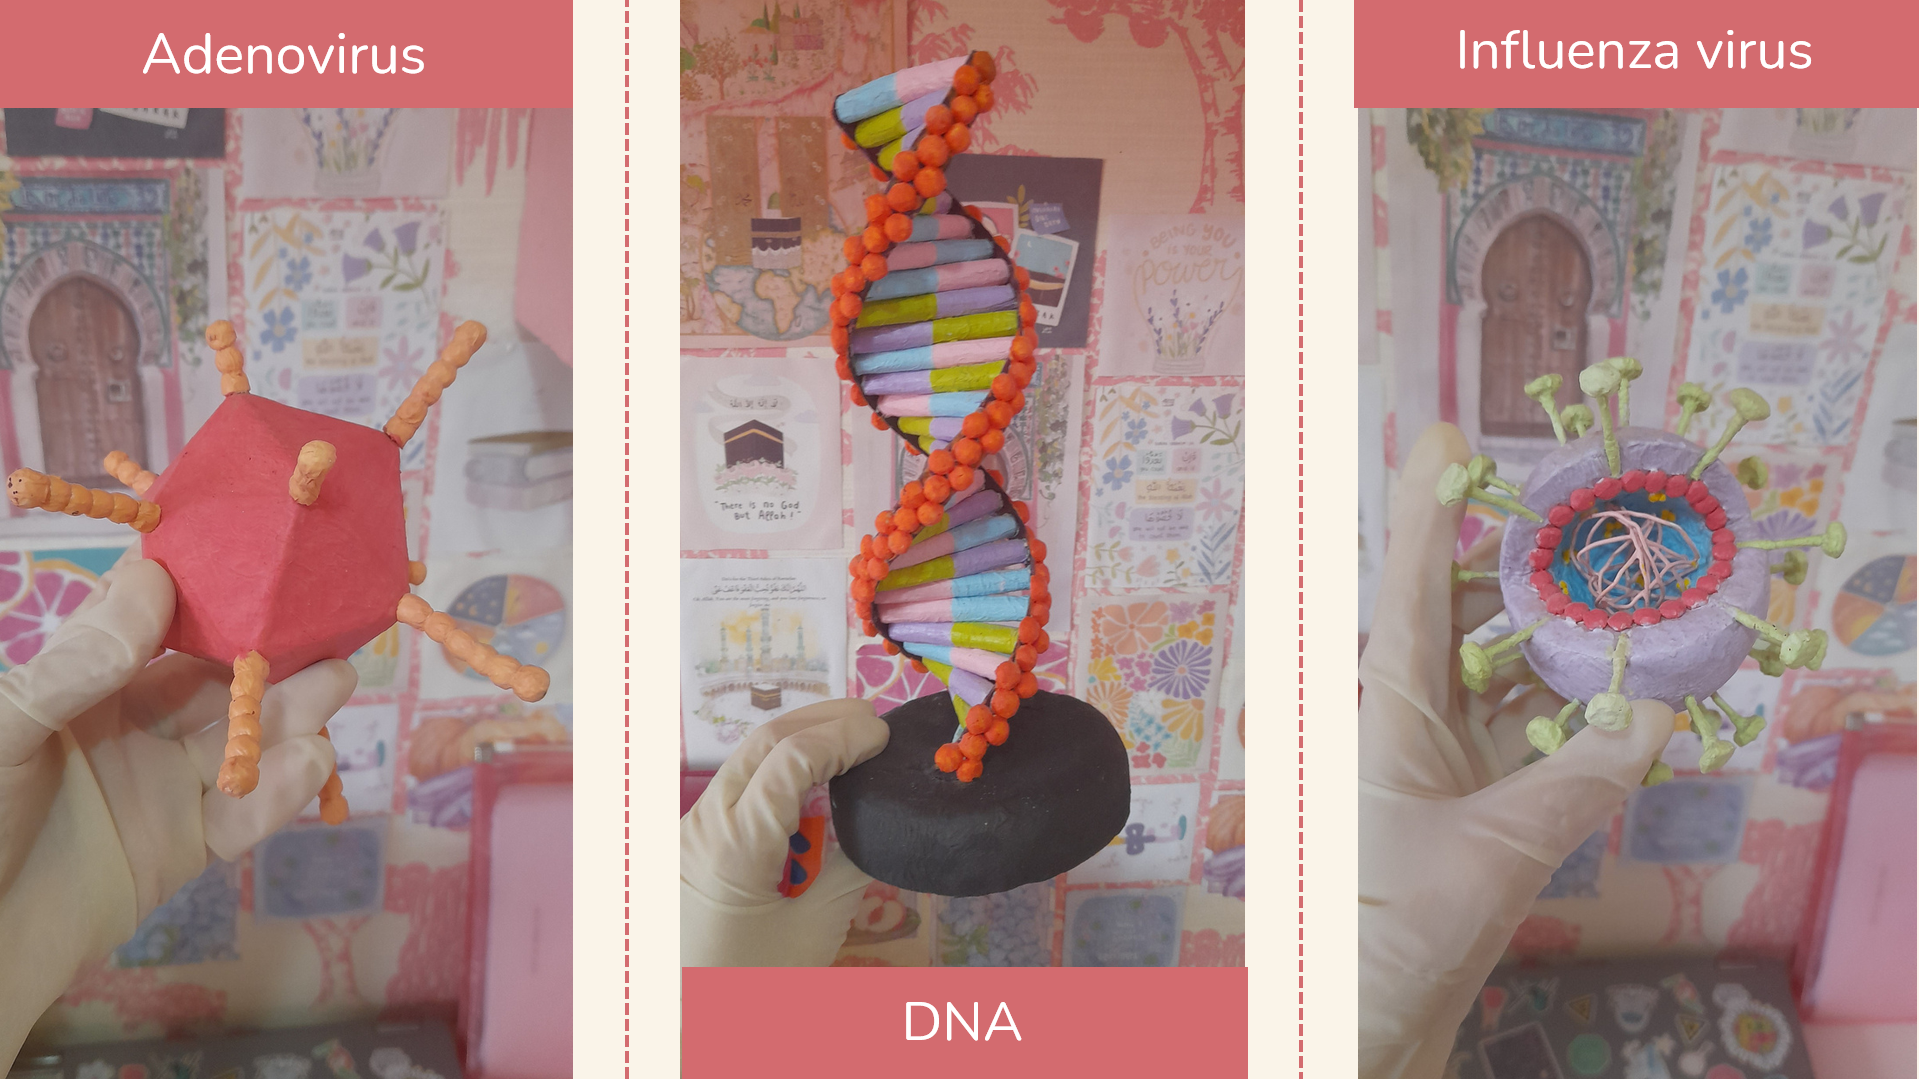

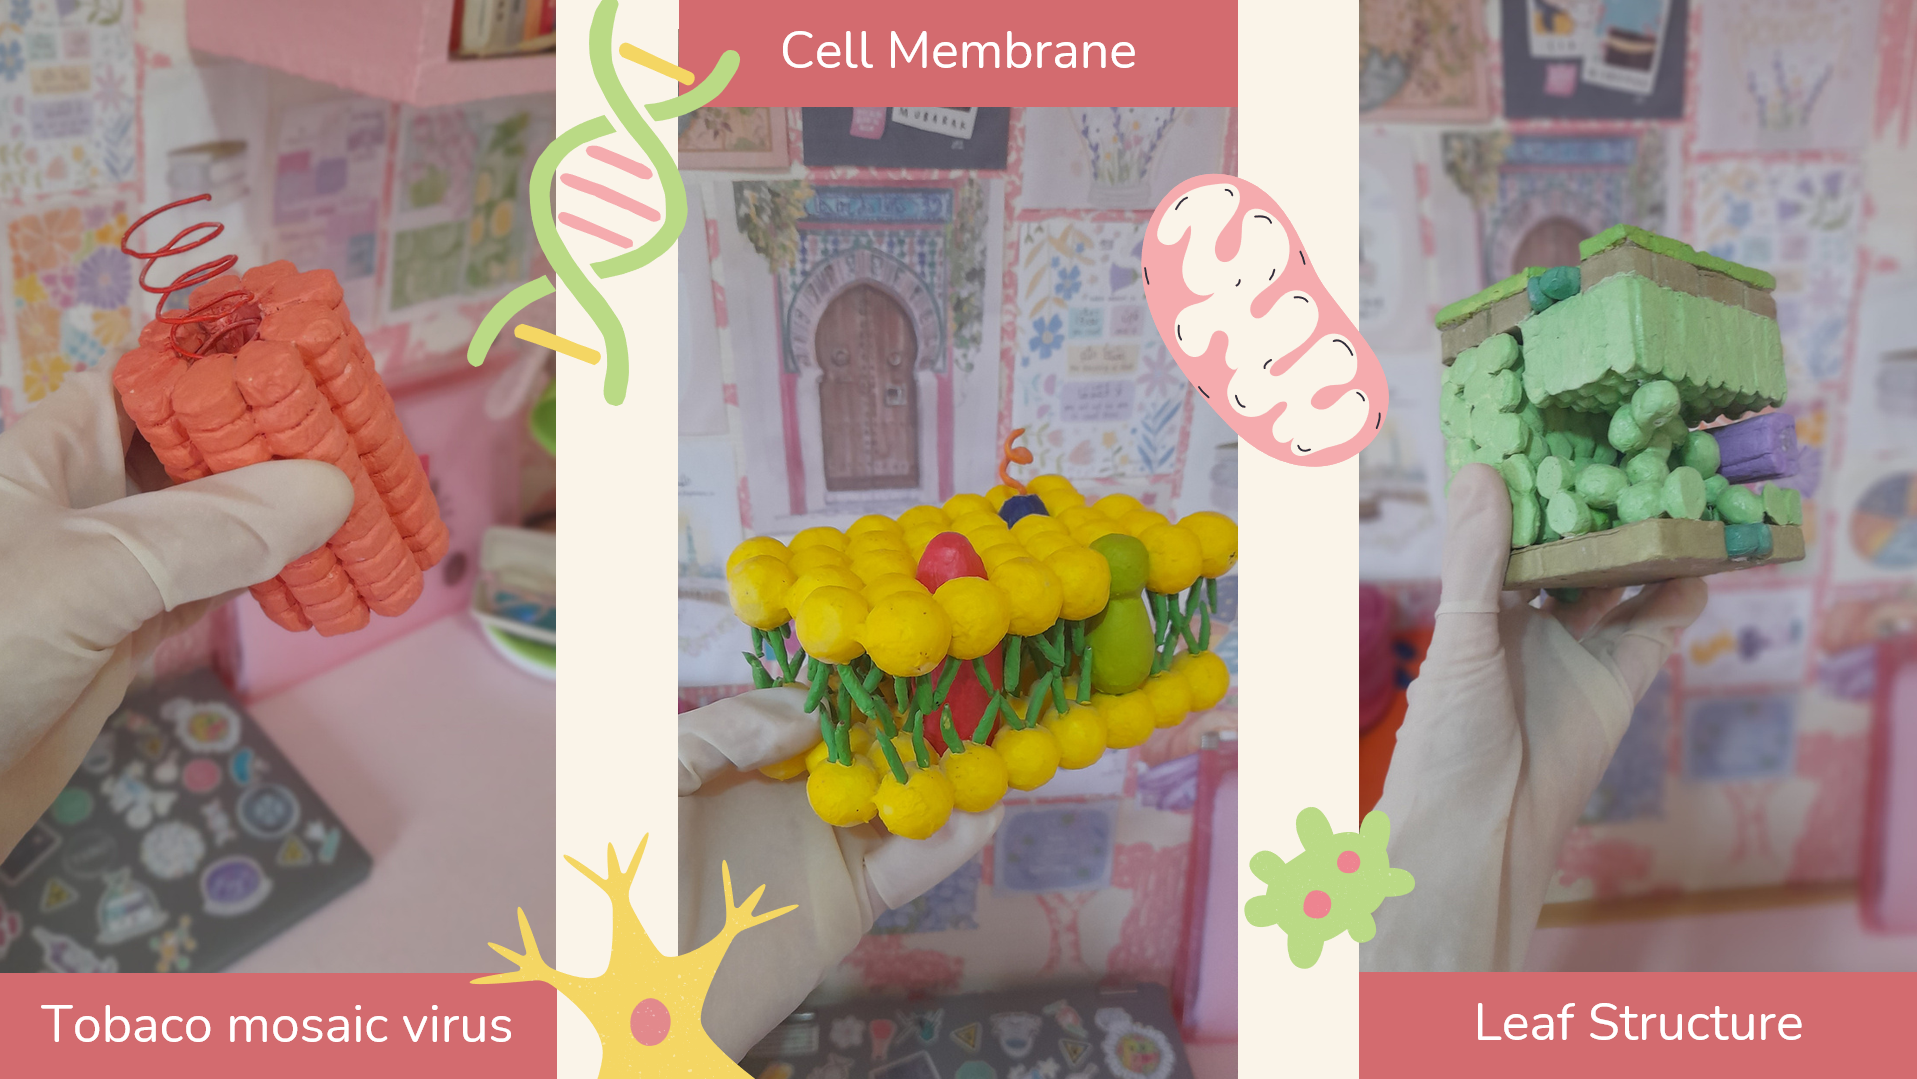


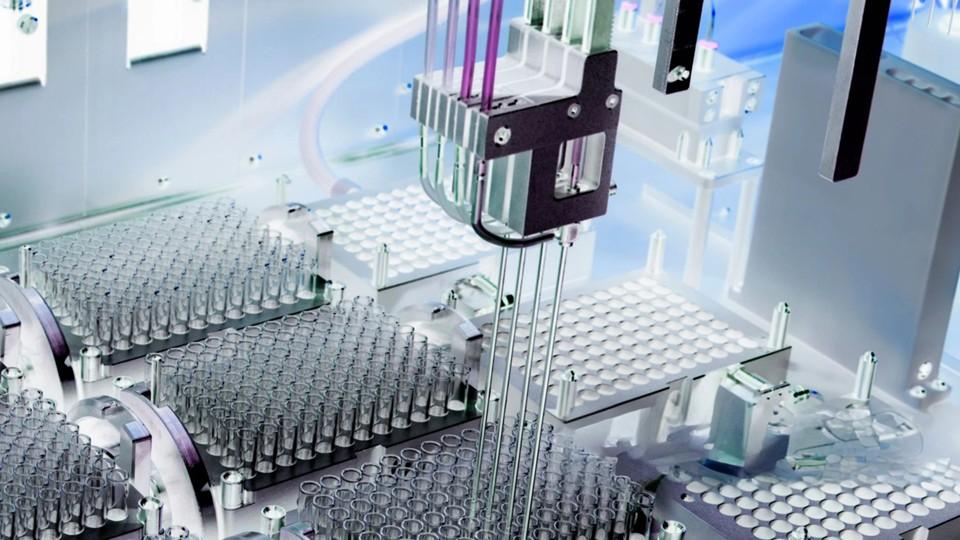
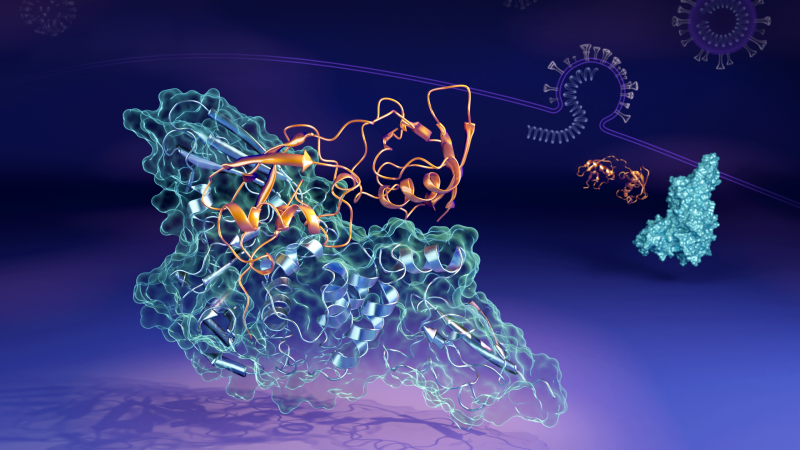
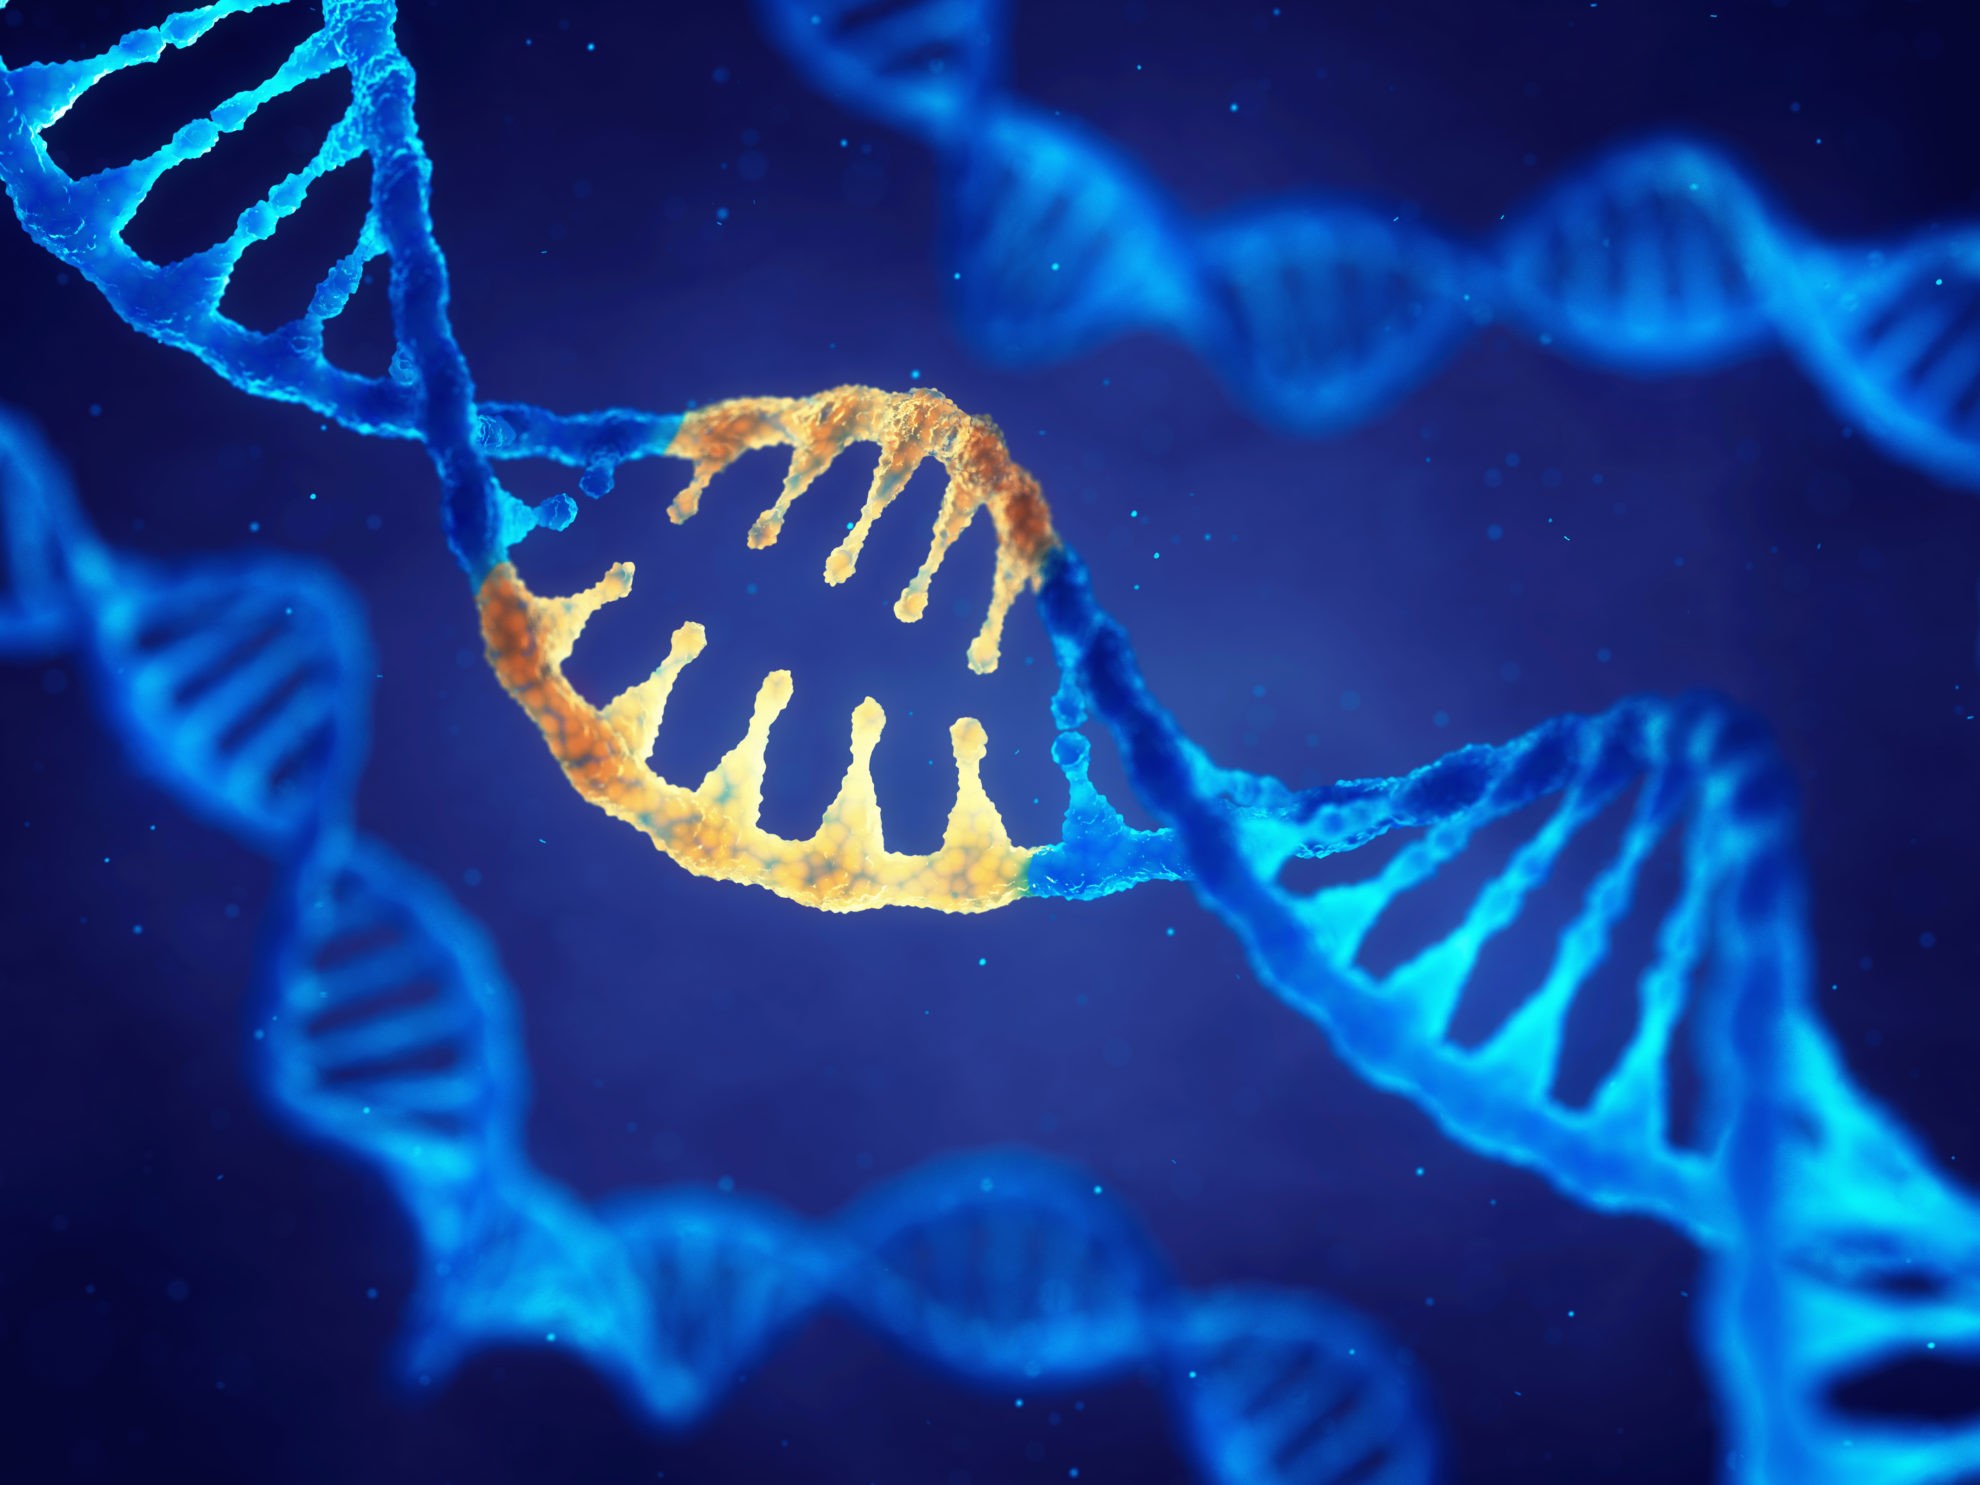


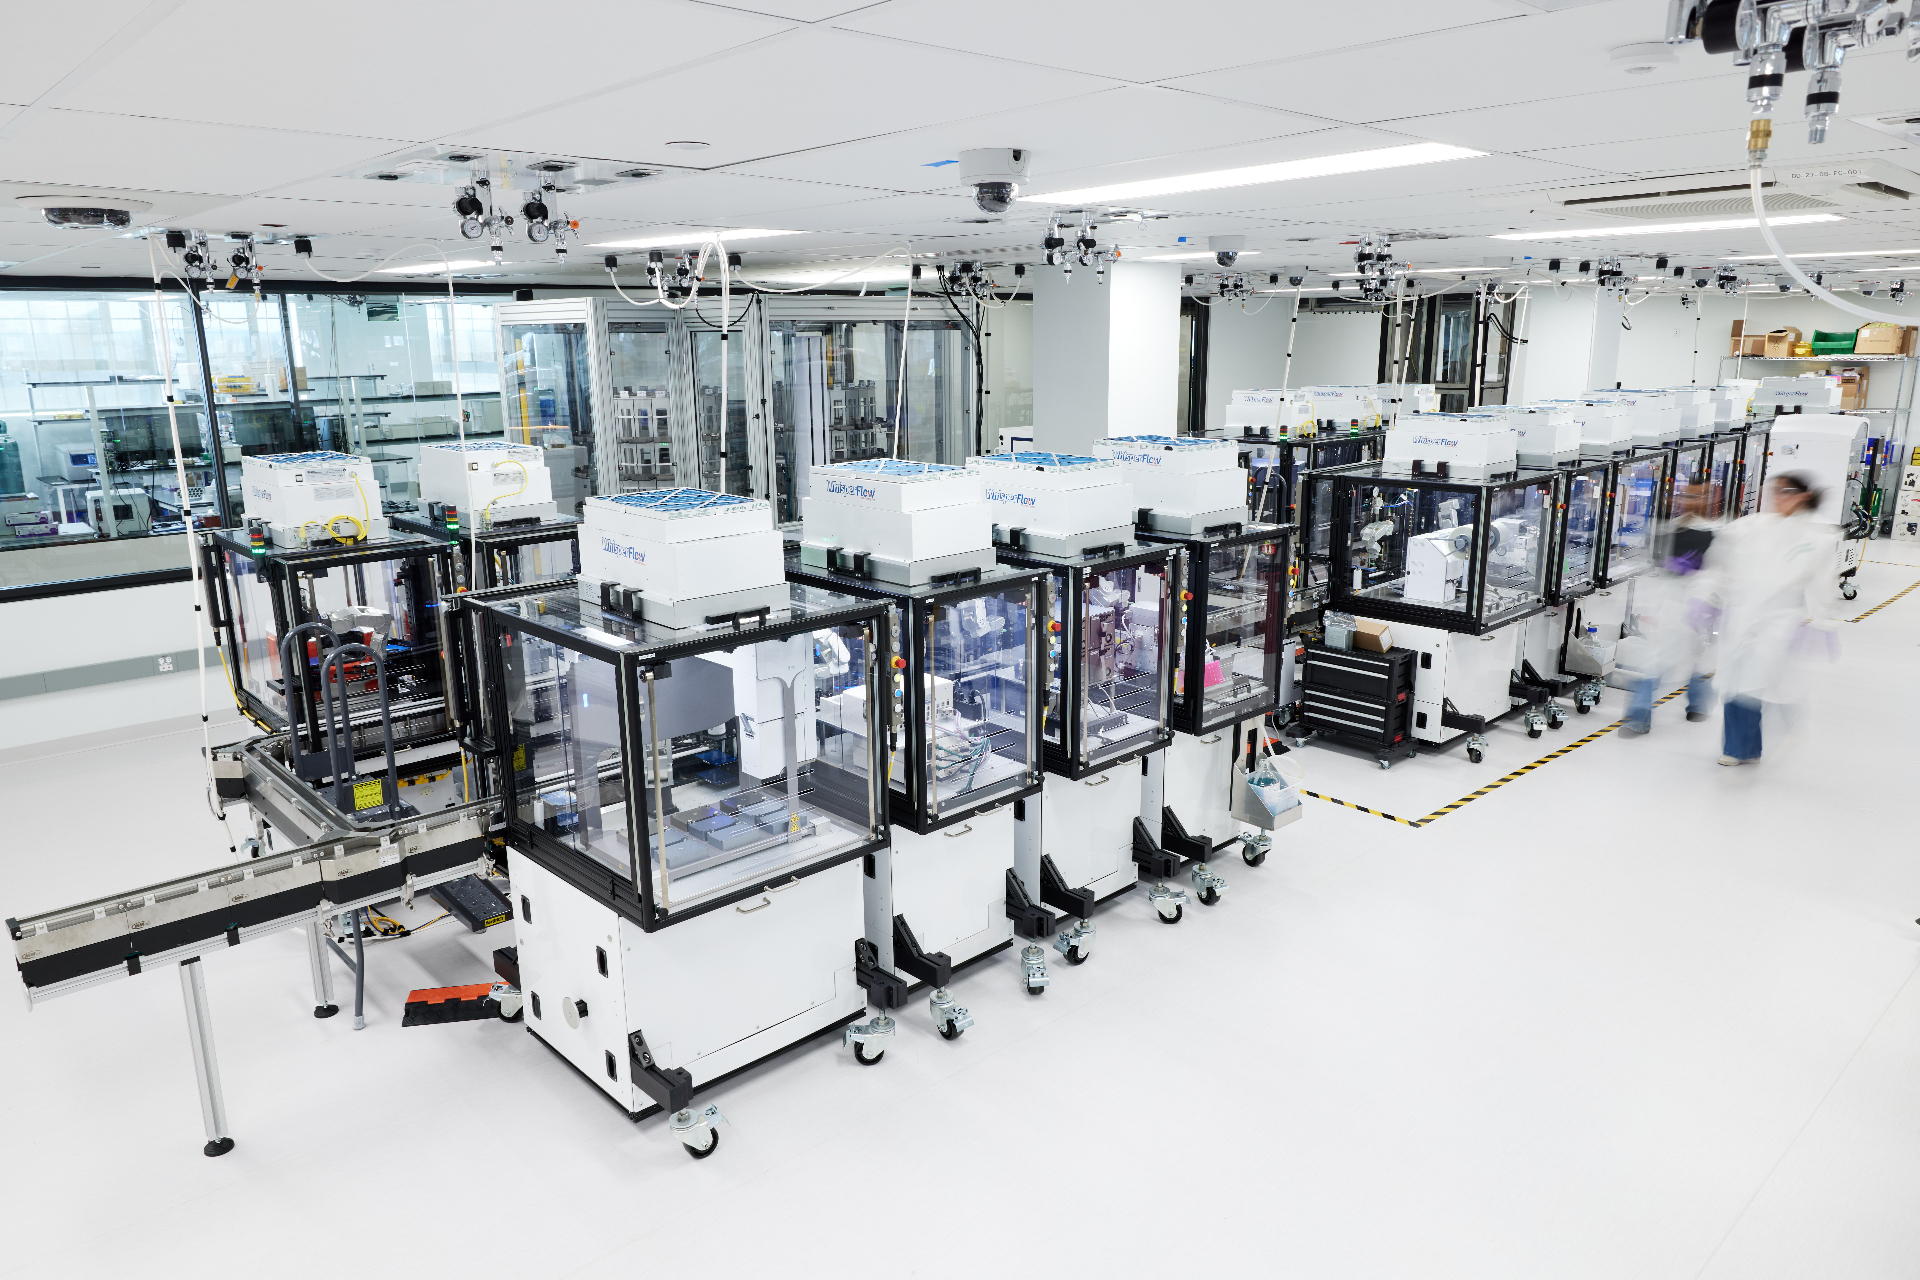


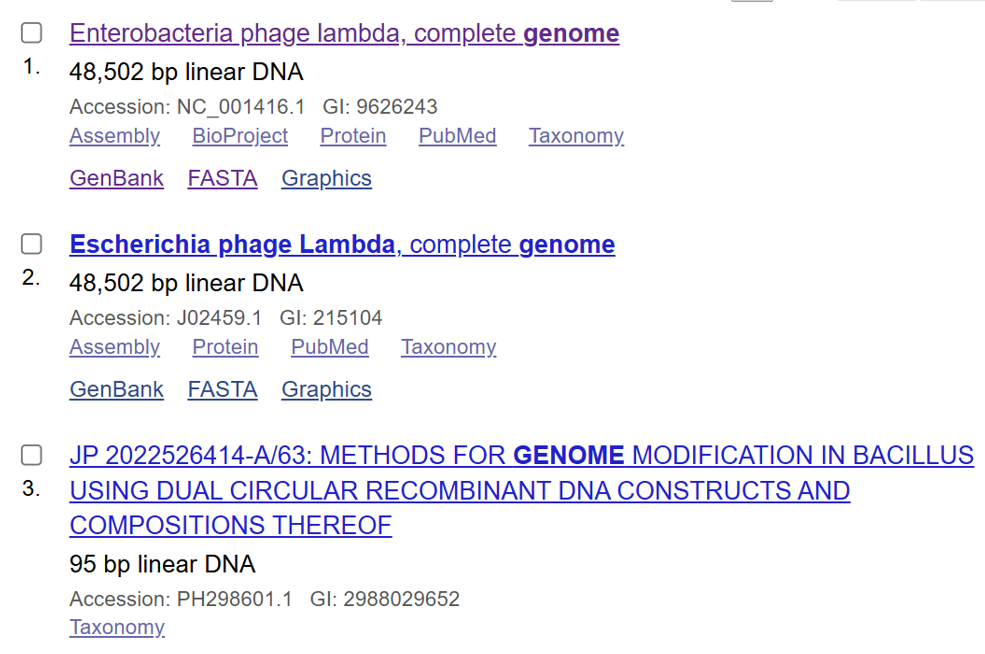
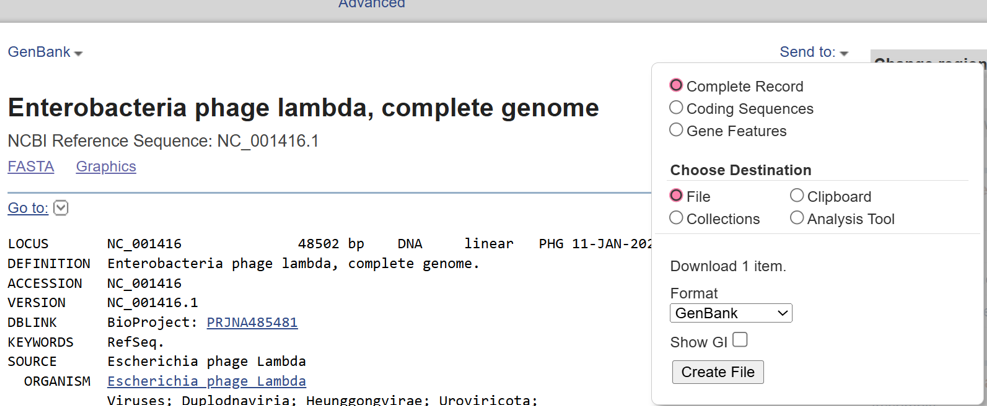

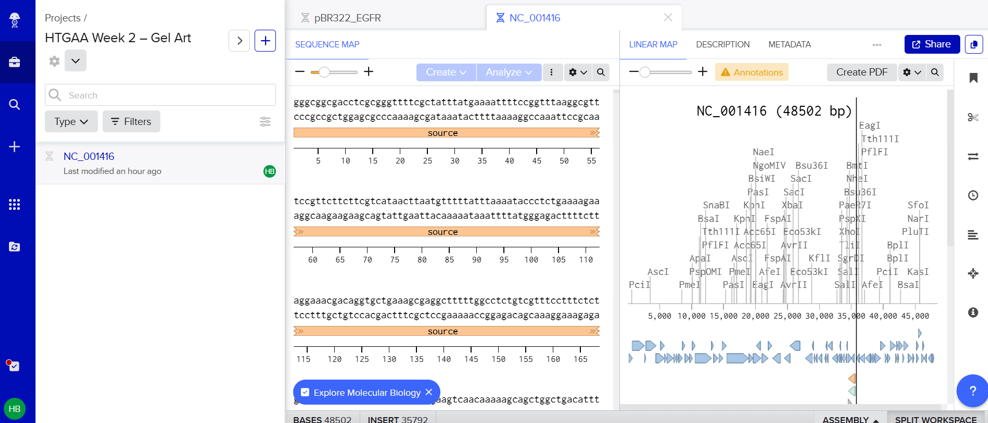
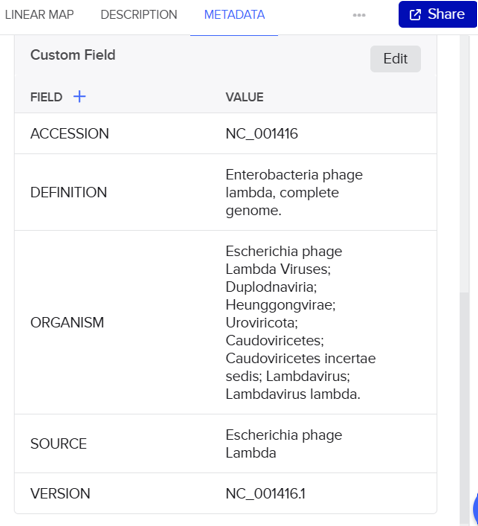
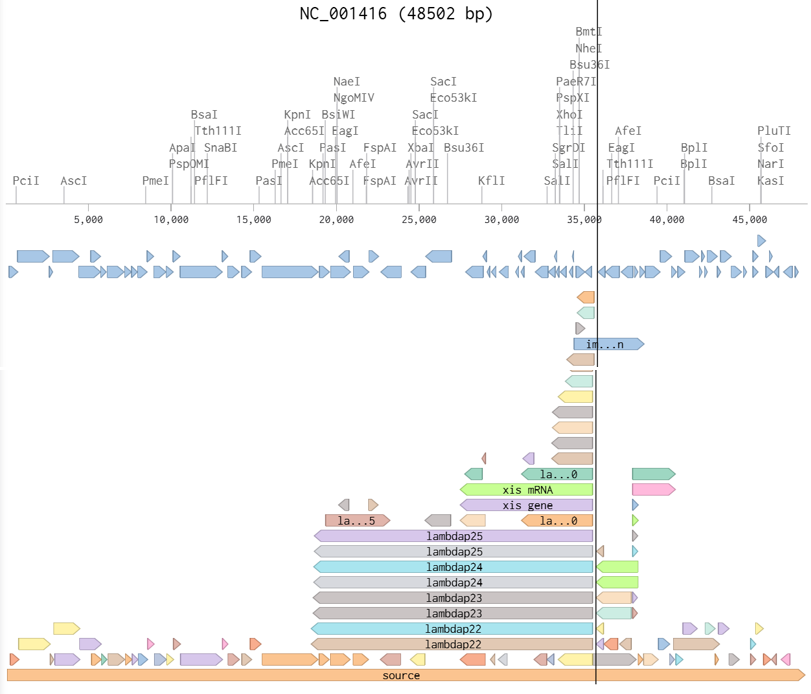
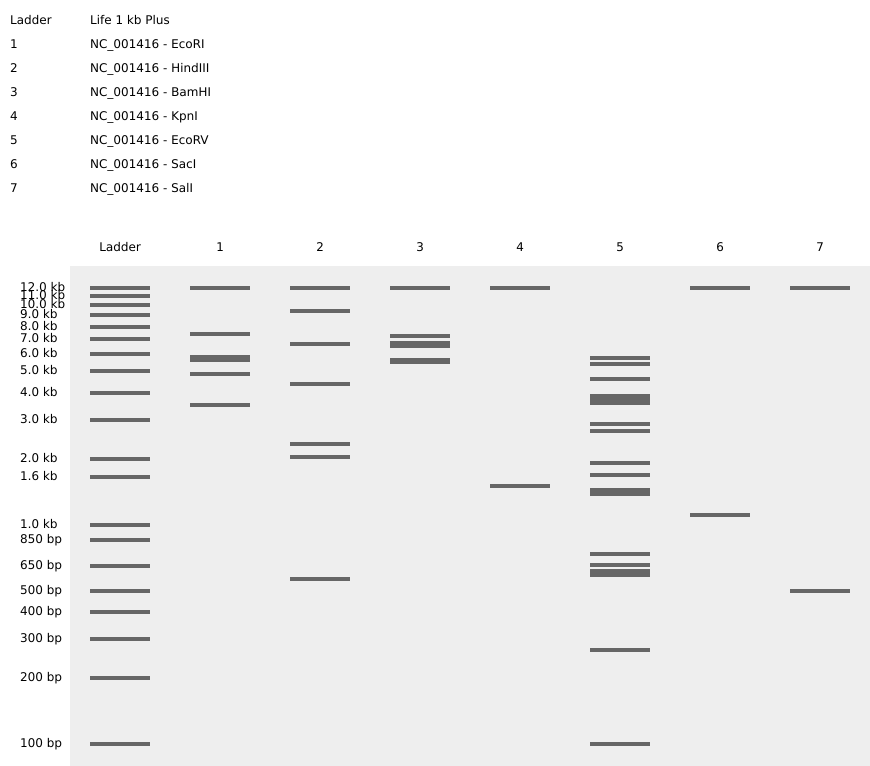

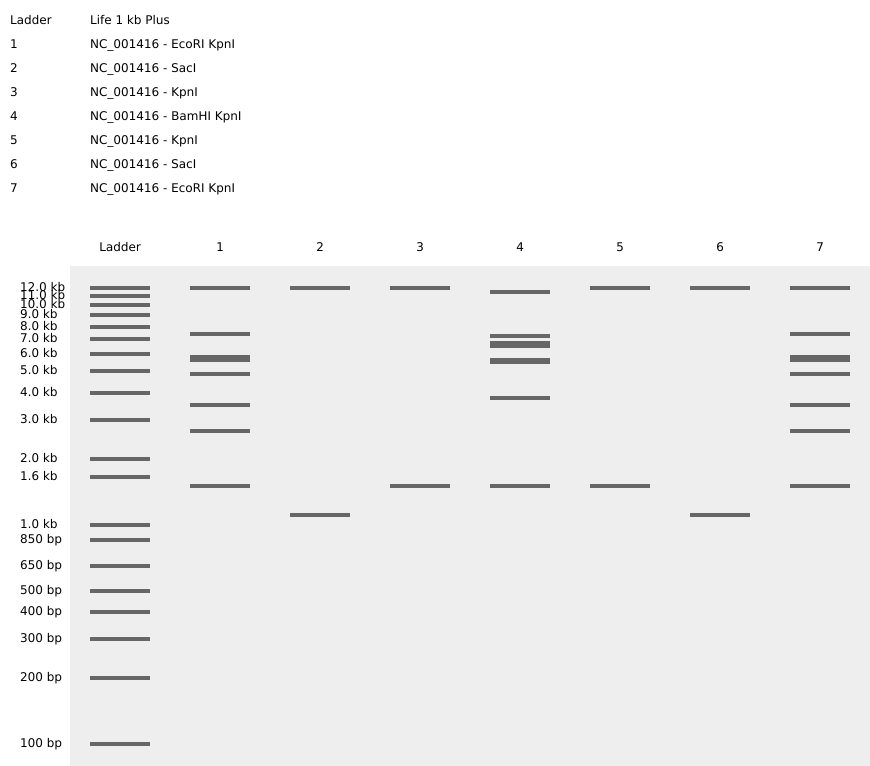
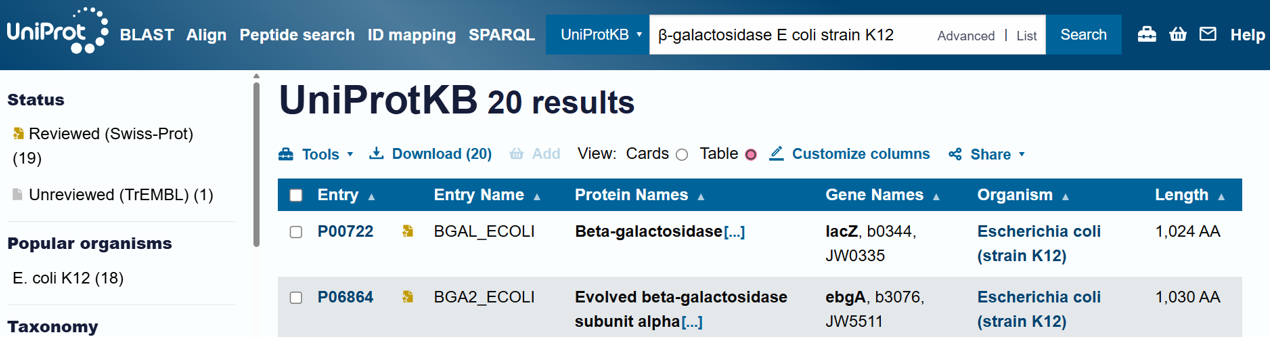
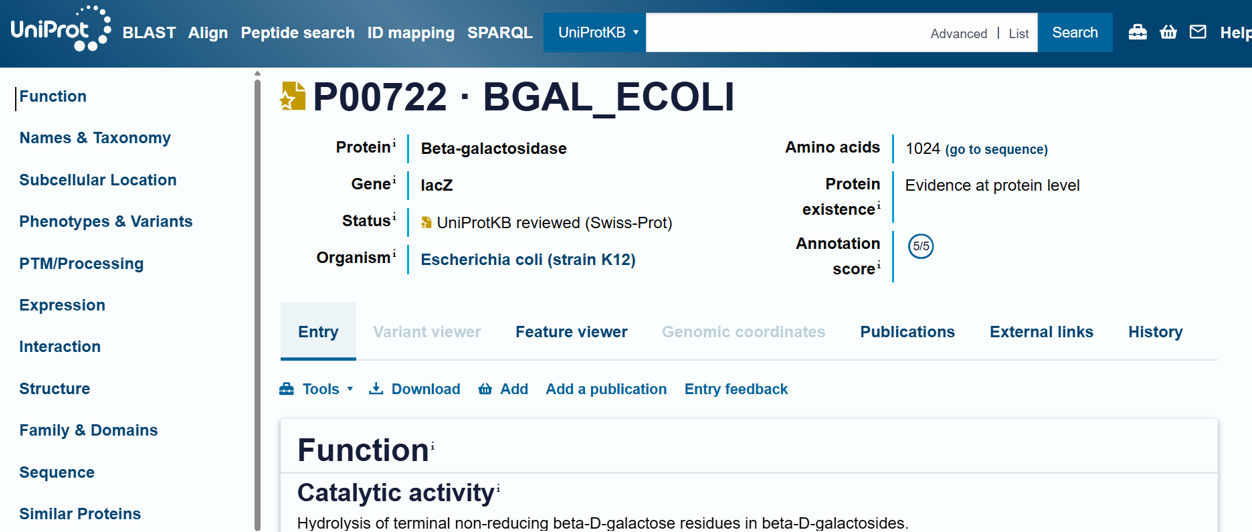
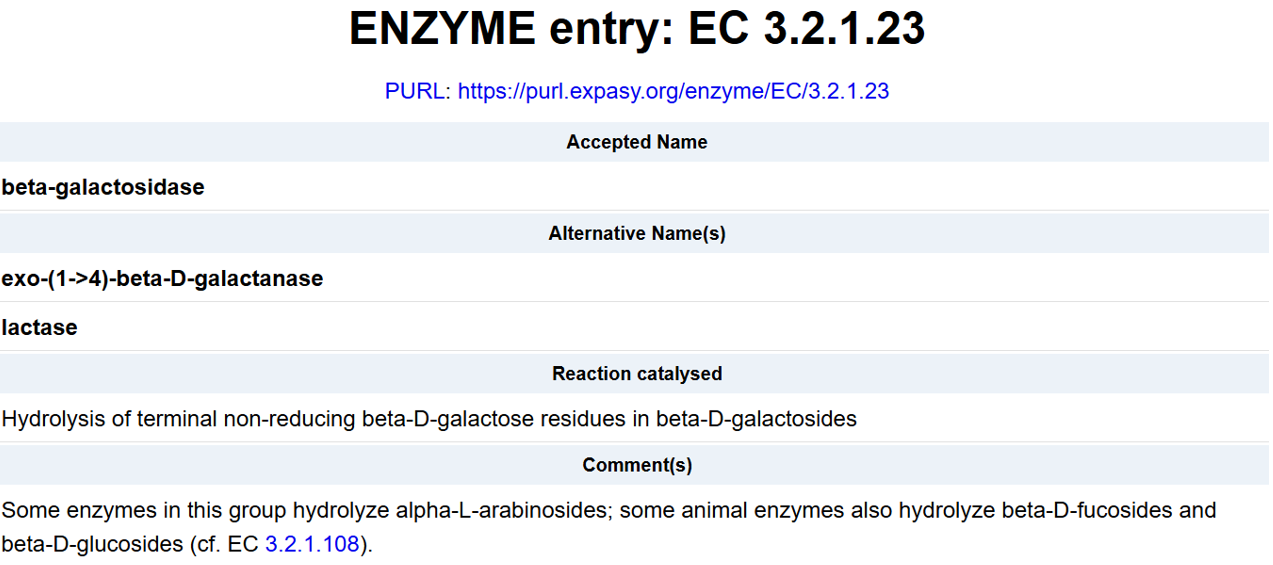
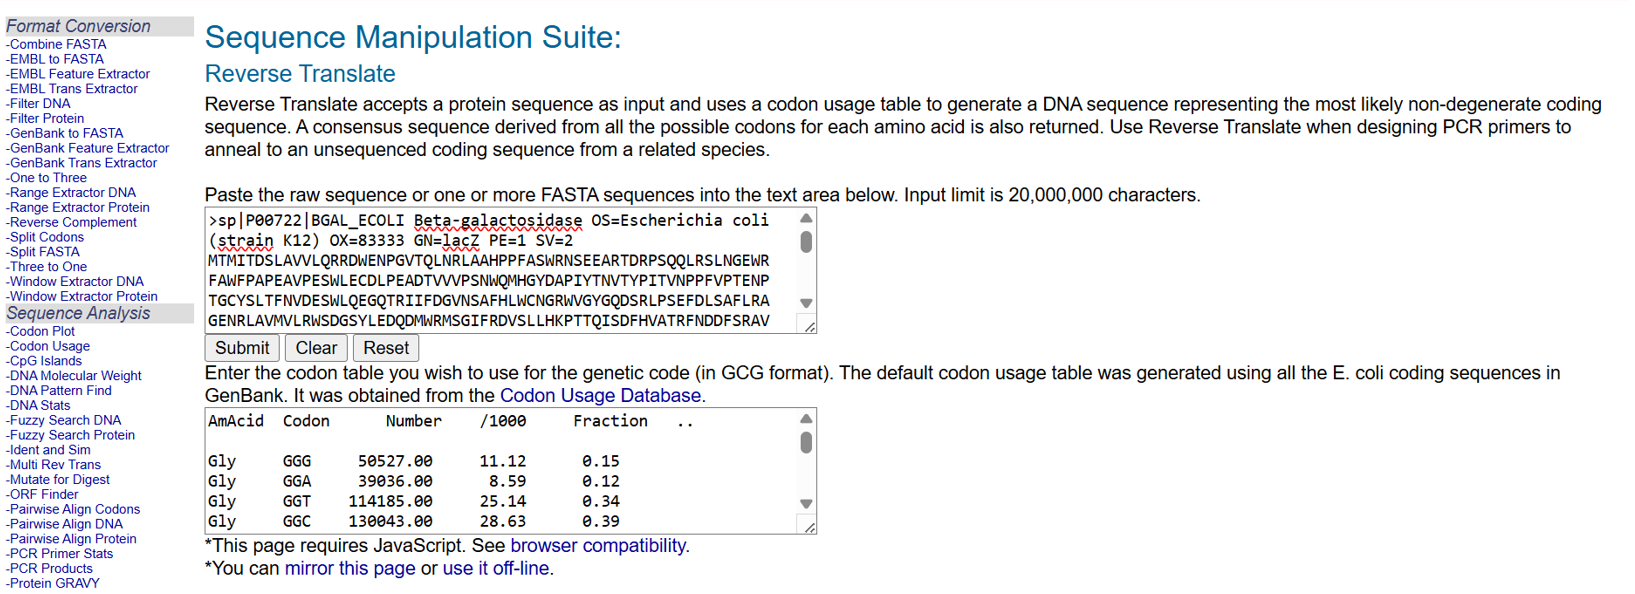

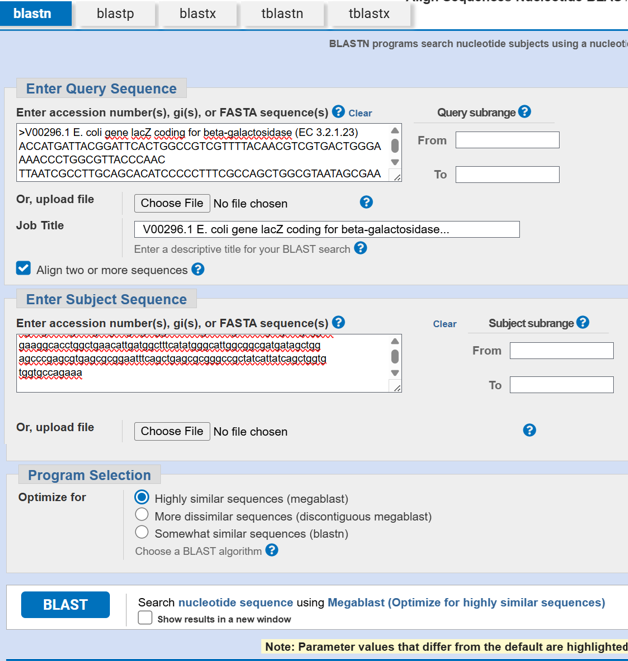

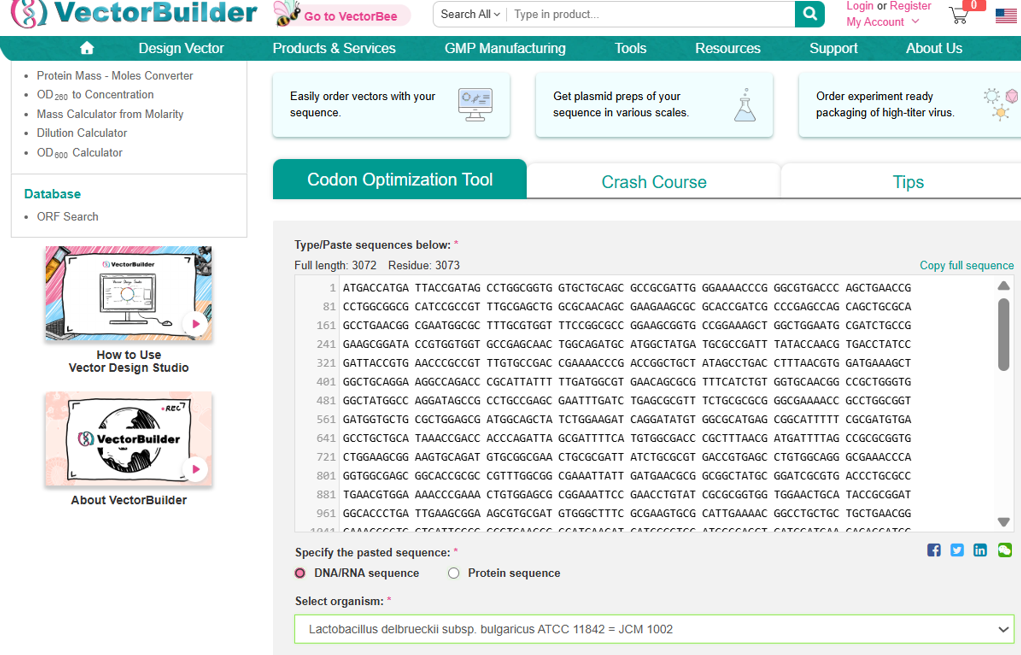
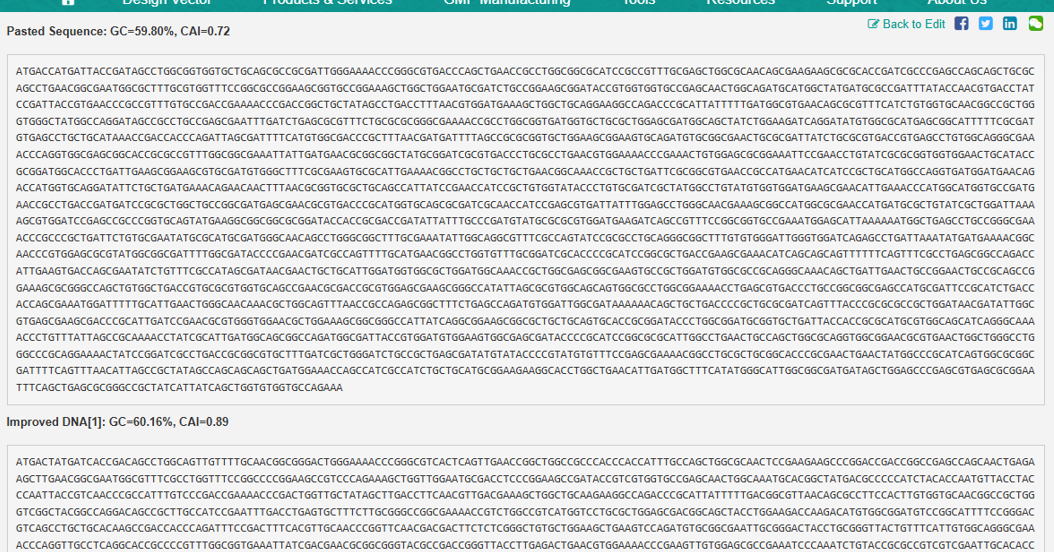

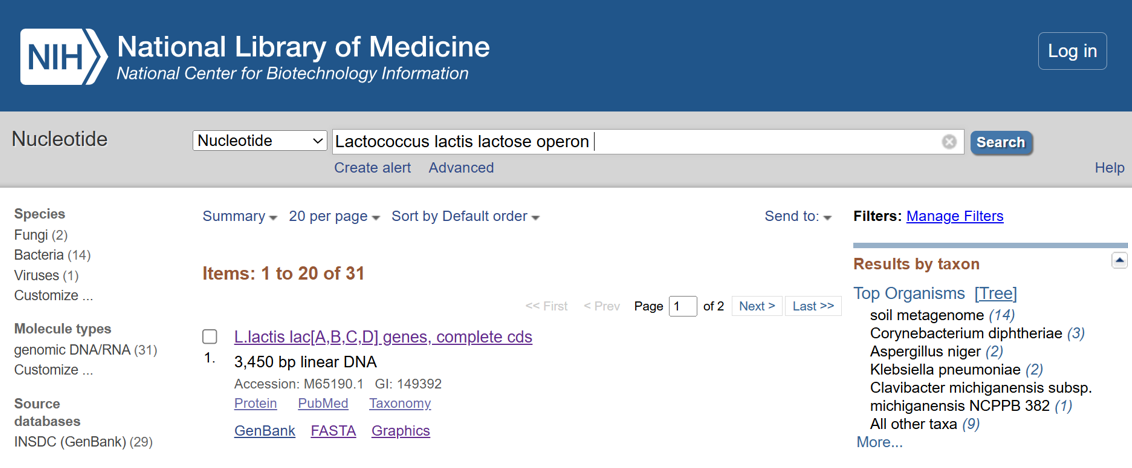
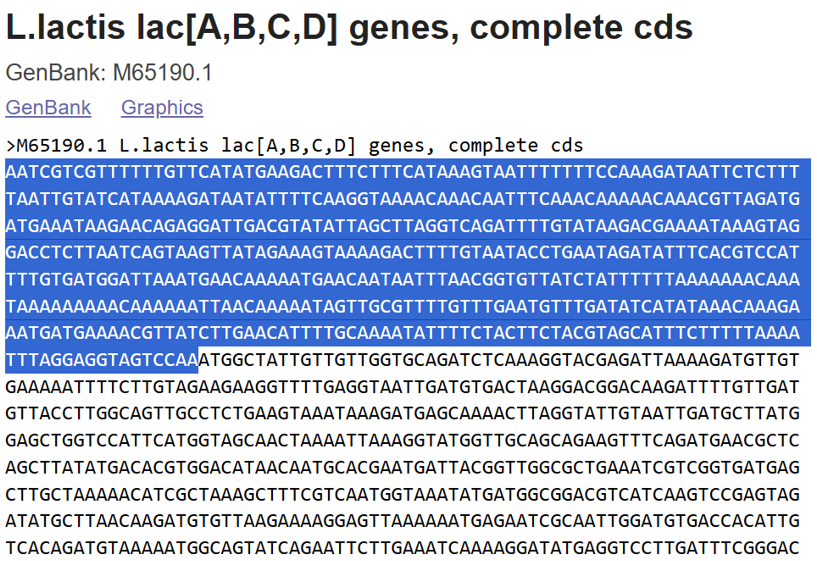
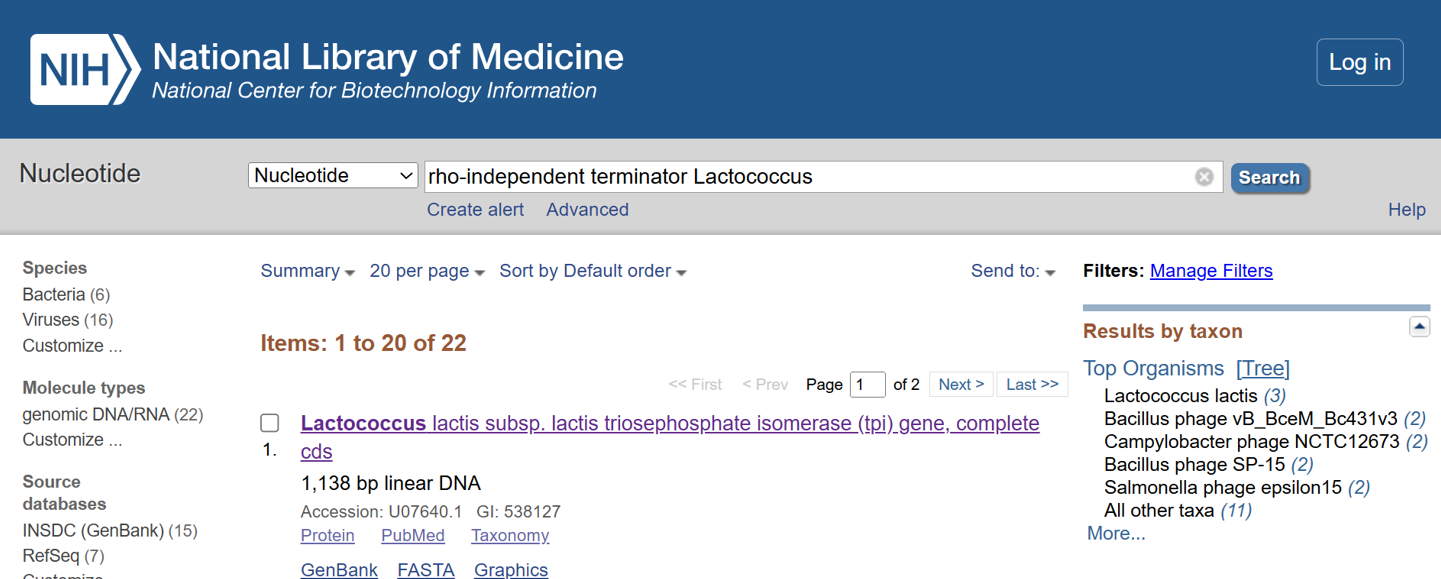
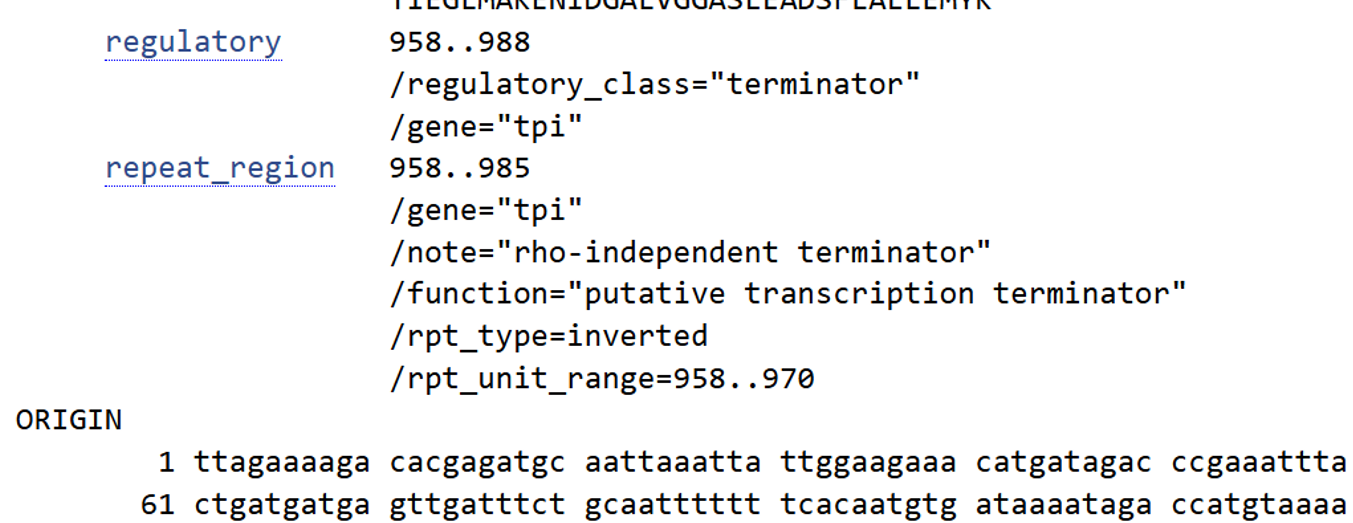
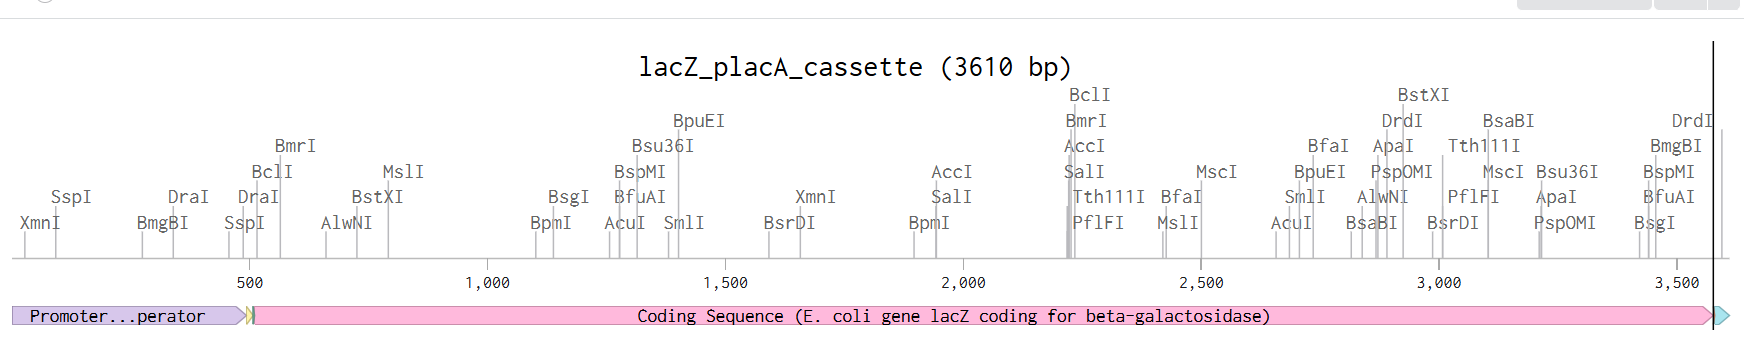
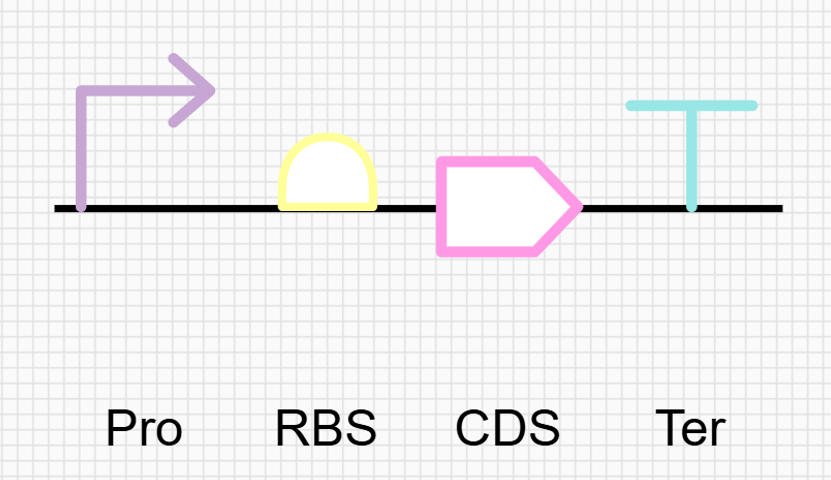
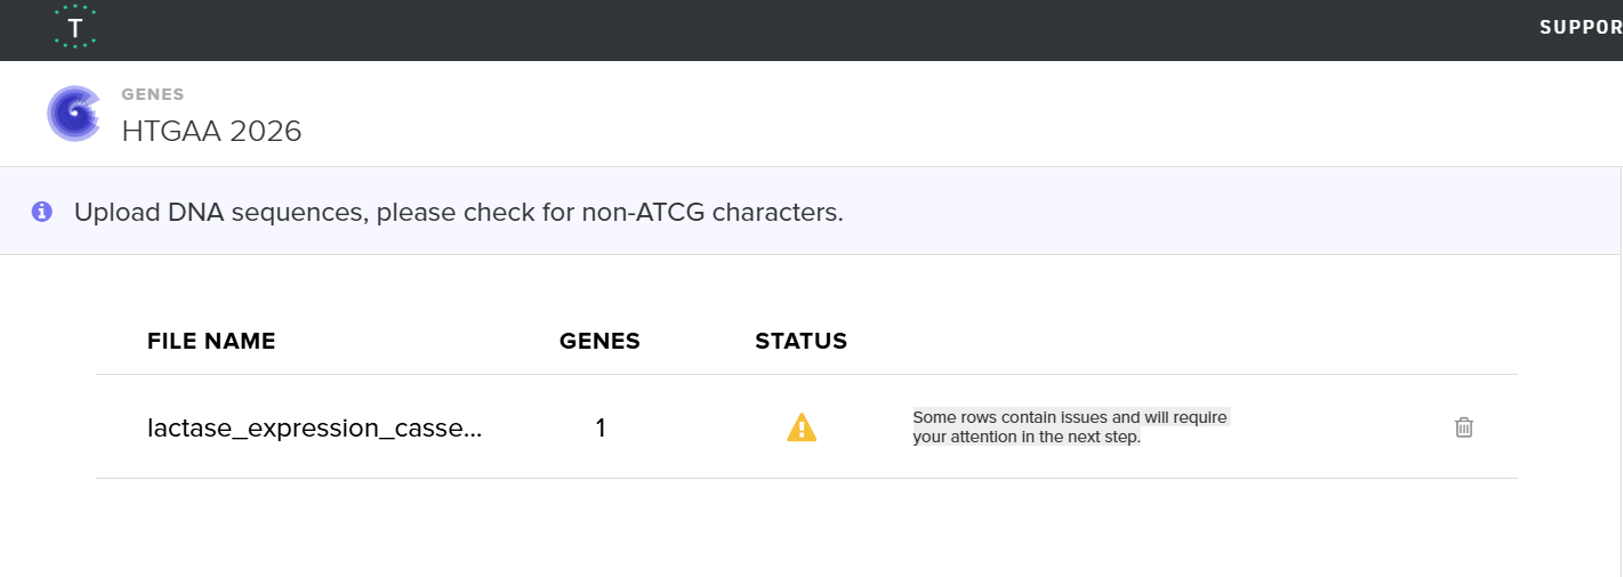
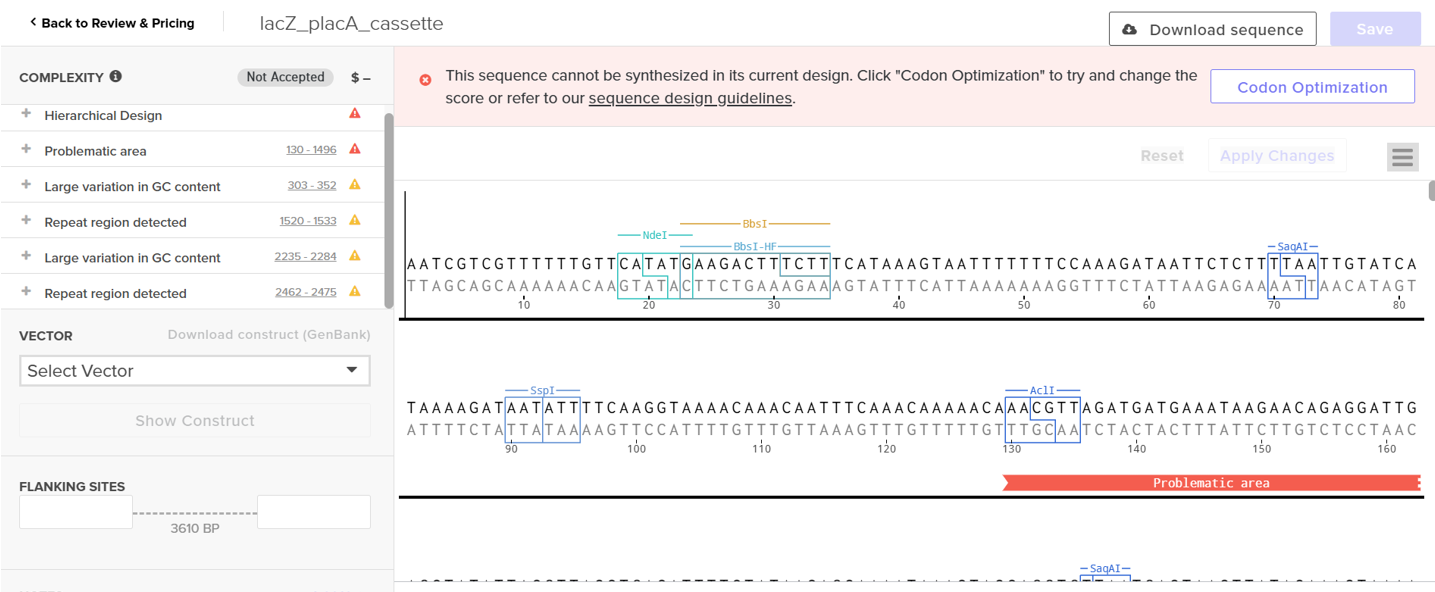
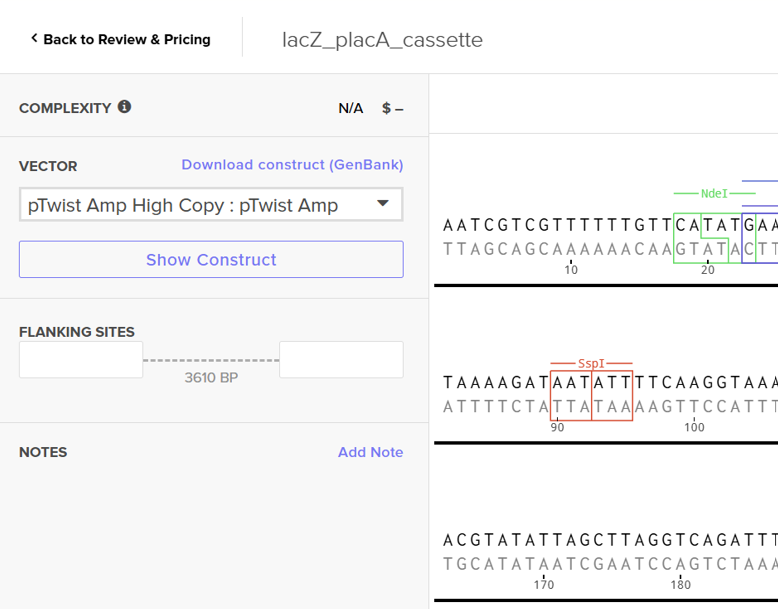
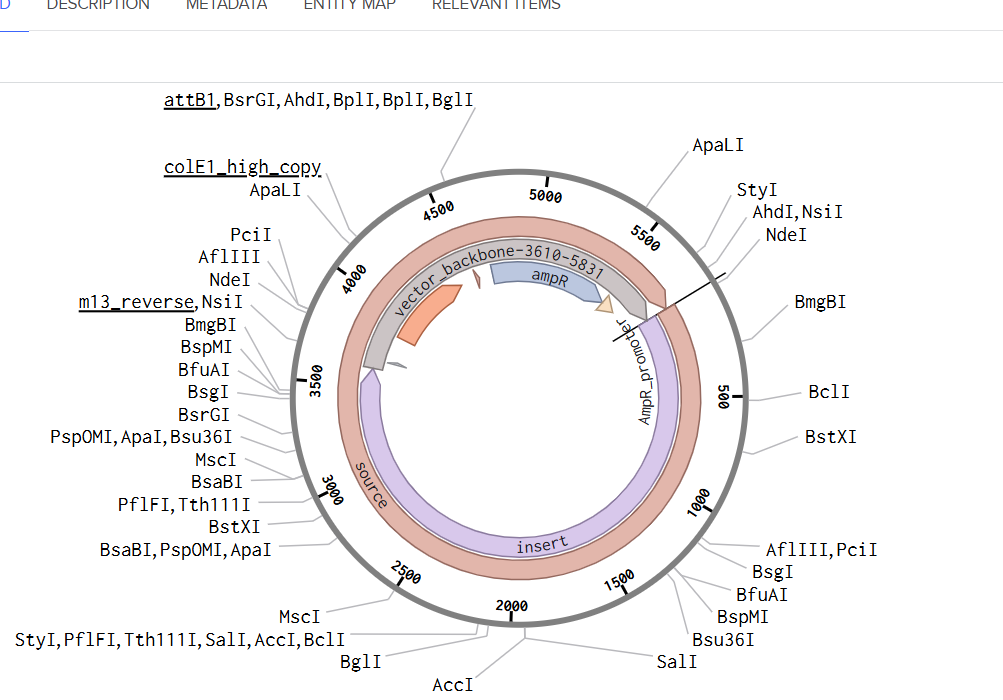


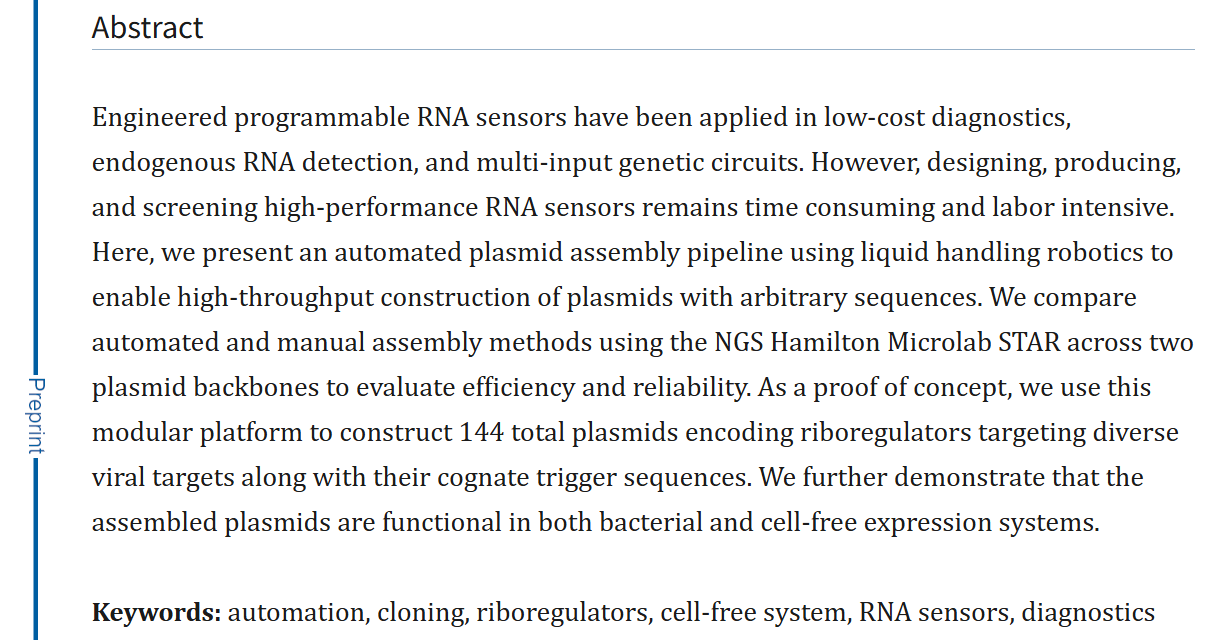
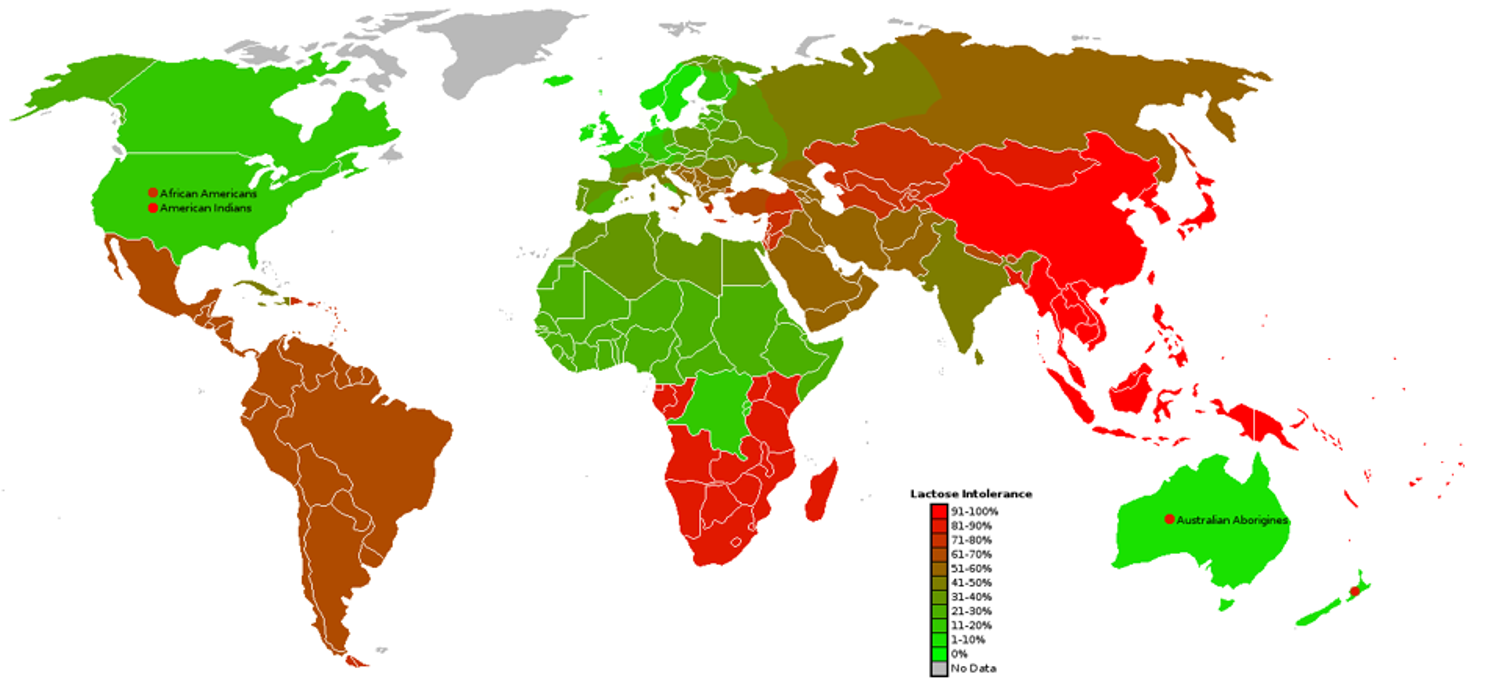
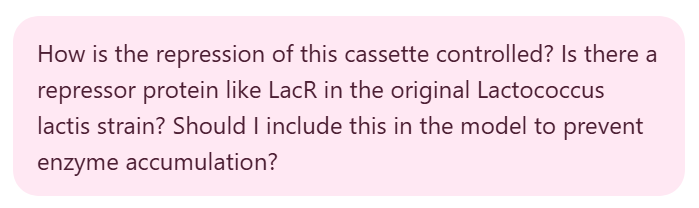
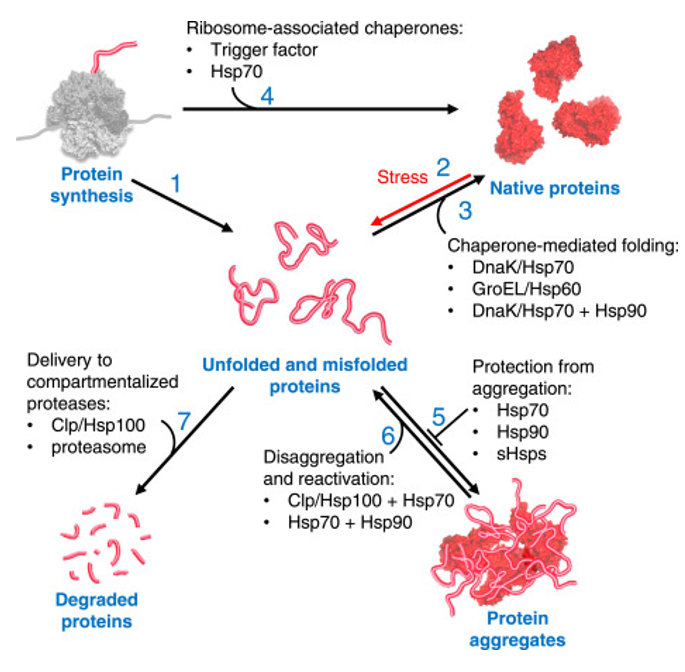
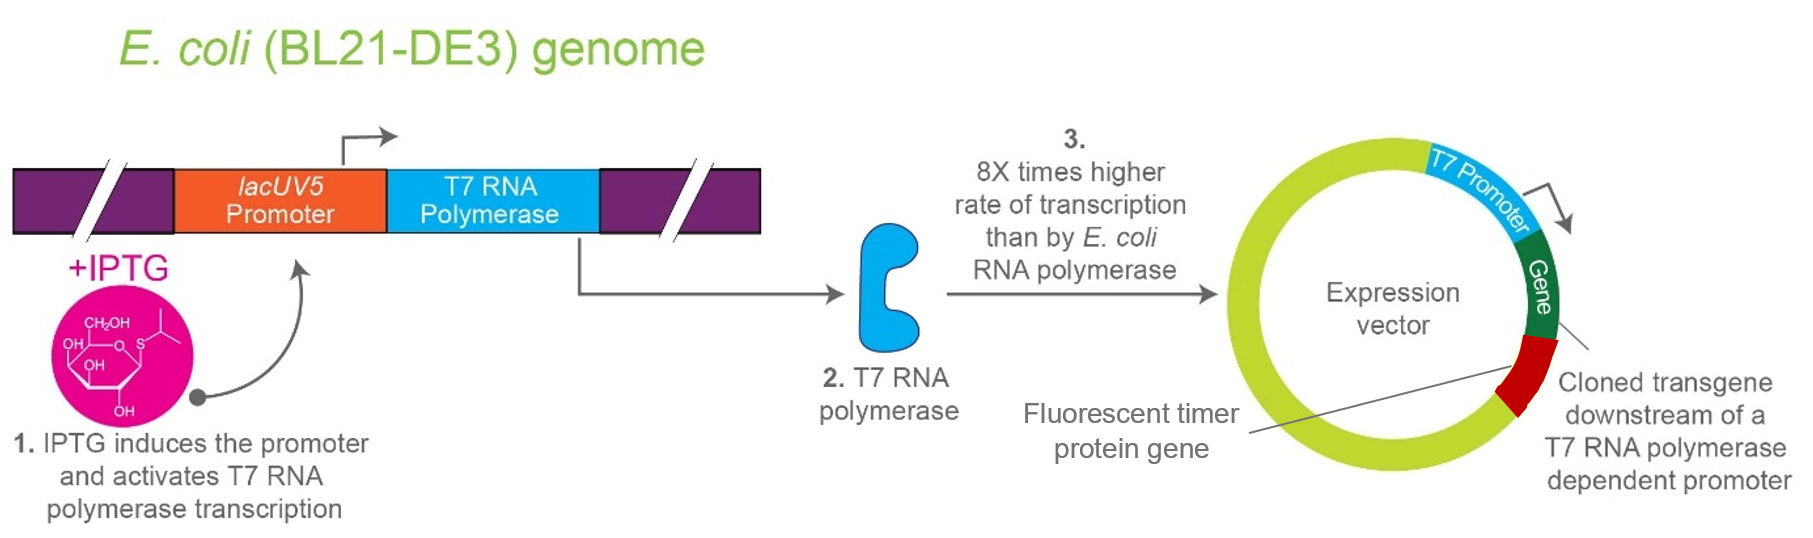
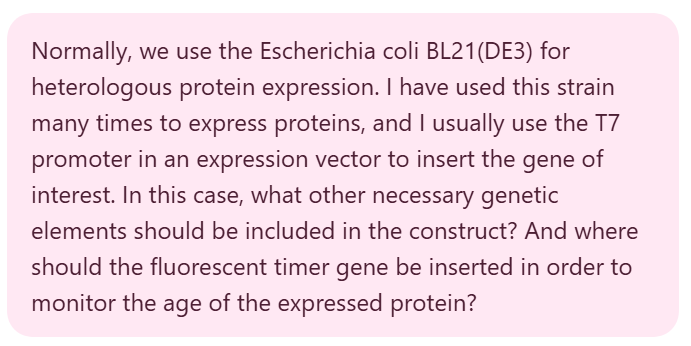

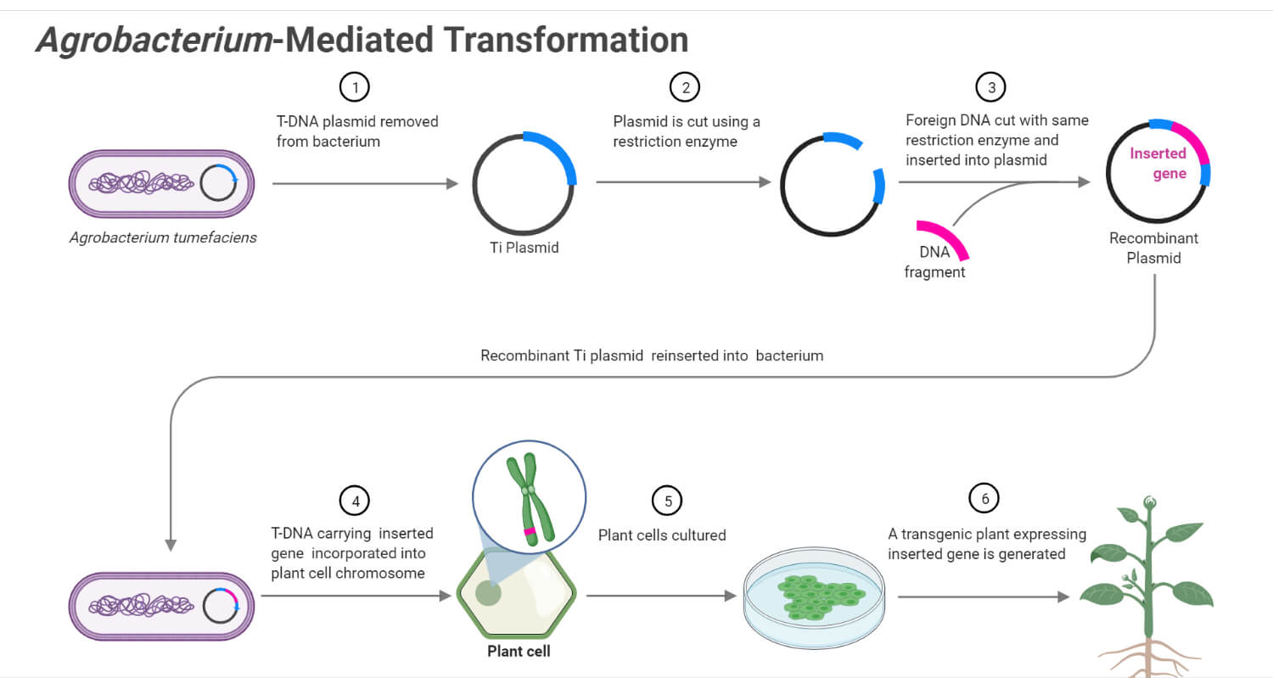

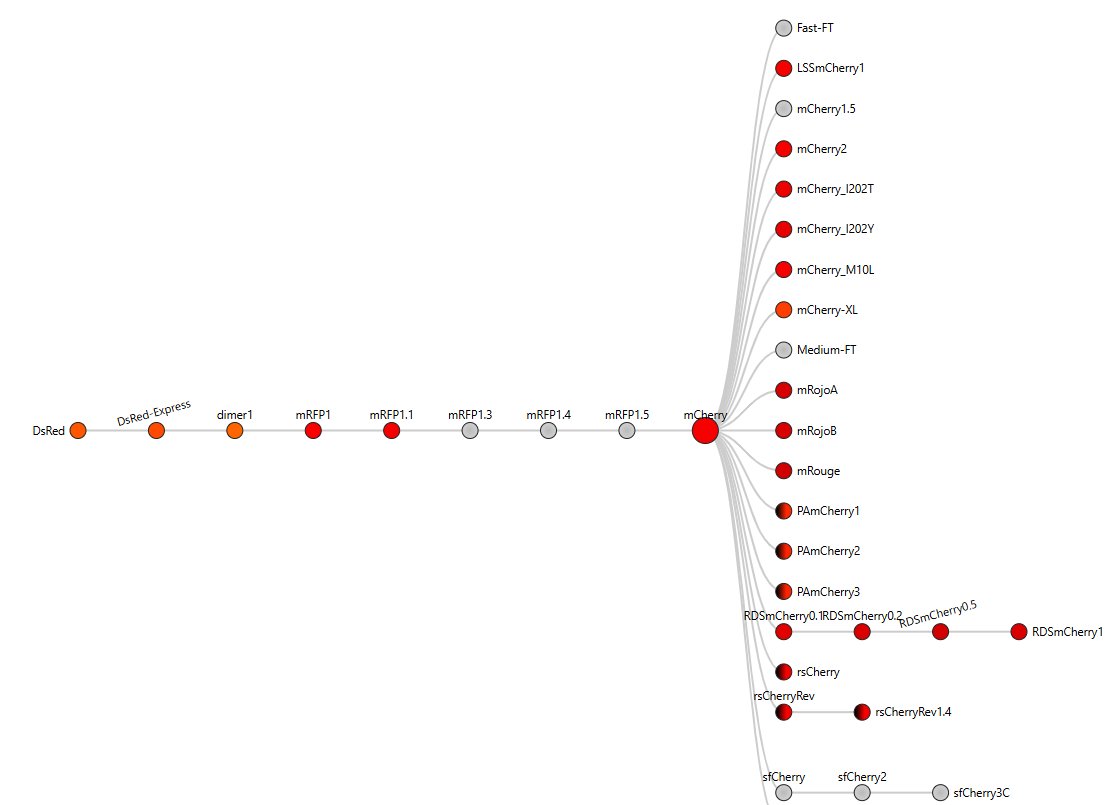
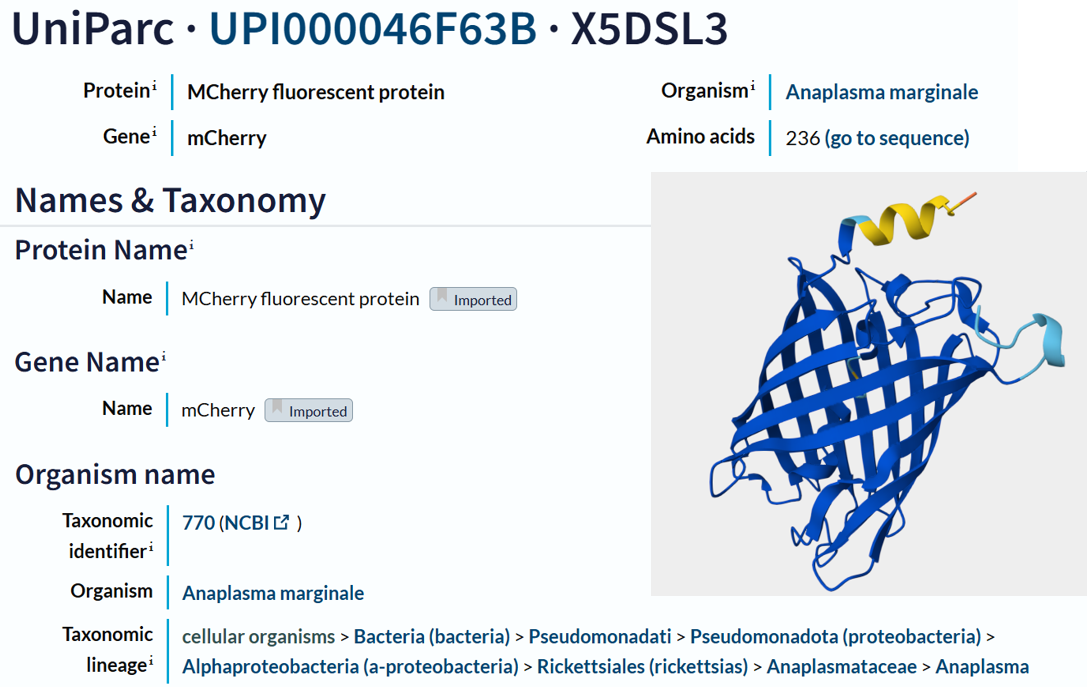
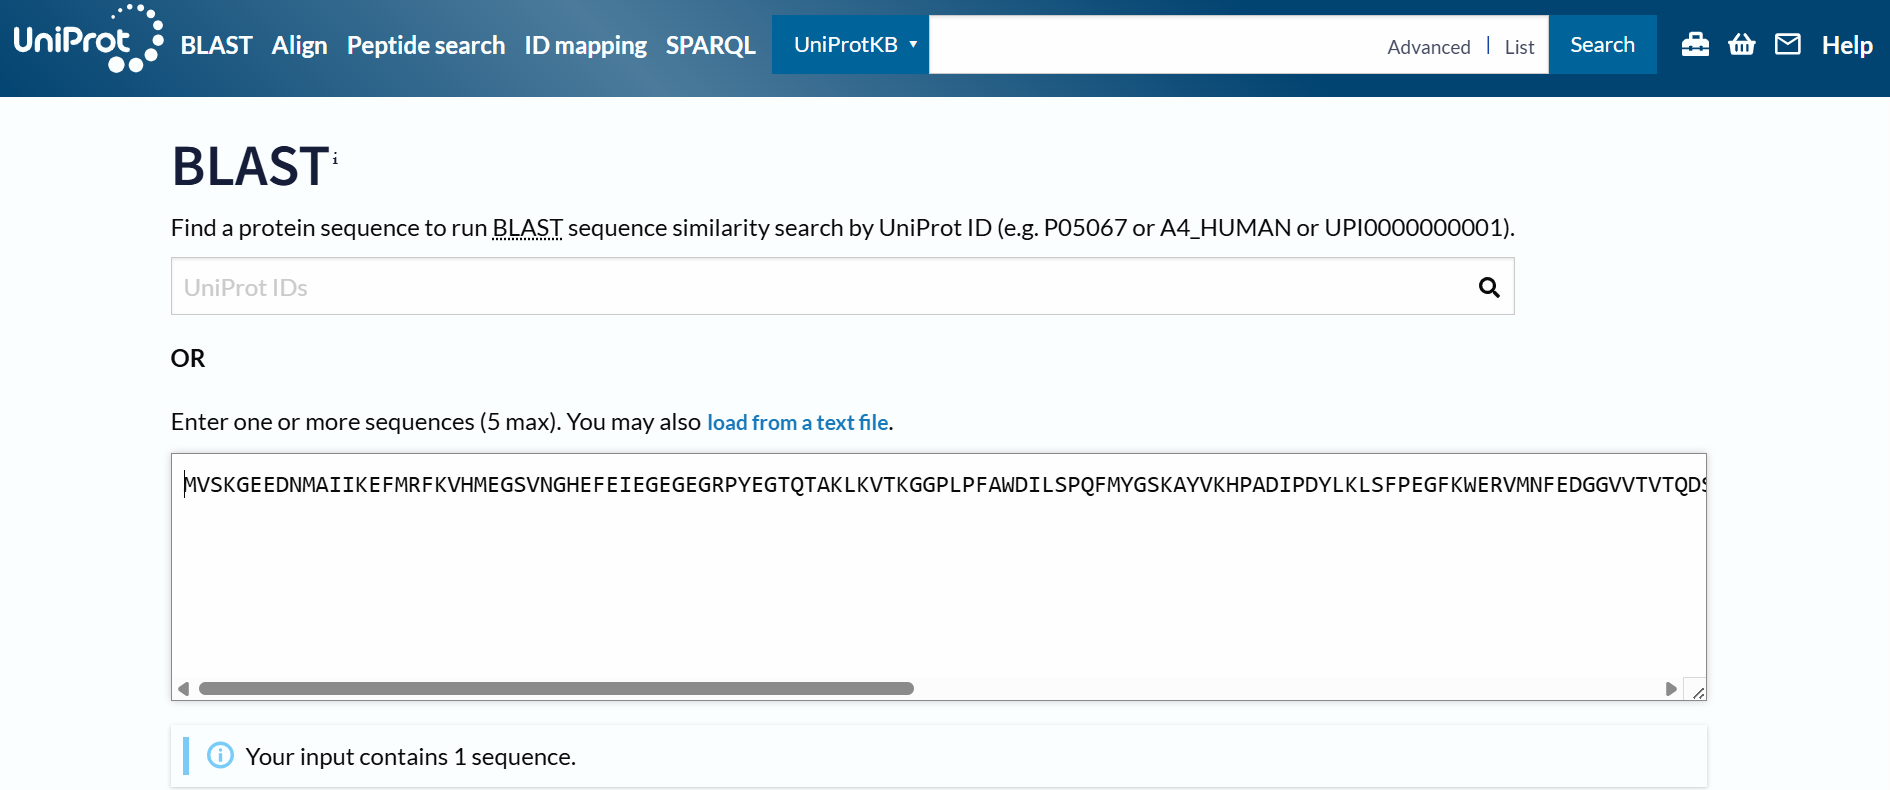
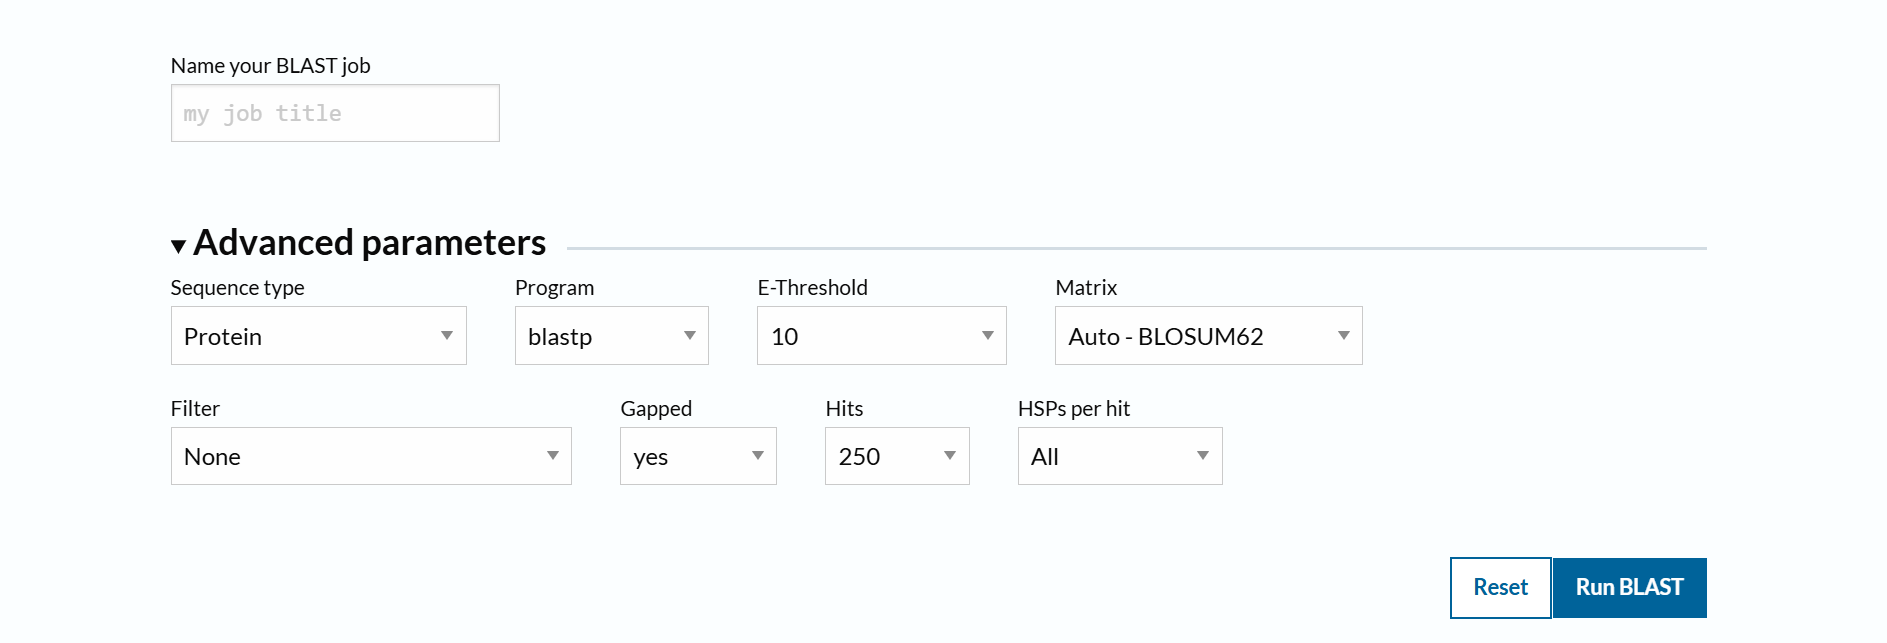
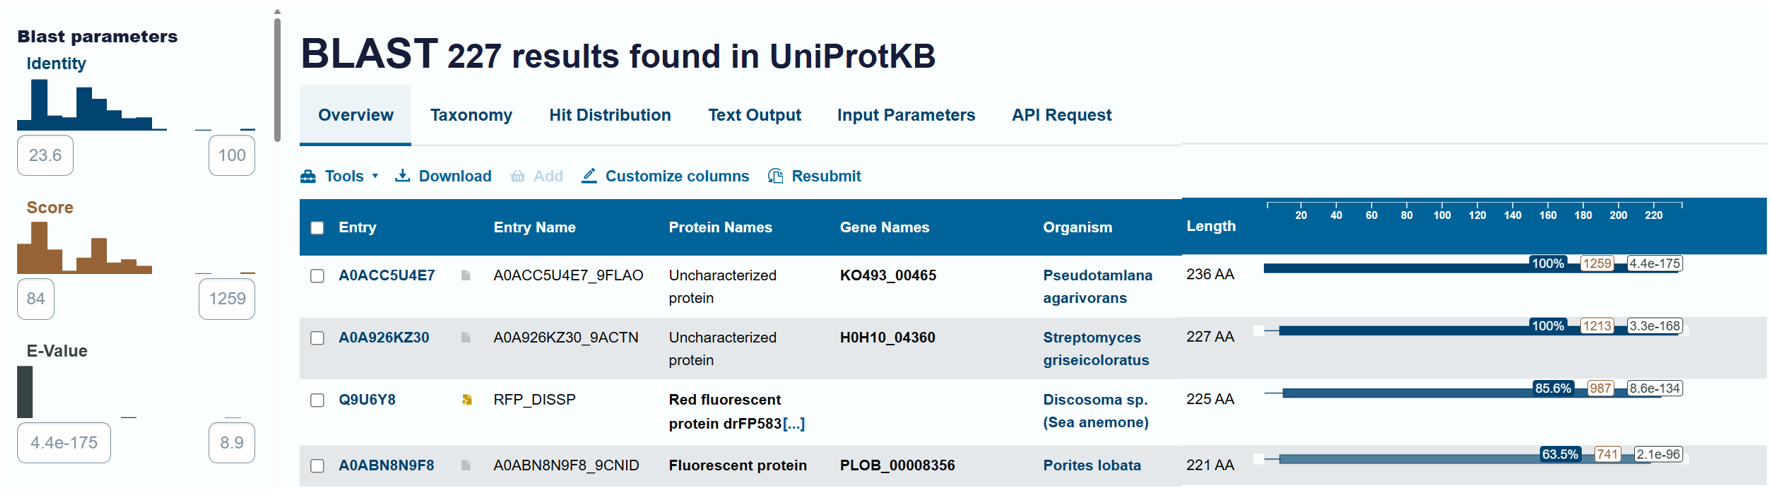
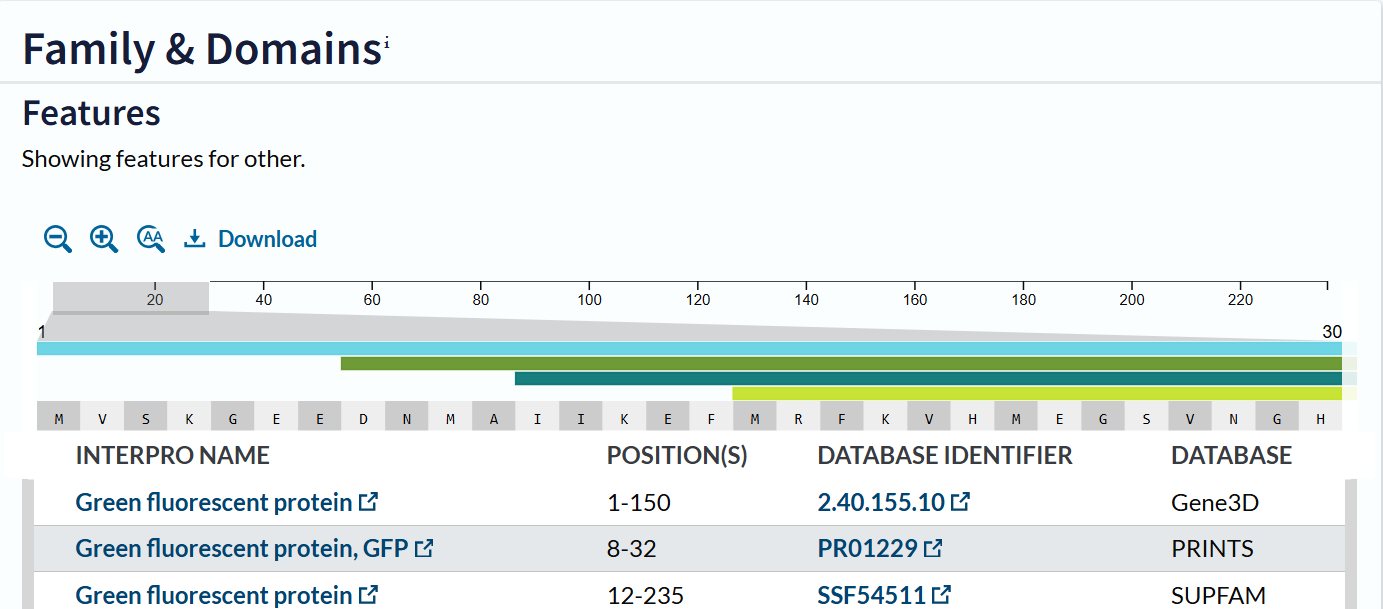
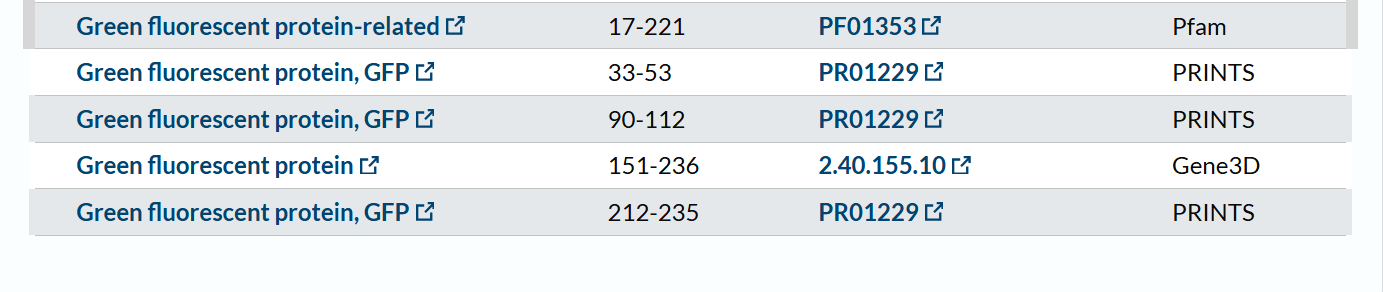
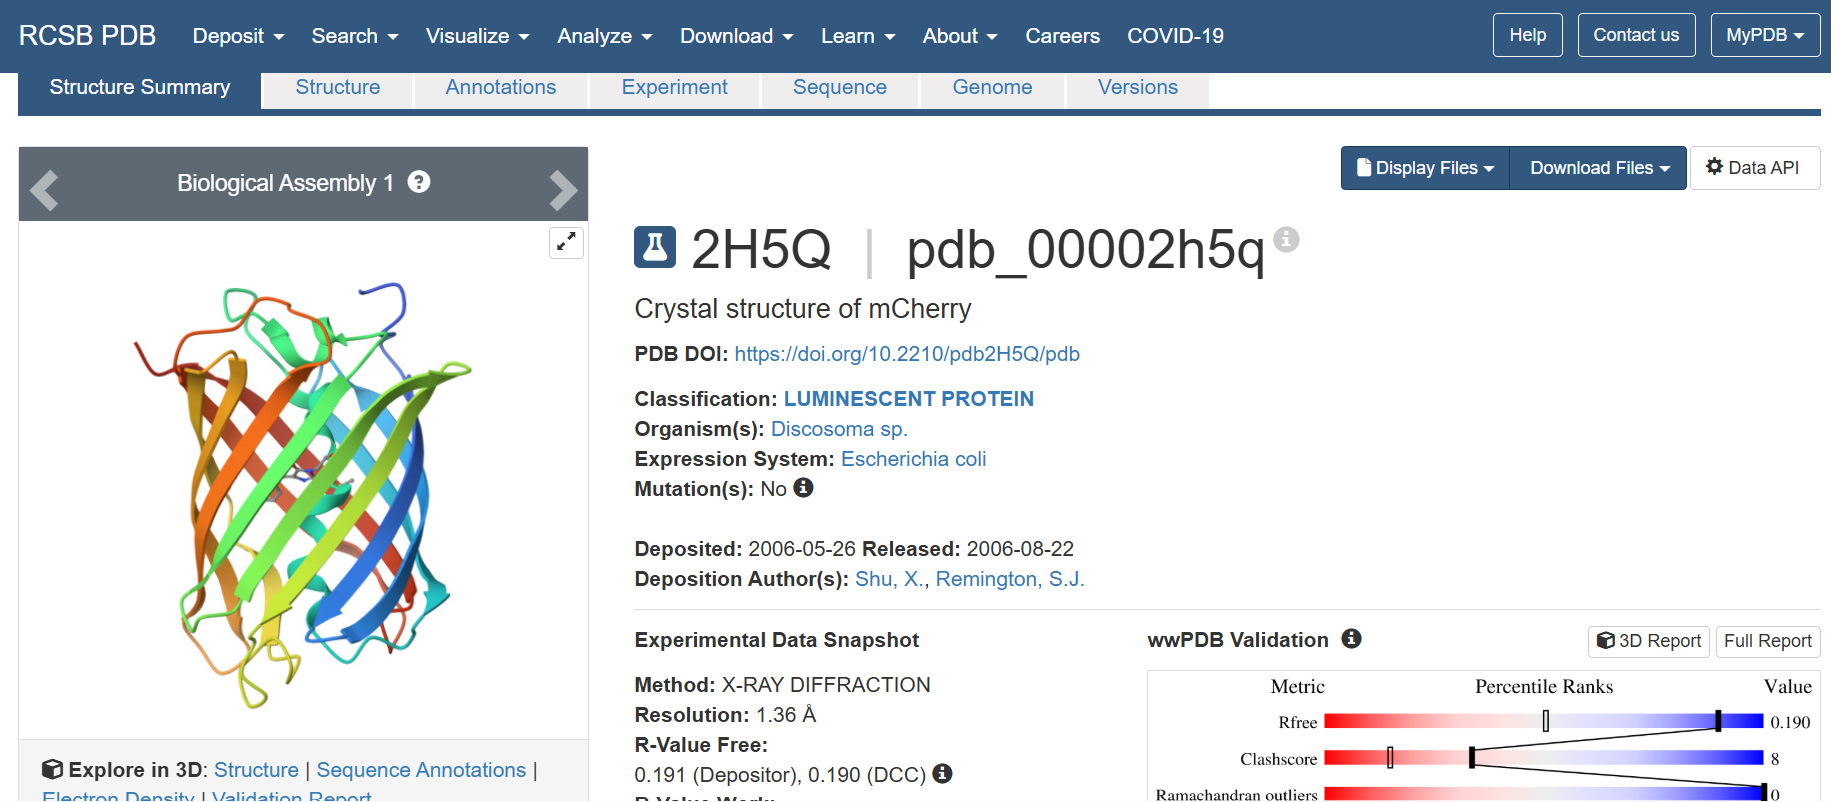
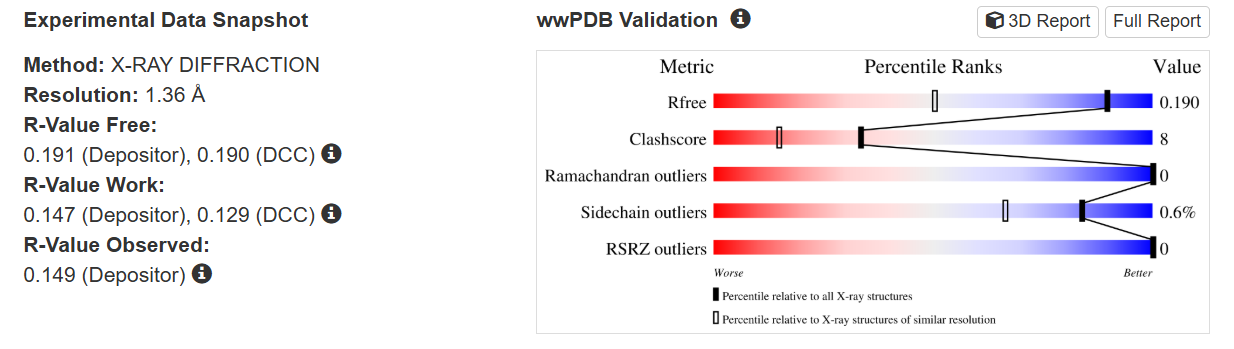
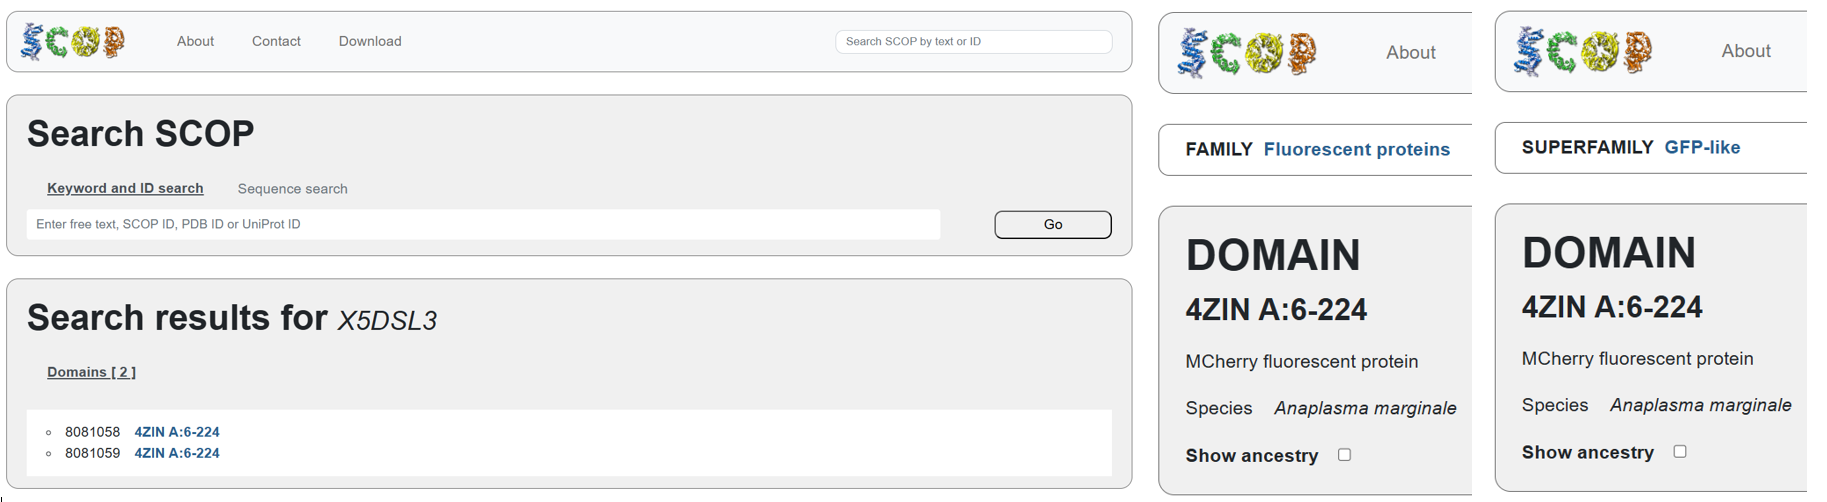
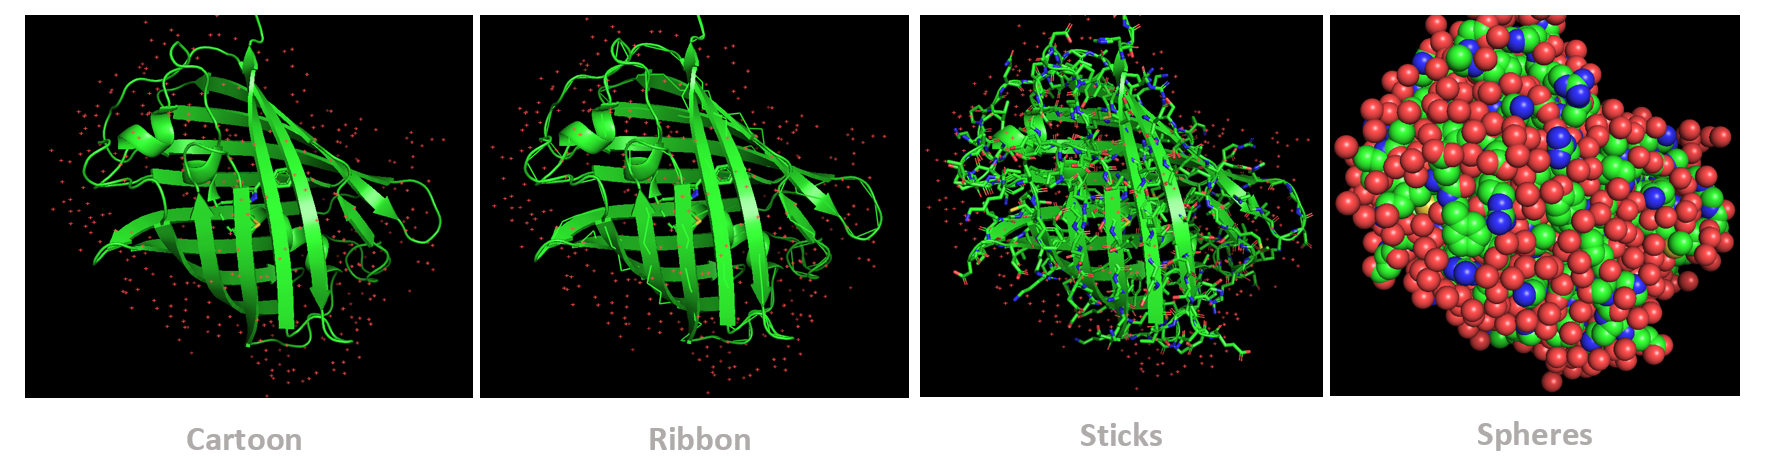
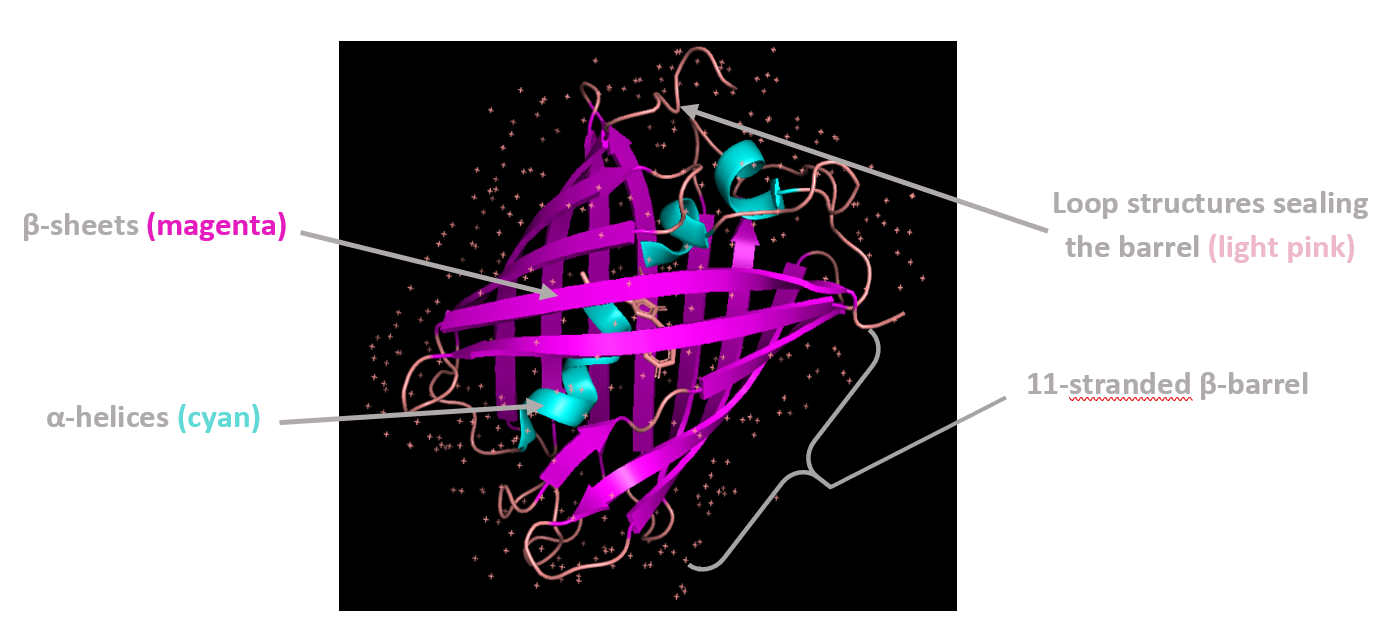
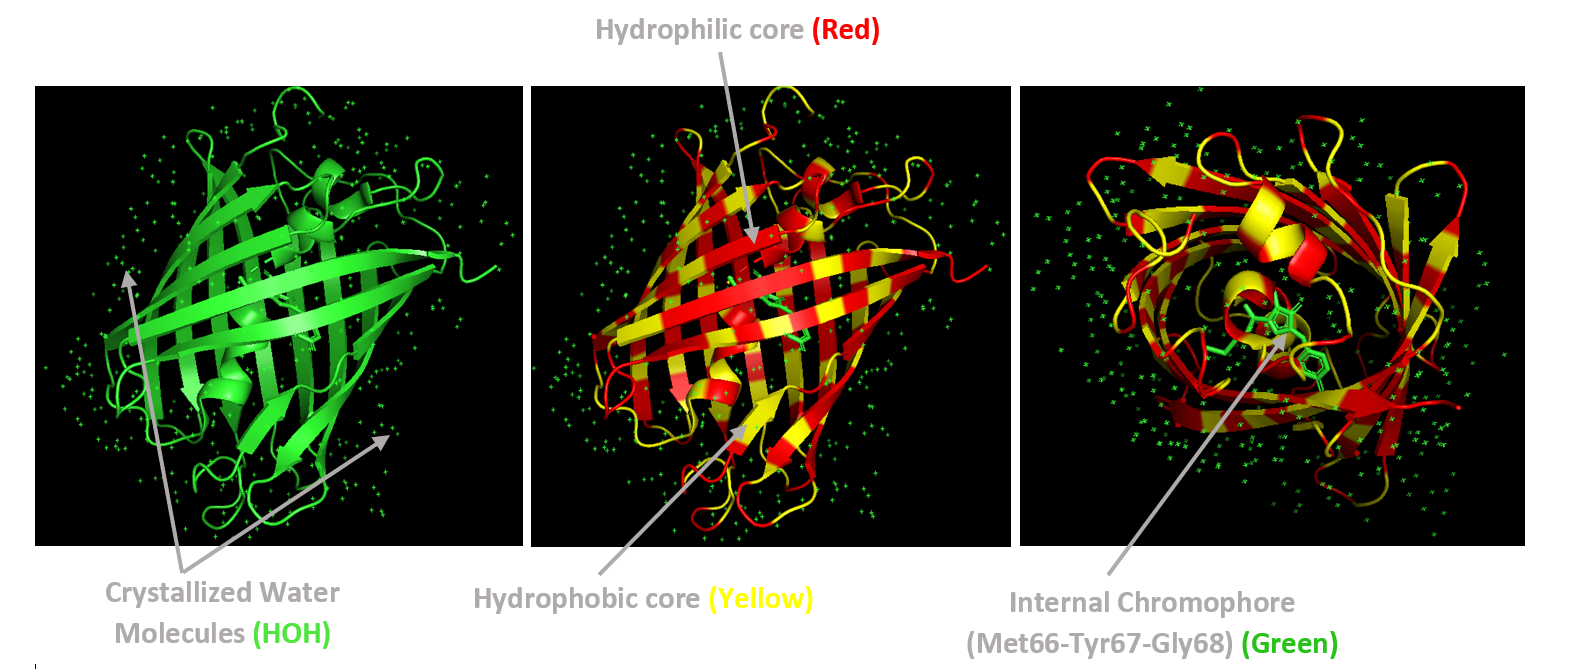
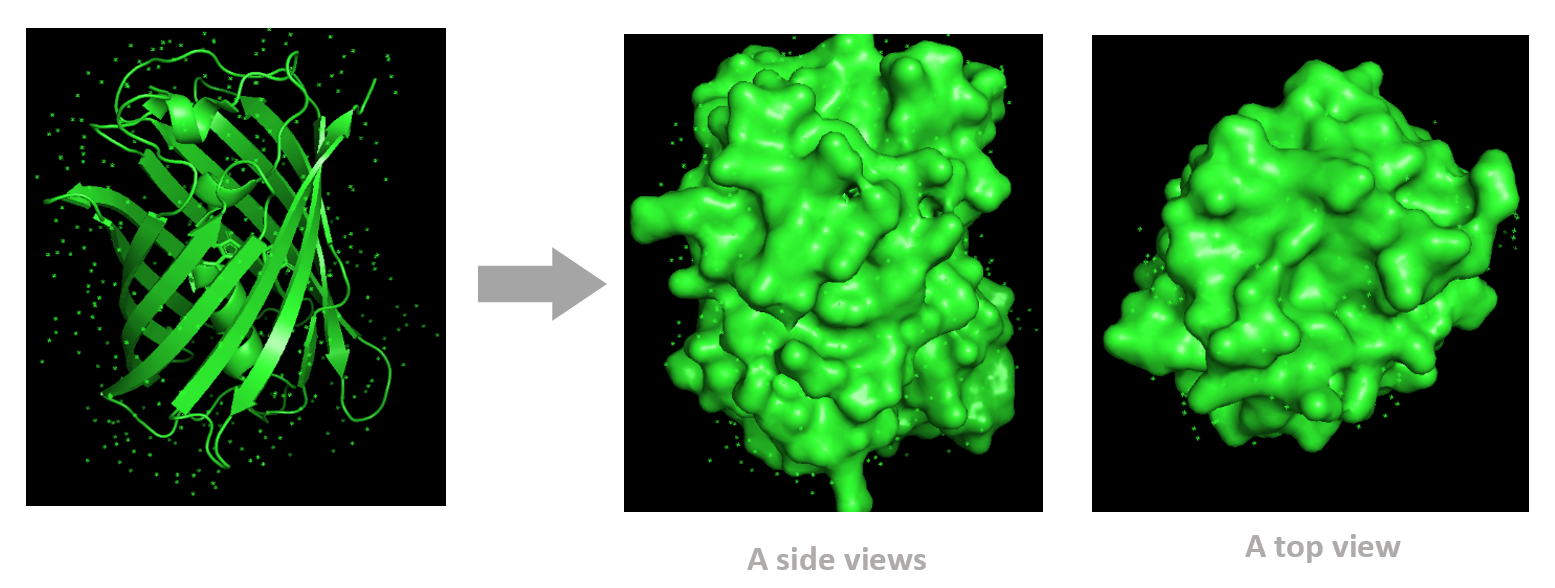
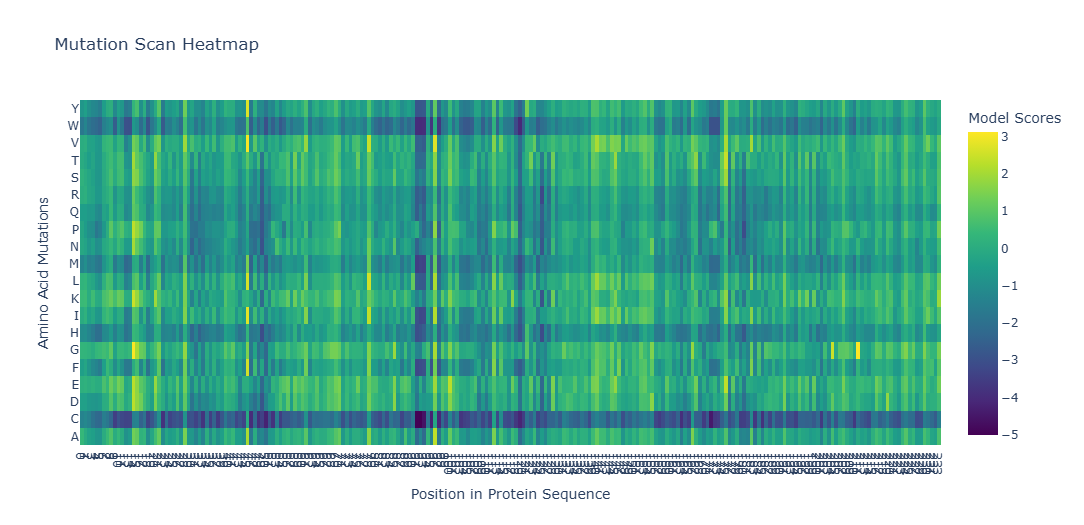
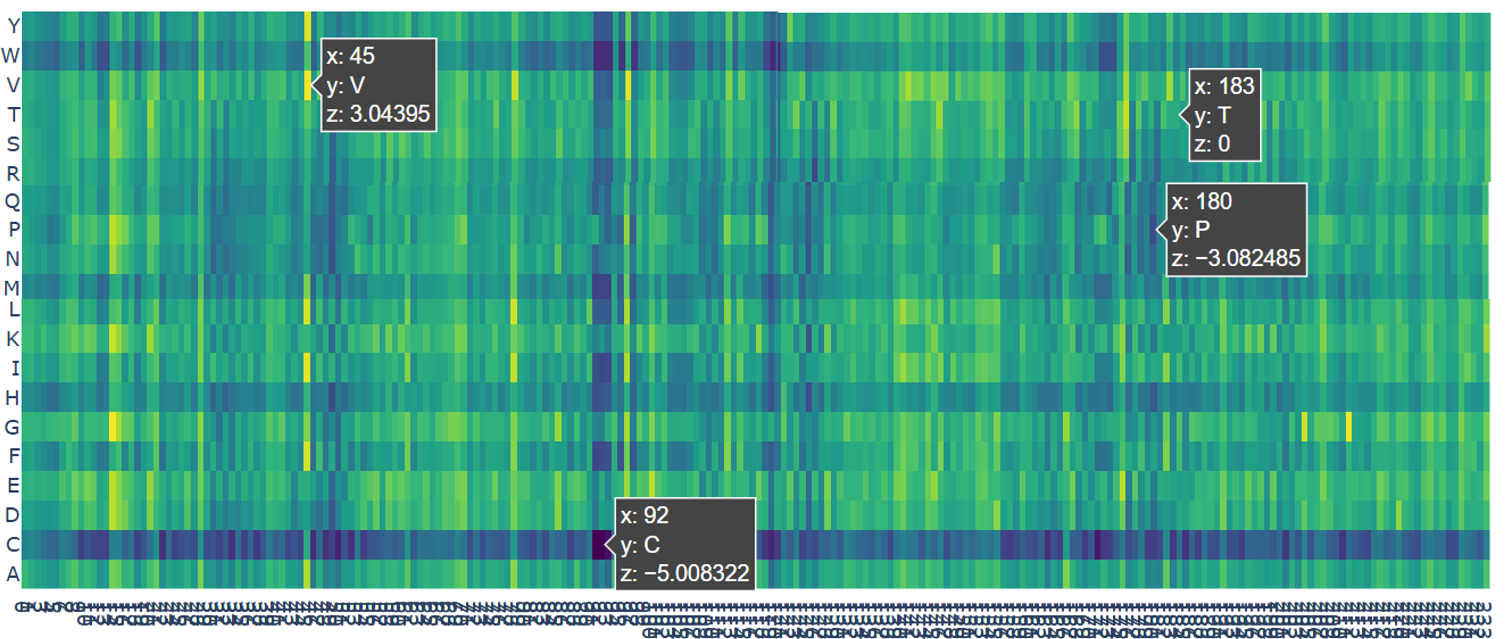
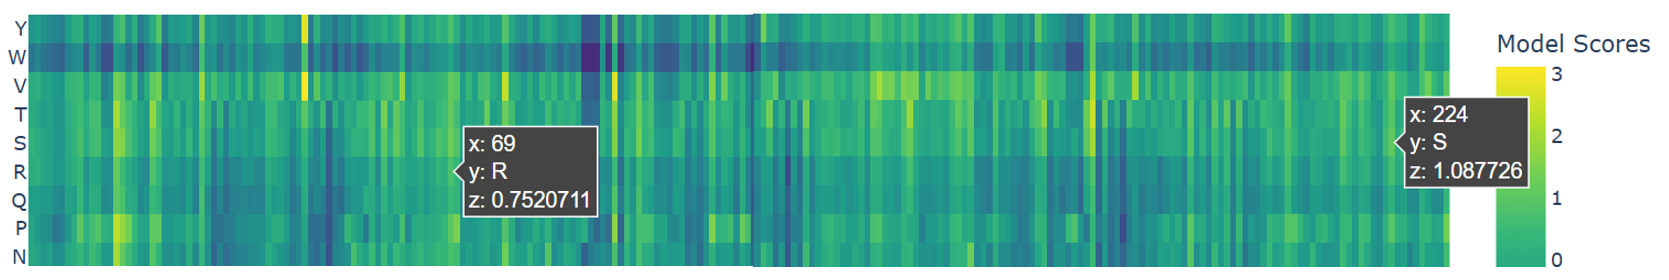
.png?width=300px)
.png?width=300px)
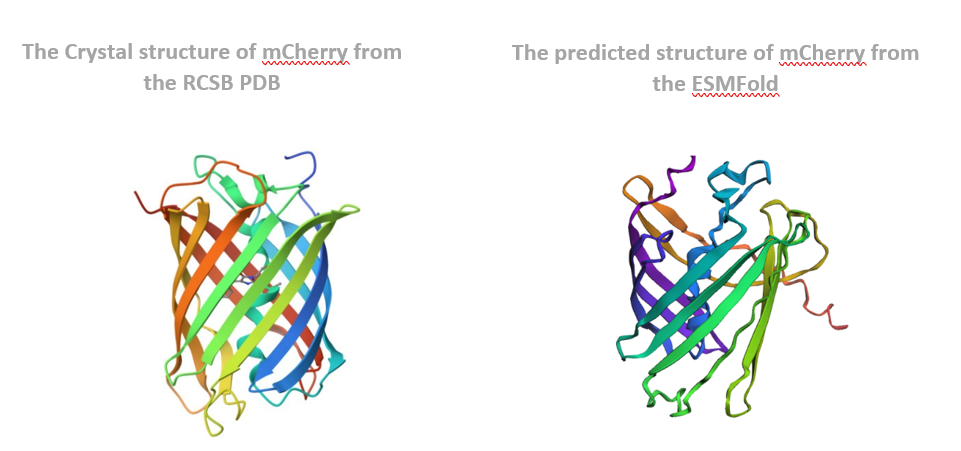
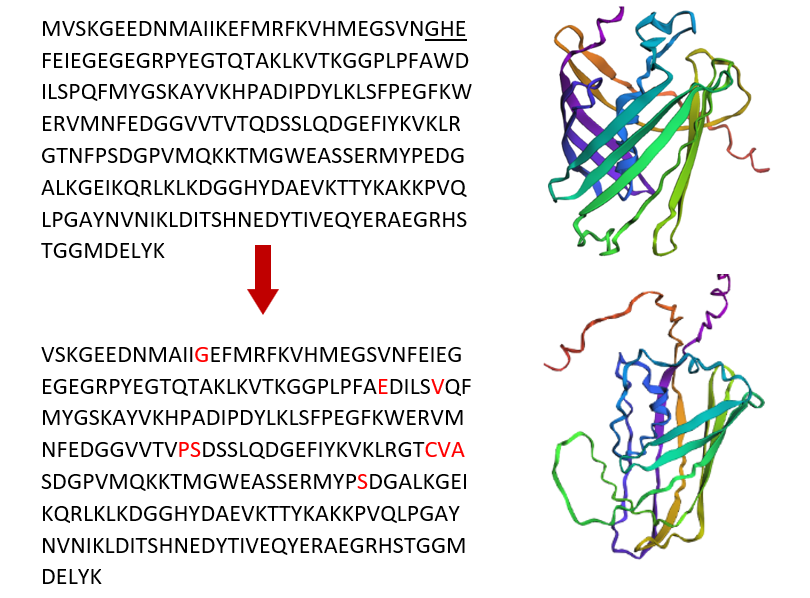
.png?width=500px)
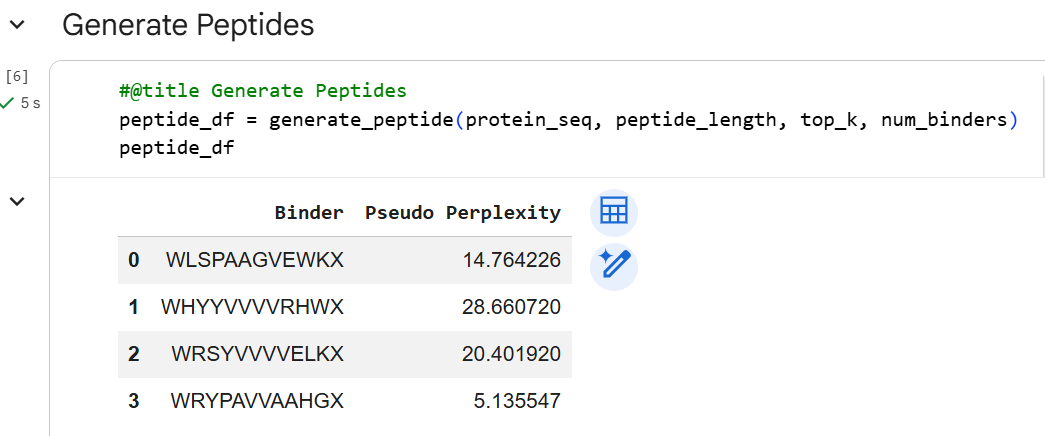

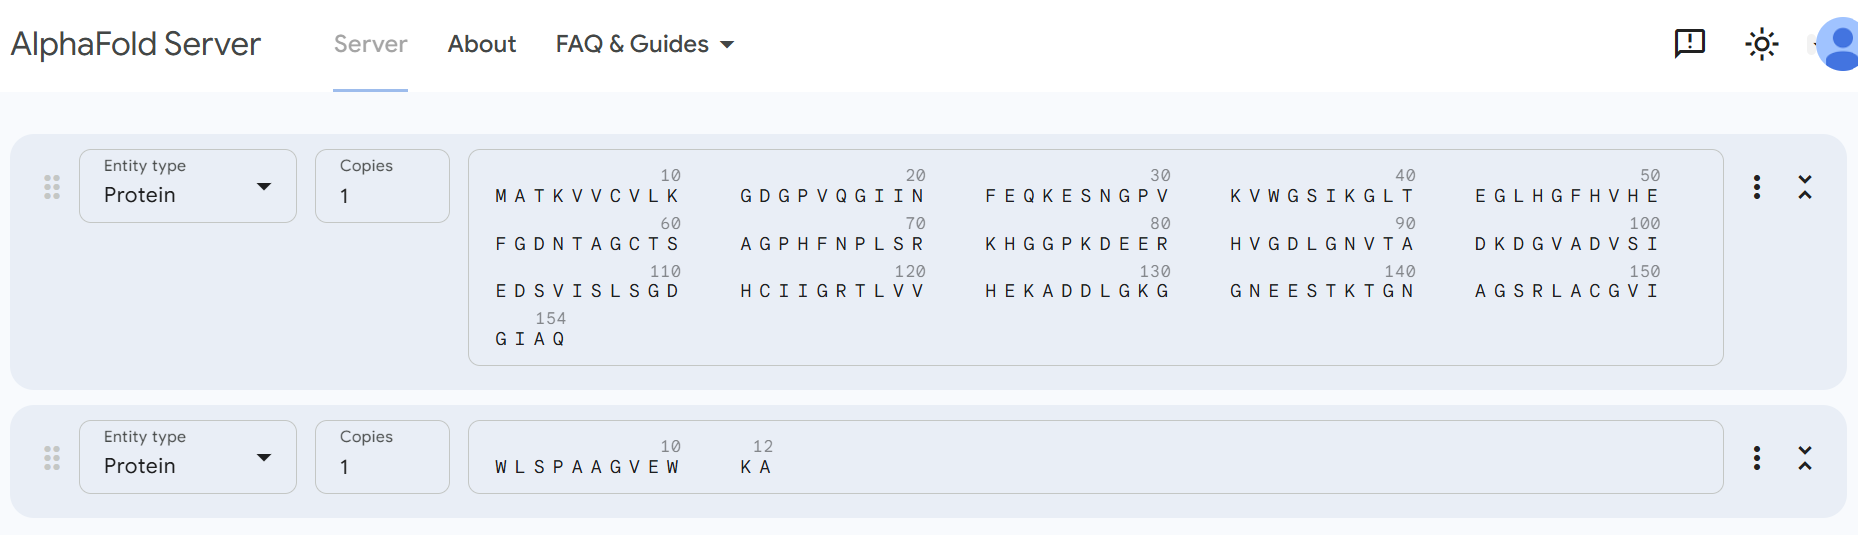
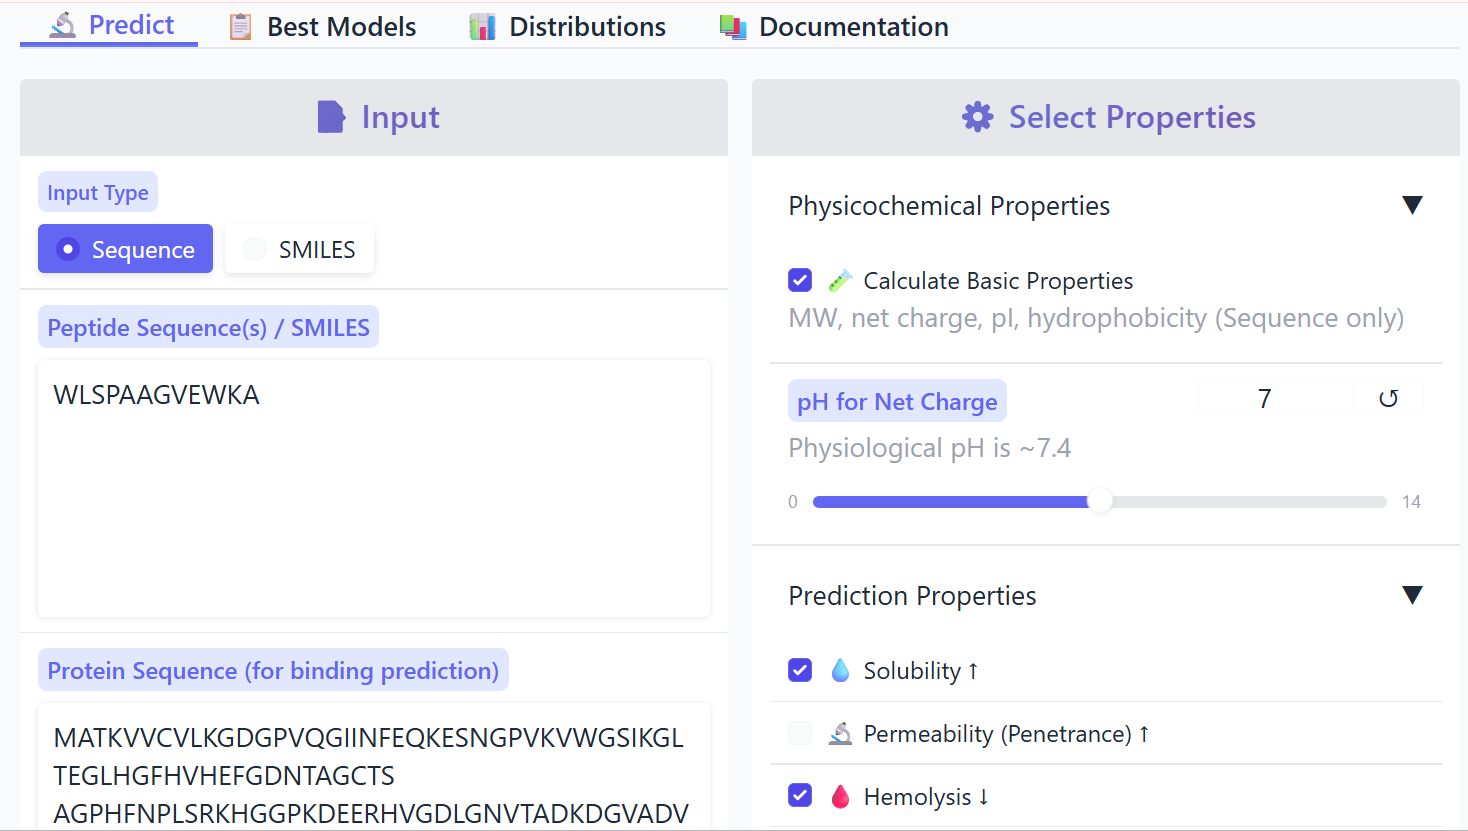
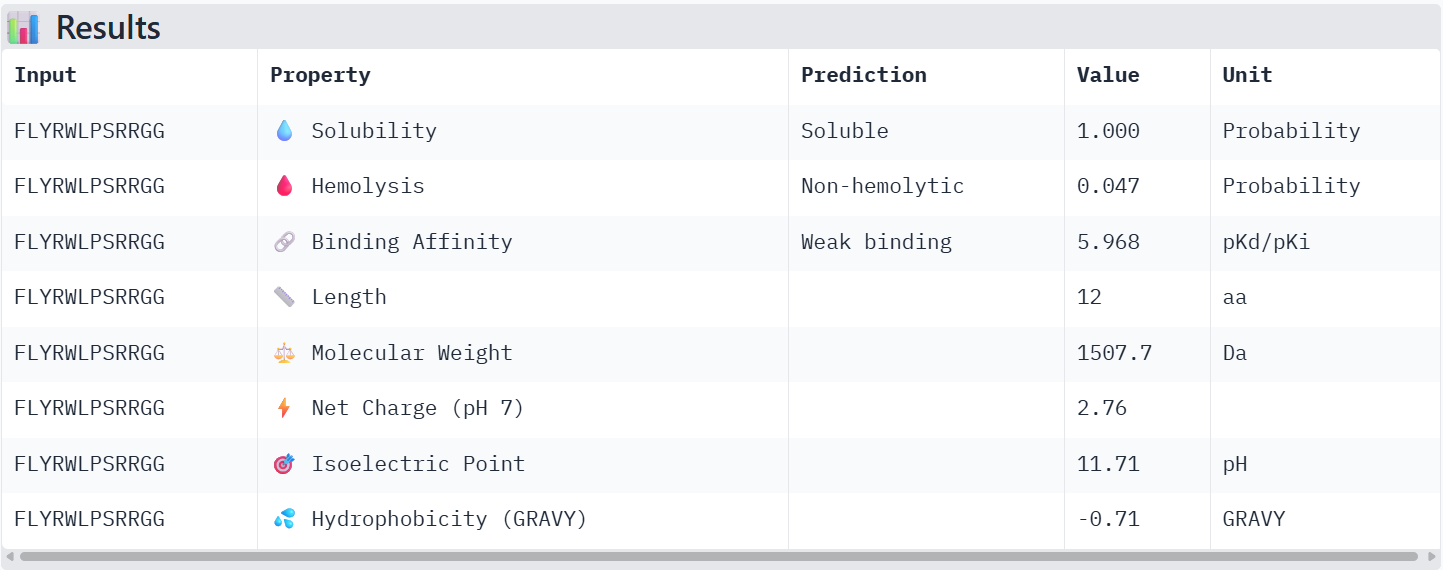
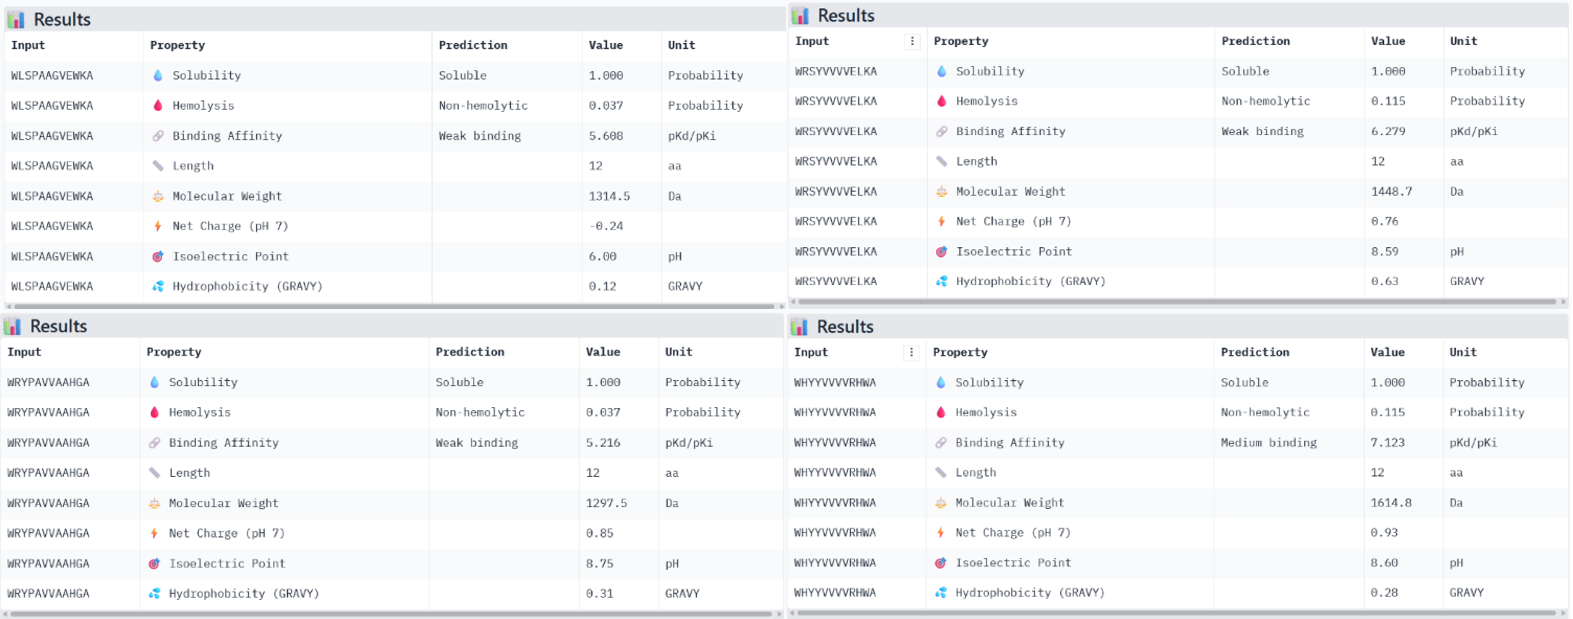
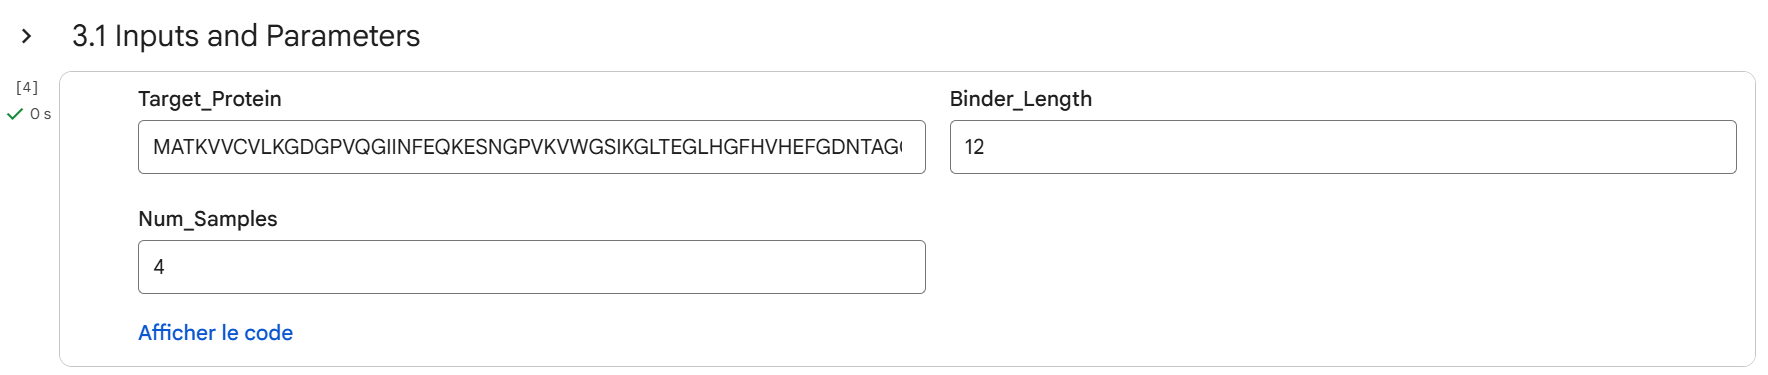
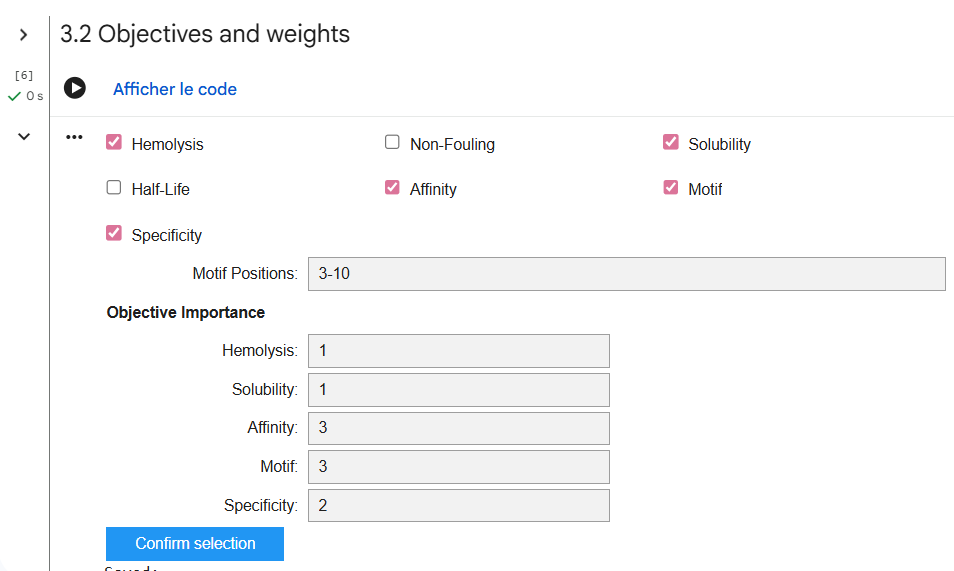
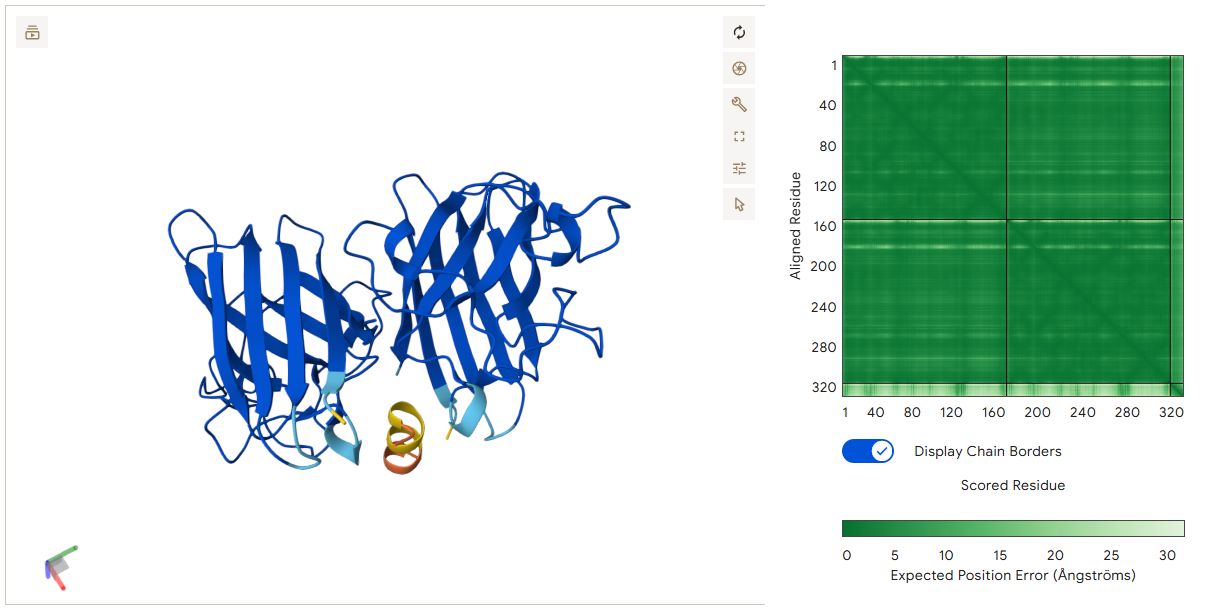
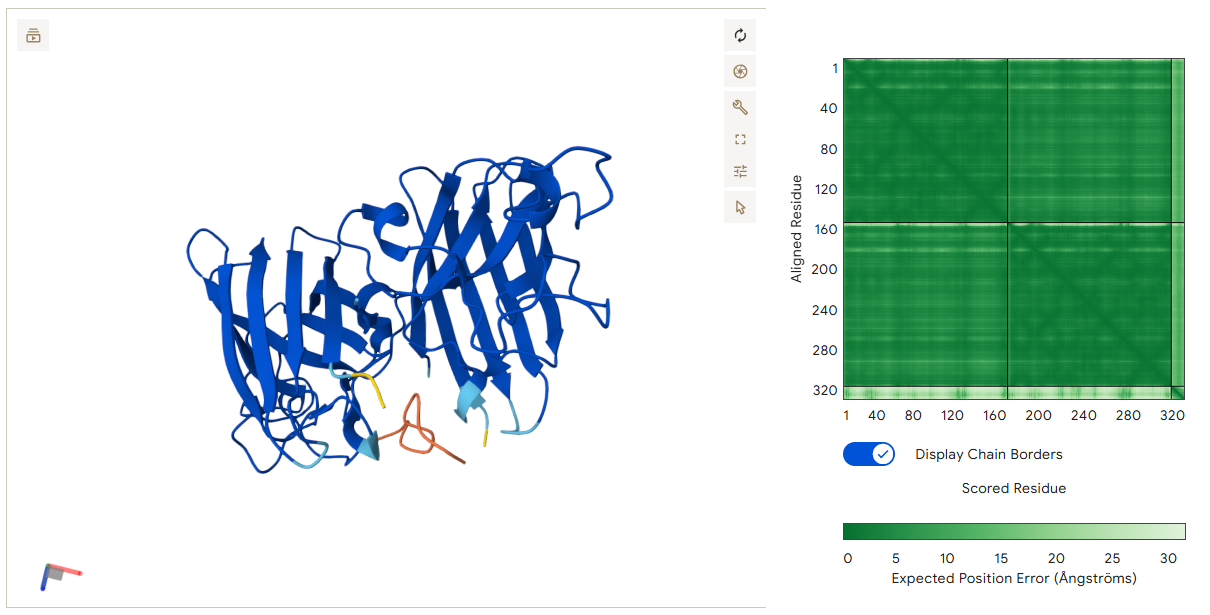
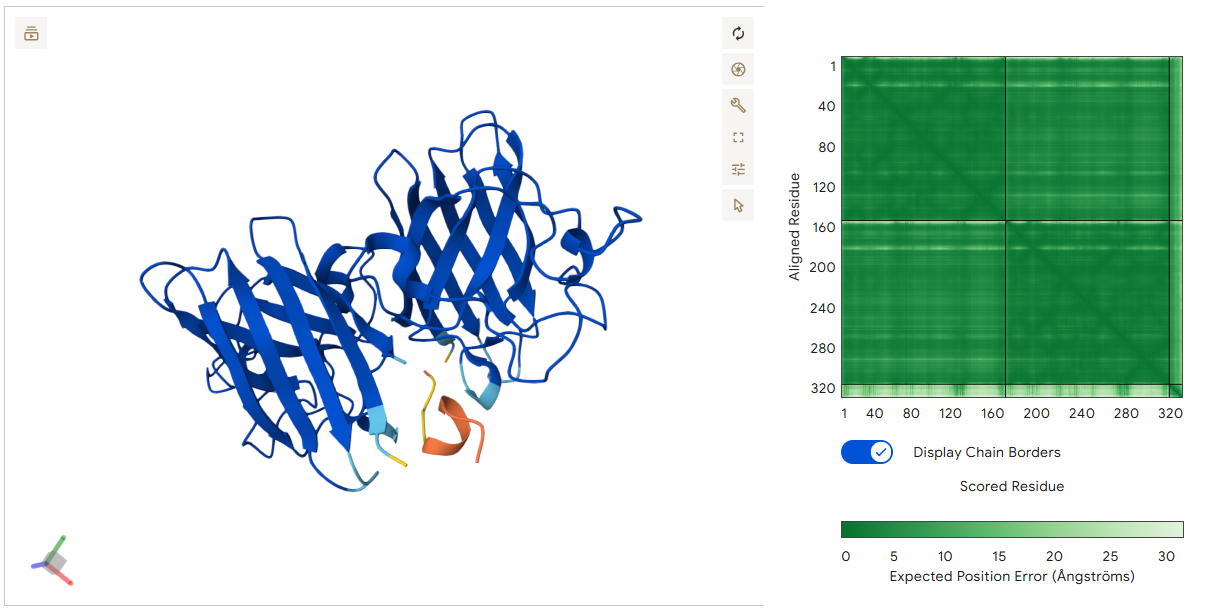
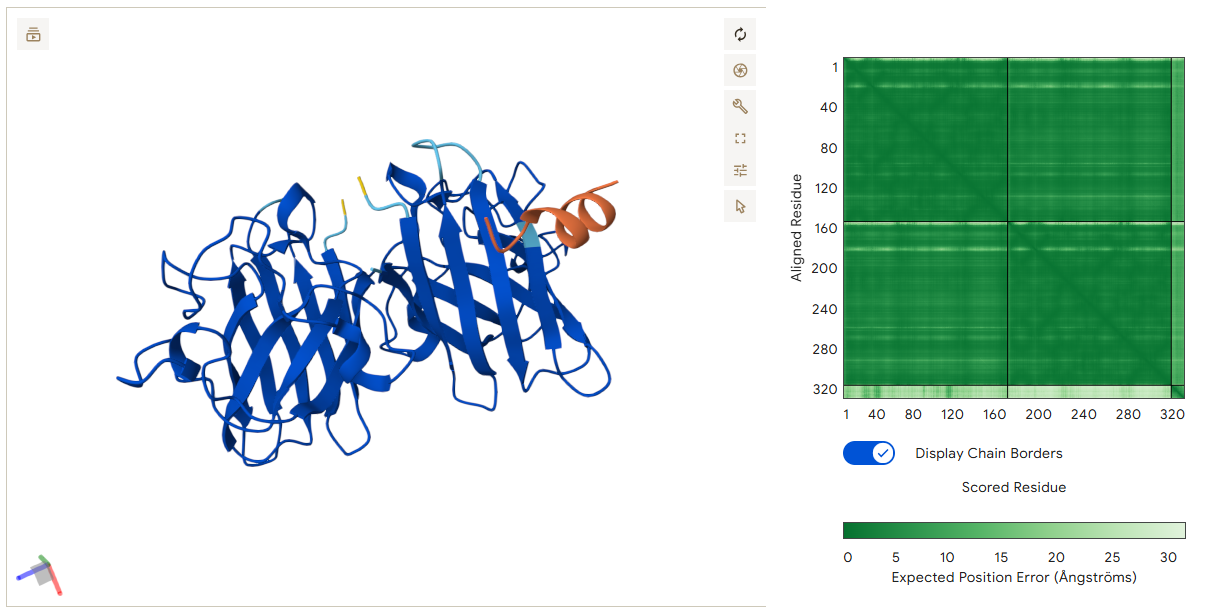
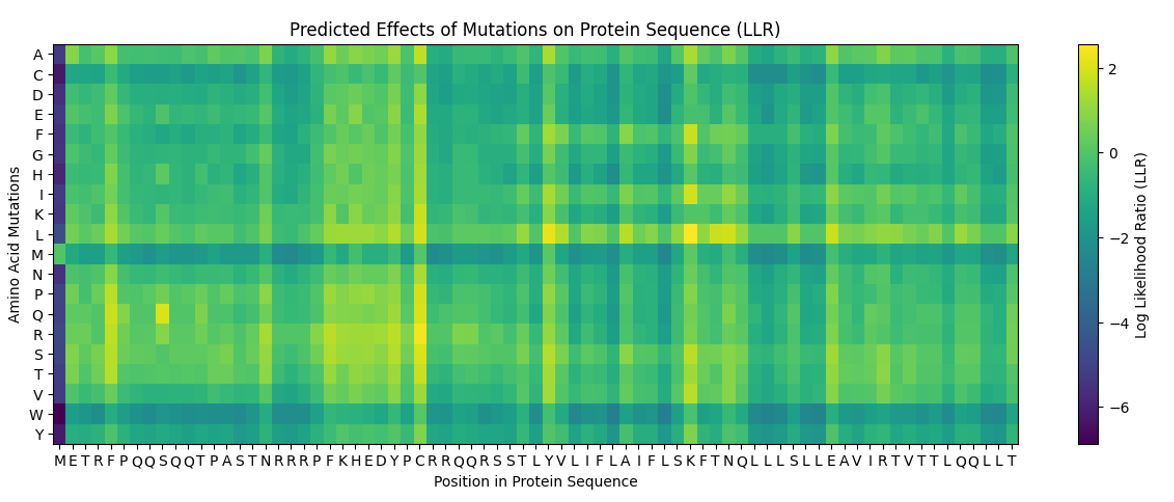
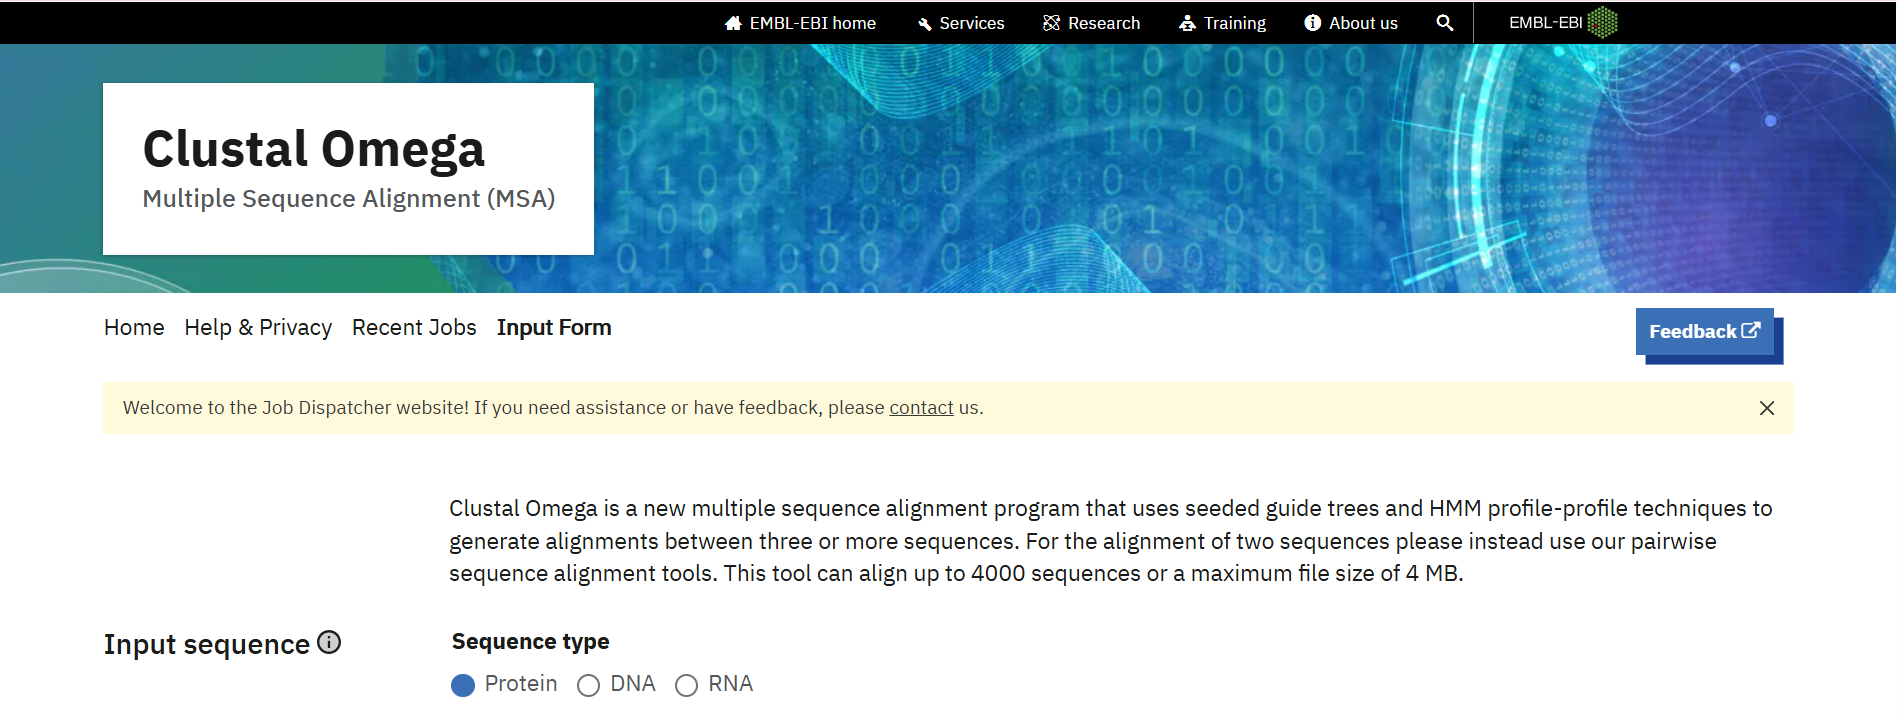
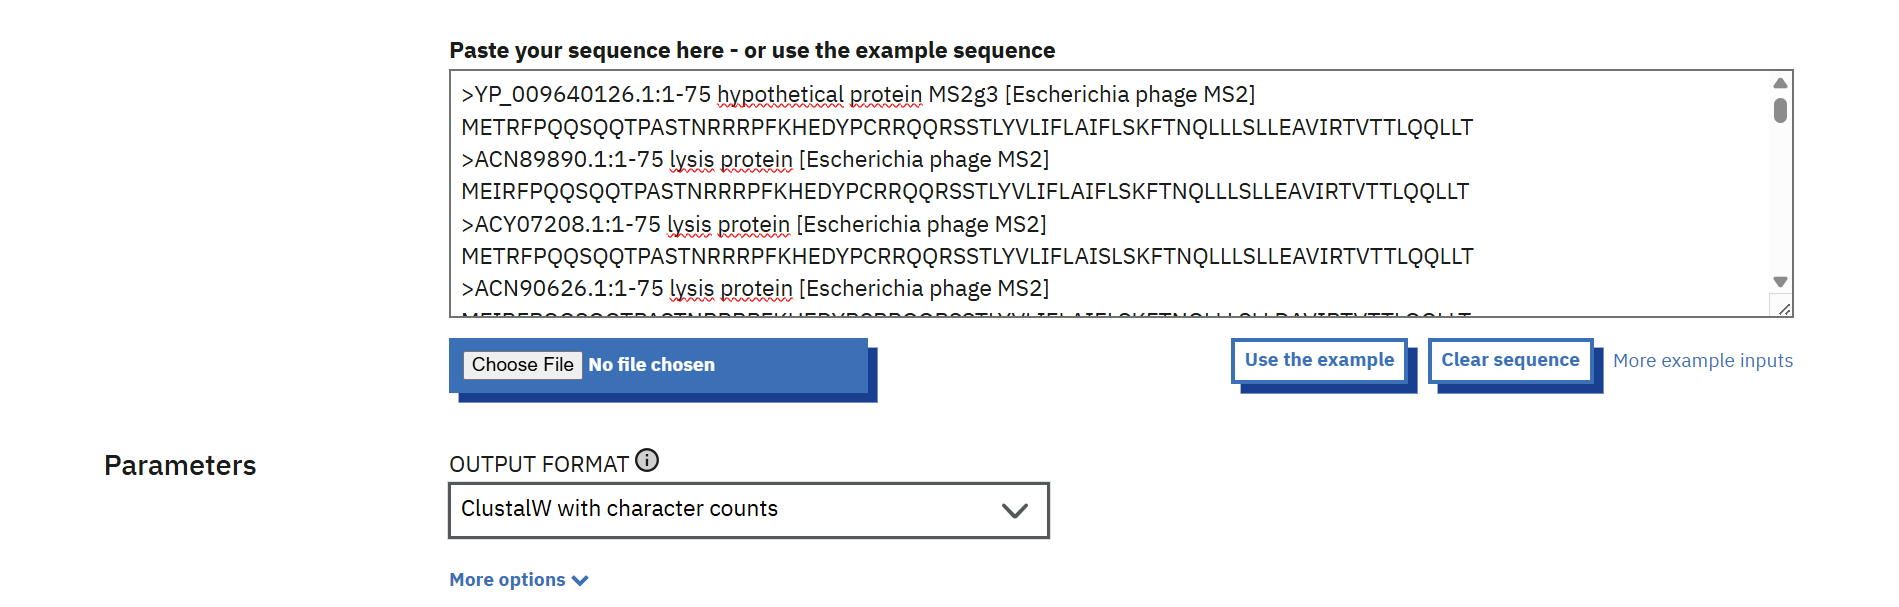

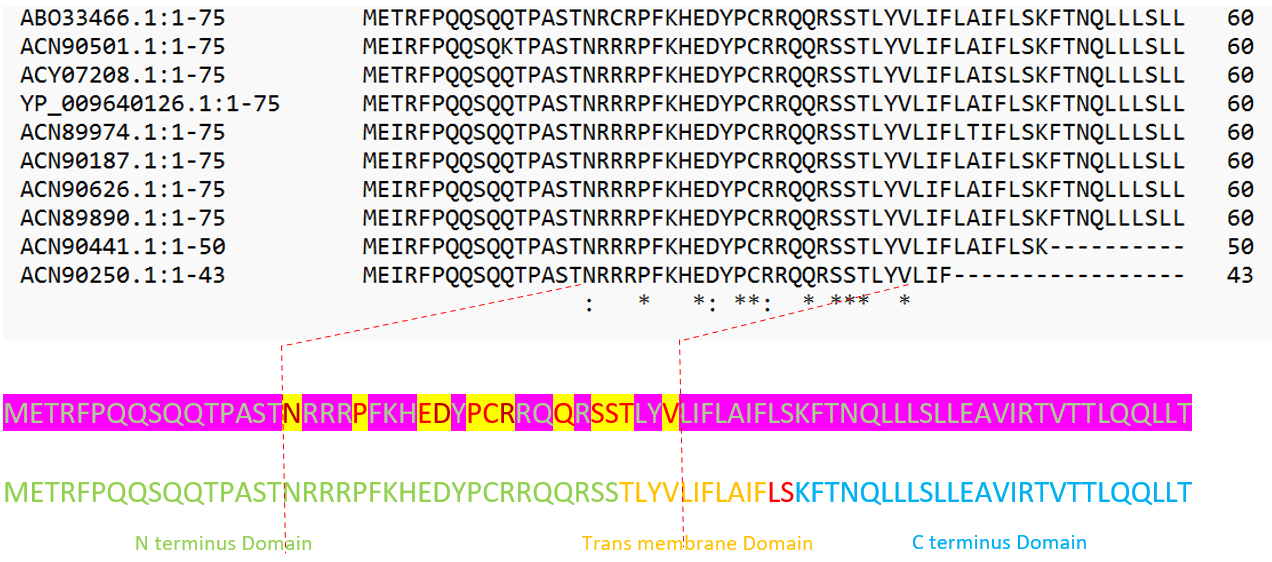

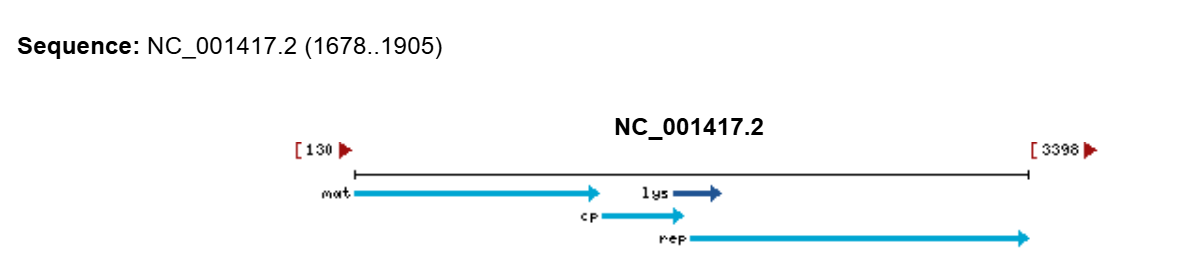
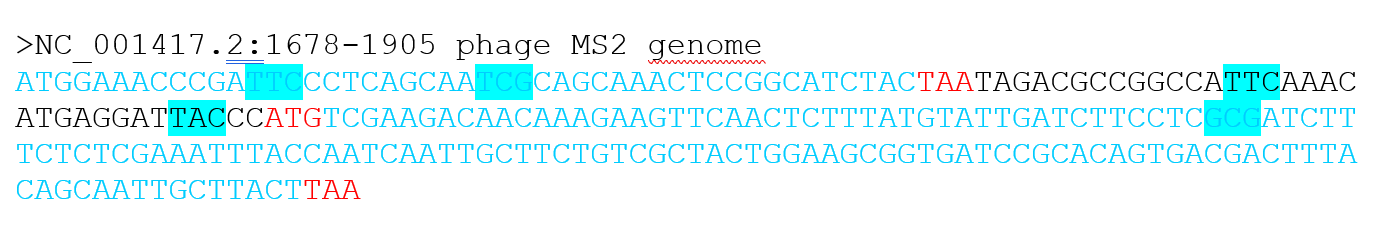
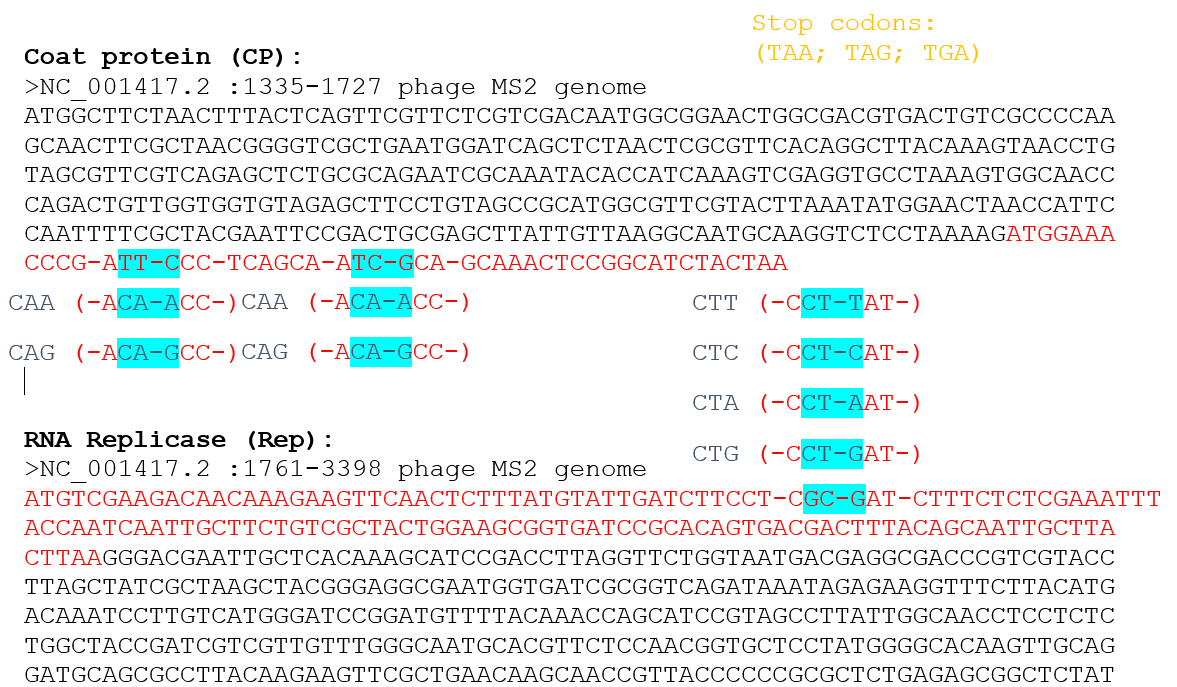
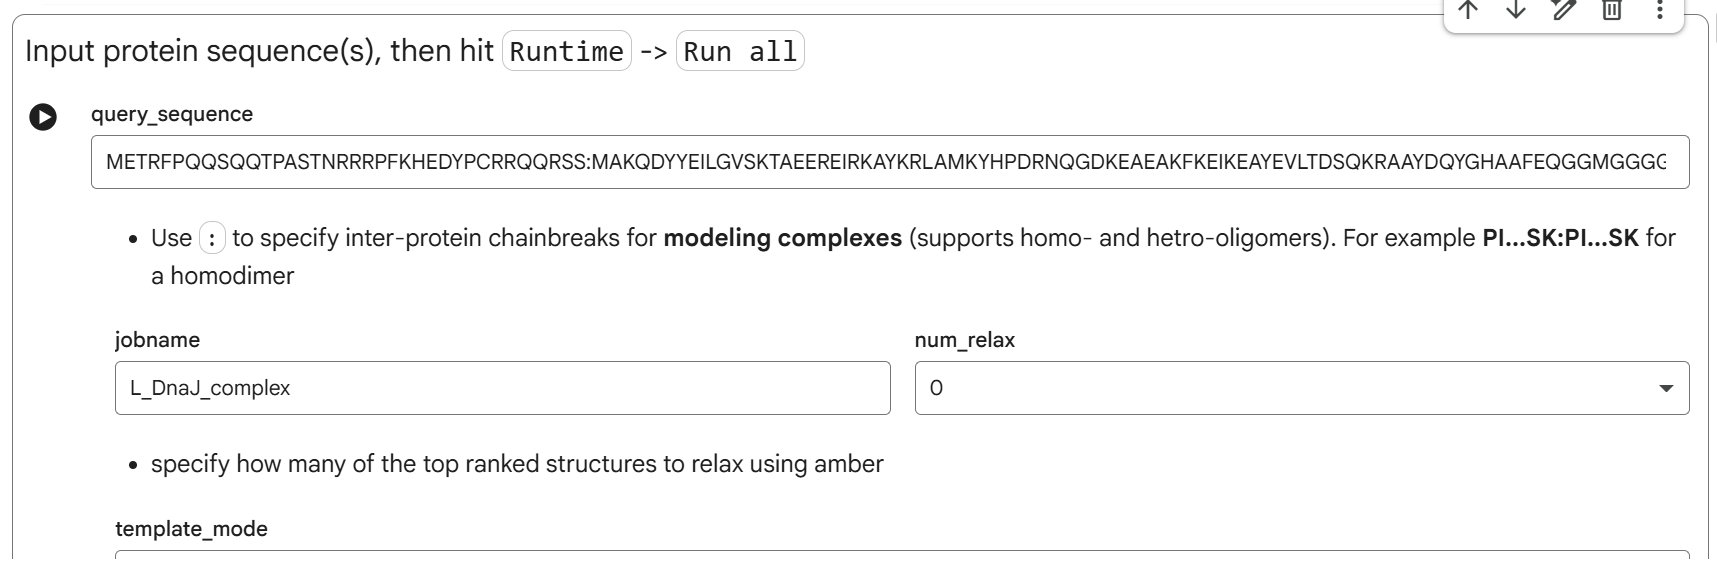
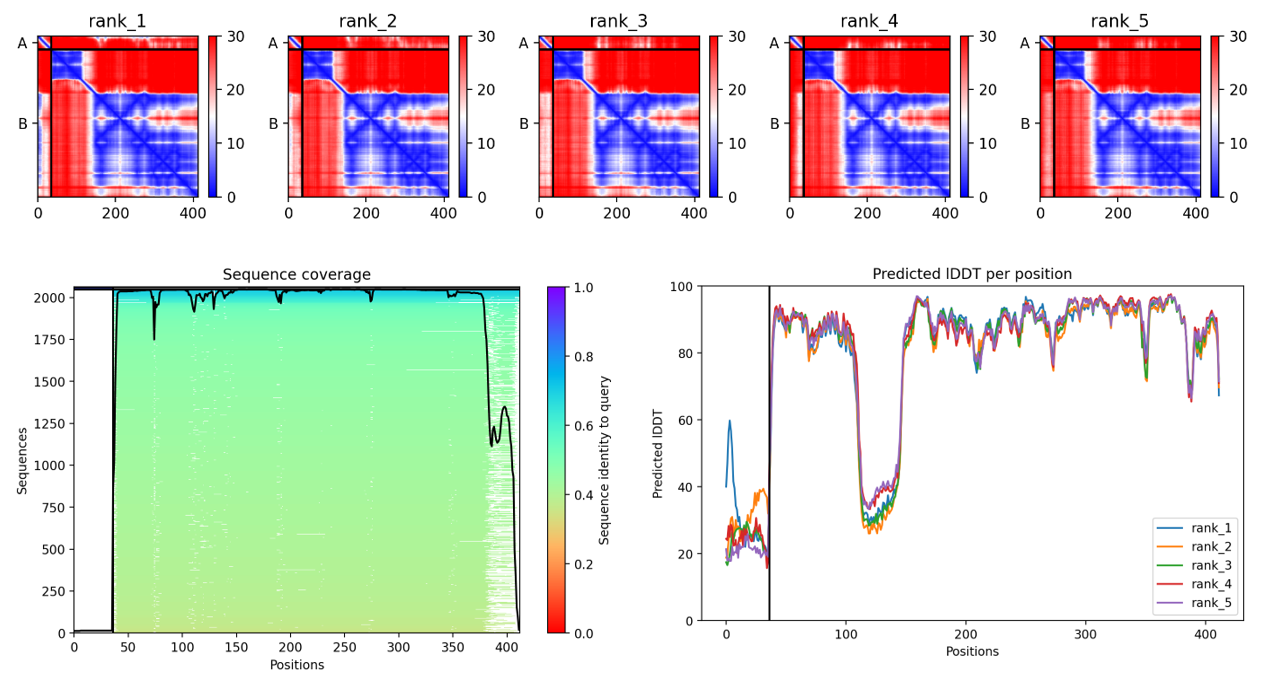


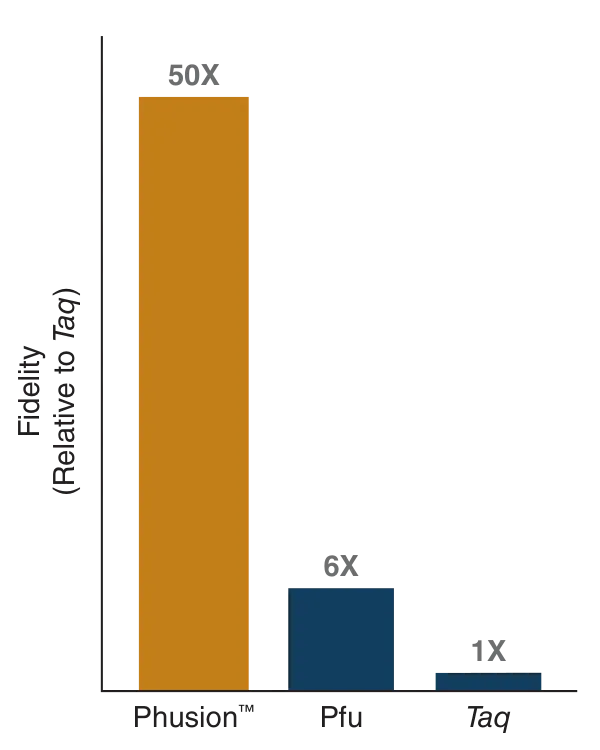


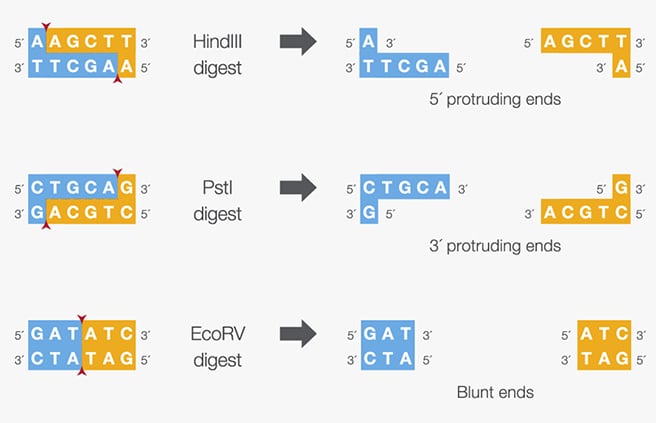

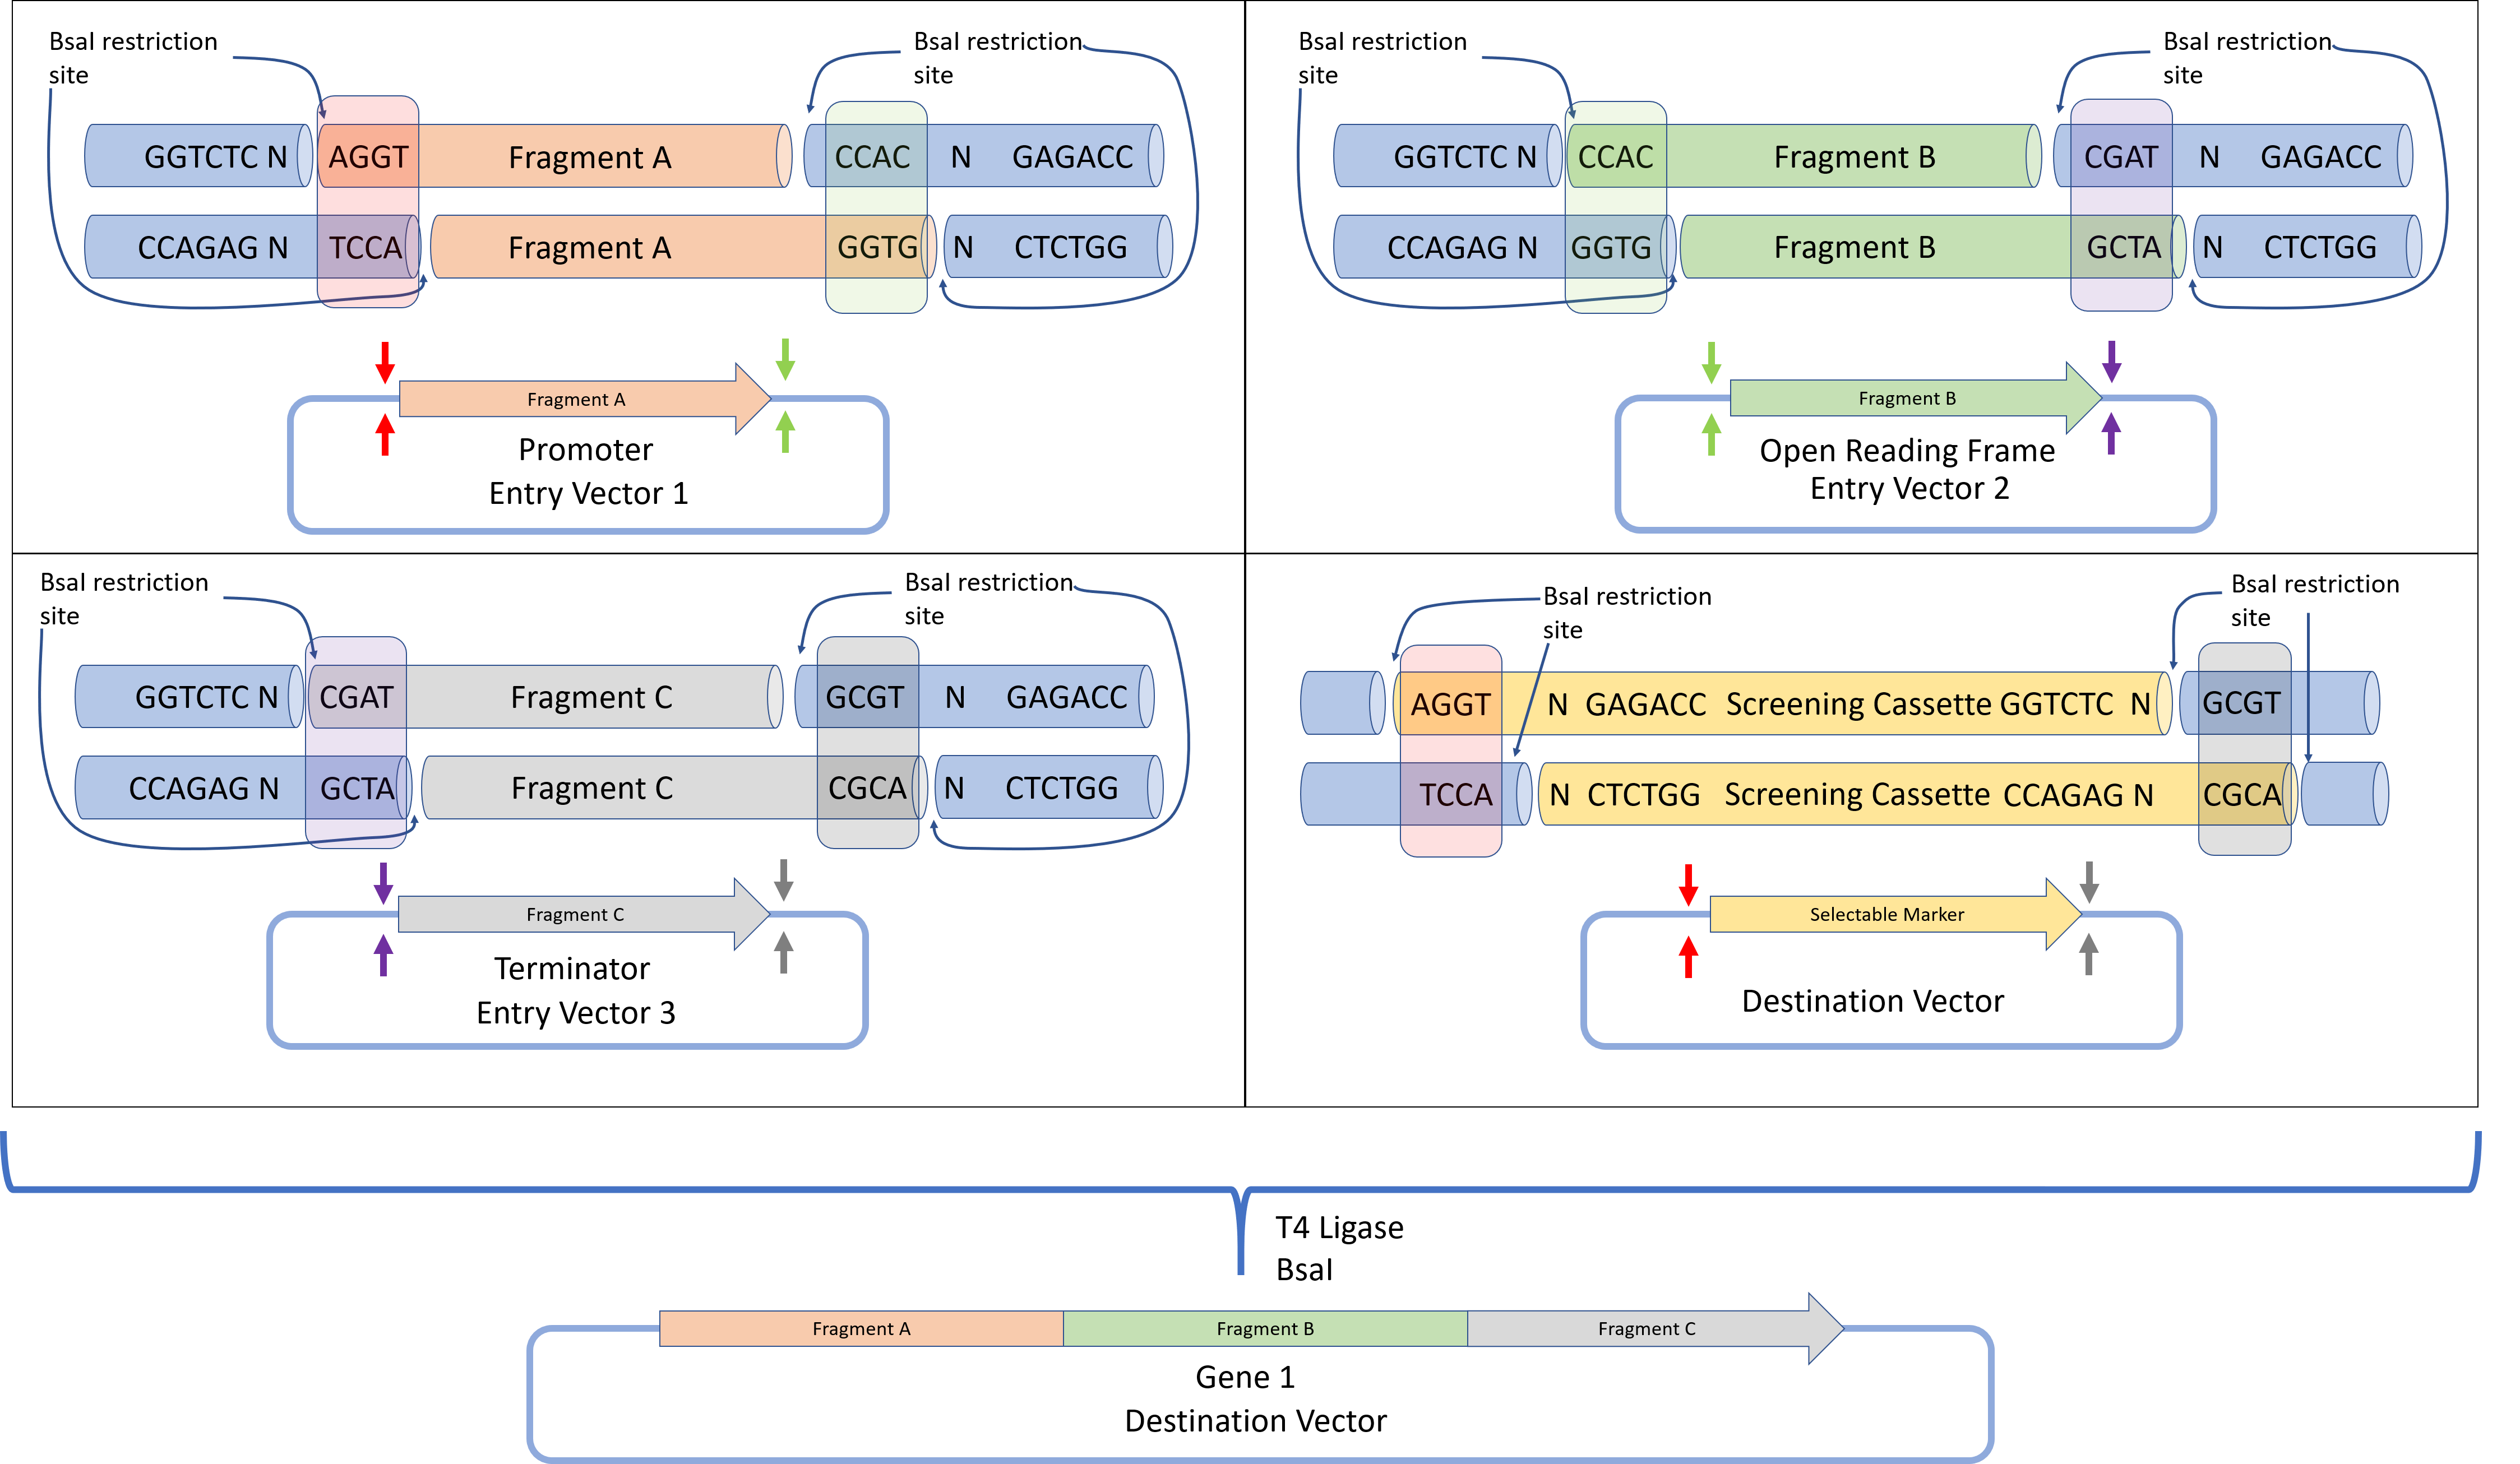

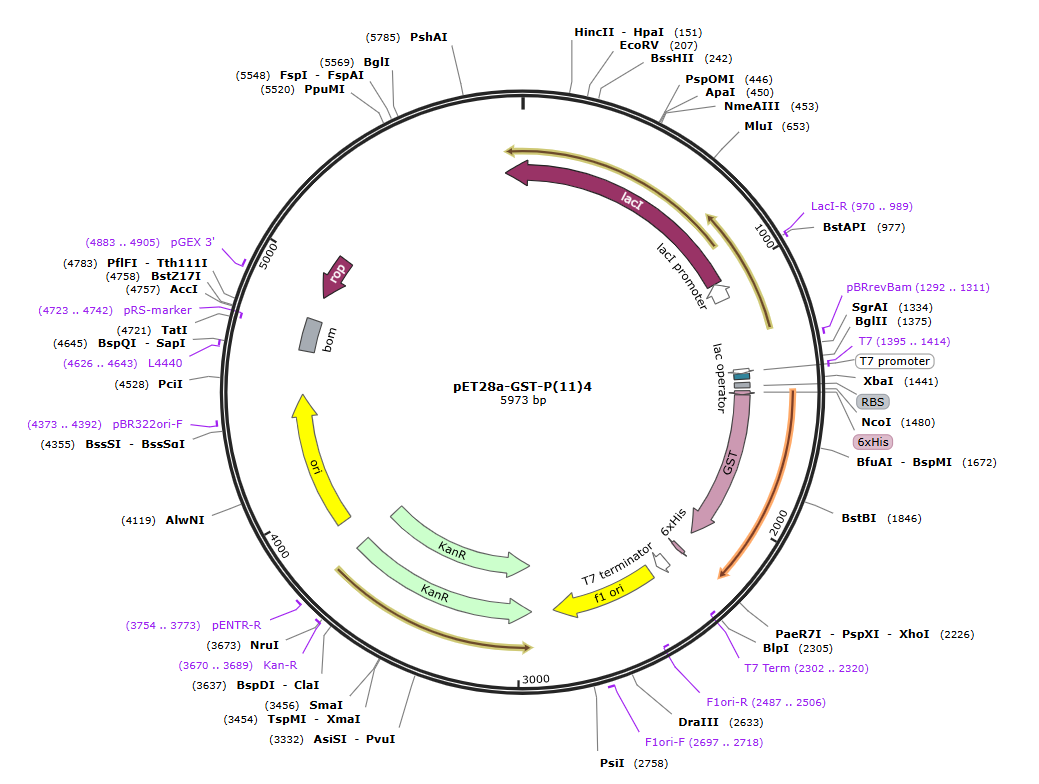
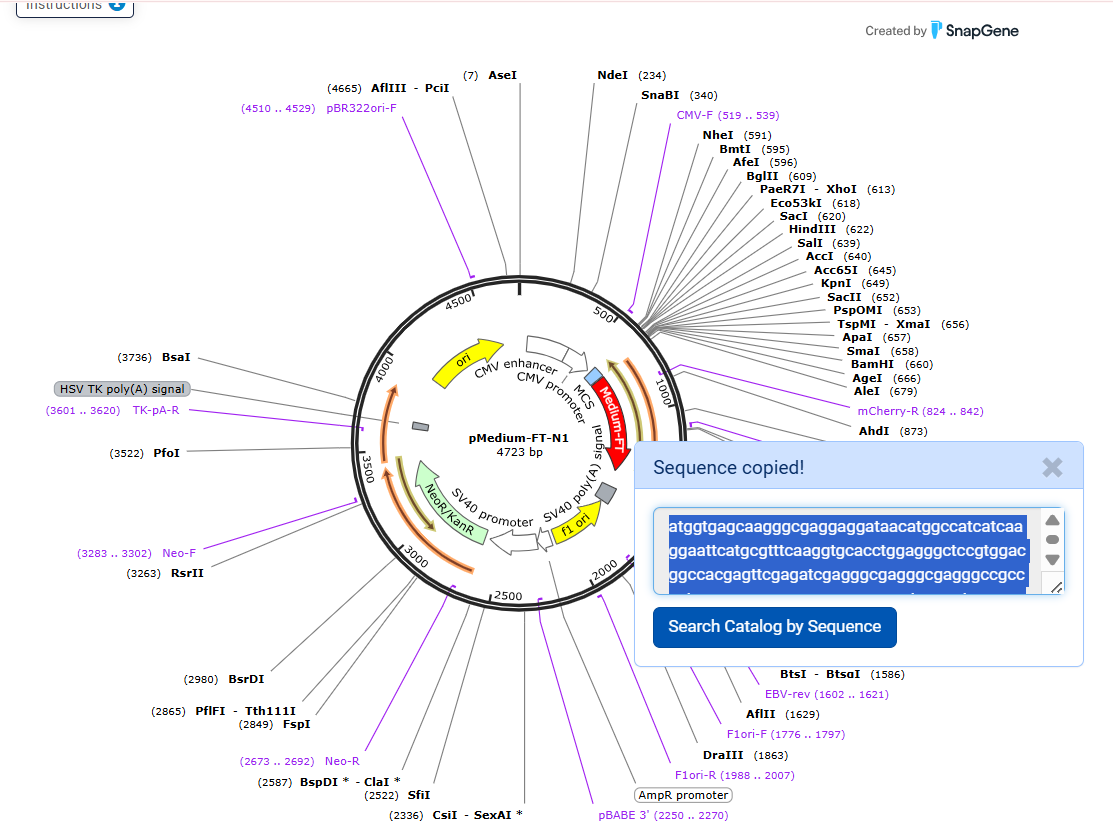
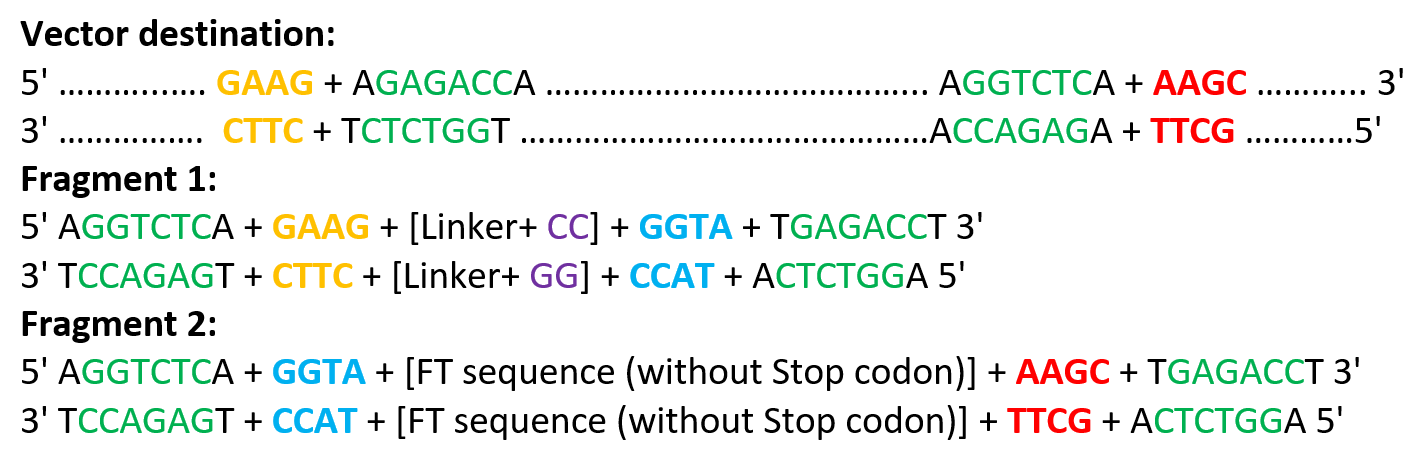
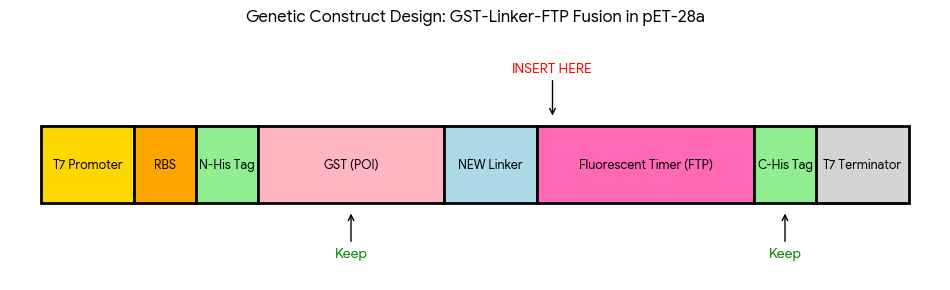
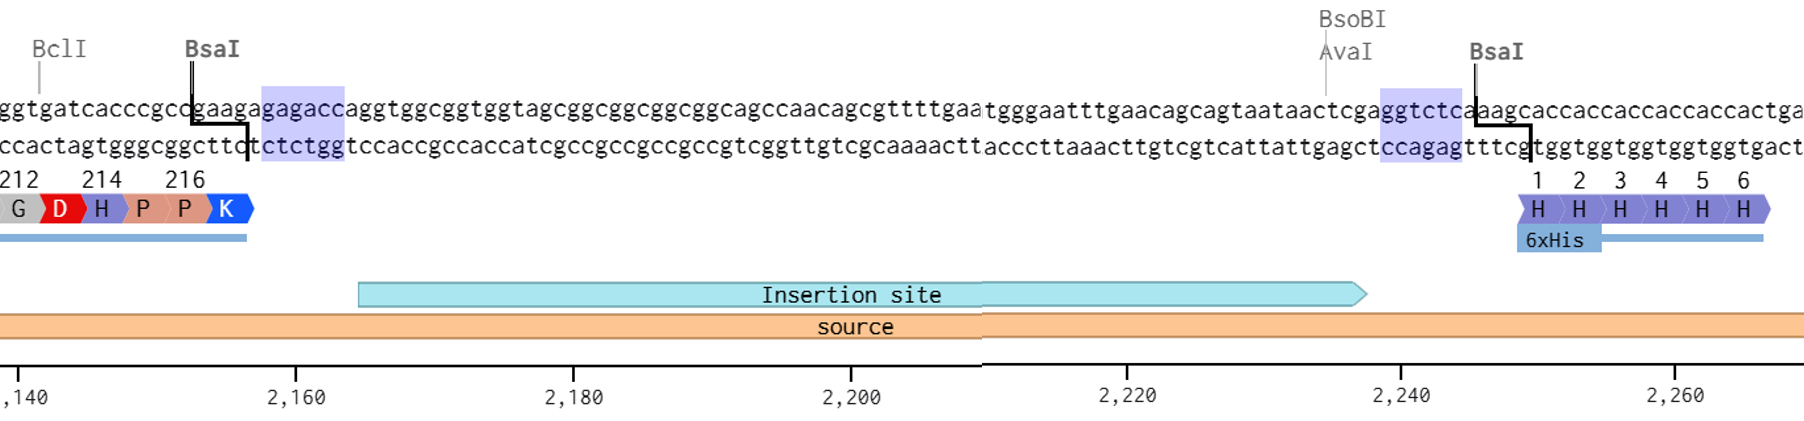
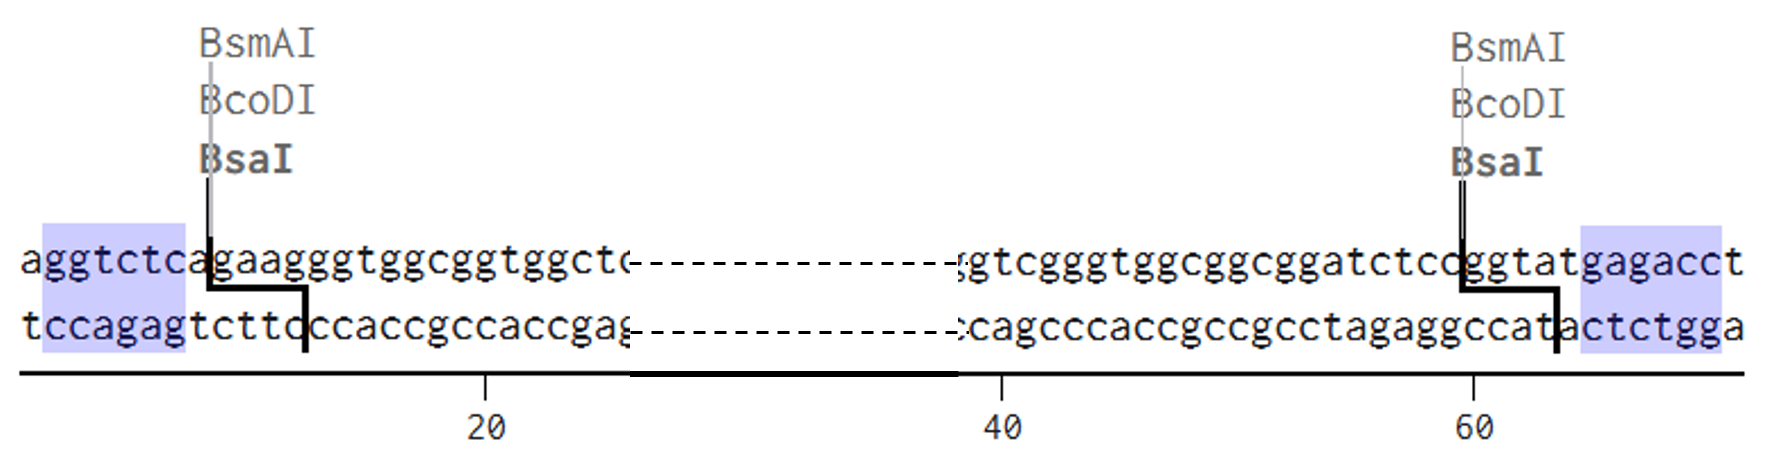
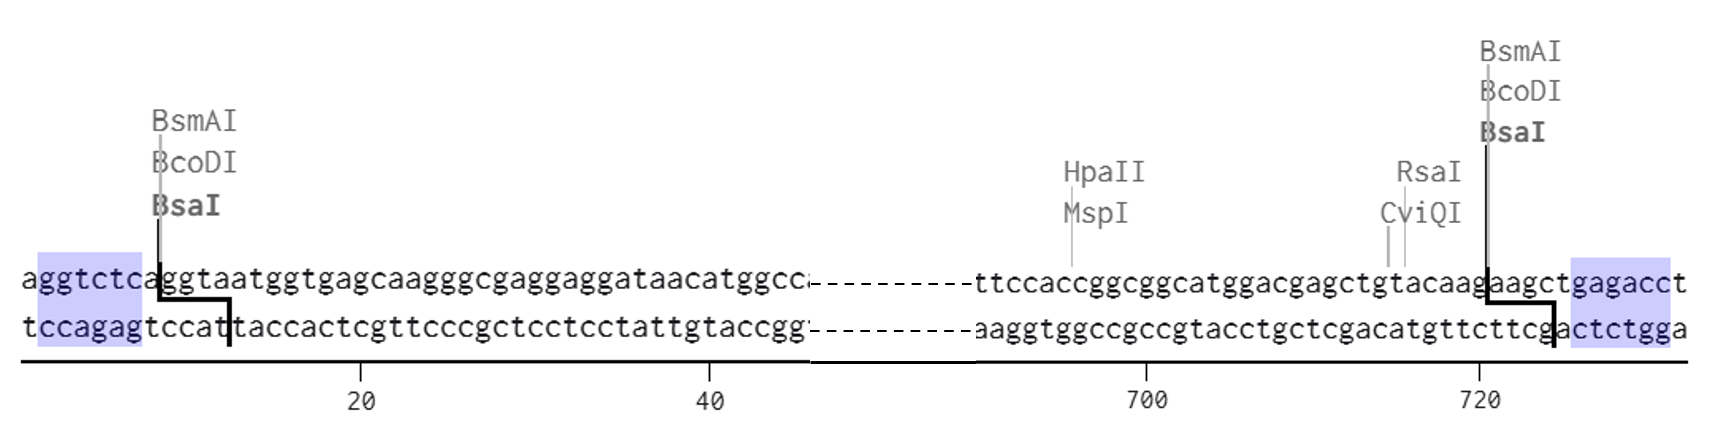
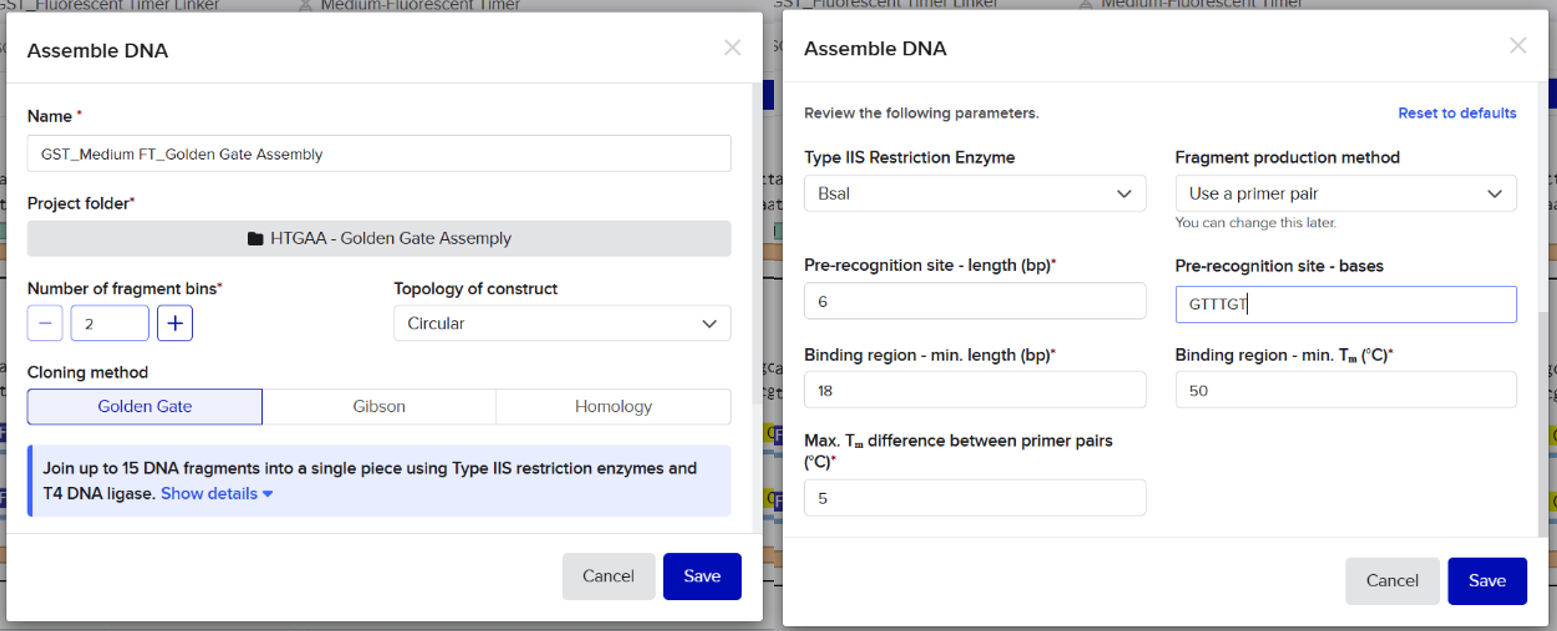

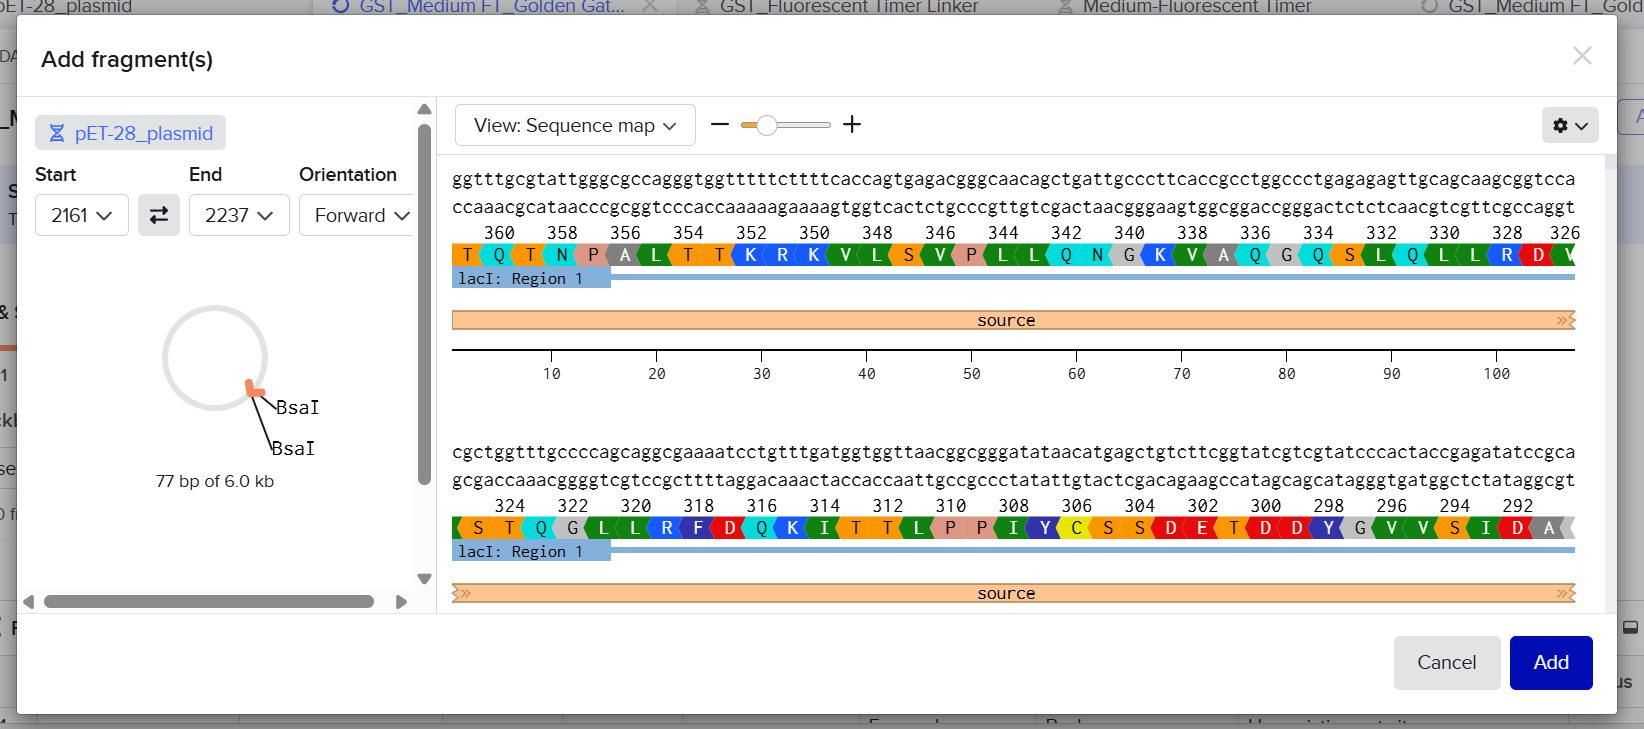
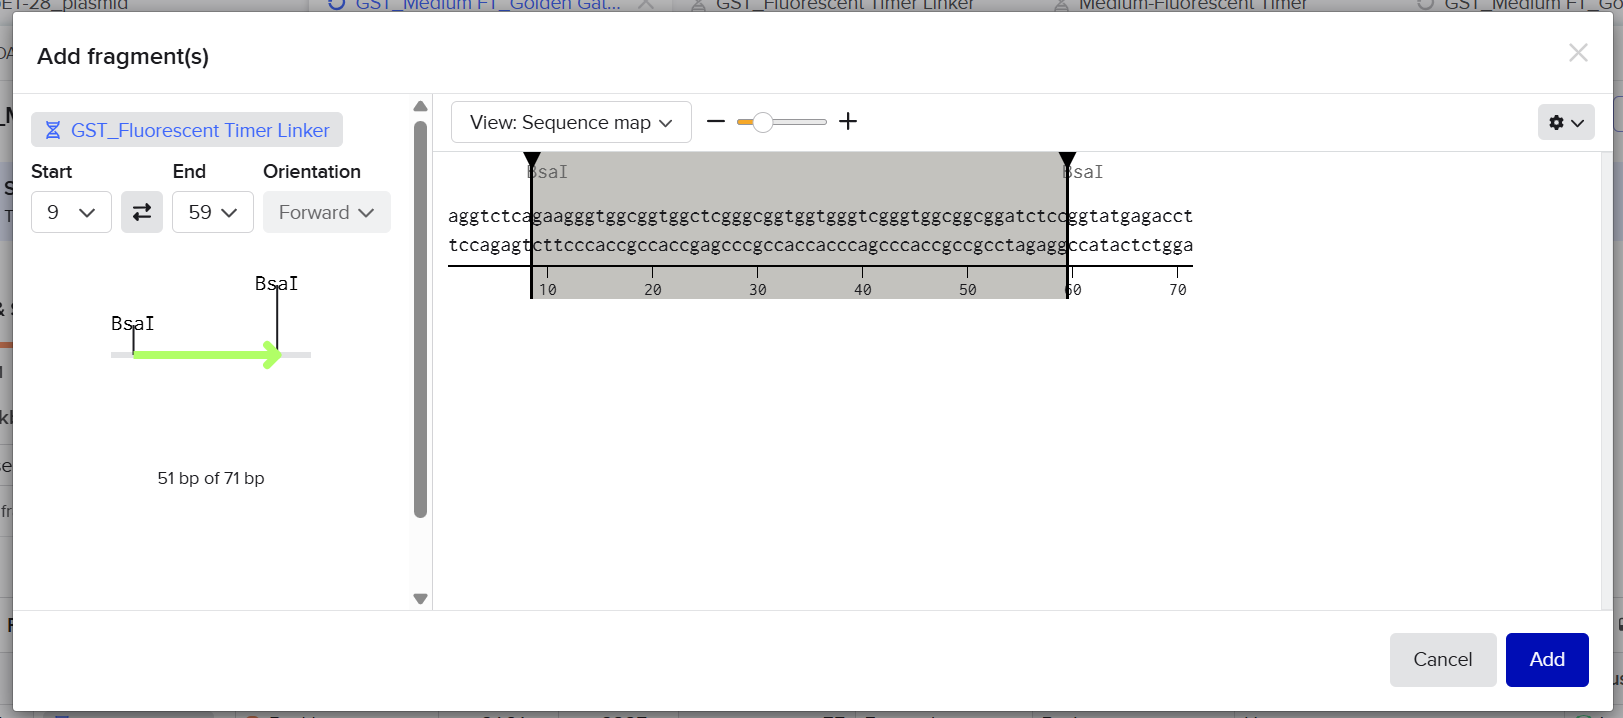
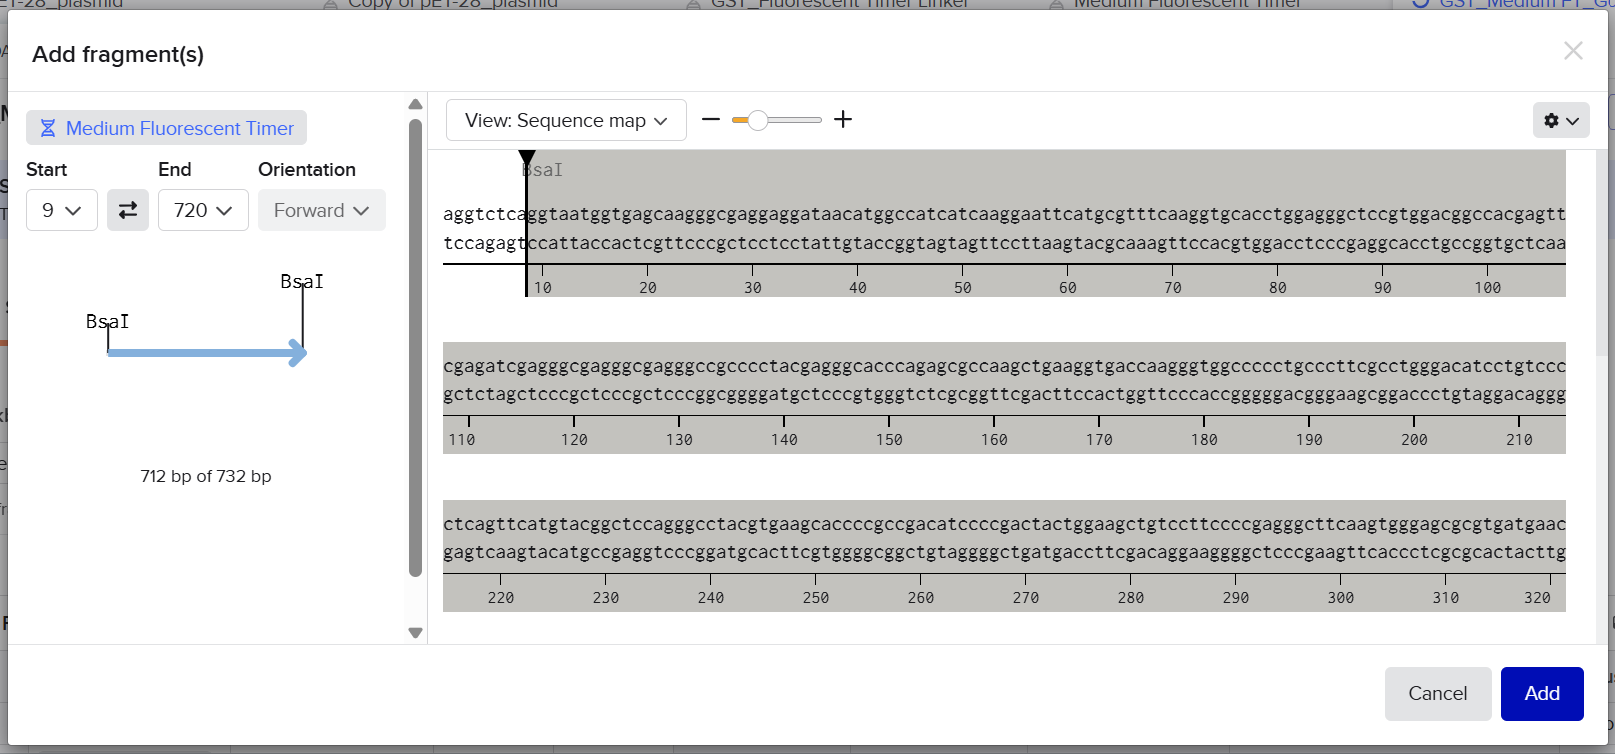
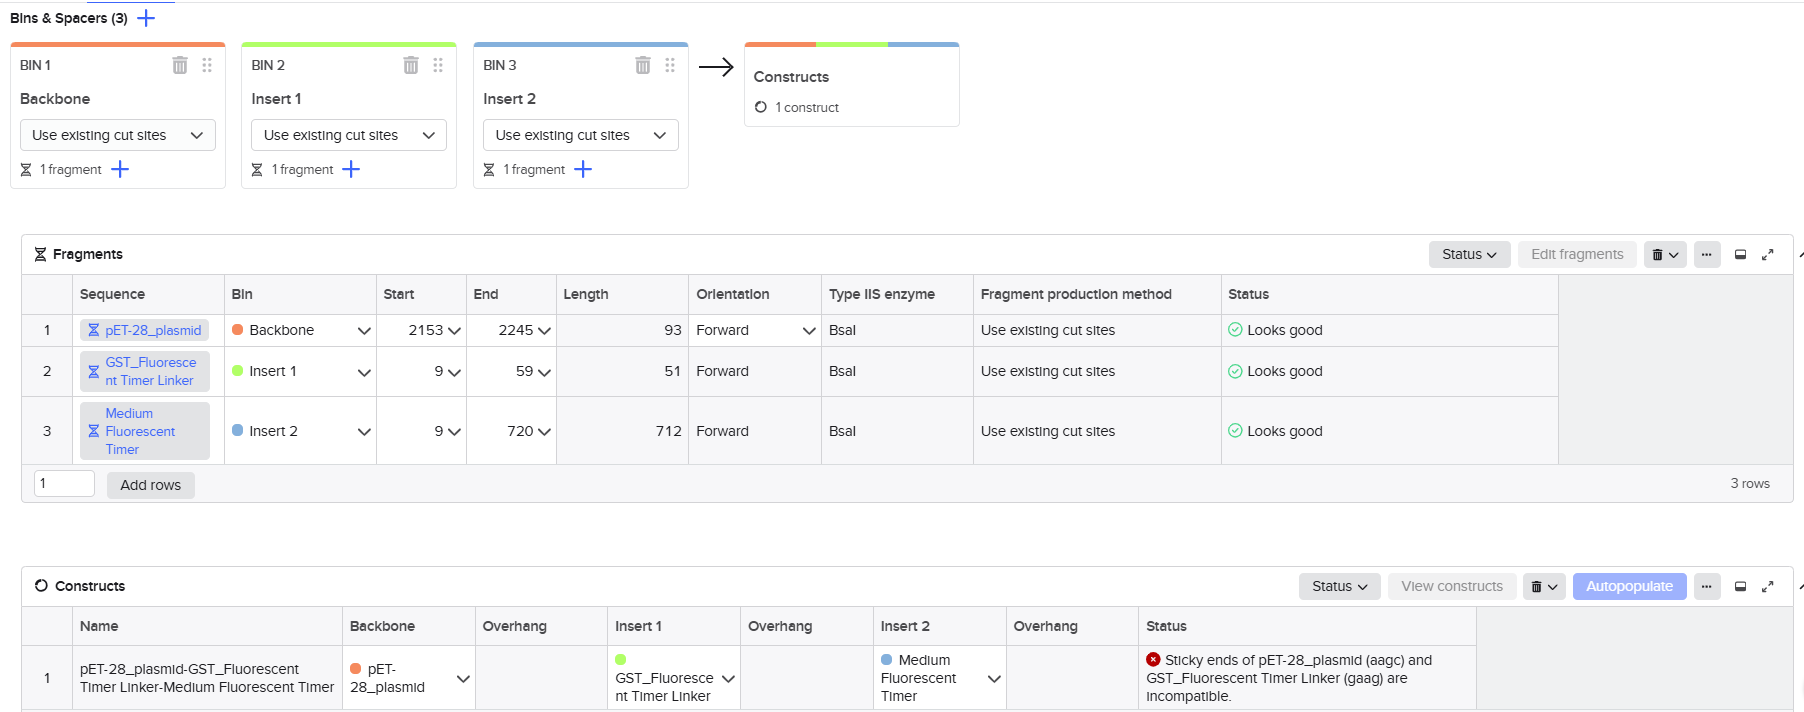
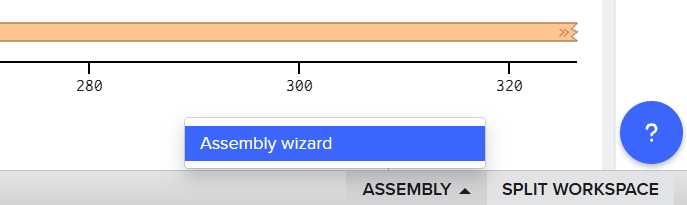


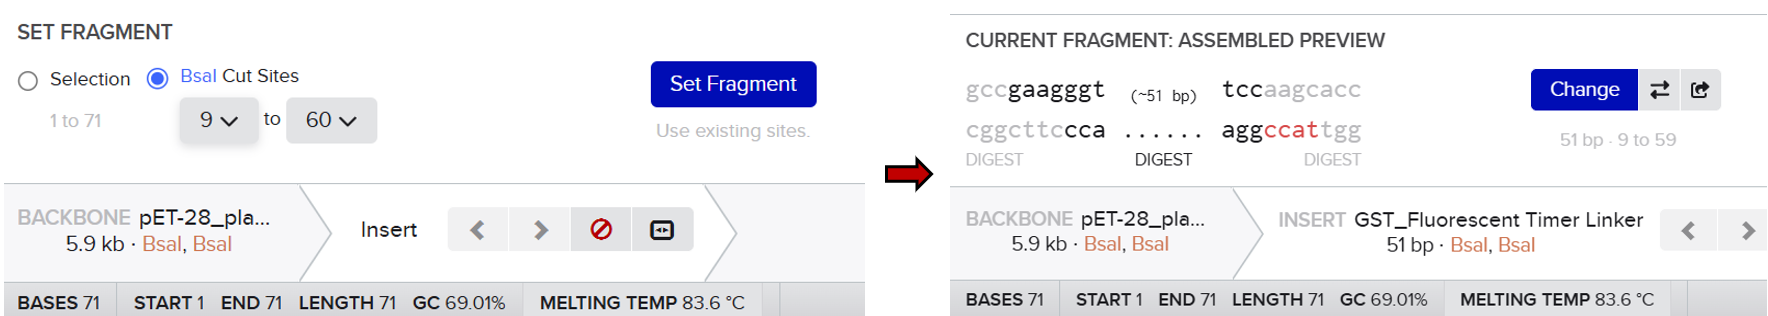
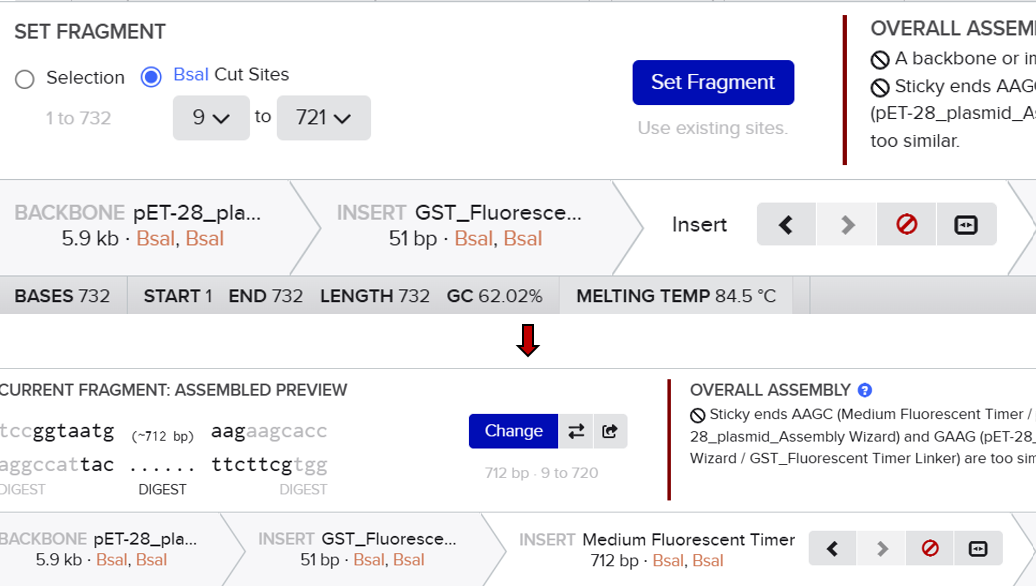
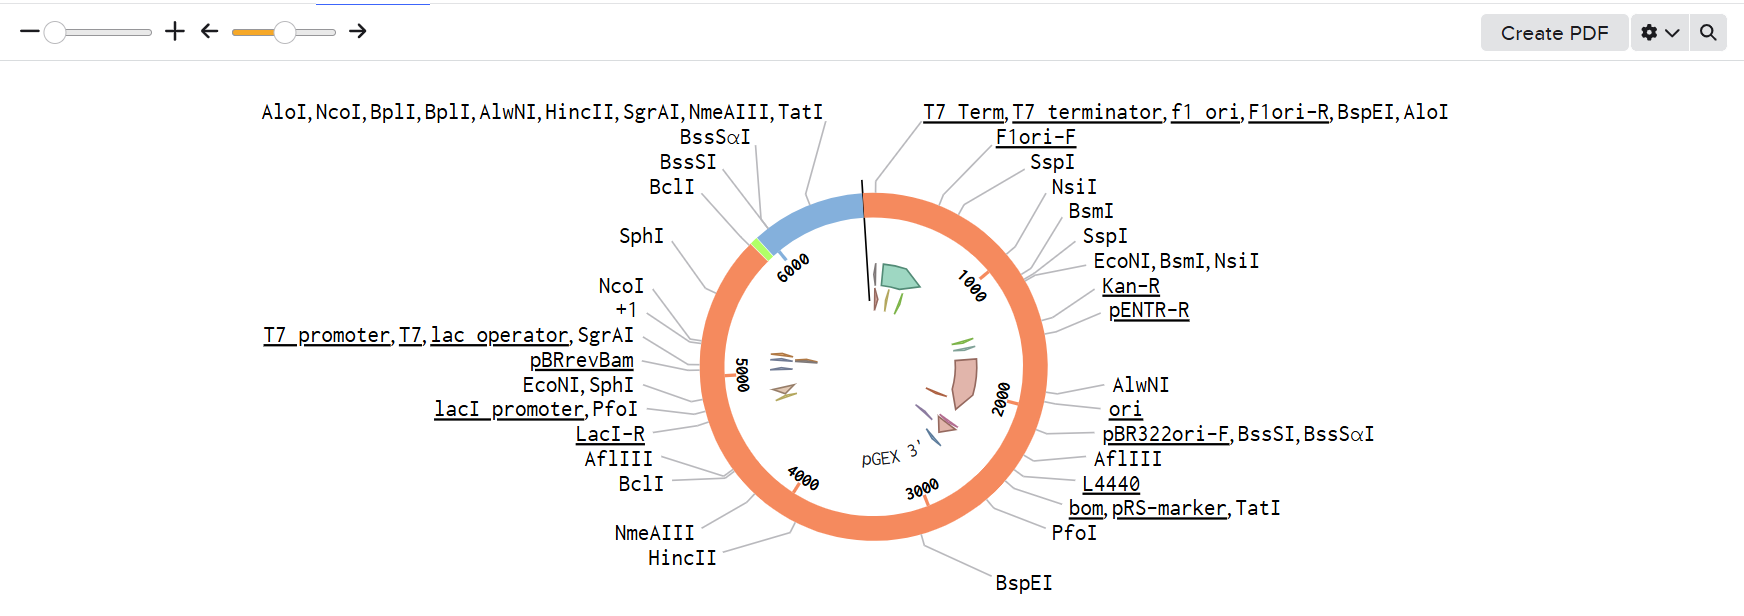
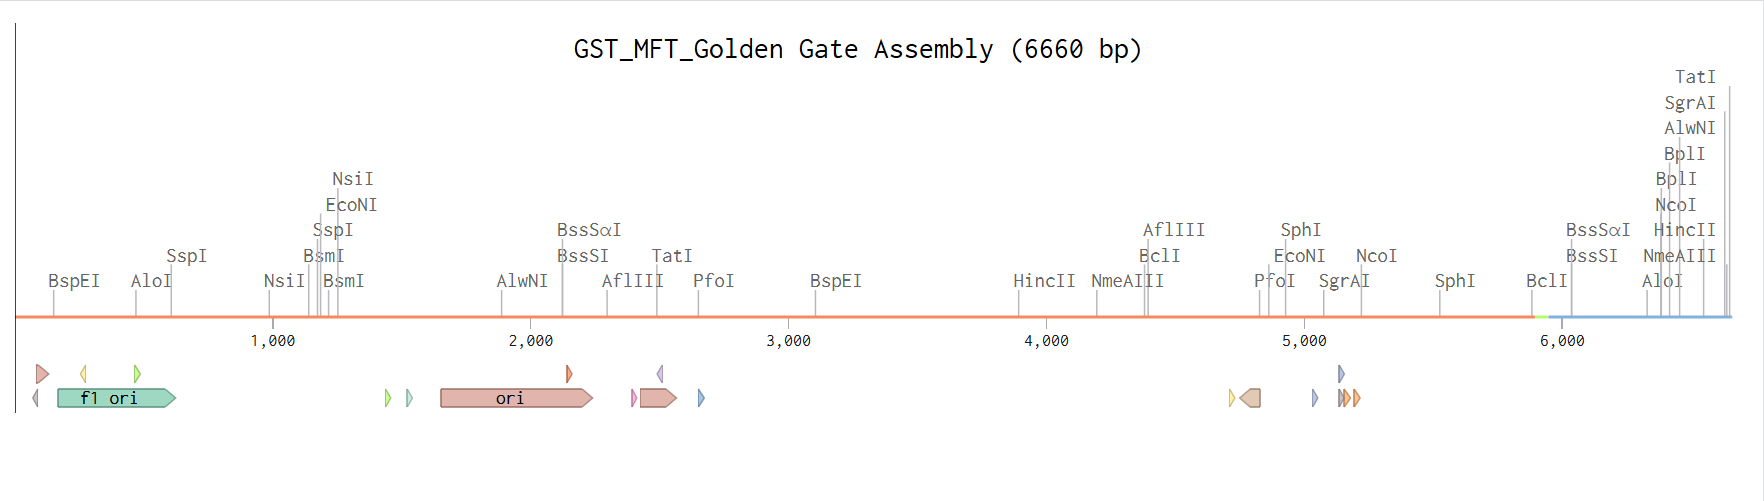

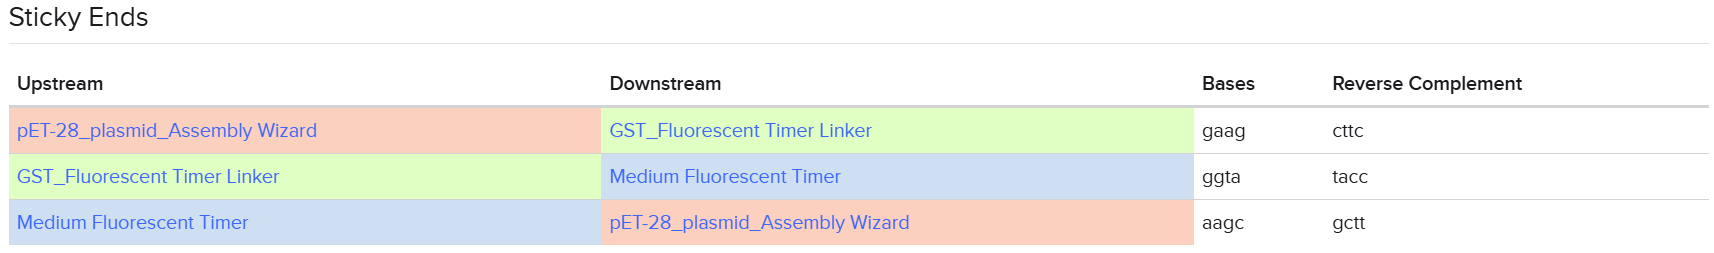


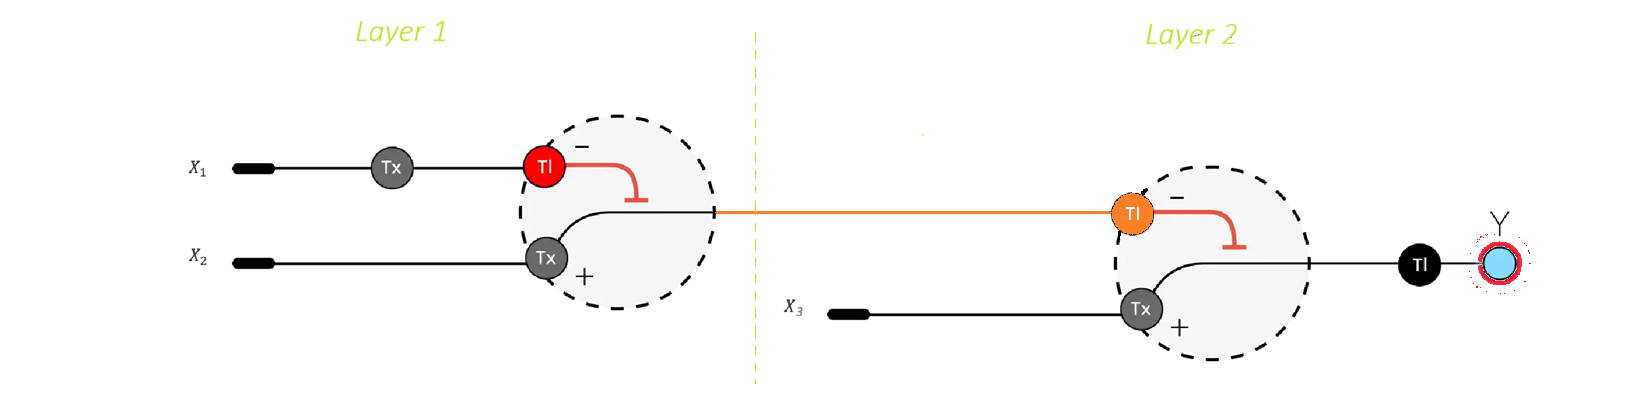
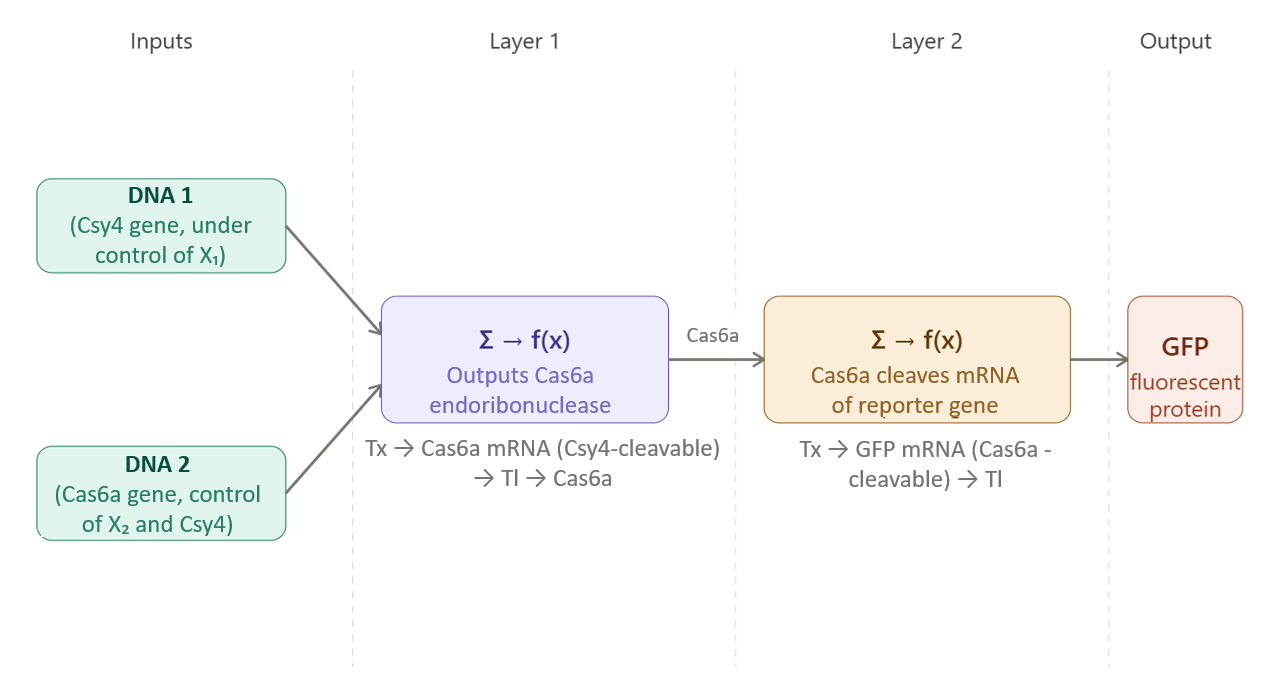

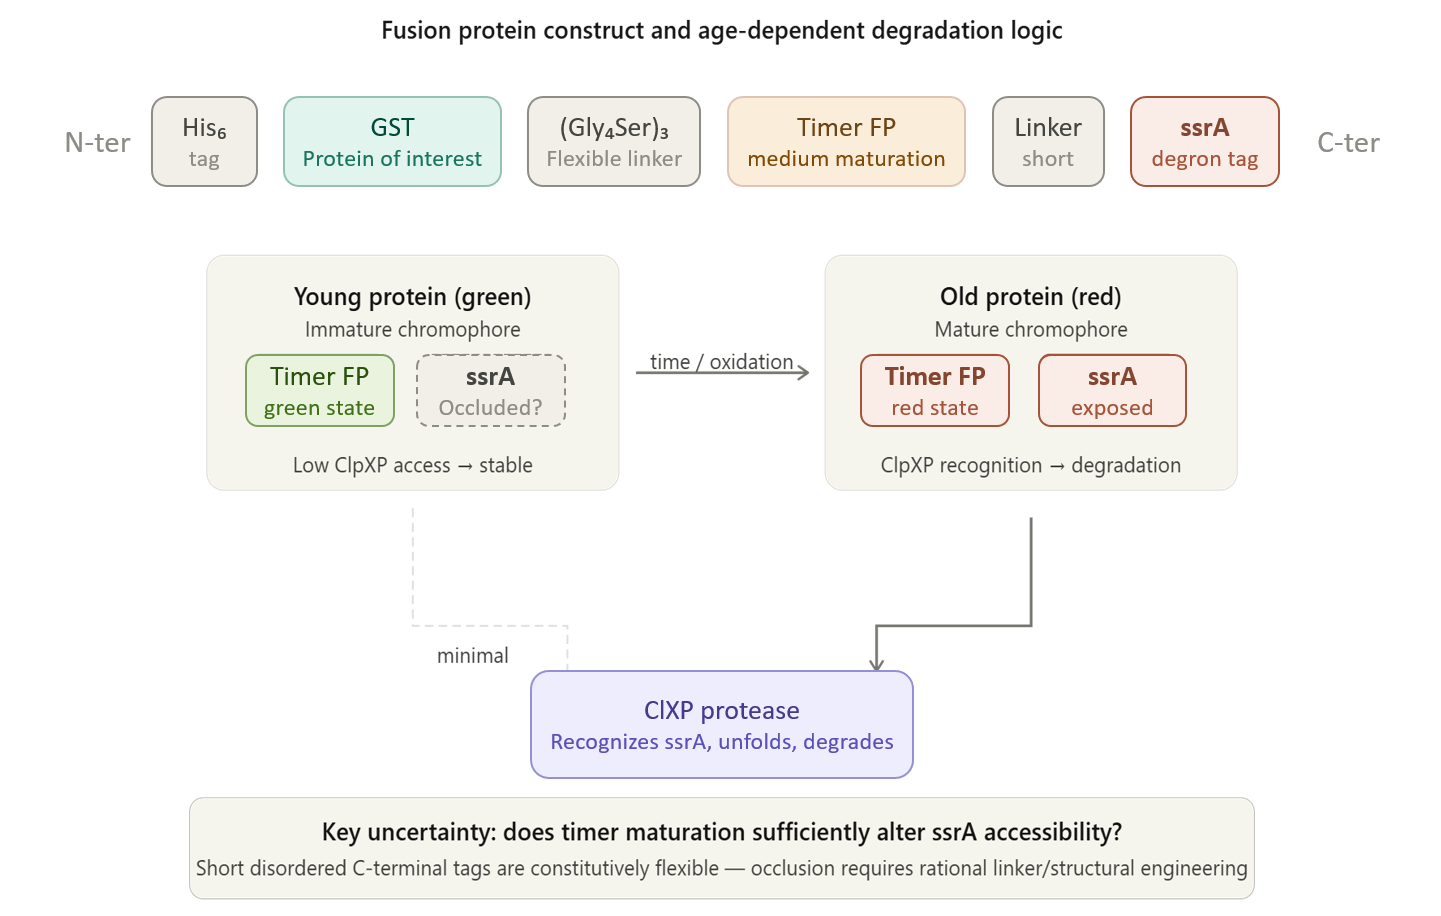


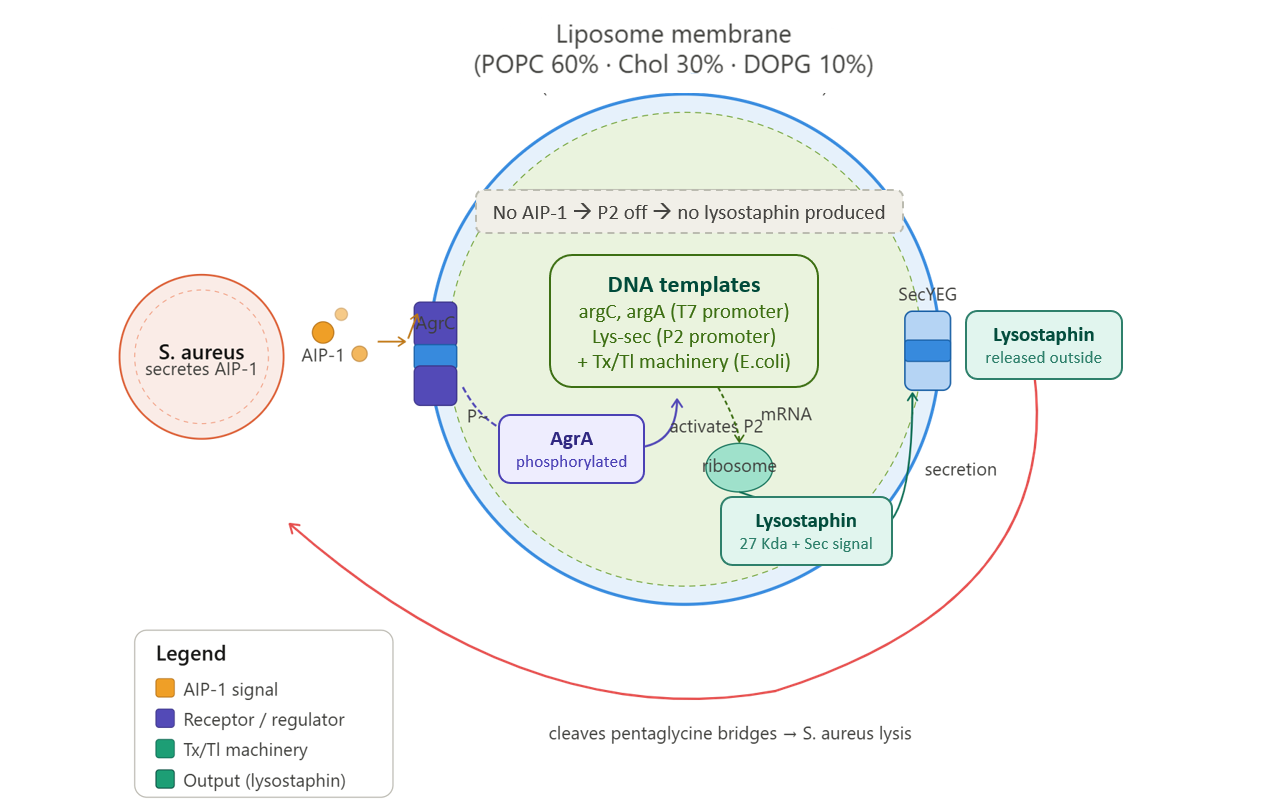


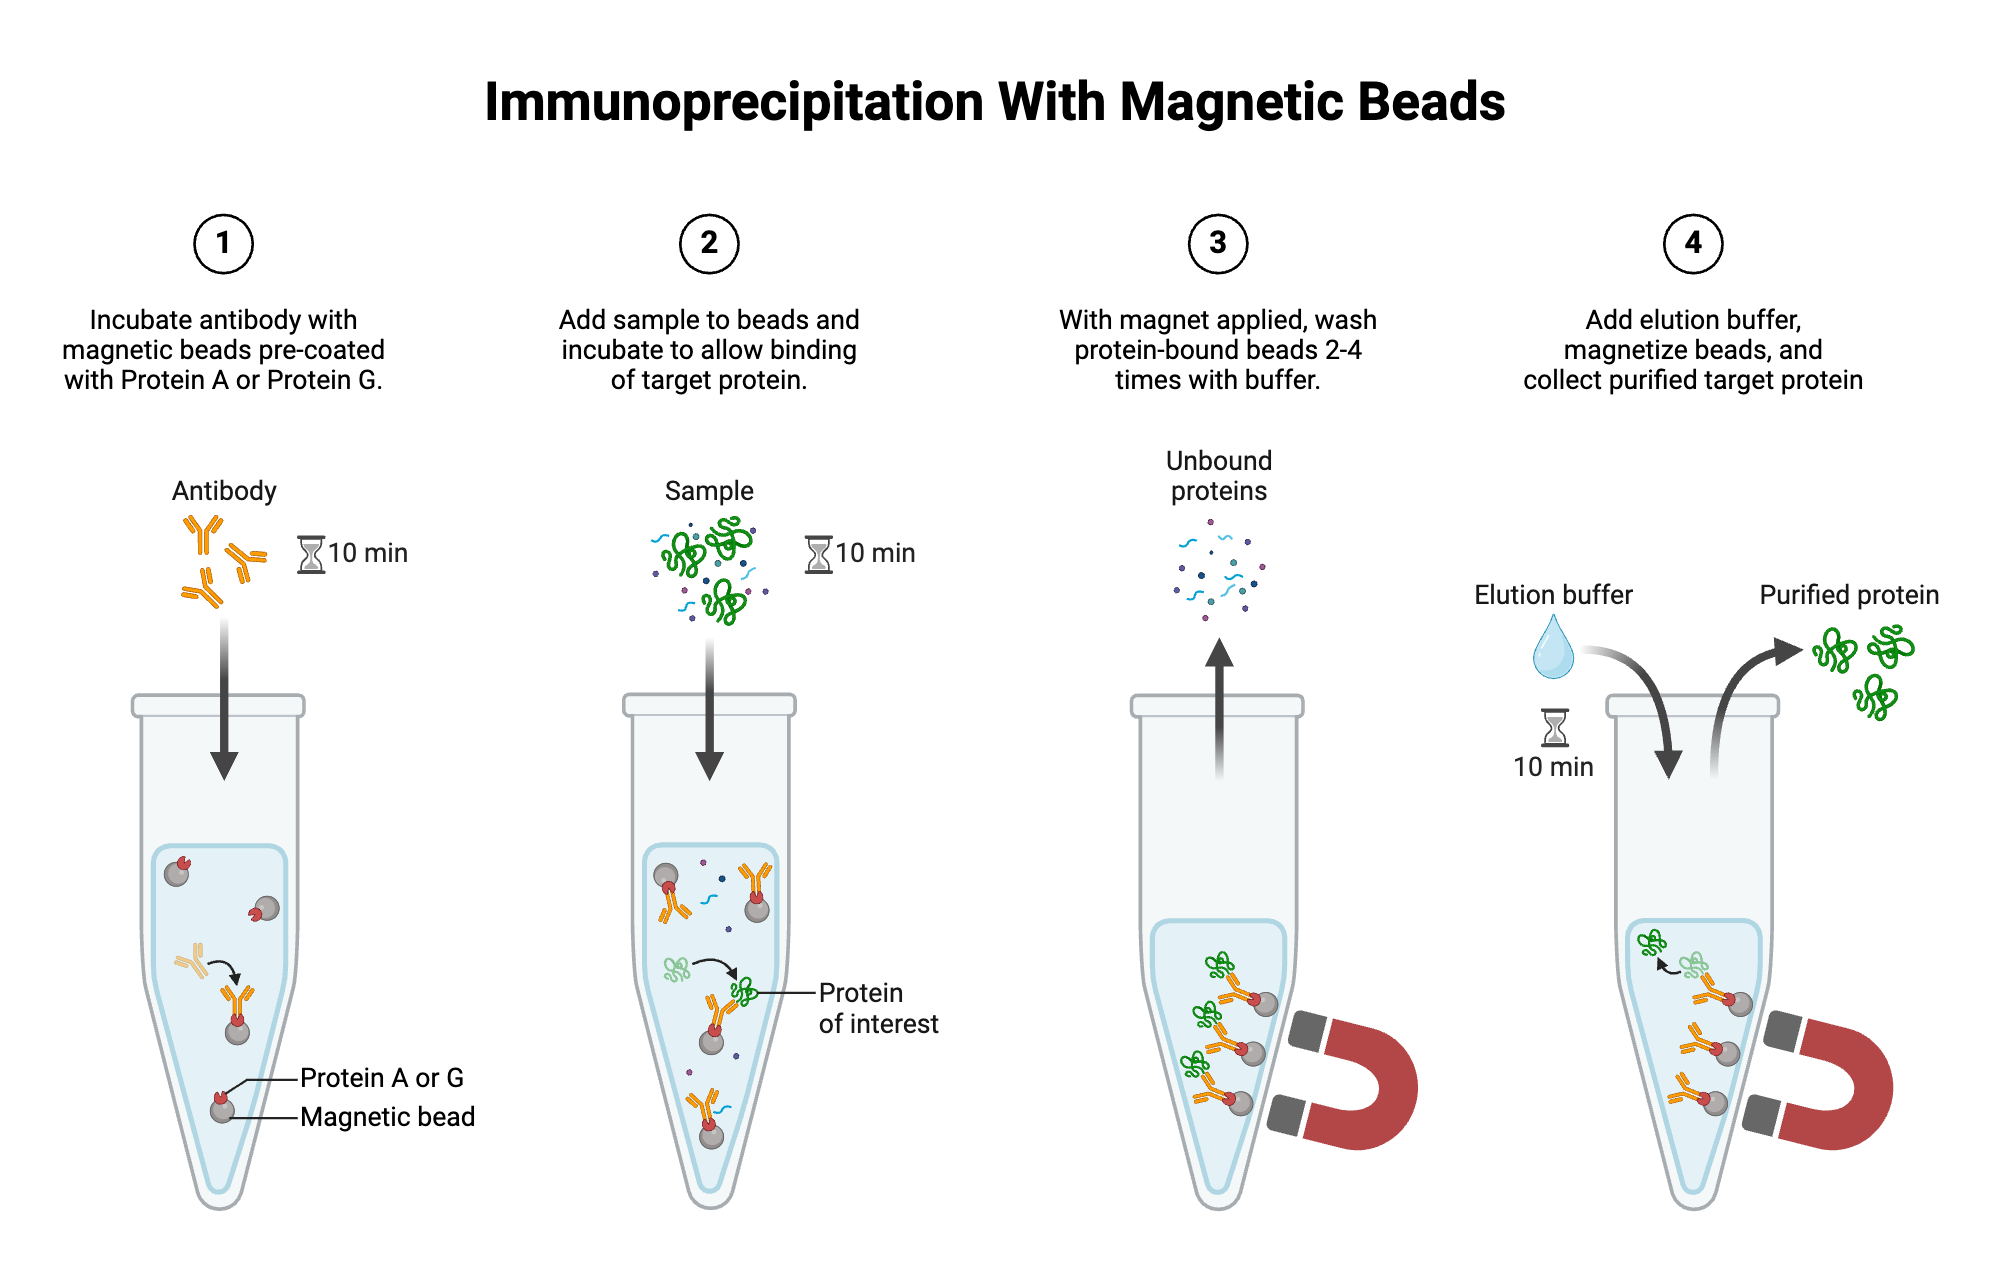


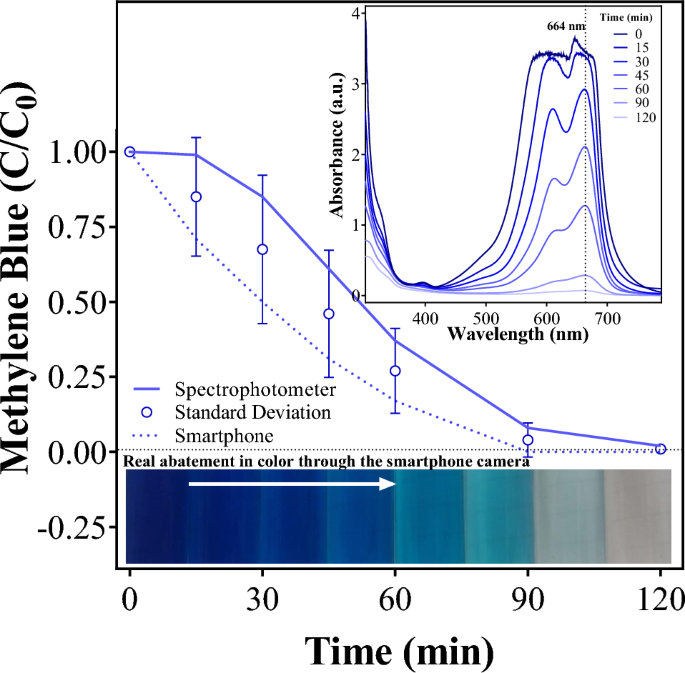


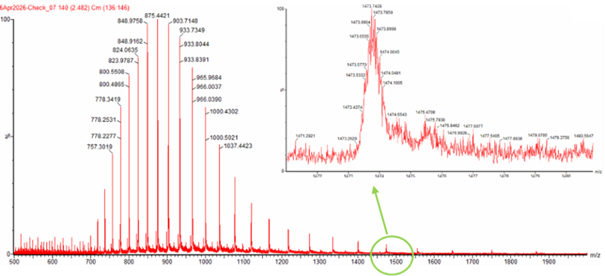

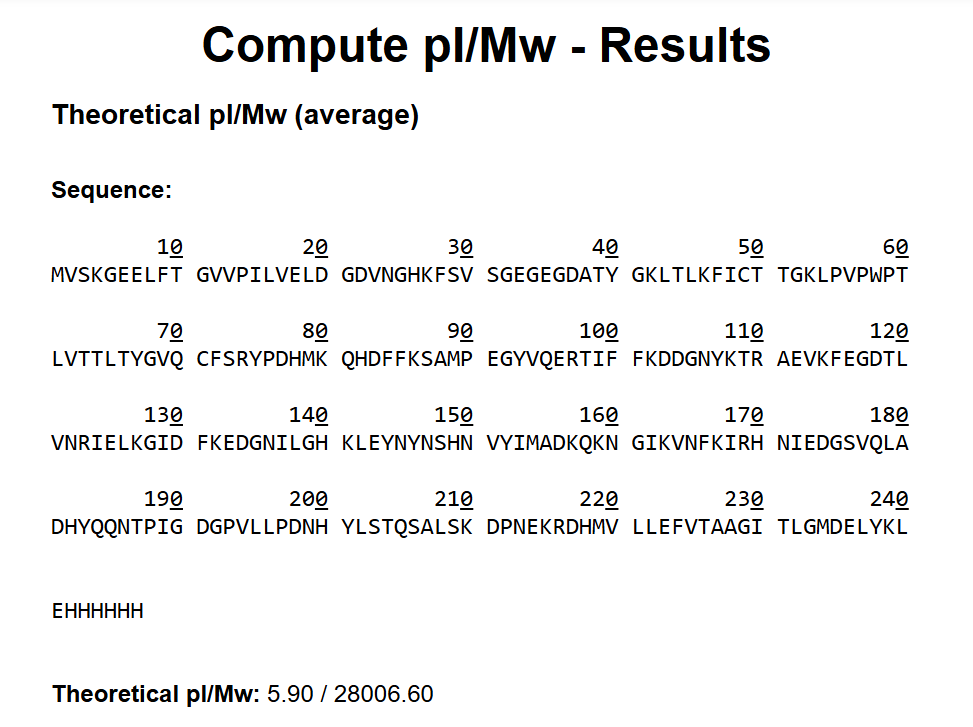
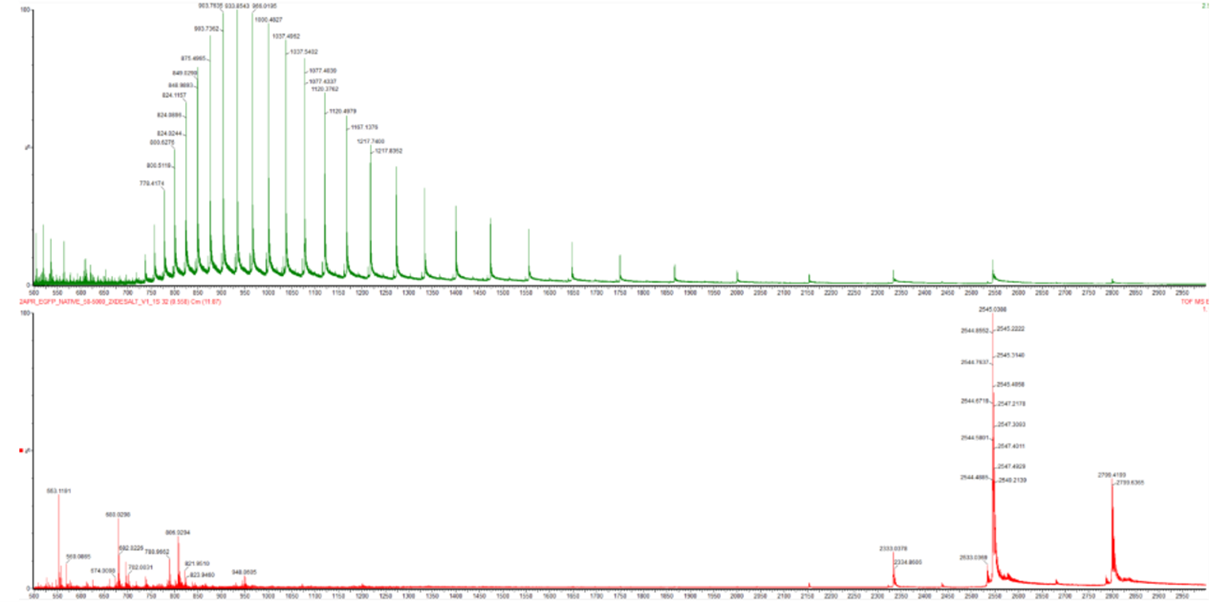
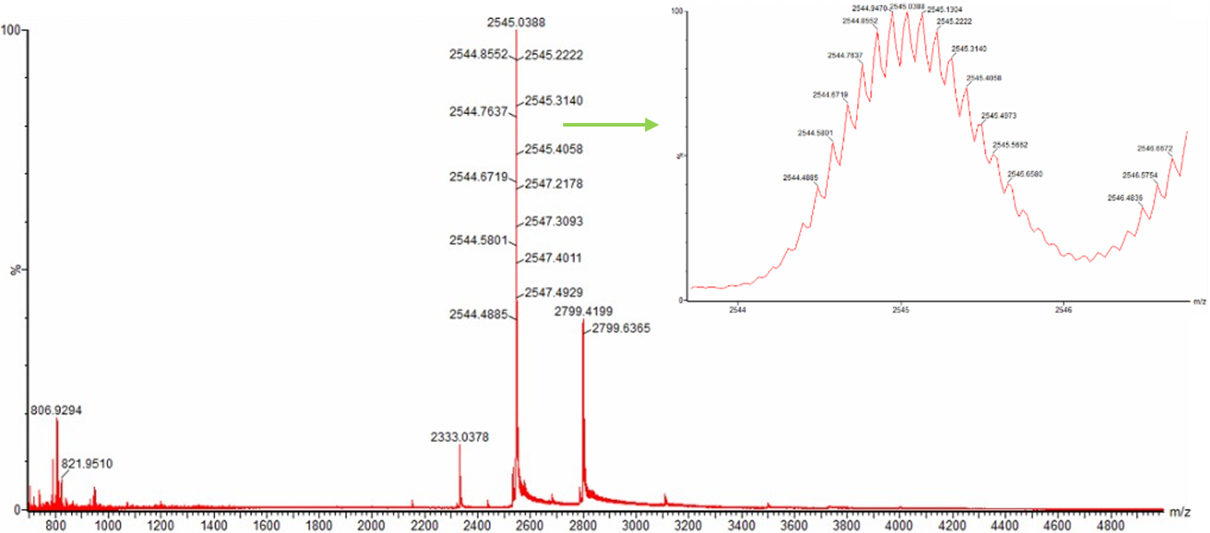
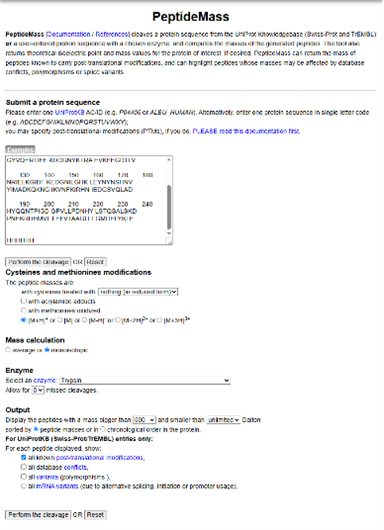
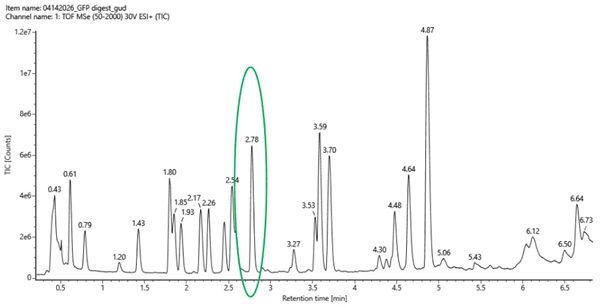
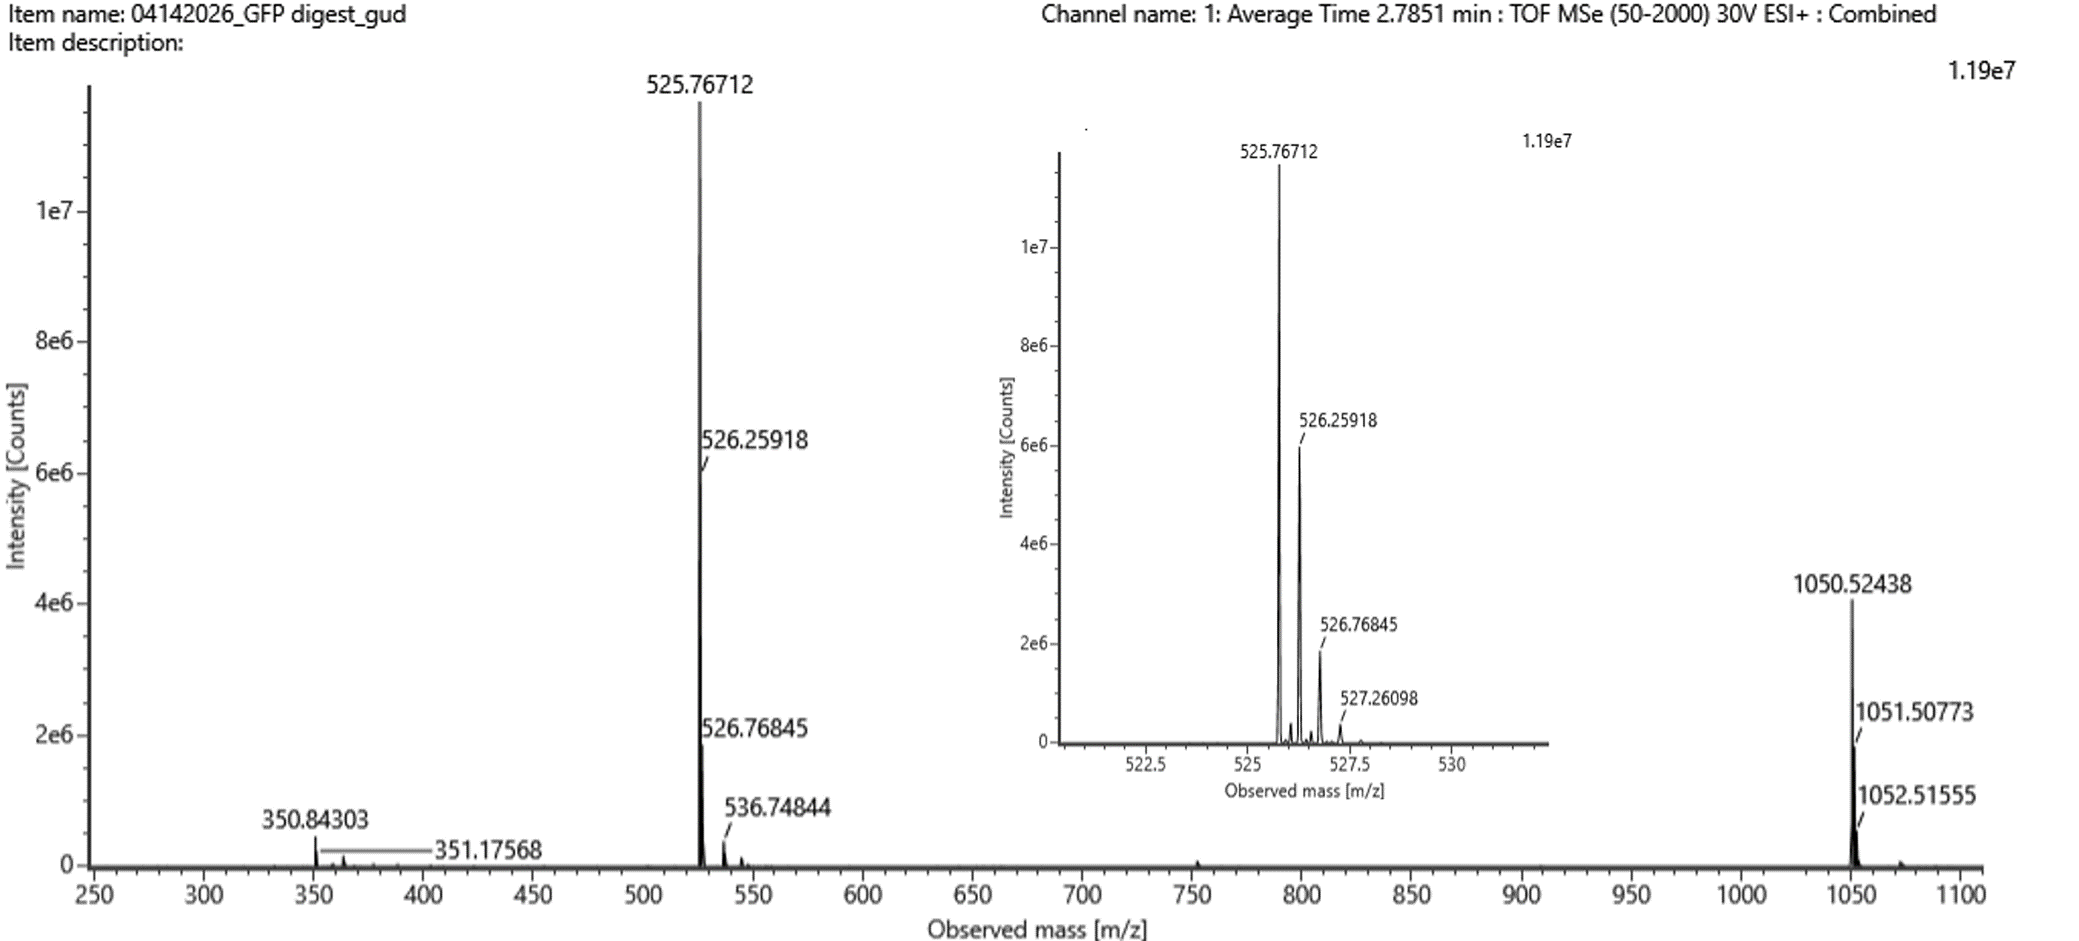
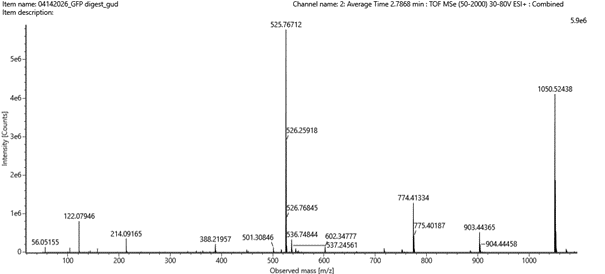
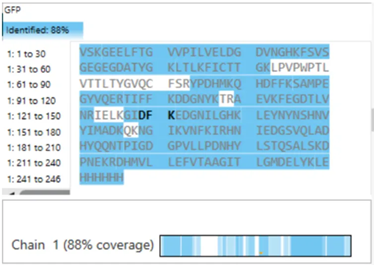
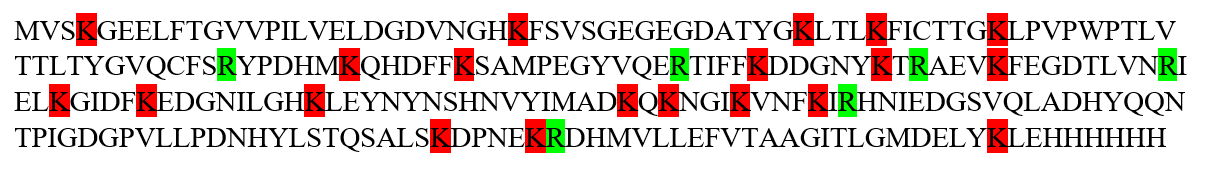
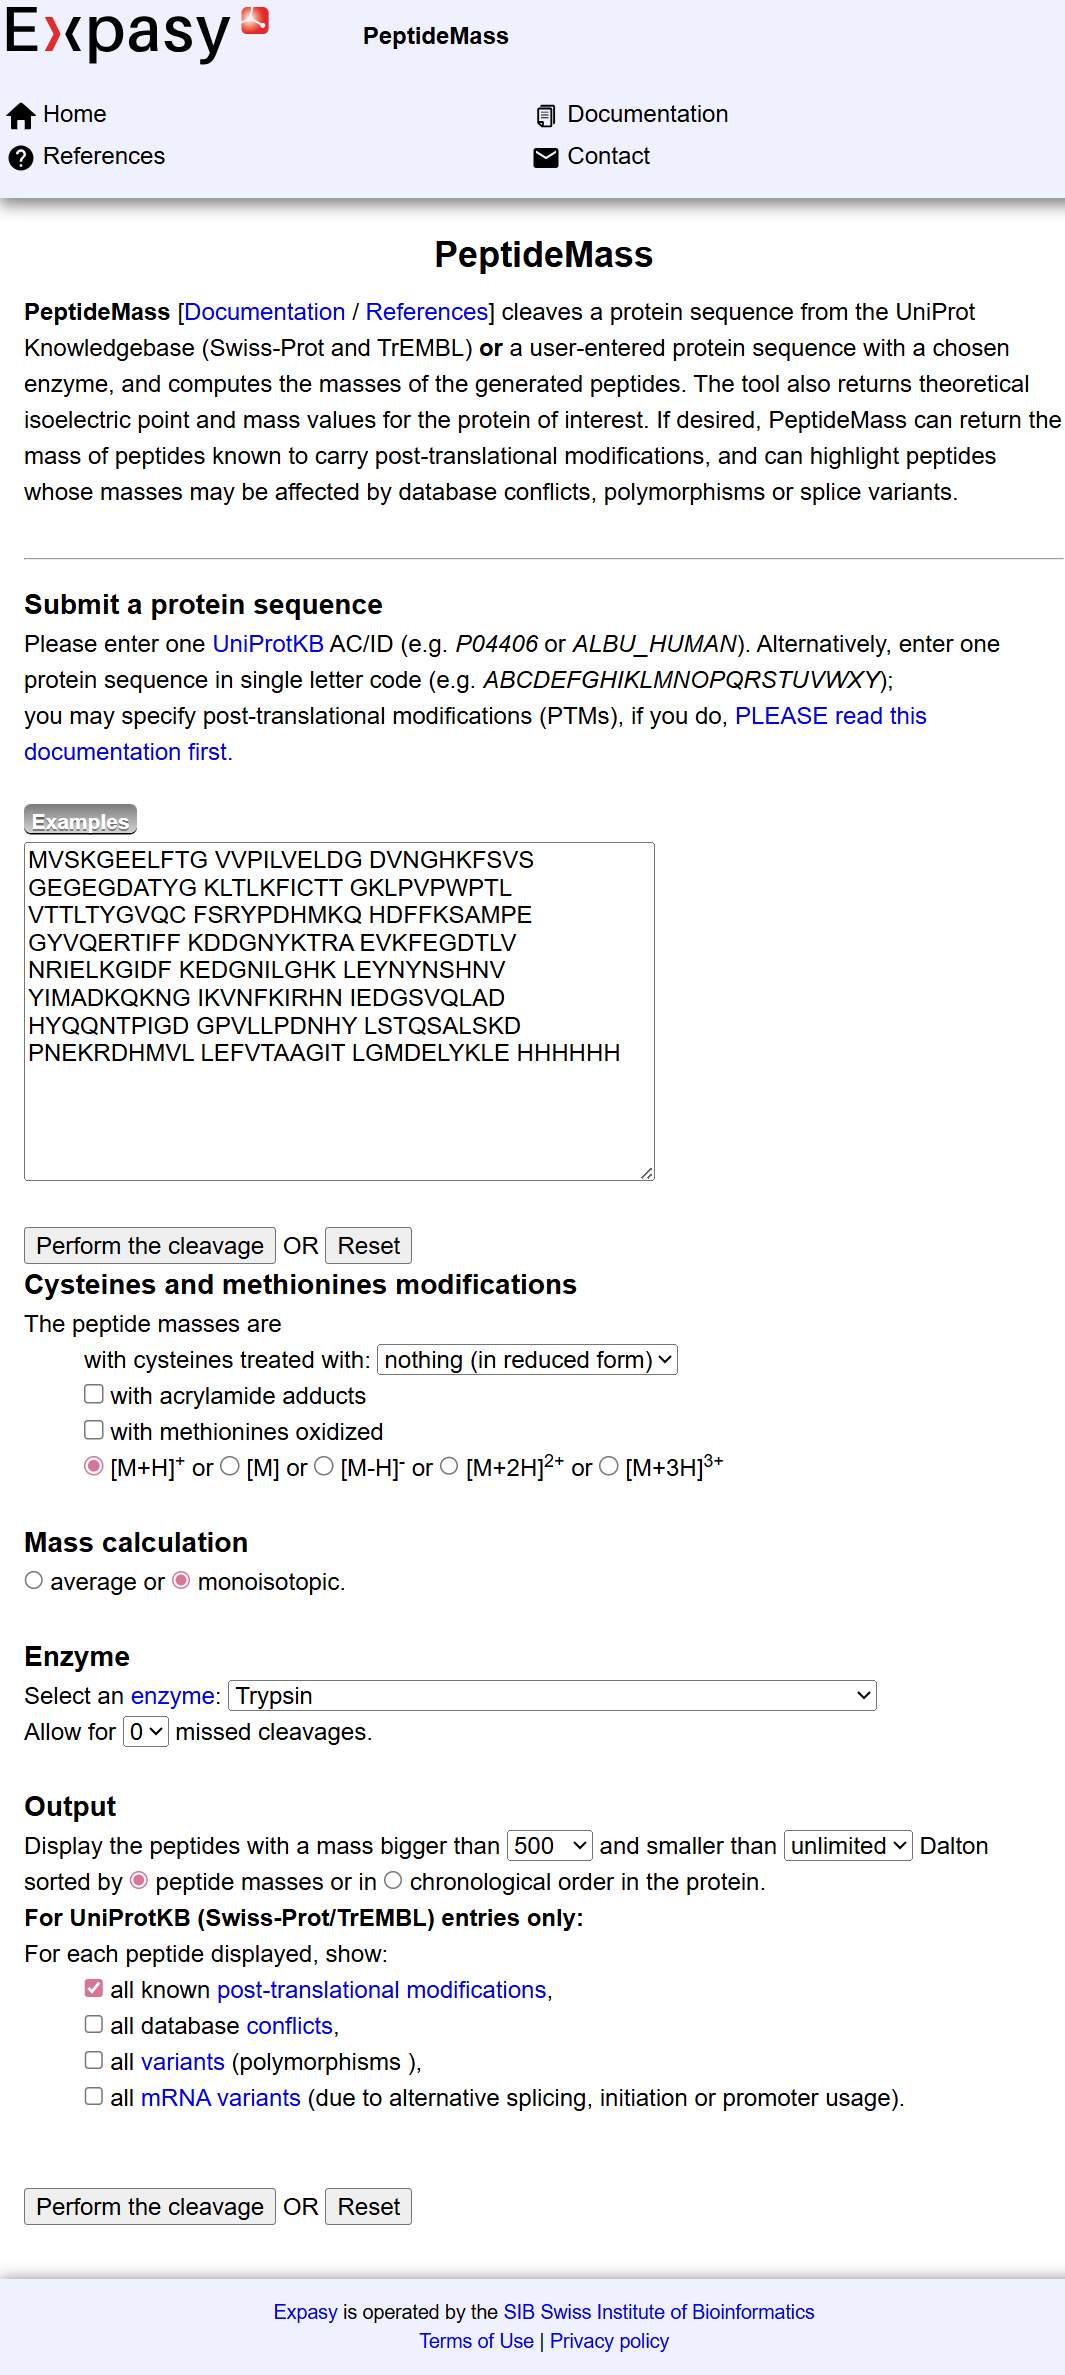
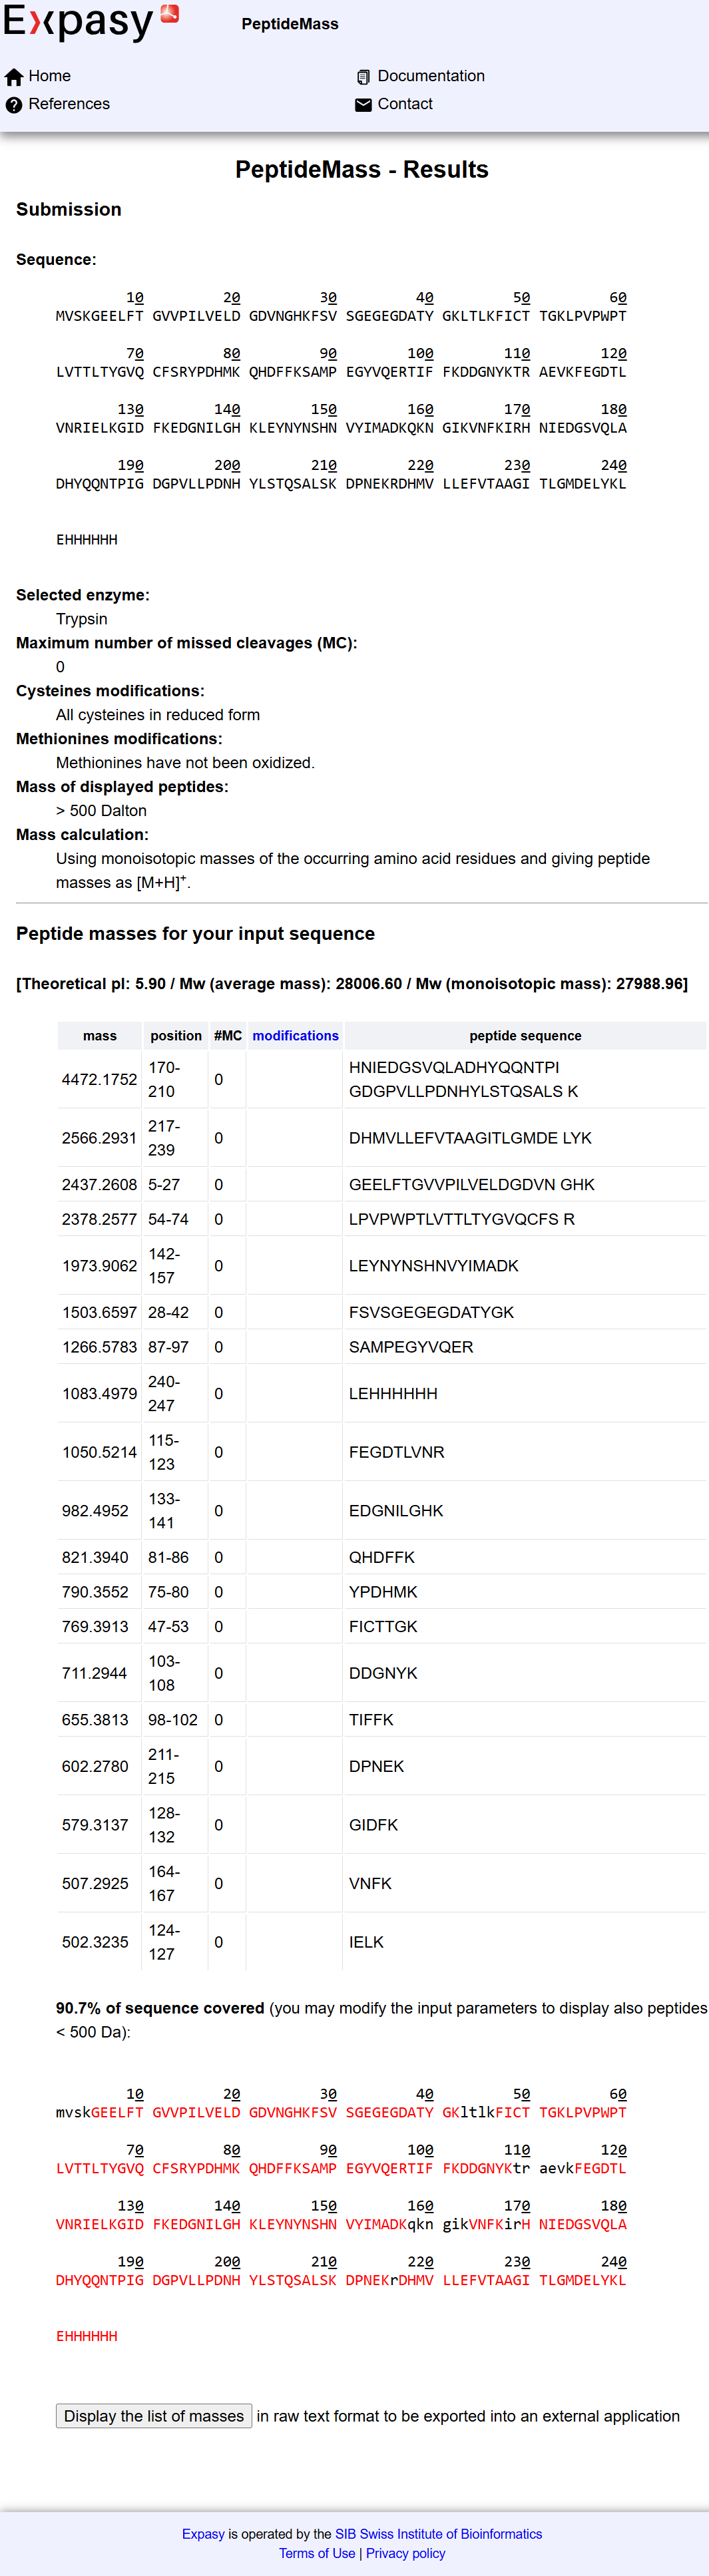
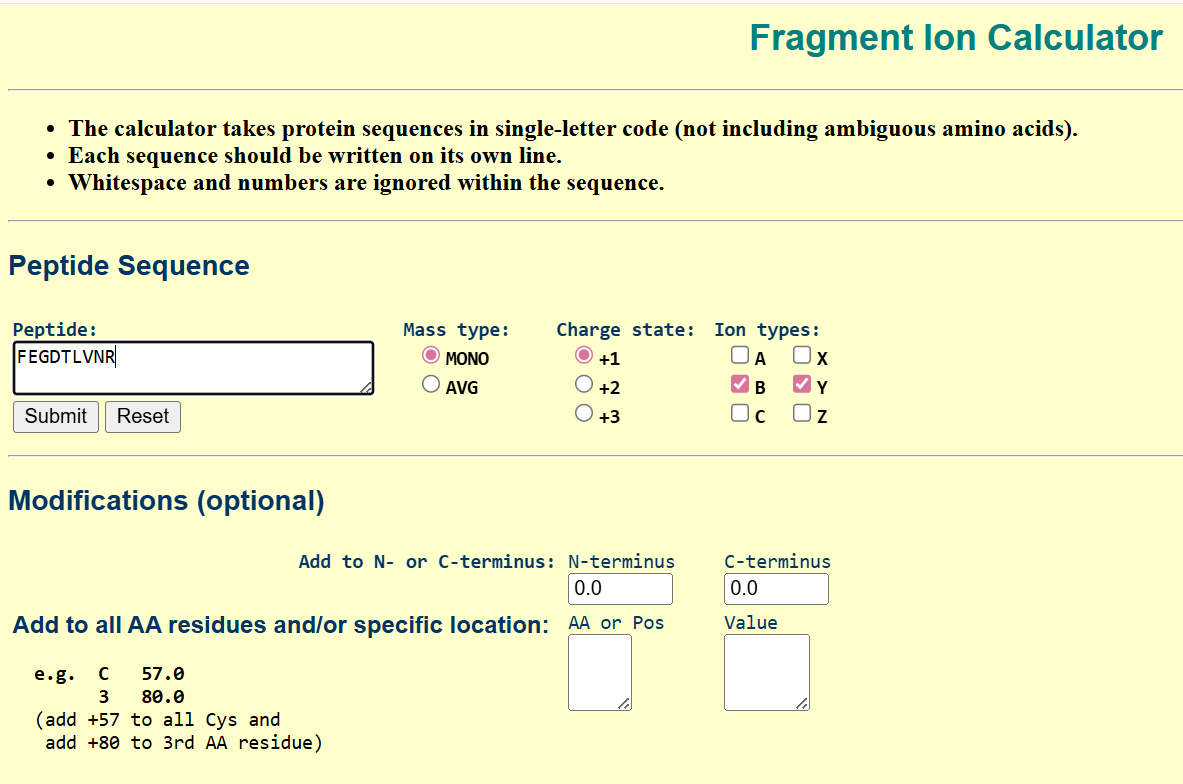
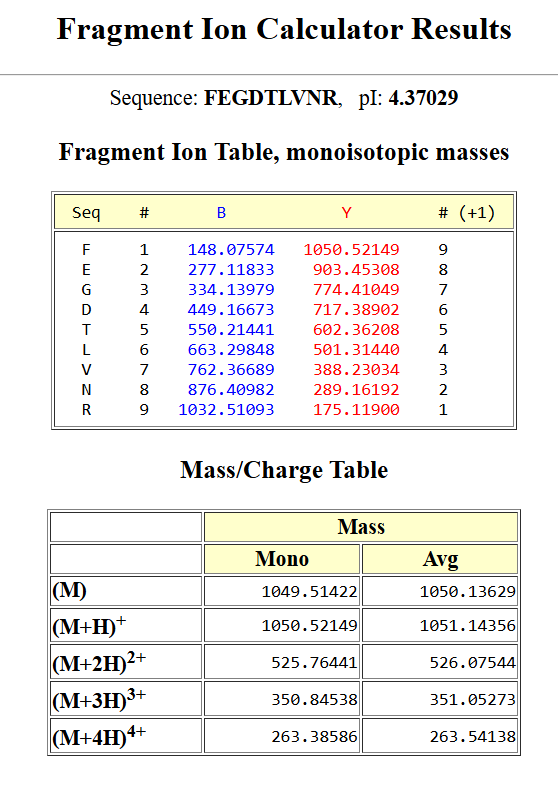
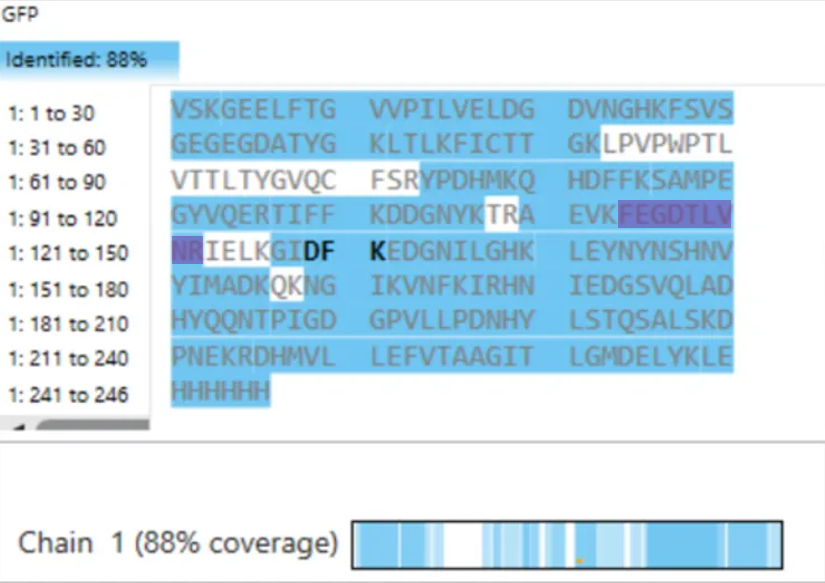
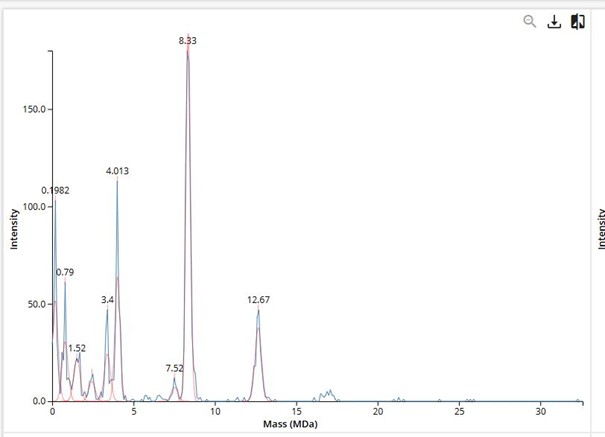


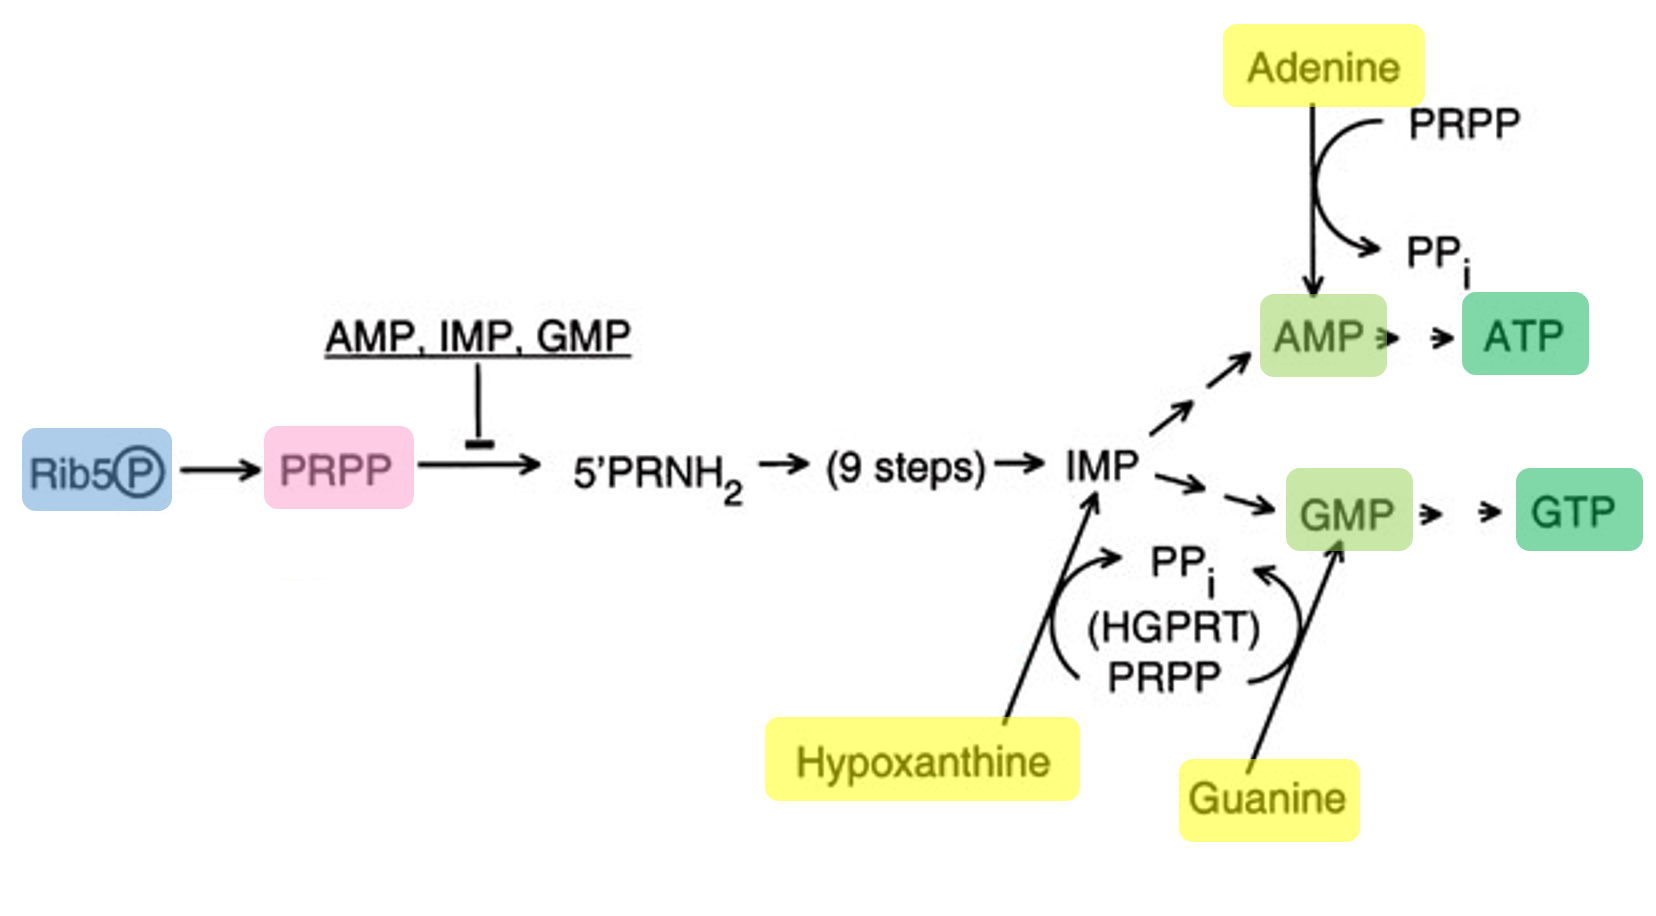

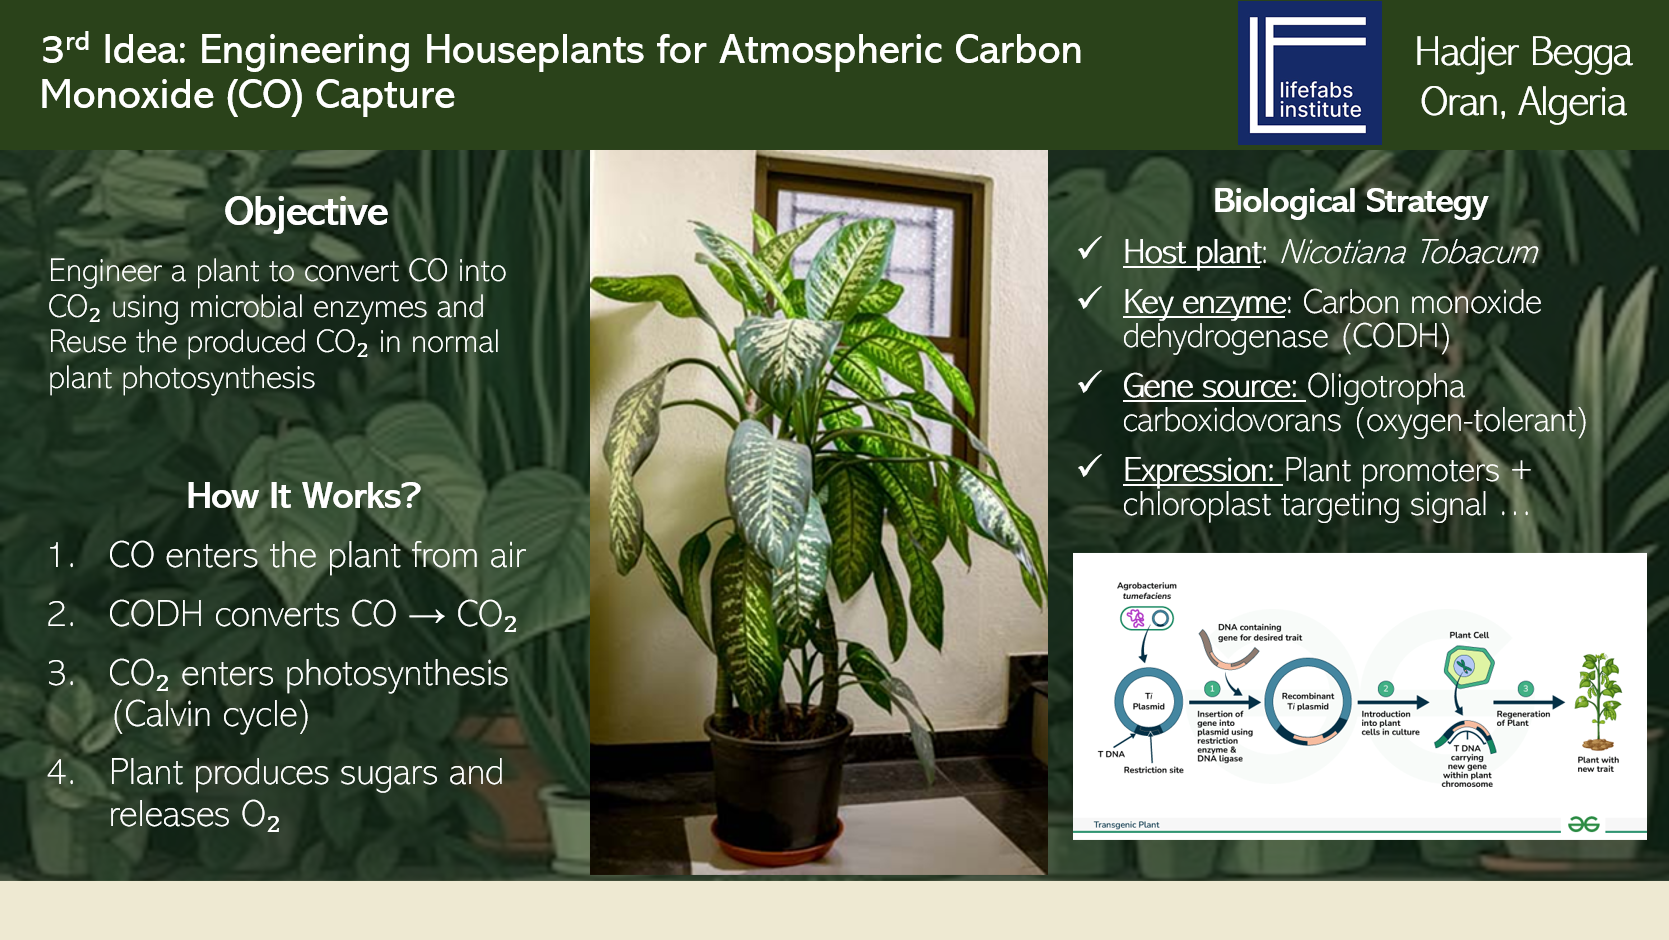
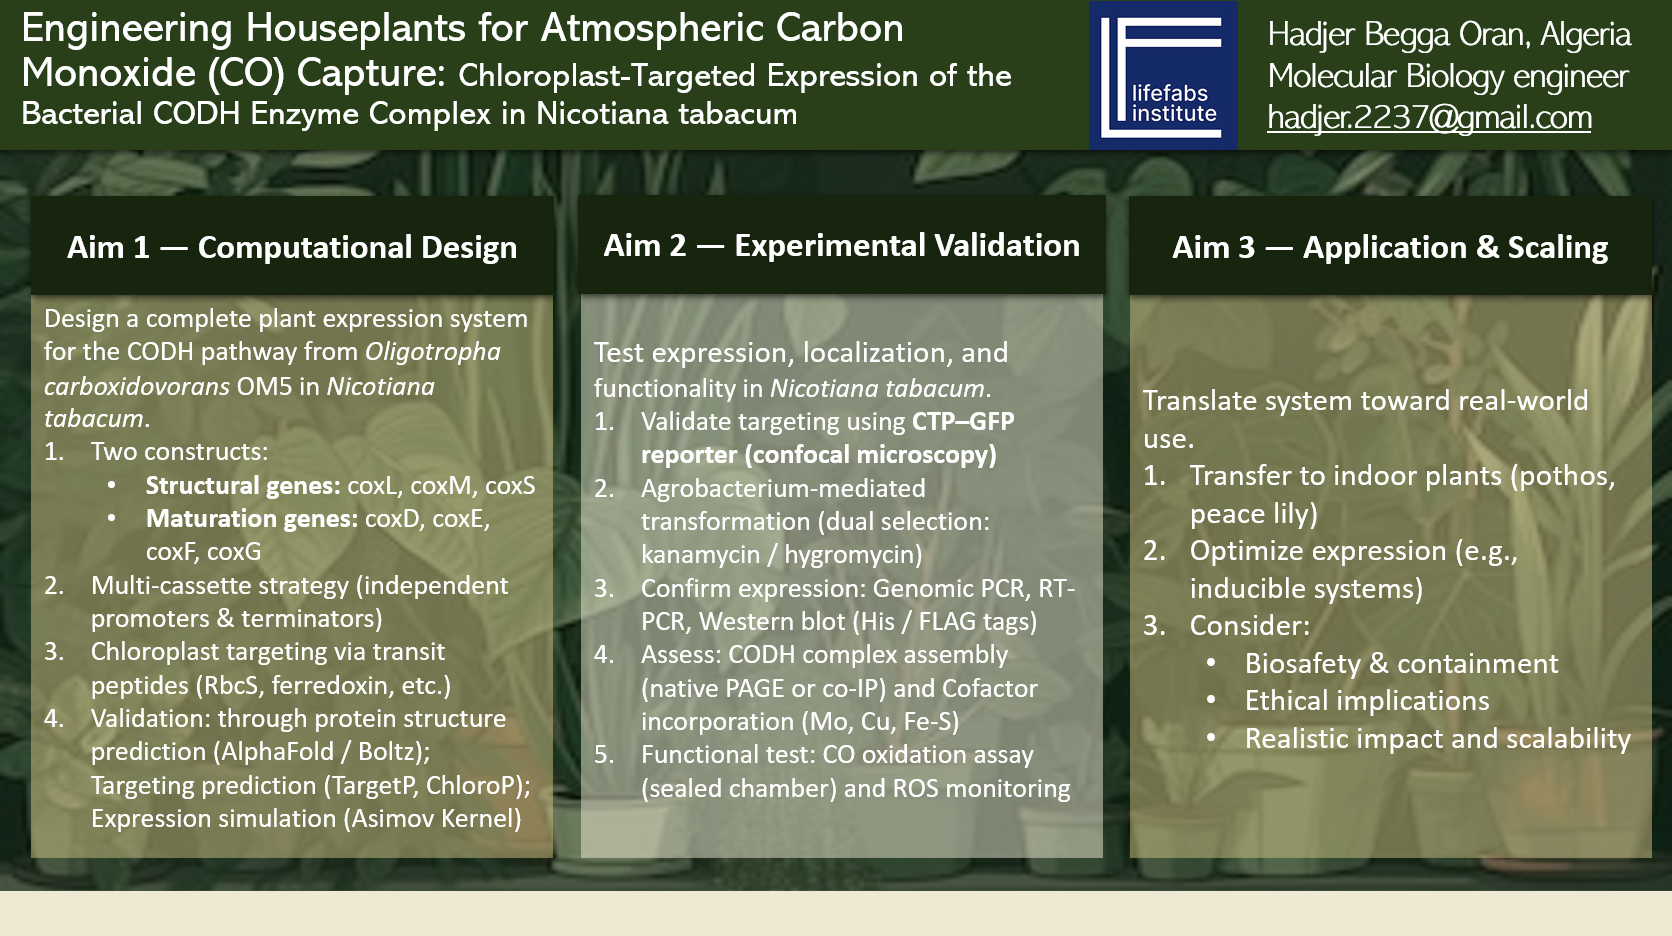

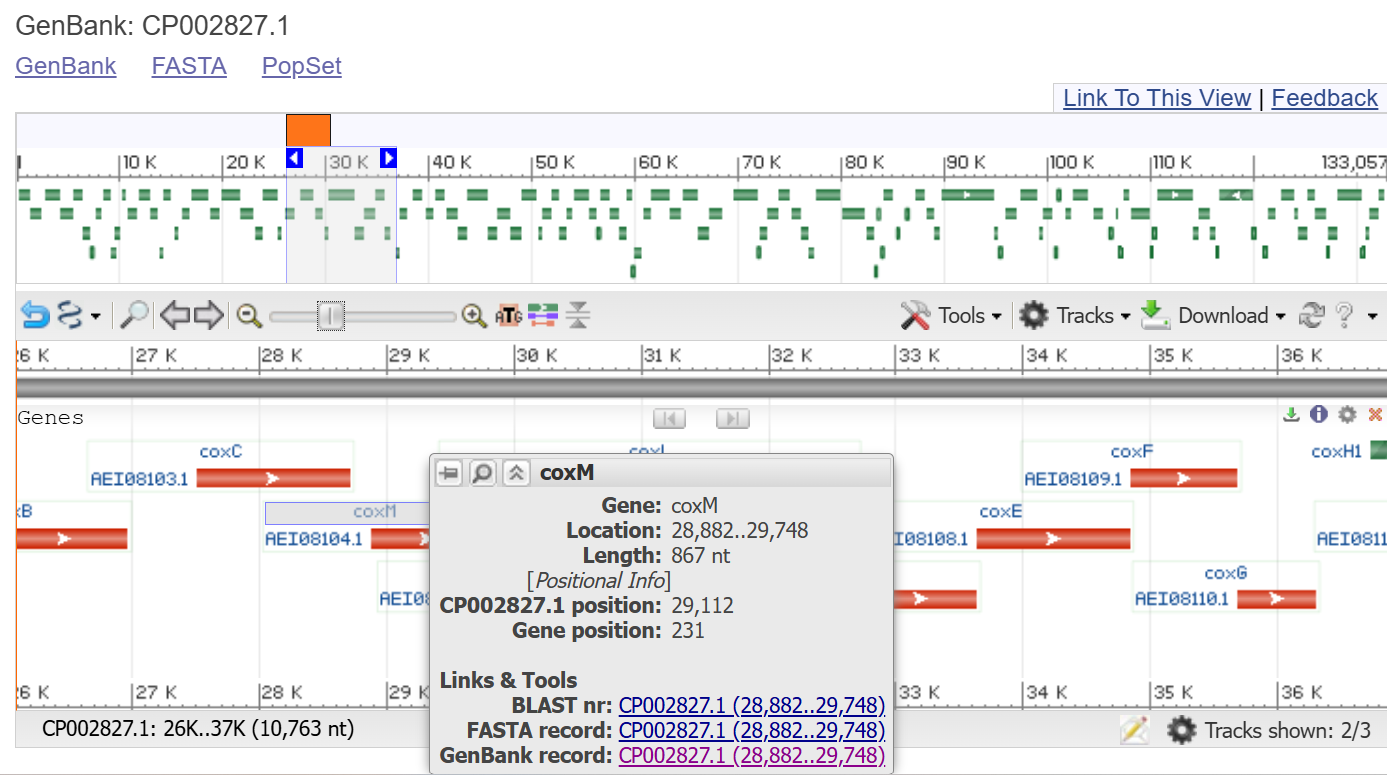
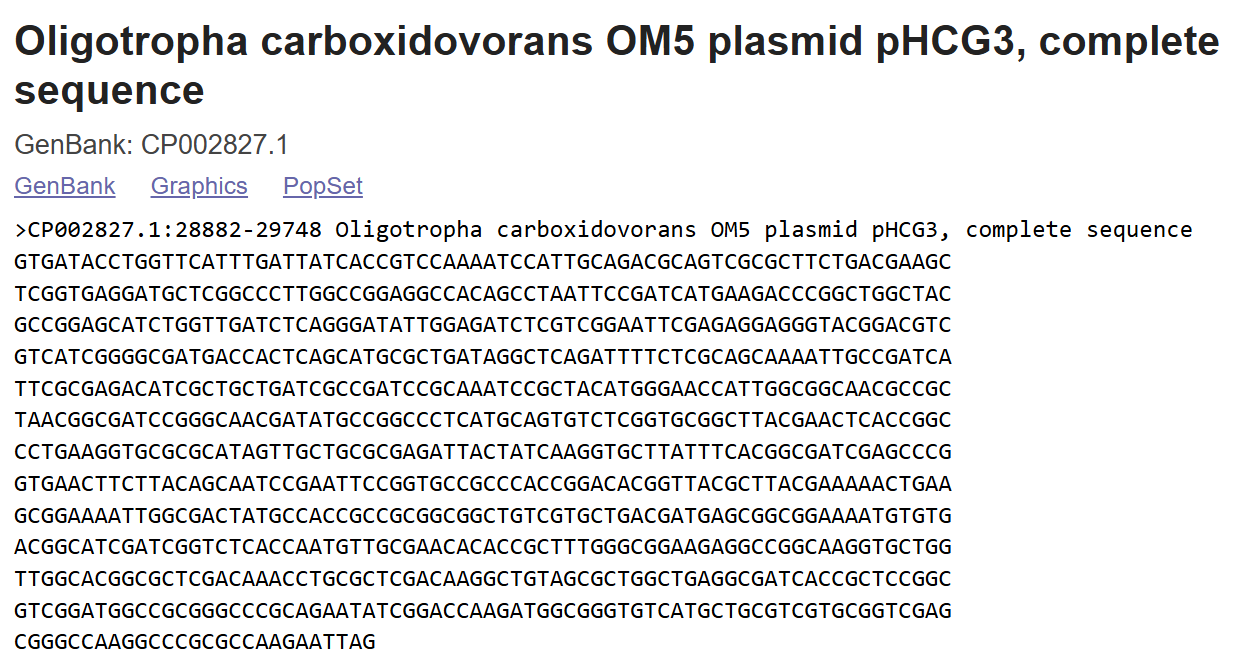
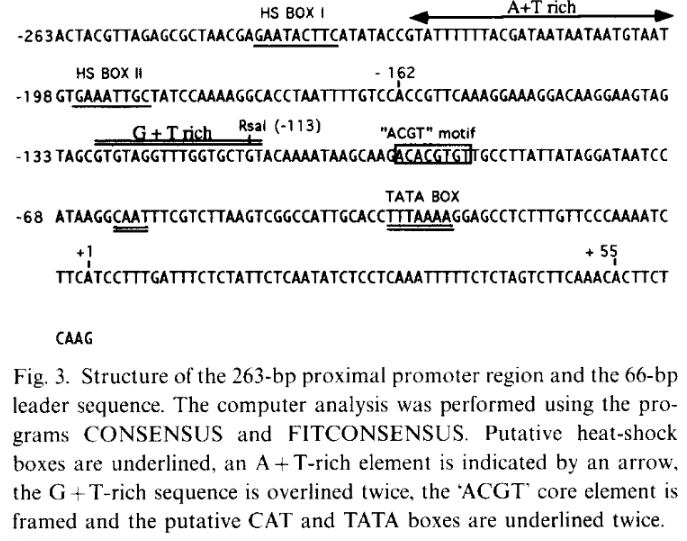
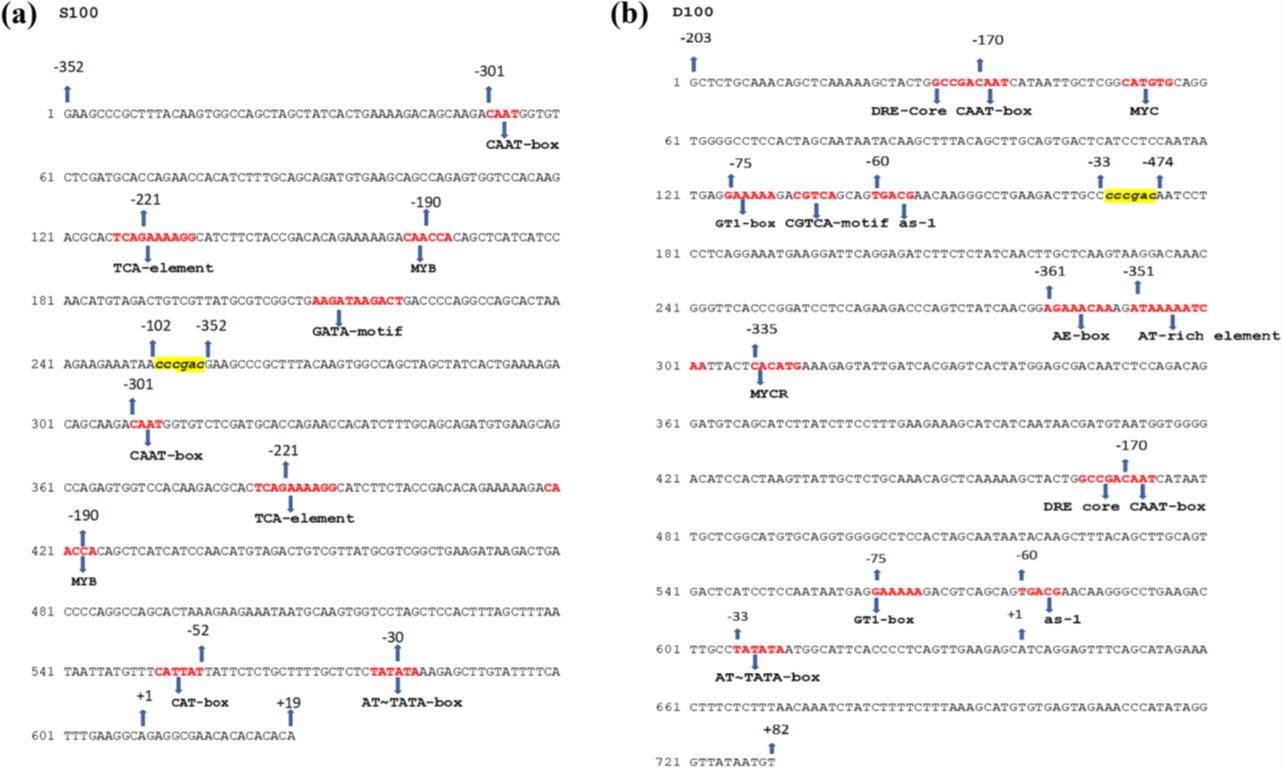
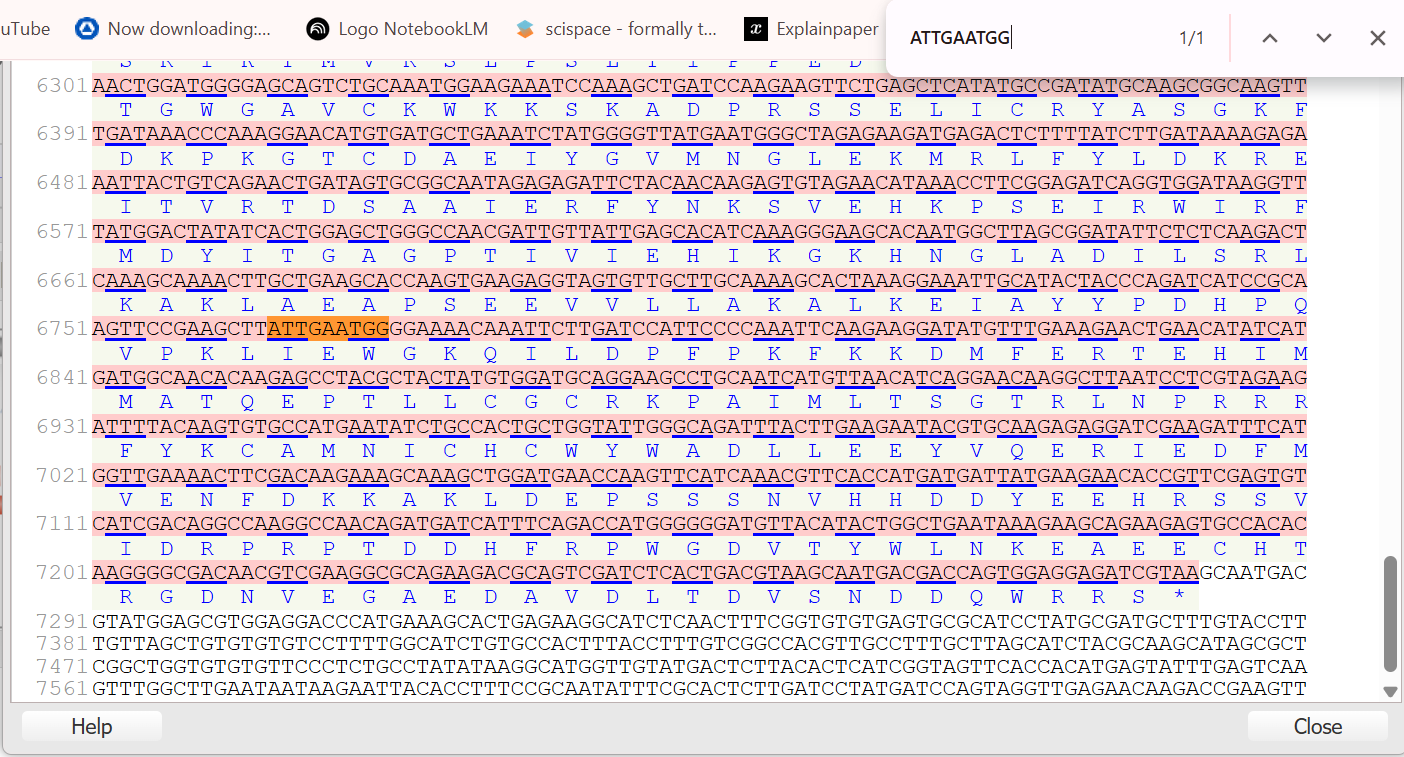
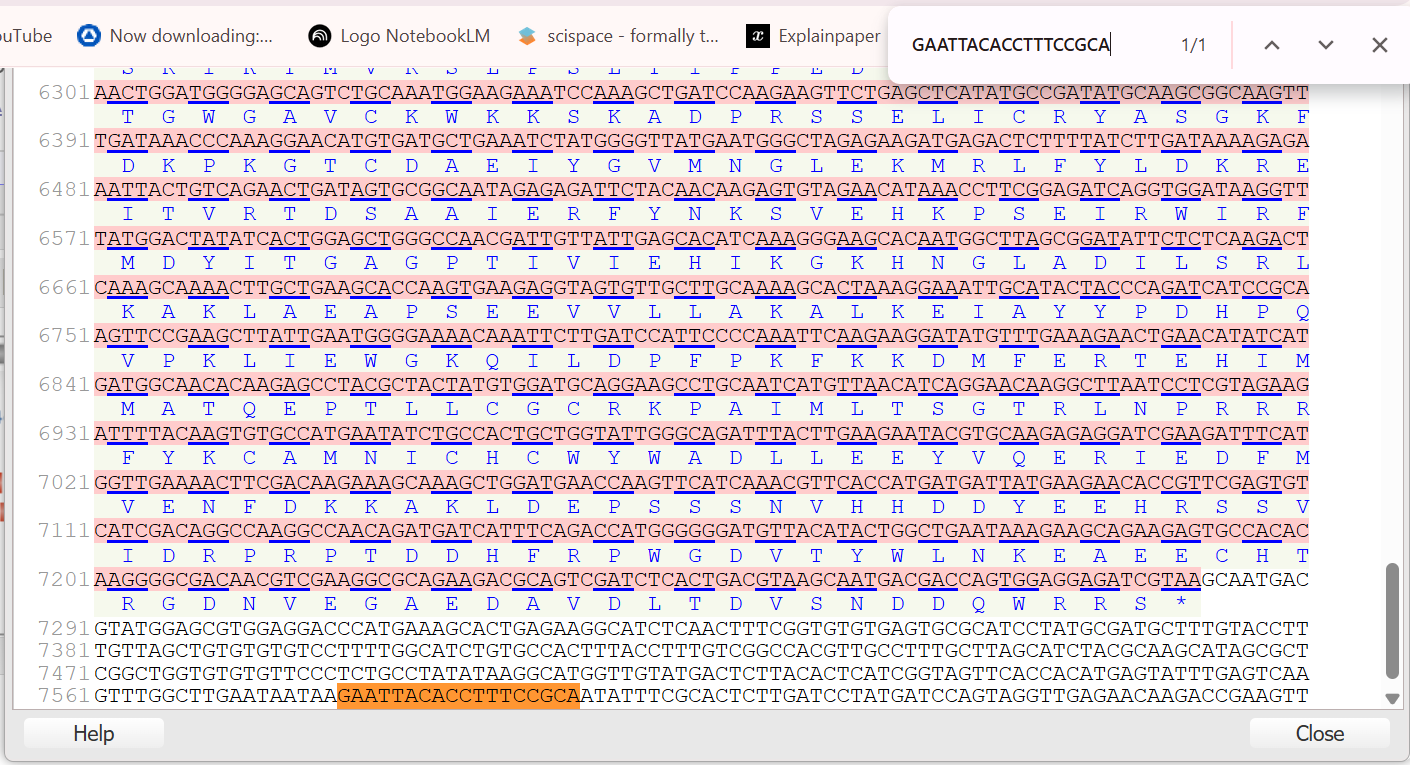
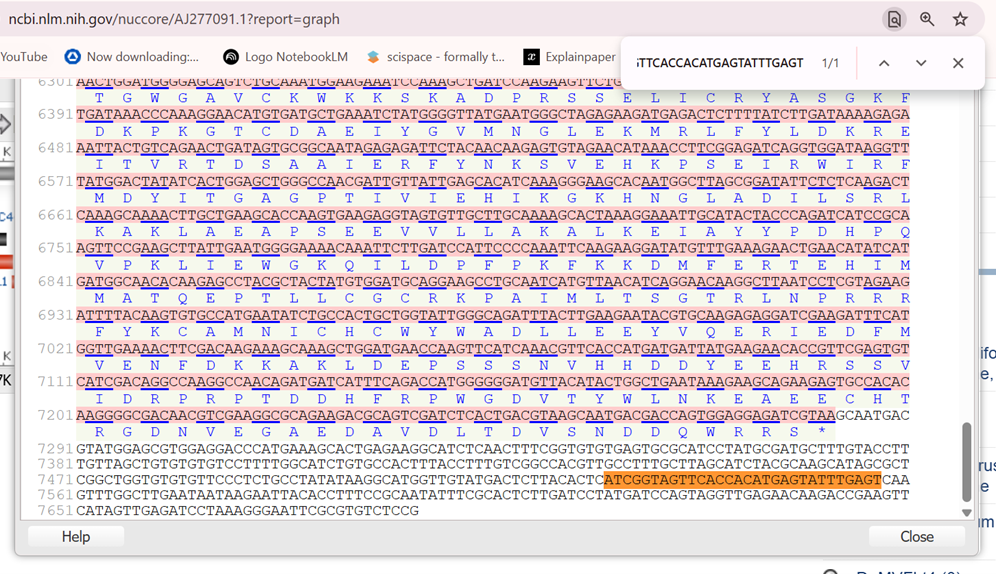
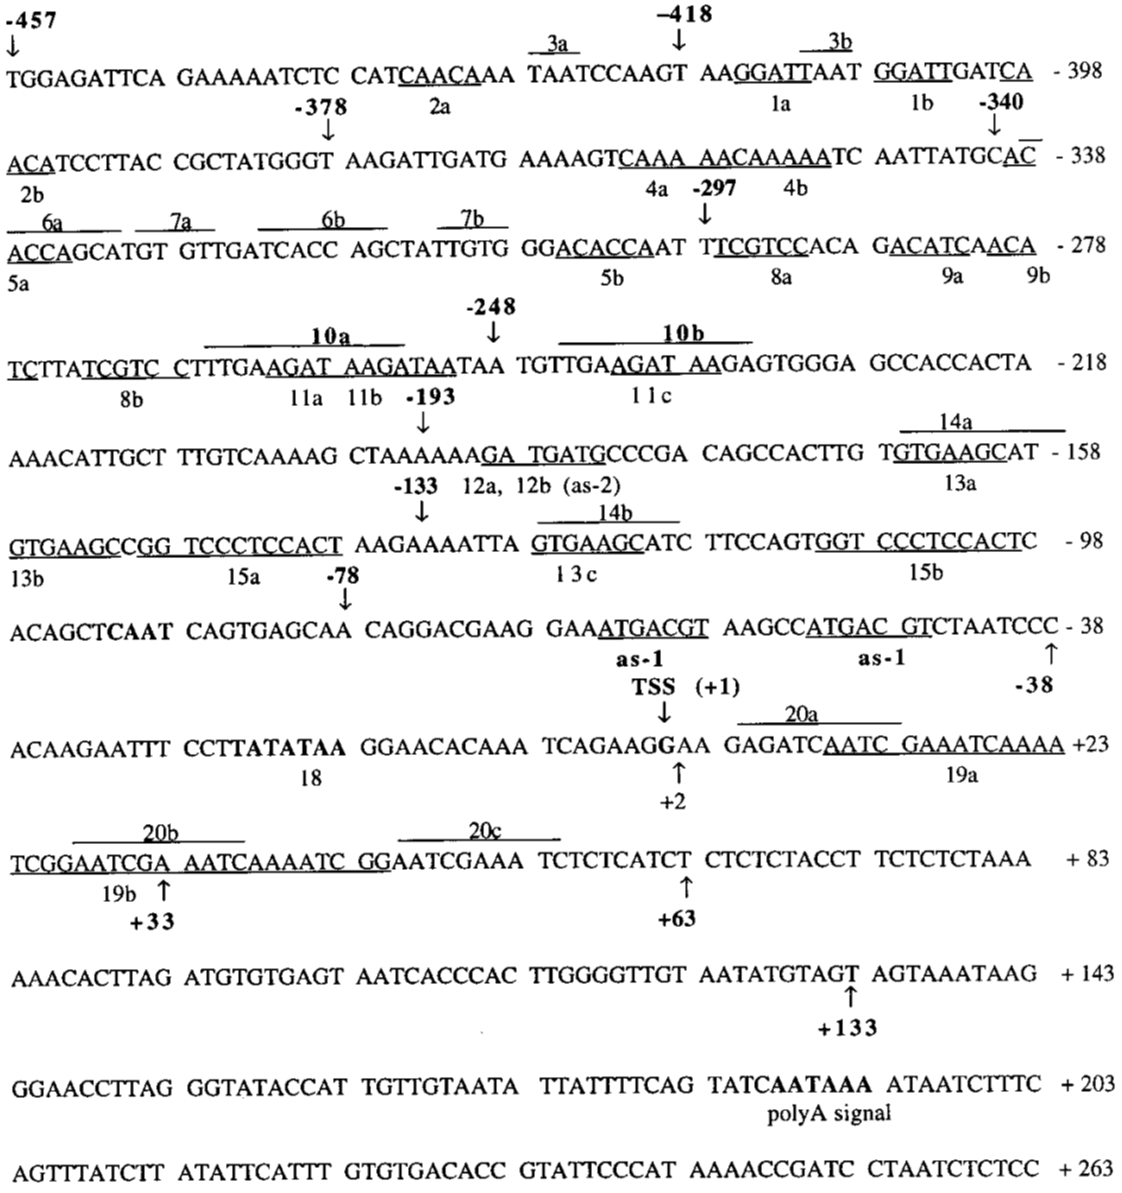
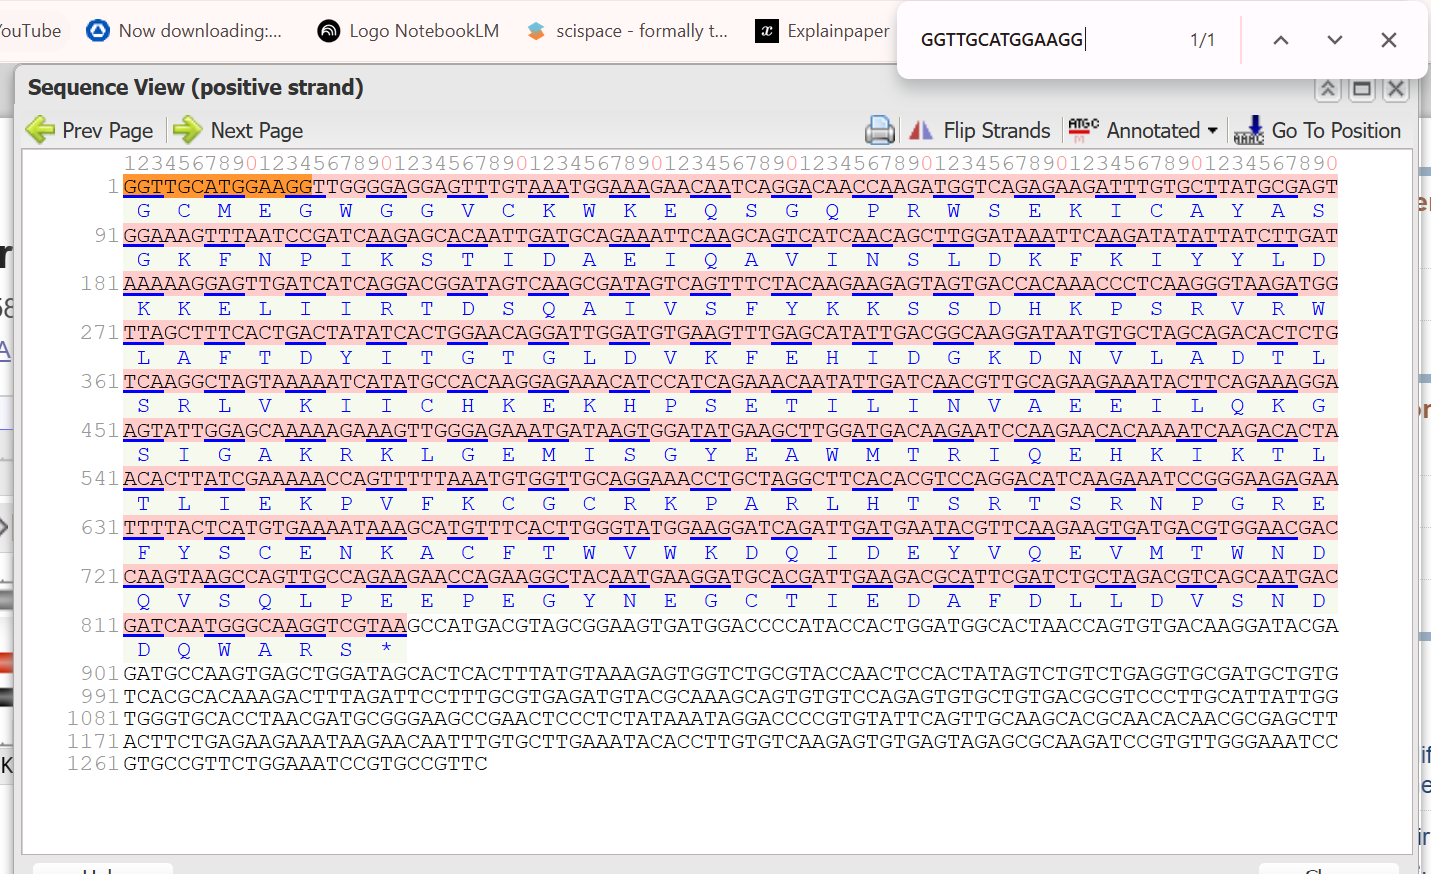
.png?width=500px)
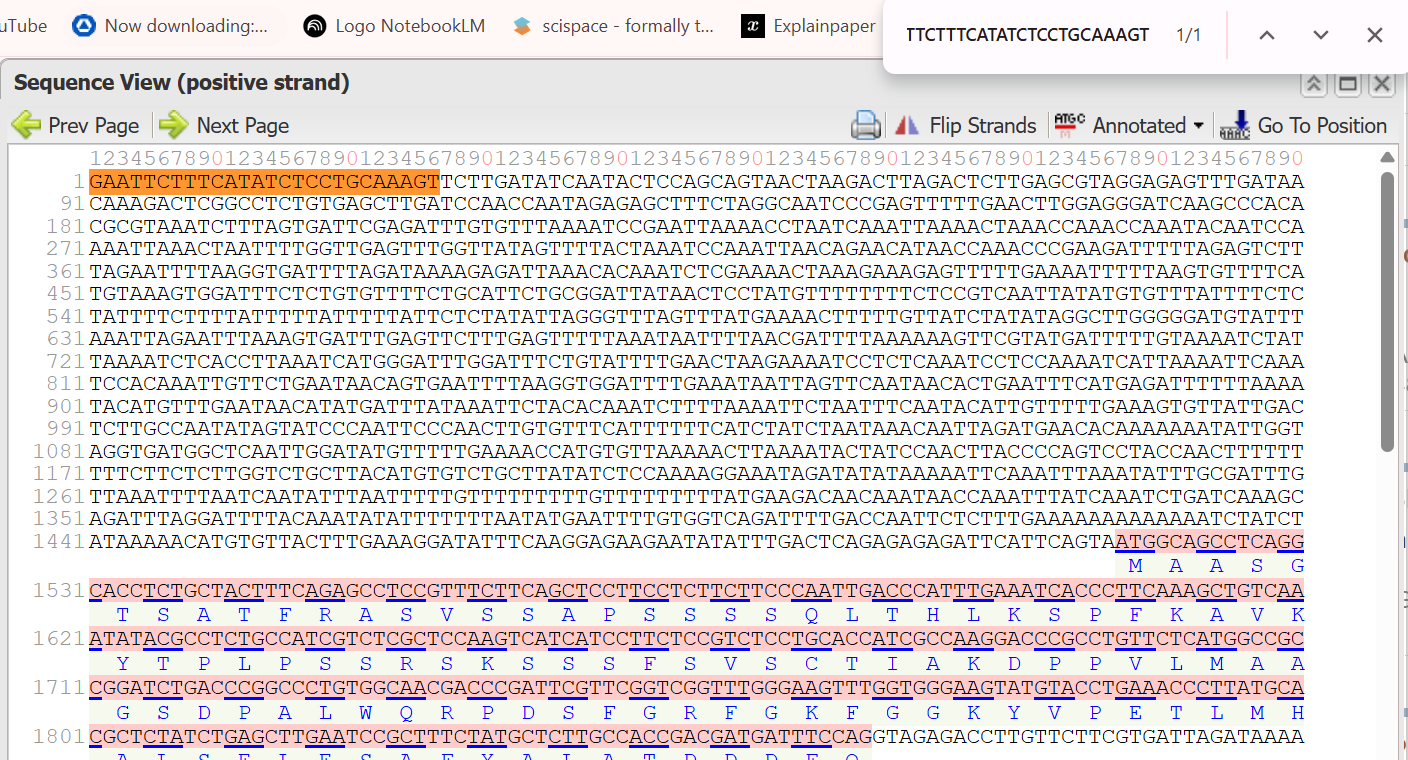
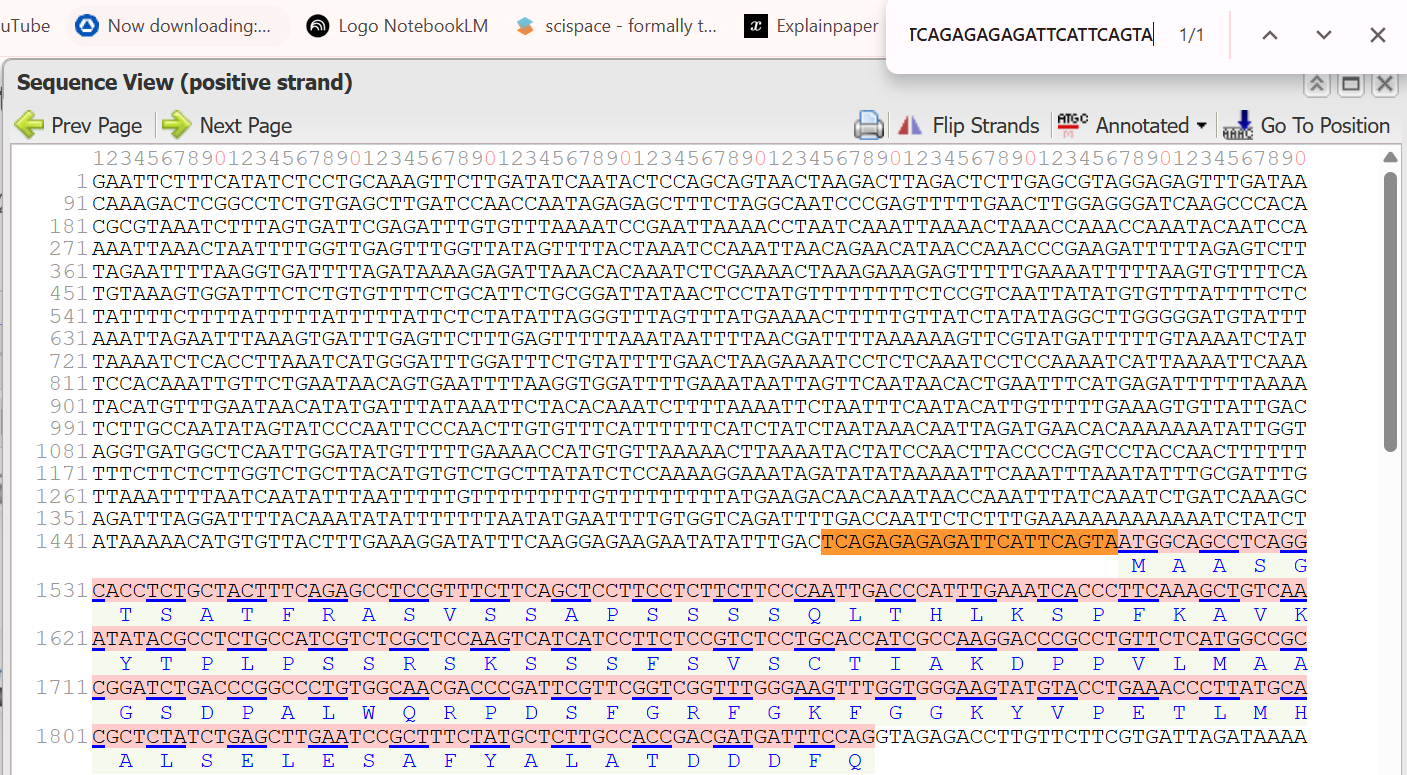
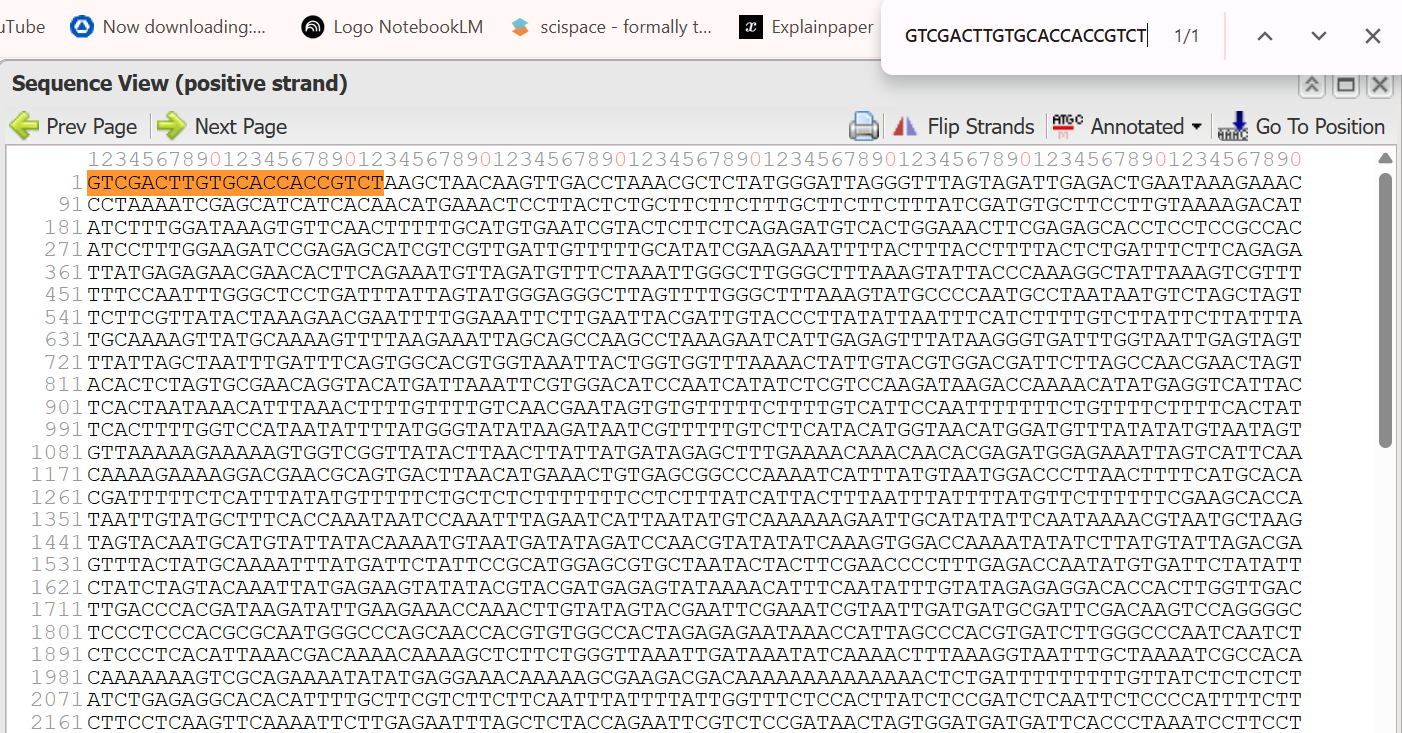
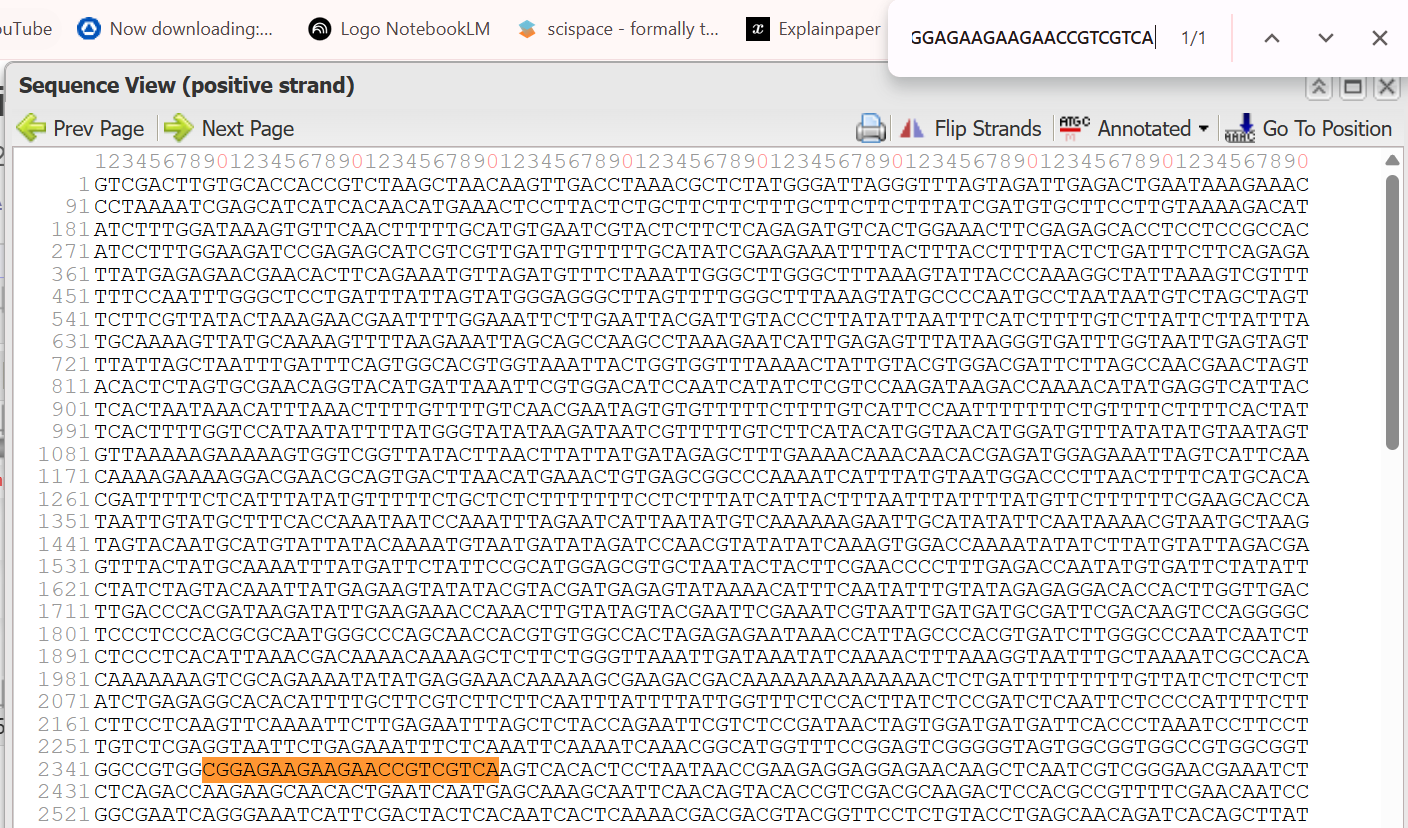
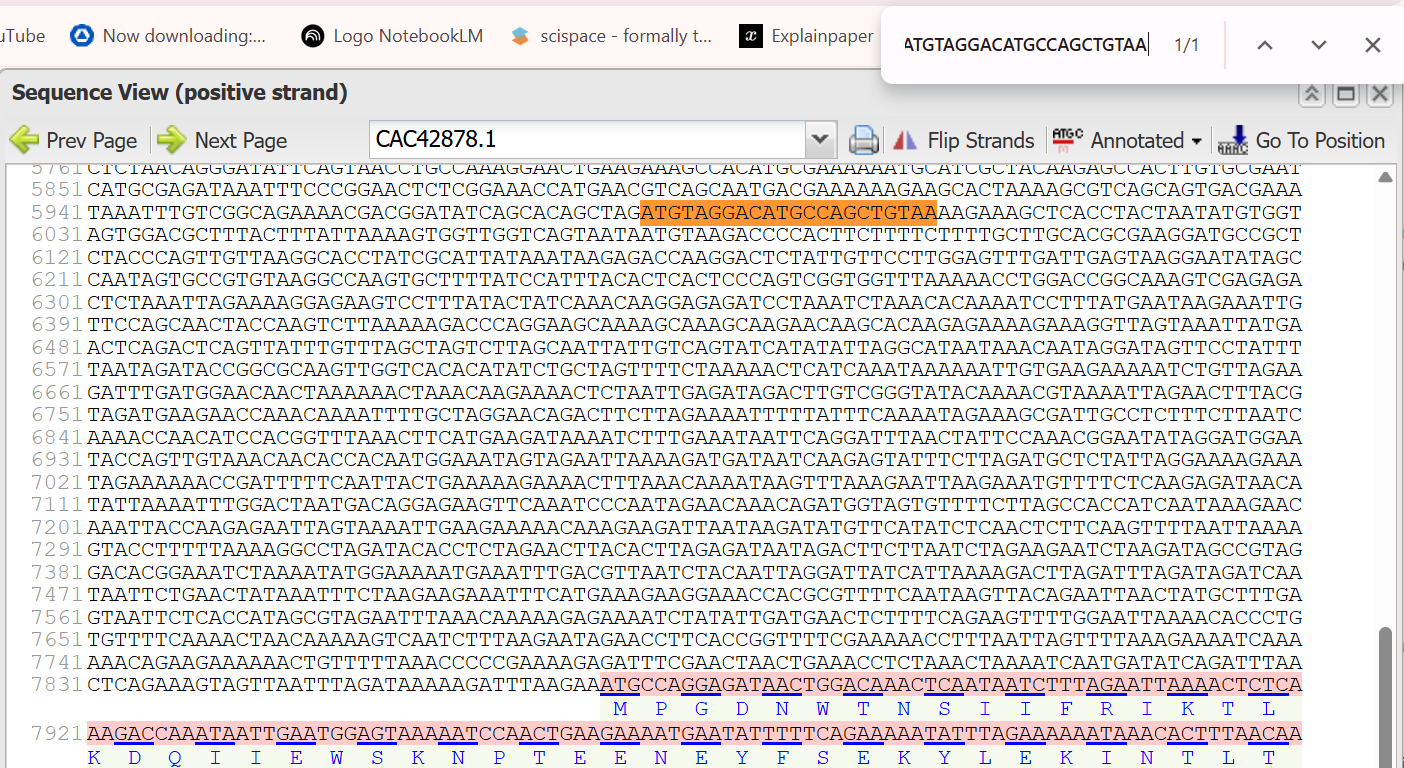
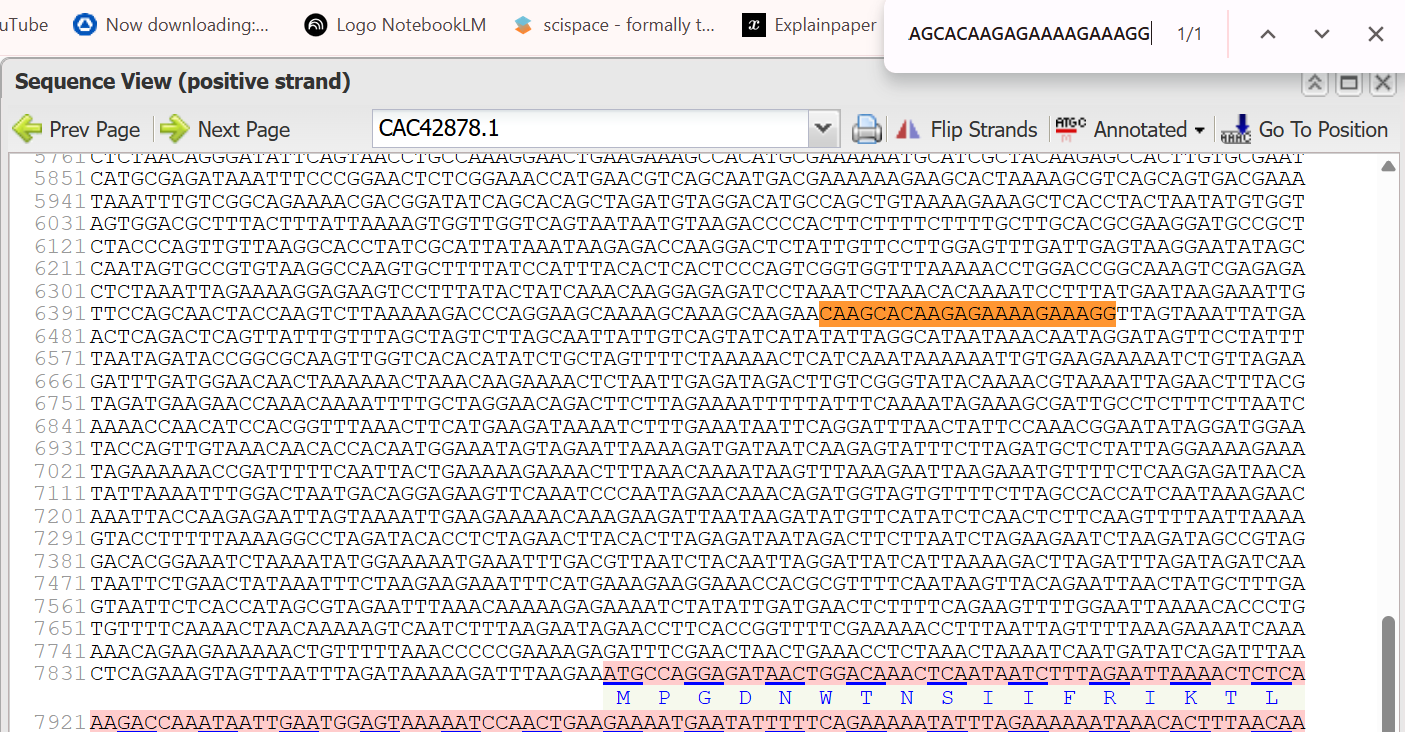
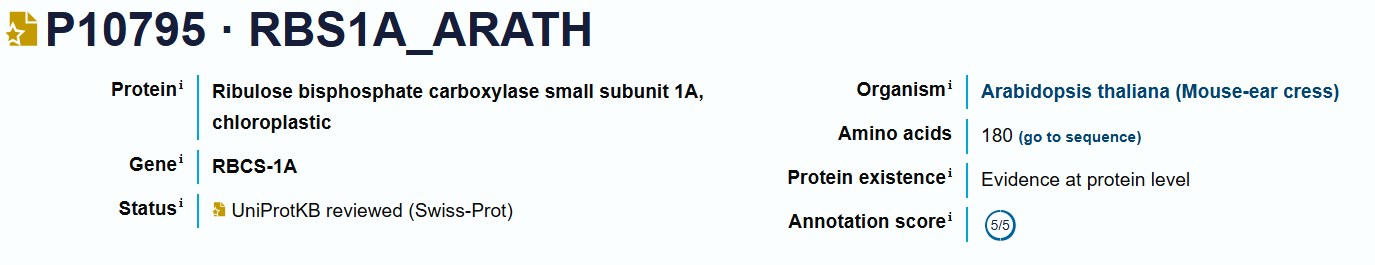
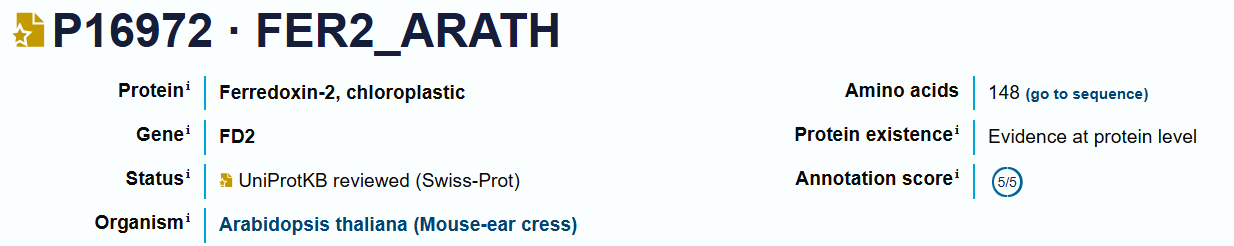
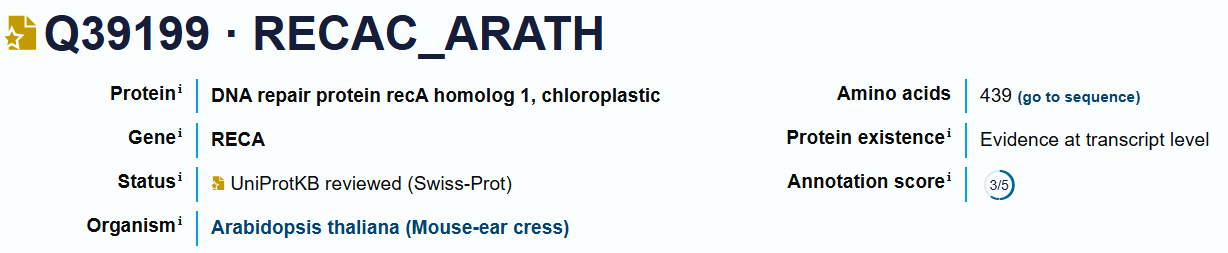
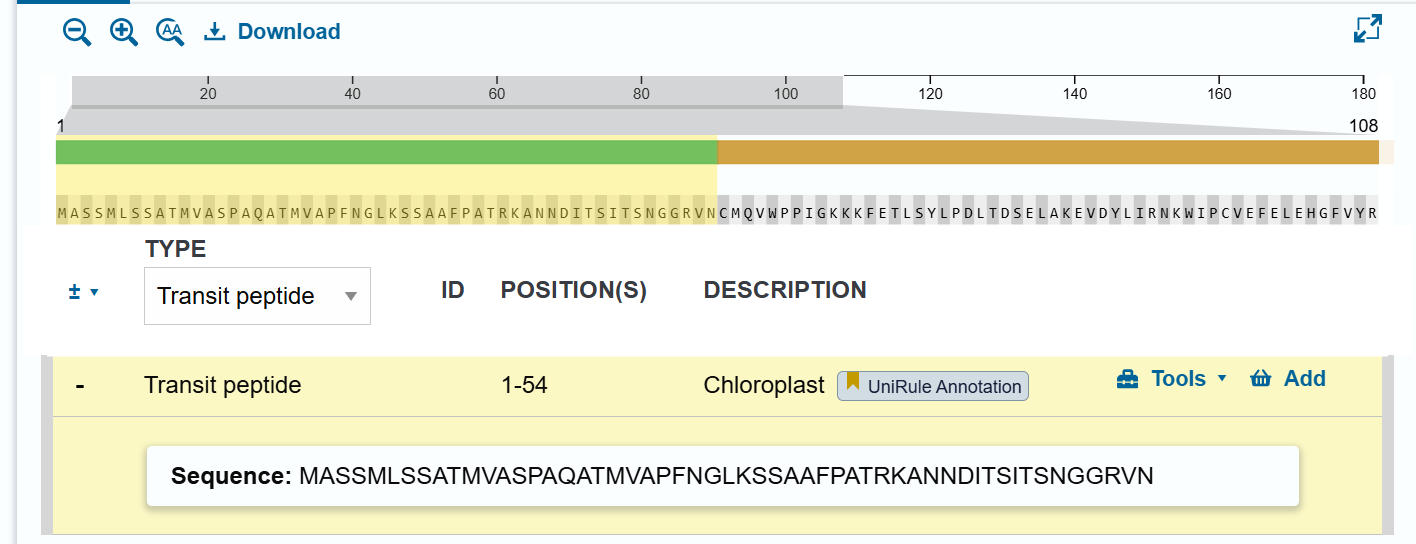
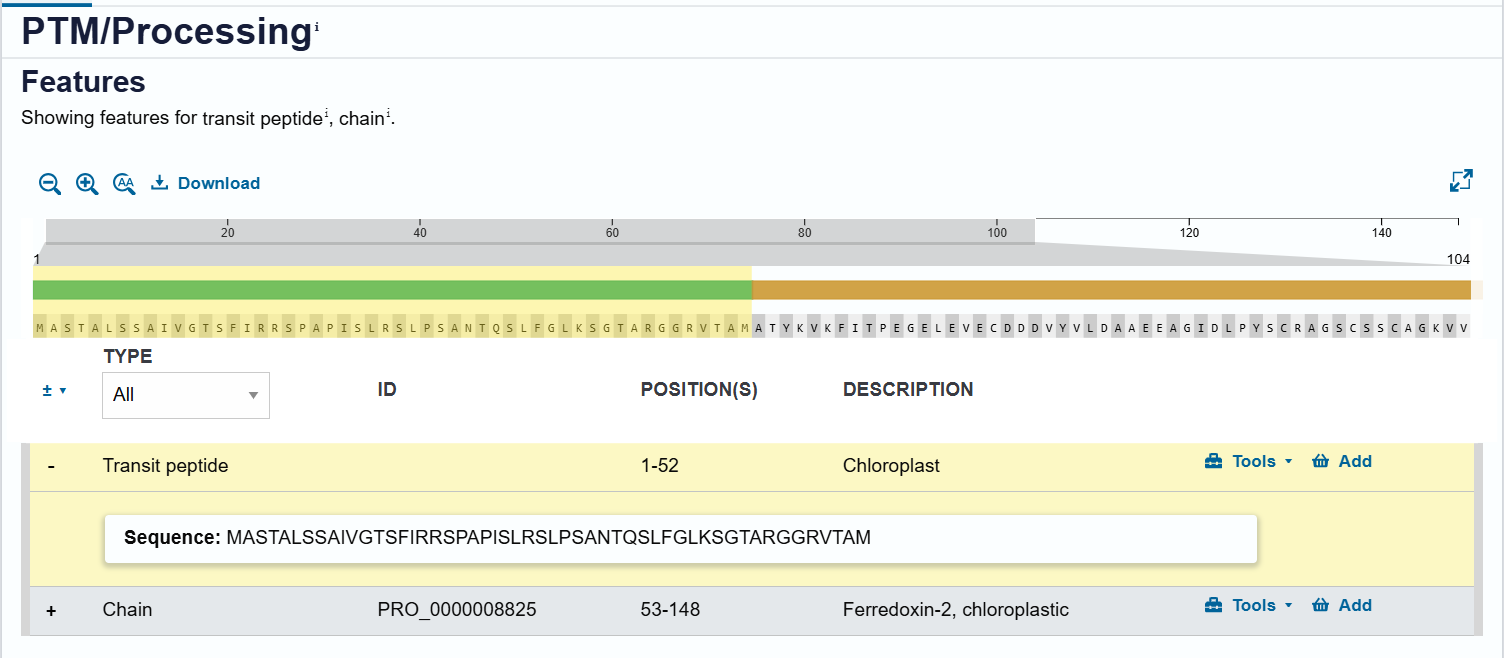
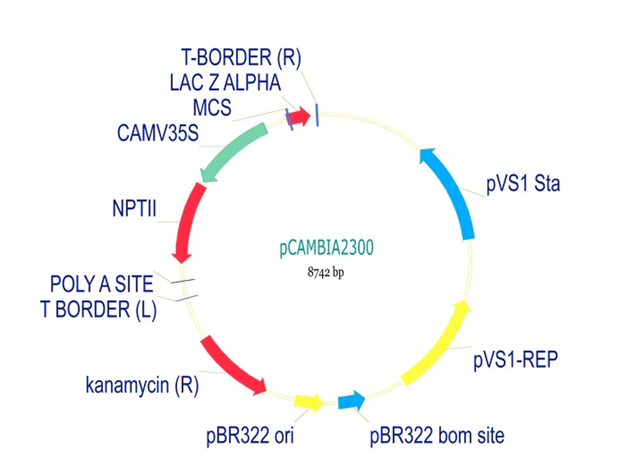
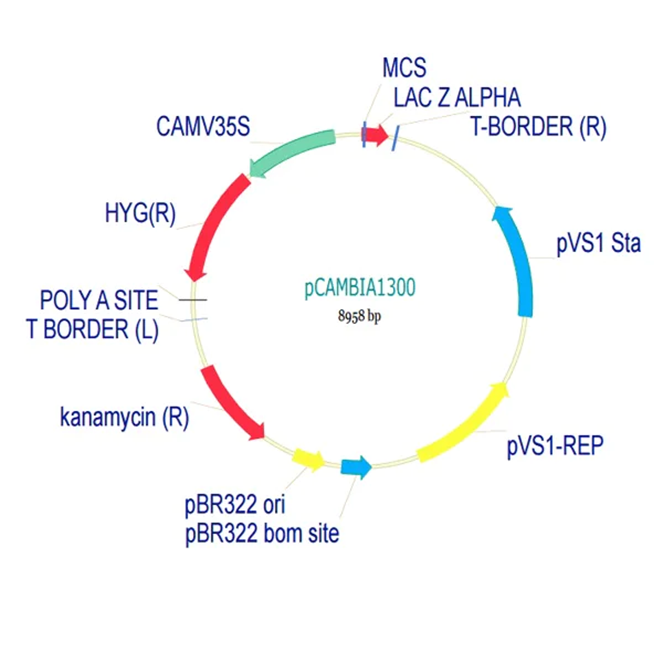
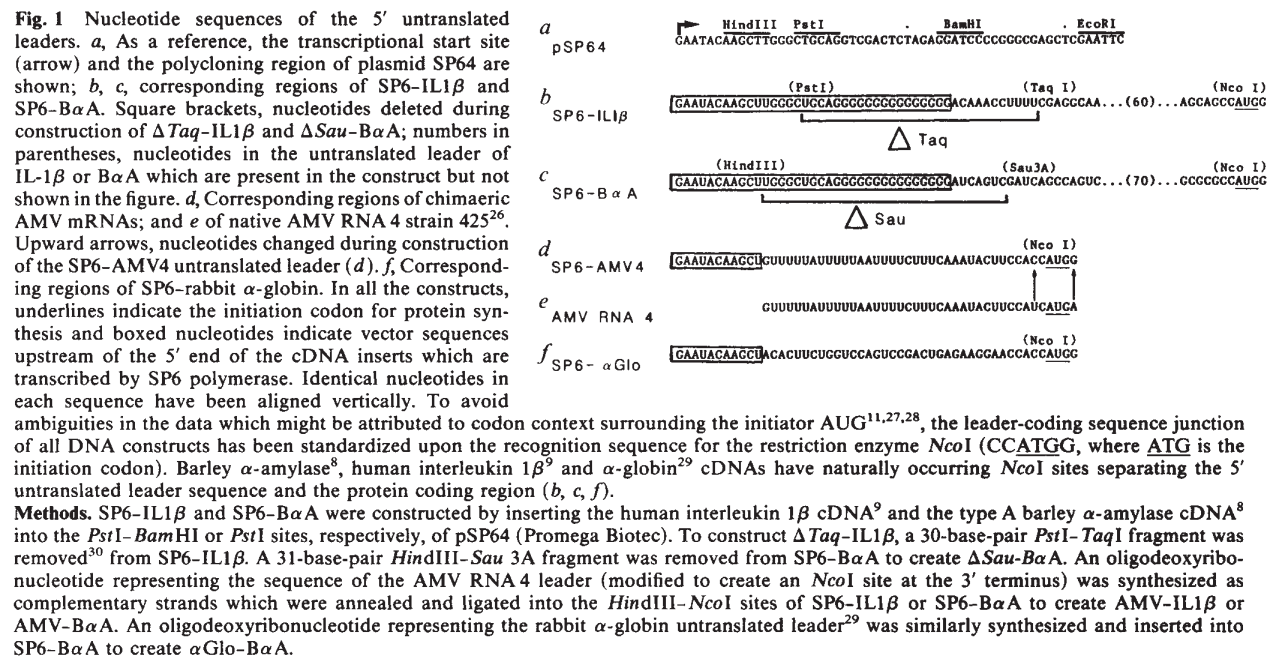
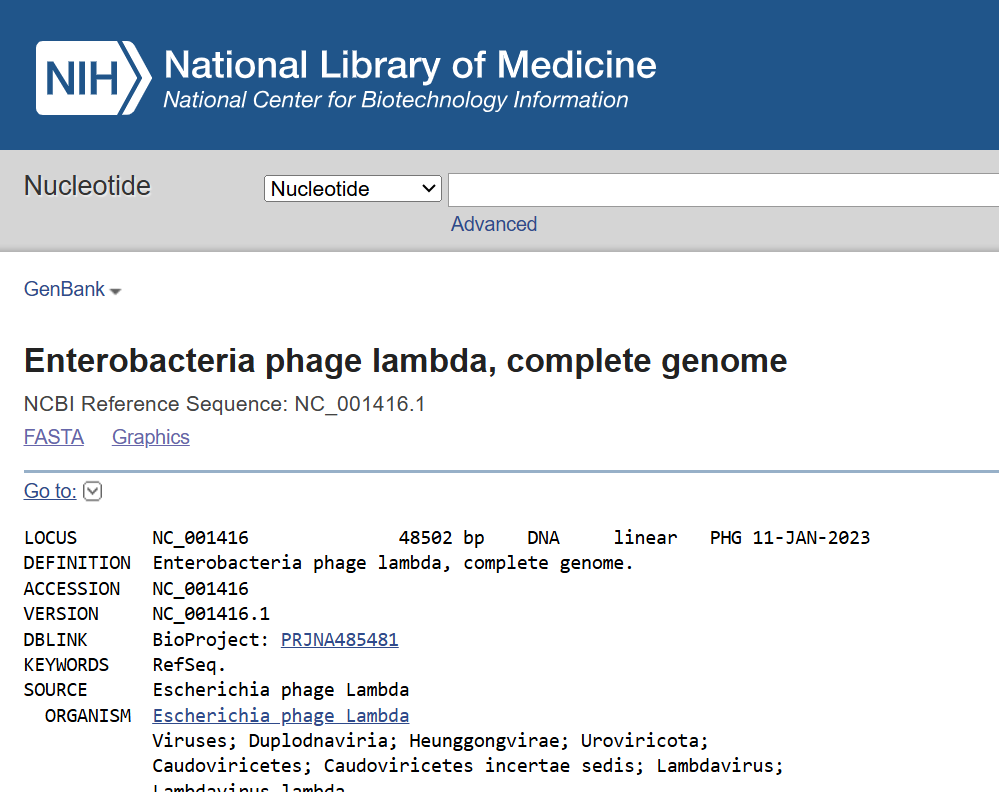
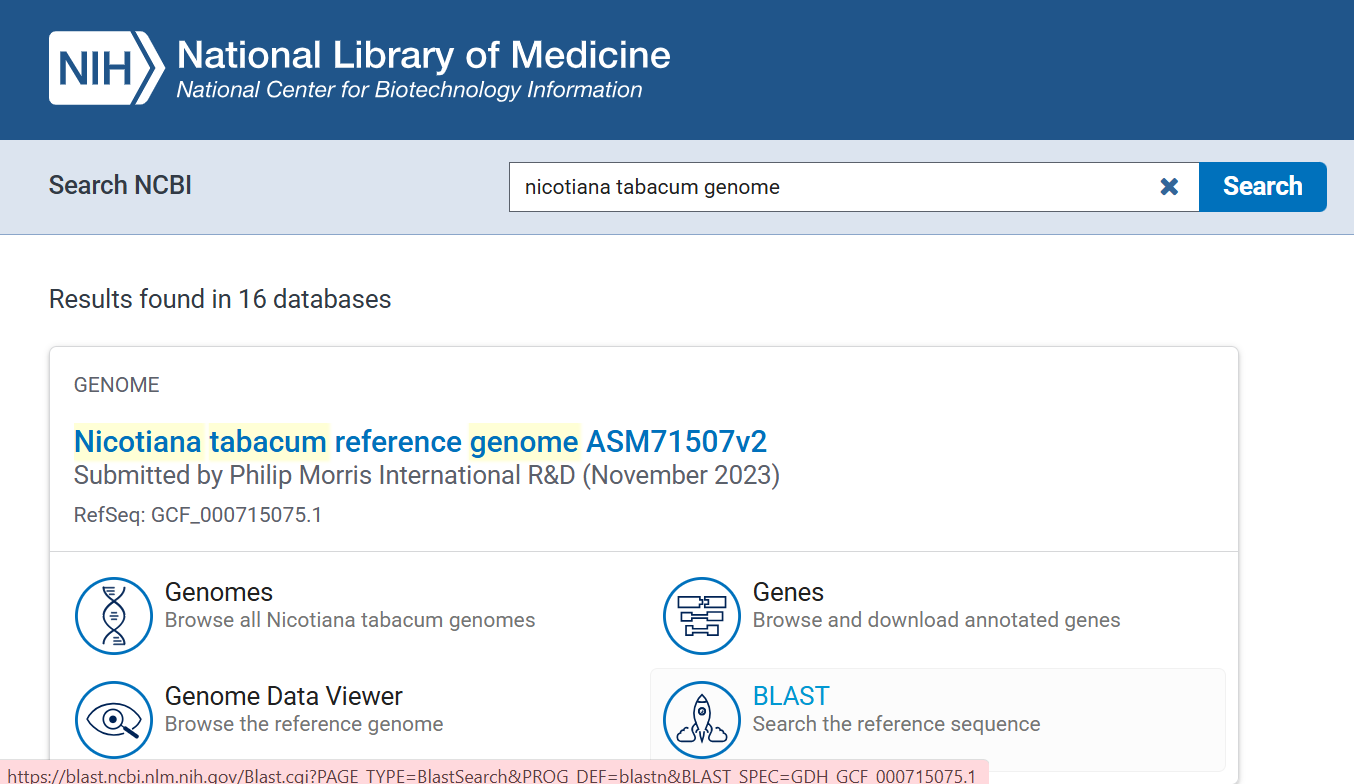
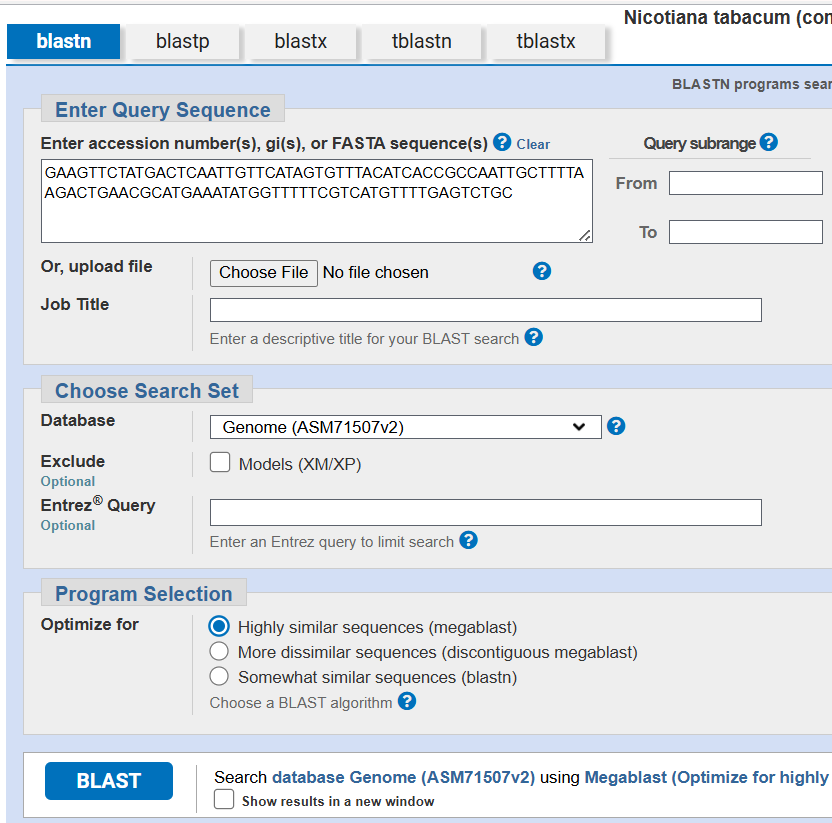

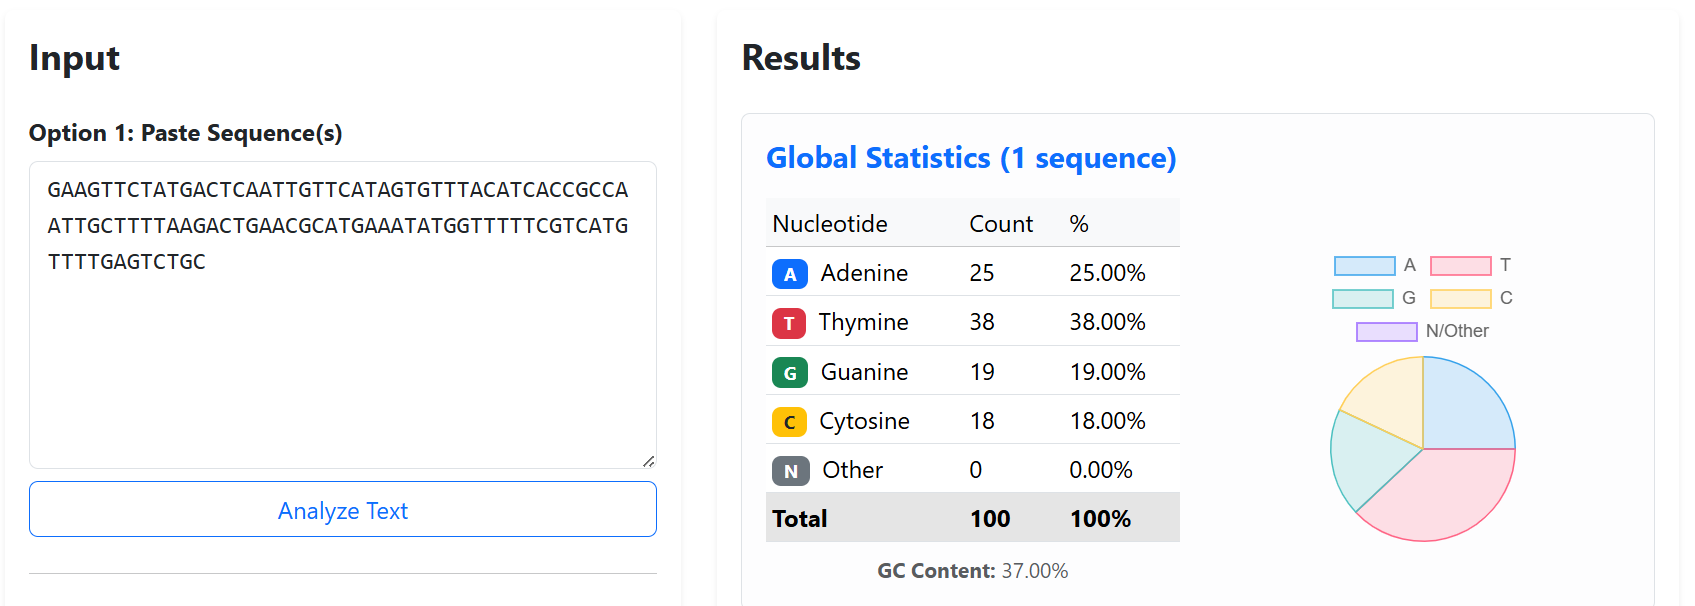
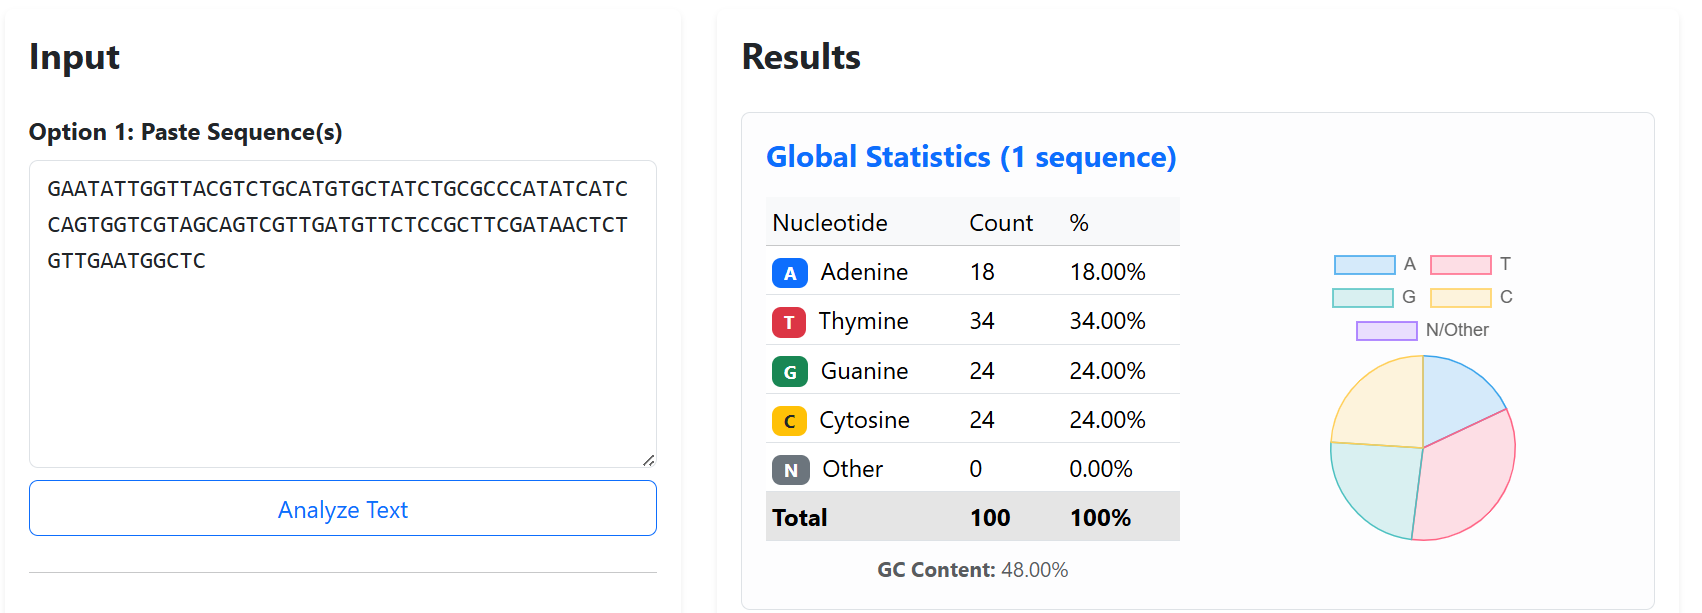
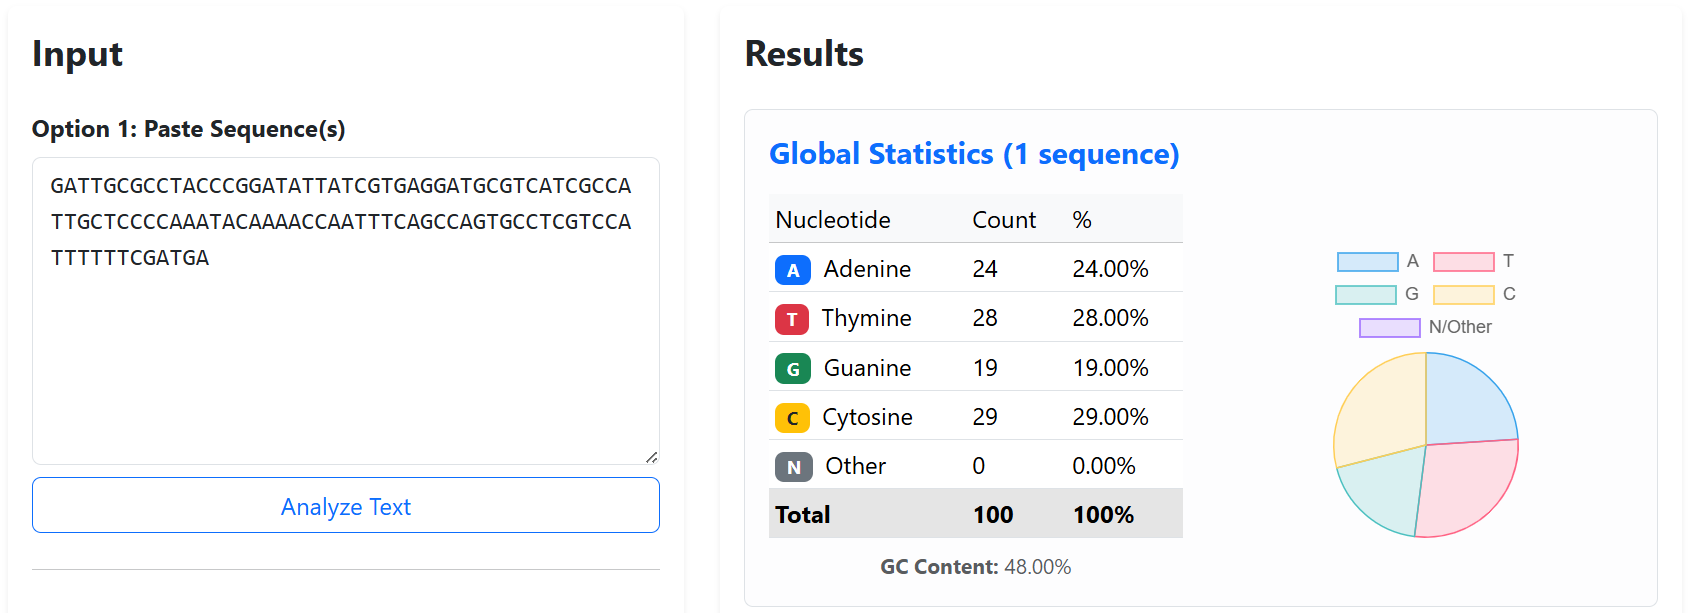
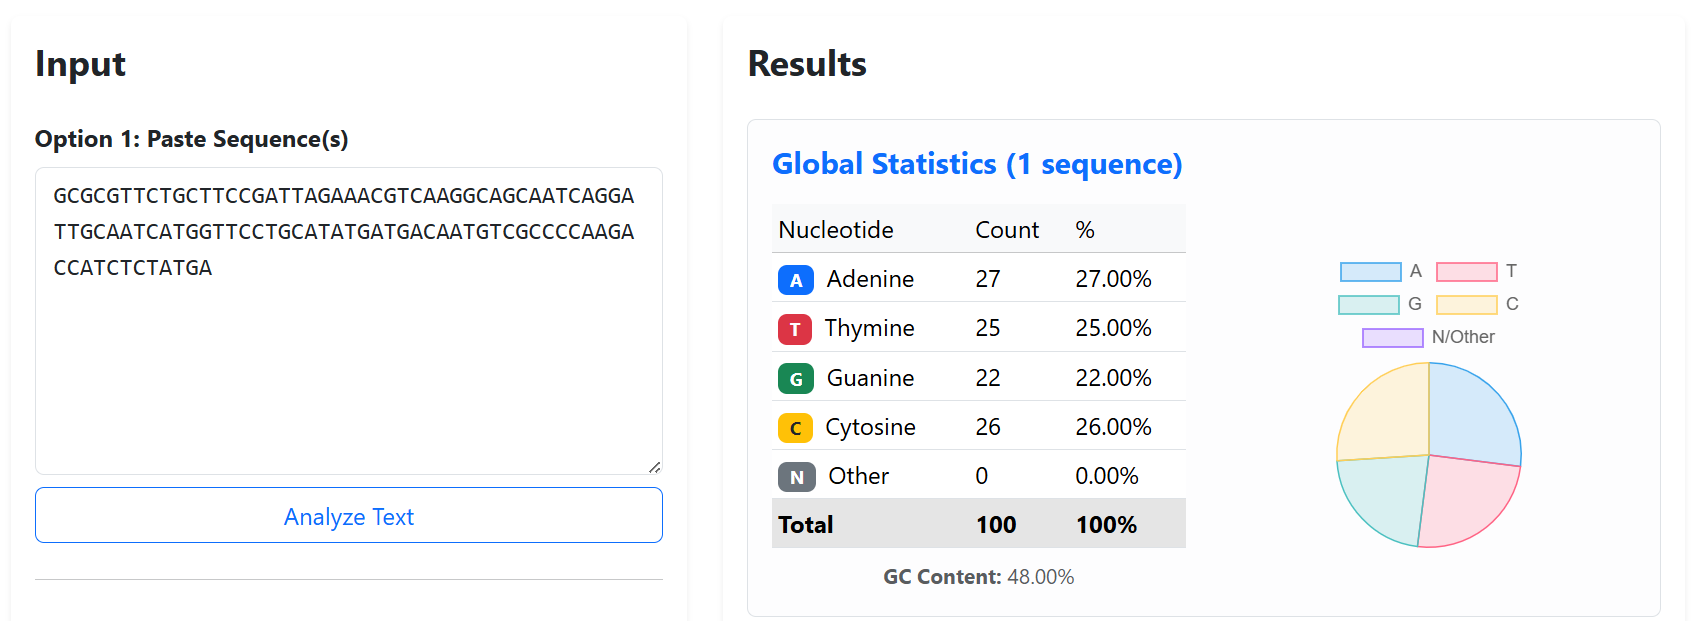
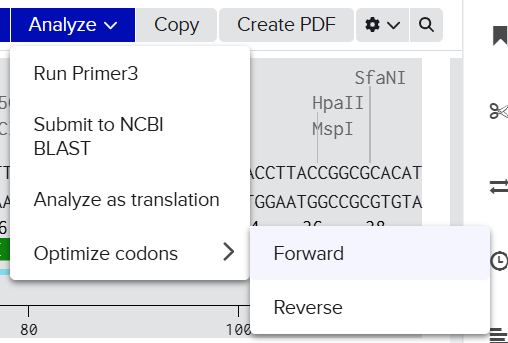
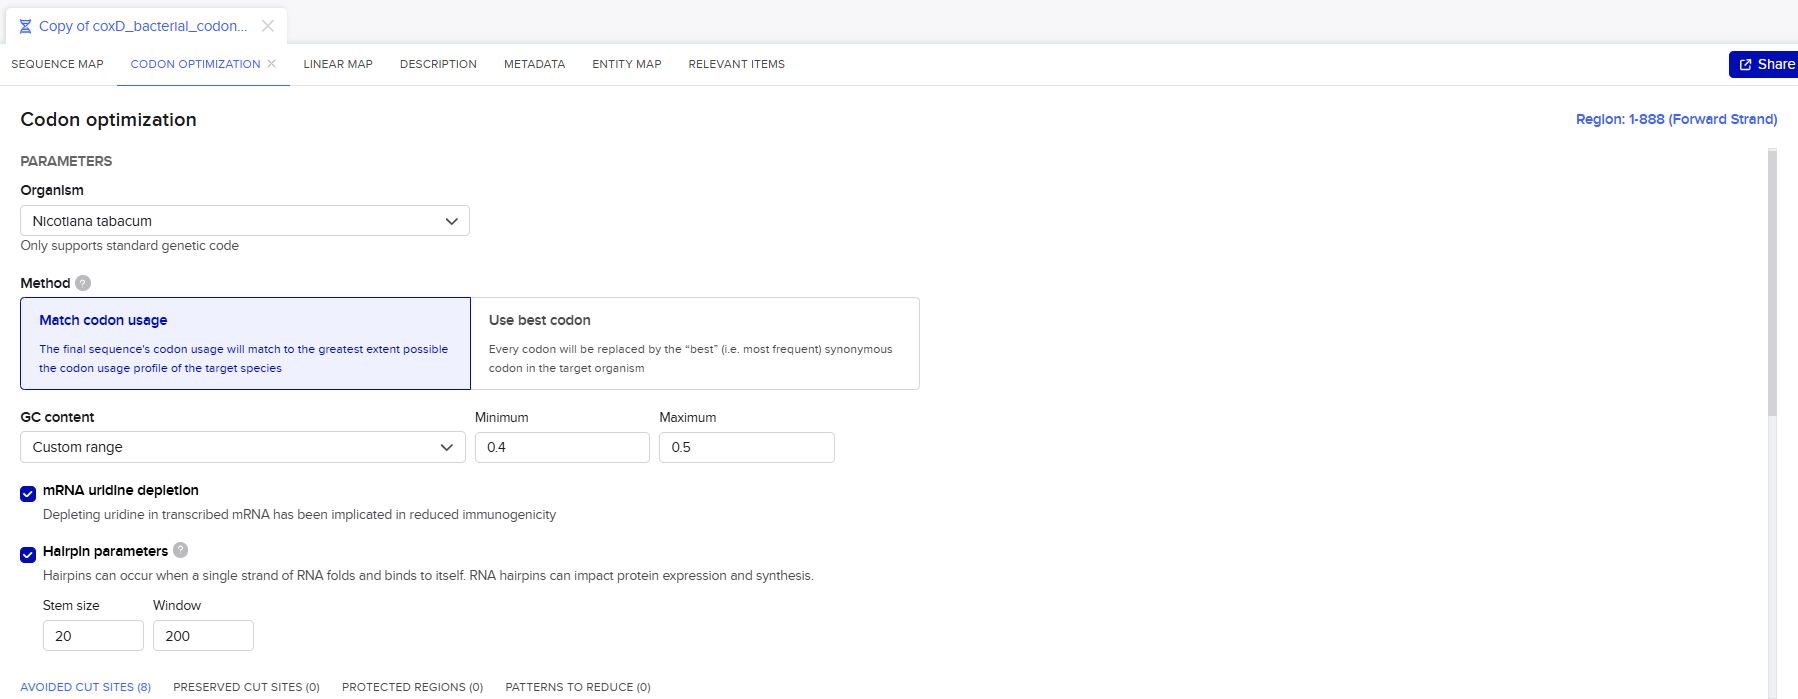
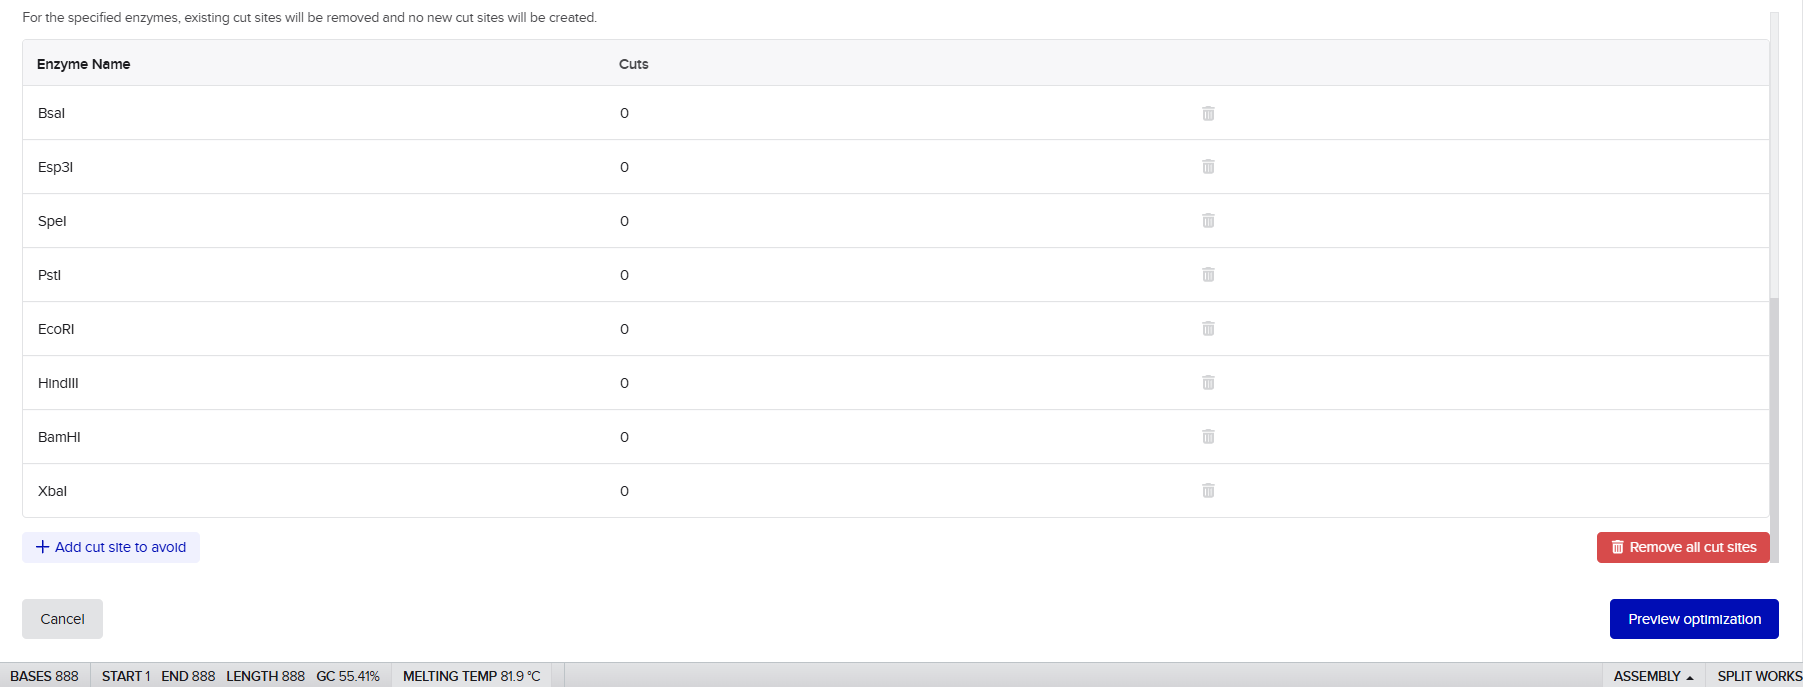
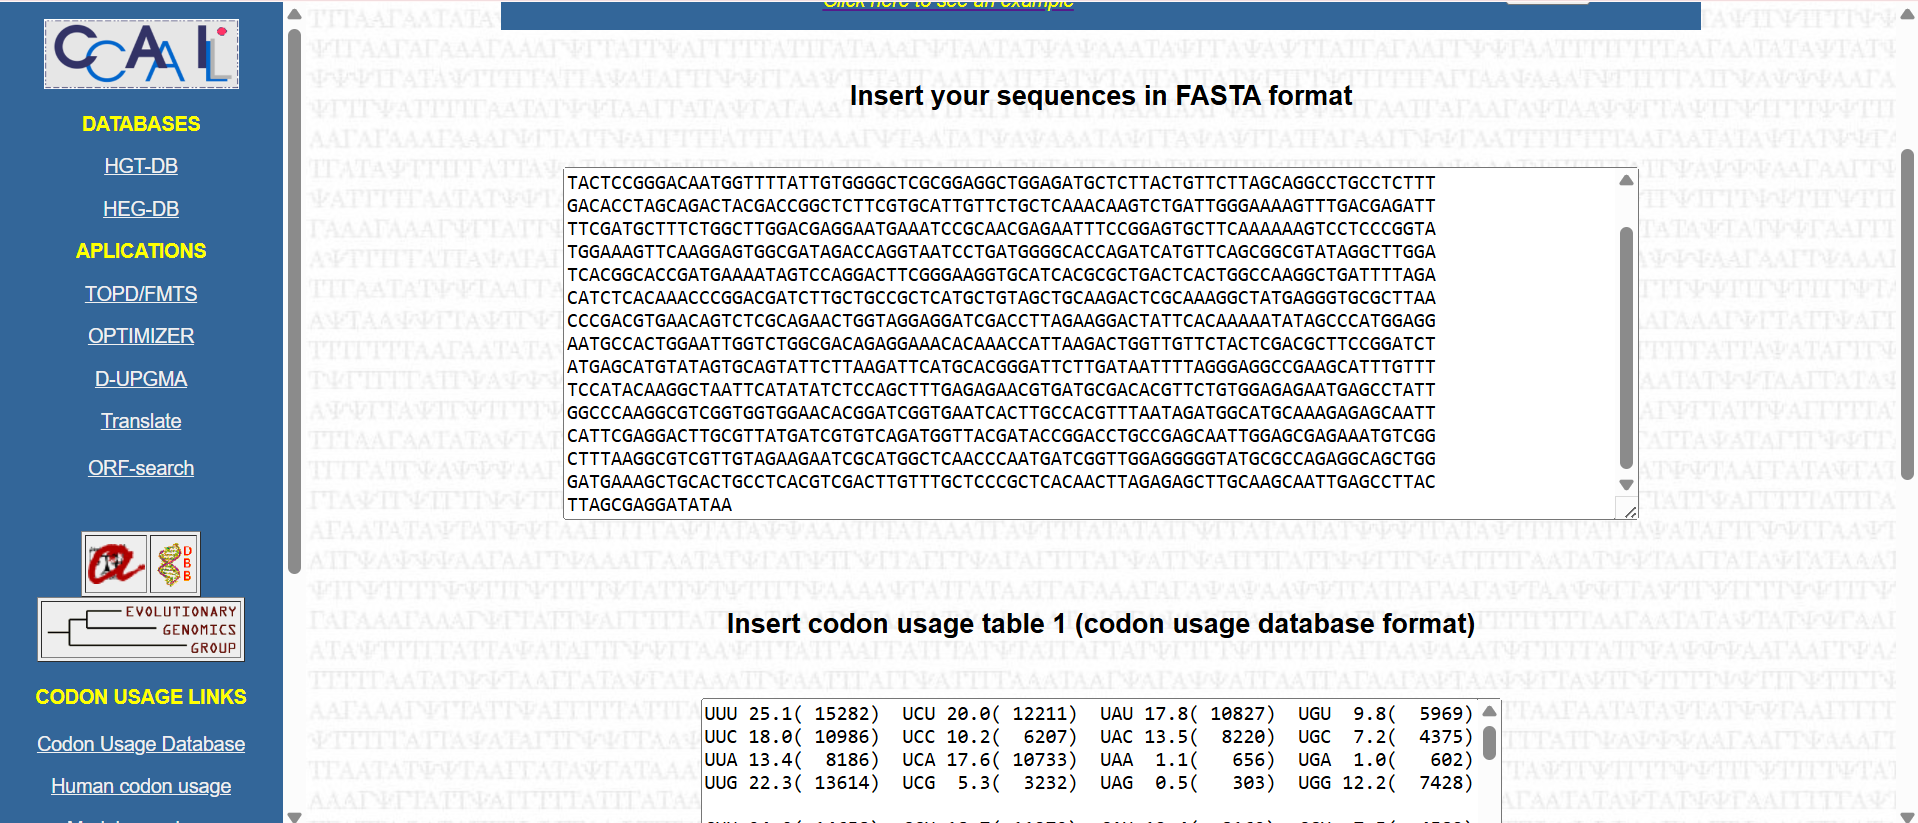
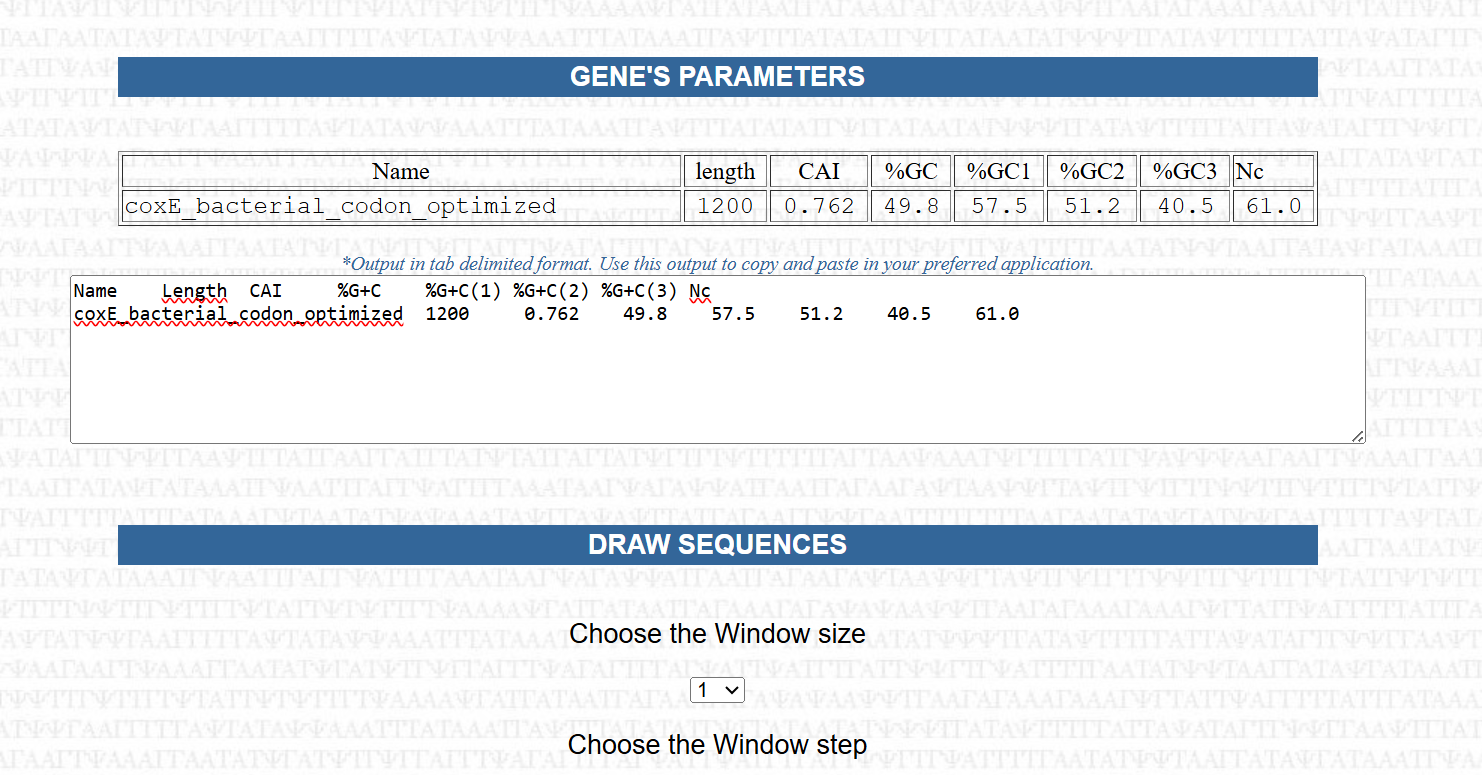
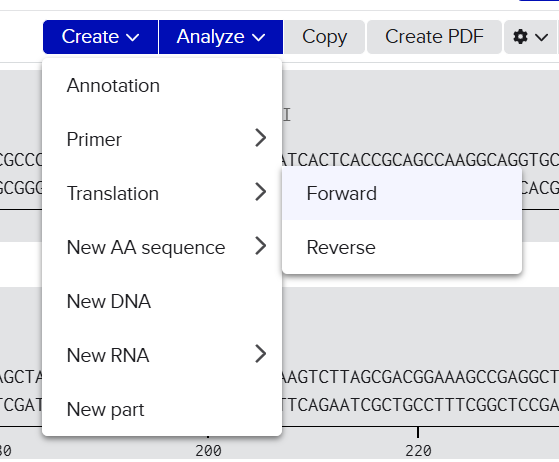
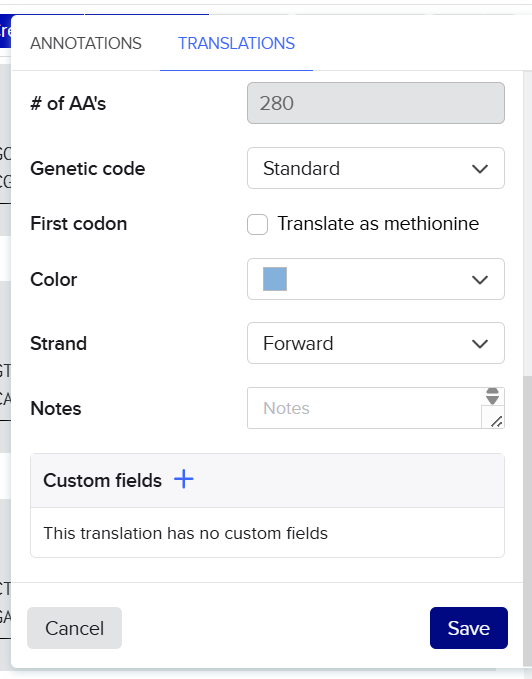
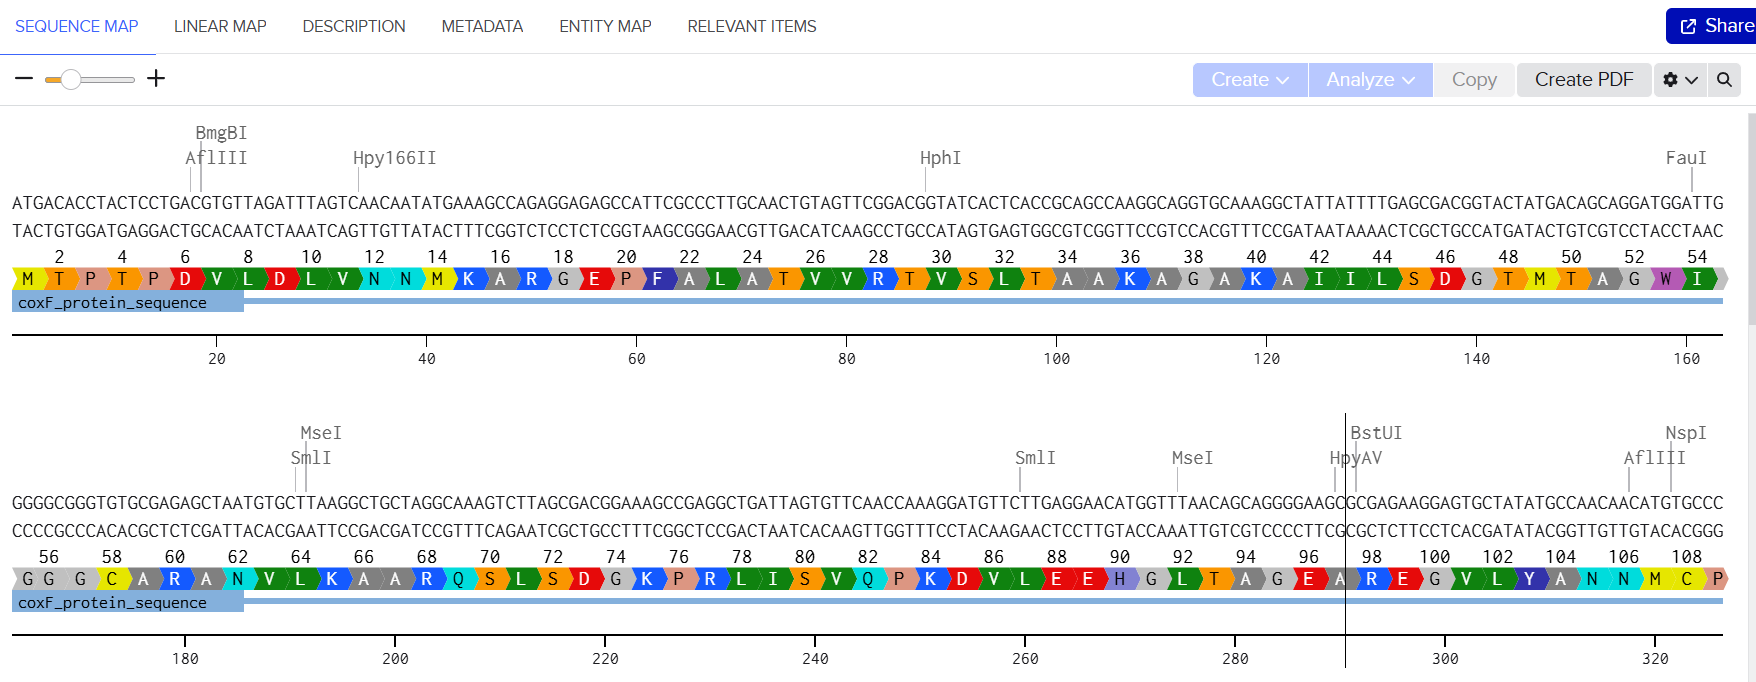
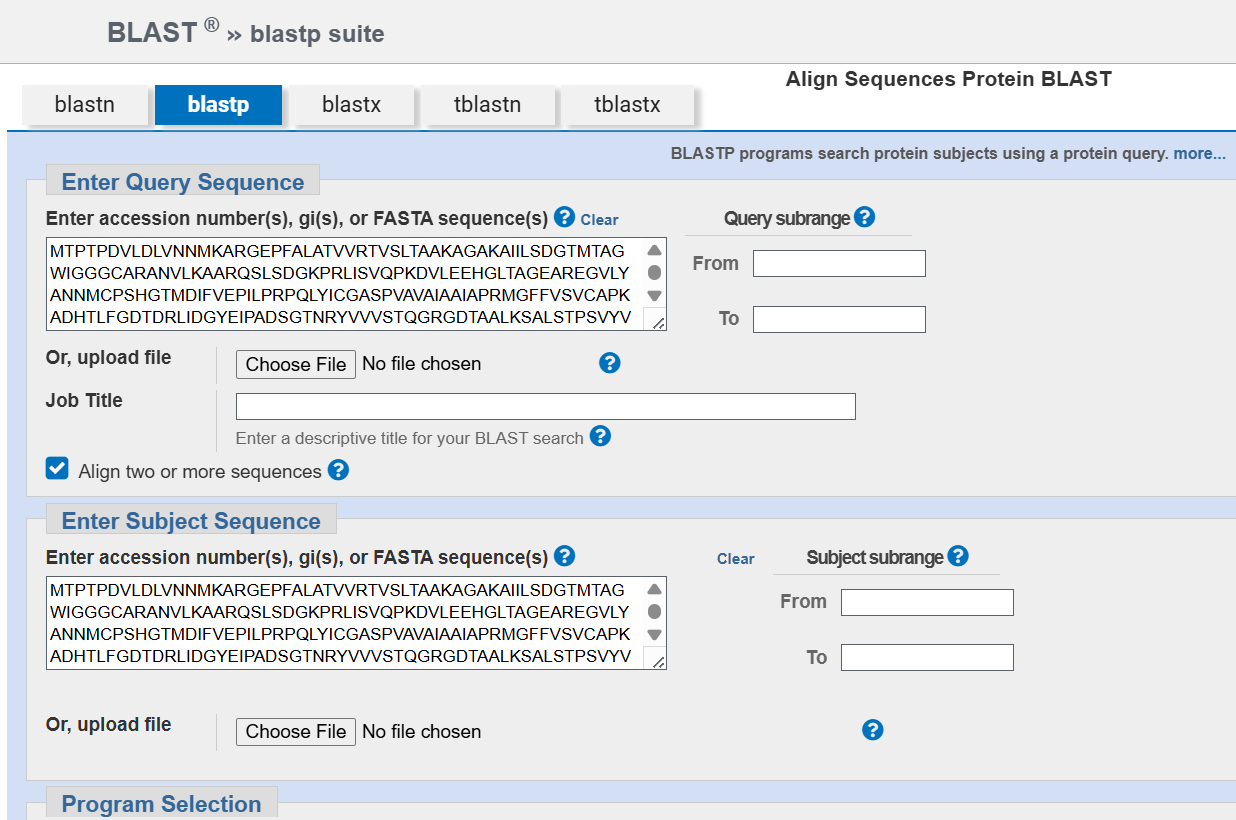
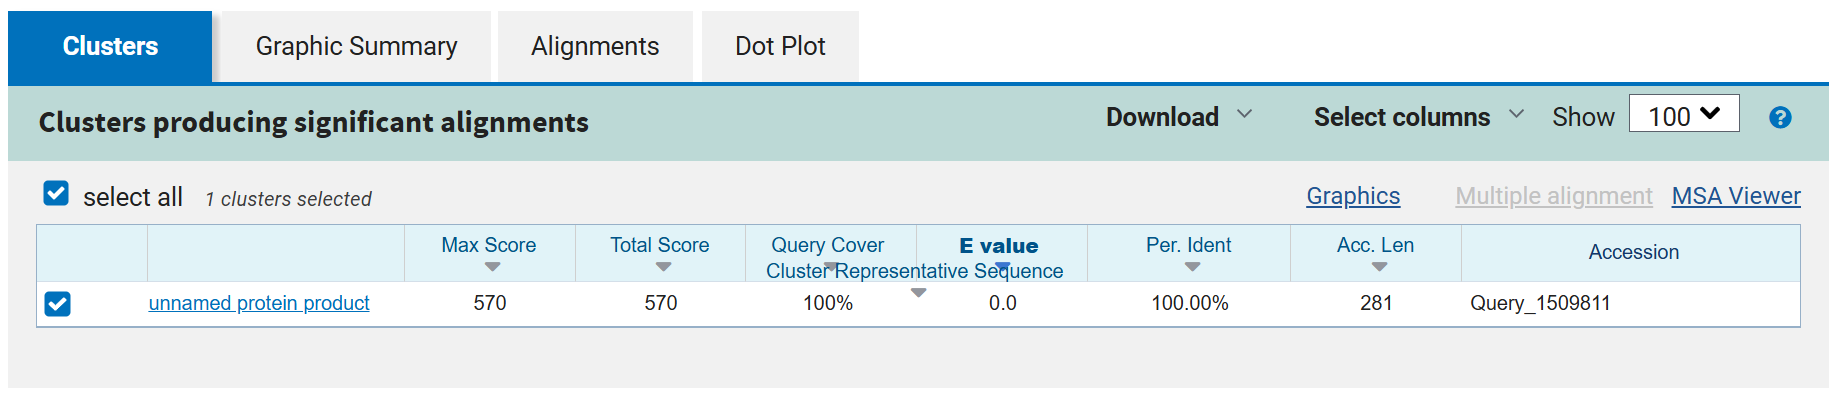
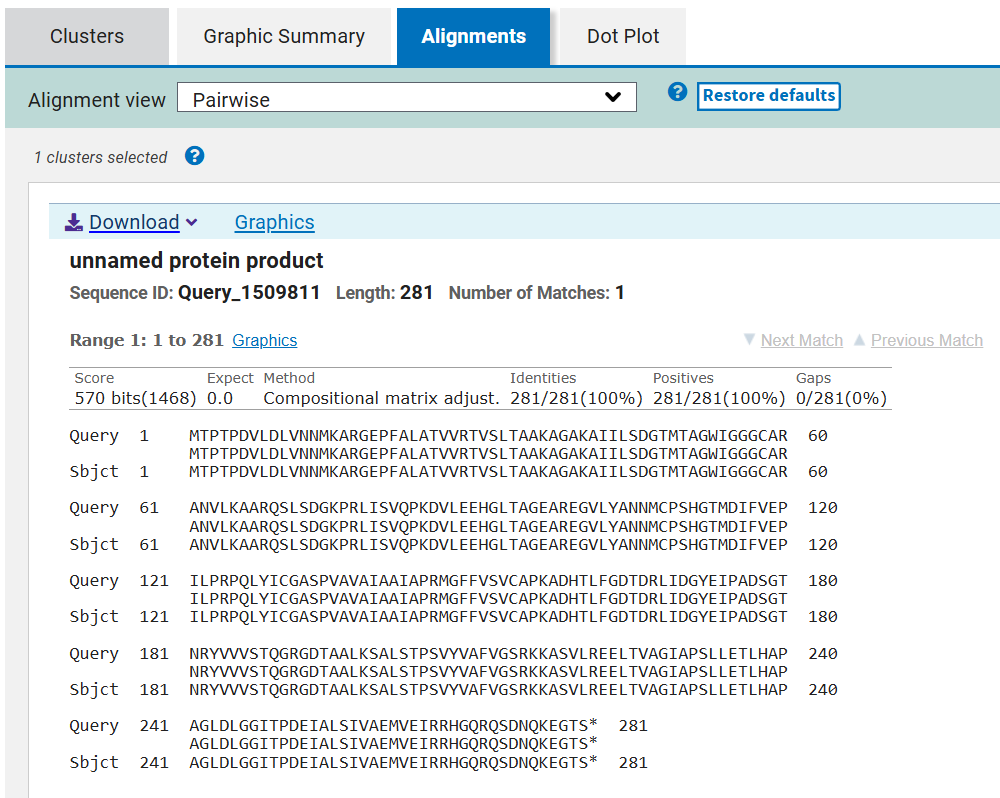
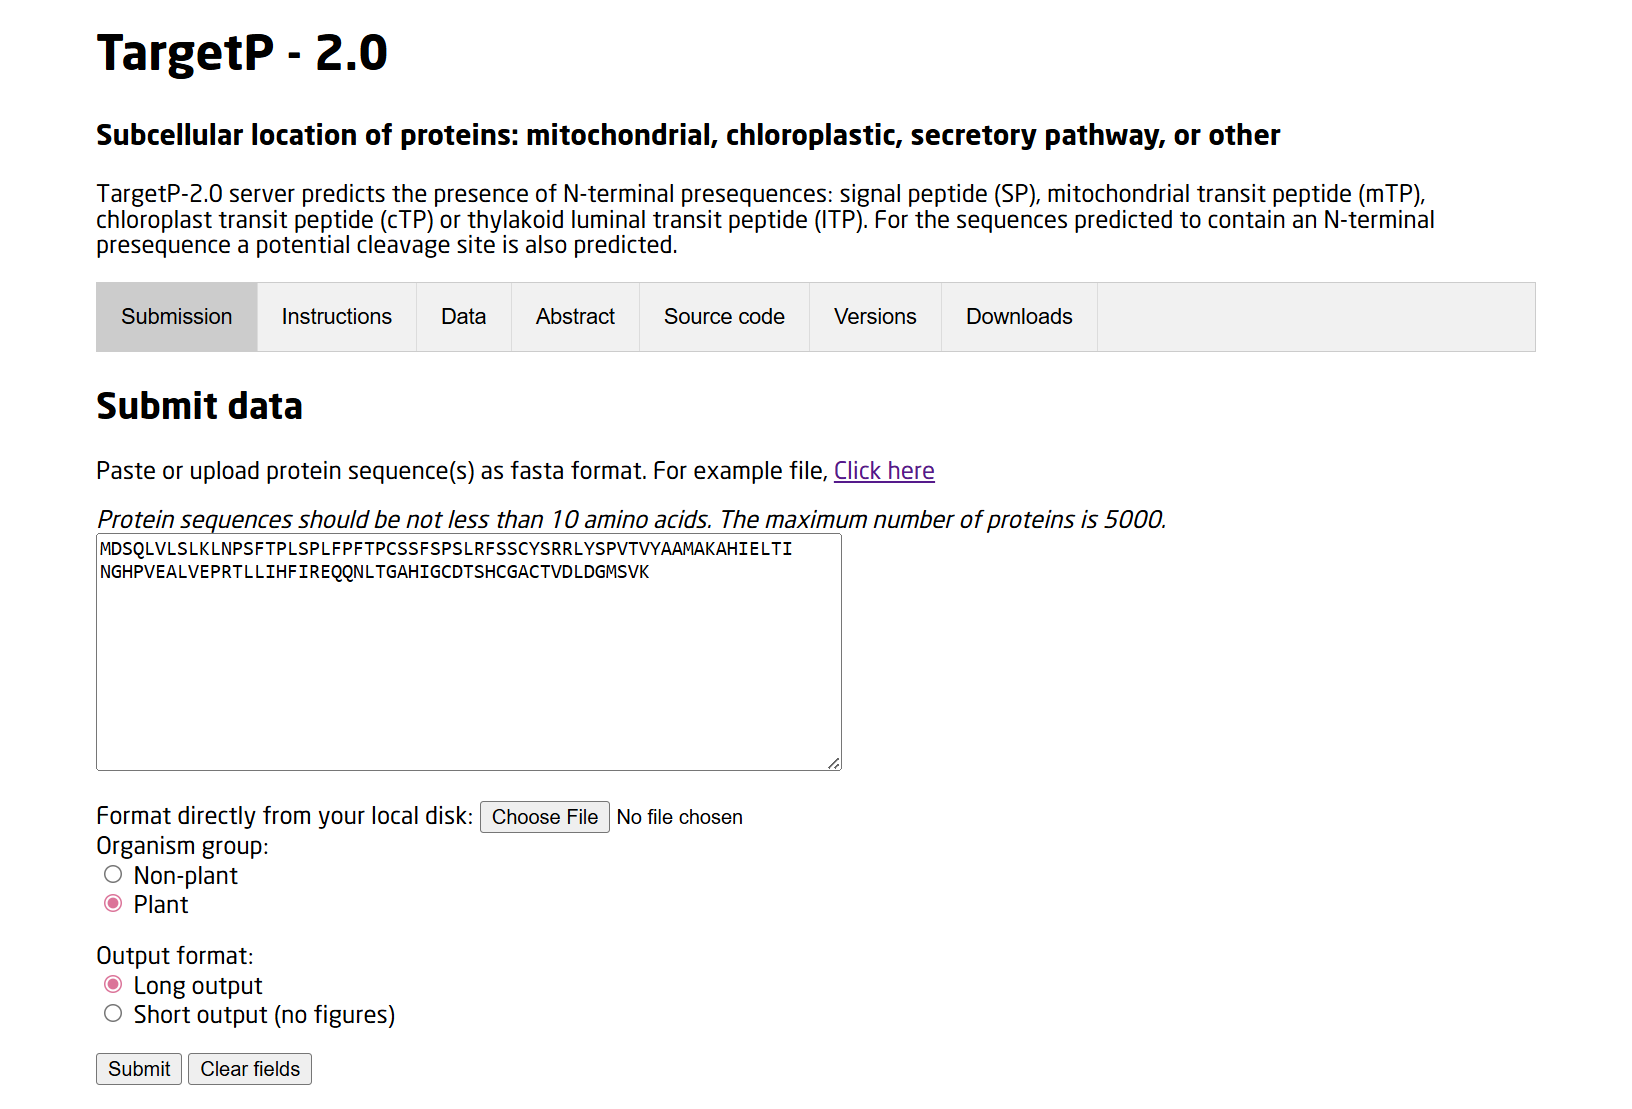
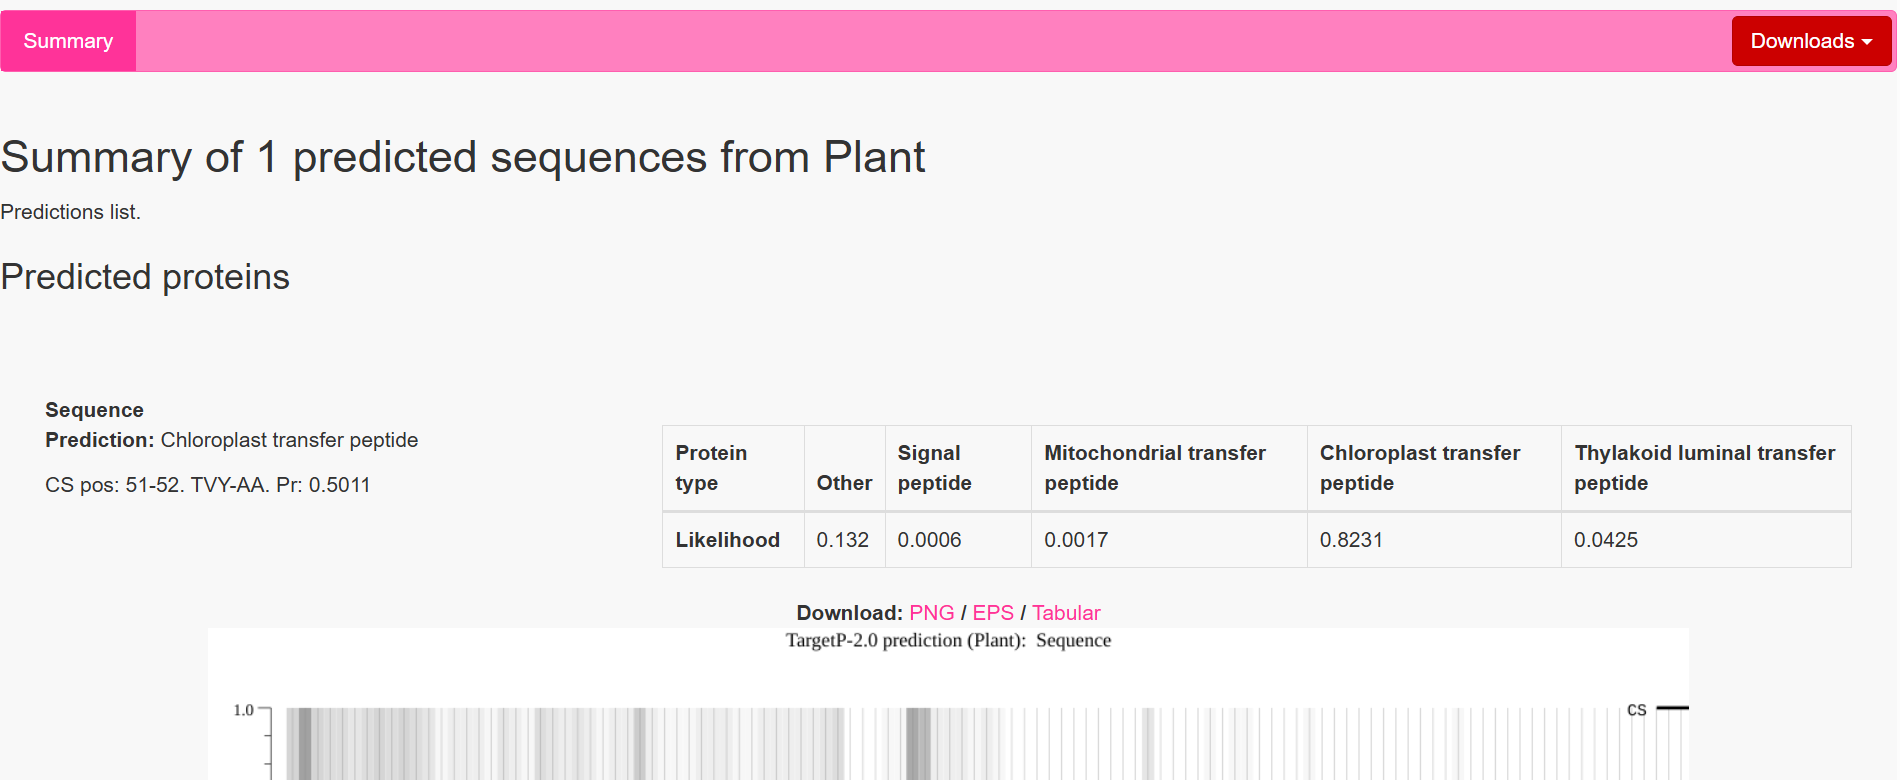
.png)
.png)
.png)
.png)
.png)
.png)
.png)

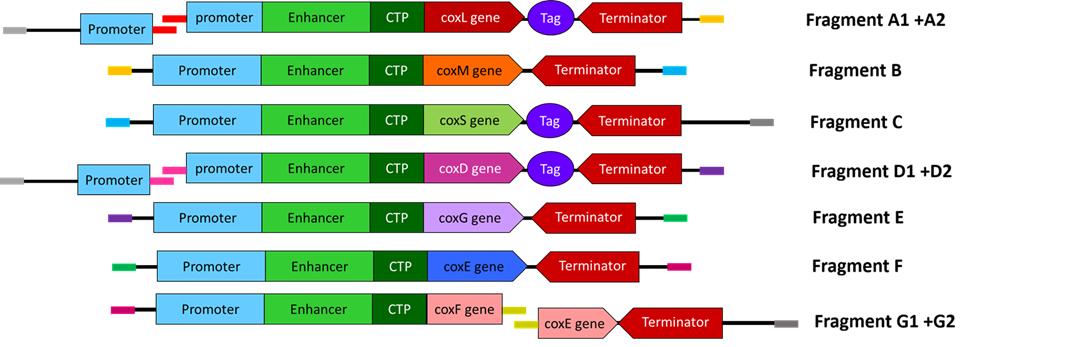
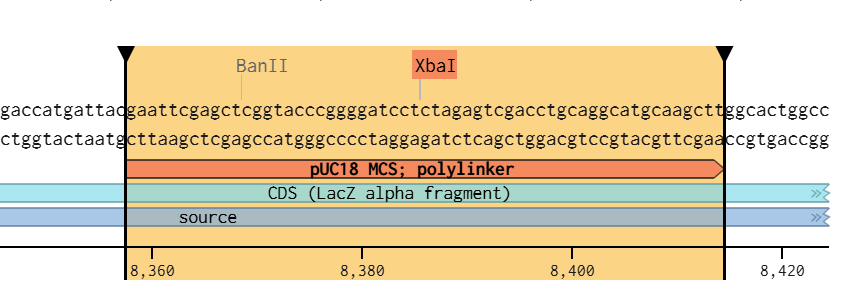
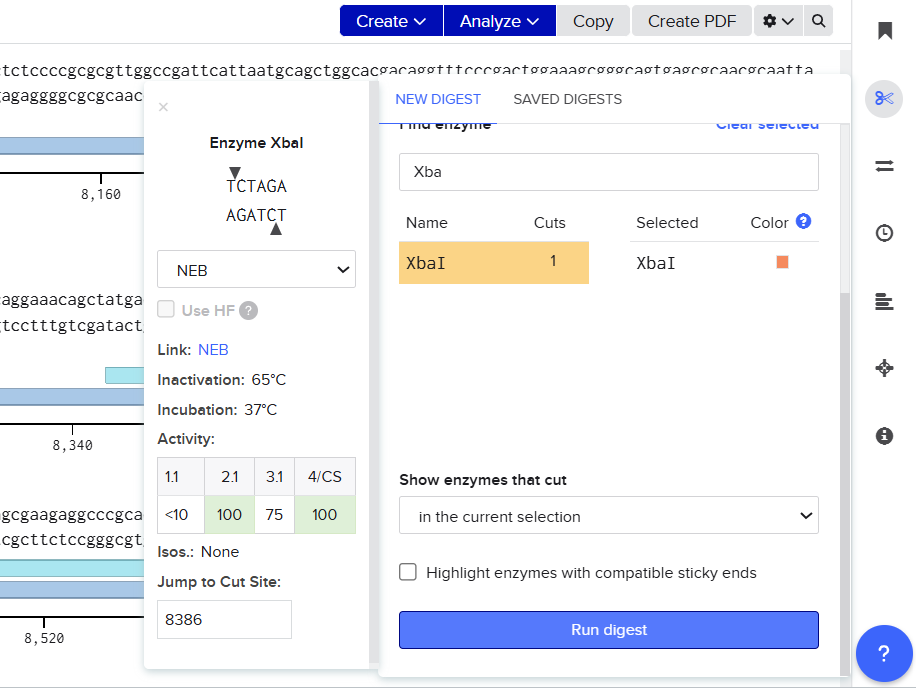
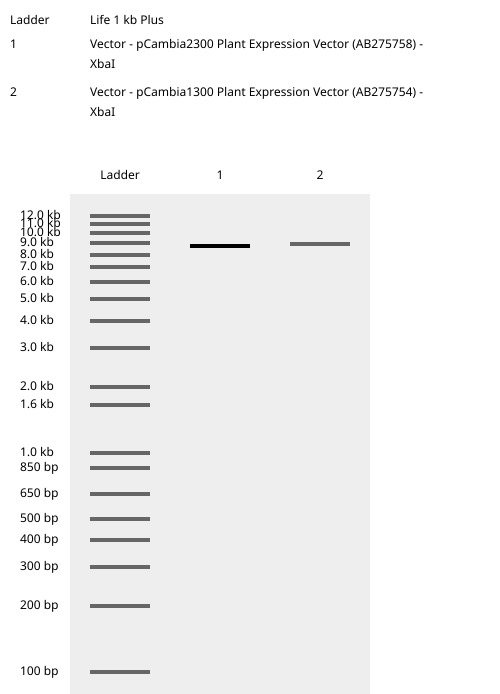
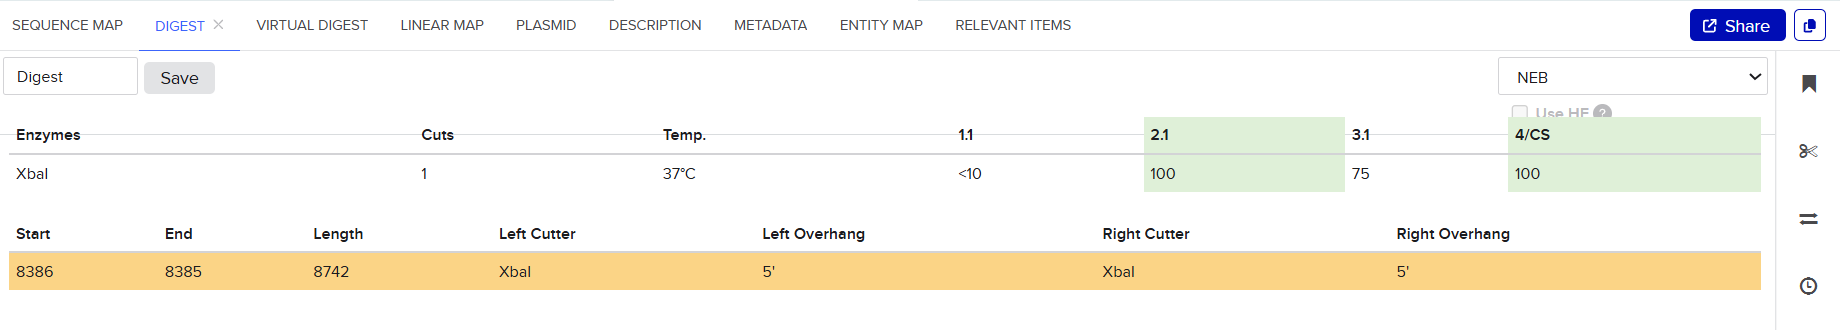
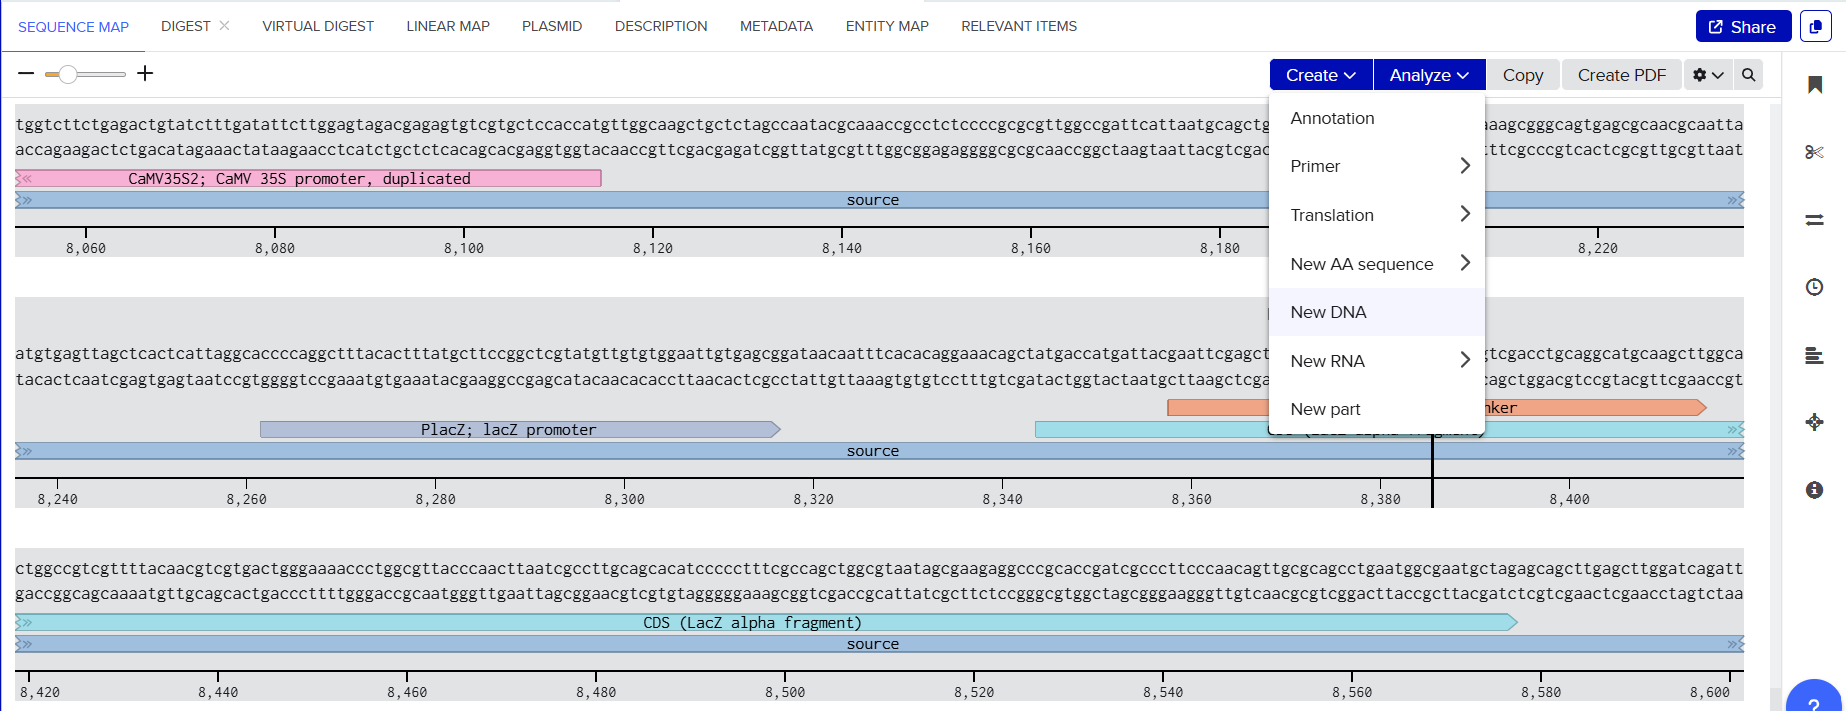
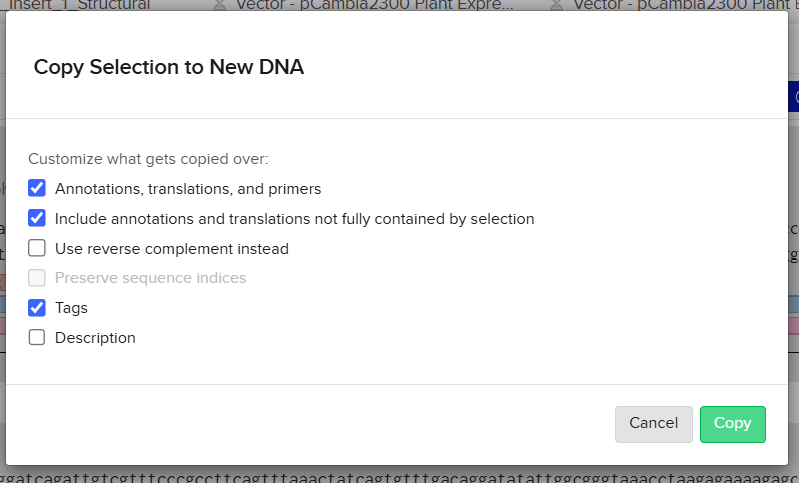
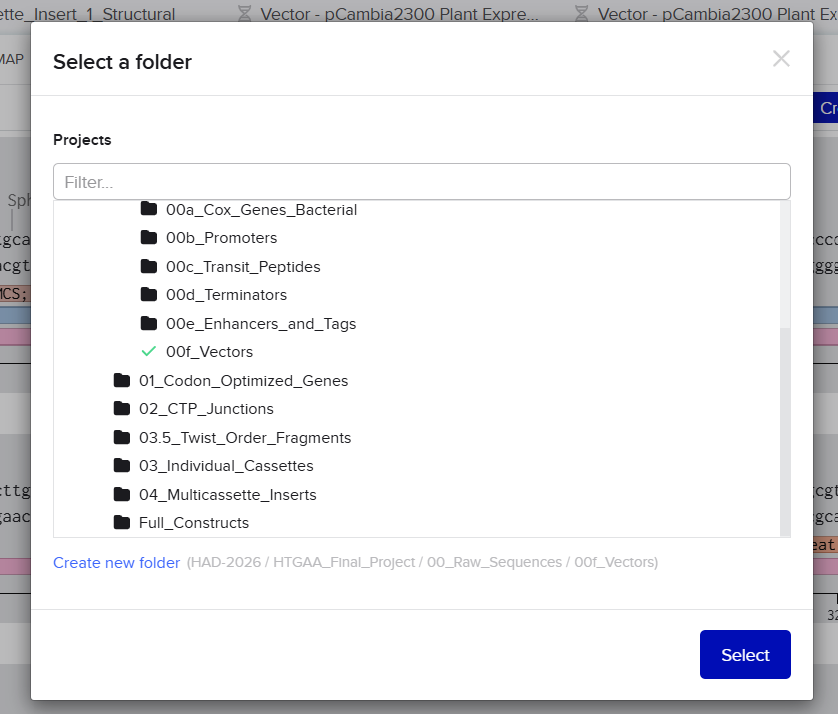
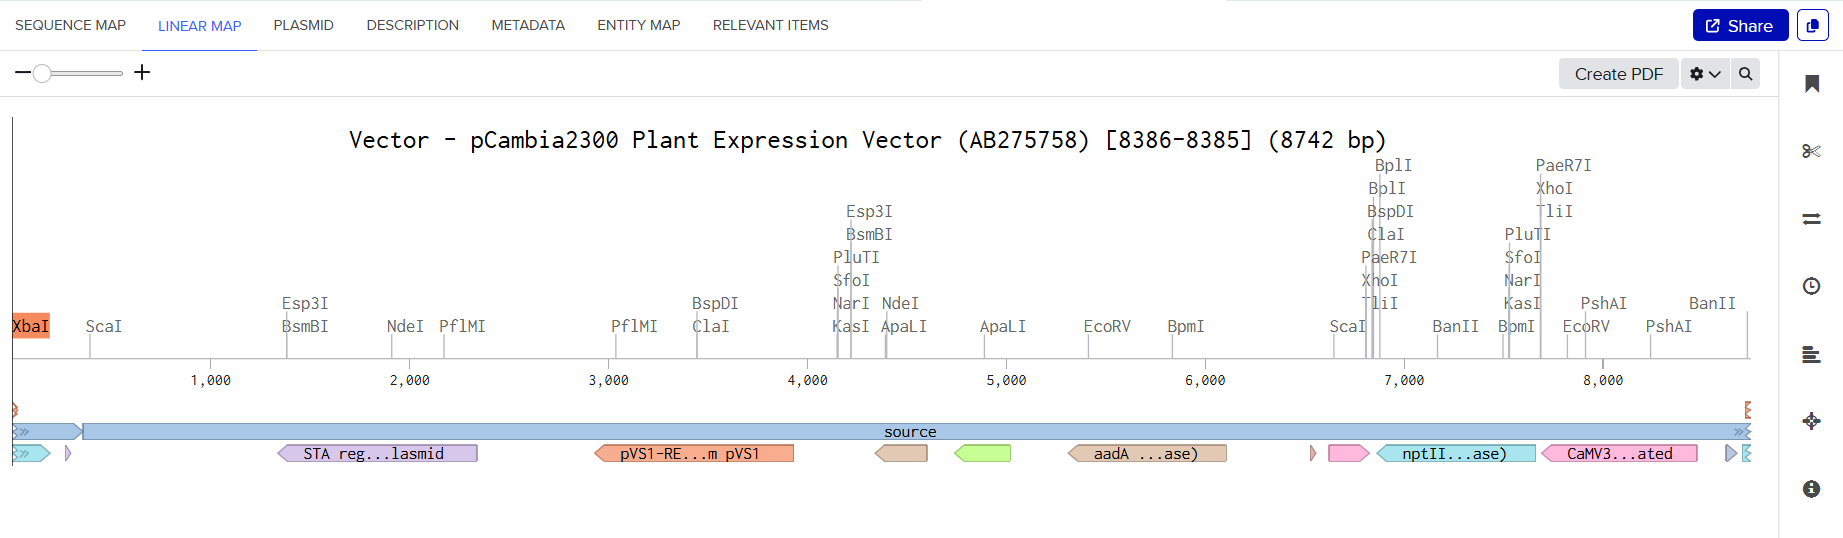
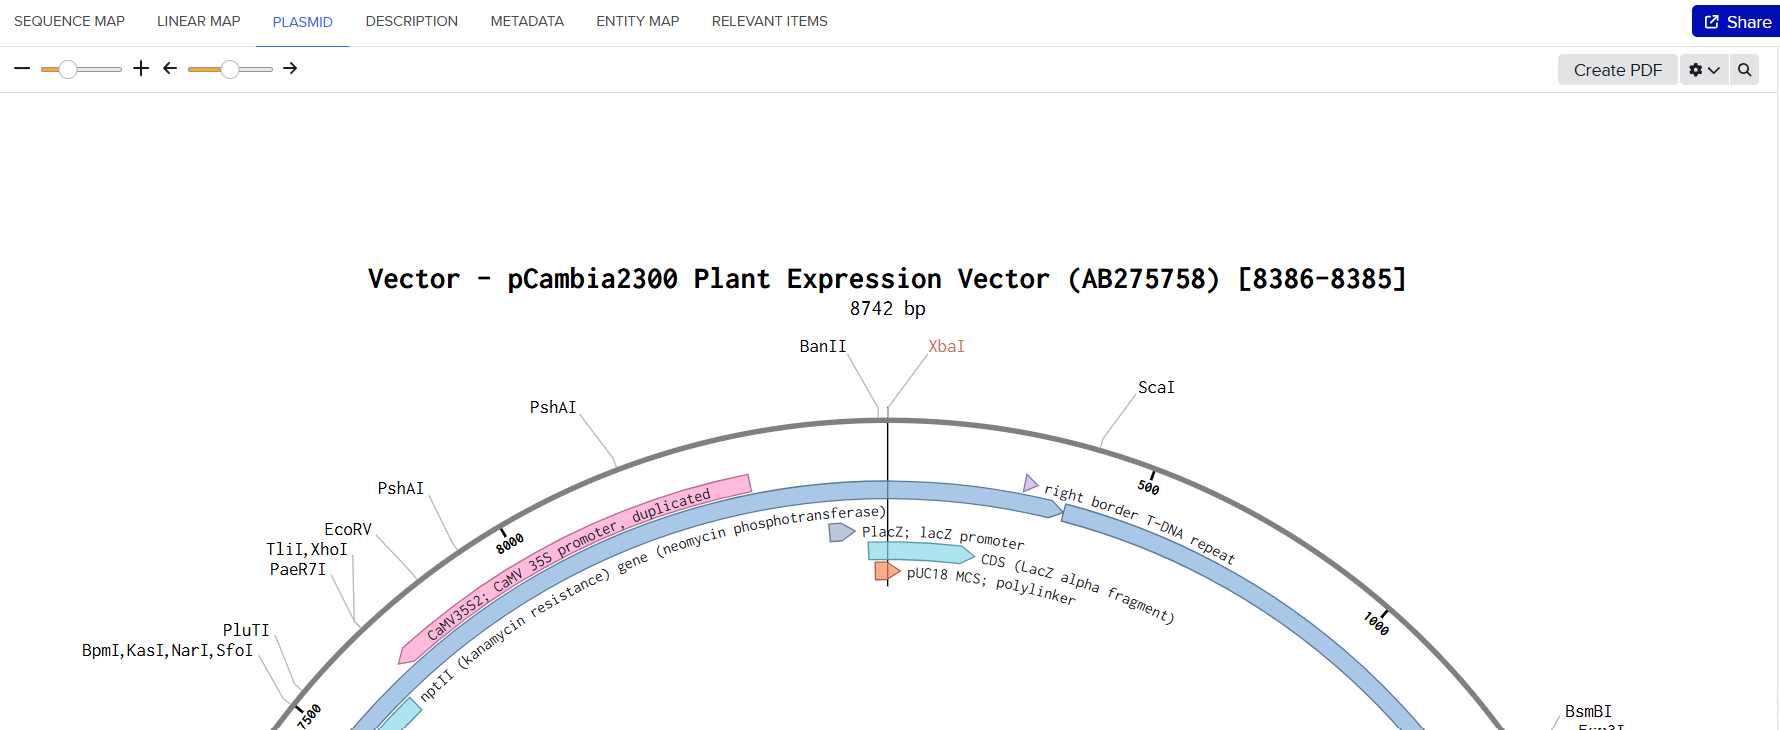
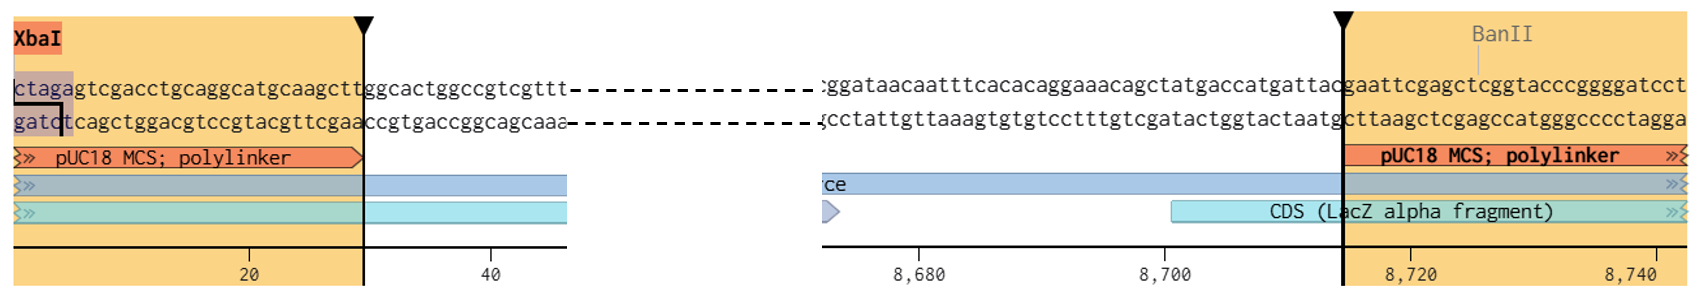
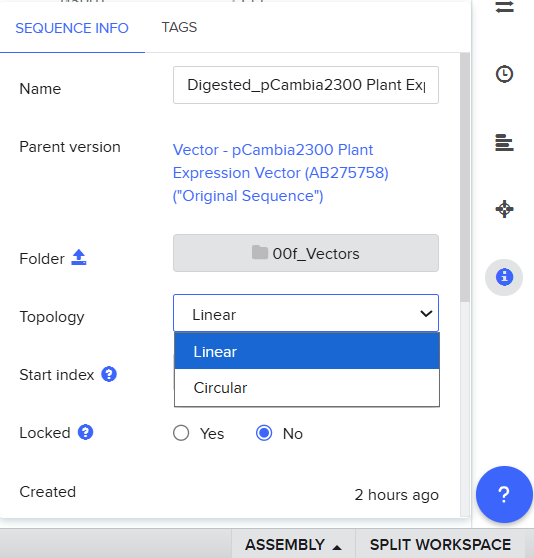

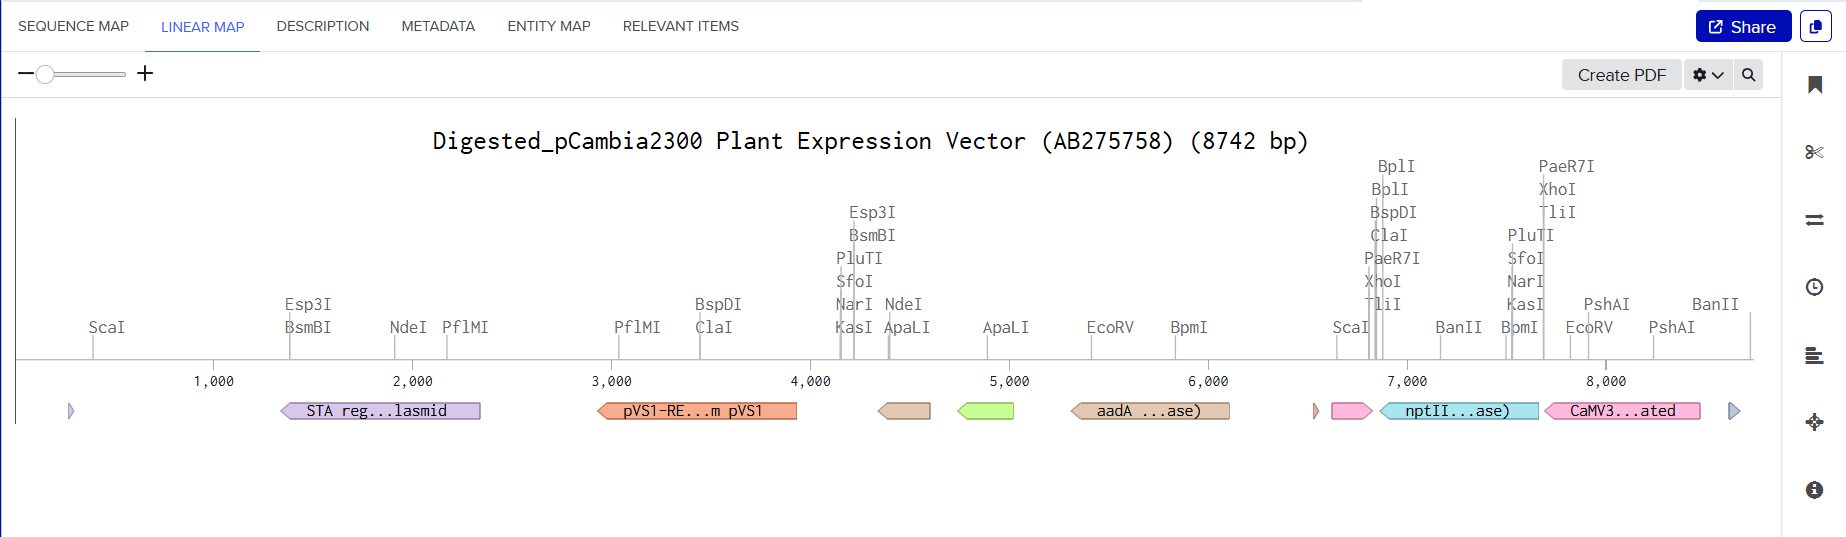
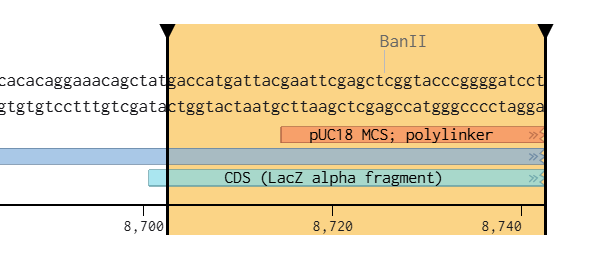
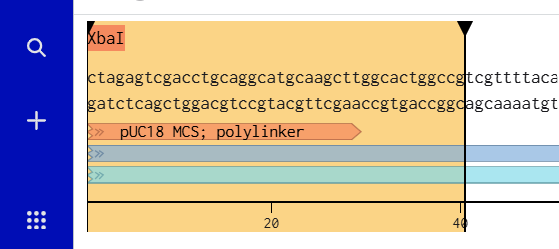
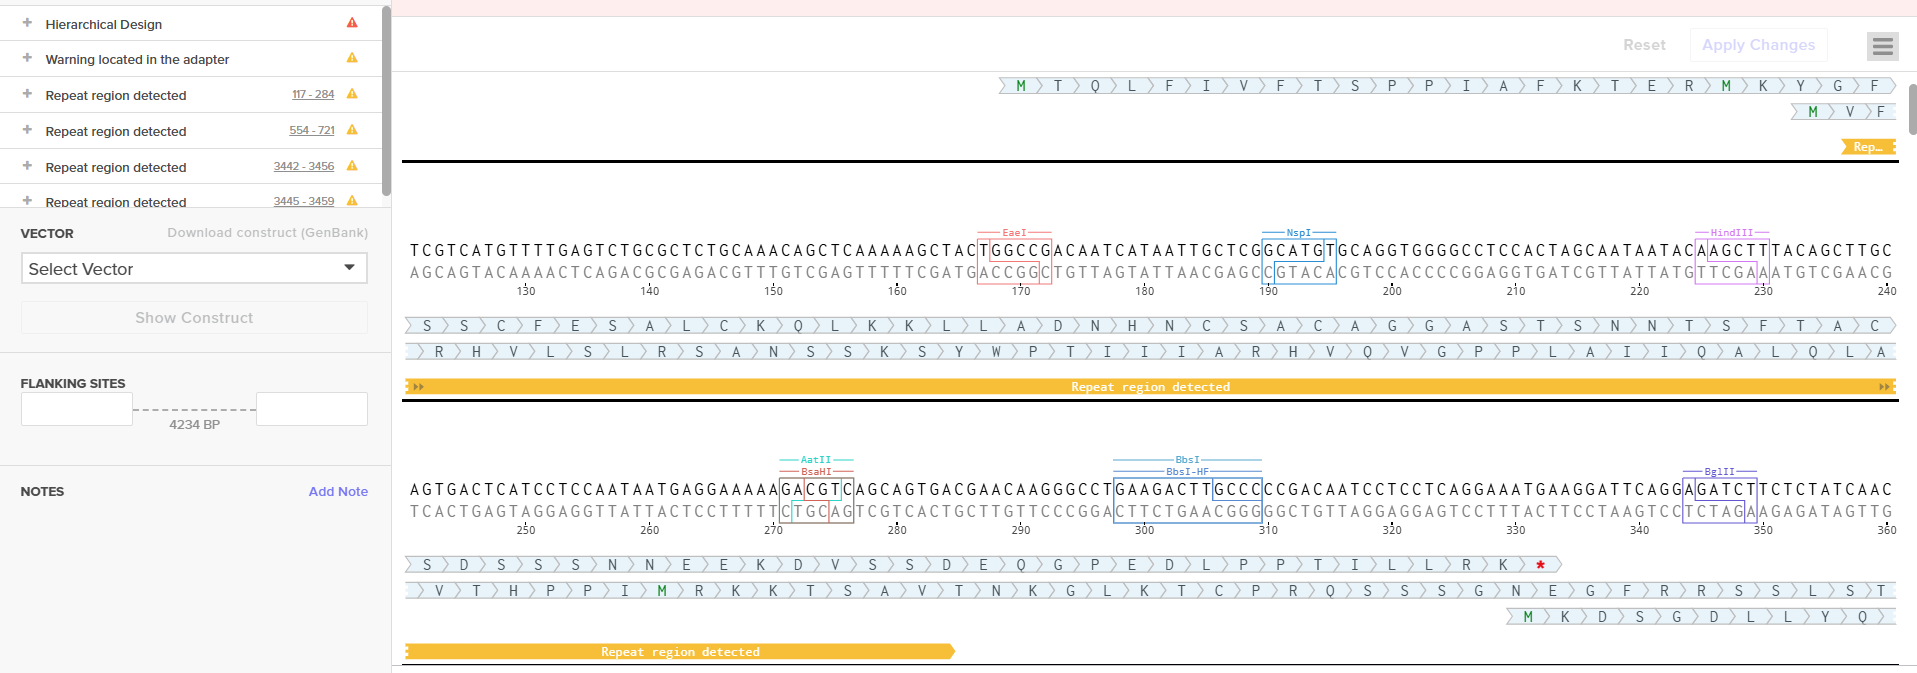
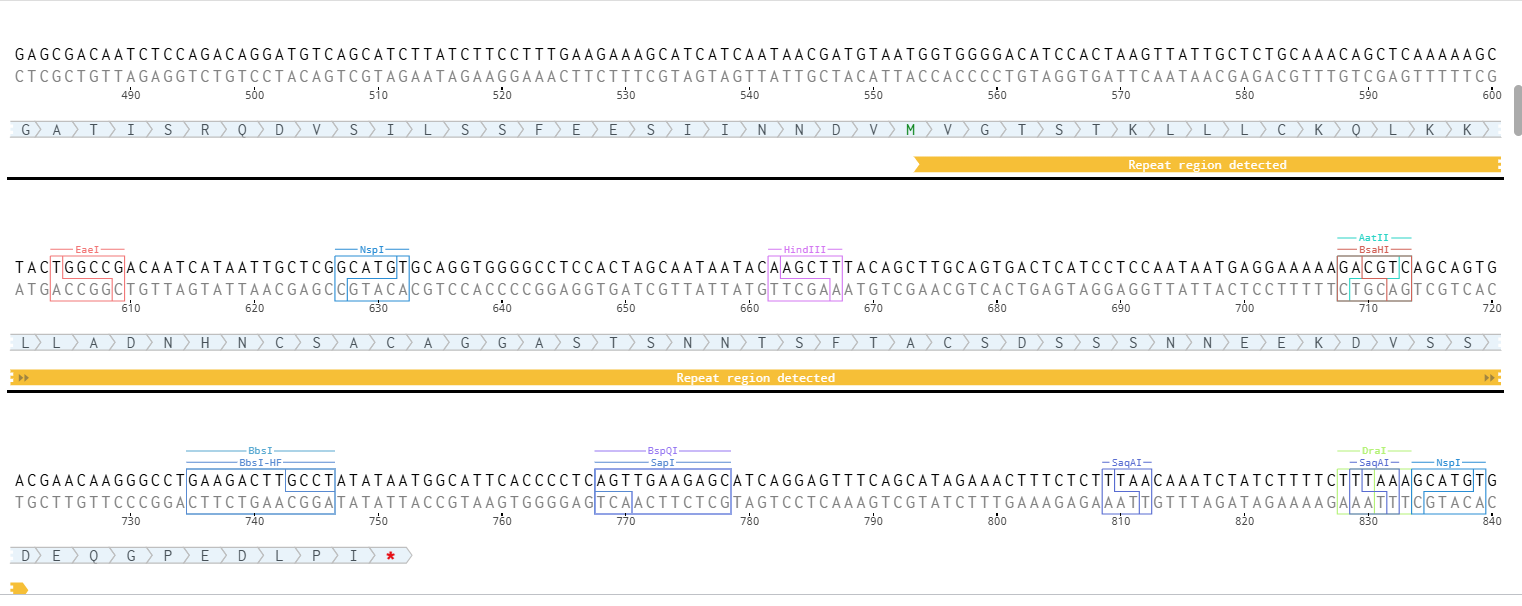
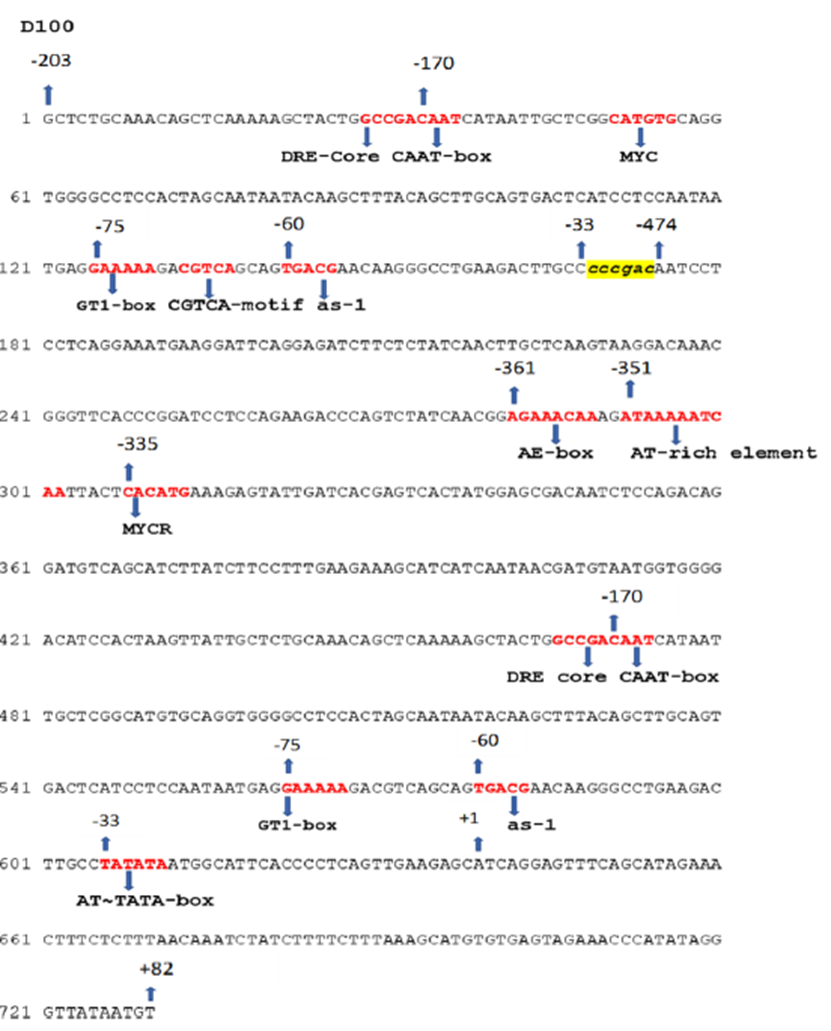
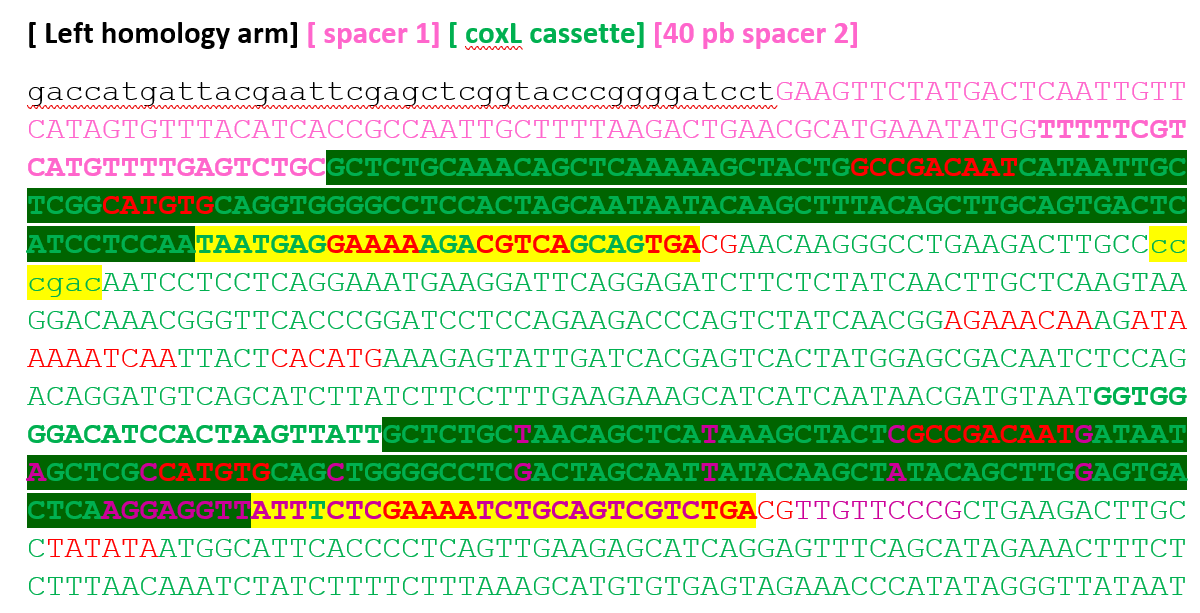
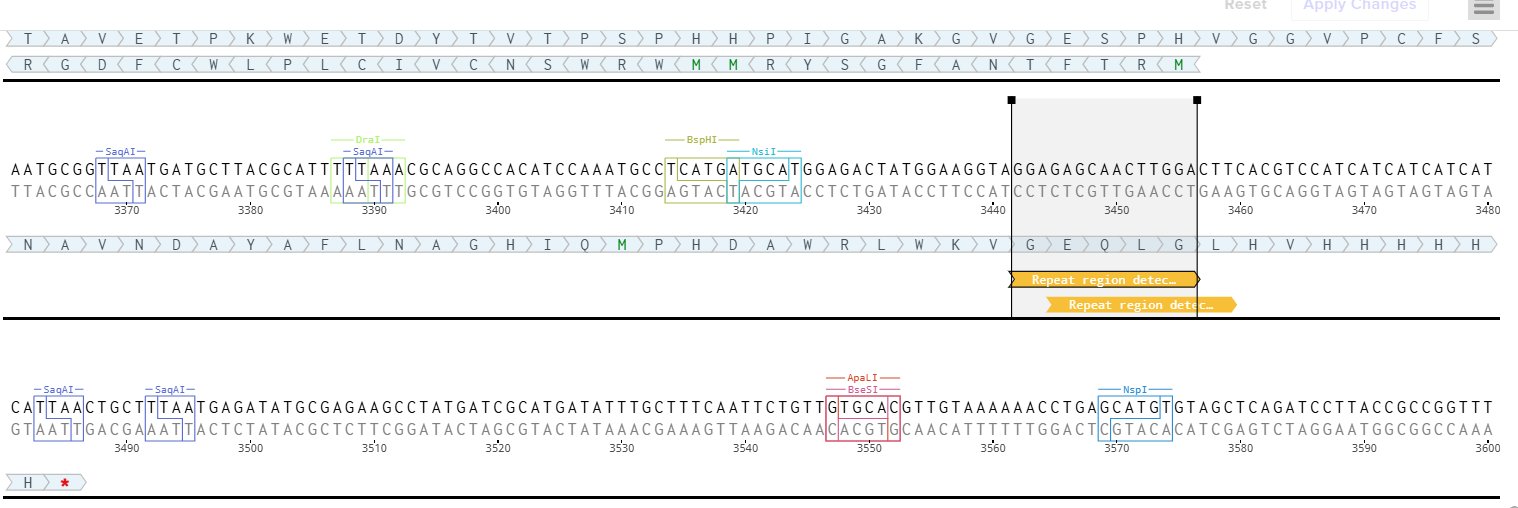
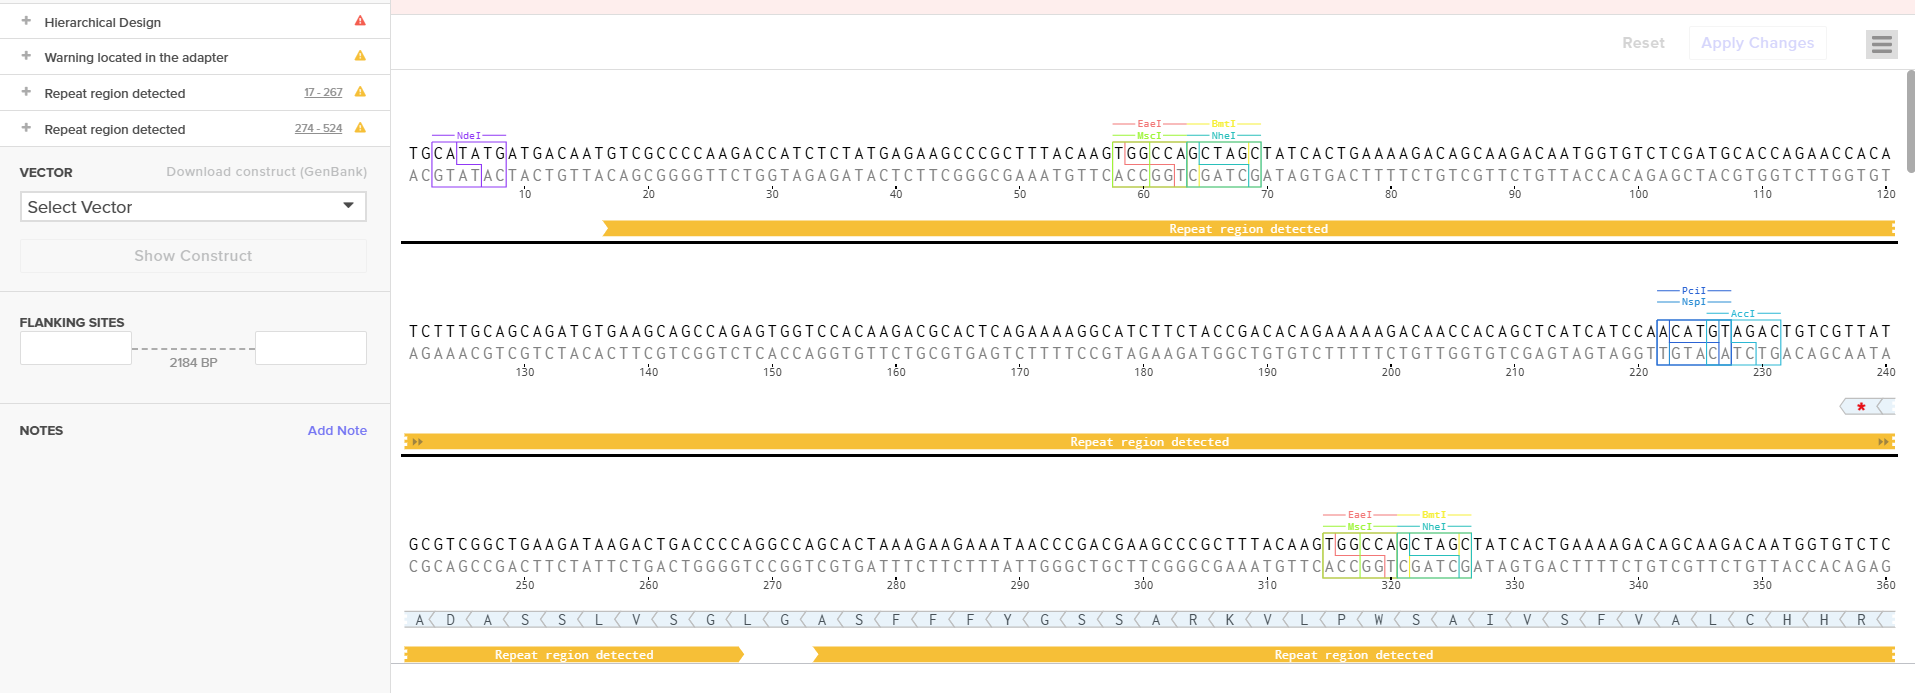
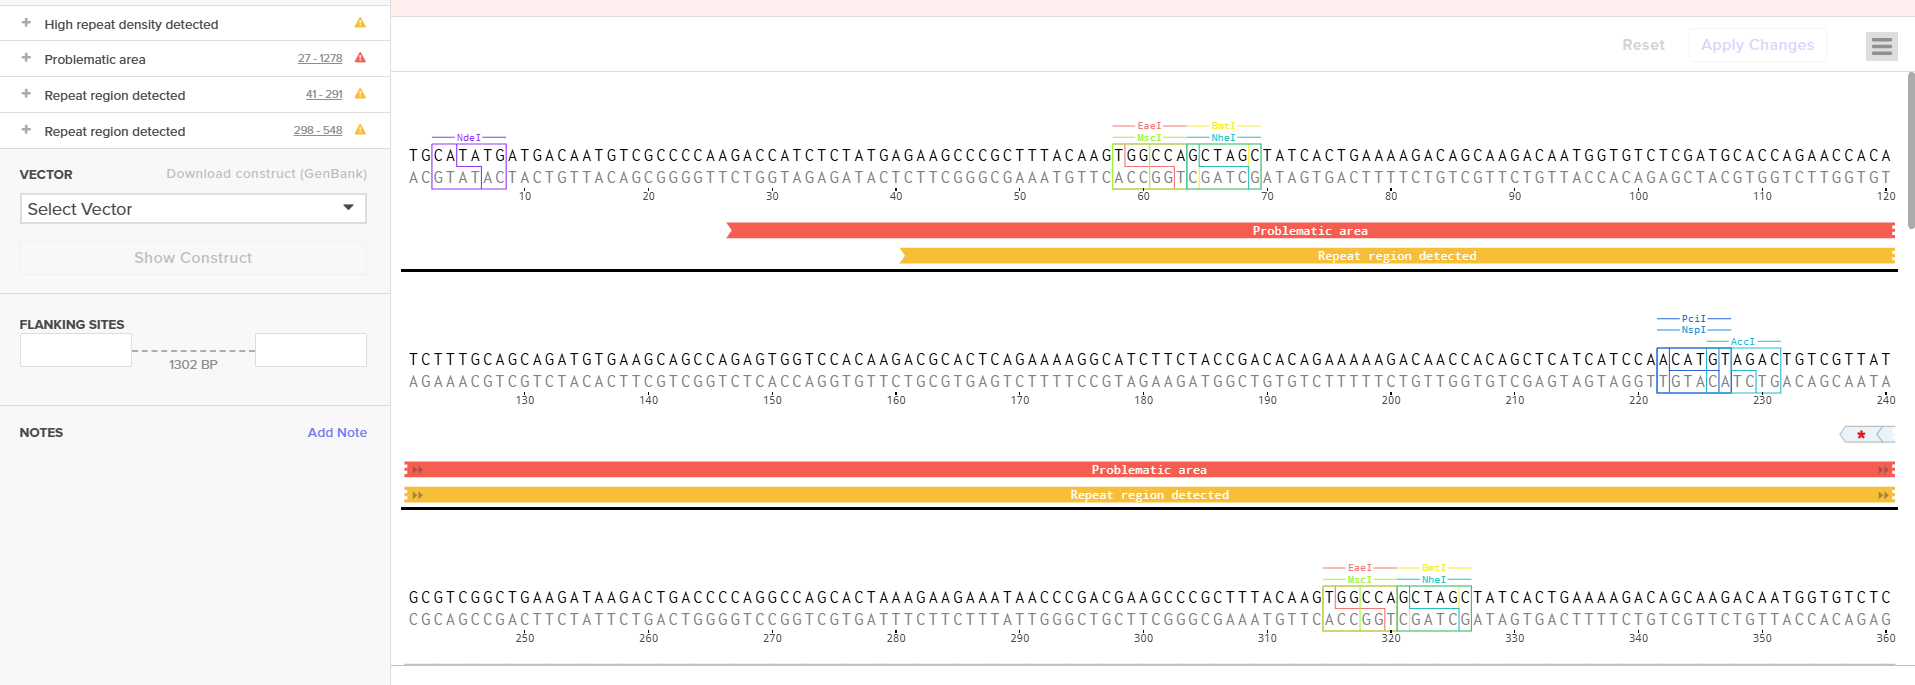
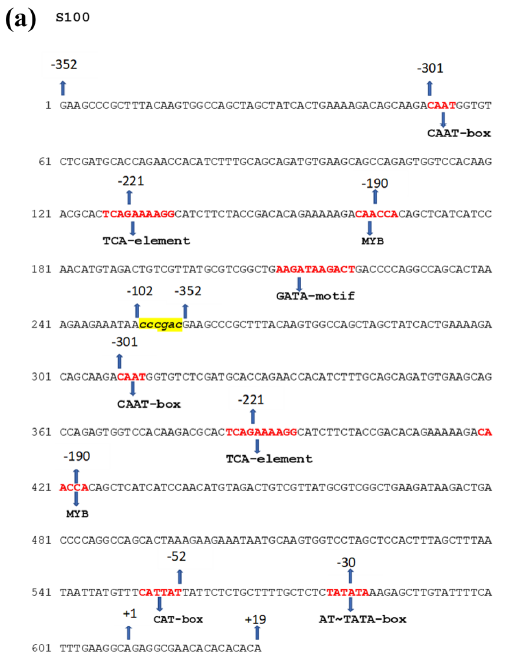
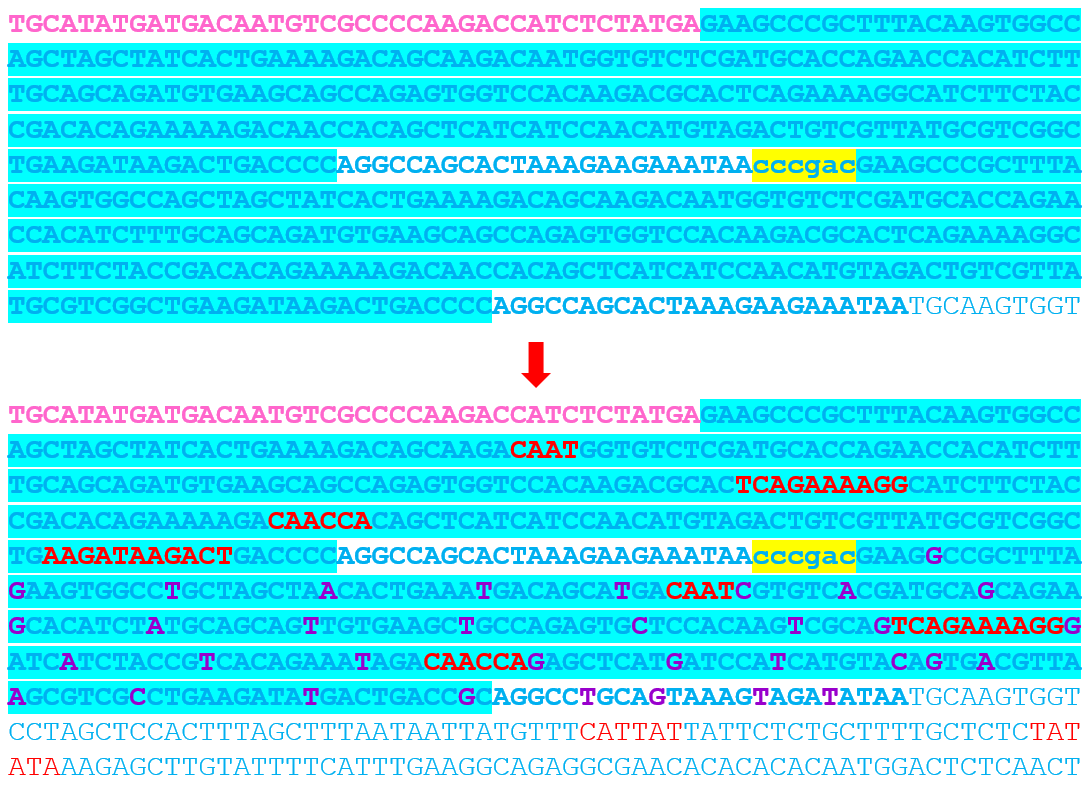
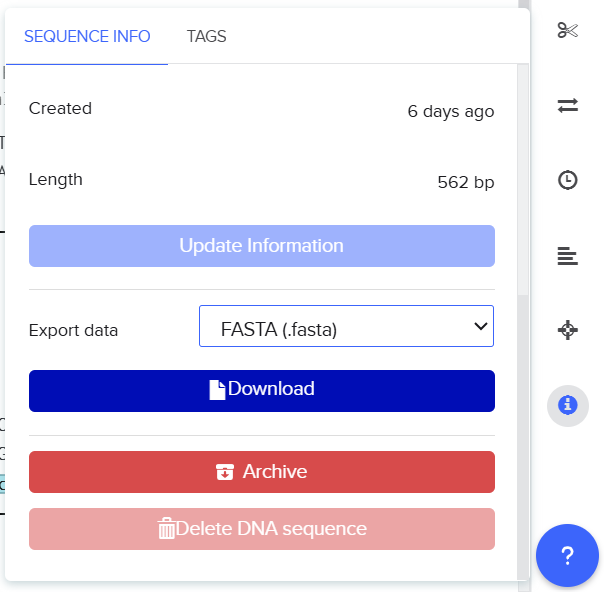

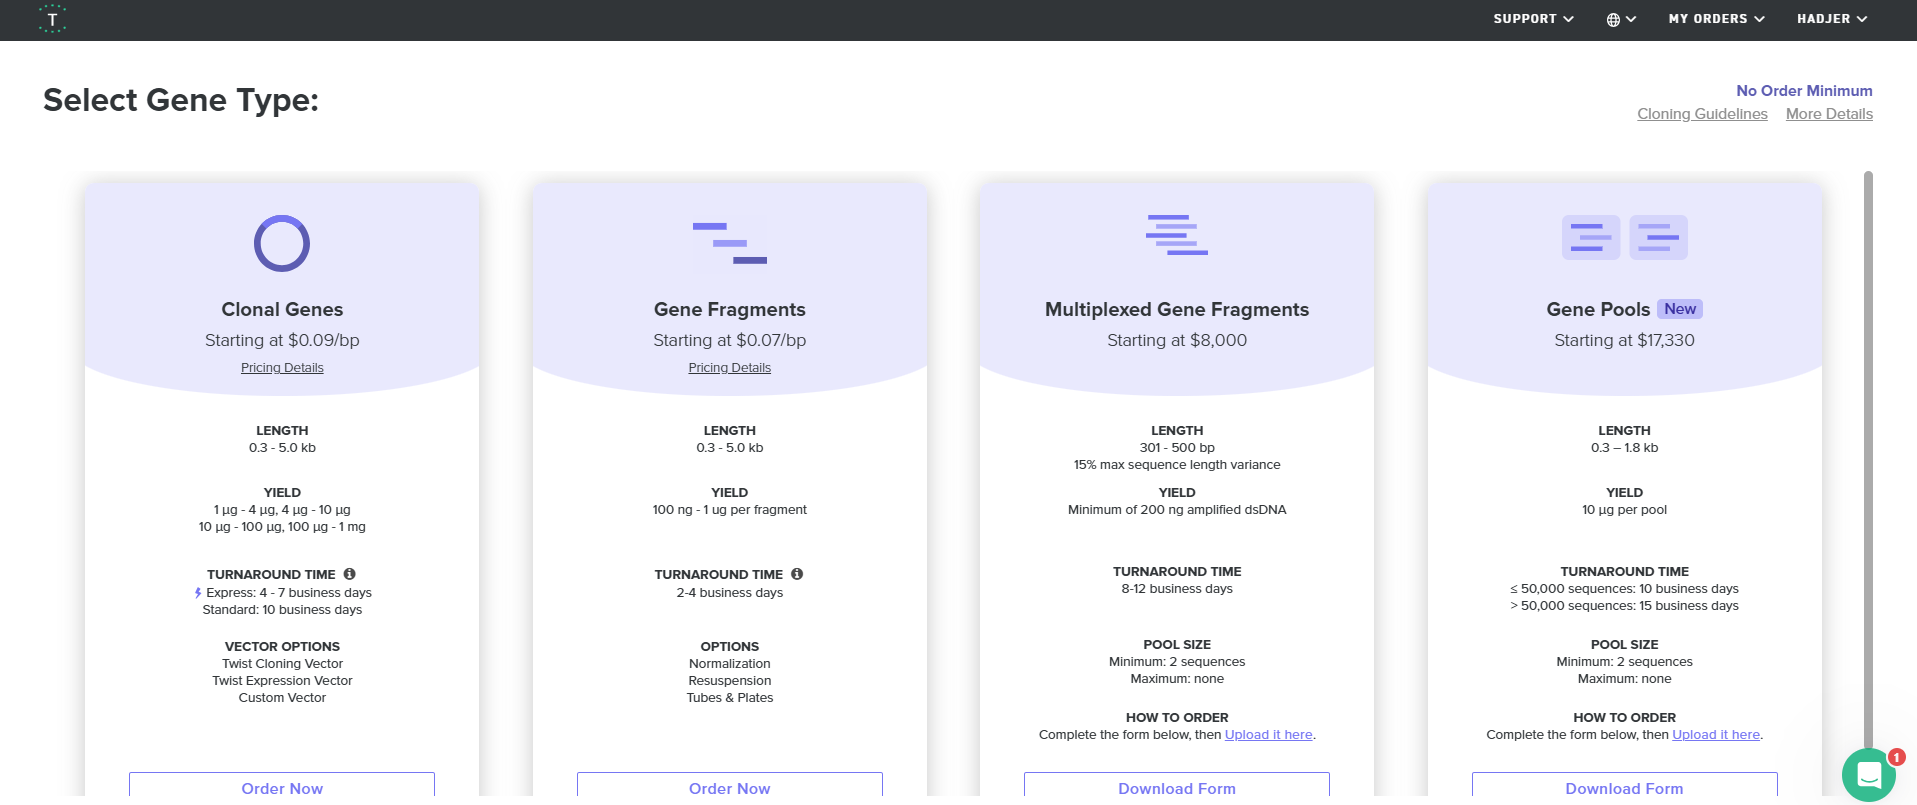


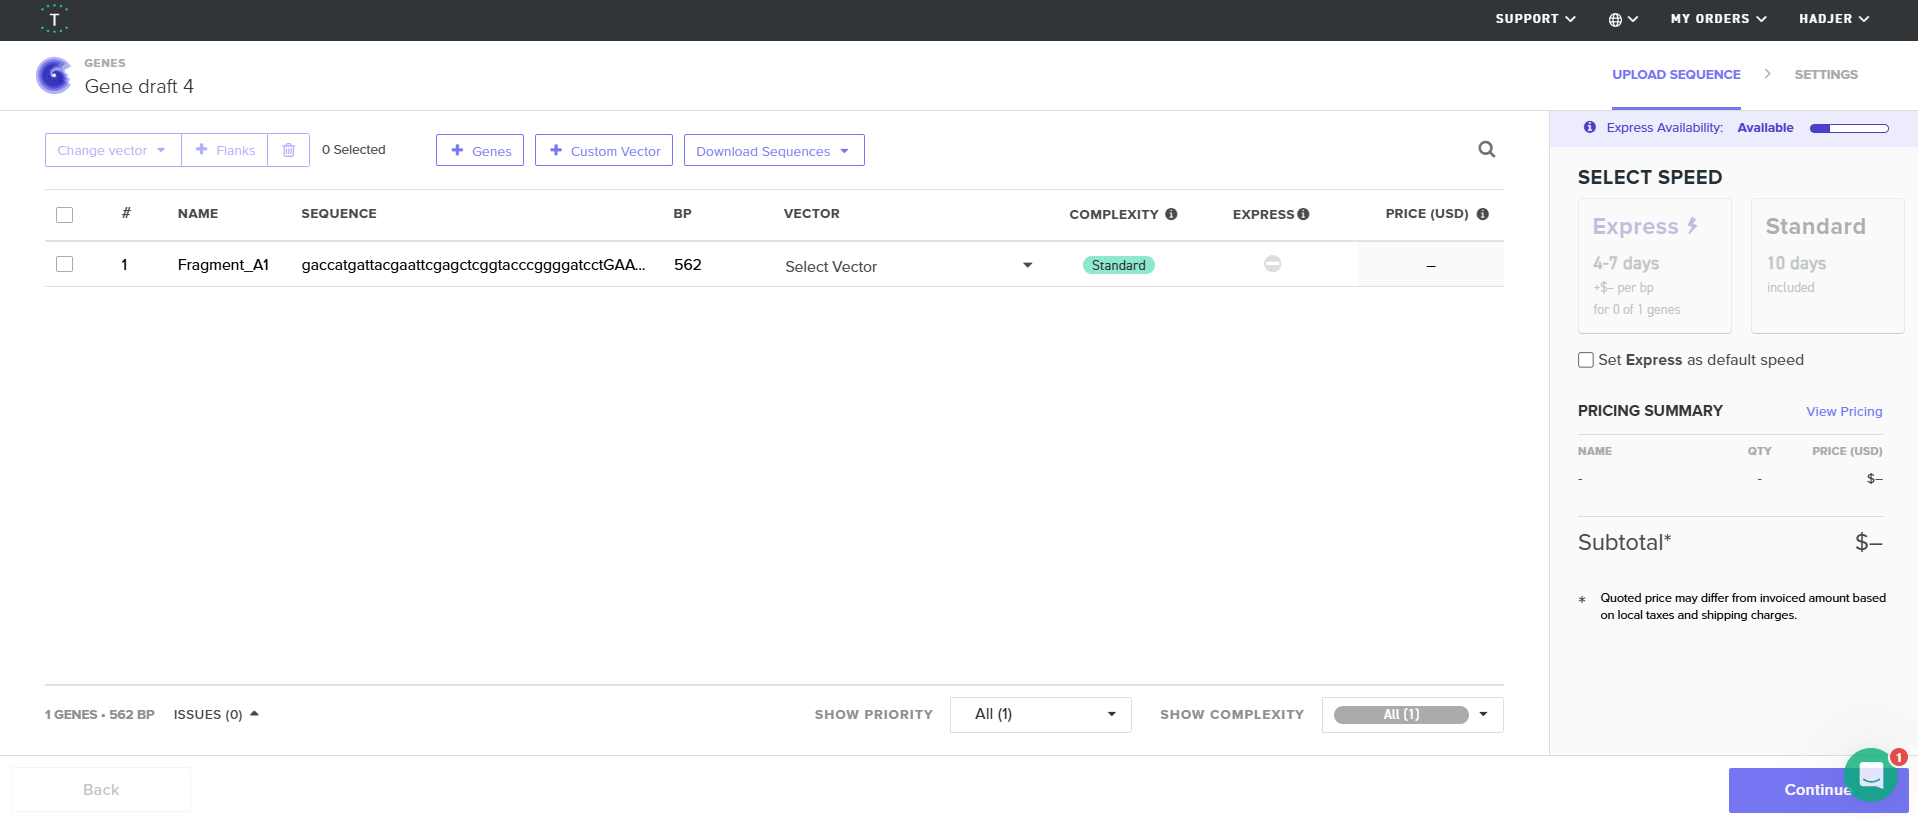
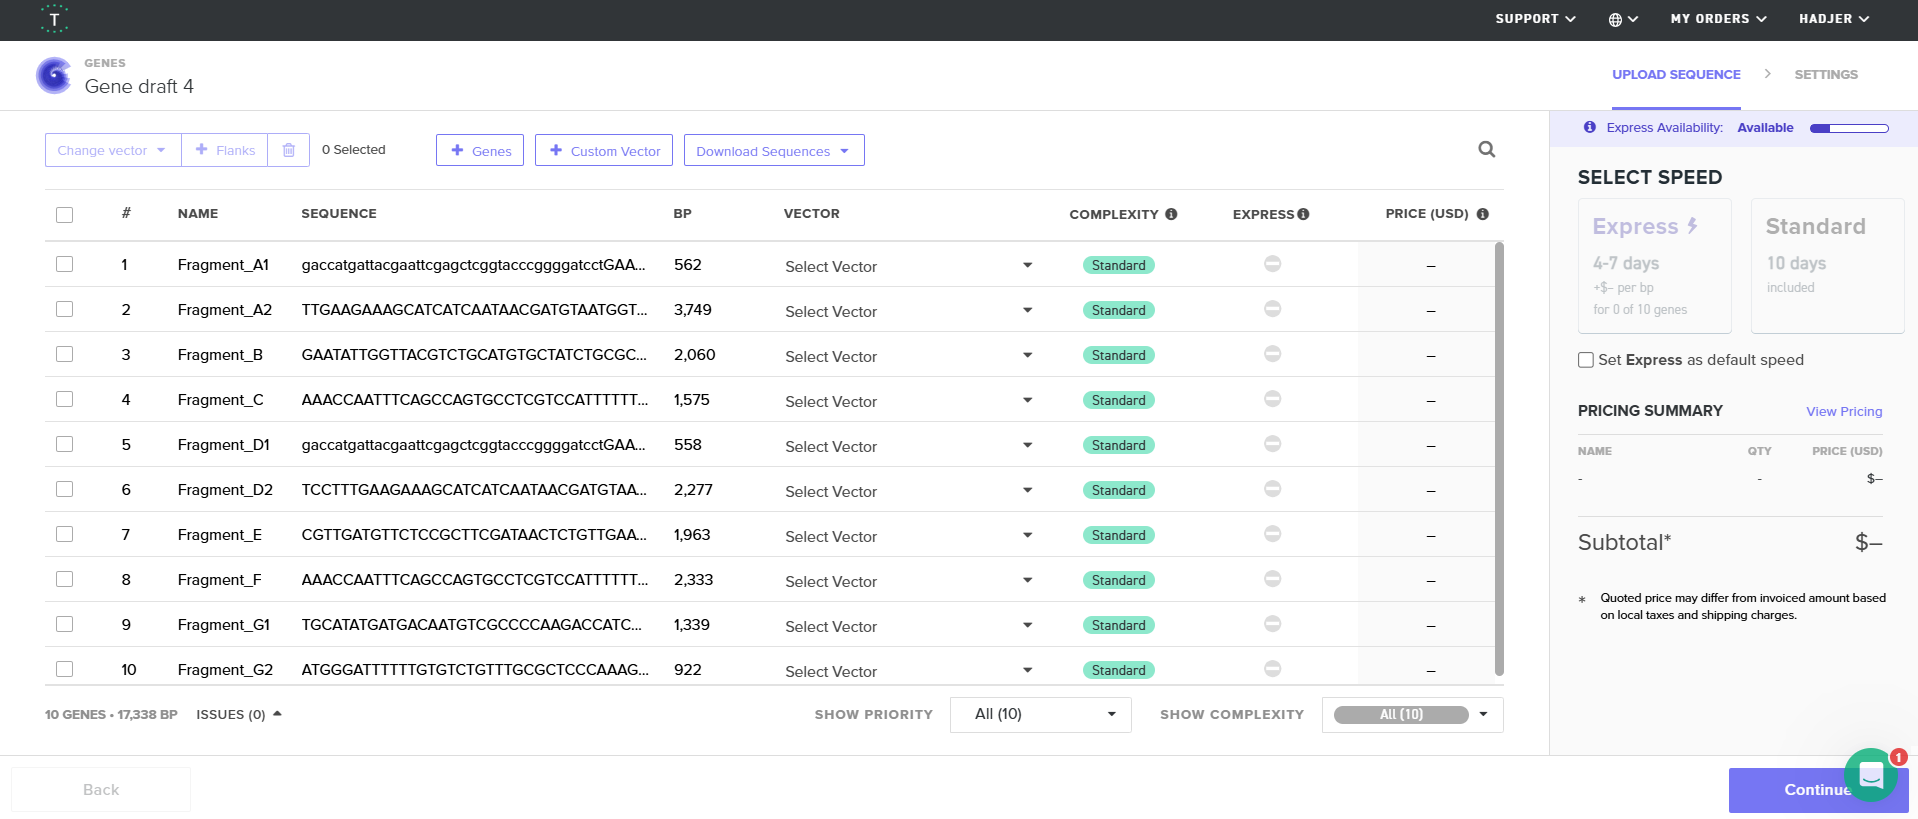
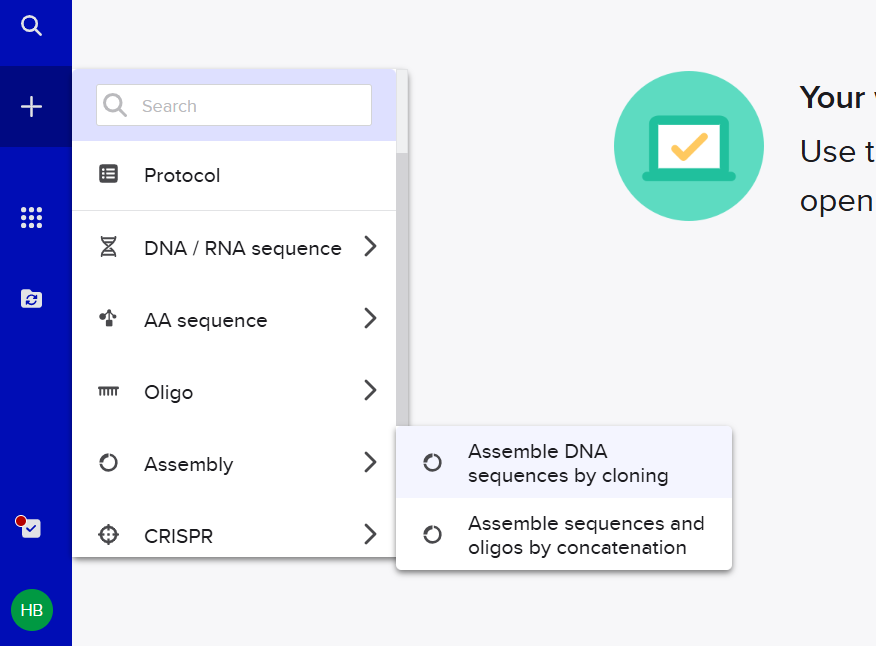
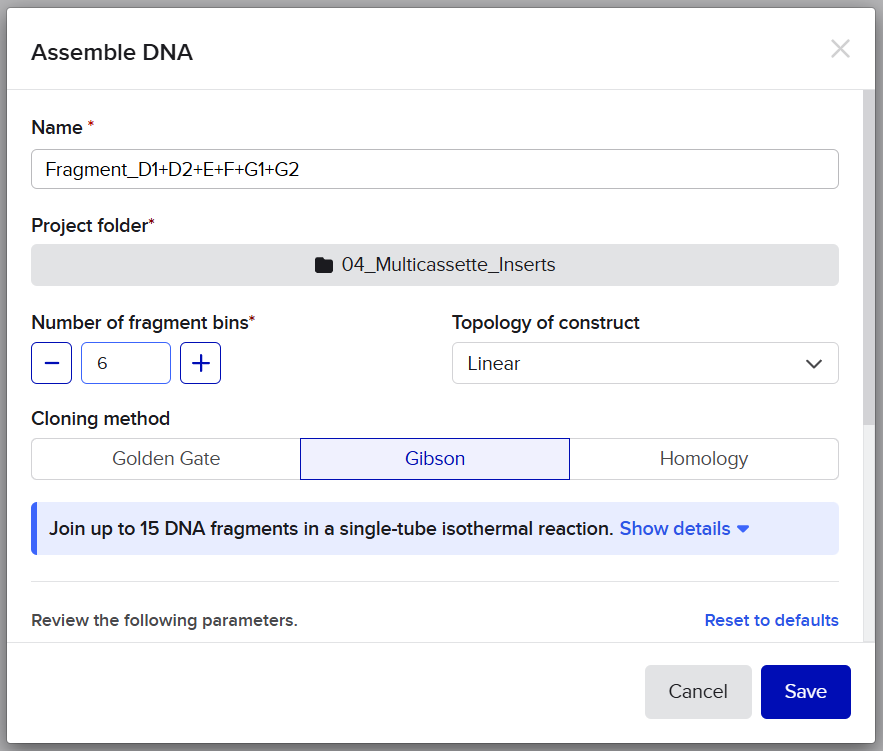
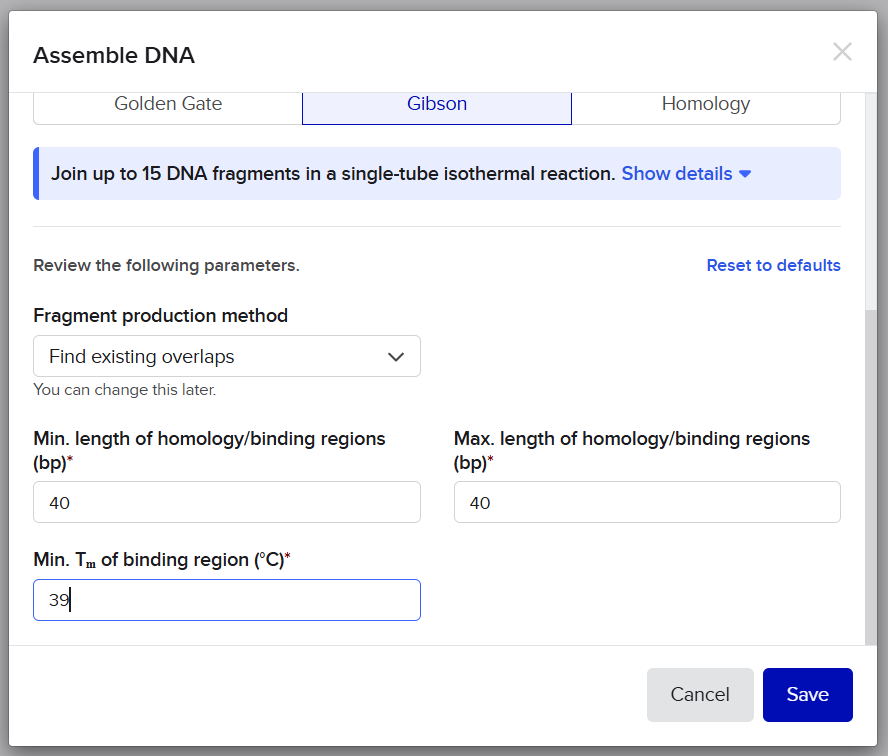

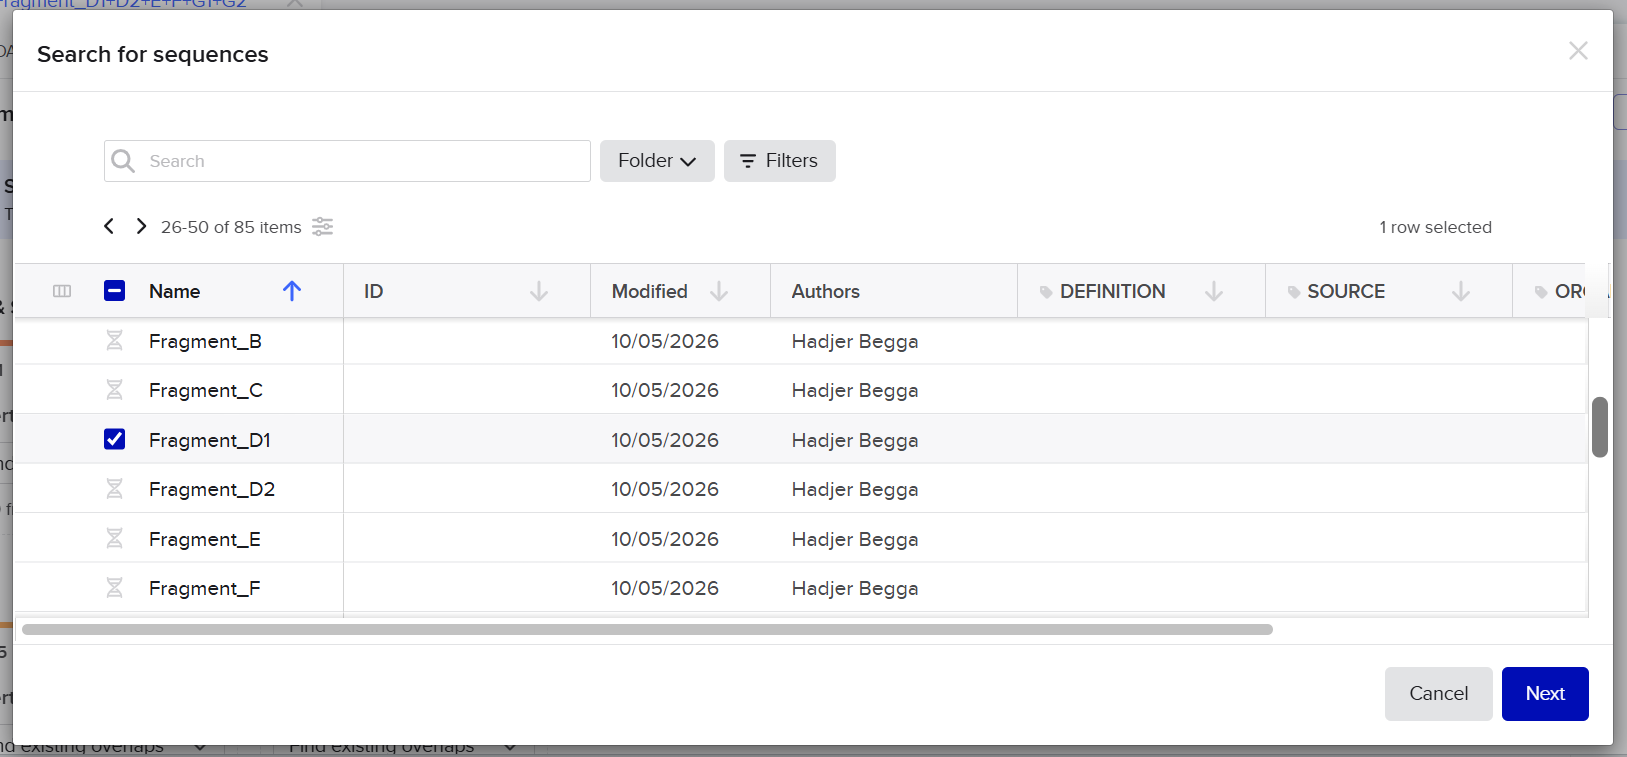
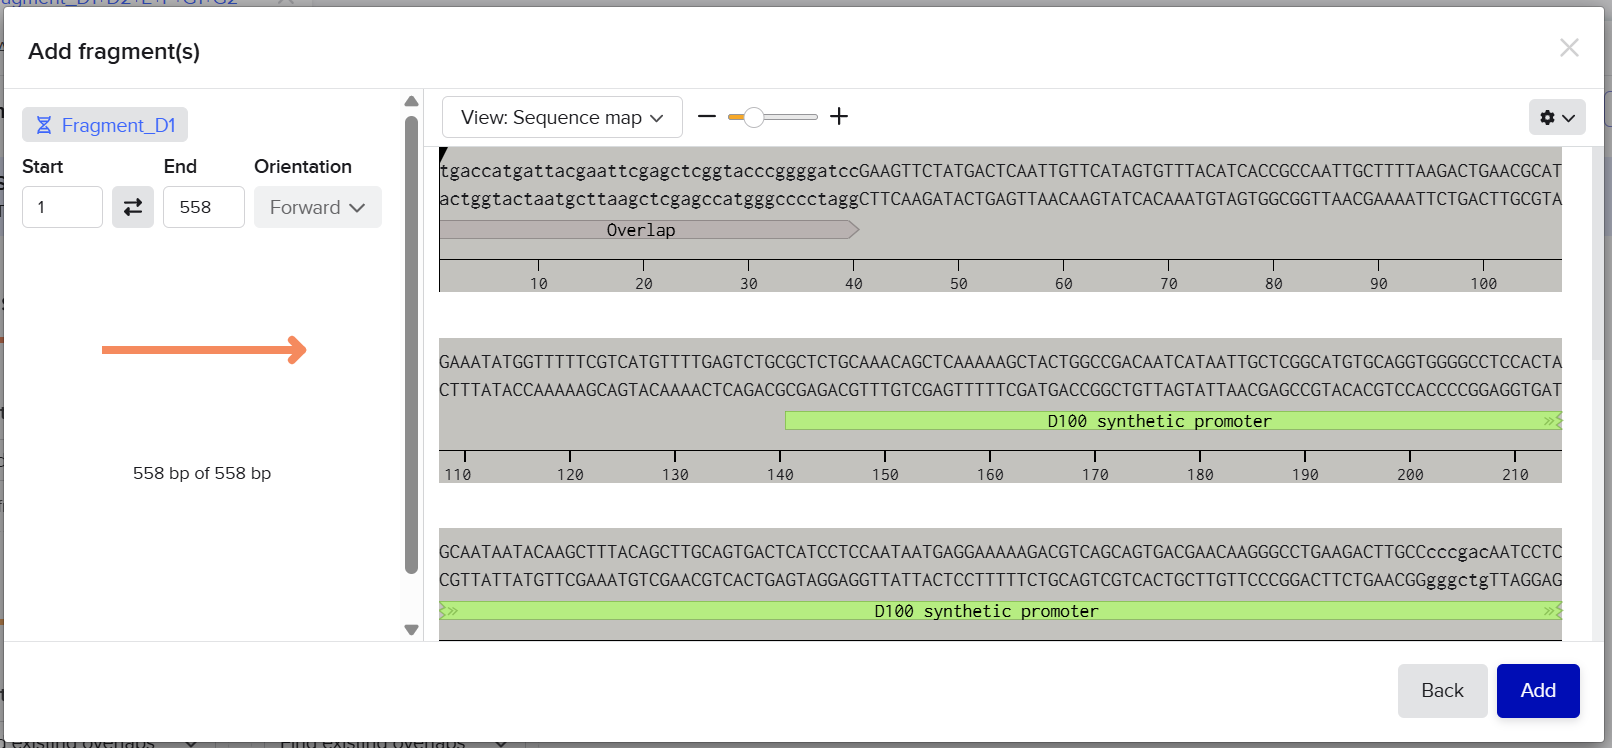
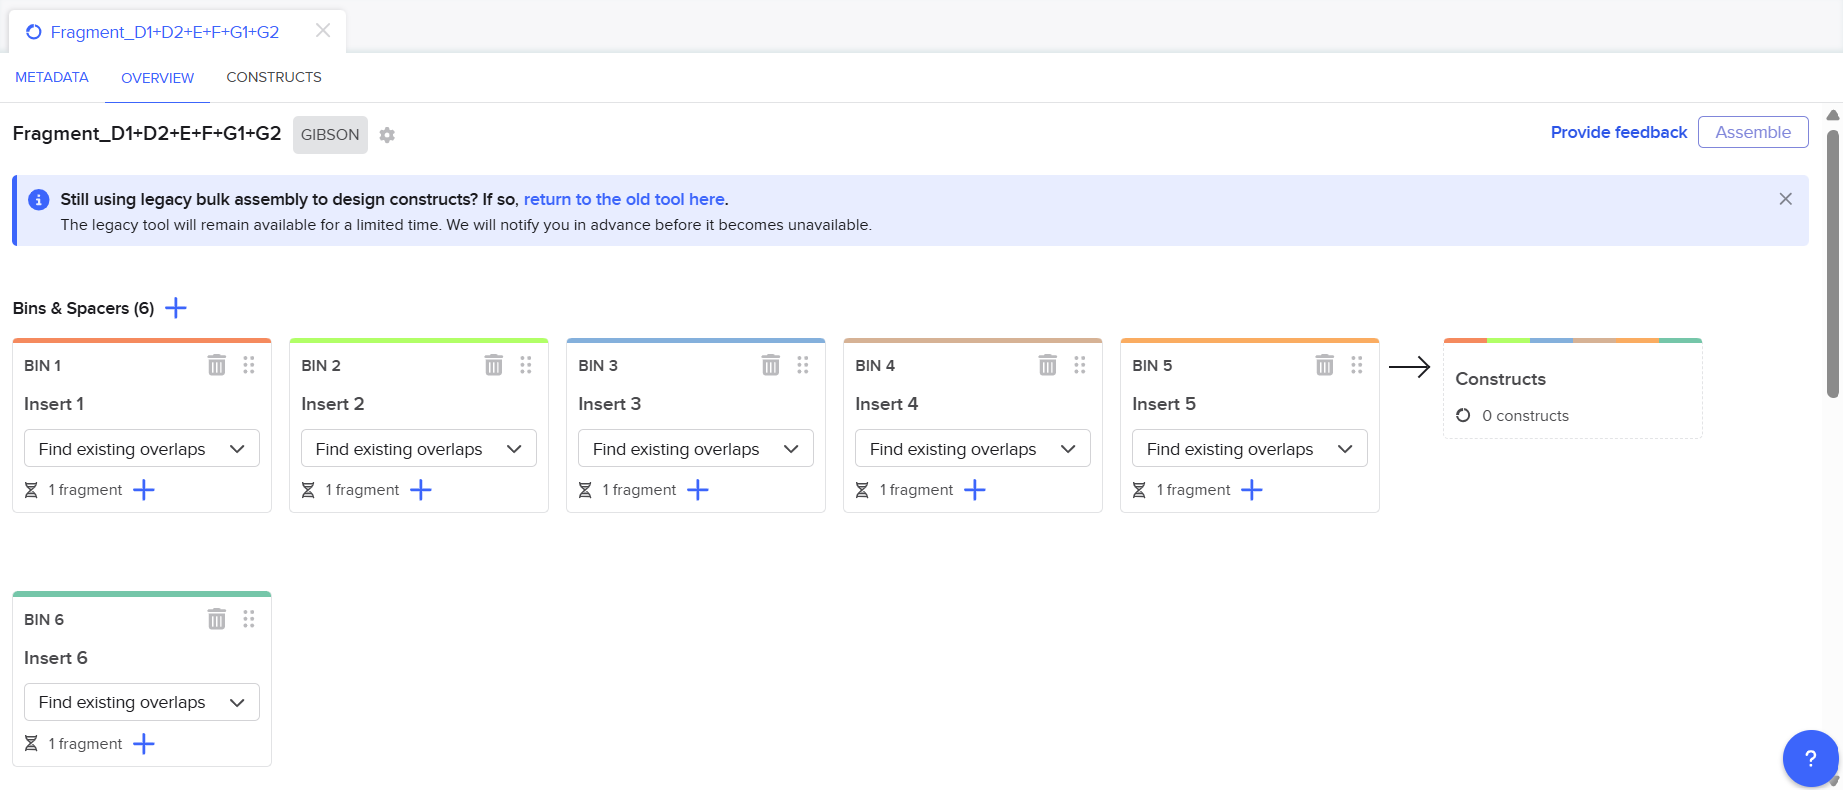
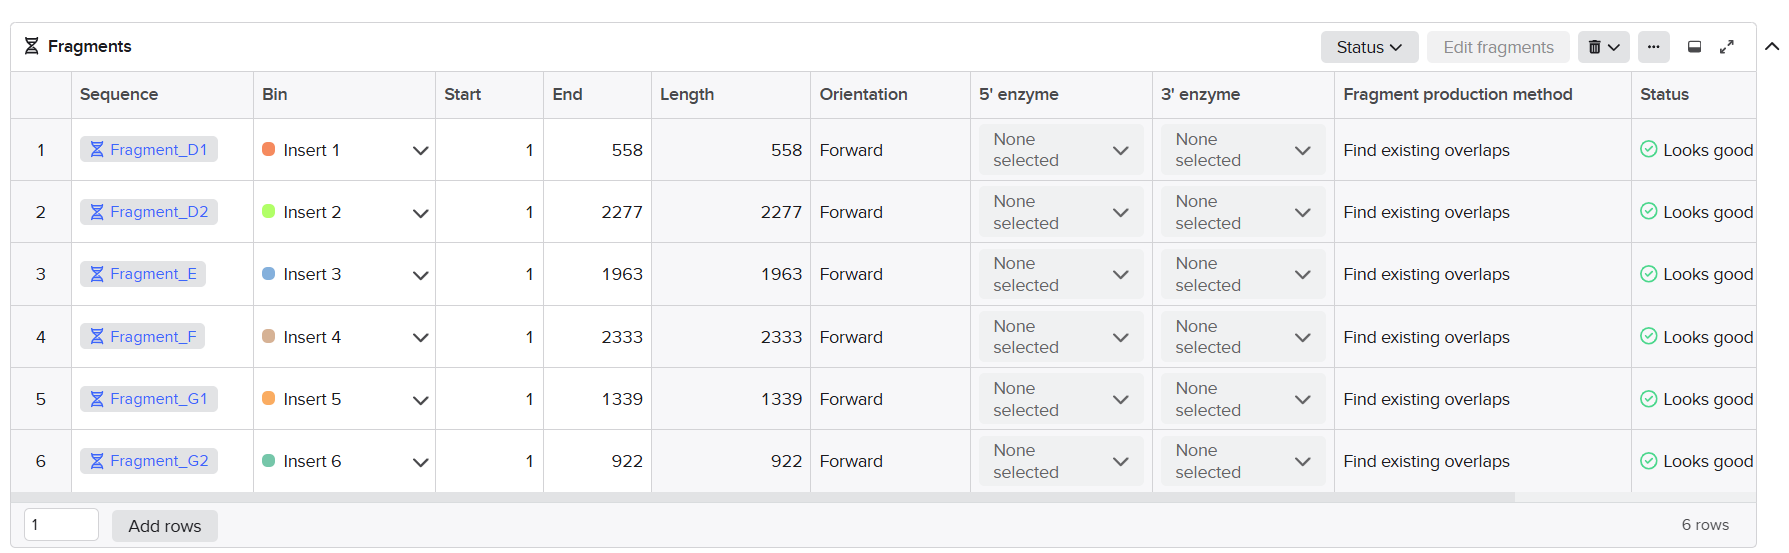
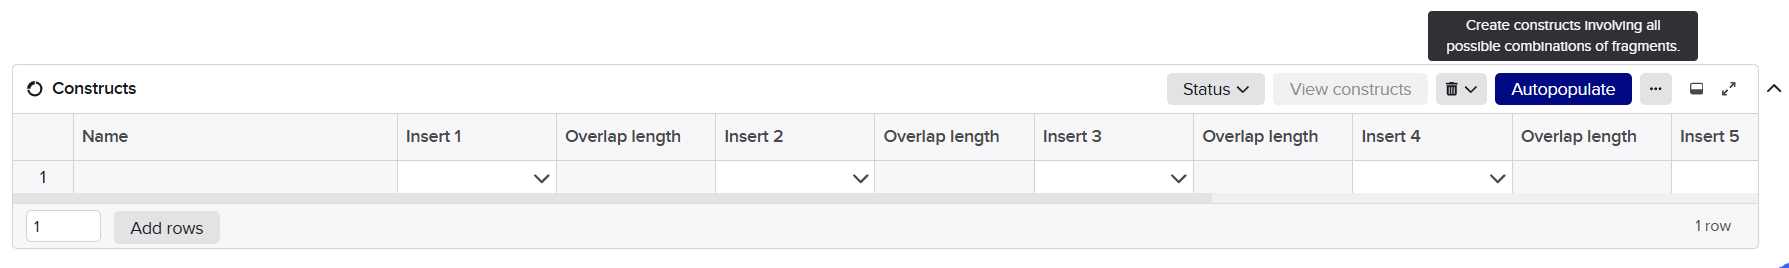
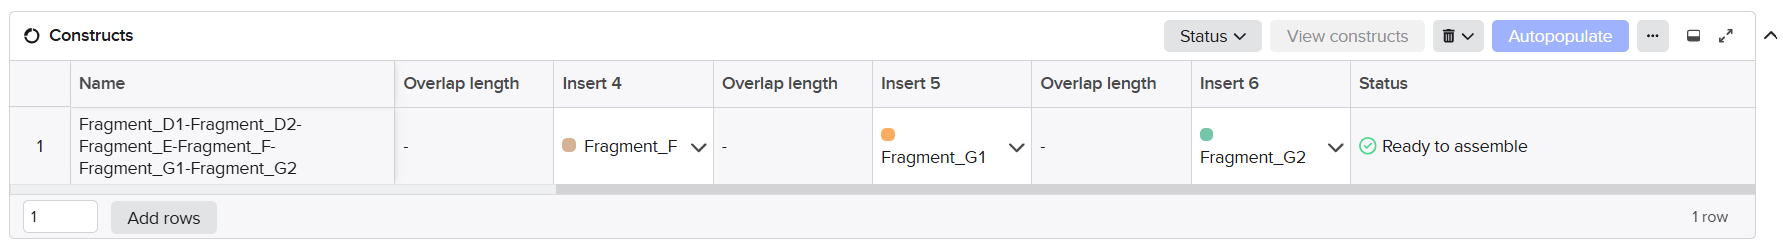


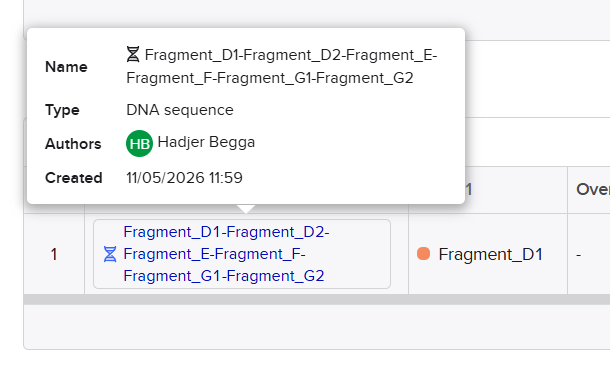
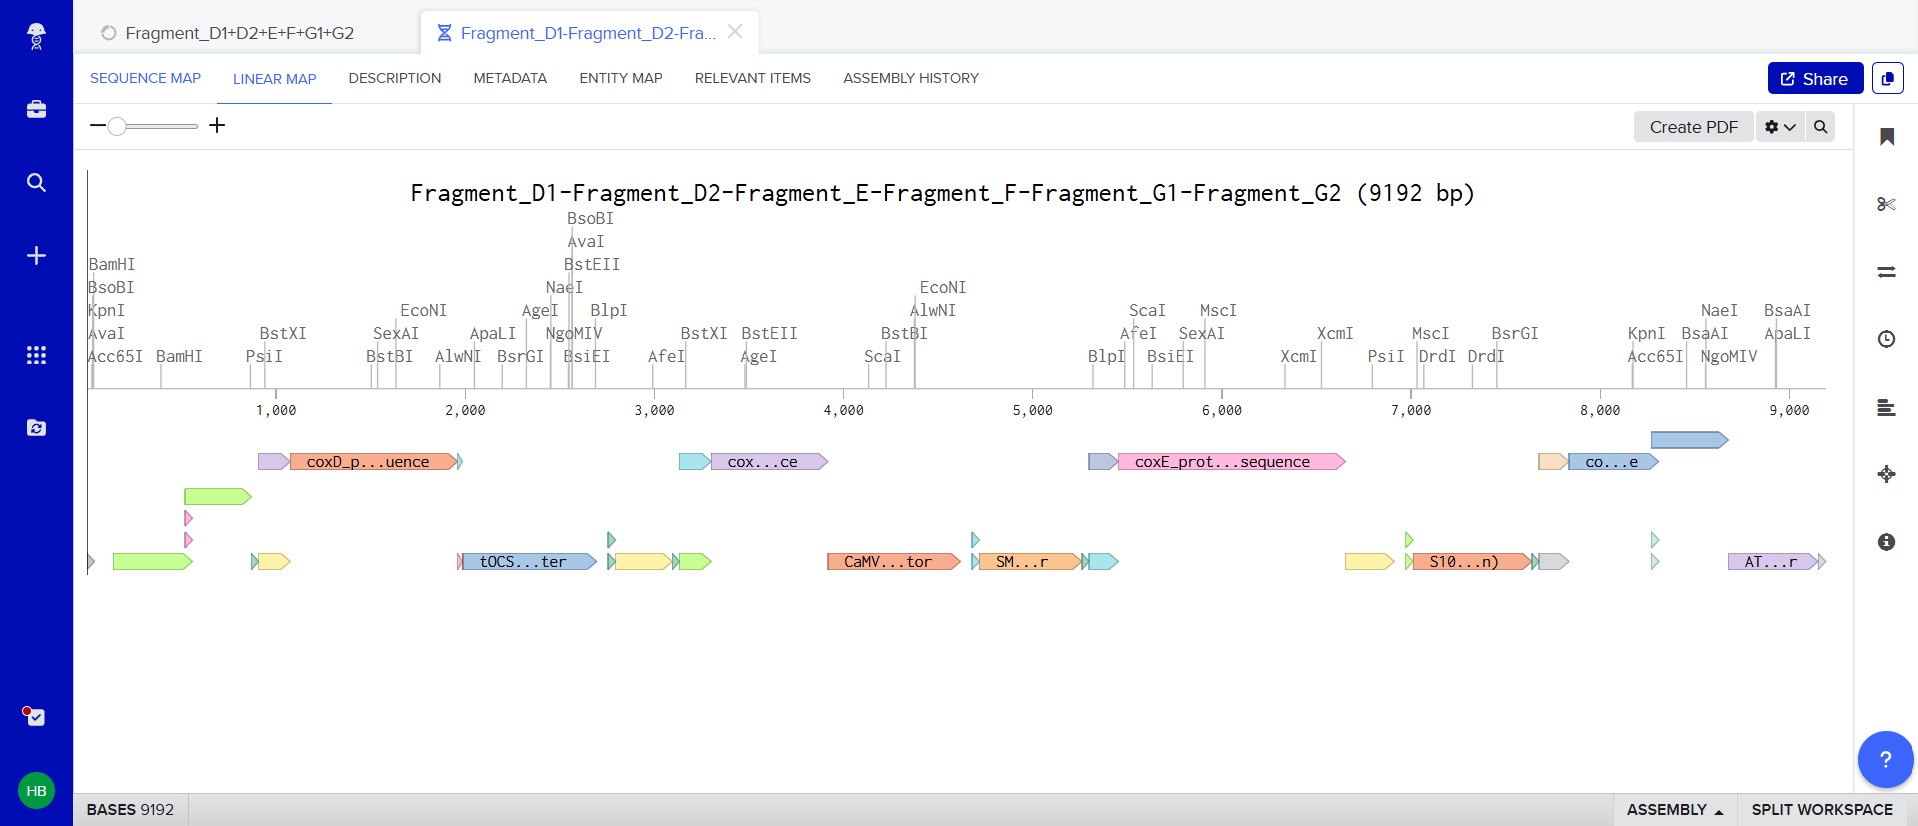
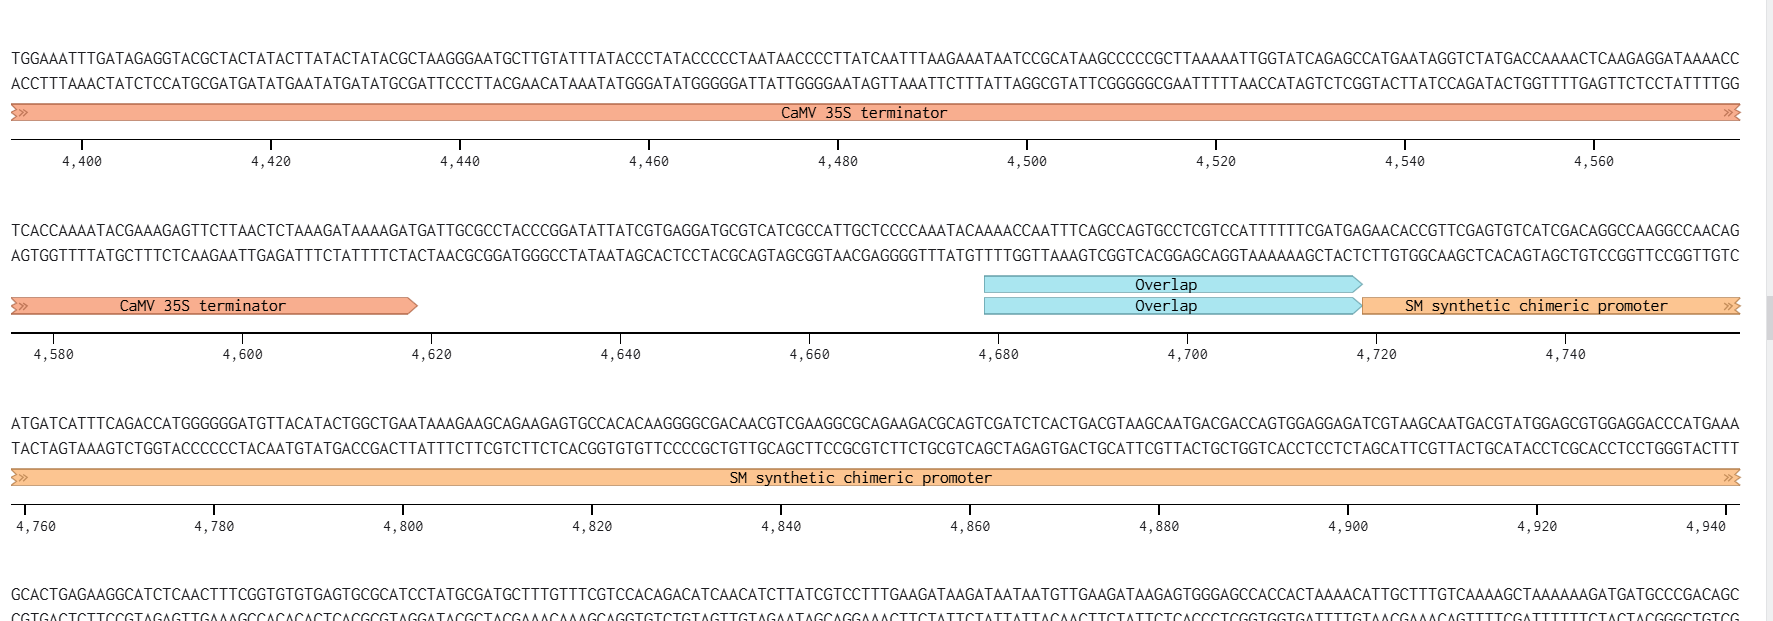
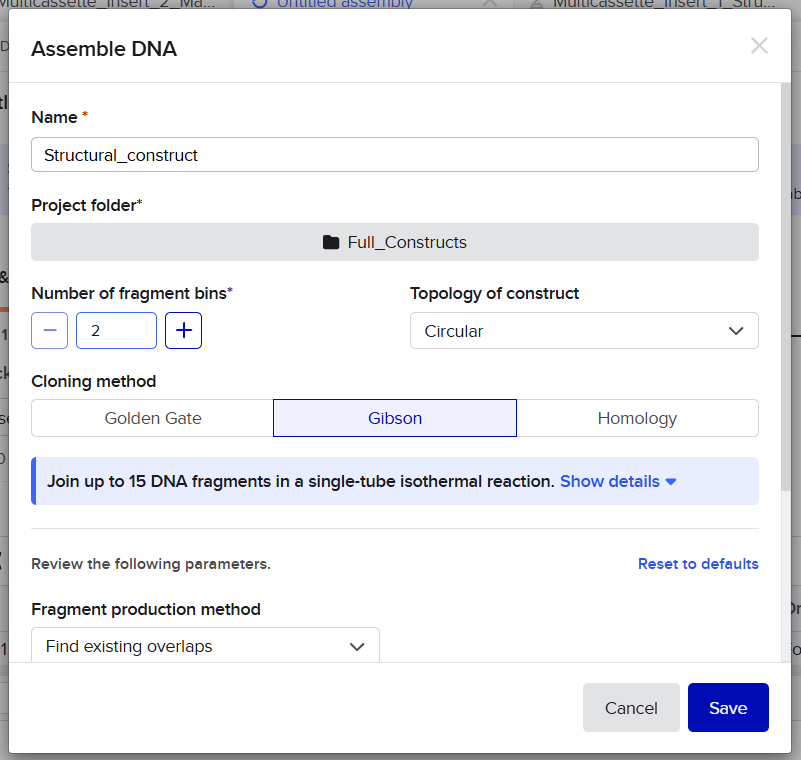
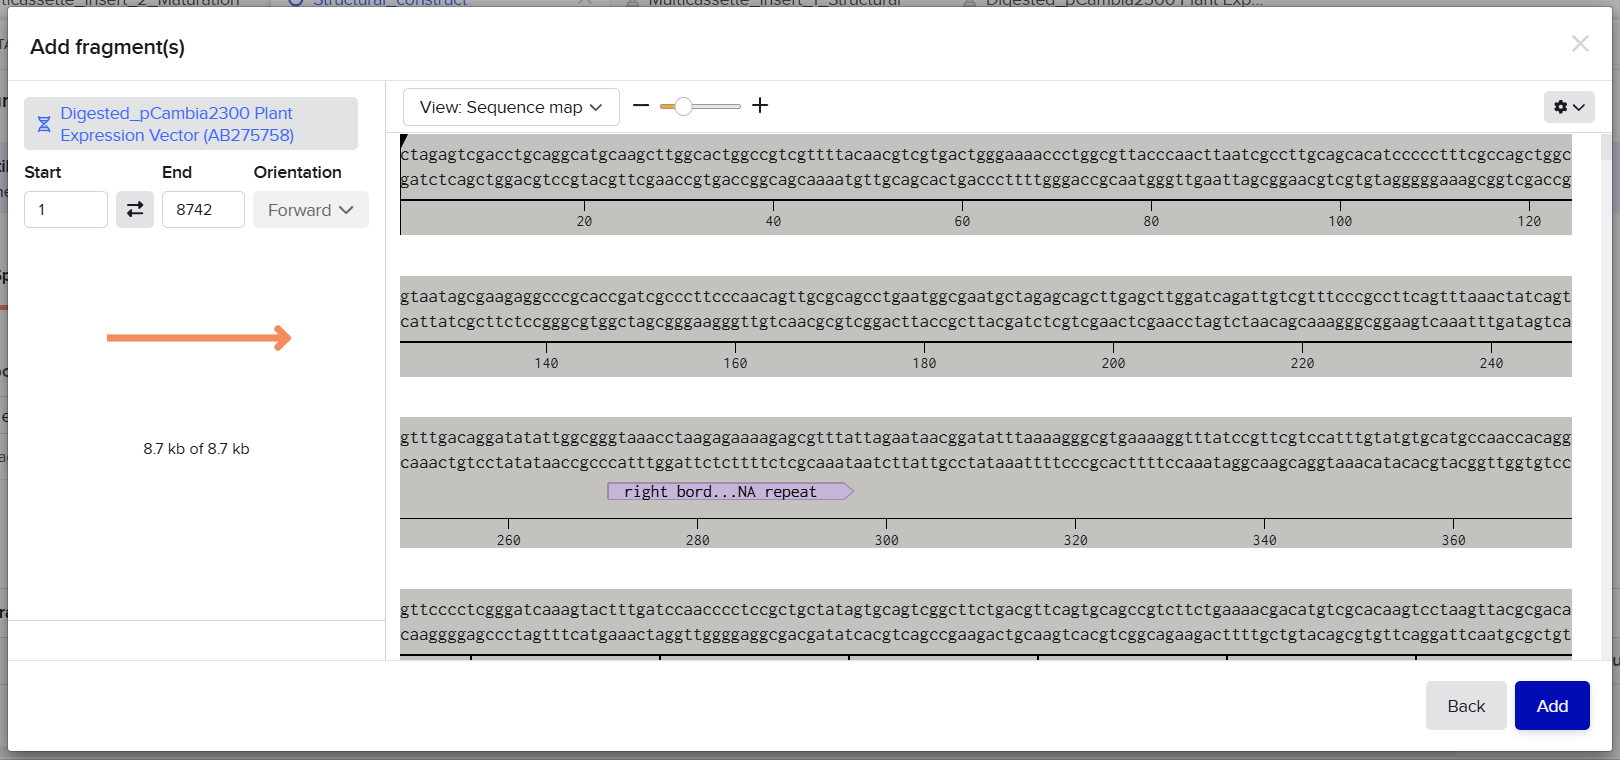
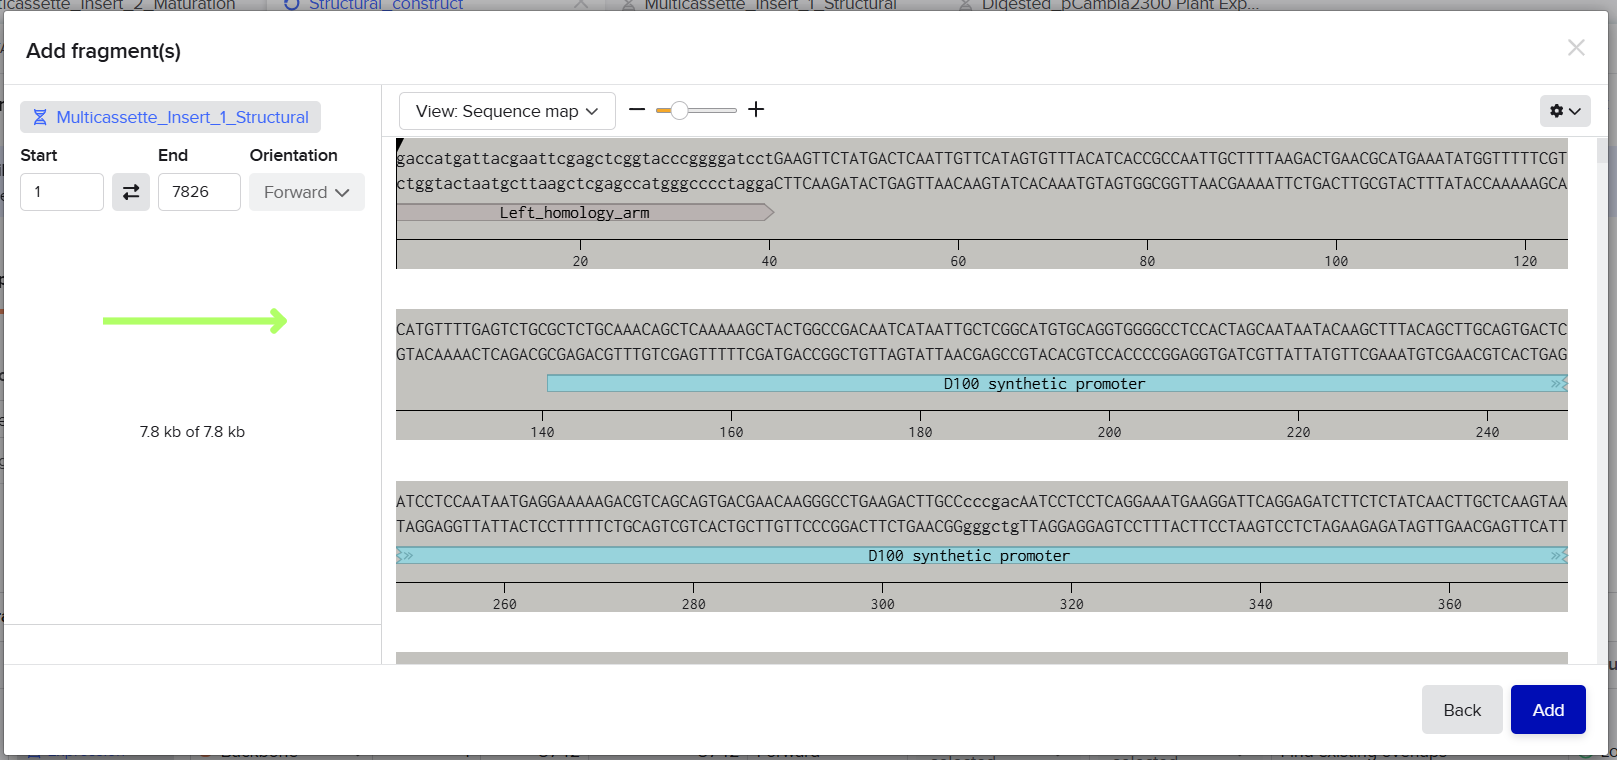
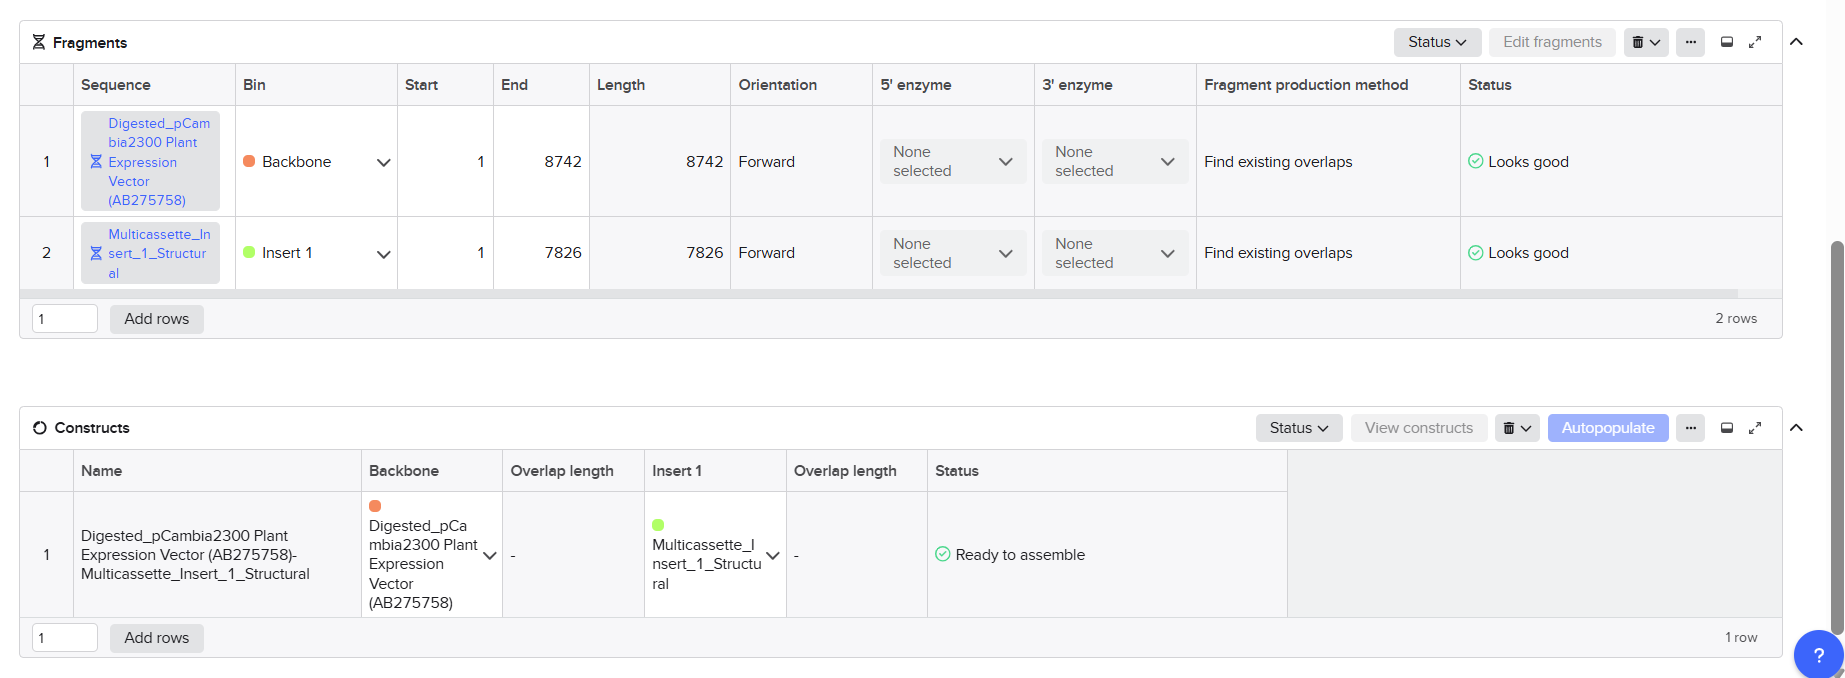

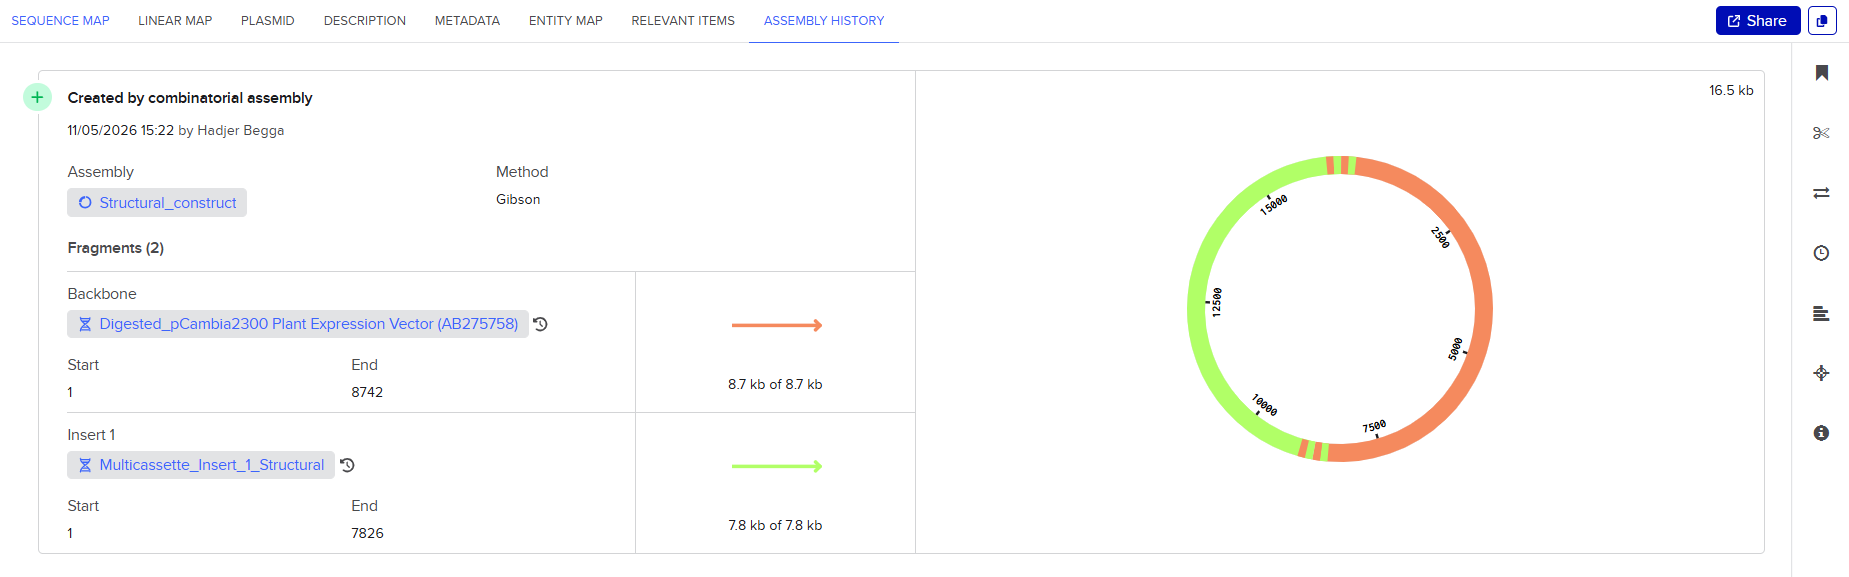
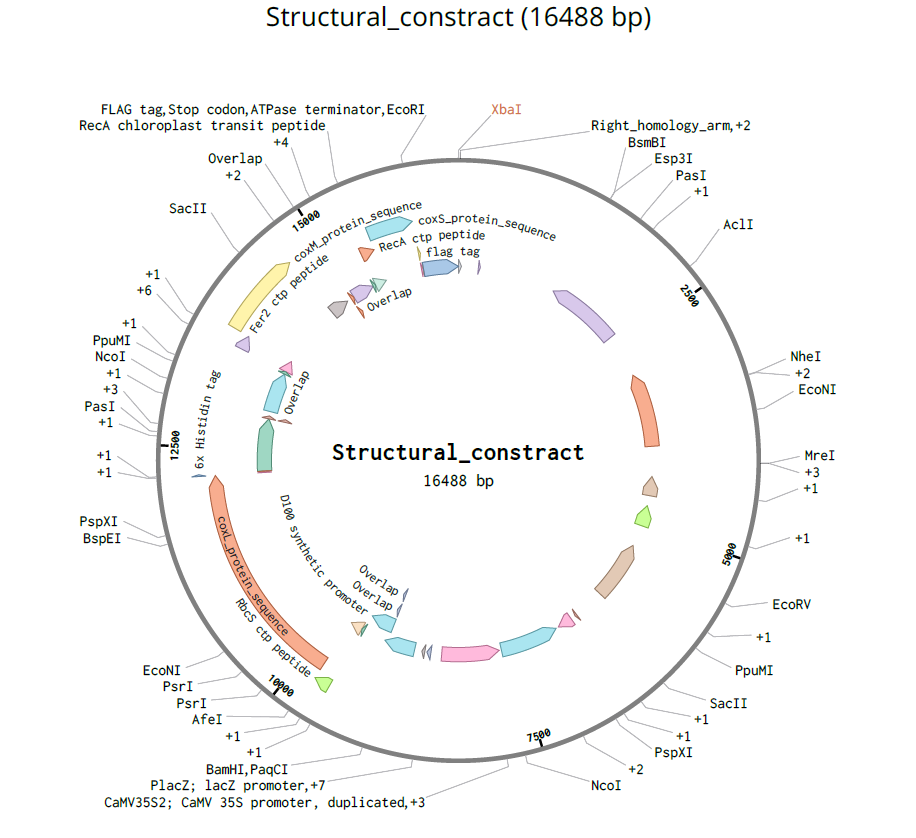
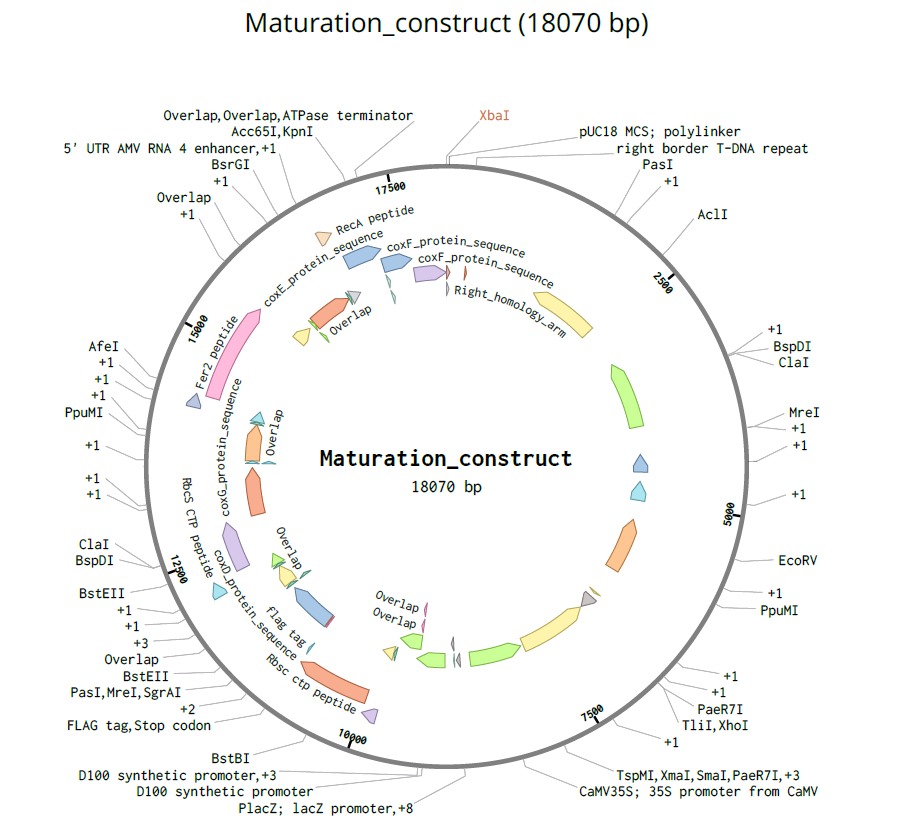
.gif)
.gif)
.gif)
.gif)
.gif)
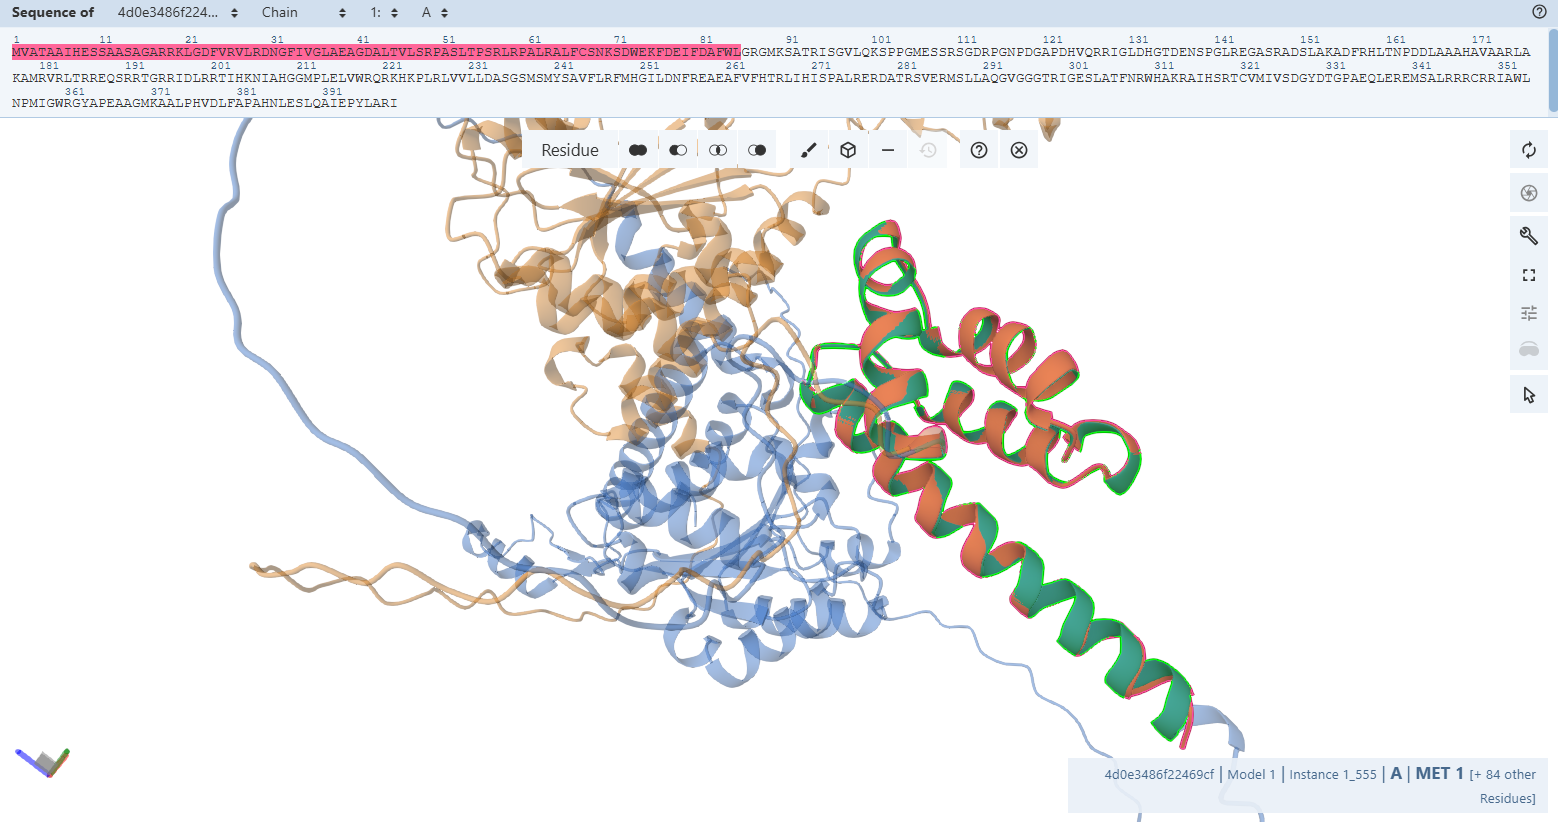
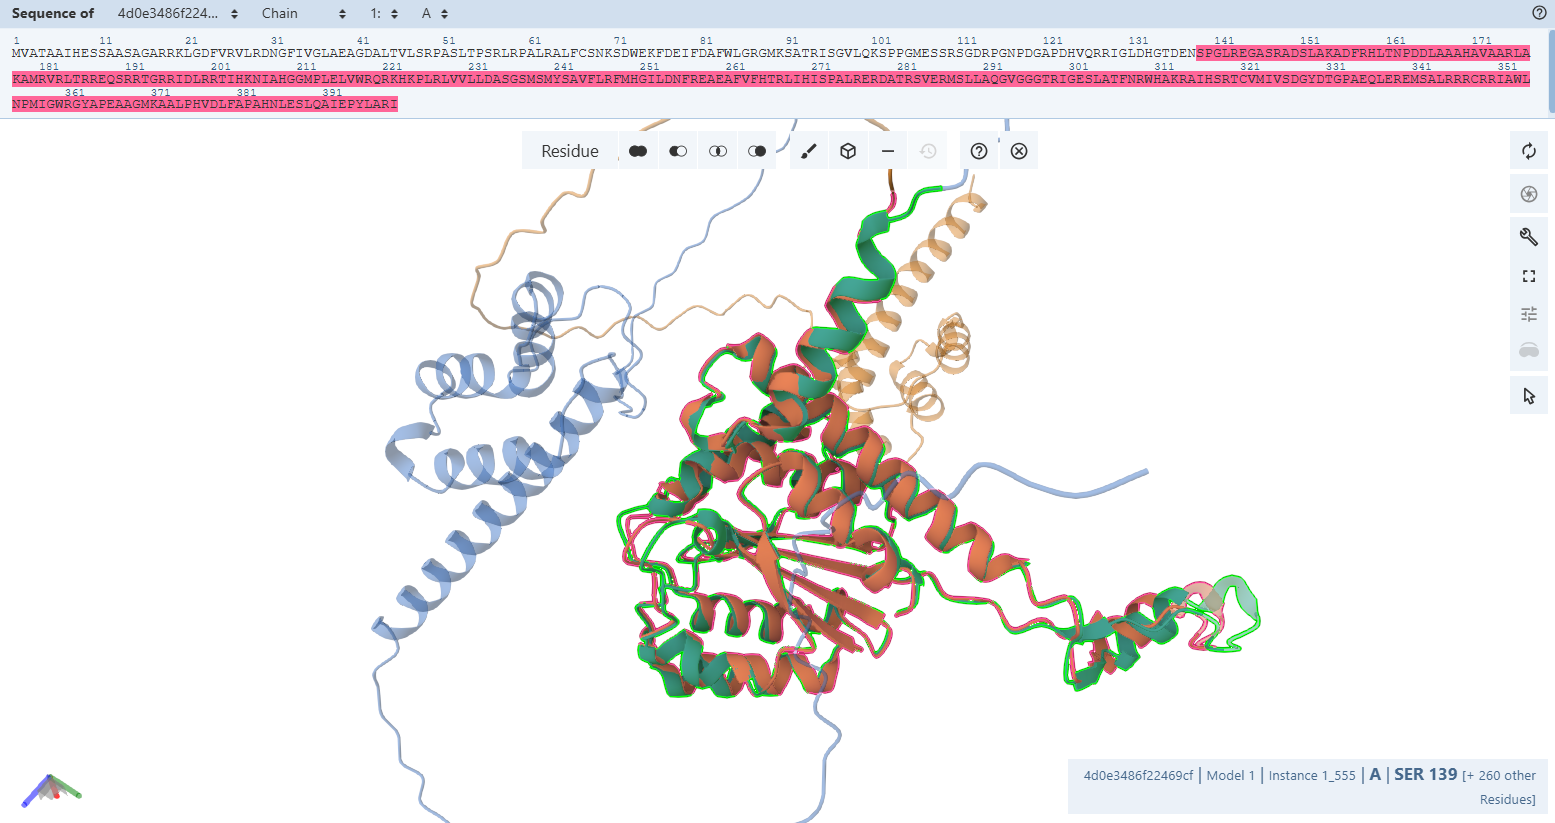
.gif)
.gif)
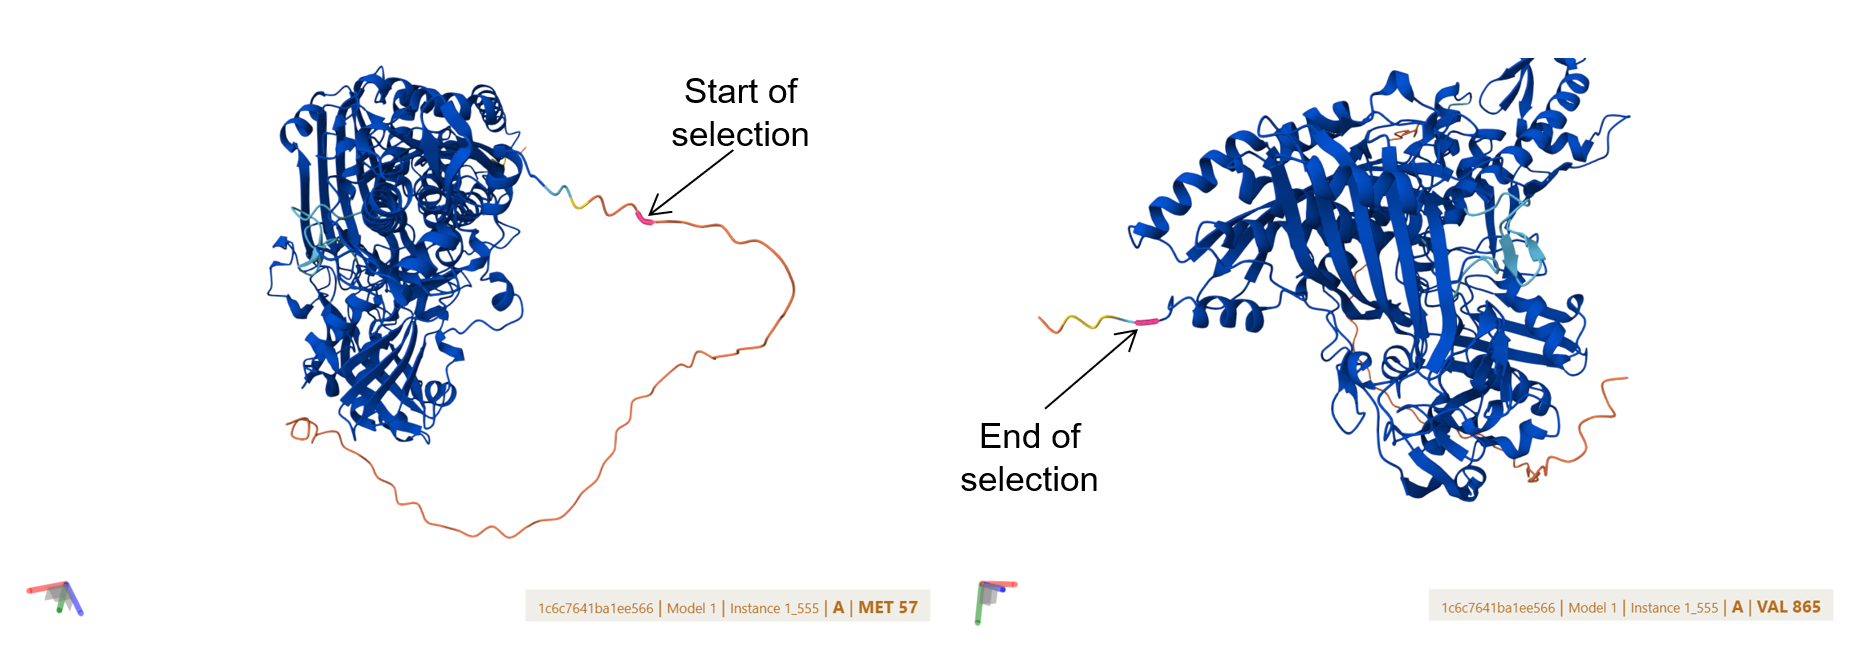

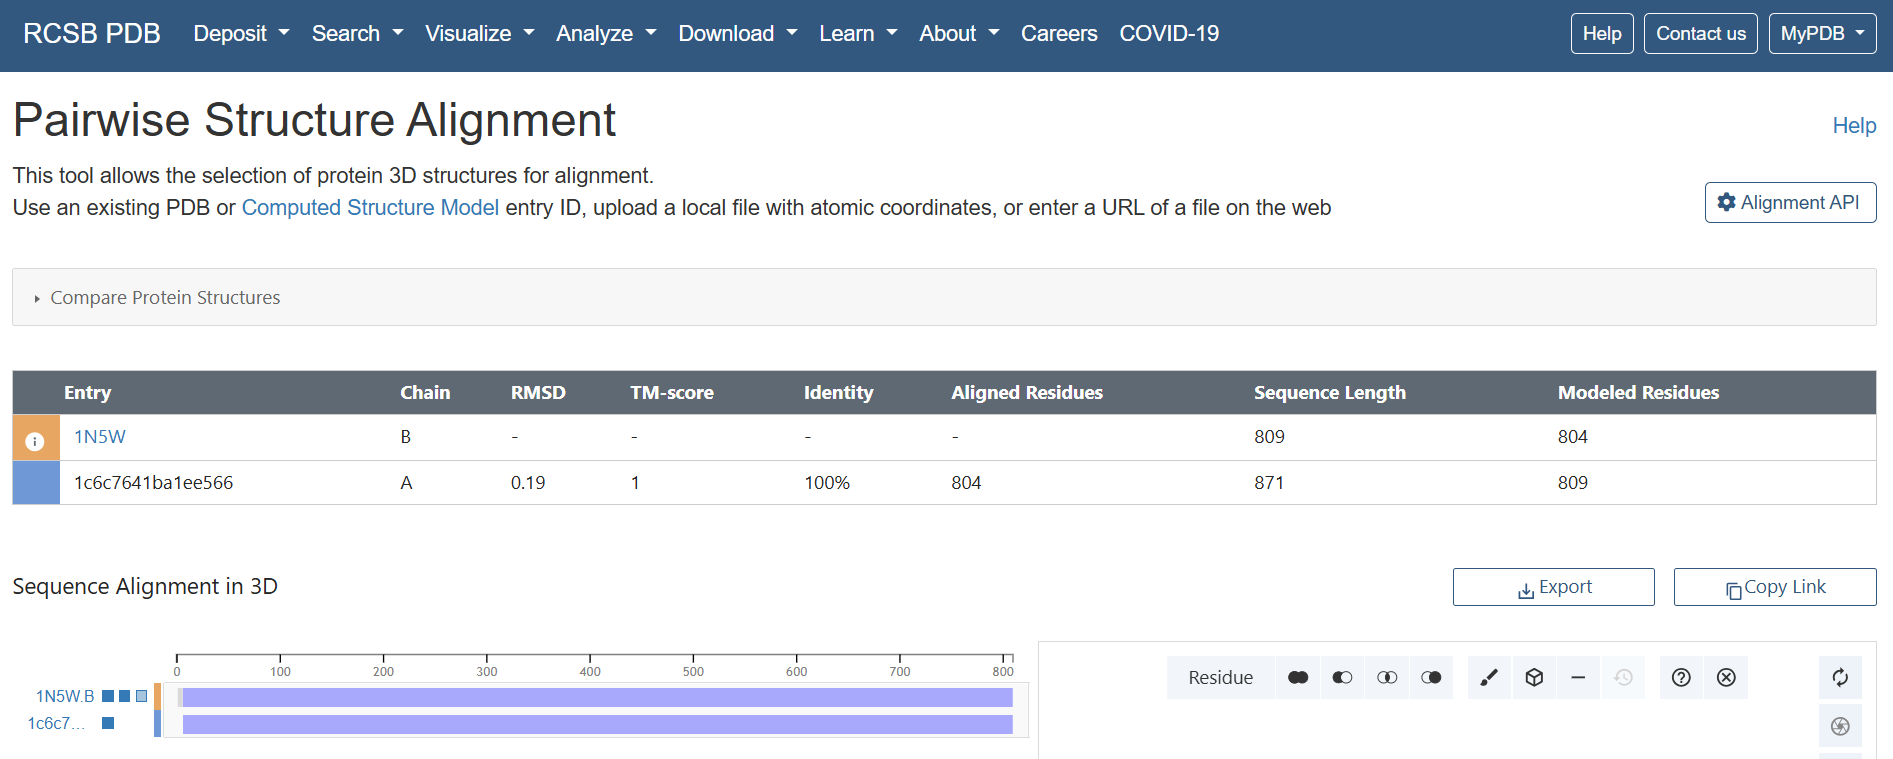
.gif?width=500px)
.gif?width=500px)
.gif?width=500px)
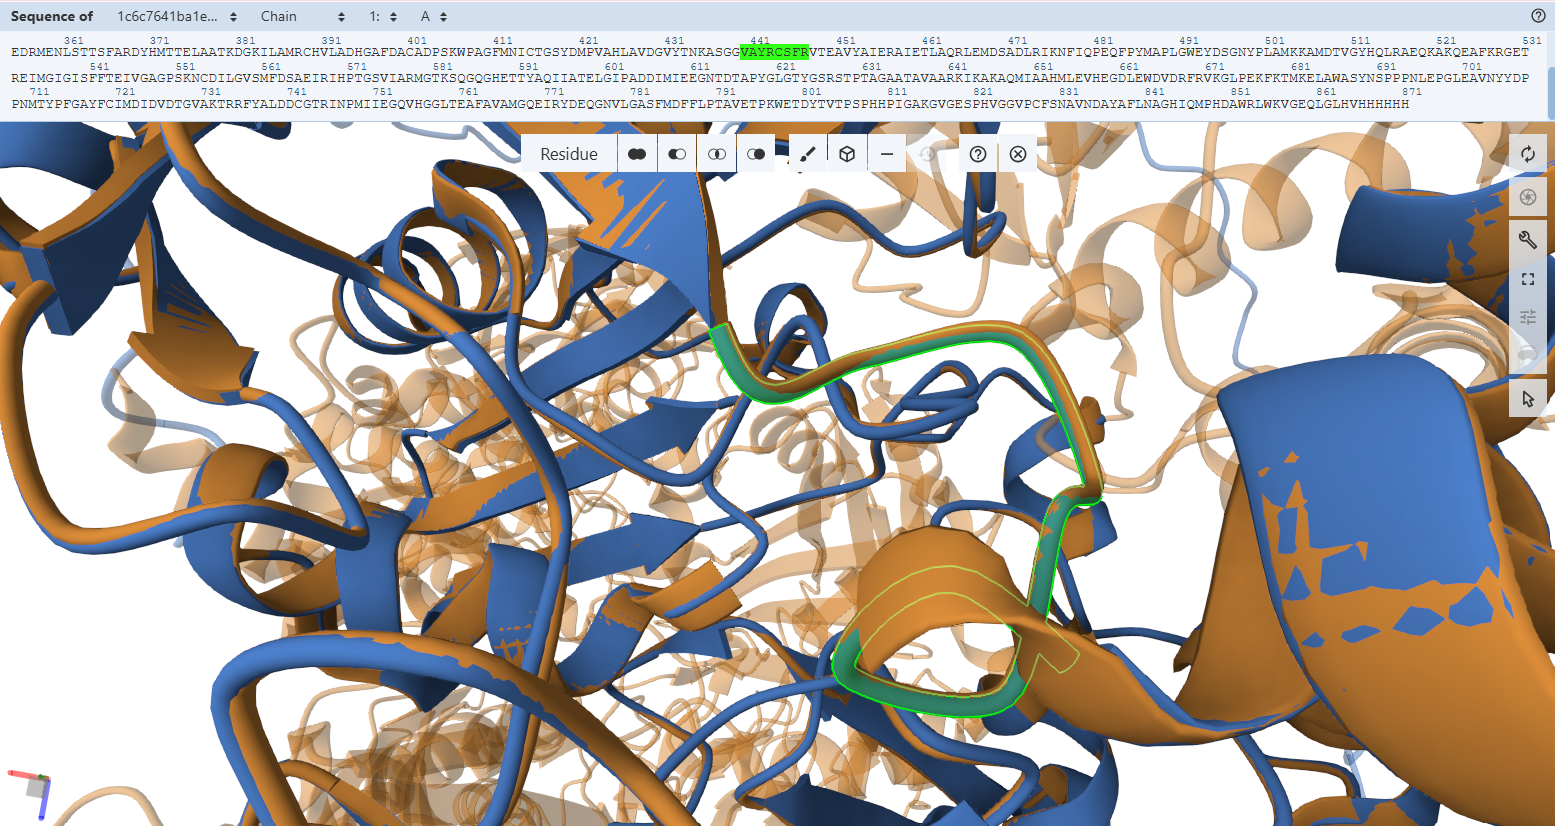
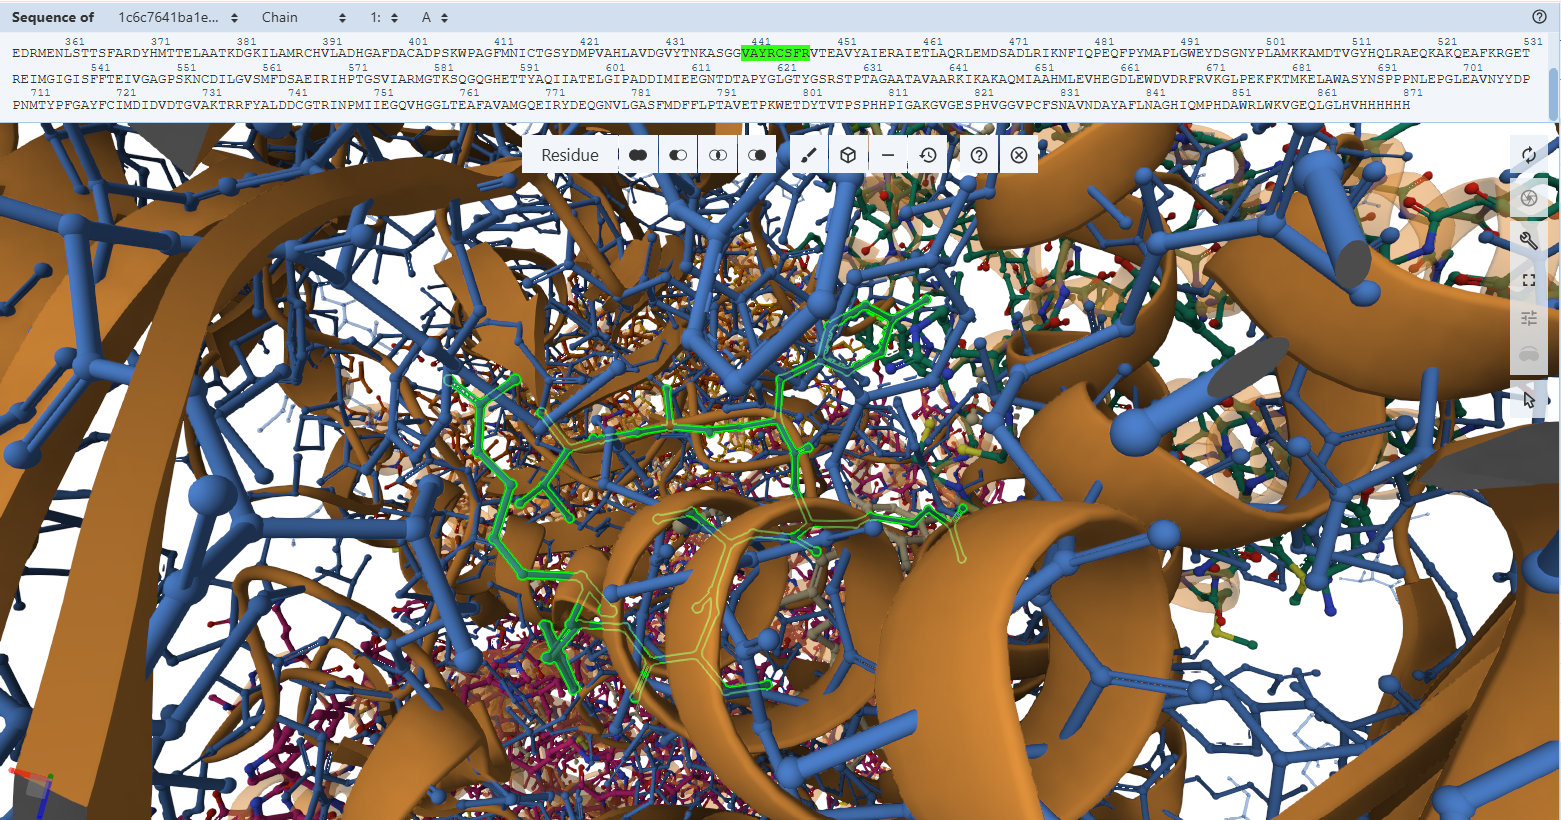
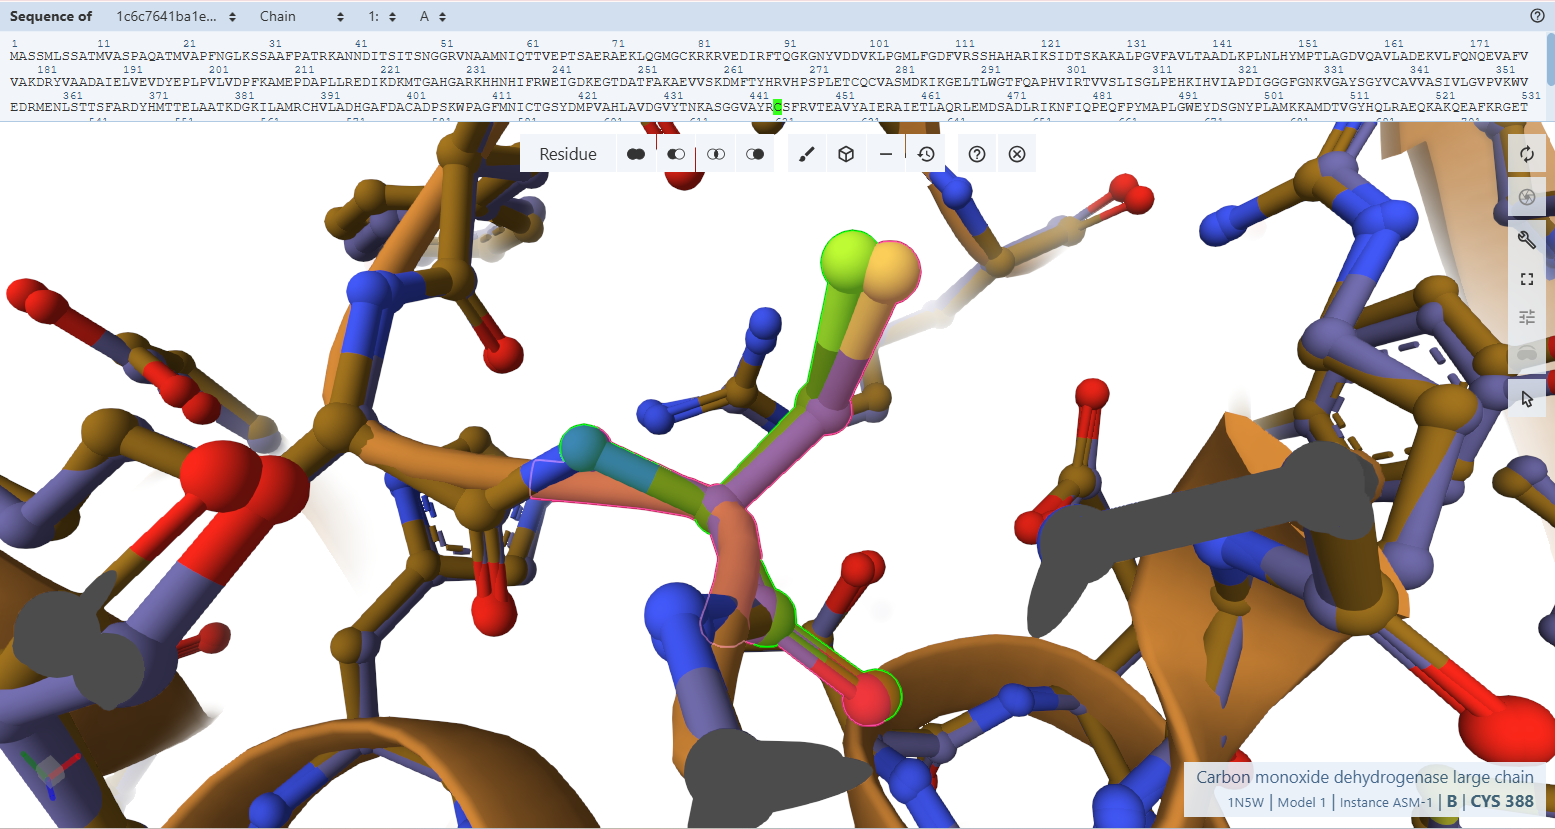
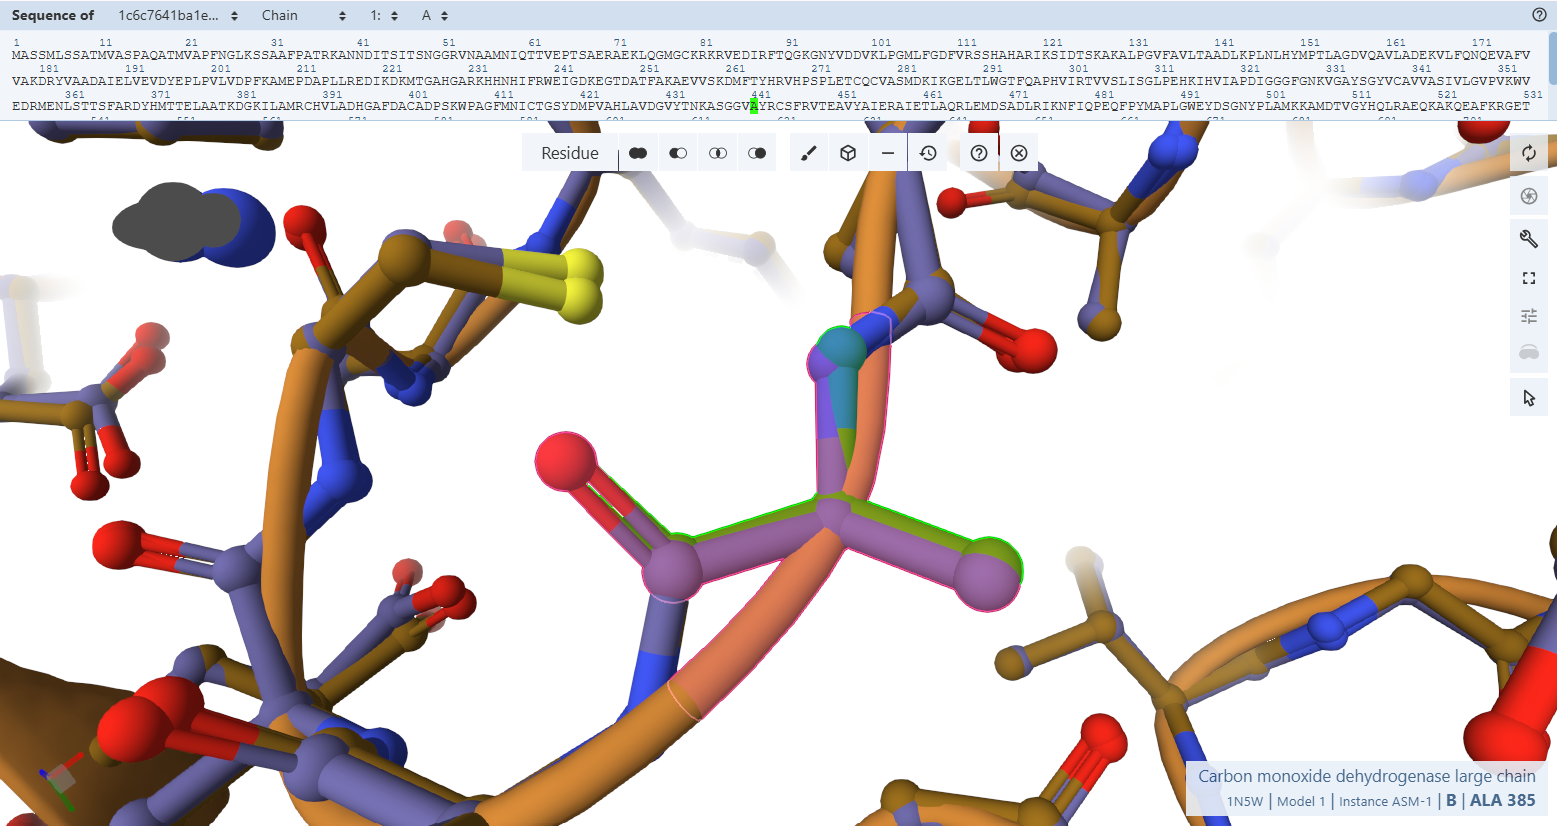
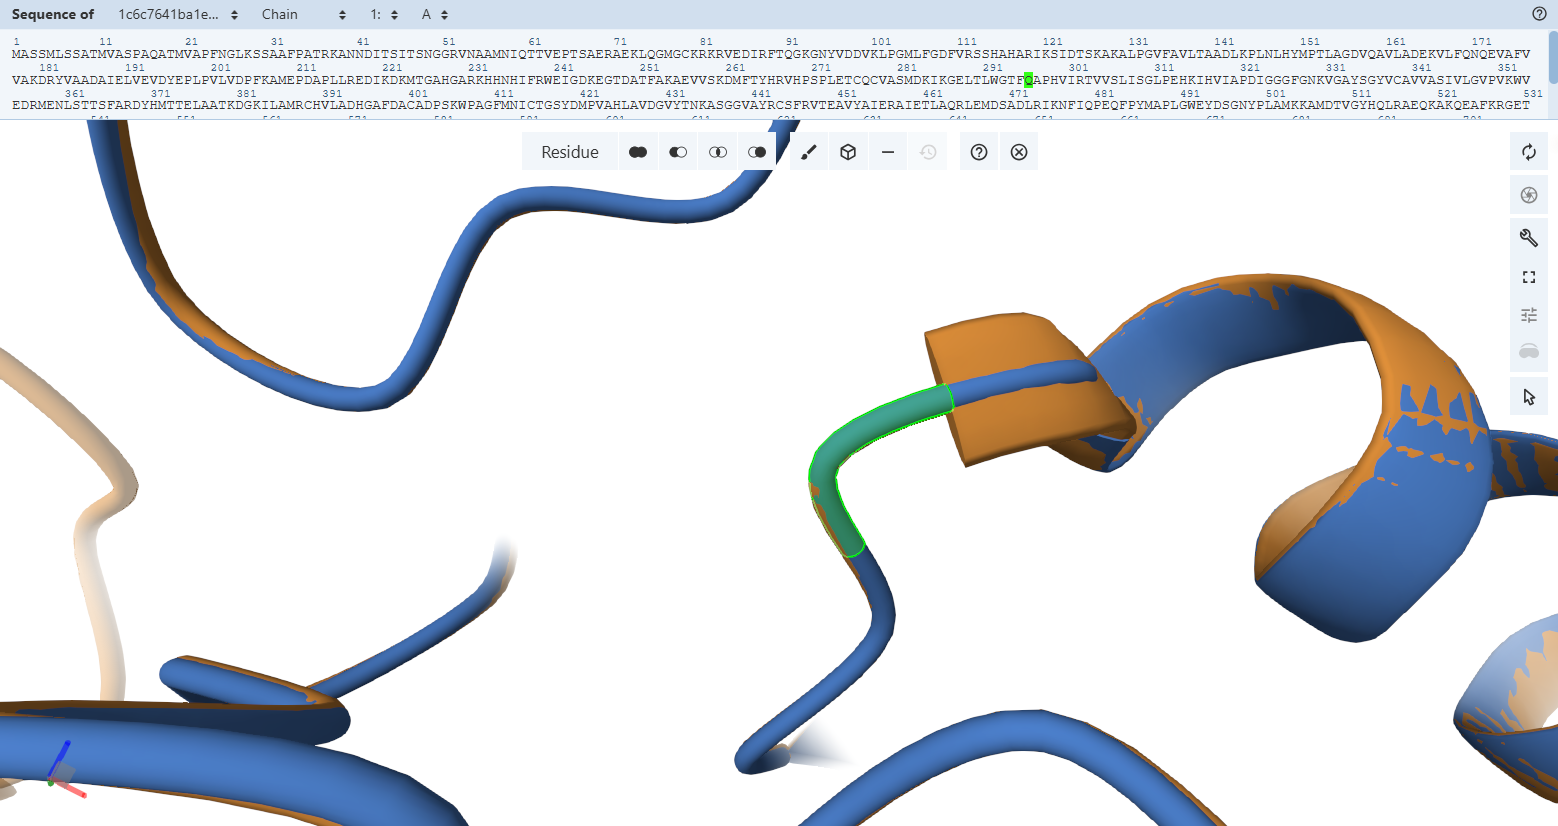
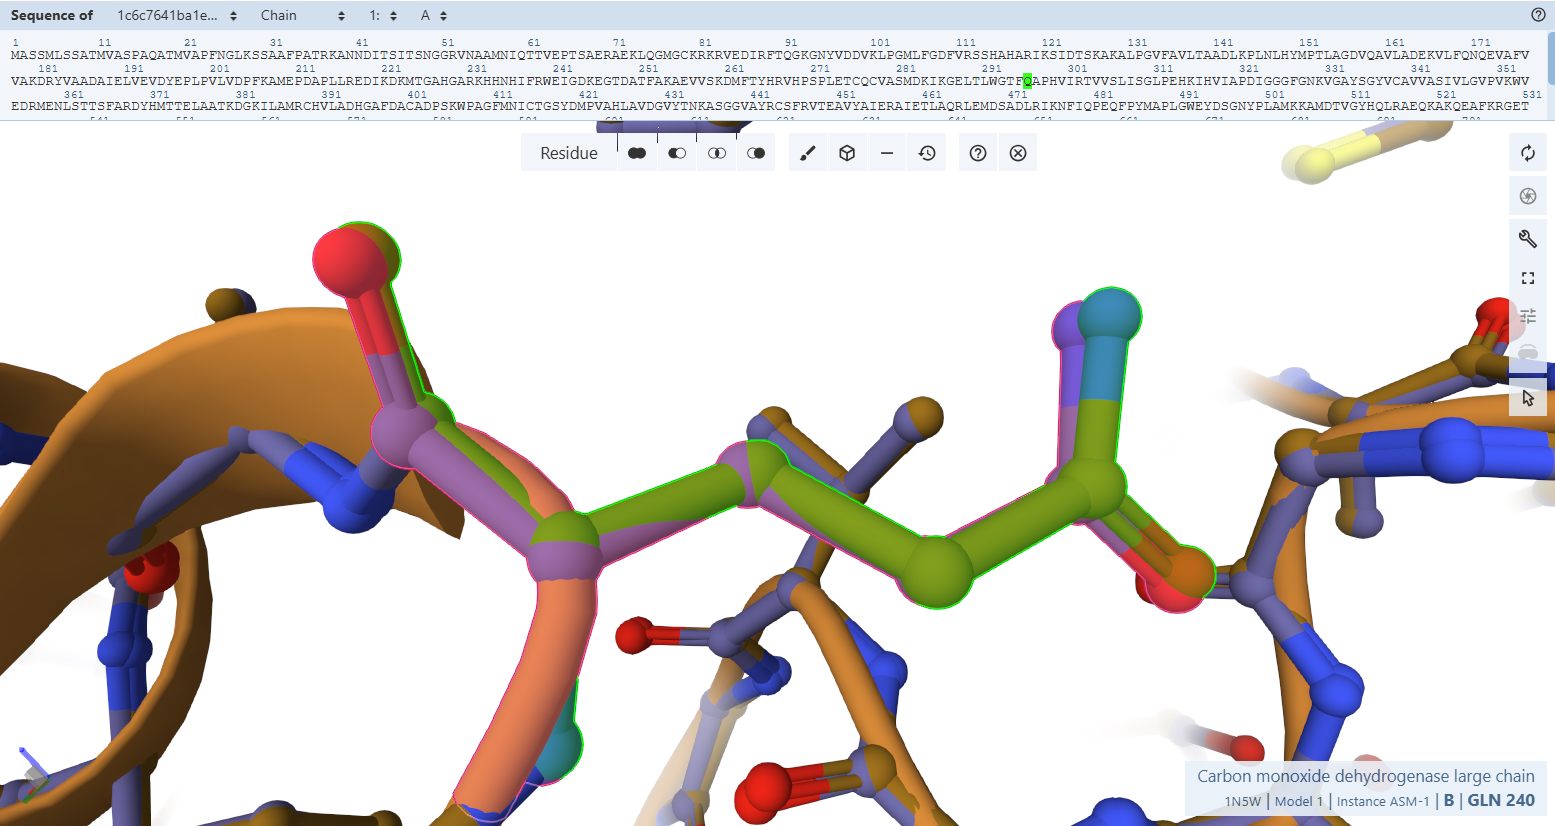
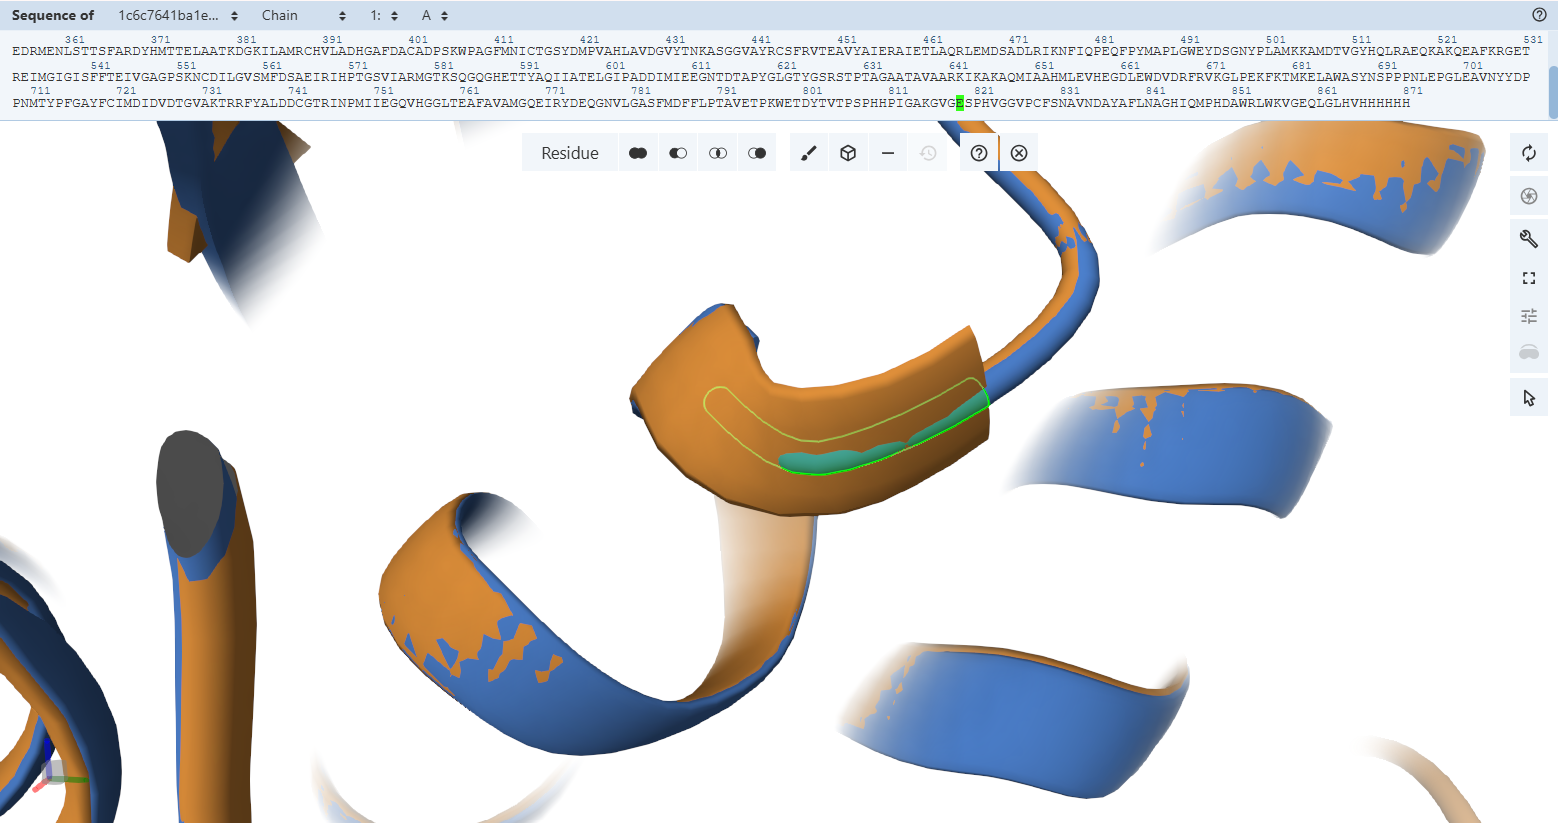
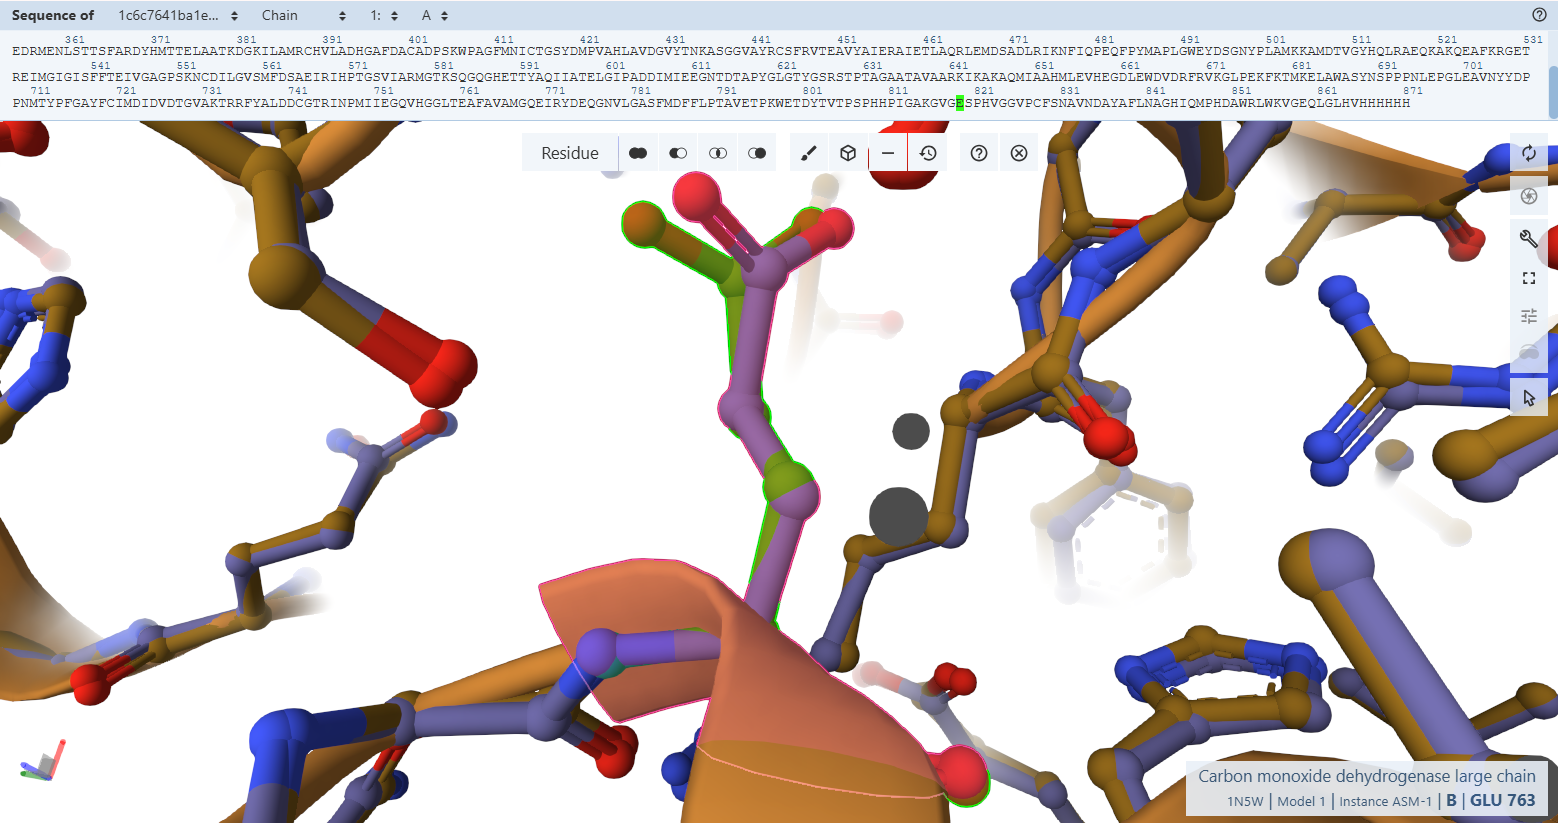

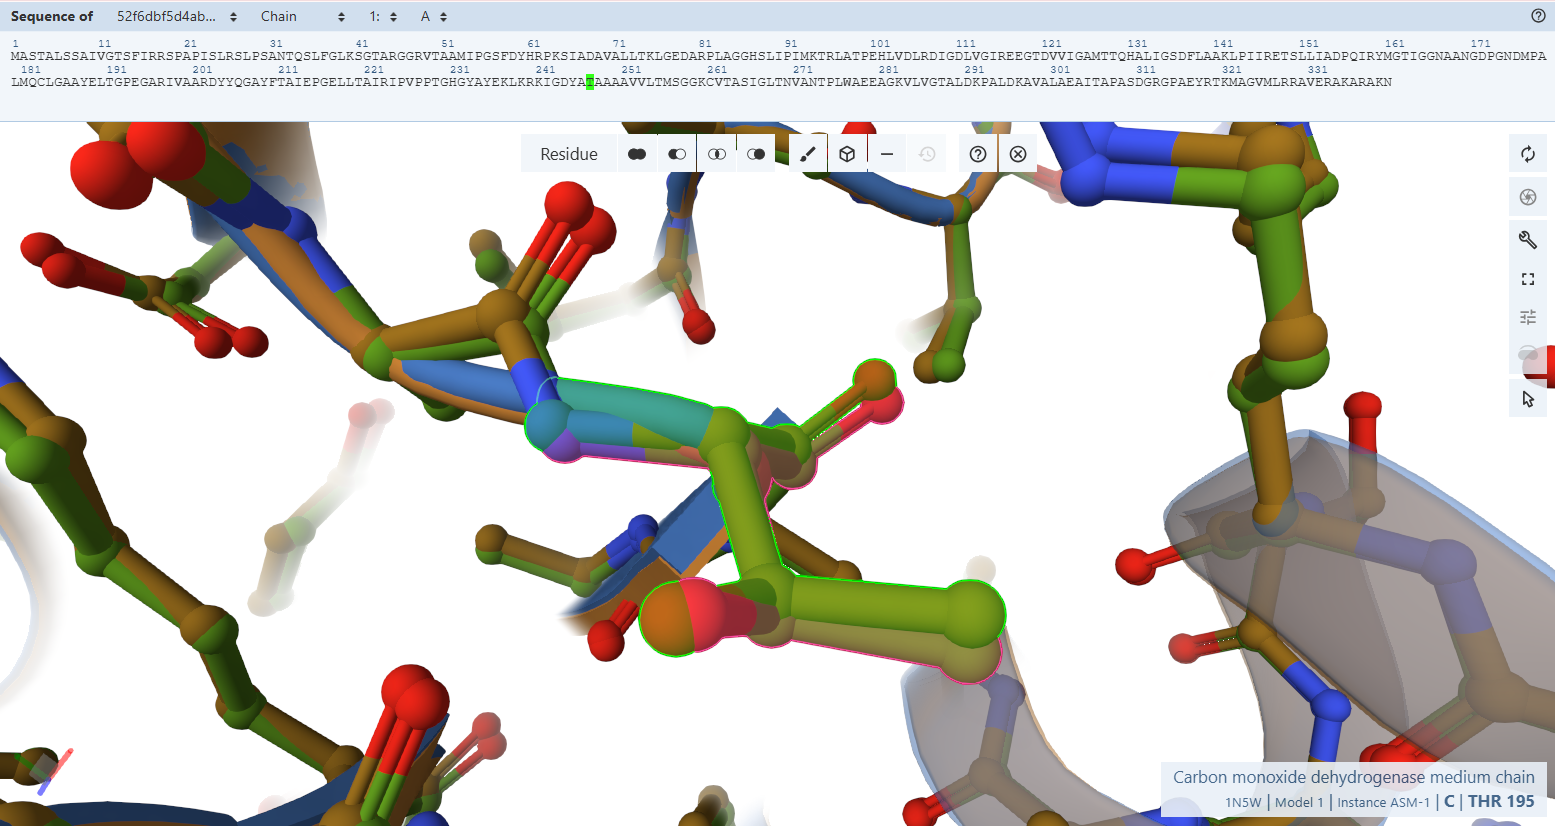
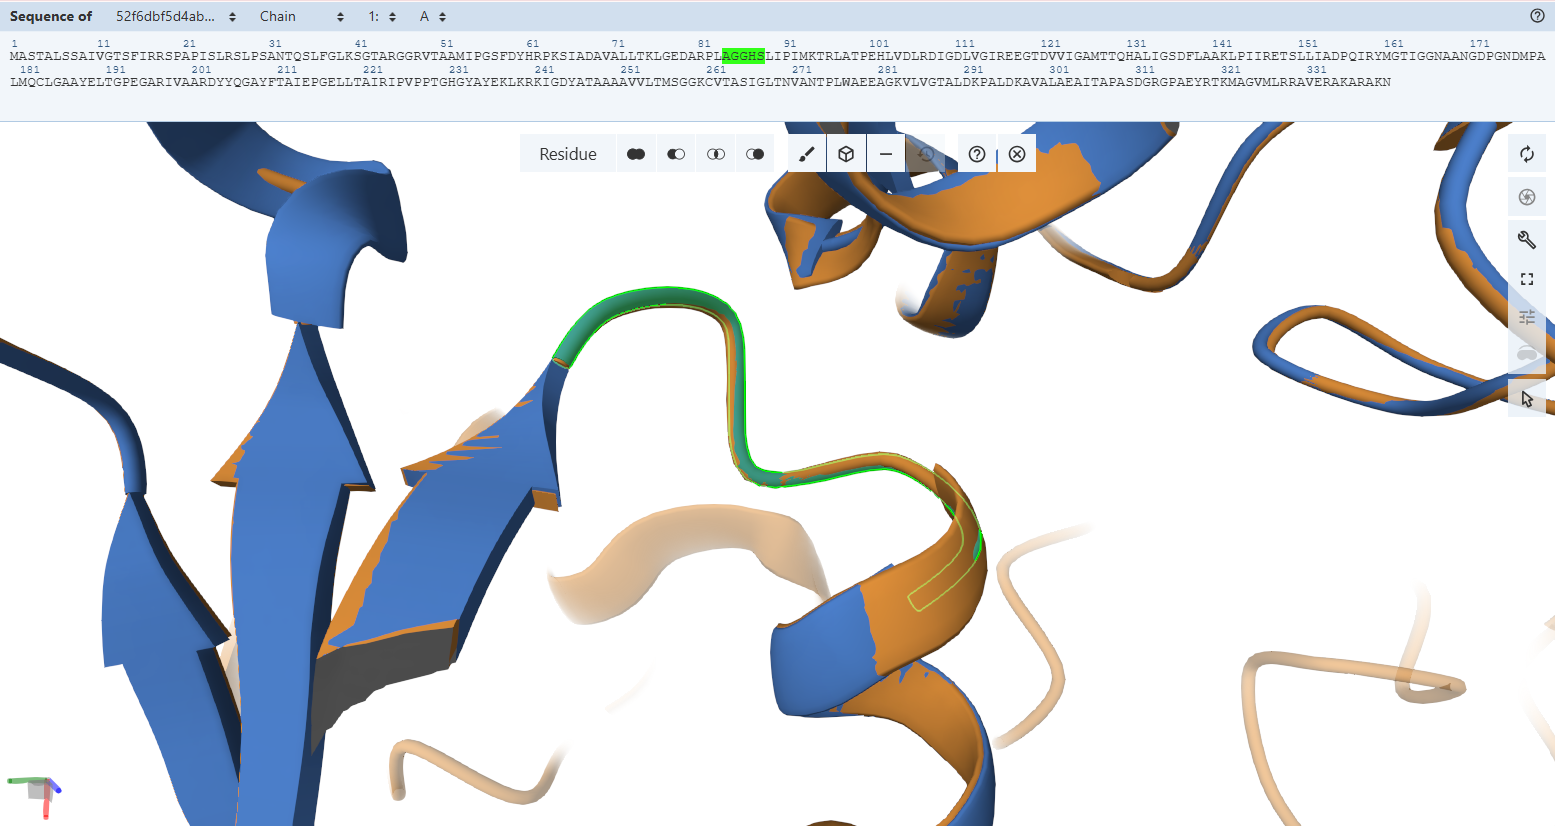
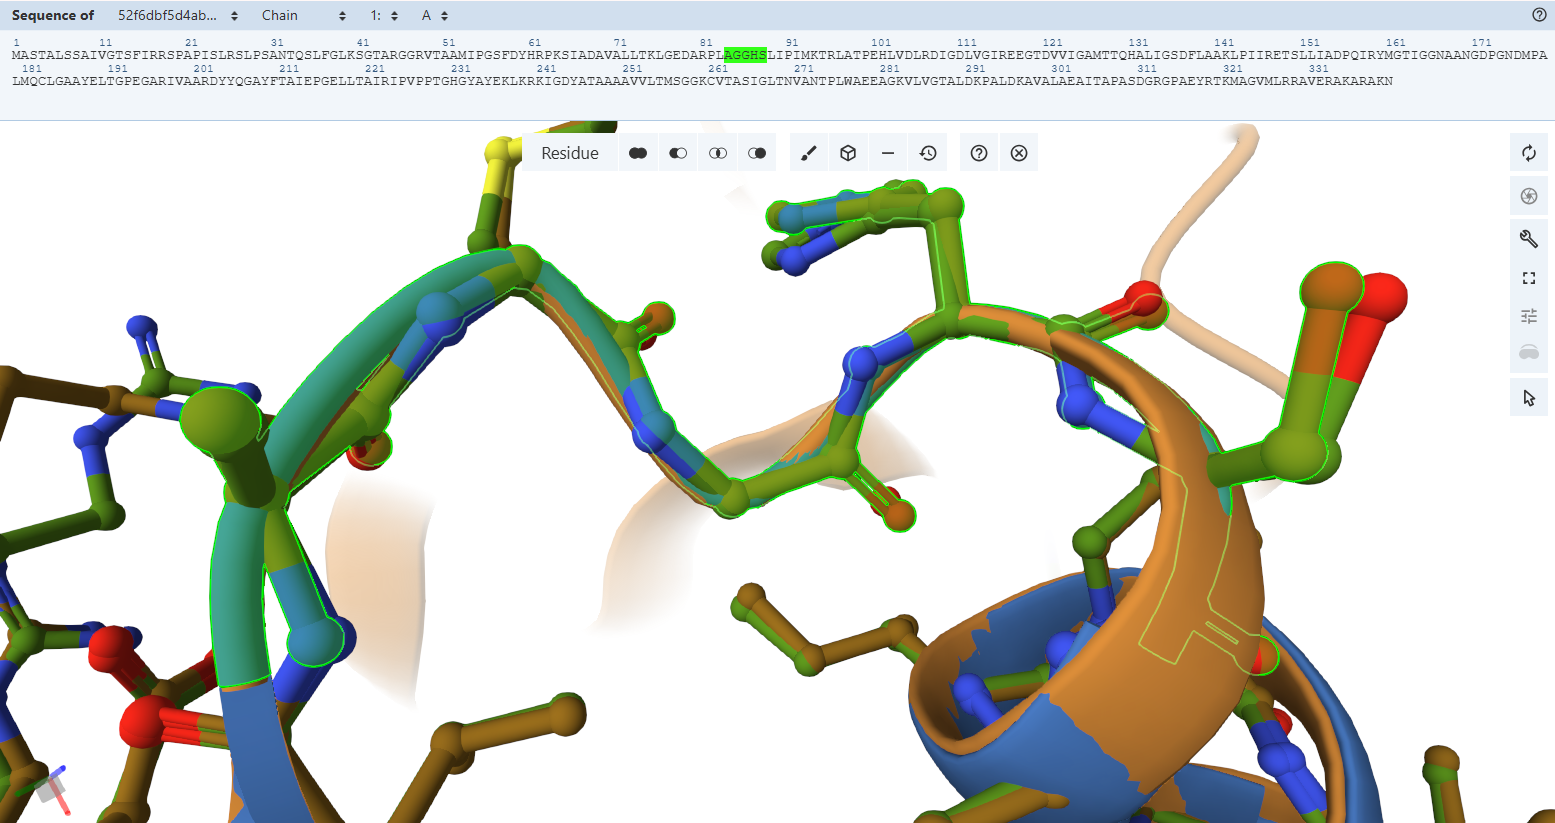
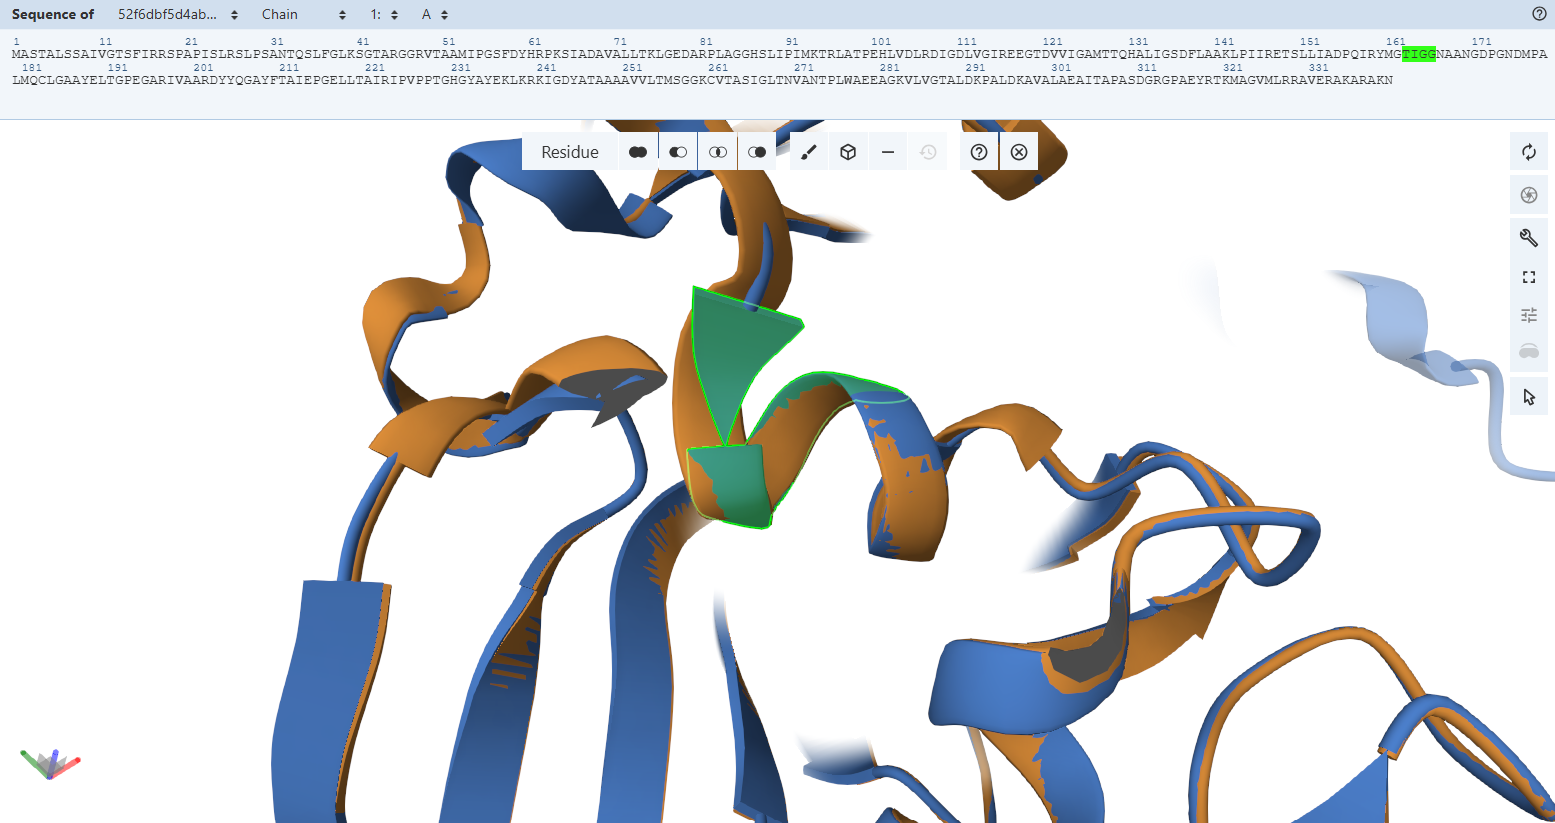
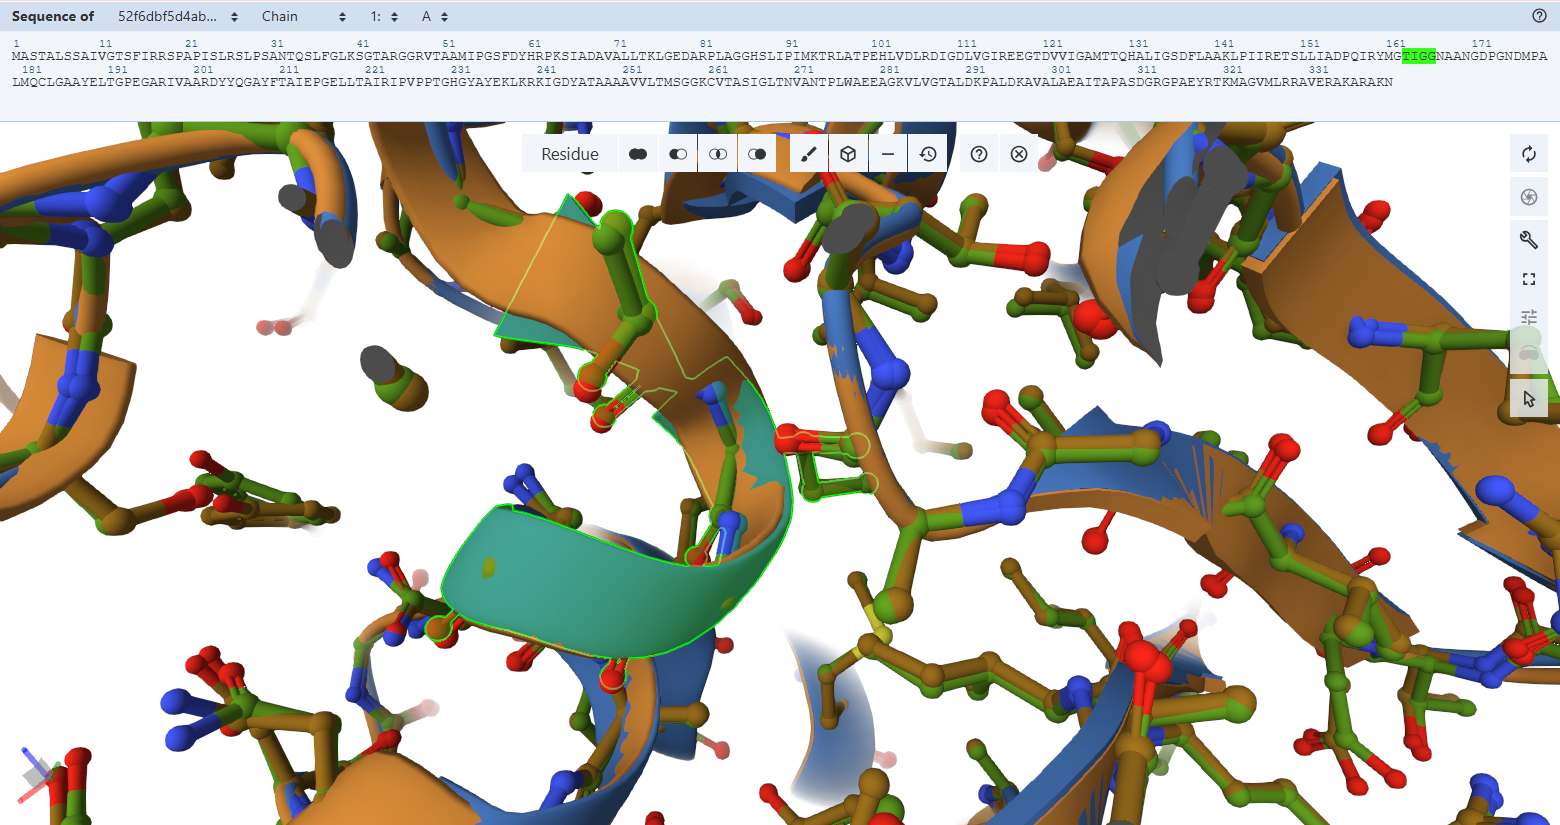
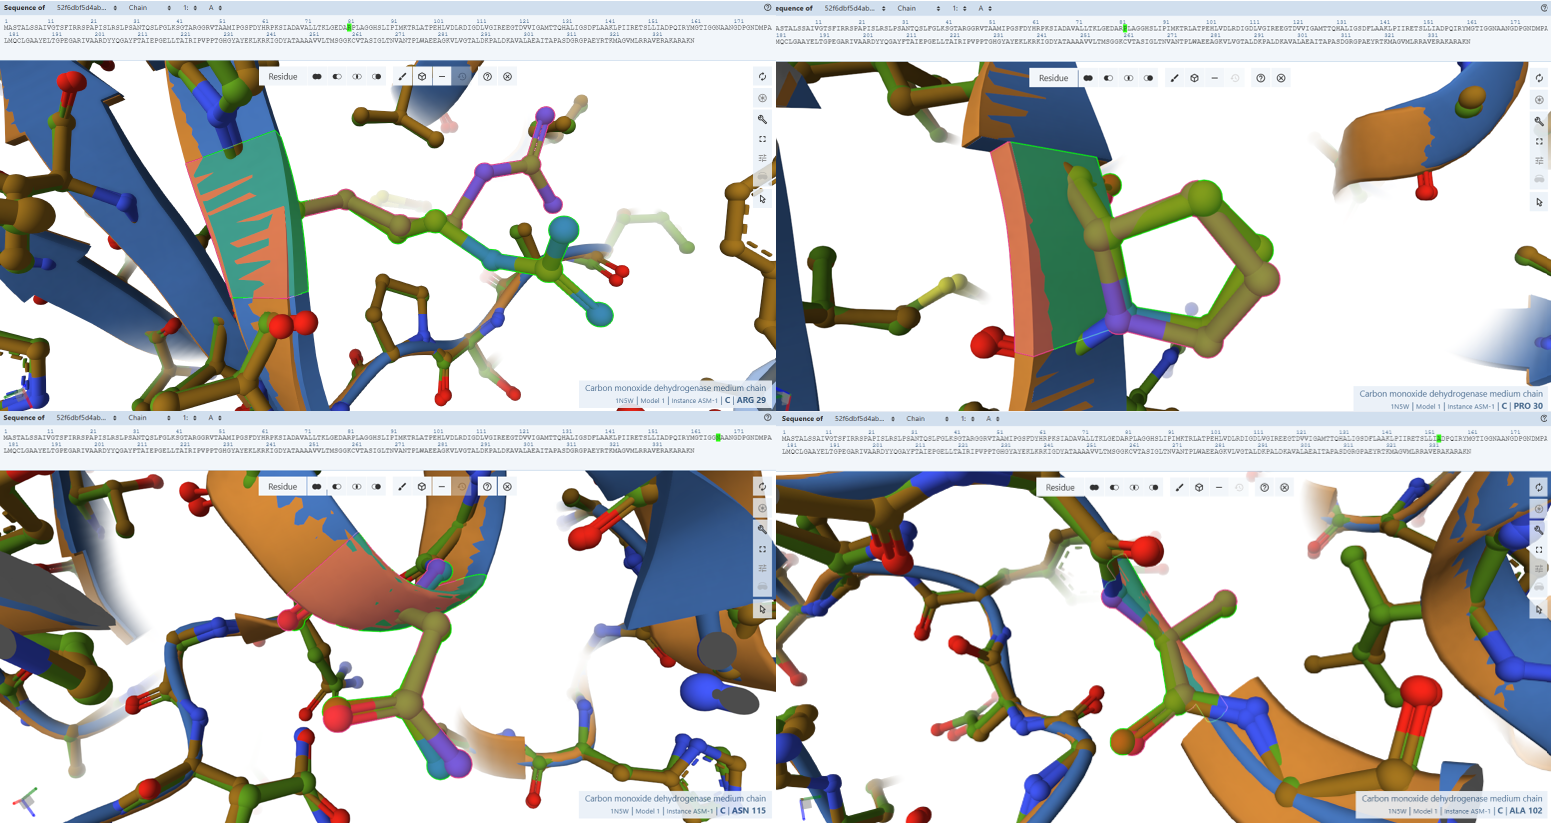
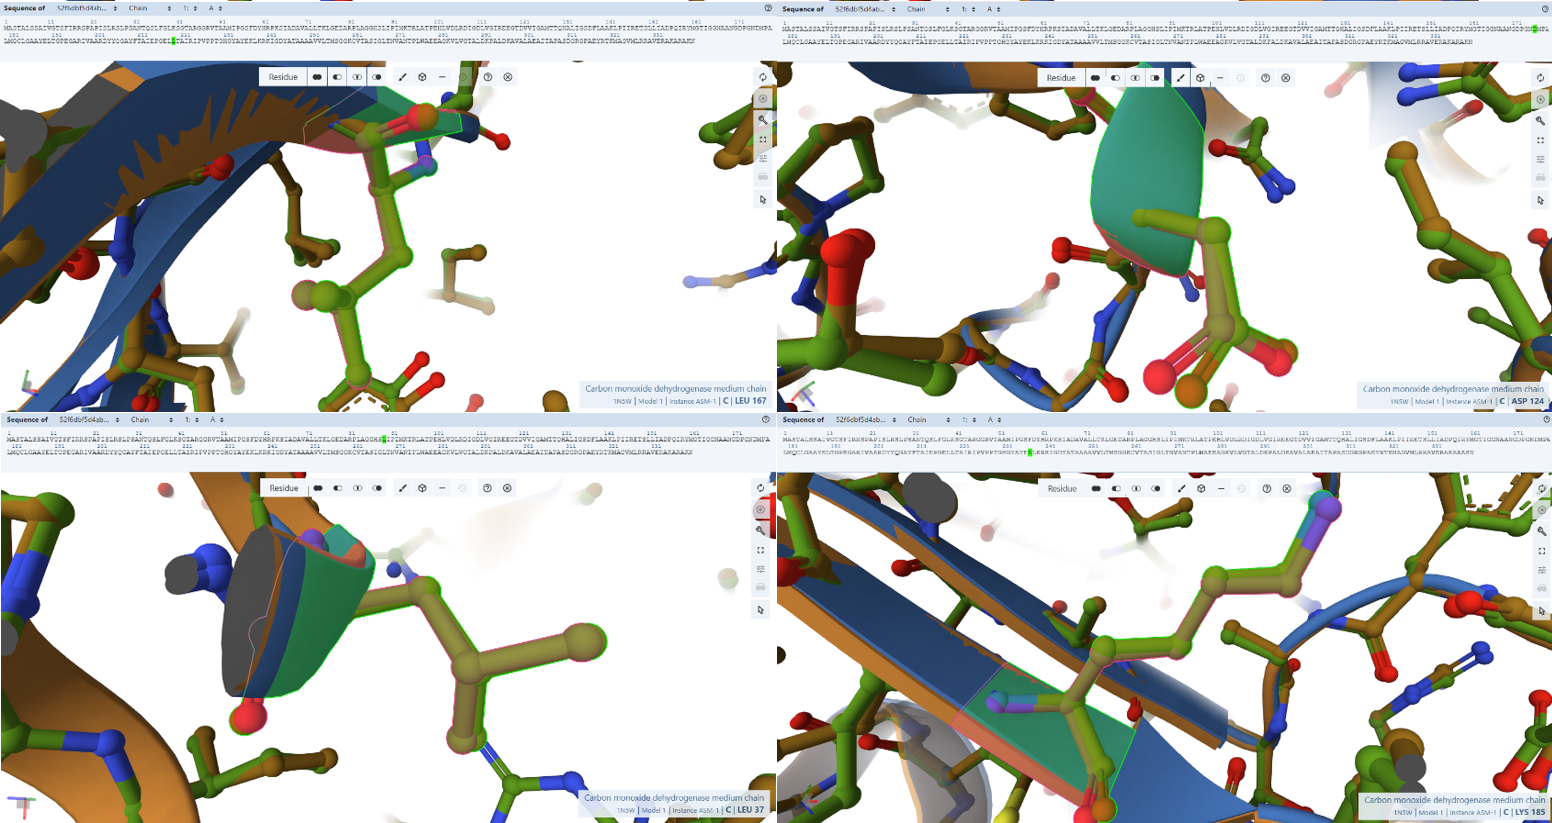
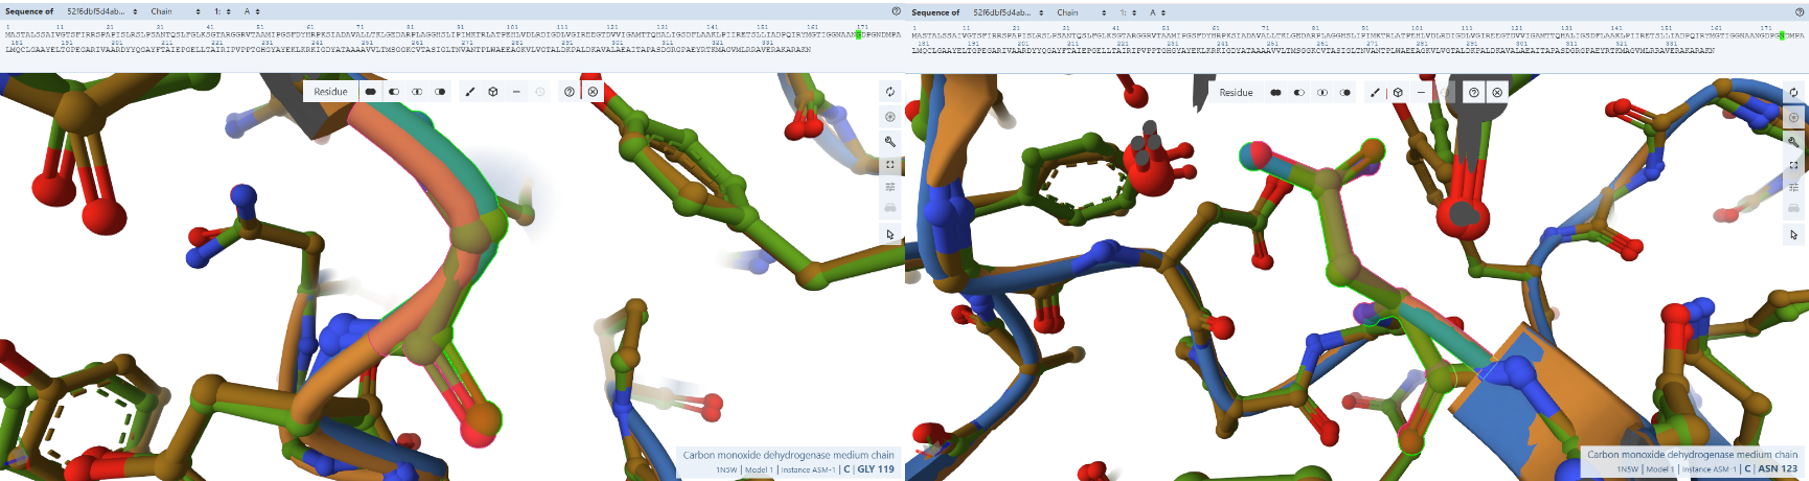
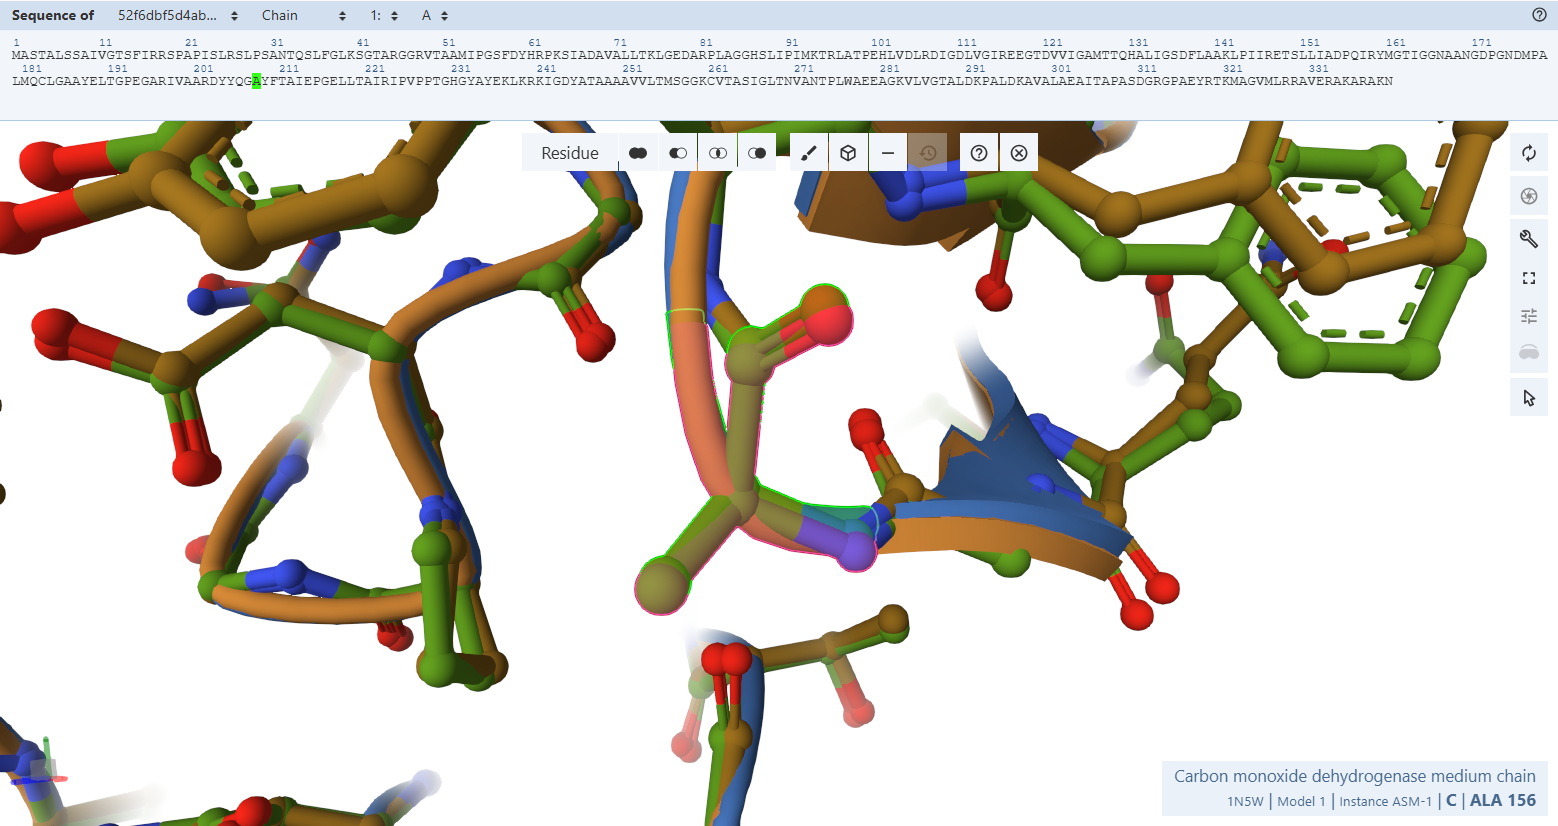
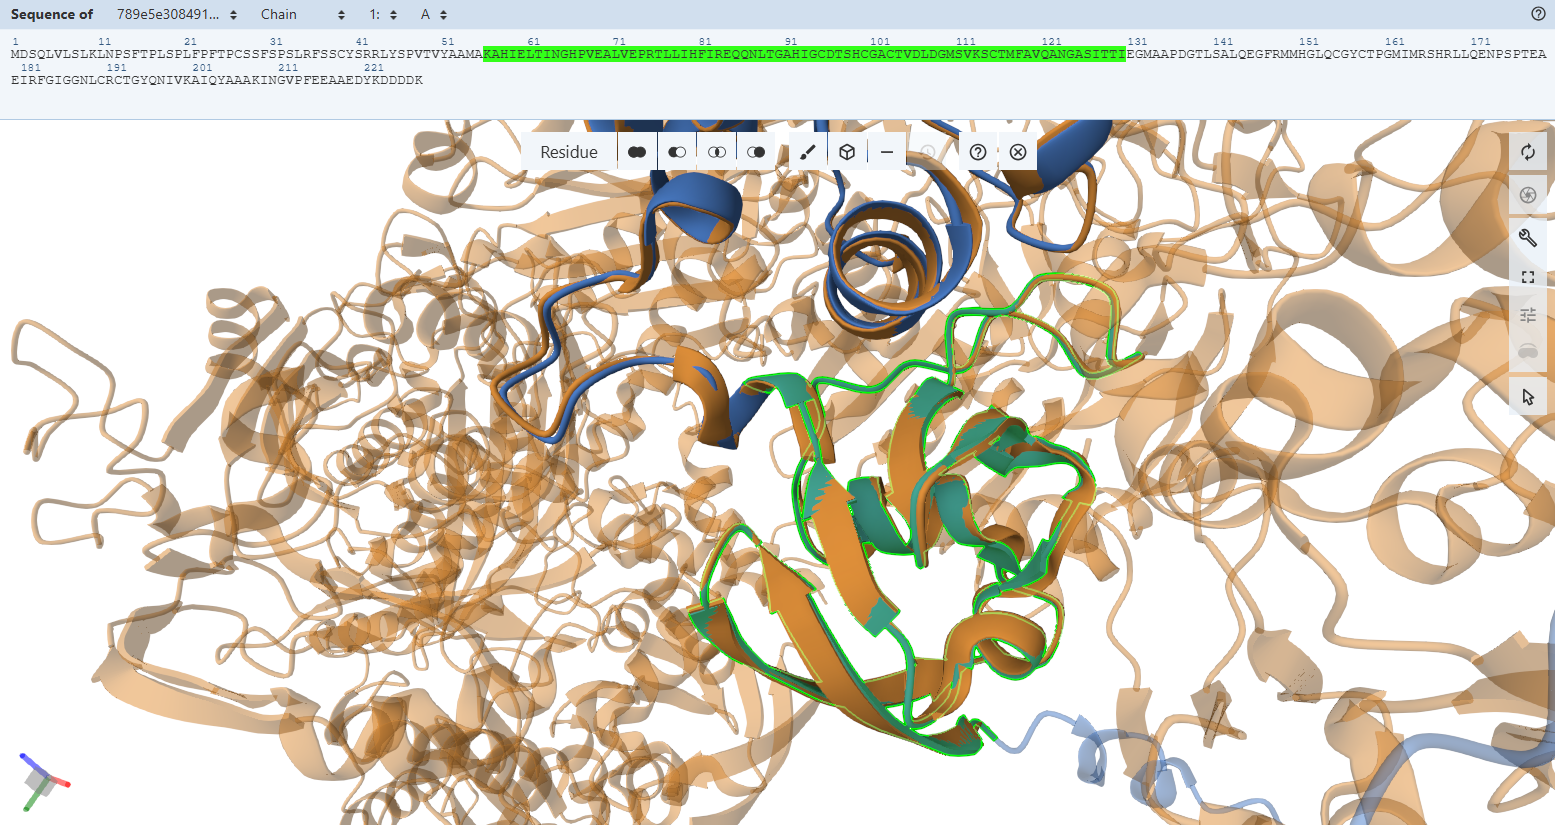
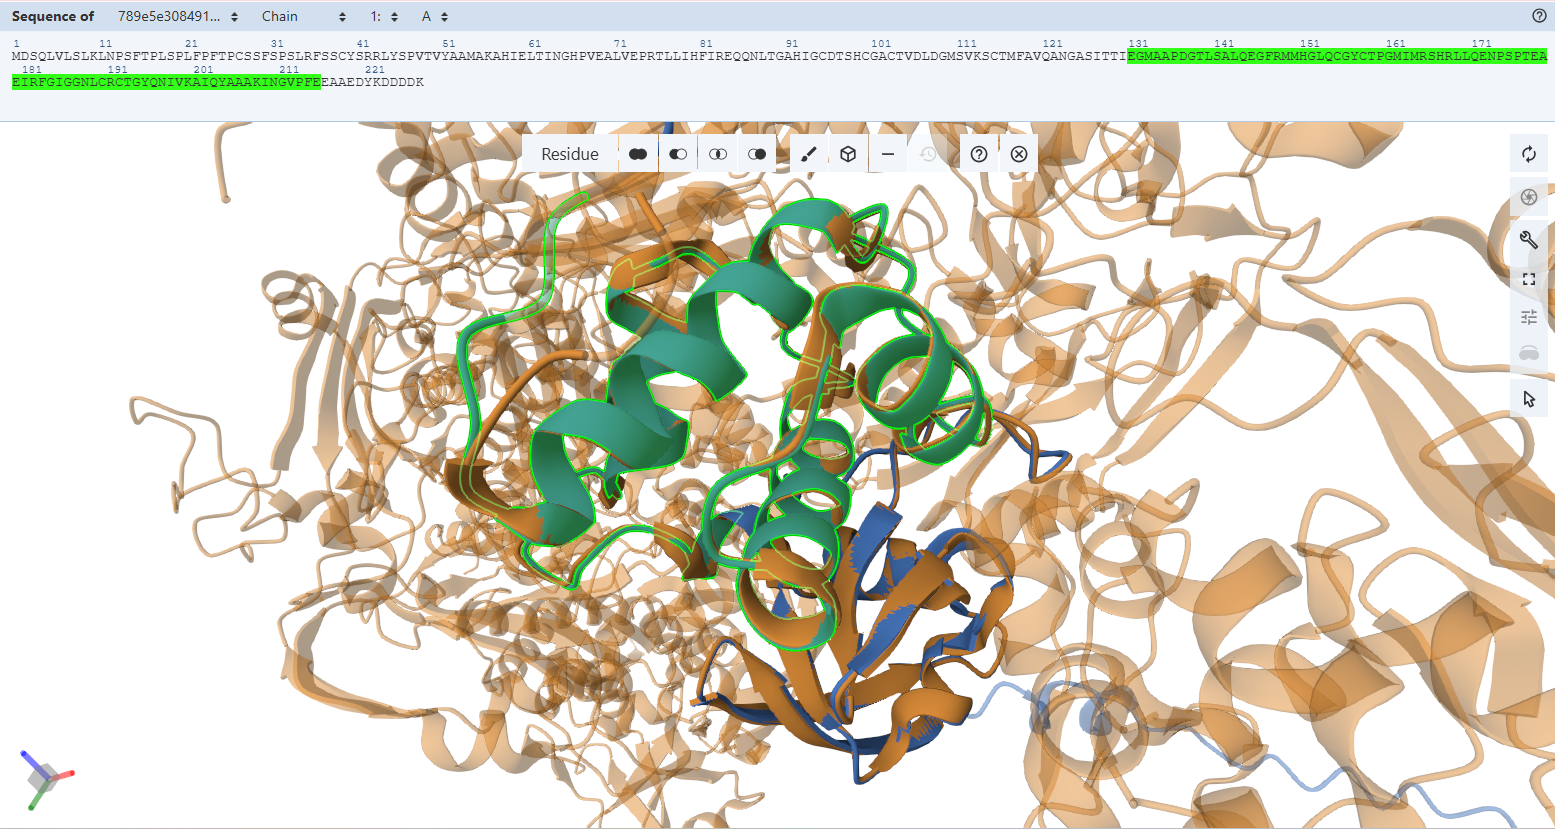
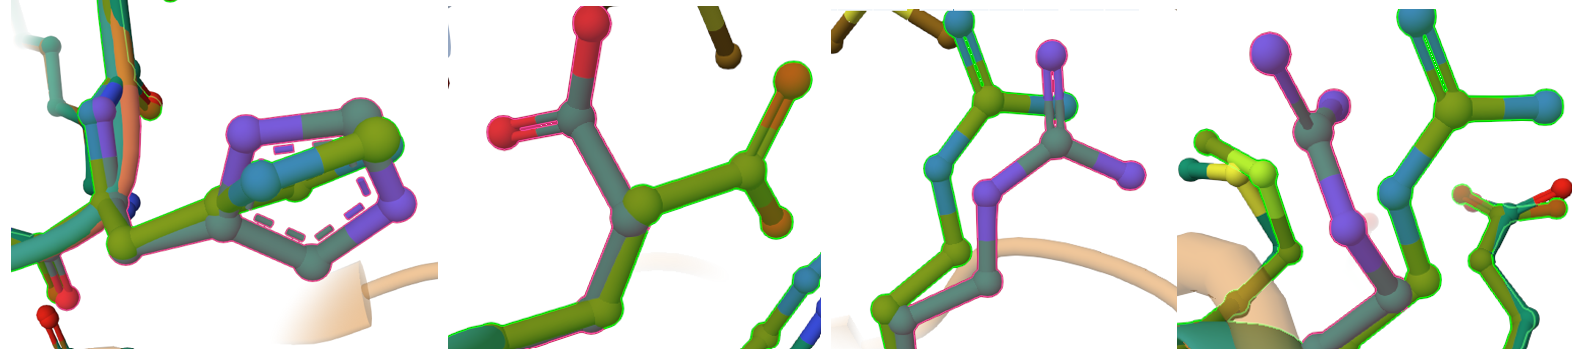
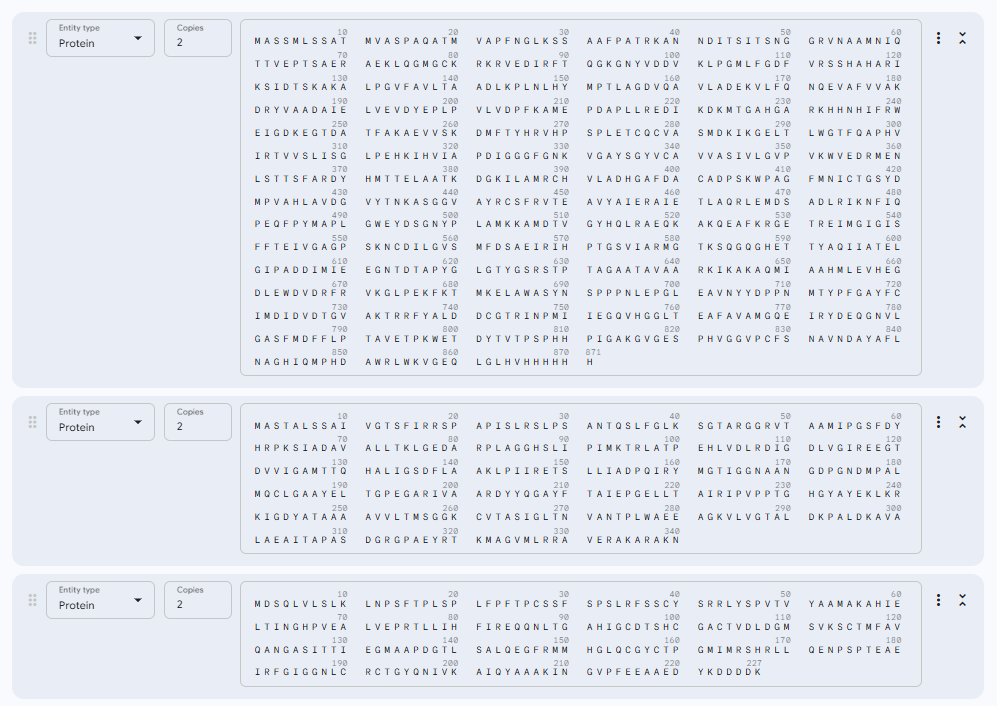
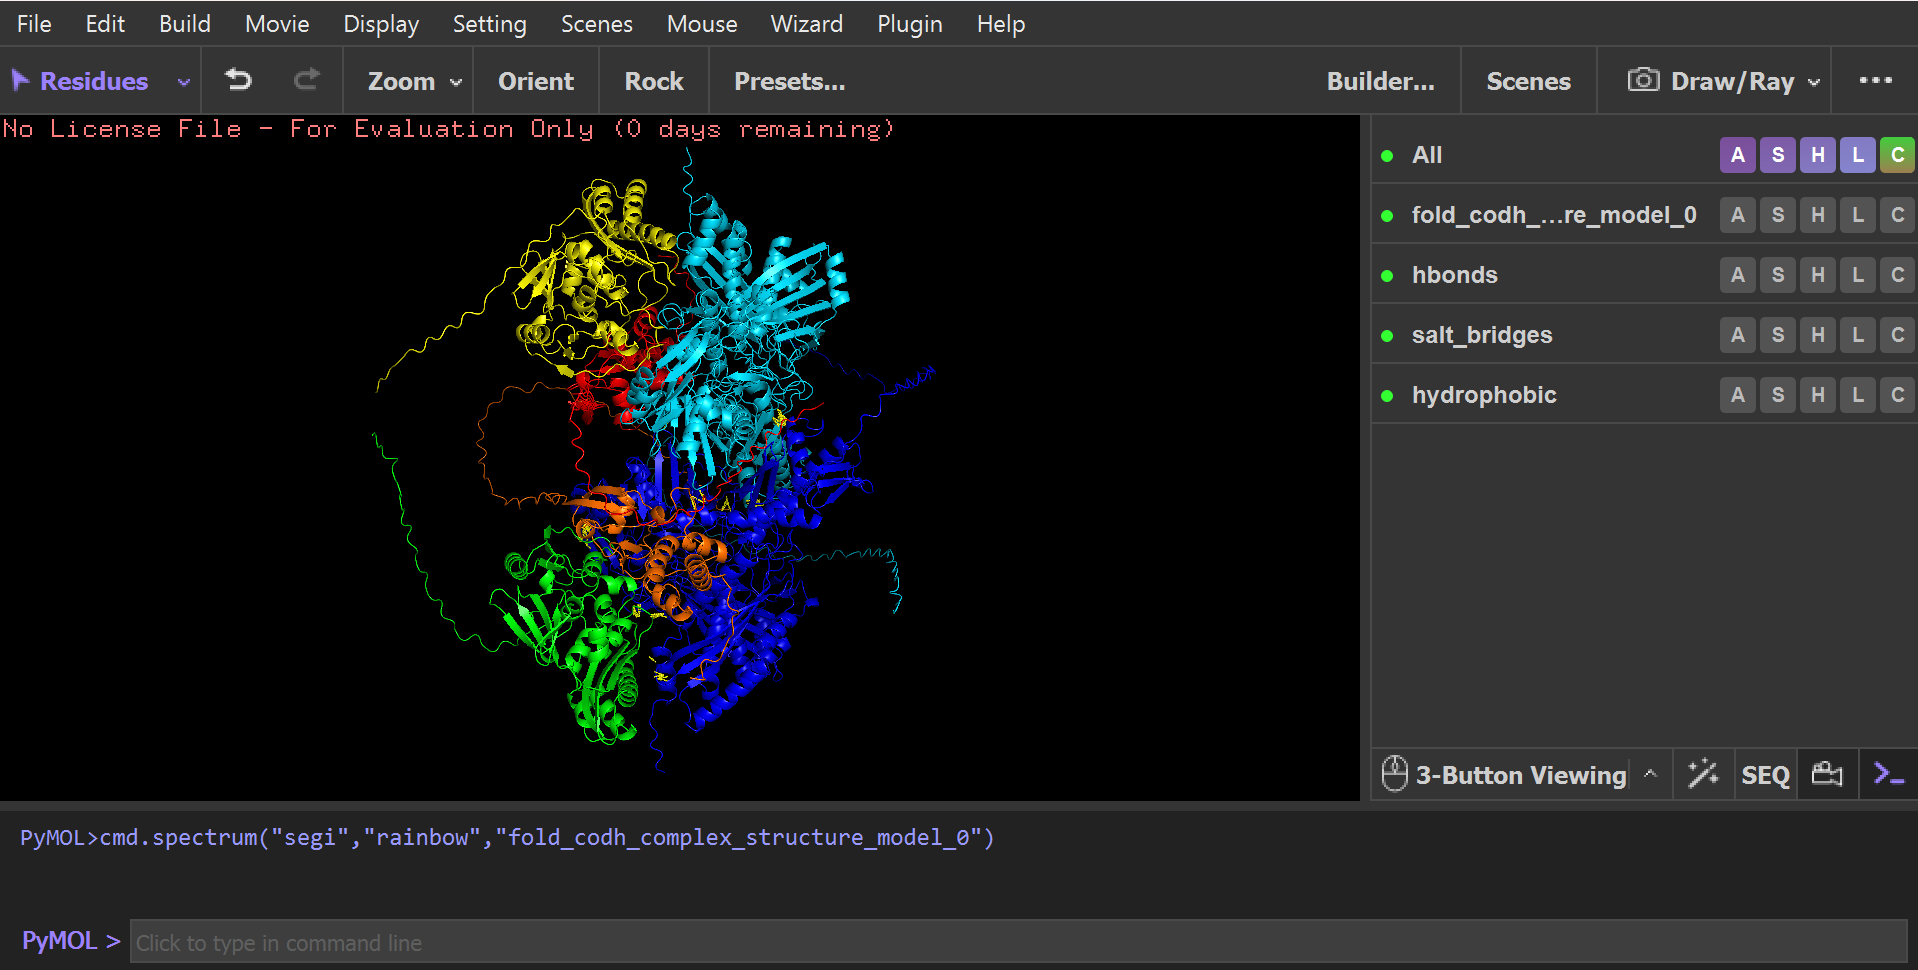
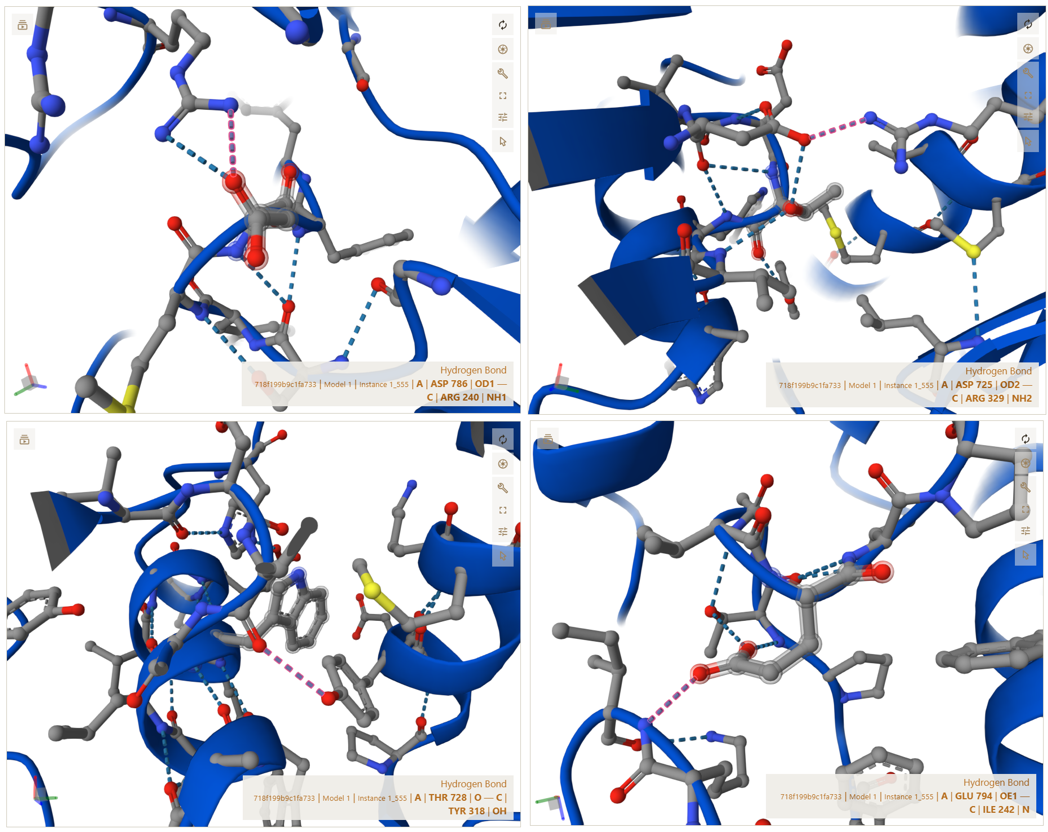
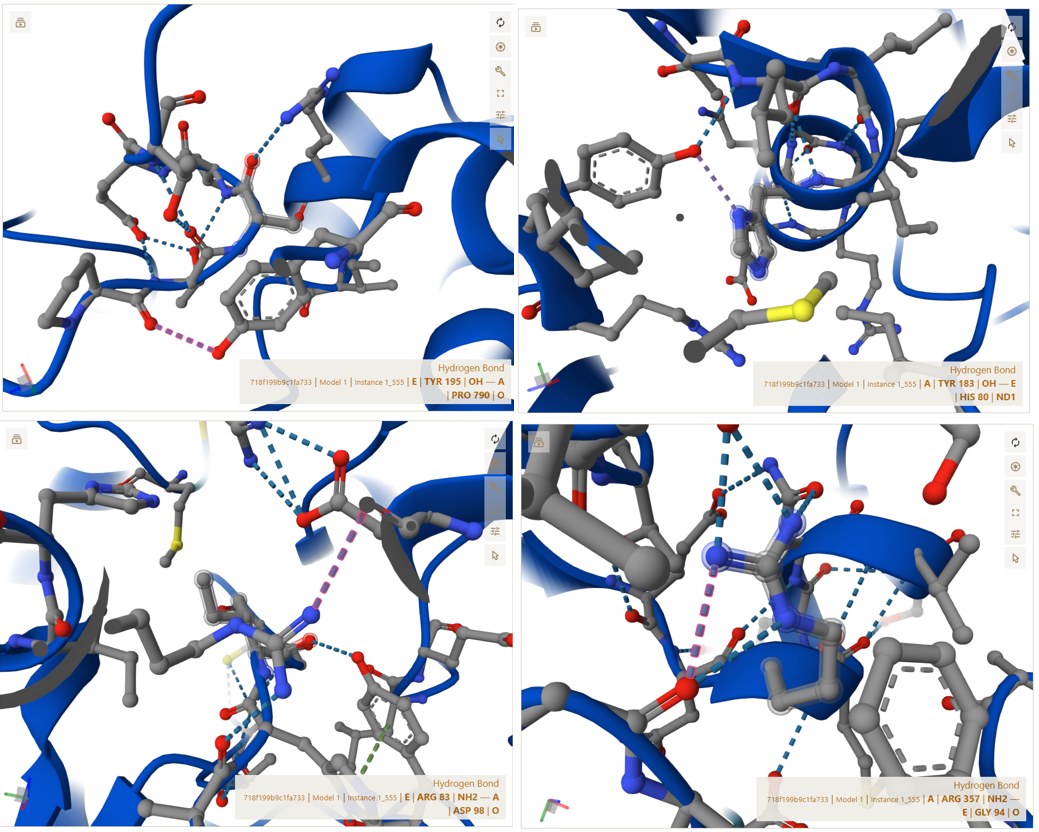
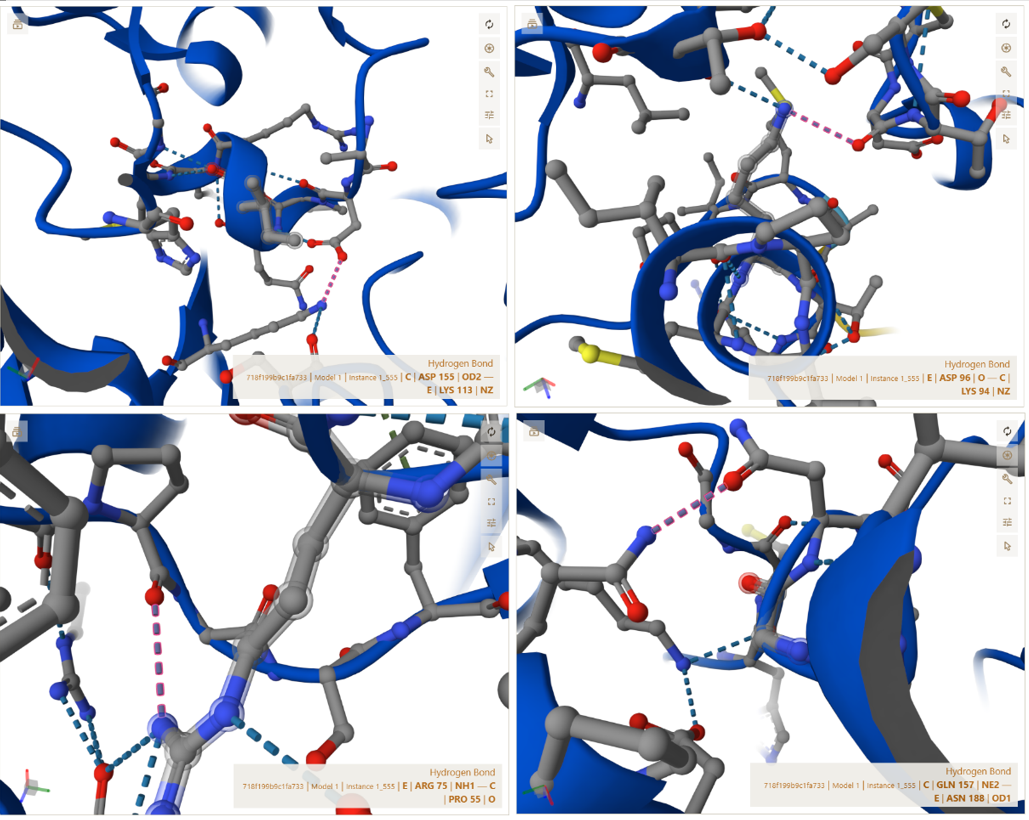
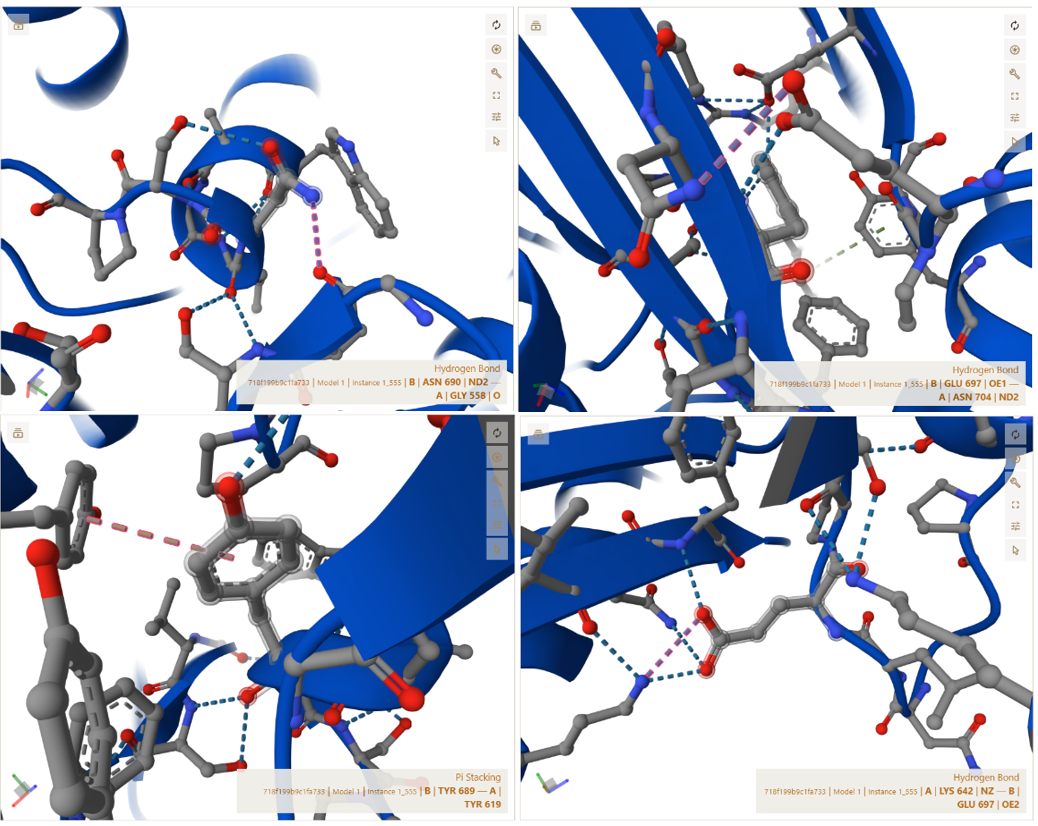
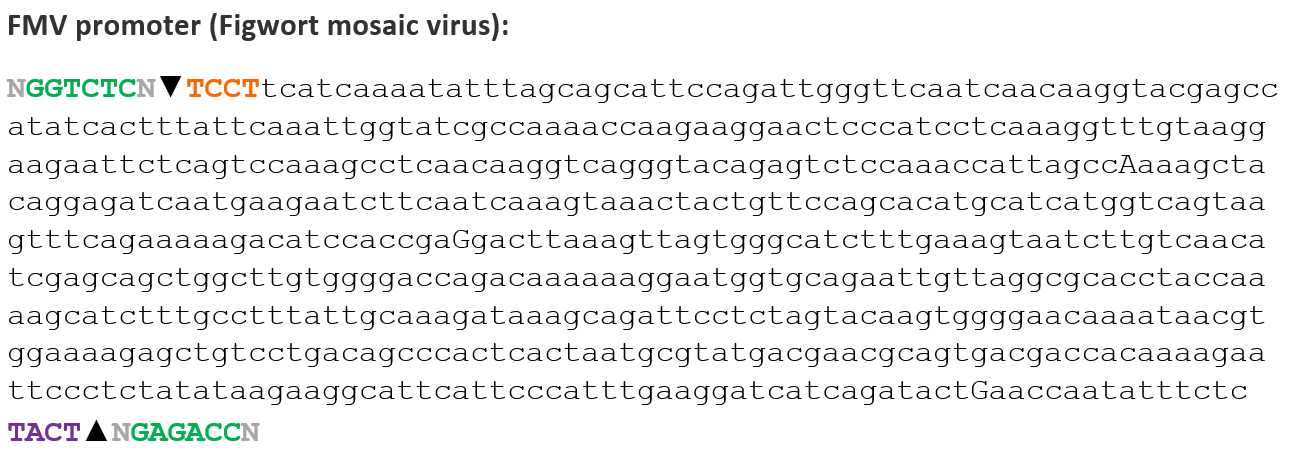

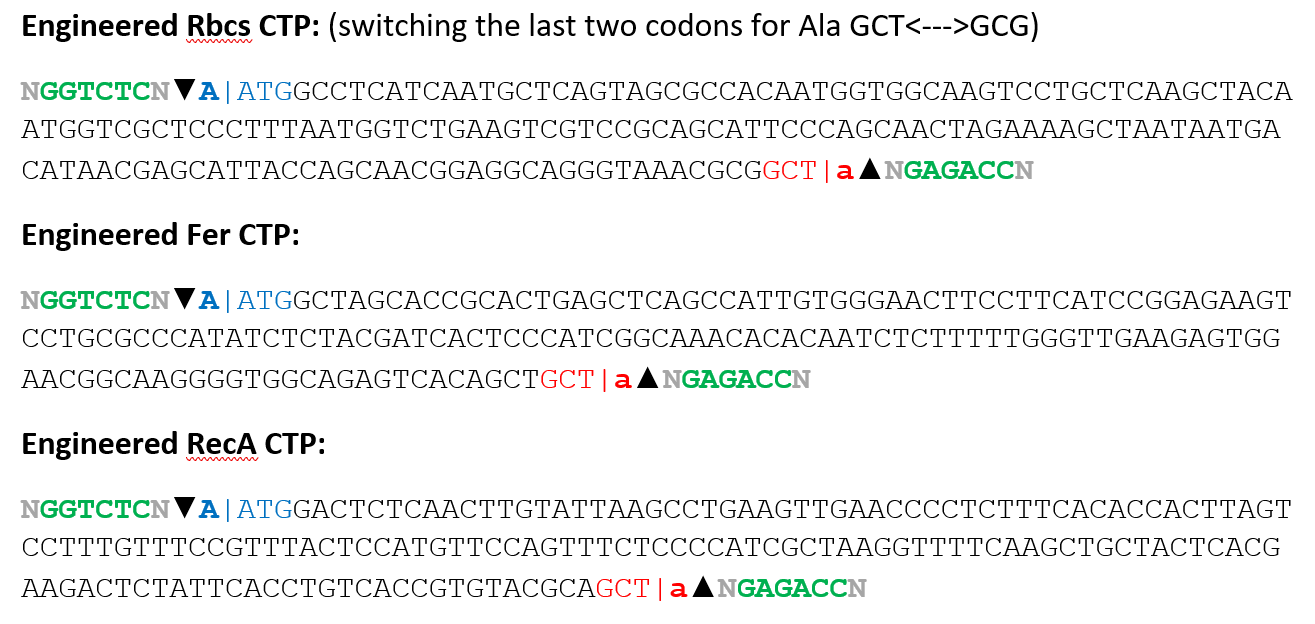
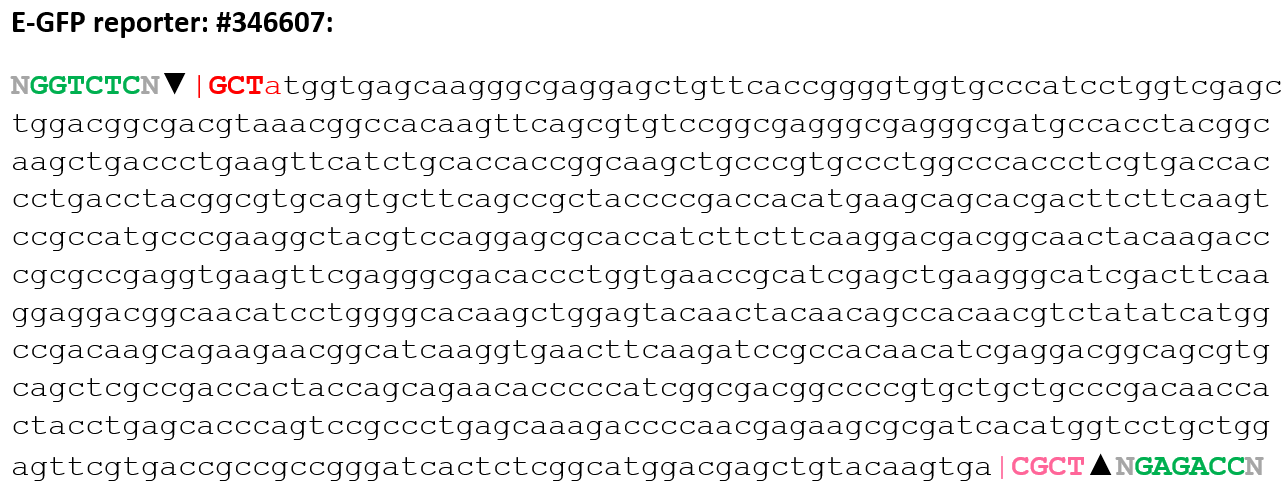
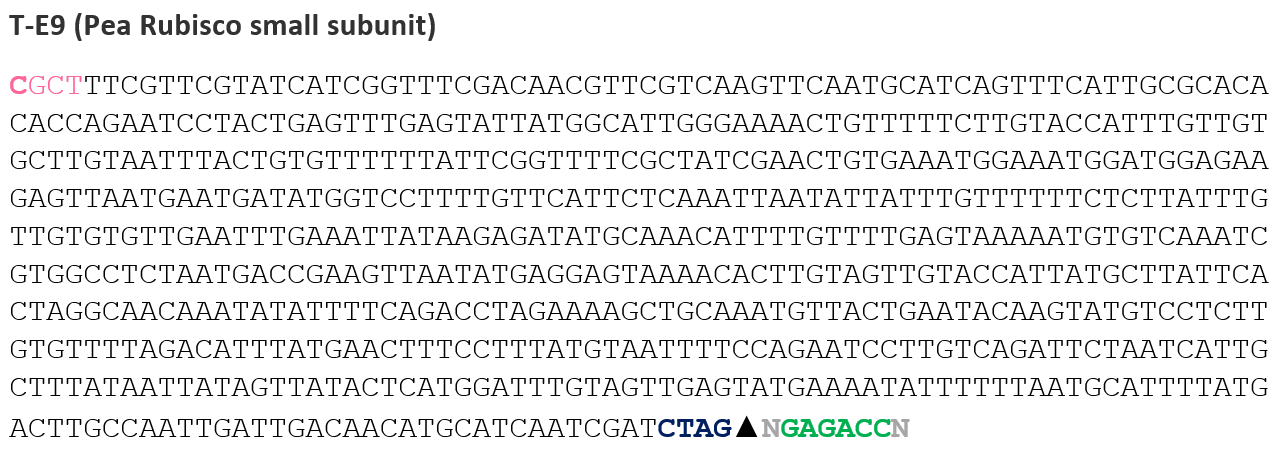
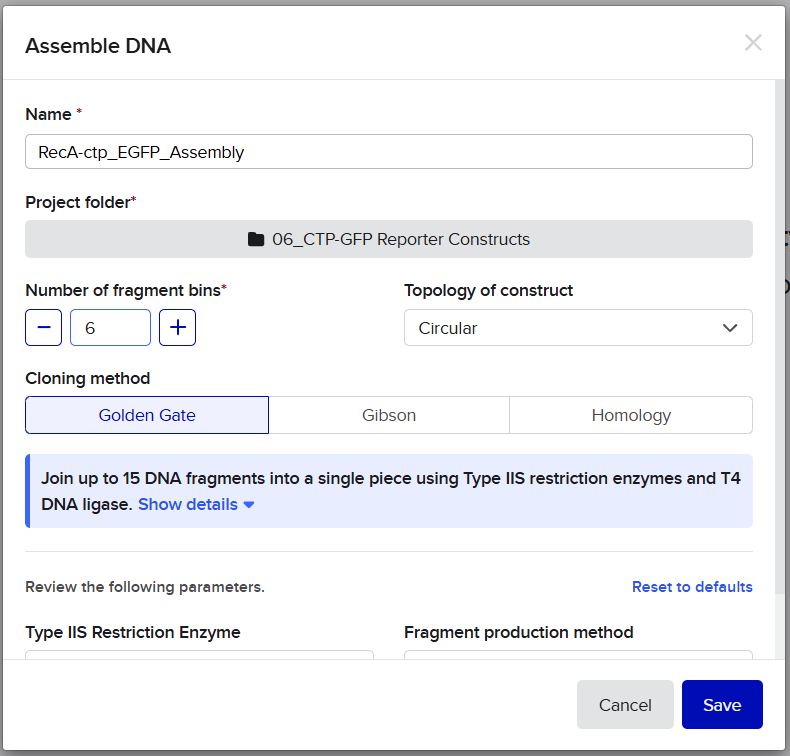
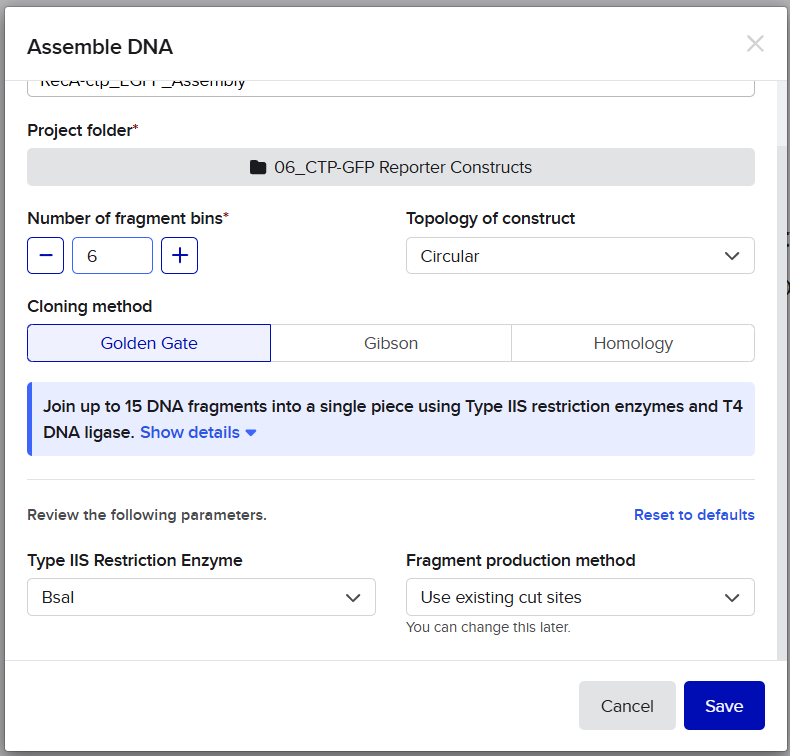

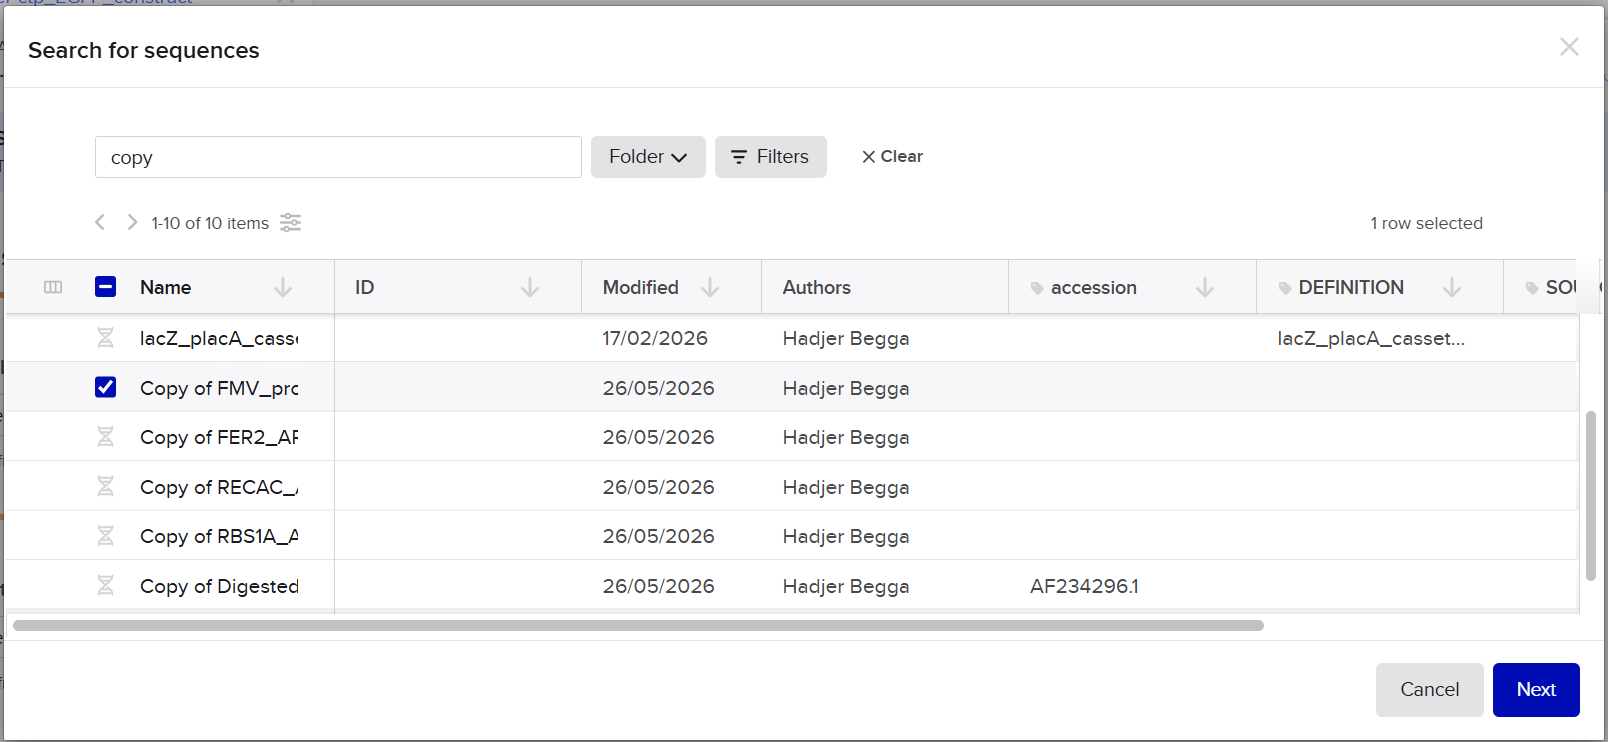
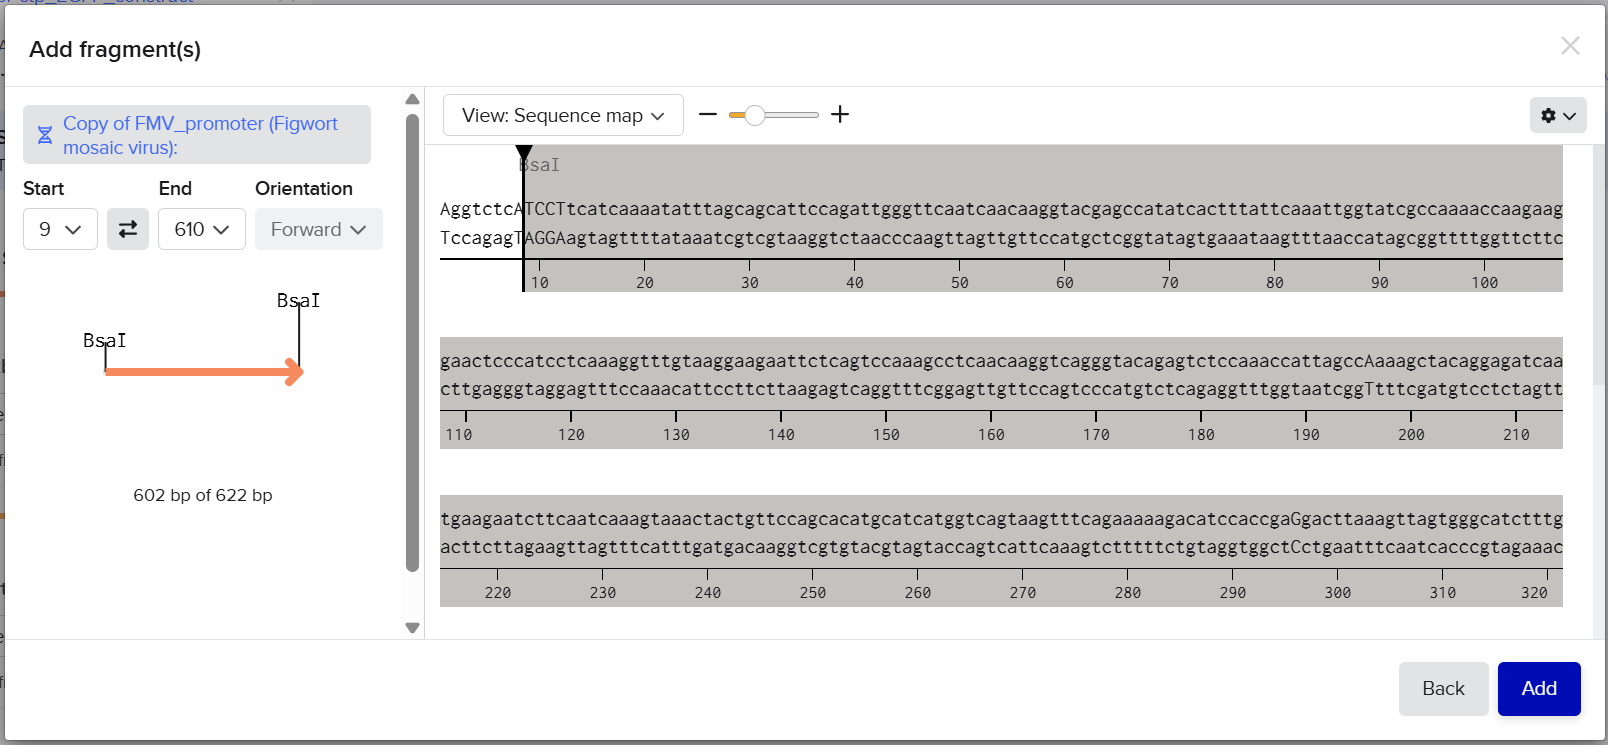
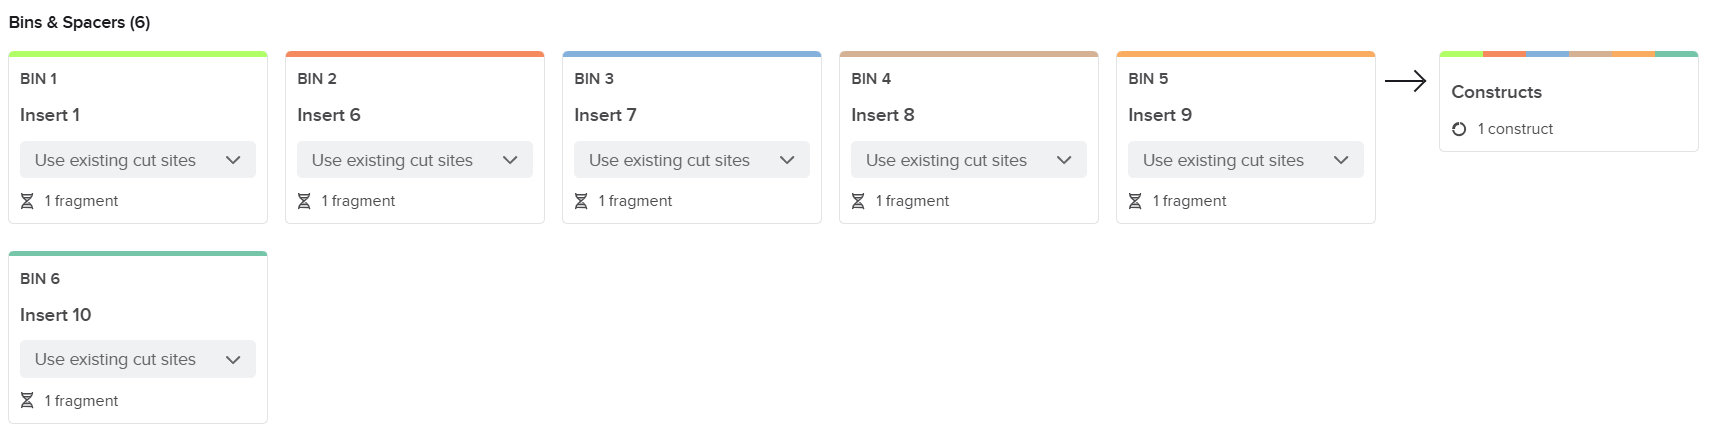
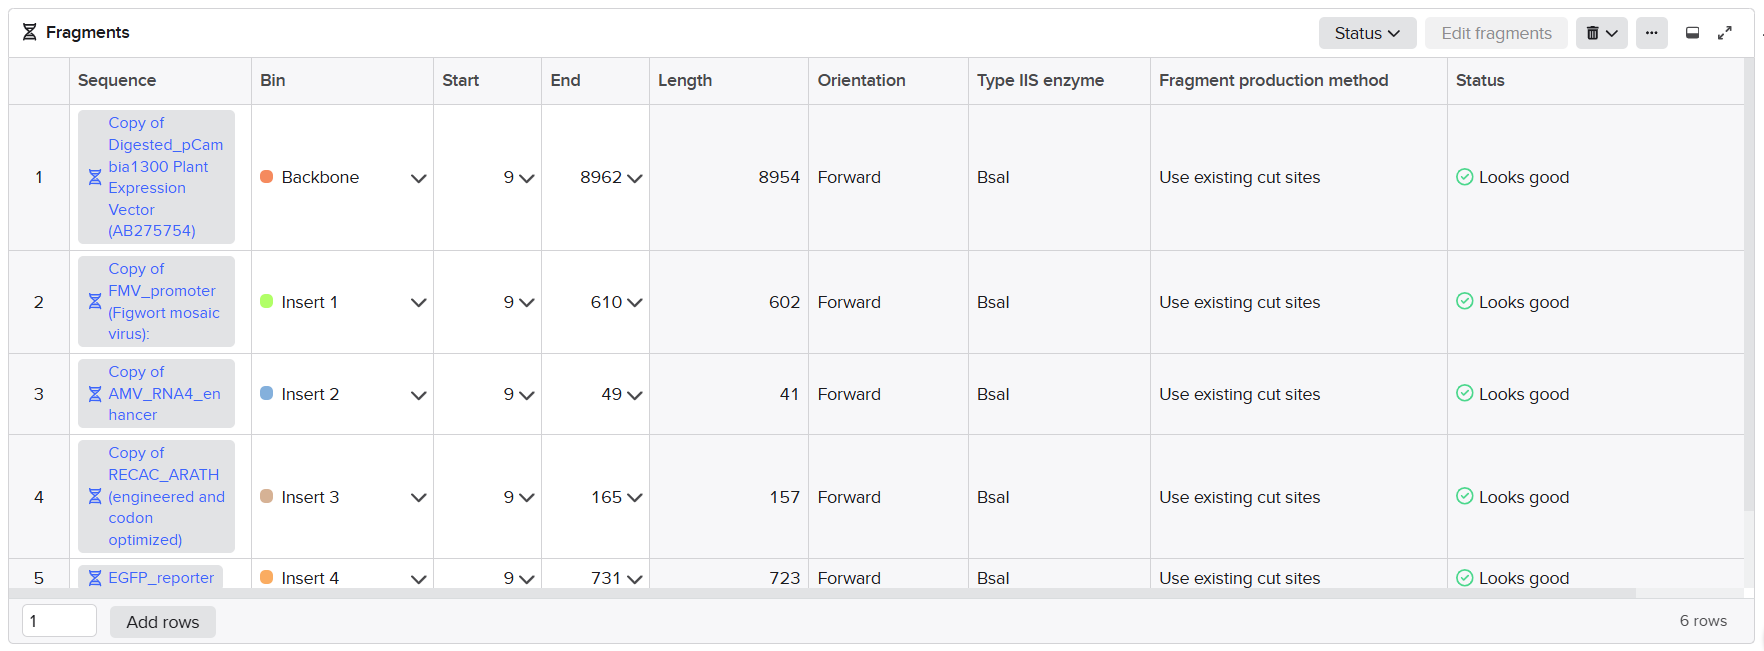
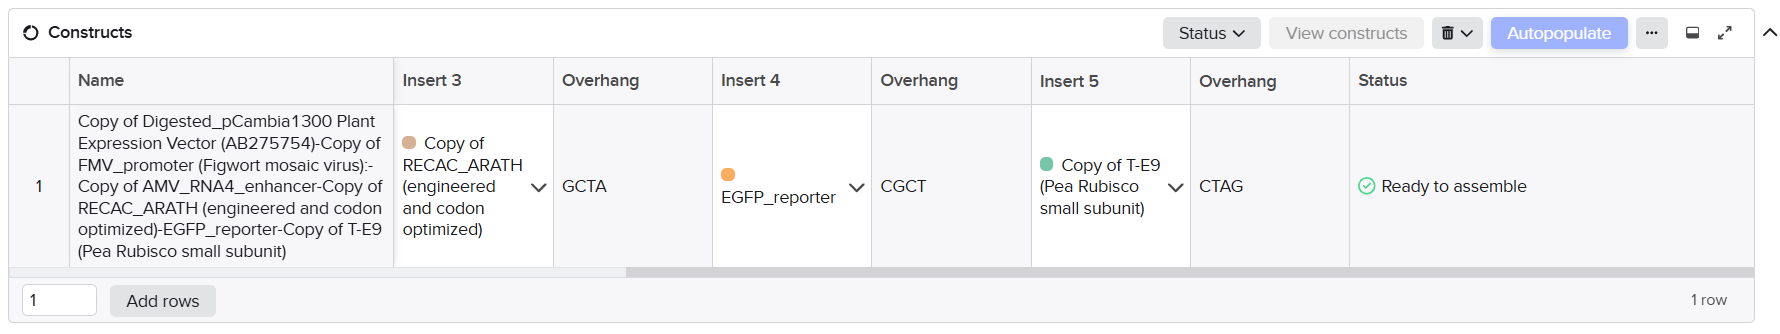


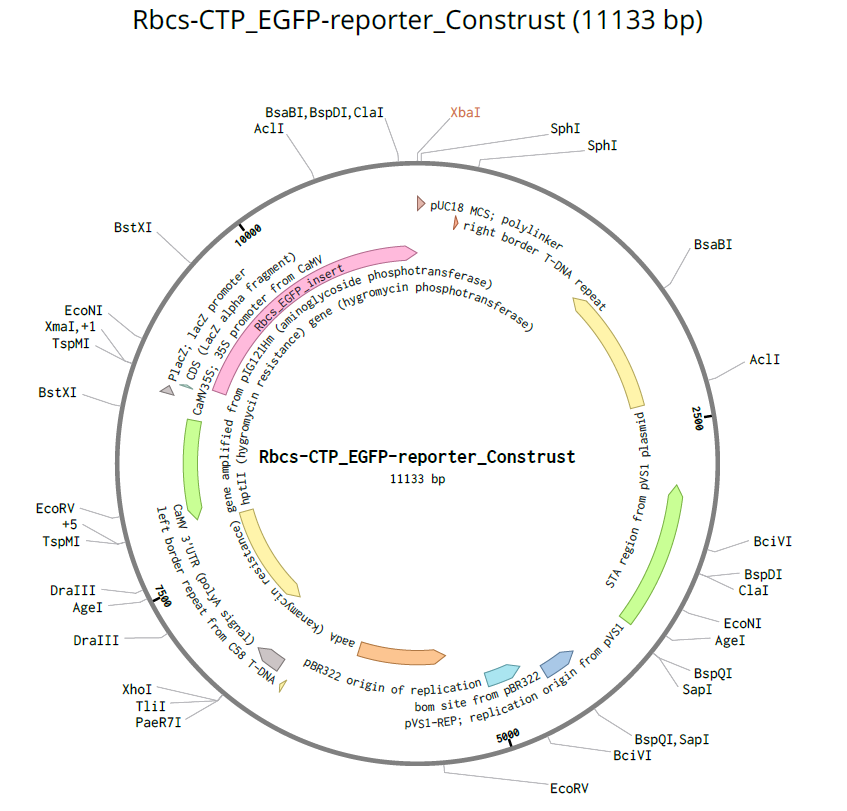
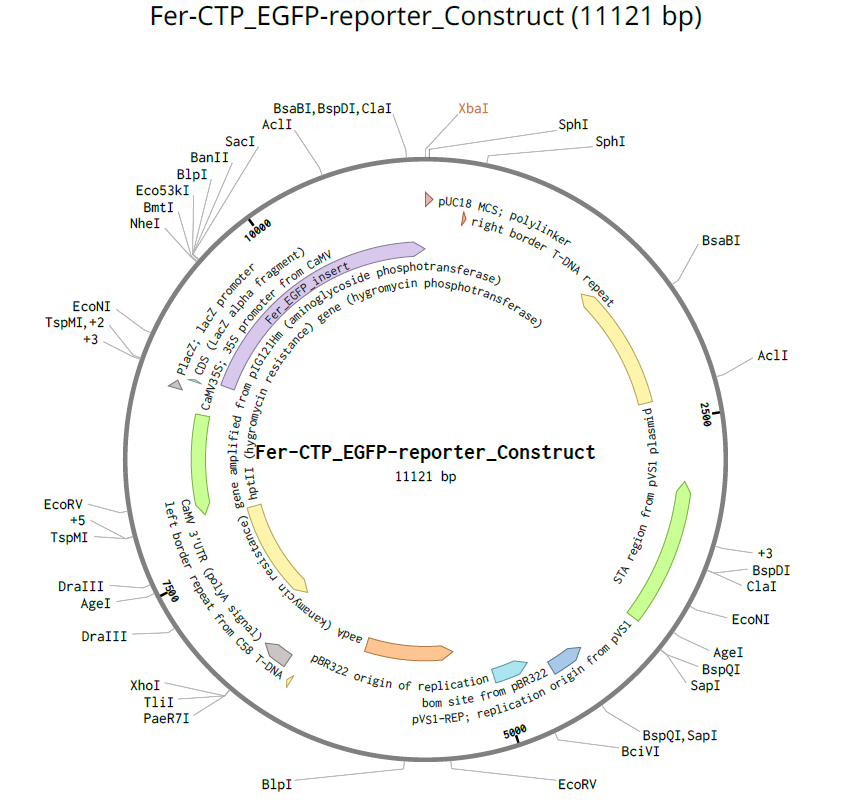
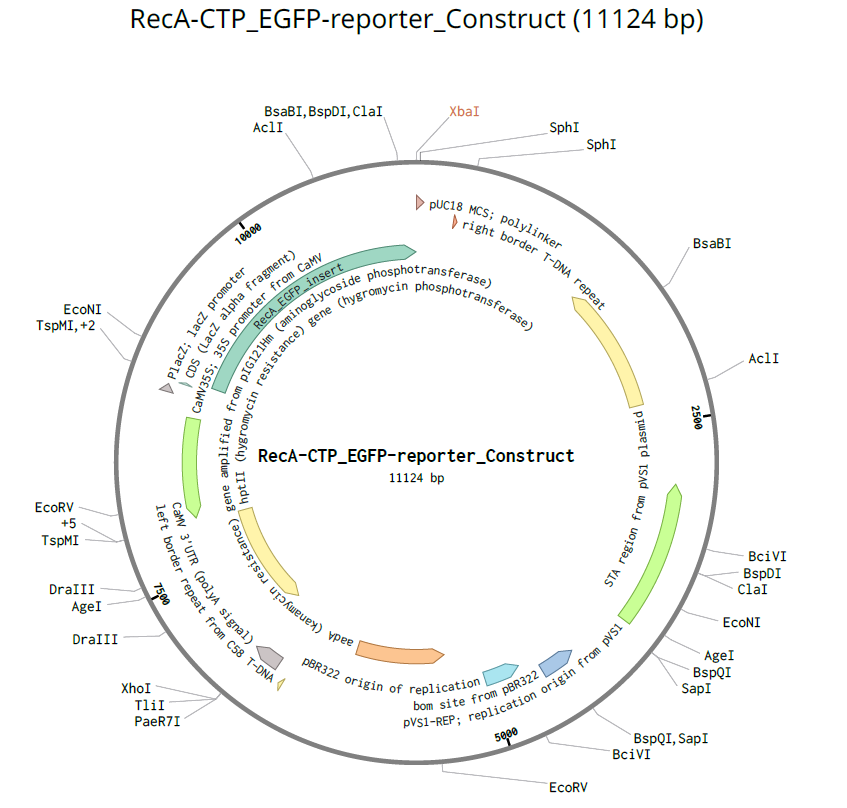
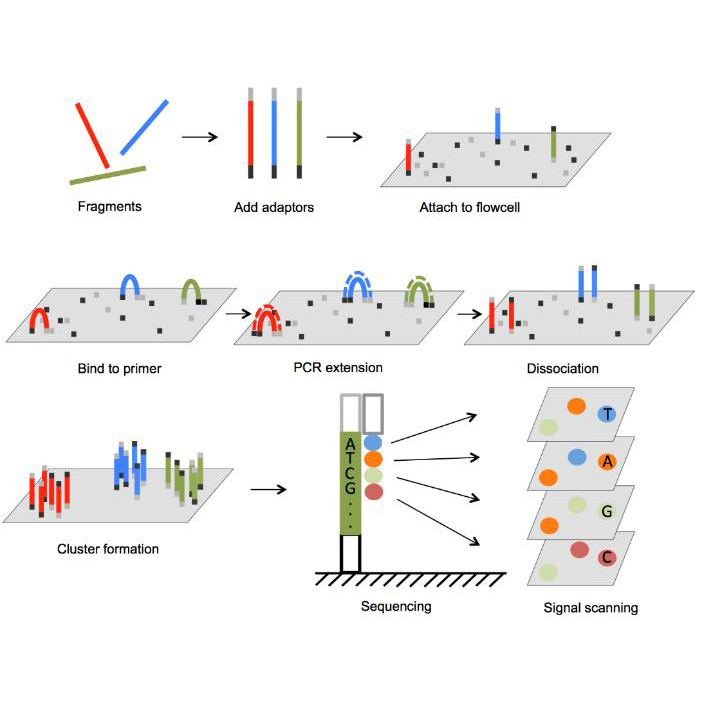