Week 10 HW: Imaging and Measurement
We will analyze an eGFP standard on a Waters Xevo G3 QTof MS system to determine the molecular weight of intact eGFP and observe its charge state distribution in the native and denatured (unfolded) states. The conditions for LC-MS analysis of intact protein cause it to unfold and be detected in its denatured form (due to the solvents and pH used for analysis).
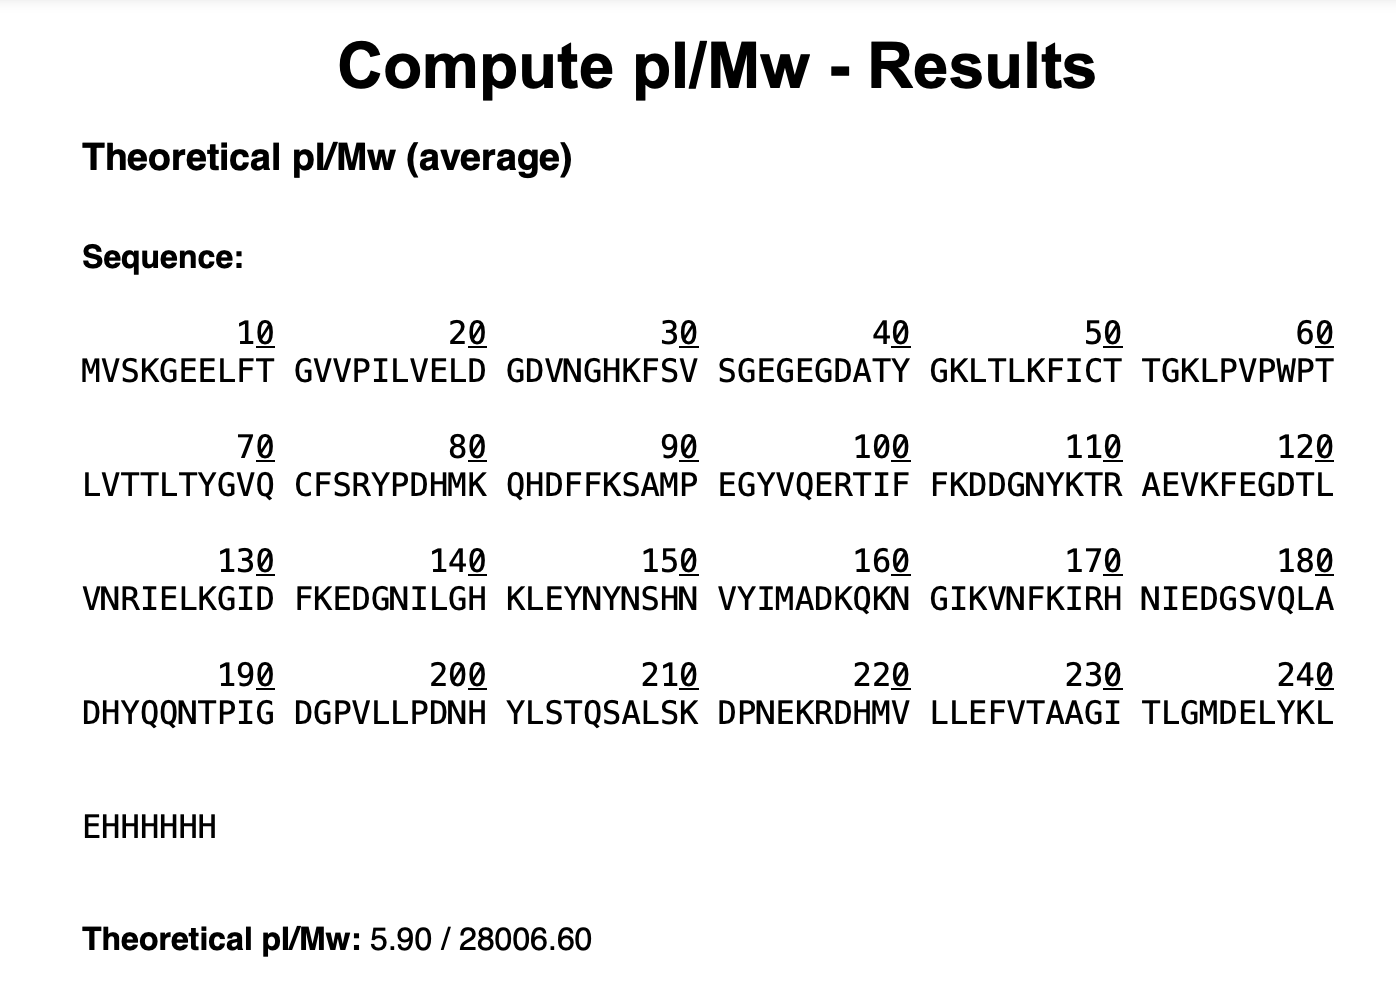
1. Based on the predicted amino acid sequence of eGFP (see below) and any known modifications, what is the calculated molecular weight? You can use an online calculator like the one at https://web.expasy.org/compute_pi/
GFP Sequence
MVSKGEELFTG VVPILVELDG DVNGHKFSVS GEGEGDATYG KLTLKFICTT GKLPVPWPTL VTTLTYGVQC FSRYPDHMKQ HDFFKSAMPE GYVQERTIFF KDDGNYKTRA EVKFEGDTLV NRIELKGIDF KEDGNILGHK LEYNYNSHNV YIMADKQKNG IKVNFKIRHN IEDGSVQLAD HYQQNTPIGD GPVLLPDNHY LSTQSALSKD PNEKRDHMVL LEFVTAAGIT LGMDELYKLE HHHHHHNote: This contains a His-purification tag (HHHHHH) and a linker (the LE before it).
MW = 28006.60 - 20.04 Da (chromophore maturation)
∴ MW = 27986.56 Da
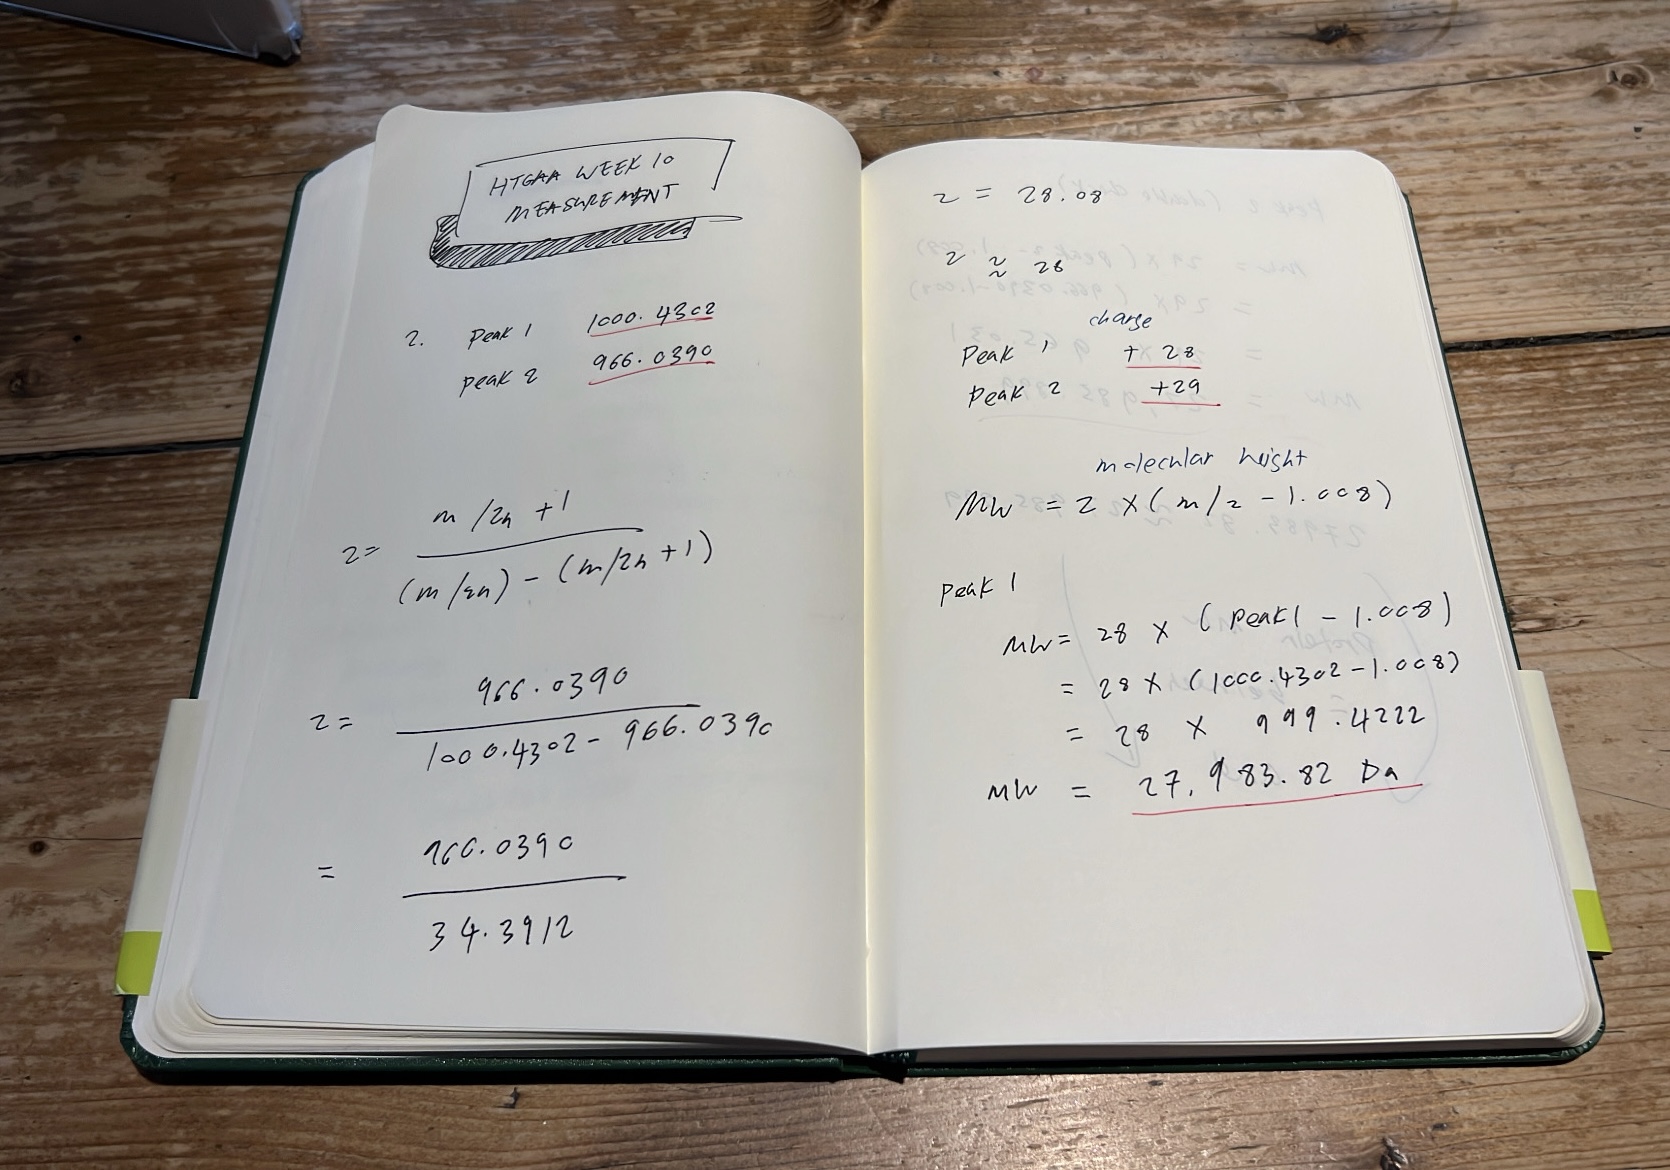
2. Calculate the molecular weight of the eGFP using the adjacent charge state approach described in the recitation.
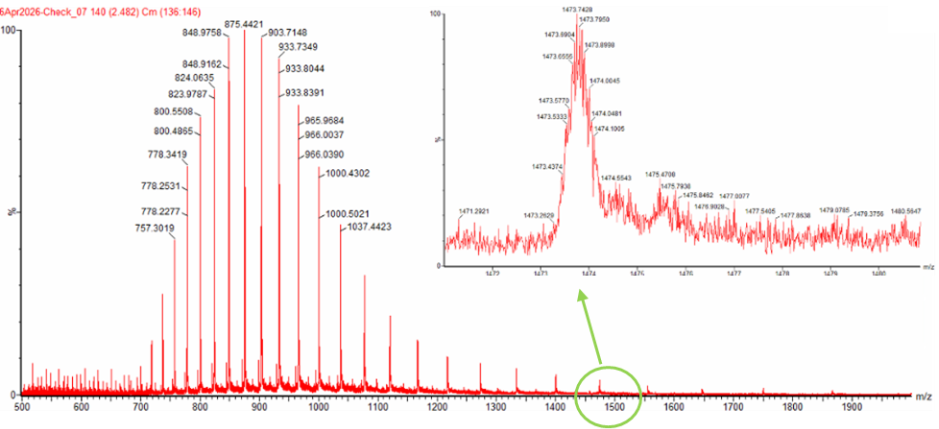
Select two charge states from the intact LC-MS data (Figure 1) and: a. Determine z for each adjacent pair of peaks
Peak 1: 1000.4302
Peak 1 z = +28
Peak 2: 966.0390 Peak 2 z = +29
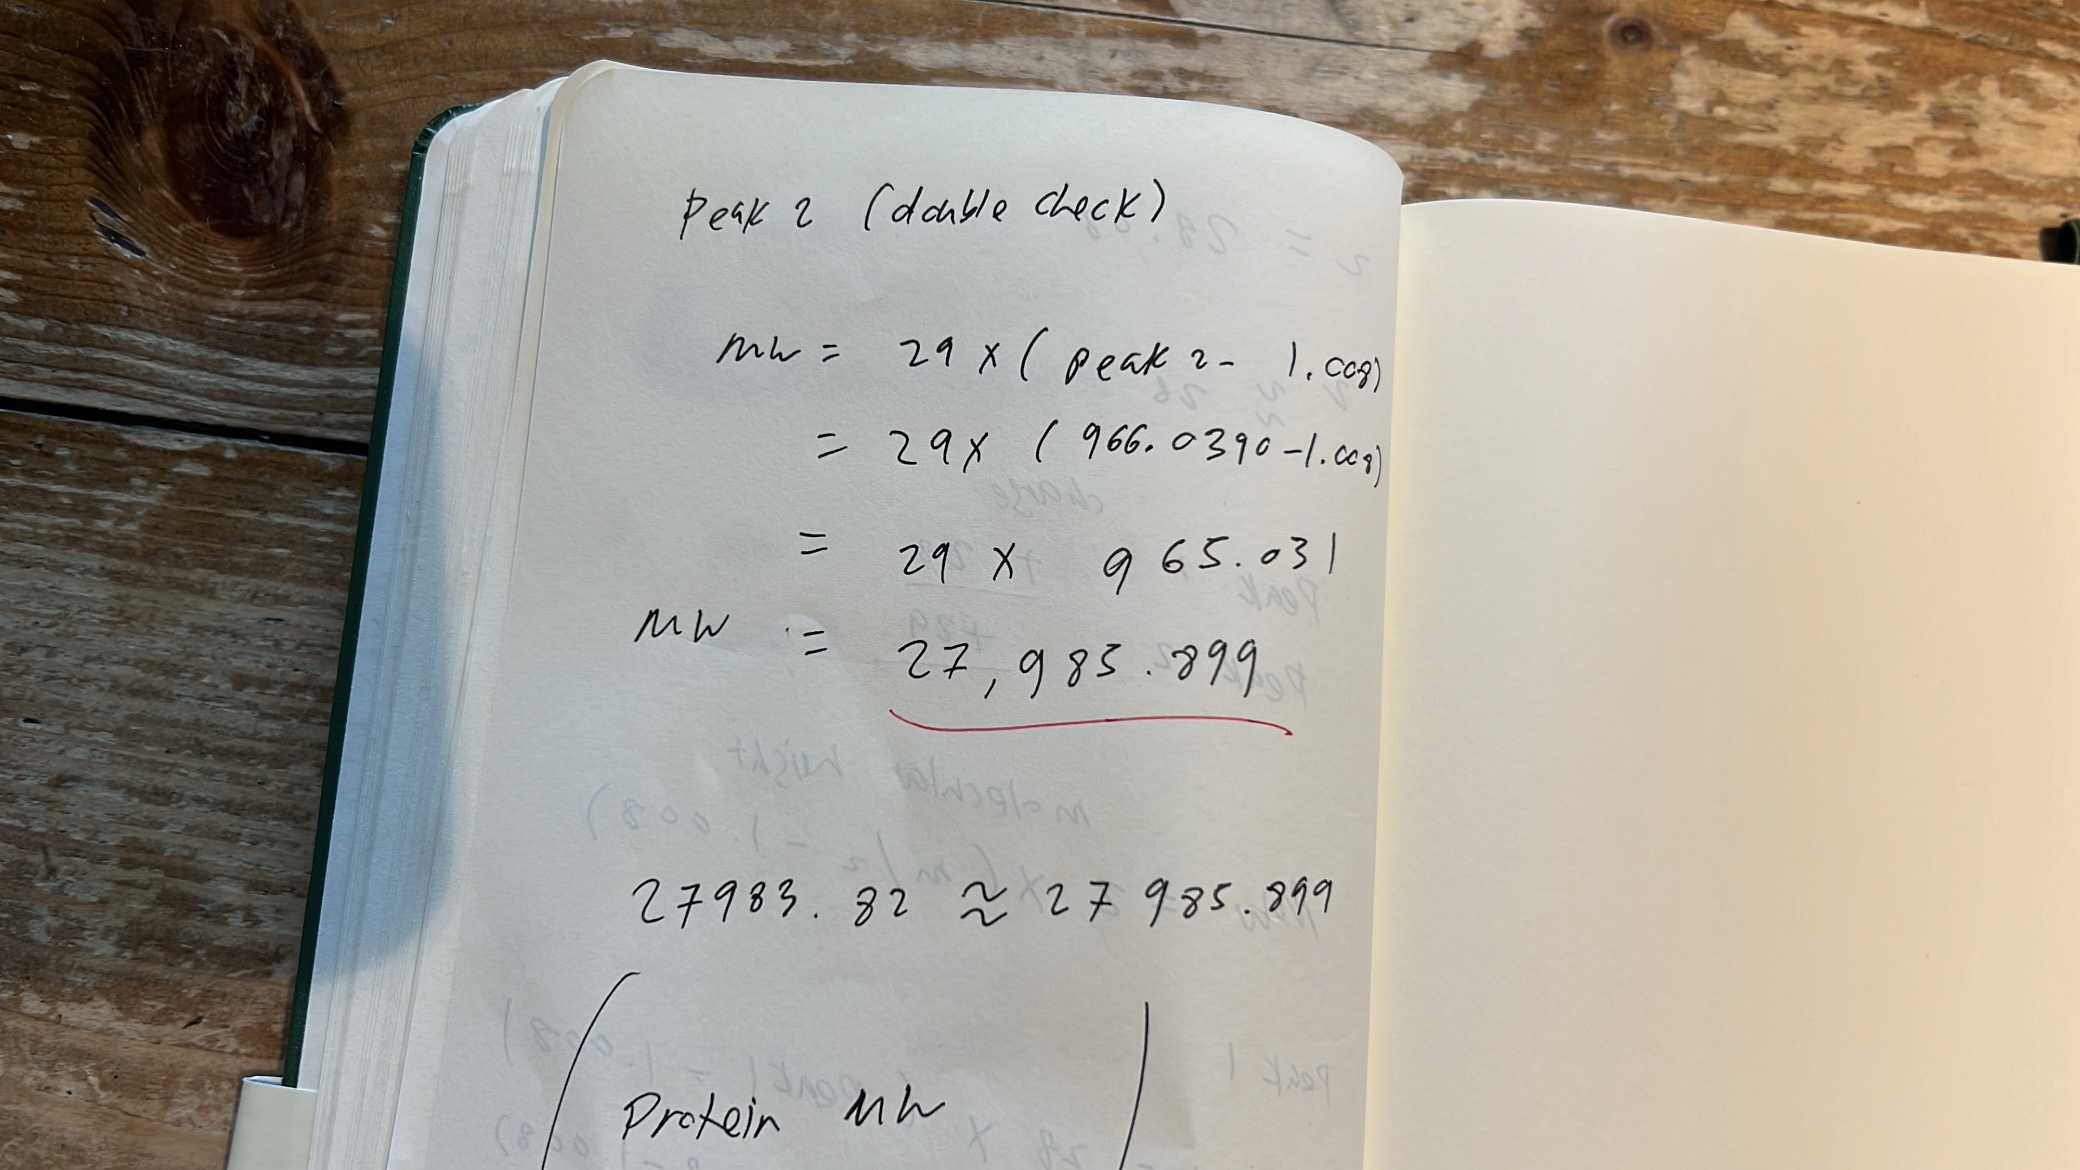
b. Determine the MW of the protein
MW of protein is 27983.82
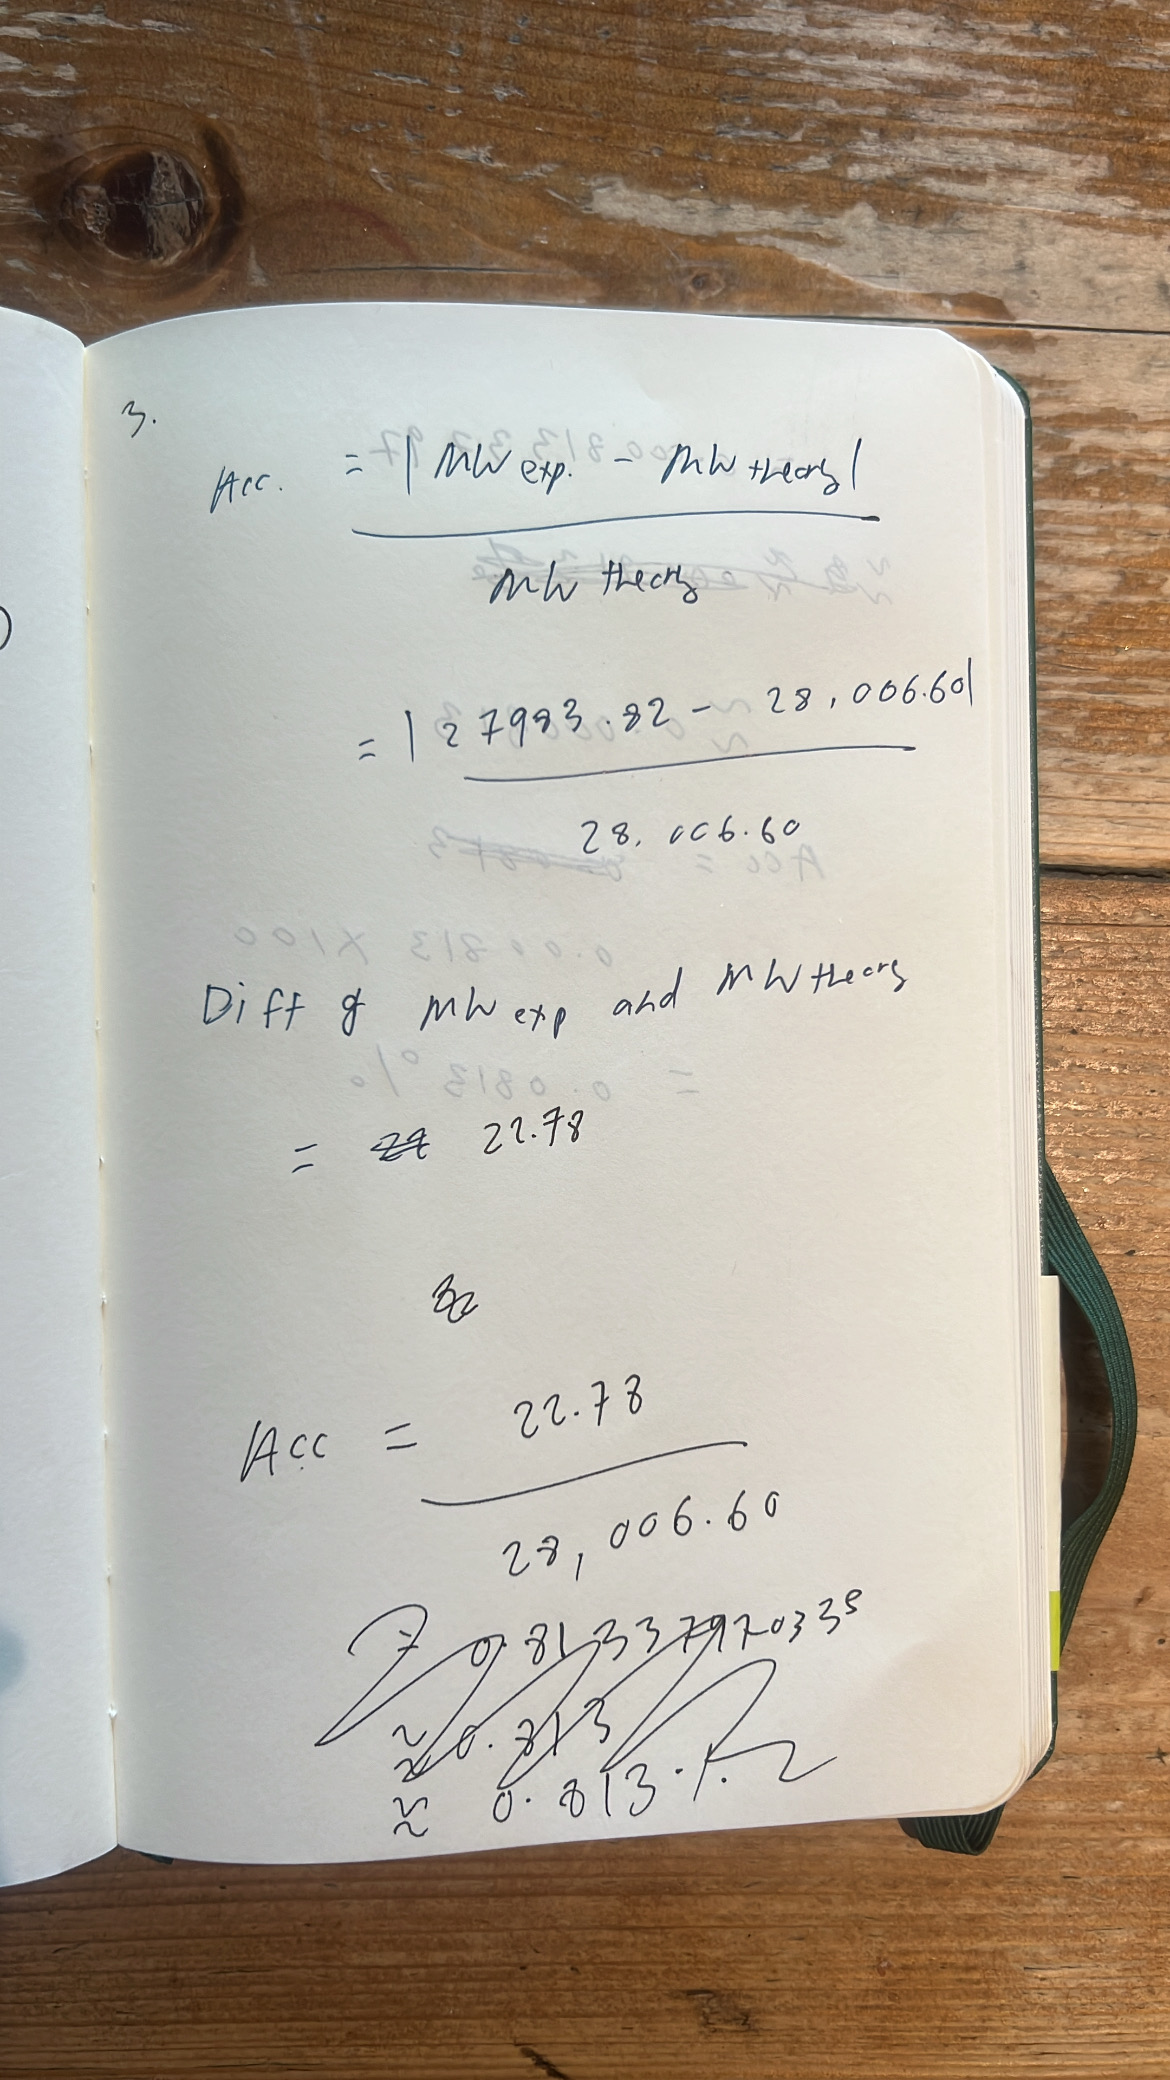
c. Calculate the accuracy of the measurement using the deconvoluted MW from 2.2 and the predicted weight of the protein from 2.1
Accuracy error when using 28006.60 Da value = 0.0813%
Accuracy error when accounting for loss of 20 Da (27986.56) = 0.01%
3. Can you observe the charge state for the zoomed-in peak in the mass spectrum for the intact eGFP? If yes, what is it? If no, why not?
No. Matter of resolution.
We will analyze eGFP in its native, folded state and compare it to its denatured, unfolded state on a quadrupole time-of-flight MS. We will be doing MS-only analysis (no liquid chromatography, also known as “direct infusion” experiments) on the Waters Xevo G3-QToF MS.
1. Based on learnings in the lab, please explain the difference between native and denatured protein conformations. For example, what happens when a protein unfolds? How is that determined with a mass spectrometer? What changes do you see in the mass spectrum between the native and denatured protein analyses (Figure 2)?
If I recall correctly (from my school days omg) a native protein is one that had a fully functional tertiary [and quarternary] structure. Its active/binding site is complementary to a substrate, thus enabling catalytic reactions. However, a protein that is denatured is one that does not have a fully functional tertiary [or quarternary] structure, thus its active site cannot bind to a substrate. Denaturation is more often than not an irreversible process, and can be caused by heat or chemical reactions.
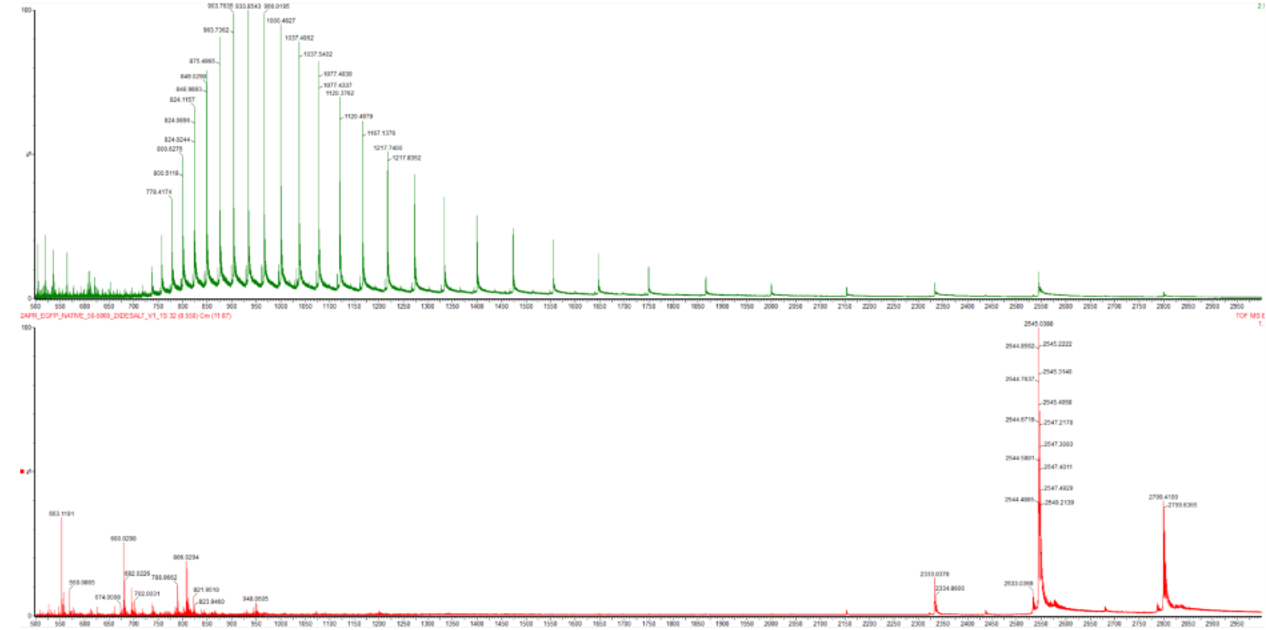
As you can see, the top denatured protein represented by green, shows a spectrum characterised by a broad distribution of many intense peaks. There are all shifted towards lower m/z values. These are mainly distributed between 800 and 1300 m/z. The reason for this is because when a protein is denatured, it essentially unfolds, thus exposing many previously unexposed basic residues which protons can attach to, causing a high m/z peak distribution.
Whereas the bottom native protein represented by red is vastly more simple with far fewer peaks. However, of the peaks it does have, its major ones have considerably higher m/z values at 2545 and 2790 respectively. The reason for there being a lesser distribution of peaks with those that do exist generally having a high m/z is because a native protein exists in a compact folded globular state. The vast mojority of its basic residues are hidden.
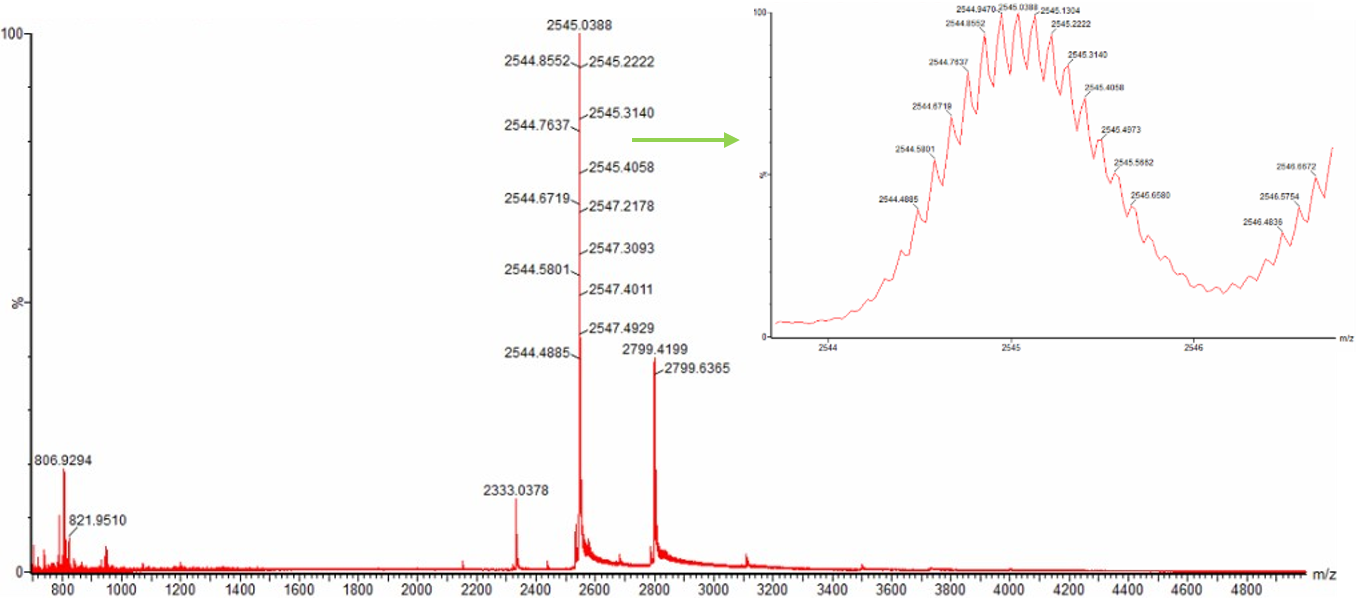
2. Zooming into the native mass spectrum of eGFP from the Waters Xevo G3 QTof MS (see Figure 3), can you discern the charge state of the peak at ~2800? What is the charge state? How can you tell?
We will digest the eGFP protein standard into peptides using trypsin (an enzyme that selectively cleaves the peptide bond after Lysine (K) and Arginine (R) residues. The resulting peptides will be analyzed on the Waters BioAccord LC-MS to measure their molecular weights and fragmented to confirm the amino acid sequence within each peptide – generating a “peptide map”. This process is used to confirm the primary structure of the protein.
There are a variety of tools available online to calculate protein molecular weight and predict a list of peptides generated from a tryptic digest. We will be using tools within the online resource Expasy (the bioinformatics resource portal of the Swiss Institute of Bioinformatics (SIB)) to predict a list of tryptic peptides from eGFP.
1. How many Lysines (K) and Arginines (R) are in eGFP? Please circle or highlight them in the eGFP sequence given in Waters Part I question 1 above. (Note: adding the sequence to Benchling as an amino acid file and clicking biochemical properties tab will show you a count for each amino acid).
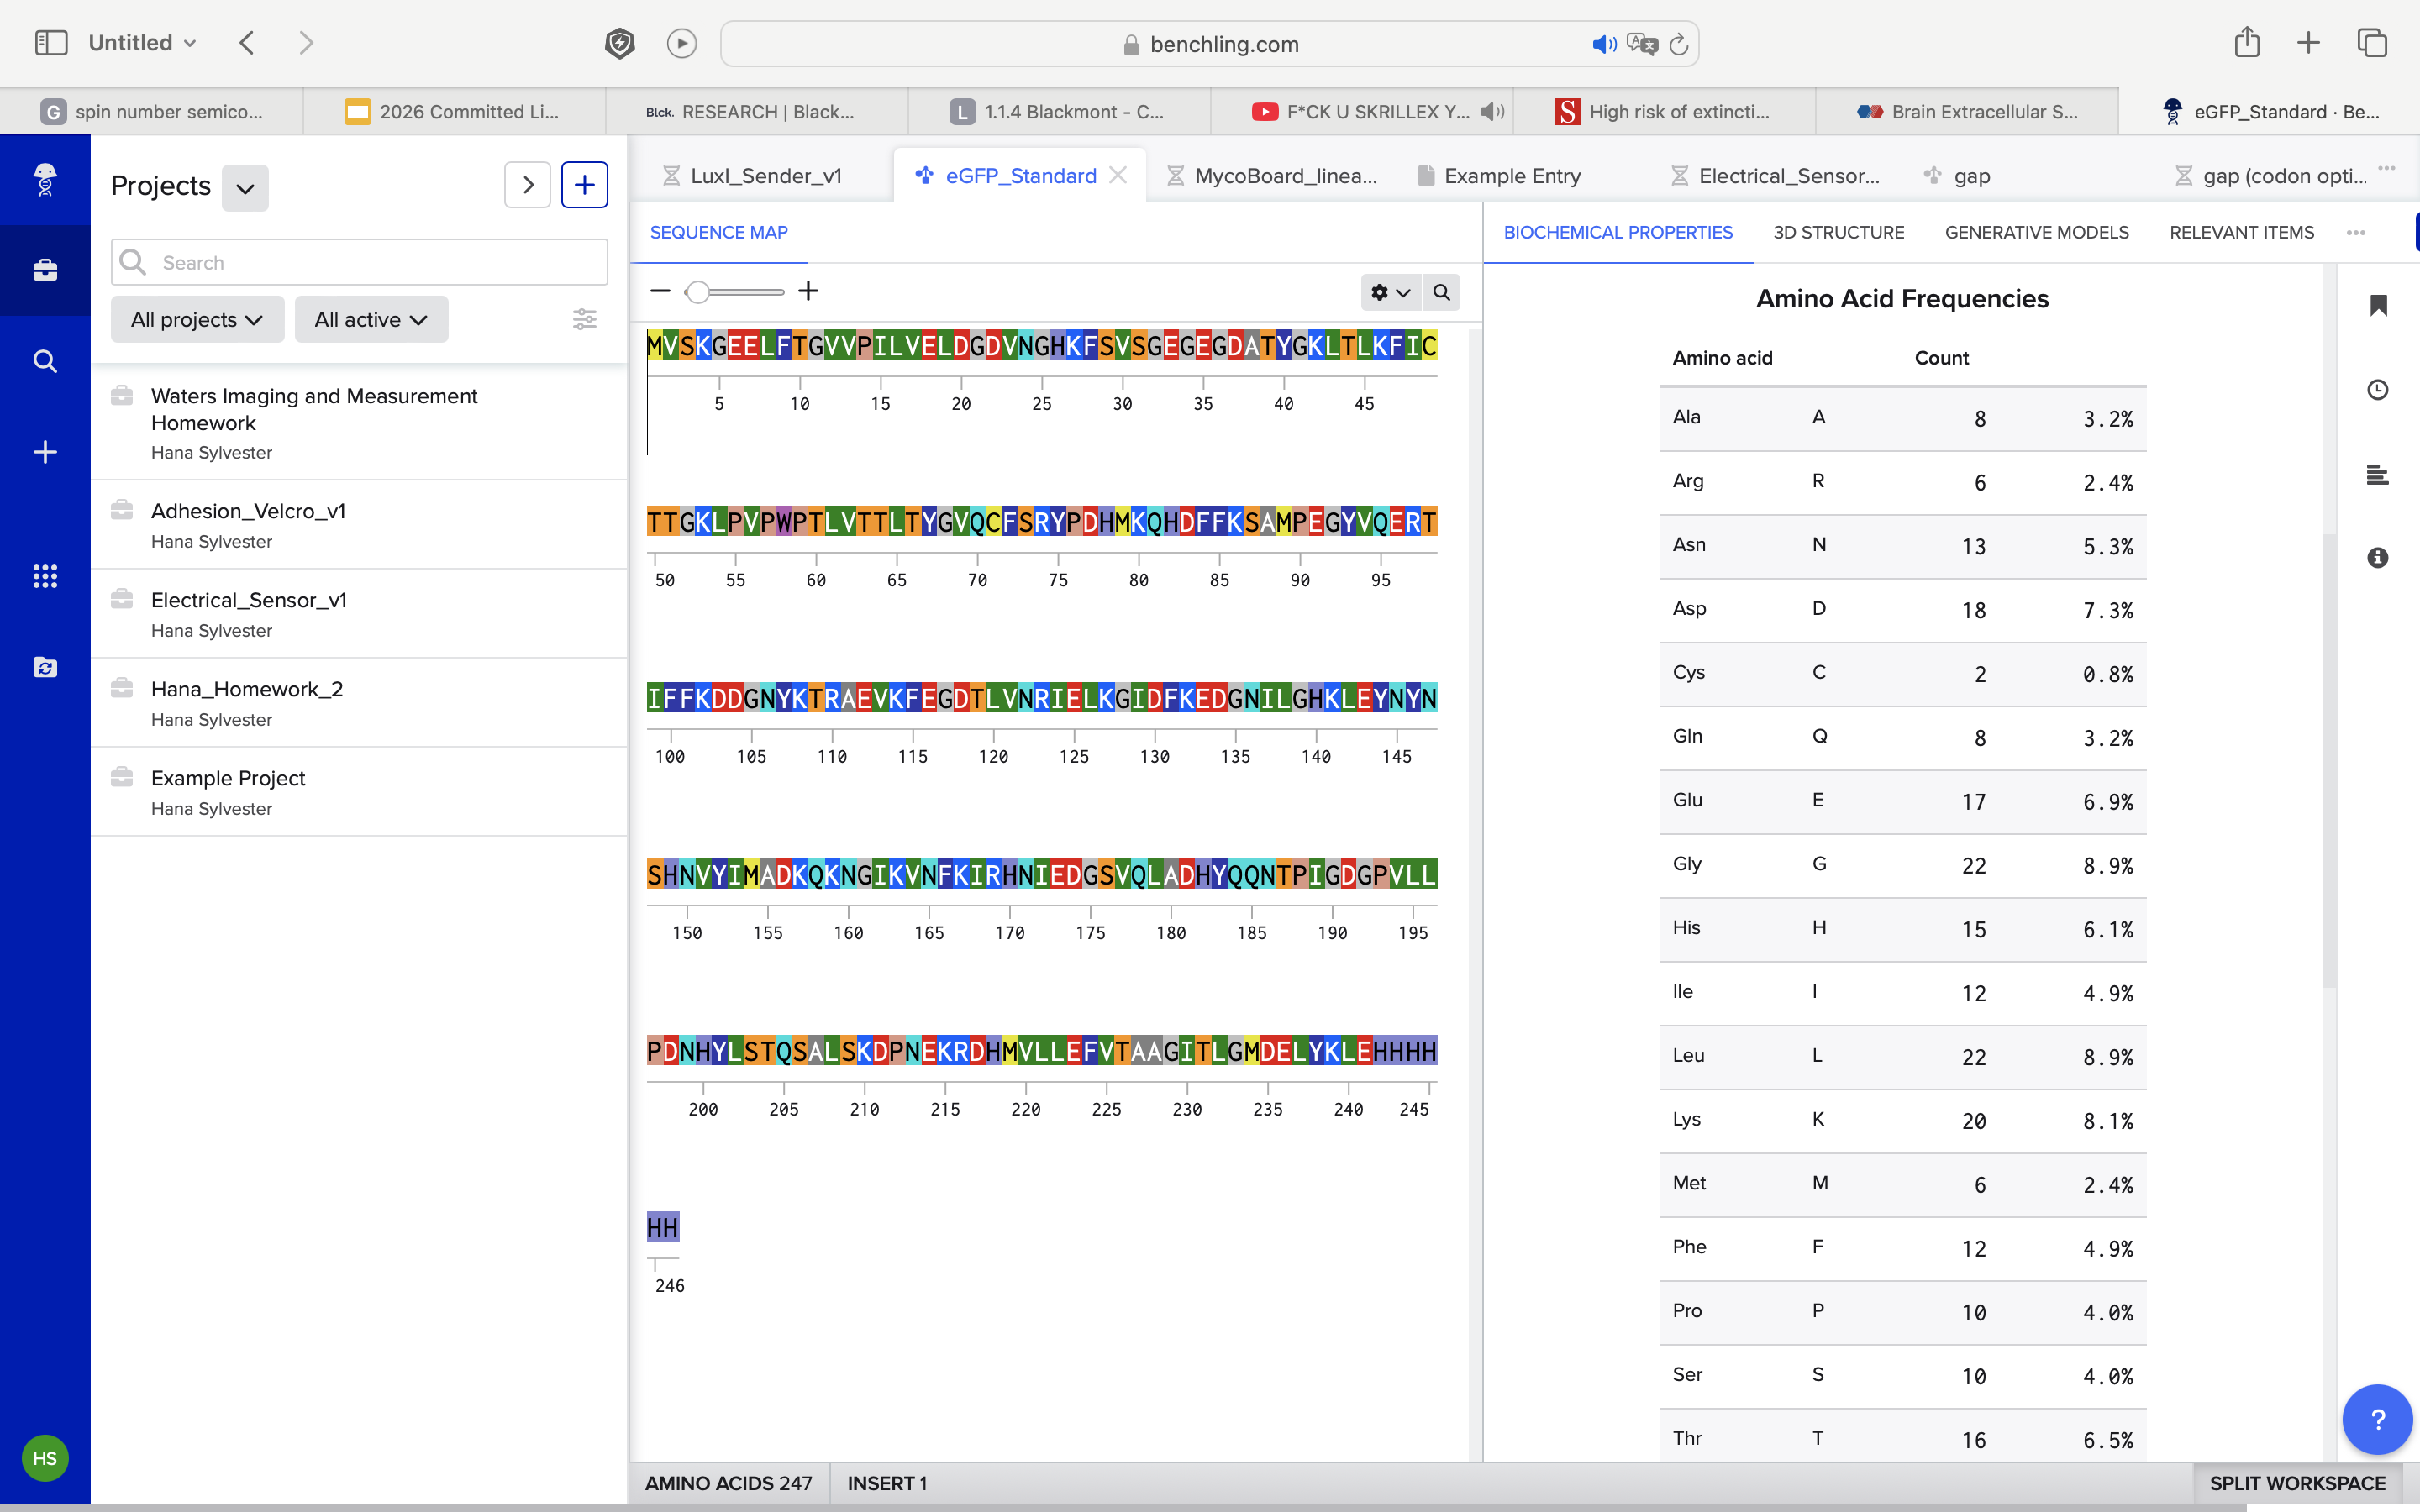
As you can see in the photo
K: 20 (3.2%)
R: 6 (2.4%)
Here is that represented in a table
| Amino Acid | Symbol | Count | Percentage (%) | Role |
|---|---|---|---|---|
| Lysine | K | 20 | 3.2% | Tryptic Cleavage Site |
| Arginine | R | 6 | 2.4% | Tryptic Cleavage Site |
| Total Sites | 26 | 5.6% | Cleavage Potential |
KLTLKFICTT GKLPVPWPTL VTTLTYGVQC FSRYPDHMKQ
HDFFKSAMPE GYVQERTIFF KDDGNYKTRA EVKFEGDTLV
NRIELKGIDF KEDGNILGHK LEYNYNSHNV YIMADKQKNG
IKVNFKIRHN IEDGSVQLAD HYQQNTPIGD GPVLLPDNHY LSTQSALSKD
PNEKRDHMVL LEFVTAAGIT LGMDELYKLE HHHHHH
2. How many peptides will be generated from tryptic digestion of eGFP?
Initially I counted 26 cuts which I thought meant 27 peptides as trypsin cleaves after lysine (K) and Arginine (R), both of which are highlighted above. The fact that K and R are next to each other confused me at first but then I realised that one peptide would be one residue long - simply R.
Then I saw that we were meant to use the Expasy PeptideMass tool.
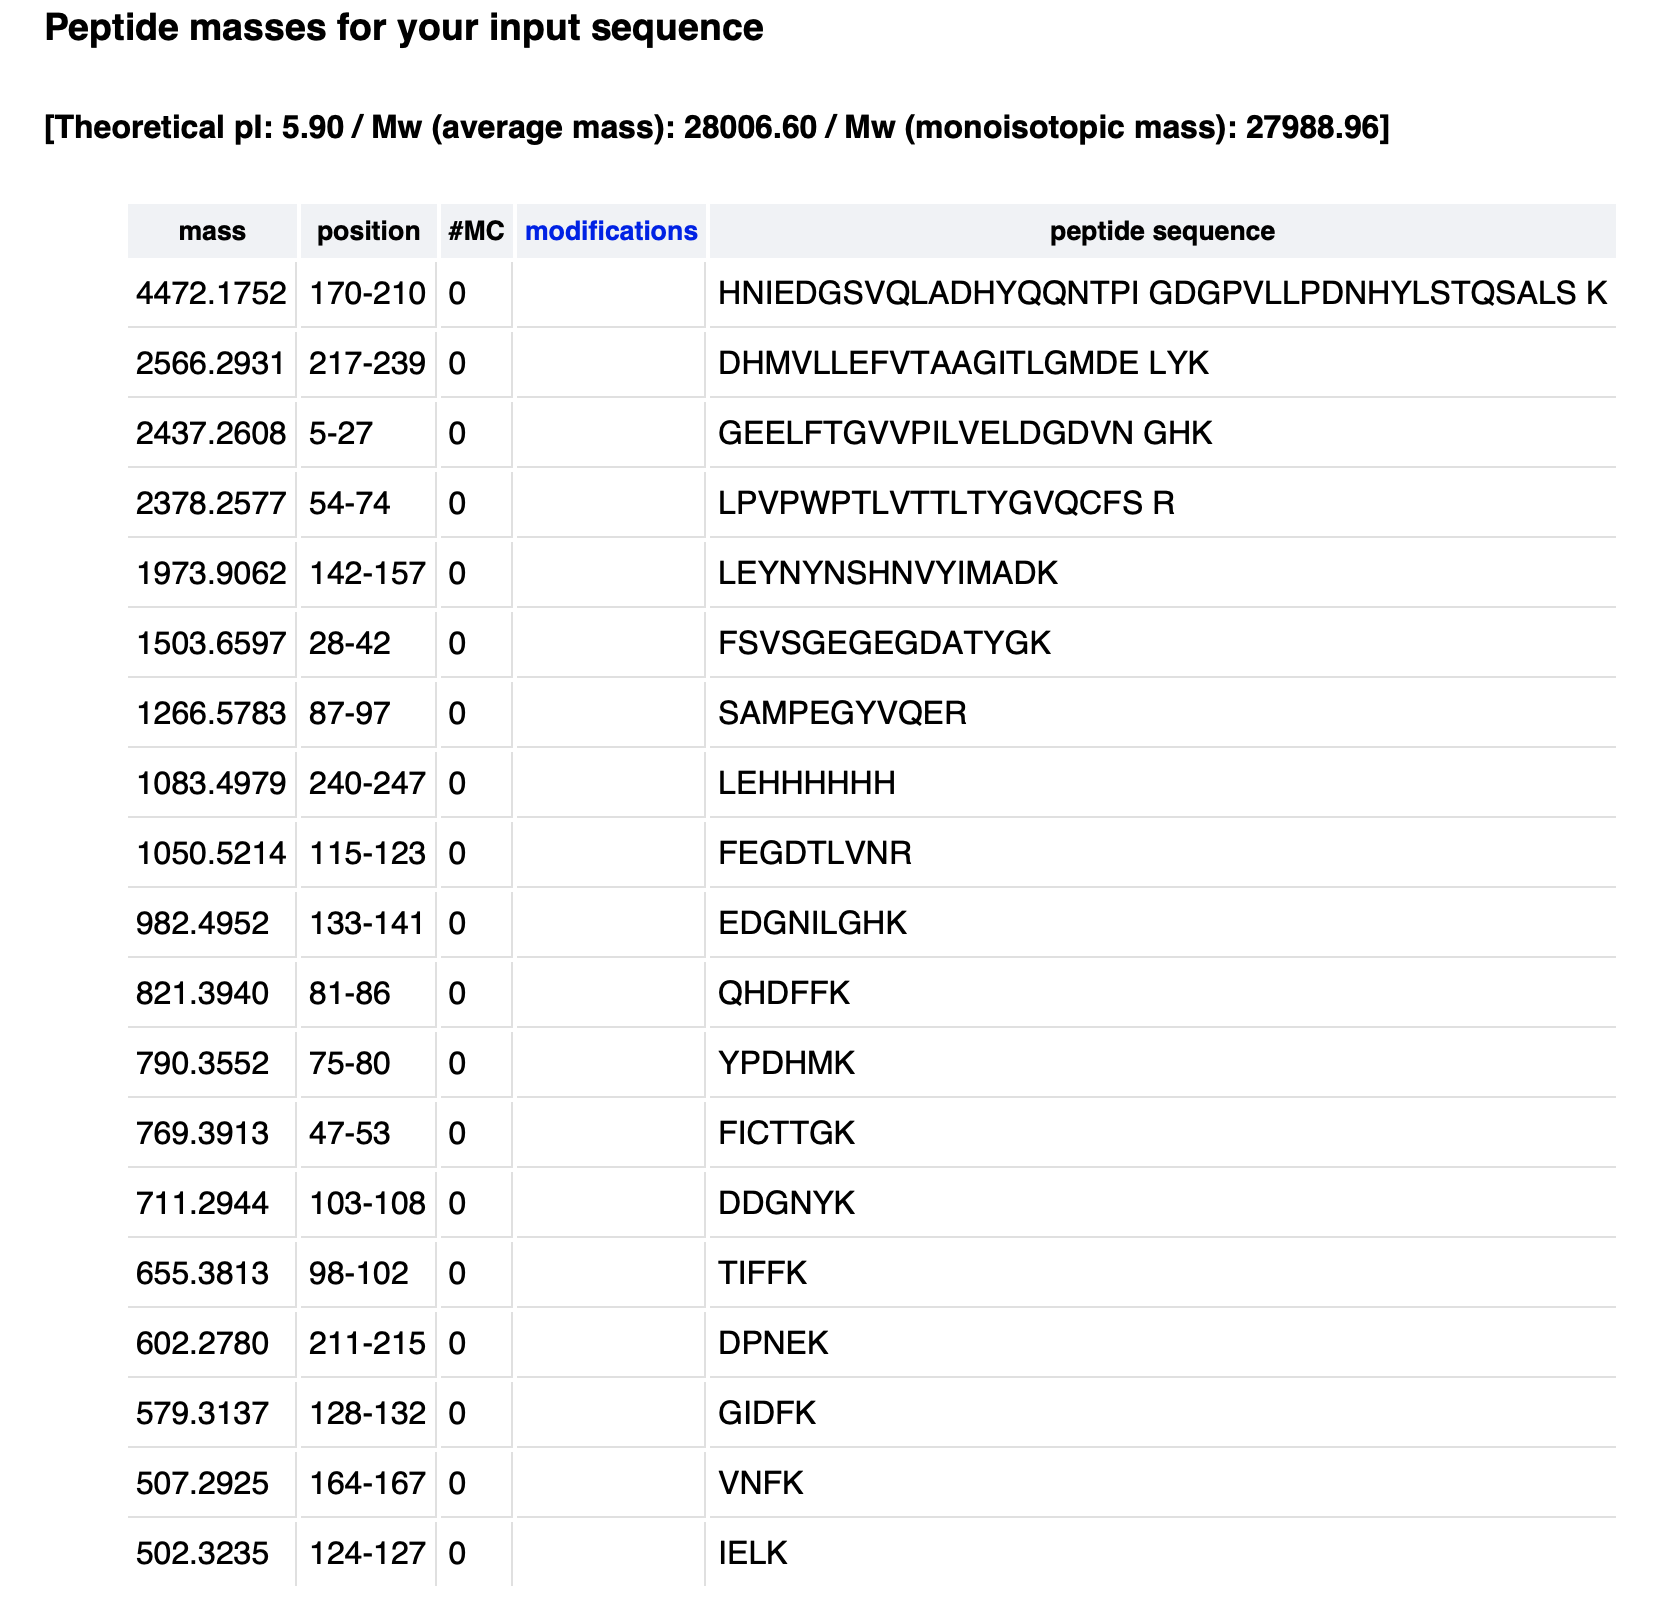
On Expasy I adjusted the parameters as instructed in Figure 4. Expasy counted 19 peptides (with a mass bigger than 500 Da).
Then I toggled an option in the Output section so that Expasy would display all peptides with a mass greater than 0 Da. It showed 27 peptides as expected.
This means that 8 peptides had a mass < 500 Da.
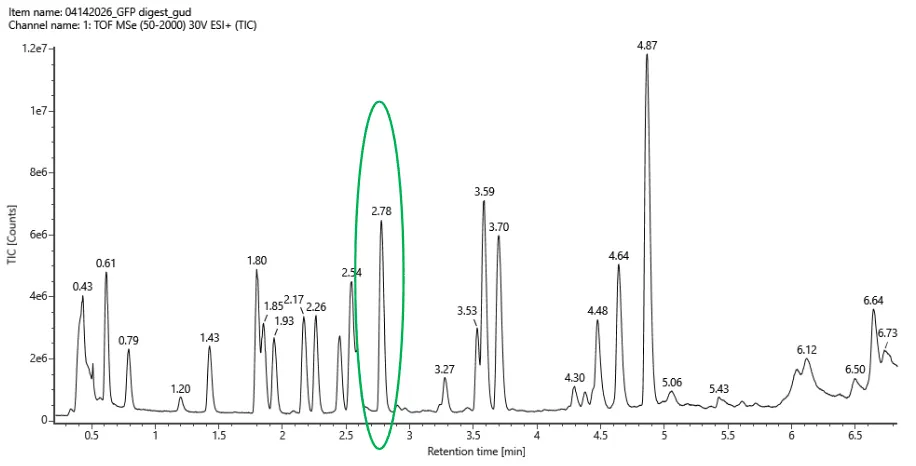
3. Based on the LC-MS data for the Peptide Map data generated in lab (please use Figure 5a as a reference) how many chromatographic peaks do you see in the eGFP peptide map between 0.5 and 6 minutes? You may count all peaks that are >10% relative abundance
Ok let’s look.
Incorrectly, I calculated the relative abundance using time: 4.9. 10% of that is 0.49 TIC. I counted 21 peaks labelled with a value above this this within the 0.5 and 6 minute tine frame.
So silly of me! I discovered my error when I started working on question 5 having looked at Figure 5b.
Ok looking at Figure 5a again, the highest peak occurs at 4.87 minutes and has a TIC of 1.08e7 (10,800,000). 10% of that is 0.108e7. I counted 18 then 19 peaks.
4. Assuming all the peaks are peptides, does the number of peaks match the number of peptides predicted from question 2 above? Are there more peaks in the chromatogram or fewer?
The Expasy tool predicted 27 peptides, but 8 of these had a mass < 500 Daltons. It predicted there would be 19 peptides with a mass > 500 Daltons.
First I mistakenly counted 21 peaks within 0.5 and 6 minutes.
Then I counted 19. This fits with the expasy prediction of 19 peptides (with a mass > 500 Daltons)! Woah. Not sure if this is right however 😿.
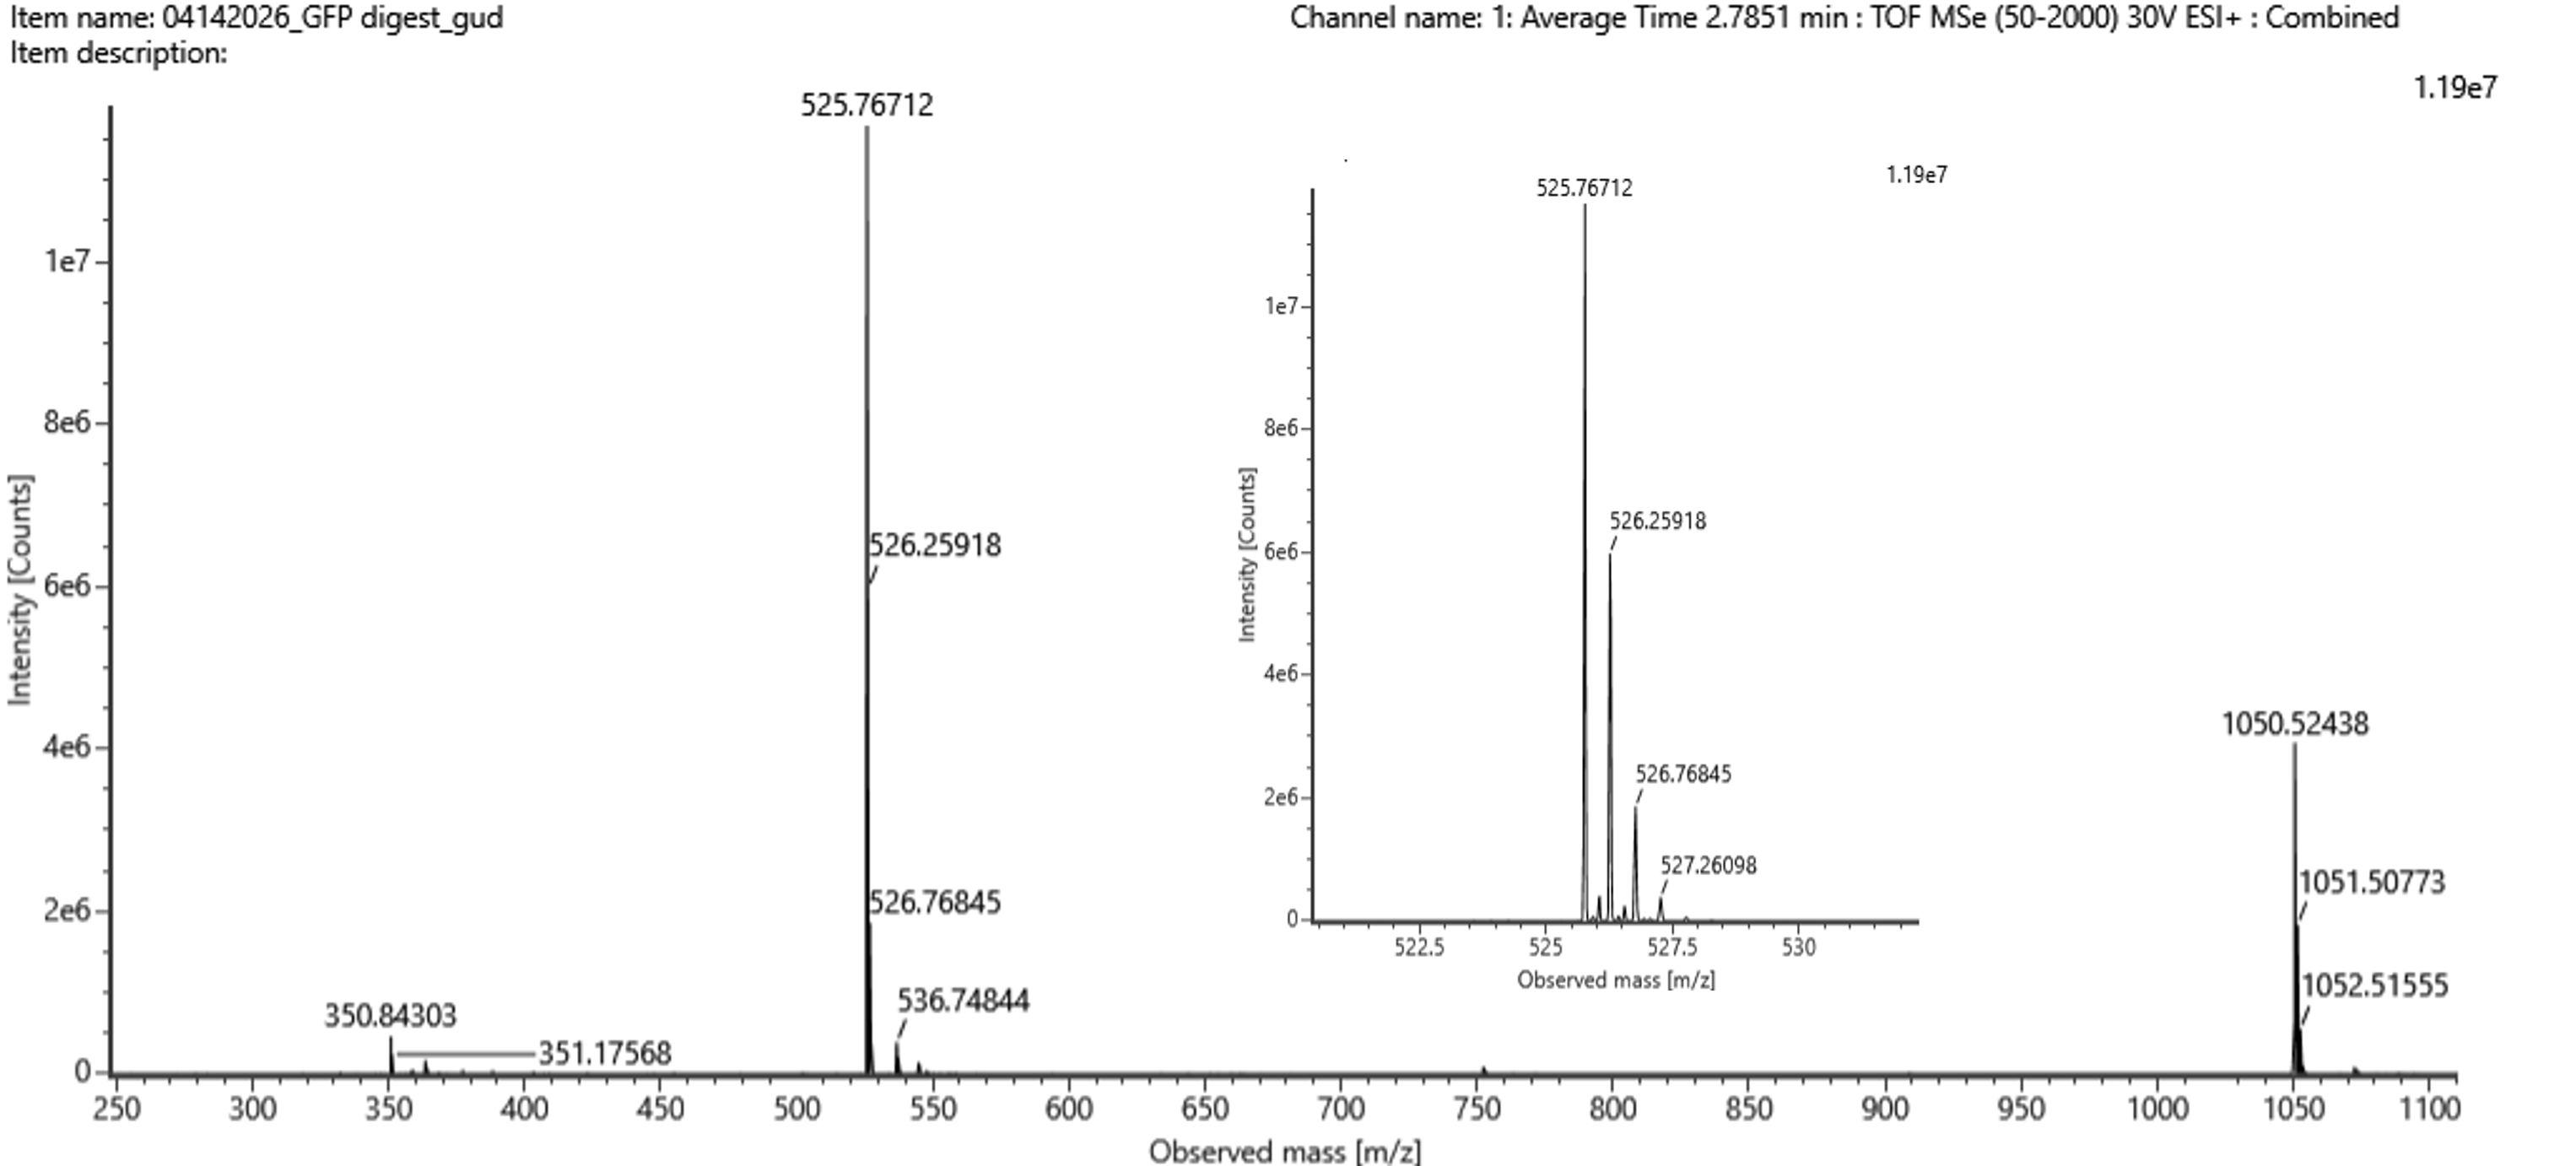
5. Identify the mass-to-charge of the peptide shown in Figure 5b. What is the charge (z) of the most abundant charge state of the peptide (use the separation of the isotopes to determine the charge state). Calculate the mass of the singly charged form of the peptide
To help me answer this question I used this Guide to Calculating Molecular Mass by Ohio State University.
Peak 1 = 525.76712
Peak 2 = 526.25918
Let’s calculate the difference between the two peaks . . .
Δ (m/z)= 526.25918−525.76712 = 0.49206 ≈ 0.5
Δ (m/z) = 1/z
0.5 = 1/z ∴ z = 2
The charge state = 2
Mass ≈ 1049.52 Da.
6. Identify the peptide based on comparison to expected masses in the PeptideMass tool.
Peptide sequence: FEGDTLVNR.
7. What is the percentage of the sequence that is confirmed by peptide mapping? (see Figure 6)
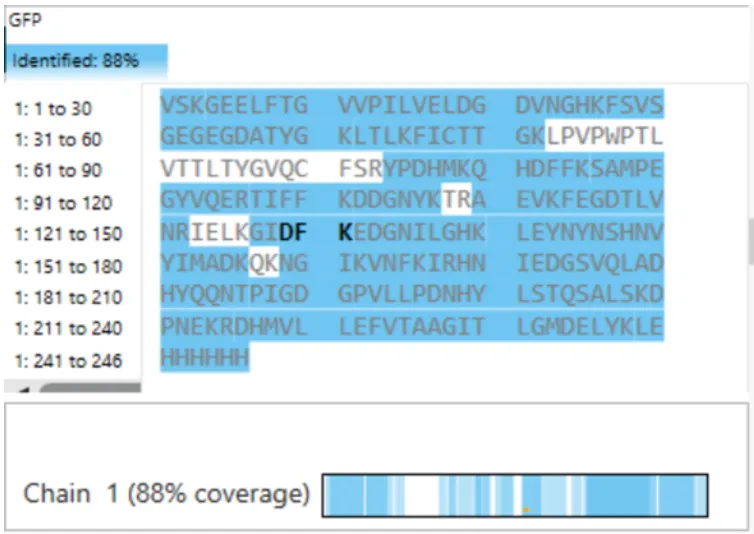
88%.