Week 10 HW: Imaging & Measurement
Final Project
- Identify at least one aspect of your project that you will measure (mass/sequence of a protein, presence/absence/quantity of a biomarker, etc.).
The mass and sequence of the CBM27_RGD_MaSp1_4x fusion protein, and its binding interaction with Tremella fuciformis polysaccharide.
Describe all of the elements you would like to measure and how you will perform these measurements.
Three things to measure: the molecular weight of the expressed fusion protein (~37 kDa), its amino acid sequence to confirm correct expression, and its binding to Tremella mannan polysaccharide via a polysaccharide binding assay.
What technologies will you use (e.g., gel electrophoresis, DNA sequencing, mass spectrometry)? Describe in detail.
SDS-PAGE to confirm the protein expressed at the correct size (~37 kDa). Mass spectrometry as per below to confirm the exact molecular weight and primary sequence via peptide mapping. A polysaccharide binding assay to confirm the CBM27 domain binds correctly to Tremella mannan.
Waters Part 1 — Molecular Weight
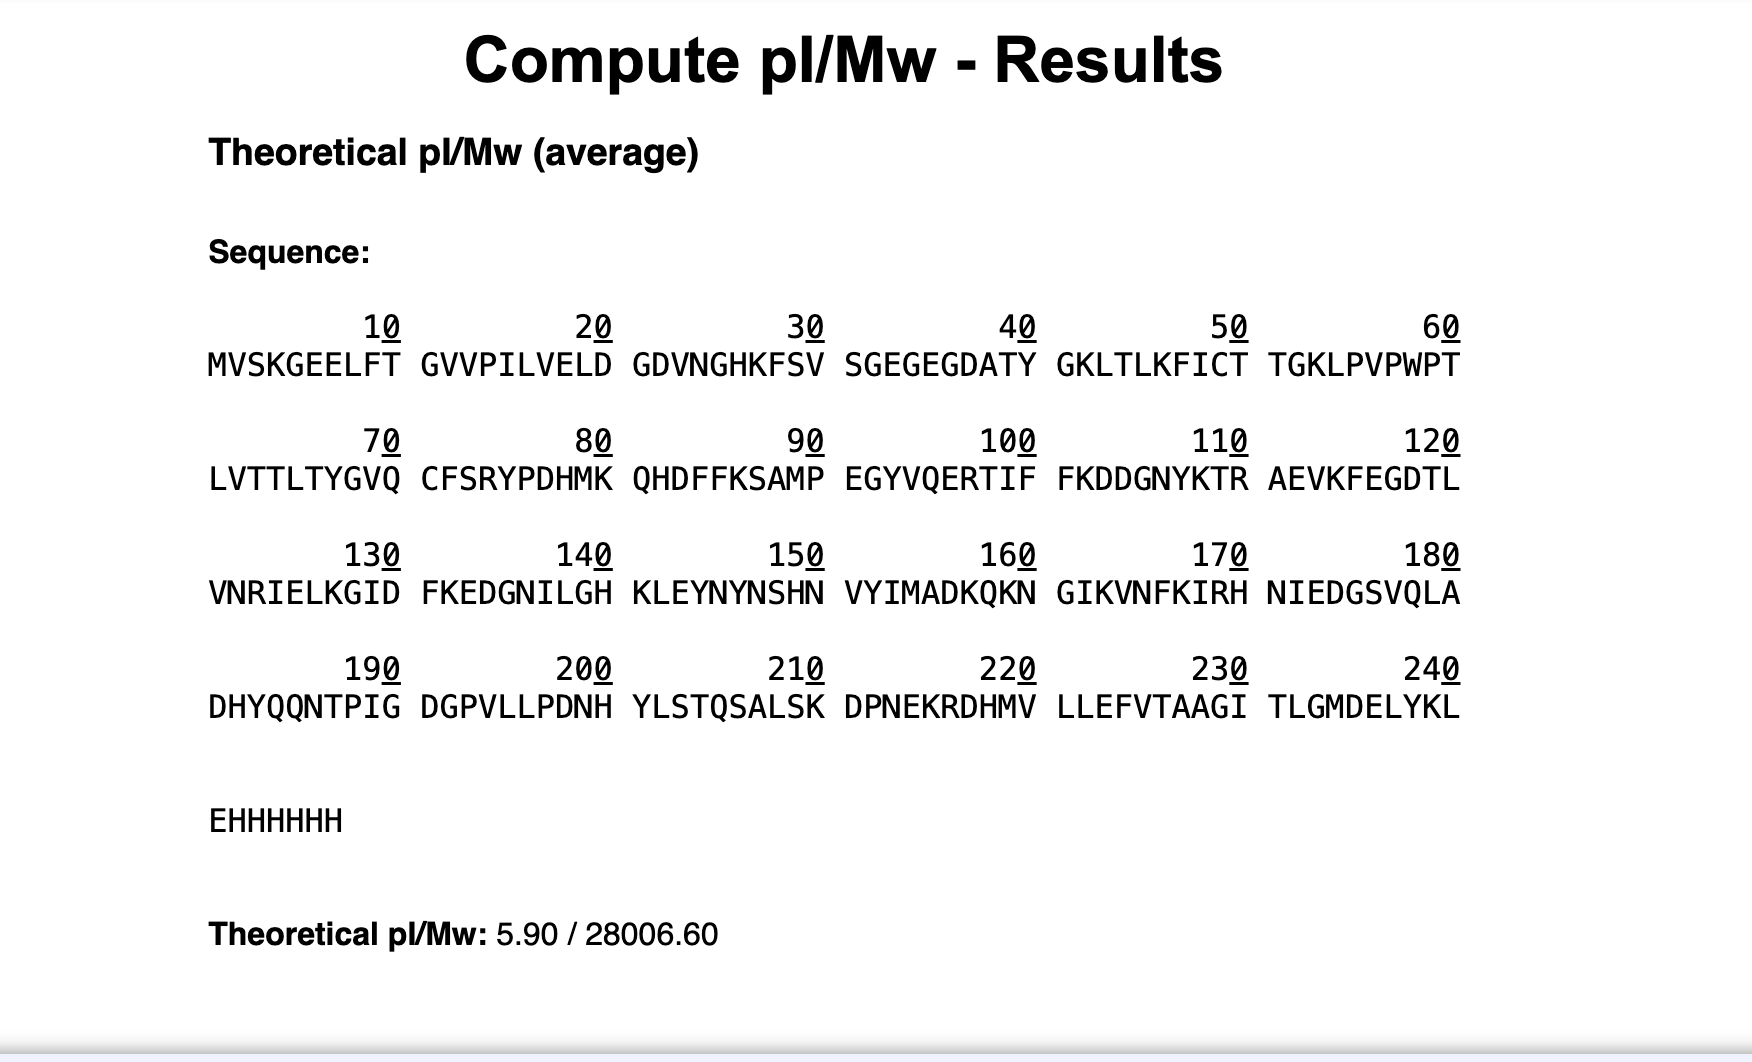
- Based only on the predicted amino acid sequence of eGFP, what is the calculated molecular weight?
Based on the predicted amino acid sequence of eGFP (including the His-tag and LE linker), the calculated average molecular weight is 28,006.60 Da.
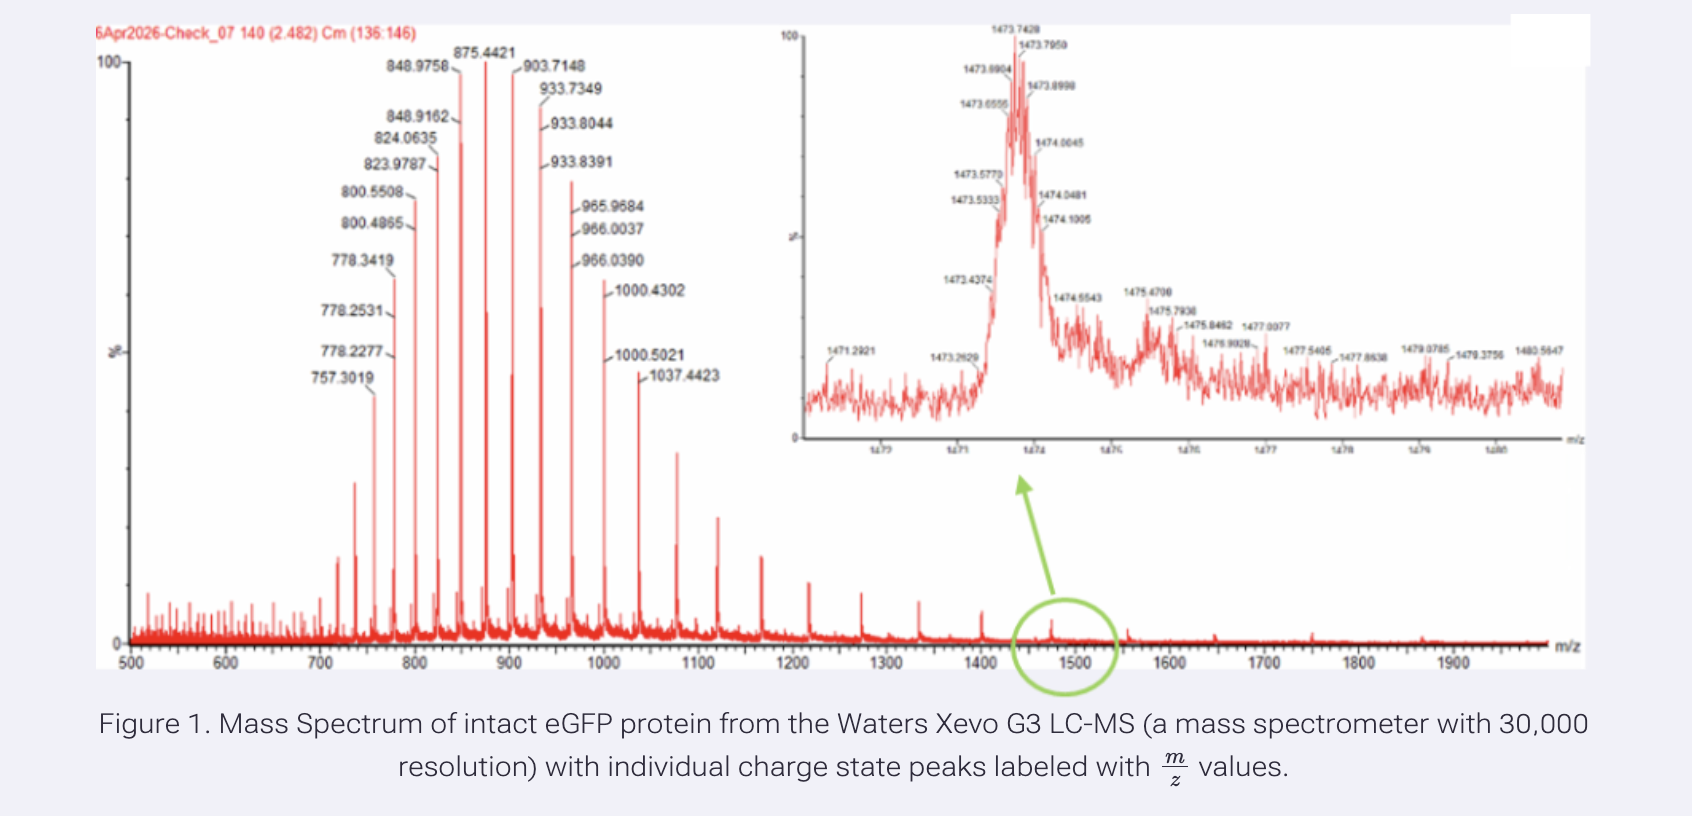
- Calculate the molecular weight of eGFP using the adjacent charge state approach:
After inserting sequence at ExPASy and selecting the two adjascent peaks form the image above I asked Claude to walk me through this math step by step and using Lego as an analogy as it too advanced for me.
Question 1: Calculated MW of eGFP
The ExPASy tool calculated the theoretical molecular weight by adding up all the amino acid masses in the sequence, giving us 28,006.60 Da. In LEGO terms, we used a database that knows the weight of each type of brick and stud in our sequence.
Question 2a: Determine z
Using the formula provided on the homework page with chosen peaks at 965.9684 and 1000.4302, we calculated z = 28 for the 1000.4302 peak and z = 29 for the 965.9684 peak. In LEGO terms,the gap between two adjacent bricks to figure out how many studs each one has.
Question 2b: Determine MW from m/z and z
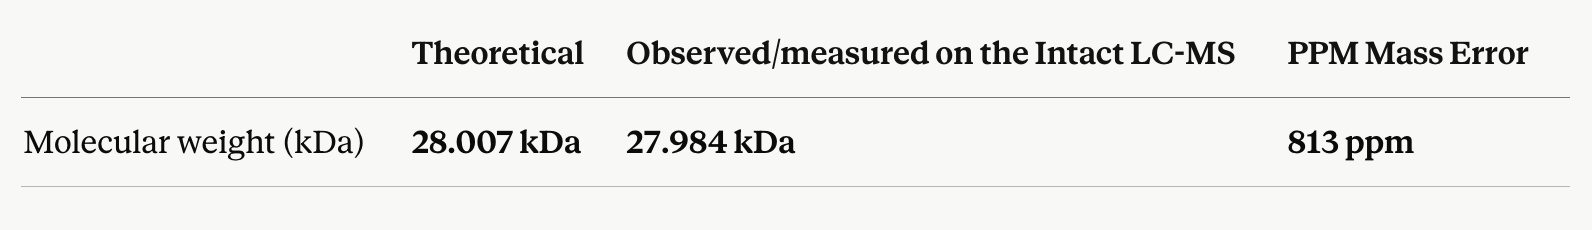
Using formula from homework page = 1000.4302, calculated MW = 27,983.84 Da.
In LEGO terms, multiplied back by the number of studs and subtracted their weight to find just the brick’s weight.
Question 2c: Mass Accuracy
Using formula from homework page Accuracy= 0.081% so Accuracy=28,006.60∣27,983.84−28,006.60∣=0.000812=0.081%, measurement was good.
In LEGO terms, calculated brick weight matched the database weight almost perfectly.
- Can you observe the charge state for the zoomed-in peak in the mass spectrum for the intact eGFP? If yes, what is it? If no, why not?
It does look a bit ‘bumpy’ so I said yes, the charge state can be observed. Based on the zoomed-in peak at ~1473 m/z, the charge state is approximately z = 19
Waters Part II – Secondary/Tertiary Structure
Explain the difference between native and denatured protein conformations.
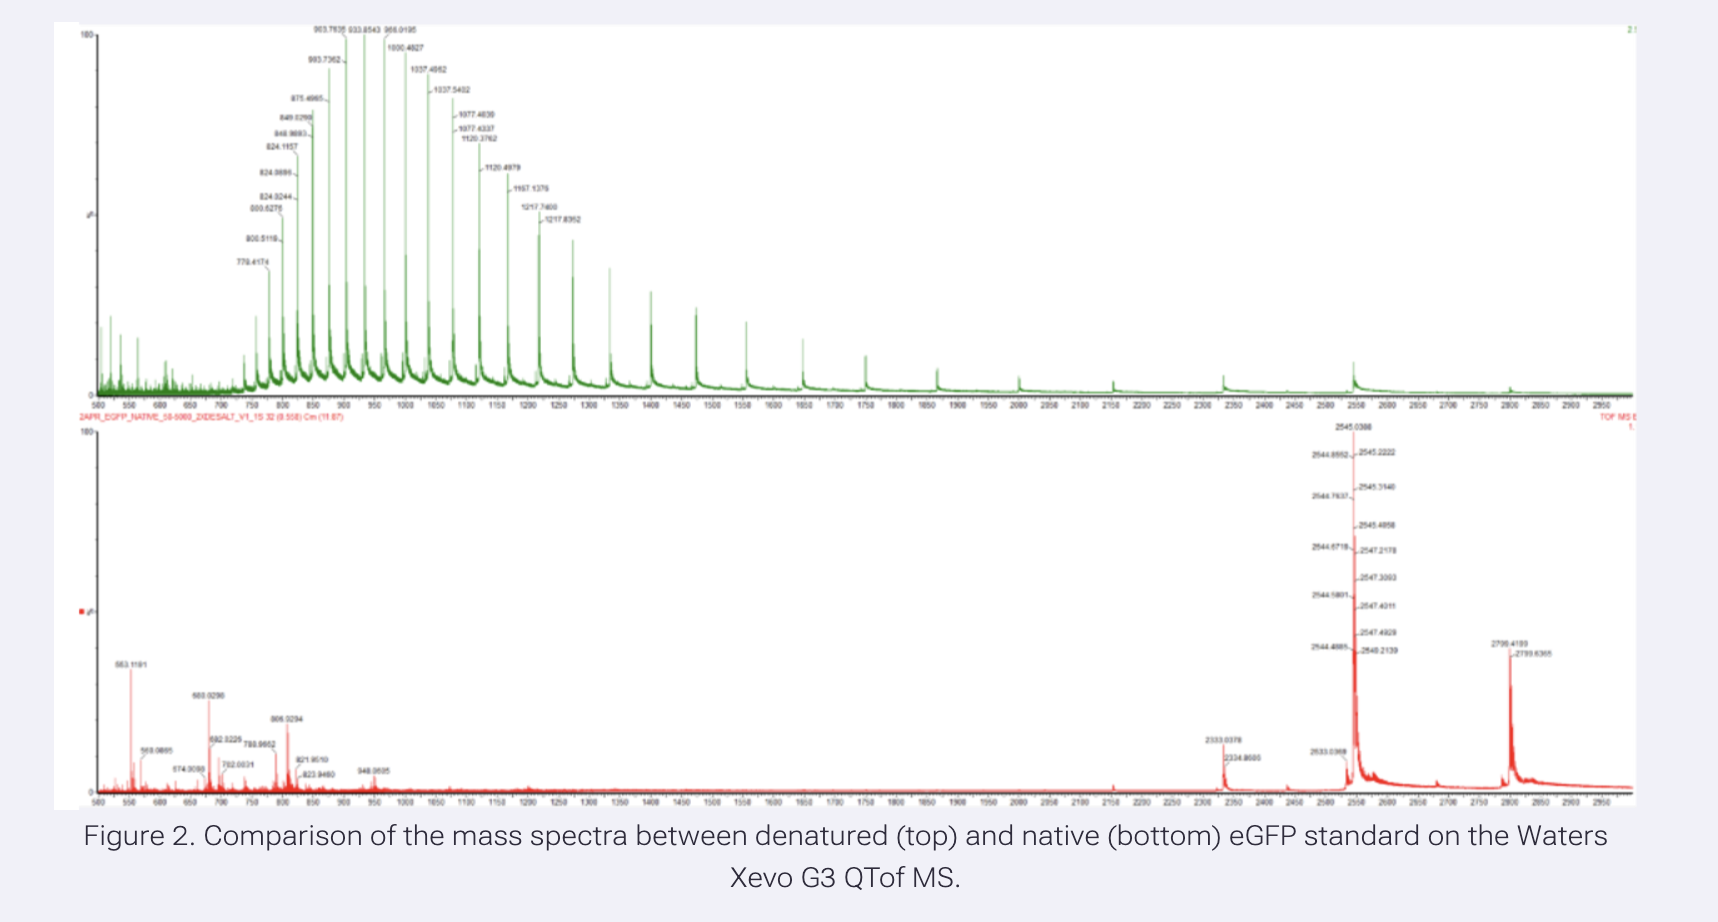
When a protein unfolds (denatures), its 3D structure is lost and buried regions become exposed. These exposed regions can pick up more protons, increasing the charge state (z). Higher charge means lower m/z, so the peaks shift to the left. Looking at Figure 2 above:
Denatured (top, green): Many peaks spread across a wide range at lower m/z (600-1400), high charge states Native (bottom, red): Fewer peaks clustered at higher m/z (2500-2800), low charge states
In LEGO terms: the folded brick can only fit a few studs on its surface. When you pull it apart, every piece can now have studs attached, so the total stud count goes way up.
What happens when a protein unfolds? How is that determined with a mass spectrometer?
When a protein unfolds, its 3D structure is lost and buried regions become exposed, allowing more protons to attach to the protein. The mass spectrometer detects the change in charge state distribution. An unfolded protein shows many peaks at lower m/z values due to higher charge states, while a folded protein shows fewer peaks clustered at higher m/z values.
What changes do you see in the mass spectrum between native and denatured analyses (Figure 2)?
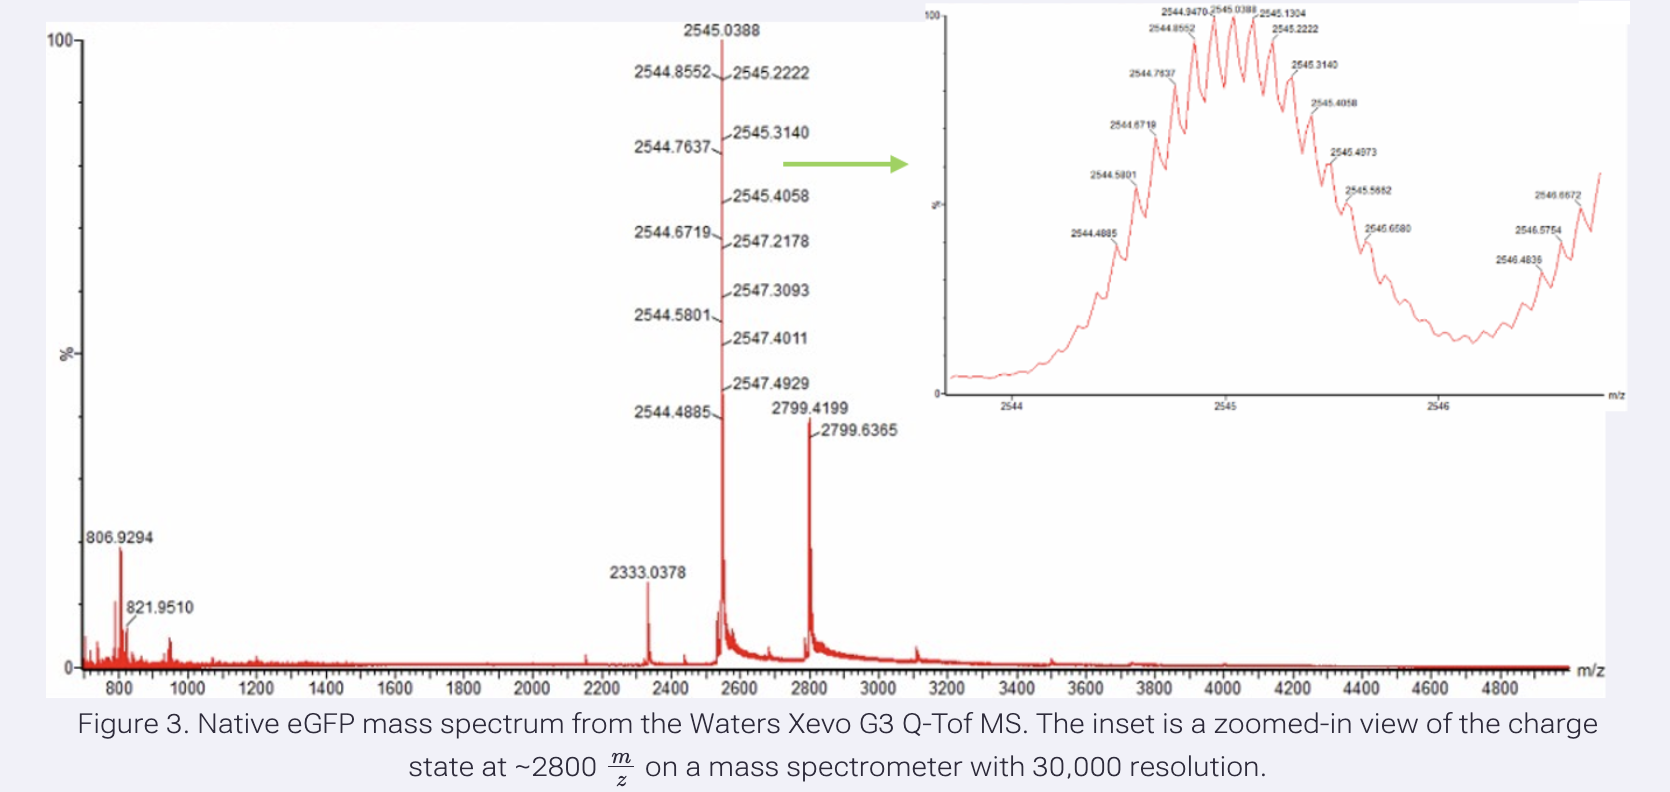
Zooming into the native mass spectrum (Figure 3), can you discern the charge state of the peak at ~2800 m/z? What is the charge state? How can you tell?
The denatured spectrum (top) shows many peaks at lower m/z. The native spectrum (bottom) shows fewer peaks clustered at higher m/z. More protons attach to the unfolded protein, shifting peaks to the left.
Yes, the charge state can be discerned from the zoomed inset. The isotope peaks are spaced approximately 0.1 Da apart, meaning z = 1/0.1 = 10.
Waters Part III – Peptide Mapping
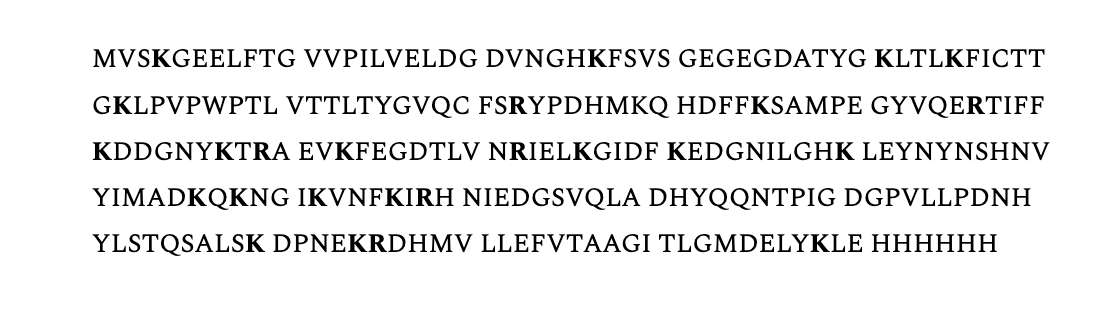
How many Lysines (K) and Arginines (R) are in eGFP? Circle or highlight them in the sequence.
29
How many peptides will be generated from tryptic digestion of eGFP?
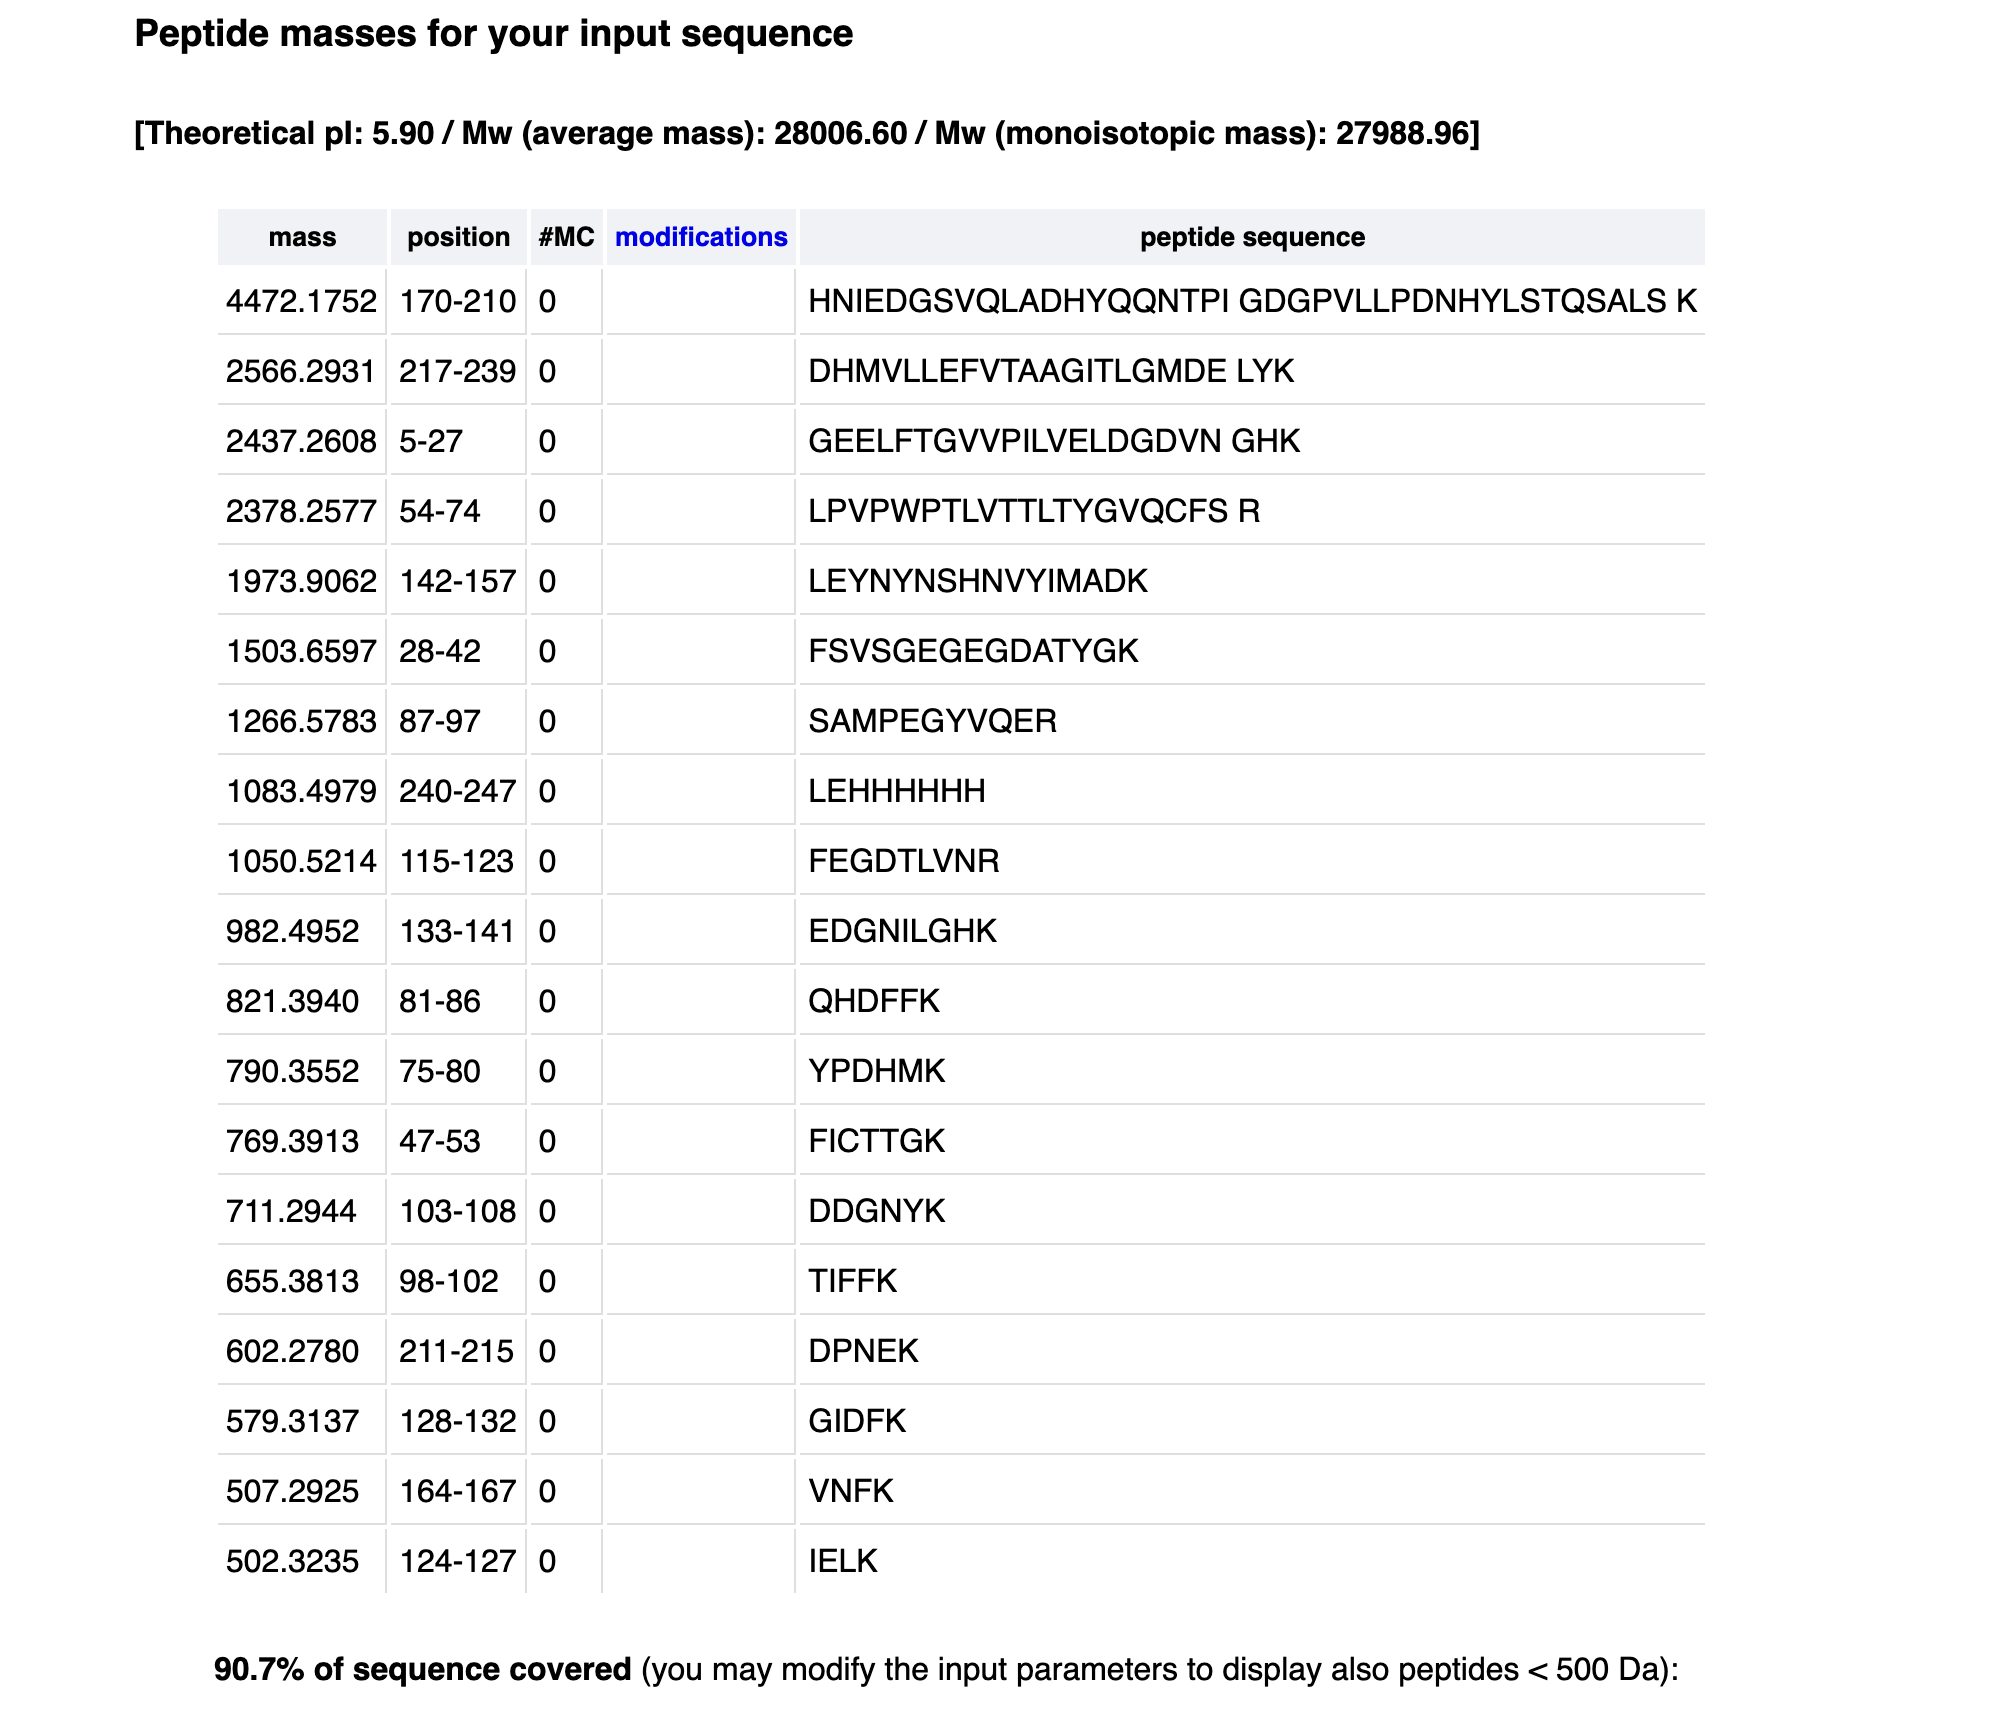
Tryptic digestion of eGFP generates 19 peptides shown here, with additional smaller peptides below 500 Da not displayed. The total number of predicted cleavage sites is 29 (19K + 10R), giving a maximum of 30 peptides.
Based on the LC-MS chromatogram data (Figure 5a), how many chromatographic peaks do you see between 0.5 and 6 minutes?
Between 0.5 and 6 minutes, there are approximately 19 chromatographic peaks above 10% relative abundance. I did estimate this as some might have cleared, but left them out.
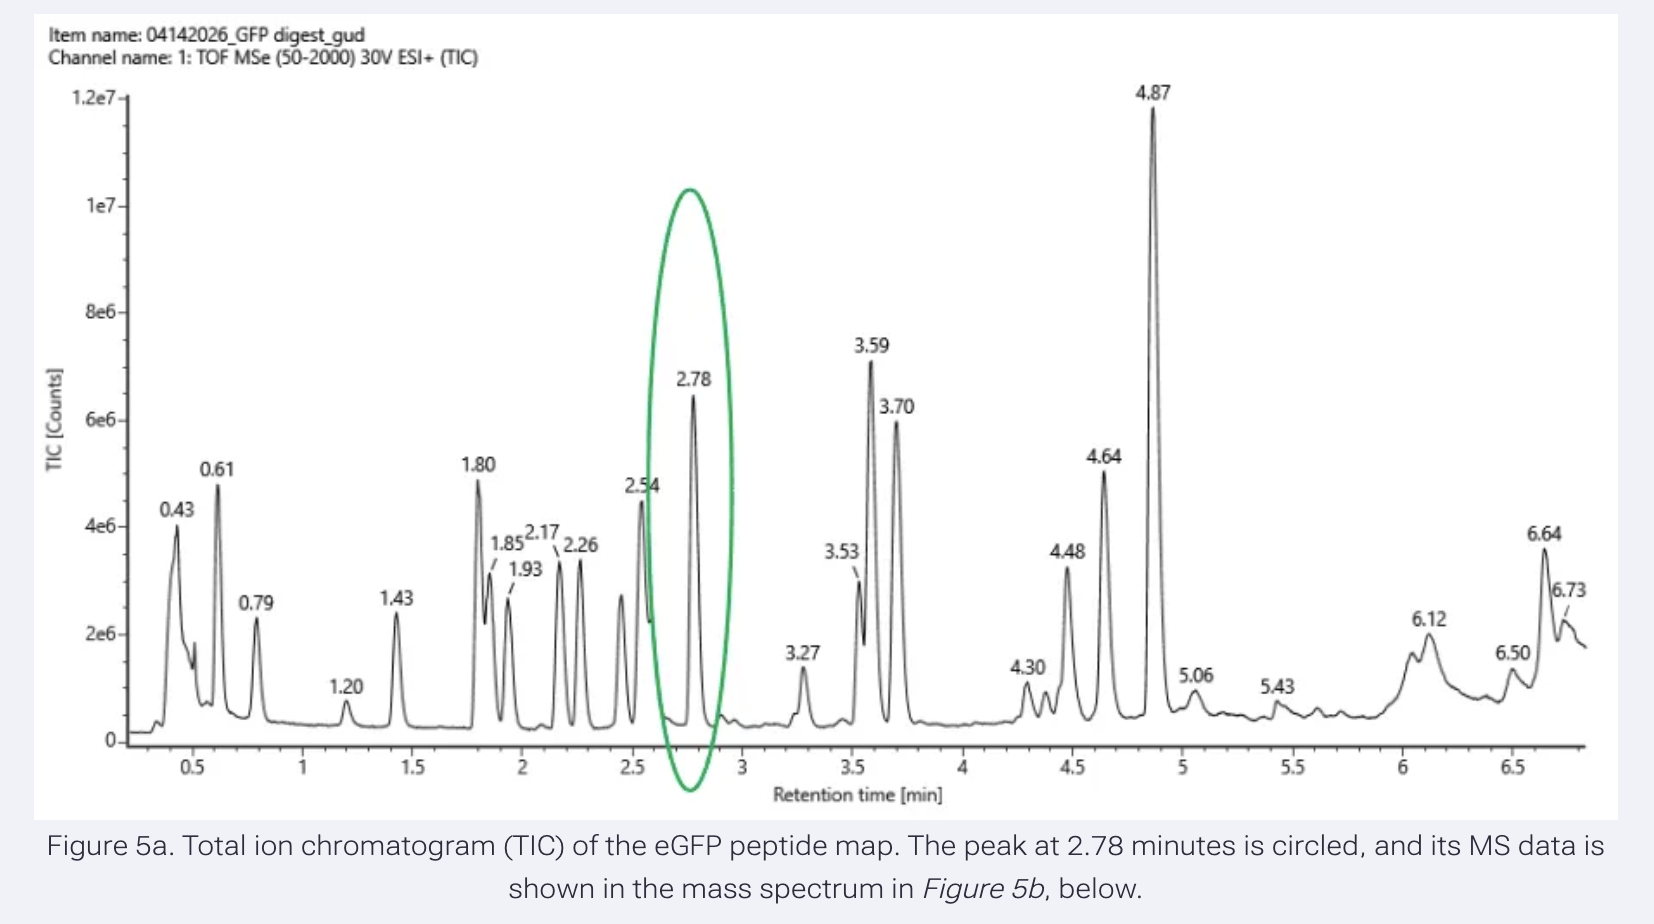
Does the number of peaks match the number of peptides predicted? Are there more or fewer peaks?
There are fewer peaks than predicted peptides. This is because some peptides co-elute (blend together) and appear as one peak, very small peptides below 500 Da are not detected, and some peptides may be below the detection threshold.
Identify the m/z of the peptide shown in Figure 5b. What is the charge (z) of the most abundant charge state? Calculate the mass of the singly charged form [M+H]+ based on its m/z and z.
m/z = 525.76712 z = 2 [M+H]+ = 1050.527 Da
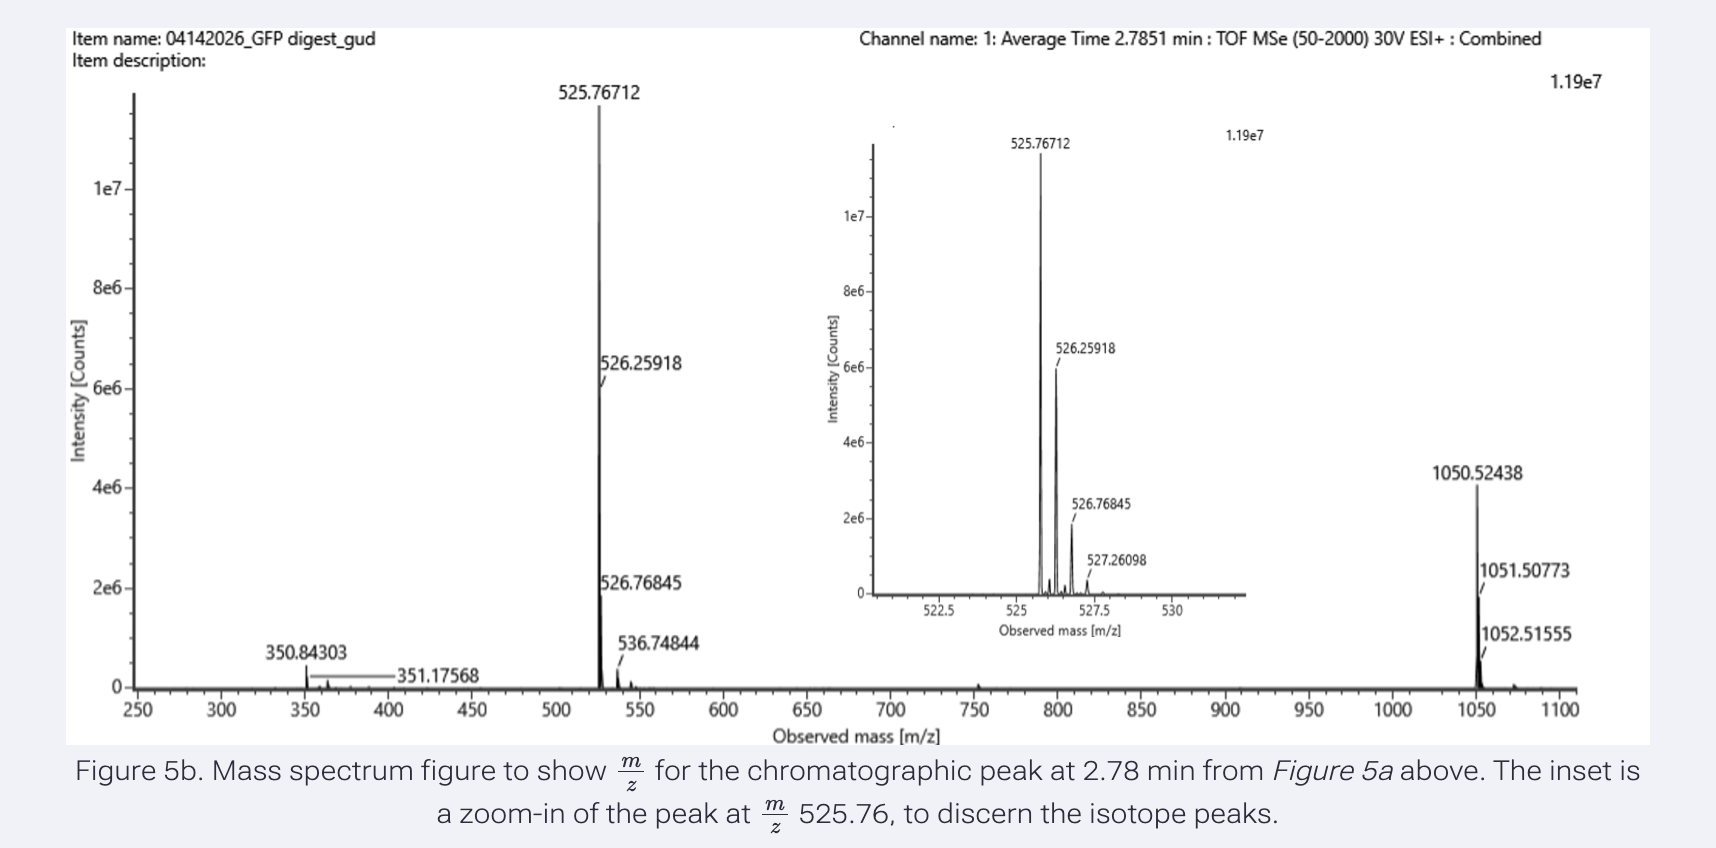
Identify the peptide based on comparison to expected masses in the PeptideMass tool. What is the mass accuracy of the measurement?
Peptide = FEGDTLVNR Mass accuracy = 5.3 ppm

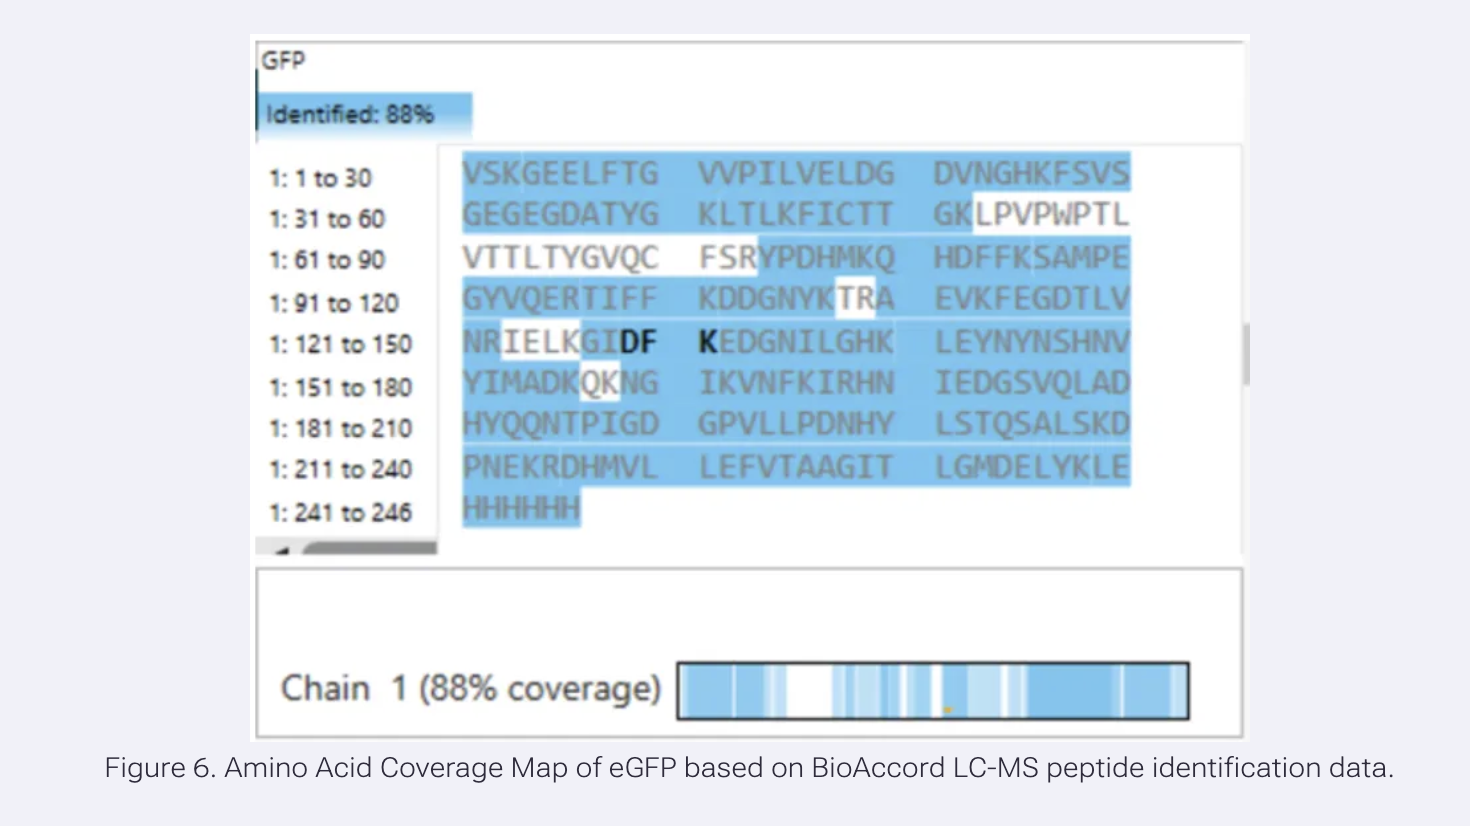
What is the percentage of the sequence confirmed by peptide mapping (Figure 6)?
88% sequence coverage
Waters Part IV – Oligomers
Using the known masses of the polypeptide subunits for KLH, identify where the following oligomeric species are on the CDMS spectrum (Figure 7):
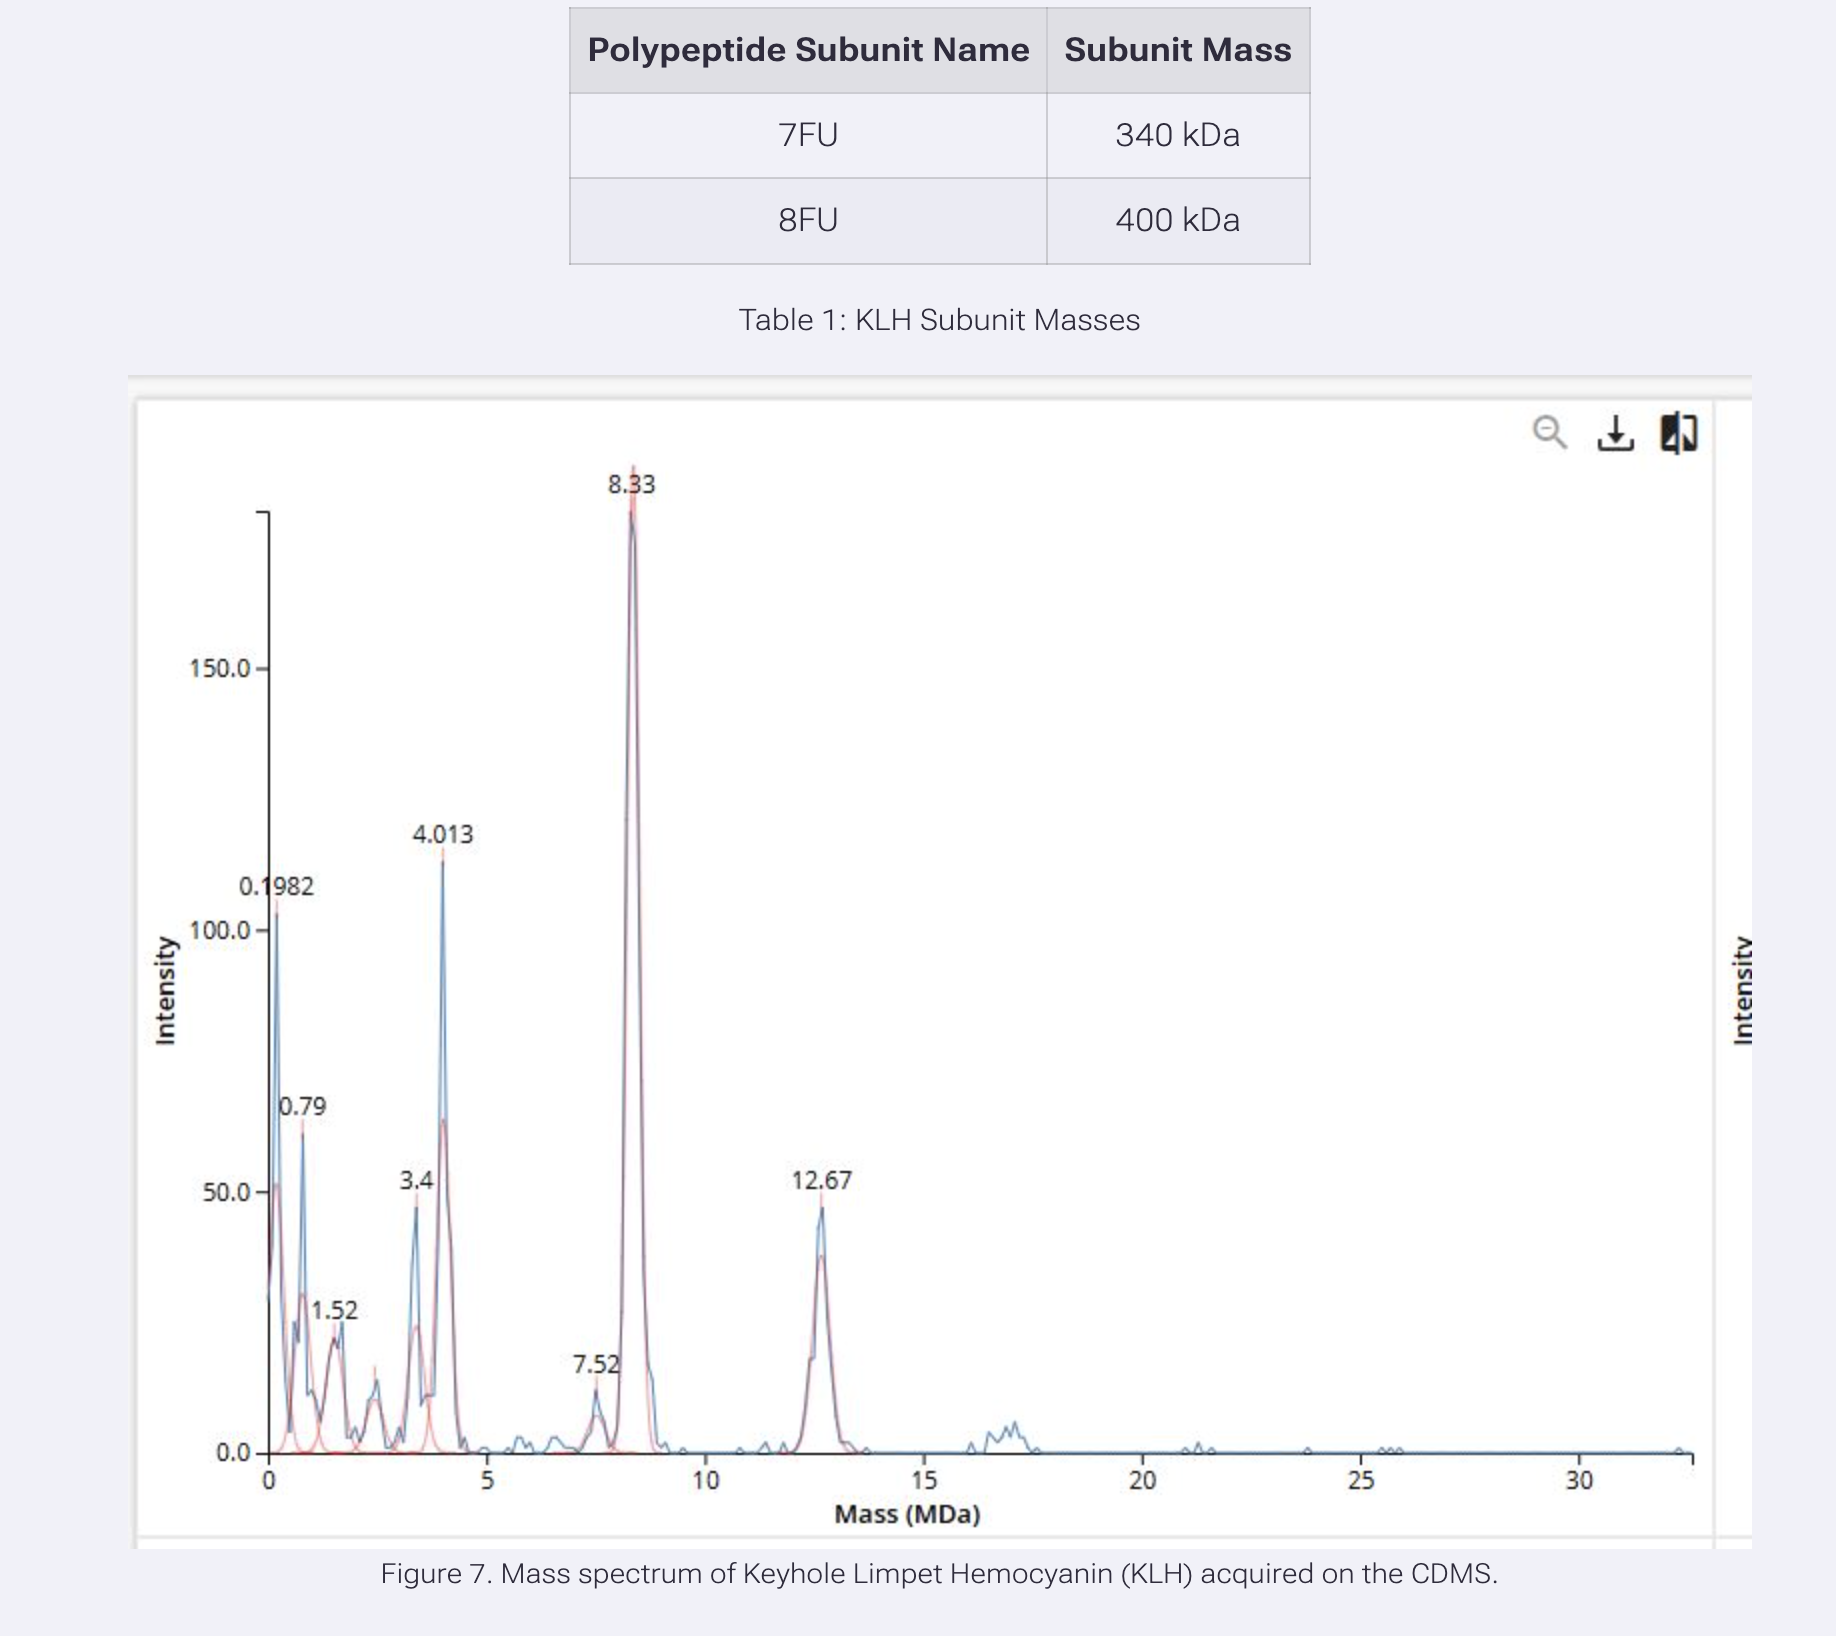
7FU Decamer, 8FU Didecamer, 8FU 3-Decamer, 8FU 4-Decamer.
7FU Decamer (10 x 340 kDa) = 3,400 kDa = 3.4 MDa – that’s the peak at 3.4 on the spectrum
8FU Didecamer (20 x 400 kDa) = 8,000 kDa = 8.0 MDa – that’s the peak at 8.33 on the spectrum
8FU 3-Decamer (30 x 400 kDa) = 12,000 kDa = 12.0 MDa – that’s the peak at 12.67 on the spectrum
8FU 4-Decamer (40 x 400 kDa) = 16,000 kDa = 16.0 MDa – that’s the small peak around 16 on the spectrum
- Fill out the “Did I make GFP?” table with theoretical vs. observed molecular weight and amino acid sequence coverage from both instruments.