Week 10 HW: Advanced Imaging & Measurement Technology
Homework: Waters Part I — Molecular Weight
eGFP Sequence: MVSKGEELFTG VVPILVELDG DVNGHKFSVS GEGEGDATYG KLTLKFICTT GKLPVPWPTL VTTLTYGVQC FSRYPDHMKQ HDFFKSAMPE GYVQERTIFF KDDGNYKTRA EVKFEGDTLV NRIELKGIDF KEDGNILGHK LEYNYNSHNV YIMADKQKNG IKVNFKIRHN IEDGSVQLAD HYQQNTPIGD GPVLLPDNHY LSTQSALSKD PNEKRDHMVL LEFVTAAGIT LGMDELYKLE HHHHHH
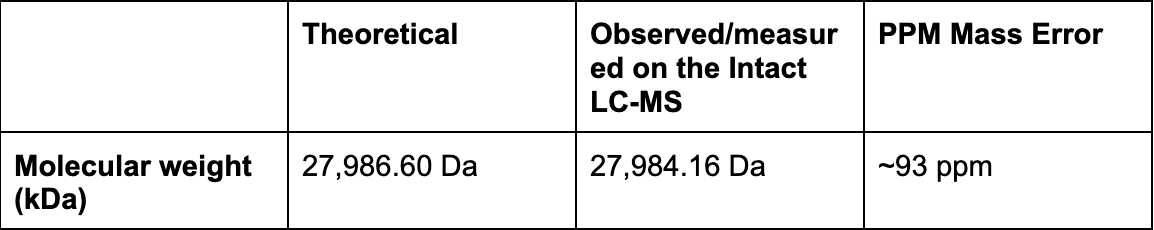
Using the online calculator, the theoretical mass is 28006.60 Da. After subtracting the chromophore maturation (-20 Da), my predicted molecular weight comes out to 27,986.60 Da.
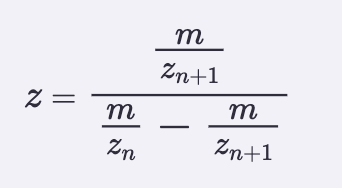
Calculate the molecular weight of the eGFP using the adjacent charge state approach described in the recitation. Select two charge states from the intact LC-MS data (Figure 1) and: Determine z for each adjacent pair of peaks (n, n+1) using:
I picked peaks 903.7148 and 875.4421
Z = 875.4421/903.7148 - 875.4421
Z = 875.4421/28.2727
Z = 30.96 rounded to 31
Charge is +31 for peak 875.4421
Therefore charge must be +32 for 903.7148
Determine the MW of the protein using the relationship between m/Zn, MW and z:
Taking the formula from recitation: MW = (n x m/Zn) - n
MW = (31 x 875.4421) - 31
MW = 28,015.16 − 31
MW = 27,984.16 Da
Calculate the accuracy of the measurement using the deconvoluted MW from 2.2 and the predicted weight of the protein from 2.1 using:
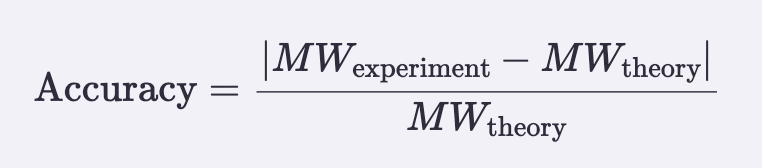
Accuracy = ∣27,986 - 27,986.60∣ / 27,986.60
Accuracy = 2.60 / 27,986.60
Accuracy = 0.0000929
Accuracy = 0.0000929 x 100
Accuracy = 0.0093% (≈ 93 ppm)
Can you observe the charge state for the zoomed-in peak in the mass spectrum for the intact eGFP? If yes, what is it? If no, why not?
Yes (although it may be inaccurate because I had to guess some of the numbers form the blurry image). We know the isotope peaks with an ion of charge z are spaced apart at z = 1. Looking at the isotope peaks in the zoomed photo:
1473.7428 → 1473.7950: Δ = 0.0522
1473.7950 → 1473.8990: Δ = 0.1040 (≈ 2 × 0.052. one isotope peak skipped/unlabeled)
1473.8990 → 1474.0481: Δ = 0.1491 (≈ 3 × 0.05. likely 2 peaks skipped)
1474.0481 → 1474.1006: Δ = 0.0525
The consistent spacing is around 0.052m/z. Therefore:
Z = 1.0.052
Z = 19.2
The charge state is +19.
Homework: Waters Part III — Peptide Mapping - primary structure
How many Lysines (K) and Arginines (R) are in eGFP? Please circle or highlight them in the eGFP sequence given in Waters Part I question 1 above. (Note: adding the sequence to Benchling as an amino acid file and clicking the biochemical properties tab will show you a count for each amino acid).
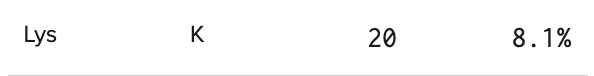
There are 20 lysines and 6 arganines, totaling 26 sites:
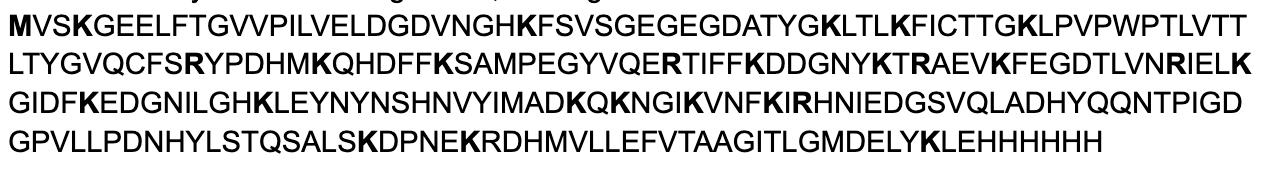
How many peptides will be generated from tryptic digestion of eGFP?
The total number of peptides generated is 19.
Based on the LC-MS data for the Peptide Map data generated in lab (please use Figure 5a as a reference) how many chromatographic peaks do you see in the eGFP peptide map between 0.5 and 6 minutes? You may count all peaks that are >10% relative abundance.
The peaks are:
- 0.61
- 0.79
- 1.20 (decided to count this one)
- 1.43
- 1.80
- 1.85
- 1.93
- 2.17
- 2.26
- 2.54
- 2.78
- 3.27
- 3.53
- 3.59
- 3.70
- 4.30
- 4.48
- 4.64
- 4.87
- 5.06
- 5.43
There are 21 chromatographic peaks.
Assuming all the peaks are peptides, does the number of peaks match the number of peptides predicted from question 2 above? Are there more peaks in the chromatogram or fewer?
No, there are slightly more peaks in the chromatogram (21) than predicted by Peptide Mass (19). This is likely due to human error (me counting peaks that are below relative abundance), missed cleavages, or missed small peptides that still produced peaks.
Identify the mass-to-charge (m/z) of the peptide shown in Figure 5b. What is the charge (z) of the most abundant charge state of the peptide (use the separation of the isotopes to determine the charge state). Calculate the mass of the singly charged form of the peptide ( M+H⁺ ) based on its m/z and z
The most abundant m/z is the tallest peak of 525.76712. Using the zoomed in image:
525.76712 → 526.25918: Δ = 0.49206
526.25918 → 526.76845: Δ = 0.50927
526.76845 → 527.26098: Δ = 0.49253
Average isotope spacing ≈ 0.50 m/z
Z = 1/0.50 = +2
The most abundant charge state is doubly charged.
For the [M+H]⁺ (singly charged) mass:
M = 2 x (525.76712) - 2 (equation from earlier)
M = 1051.53424−2.01456
M = 1049.5197 Da
M+H+ = M+1.00728
M+H+ = 1049.5197+1.00728
M+H+ = 1050.527 Da
Identify the peptide based on comparison to expected masses in the PeptideMass tool. What is mass accuracy of measurement? Please calculate the error in ppm.
From my PeptideMass table1050.527 matches the predicted 1050.5214 :
1050.5214 Da → FEGDTLVNR (positions 115–123)
Accuracy = ∣1050.5244 - 1050.5214∣ / 1050.5214
Accuracy = 0.003 / 1050.55214
Accuracy = 2.86×10^−6
Error = 2.86 ppm
What is the percentage of the sequence that is confirmed by peptide mapping?
The percentage confirmed by peptide mapping is 88% of the eGFP sequence. The unidentified regions are in white and probably correspond to small peptides below detection threshold.
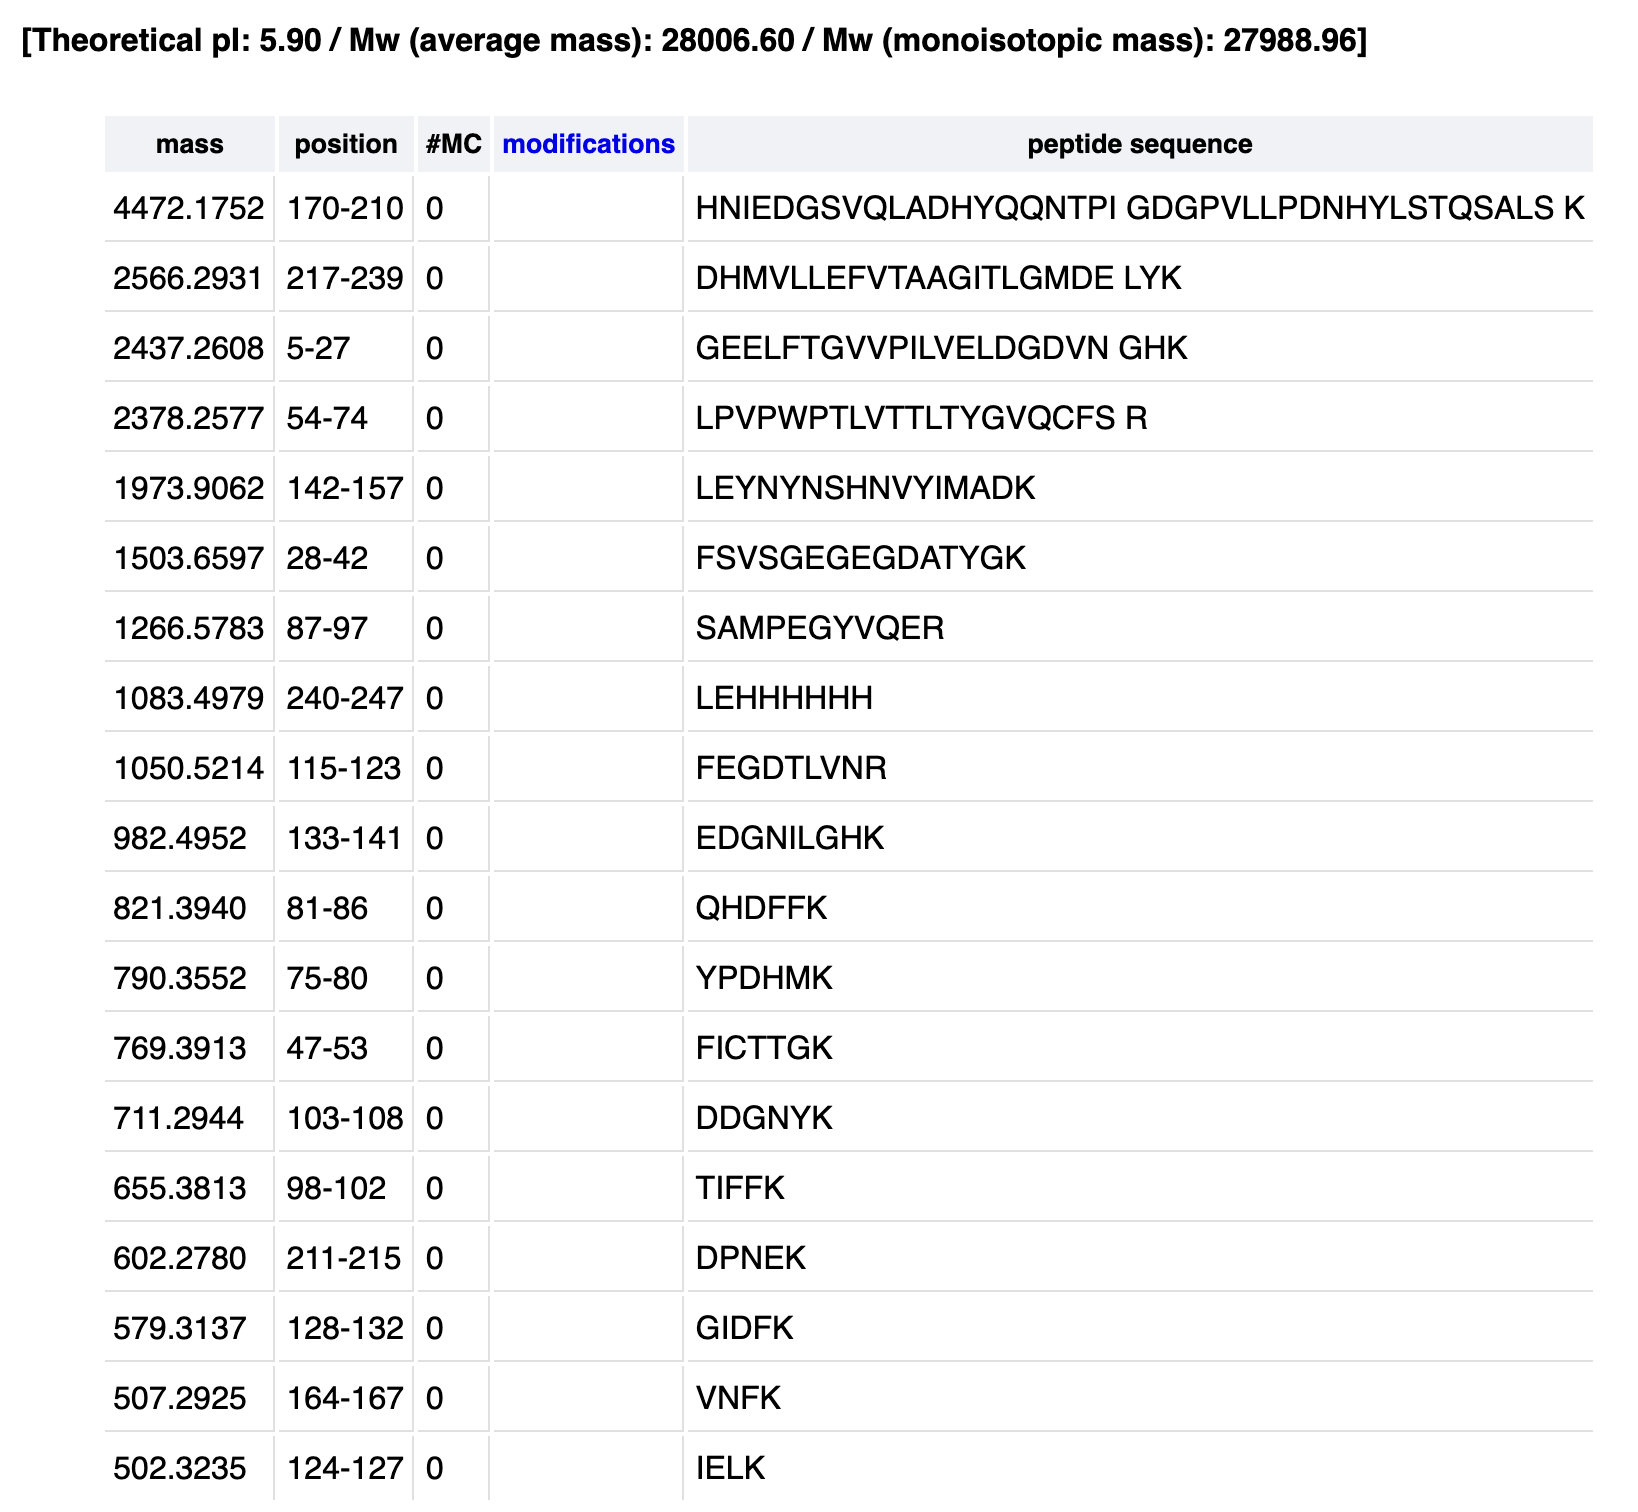
Can you determine the peptide sequence for the peptide fragmentation spectrum shown in Figure 5c? (Copy and paste its sequence into this tool online to predict the fragmentation pattern based on its amino acid sequence: http://db.systemsbiology.net/proteomicsToolkit/FragIonServlet.html. What is the sequence of the eGFP peptide that best matches the fragmentation spectrum in Figure 5c?
Yes, as mentioned earlier it’s FEGDTLVNR (115-123).
M+H⁺ = 1050.52149 → matches Figure 5b peak at 1050.52438
M+2H²⁺ = 525.76441 → matches Figure 5b peak at 525.76712
Does the peptide map data make sense, i.e. do the results indicate the protein is the eGFP standard? Why or why not? Consult with Figure 6, which depicts the % amino acid coverage of peptides positively identified using their calculated mass and fragmentation pattern.
Yes, the peptide map data confirm the protein in eGFP standard. Firstly, there is a high sequence coverage (88%). Secondly, there is accurate peptide mass matches, where the peptide identified FEGDTLVNR with [M+H]⁺ = 1050.524 Da matches the PeptideMass prediction of 1050.521 Da to within 3 ppm. Thirdly, the fragmentation pattern from figure 5c confirms this sequence, matching the predicted series for FEGDTLVNR, confirming the actual amino acid sequence of the peptide.
Homework: Waters Part IV — Oligomers
We will determine Keyhole Limpet Hemocyanin (KLH)’s oligomeric states using charge detection mass spectrometry (CDMS). CDMS single-particle measurements of KLH allow us to make direct mass measurements to determine what oligomeric states (that is, how many protein subunits combine) are present in solution. Using the known masses of the polypeptide subunits (Table 1) for KLH, identify where the following oligomeric species are on the spectrum shown below from the CDMS (Figure 7):
Calculating each ones mass:
7FU Decamer: 10 × 340 kDa = 3.4 MDa
8FU Didecamer: 20 × 400 kDa = 8.0 MDa
8FU 3-Decamer: 30 × 400 kDa = 12.0 MDa
8FU 4-Decamer: 40 × 400 kDa = 16.0 MDa
Matching to Figure 7:
3.4 -> yes, there is a peak for 7FU Decamer
8.33 -> yes there is a peak for 8FU Didecamer
12.67 -> yes there is a peak for 8FU 3-Decamer
16 -> yes there is a small peak for 8FU 4-Decamer
All four oligomeric species are on the spectrum in Figure 7, albeit at different intensities.
Since KLH exists natively as a didecamers, 8.33MDa is the tallest peak.
Homework: Waters Part V — Did I make GFP?
Please fill out this table with the data you acquired from the lab work done at the Waters Immerse Lab in Cambridge, or else the data screenshots in this document if you were unable to have lab work done at Waters.