Week 10 HW: Imaging and Measurement

Important
Homework Part 1: Final Project
Please identify at least one (ideally many) aspect(s) of your project that you will measure. It could be the mass or sequence of a protein, the presence, absence, or quantity of a biomarker, etc.
I am going to work on my final project in silico, but I will answer this question as if I had access to measuring and imaging equiptment and wetlabs.
- Environmental PAH concentration
- DNA construct accuracy (length and sequence)
- Bio sensor activation, sensitivity and kinetics (limit of detection, time for visible output, response kinetics)
- Expression levels of β-galactosidase protein
- Colourmetric output signal intensity generated through CPRG substrate hydrolysis
- Scaffold porosity and gas diffusion accessibility
Please describe all of the elements you would like to measure, and furthermore describe how you will perform these measurements.What are the technologies you will use (e.g., gel electrophoresis, DNA sequencing, mass spectrometry, etc.) Describe in detail.
1. Environmental PAH concentration:
It is important to measure the actual concentration of polycyclic aromatic hydrocarbons (PAHs) present in environmental air at deployment sites and similar conditions. This will determine whether pollutant levels fall within the detectable range of the biosensor and to optimise the genetic circuit to real world air quality conditions.
These measurements would be performed using Gas Chromatography–Mass Spectrometry. Air would first be collected using particulate filters or adsorption cartridges positioned at installation sites. The collected samples would then be extracted and analysed using GC–MS to determine the concentration of target PAH biomarkers.
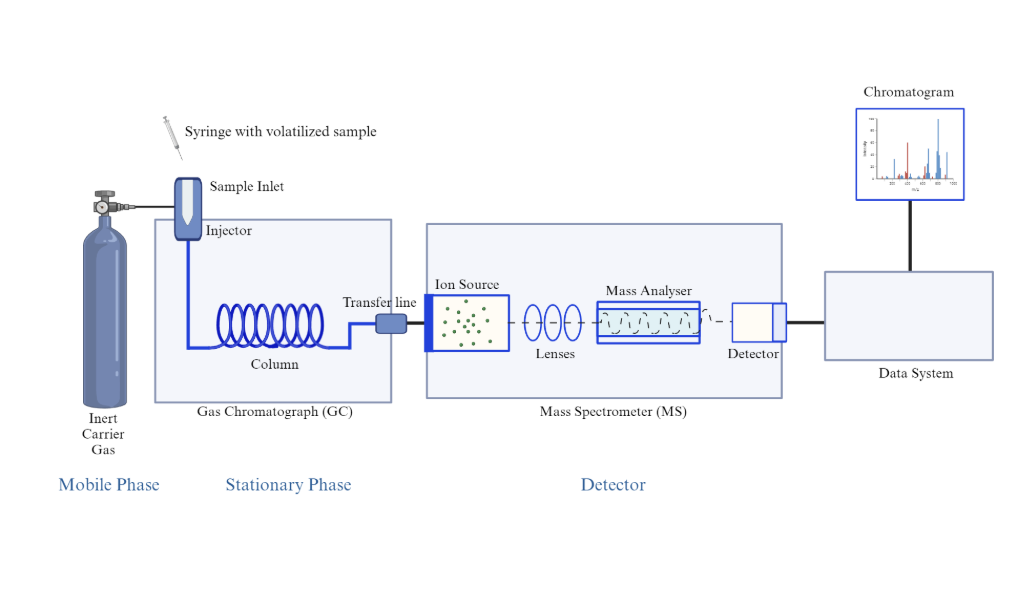
Figure of GC-MS, From: https://measurlabs.com/methods/gas-chromatography-mass-spectrometry-gc-ms/
GC:
- Air samples collected at installation sites (with a filter or cartridge)
- Samples undergo solvent extraction to isolate the retained organic molecules
- Sample is heated and vaporised
- Sample is injected into a capillary chromatography column containing a stationary phase optimised for separation of semi-volatile organic compounds such as PAHs
- Molecules travel through the column at different speeds depending on size, weight, polarity or interaction with the stationary phase, meaning they exit the column at different retention times. E.g PAH like napthalene has a short retention time.
MS:
- Molecules enters the mass spectrometer
- Ionised by electron impact ionisation
- The molecule fragment into predictable charged ions
- Fragments are measured by mass and compared against confirmed molecular identity
- Data outputted to Chromatogram used to used to determine the concentration of PAH present in the air sample.
These results would be compared with the predicted activation thresholds and sensitivity range of the NahR LacZ biosensor to evaluate whether it would produce a detectable colourimetric response under realistic environmental exposure conditions in a public installation setting.
2. DNA construct correctness and integrity
To ensure the designed biosensor functions, the NahR LacZ plasmid construct should be verified. Measurements include the DNA fragment size (in relation to molecular weight ladder) and sequence in relation to the designed Benchling construct and confirm the absence of mutations.
The first will be performed using Gel electrophoresis to confirm expected plasmid size via migration distance compared to a molecular weight ladder. Specific restriction enzymes designed in Benchling will cut the plasmid at predicted locations flanking the pNah promoter and lacZ reporter cassette. The resulting DNA fragments will migrate through an agarose gel matrix under an applied electric field, allowing fragment sizes to be compared against a molecular weight ladder.
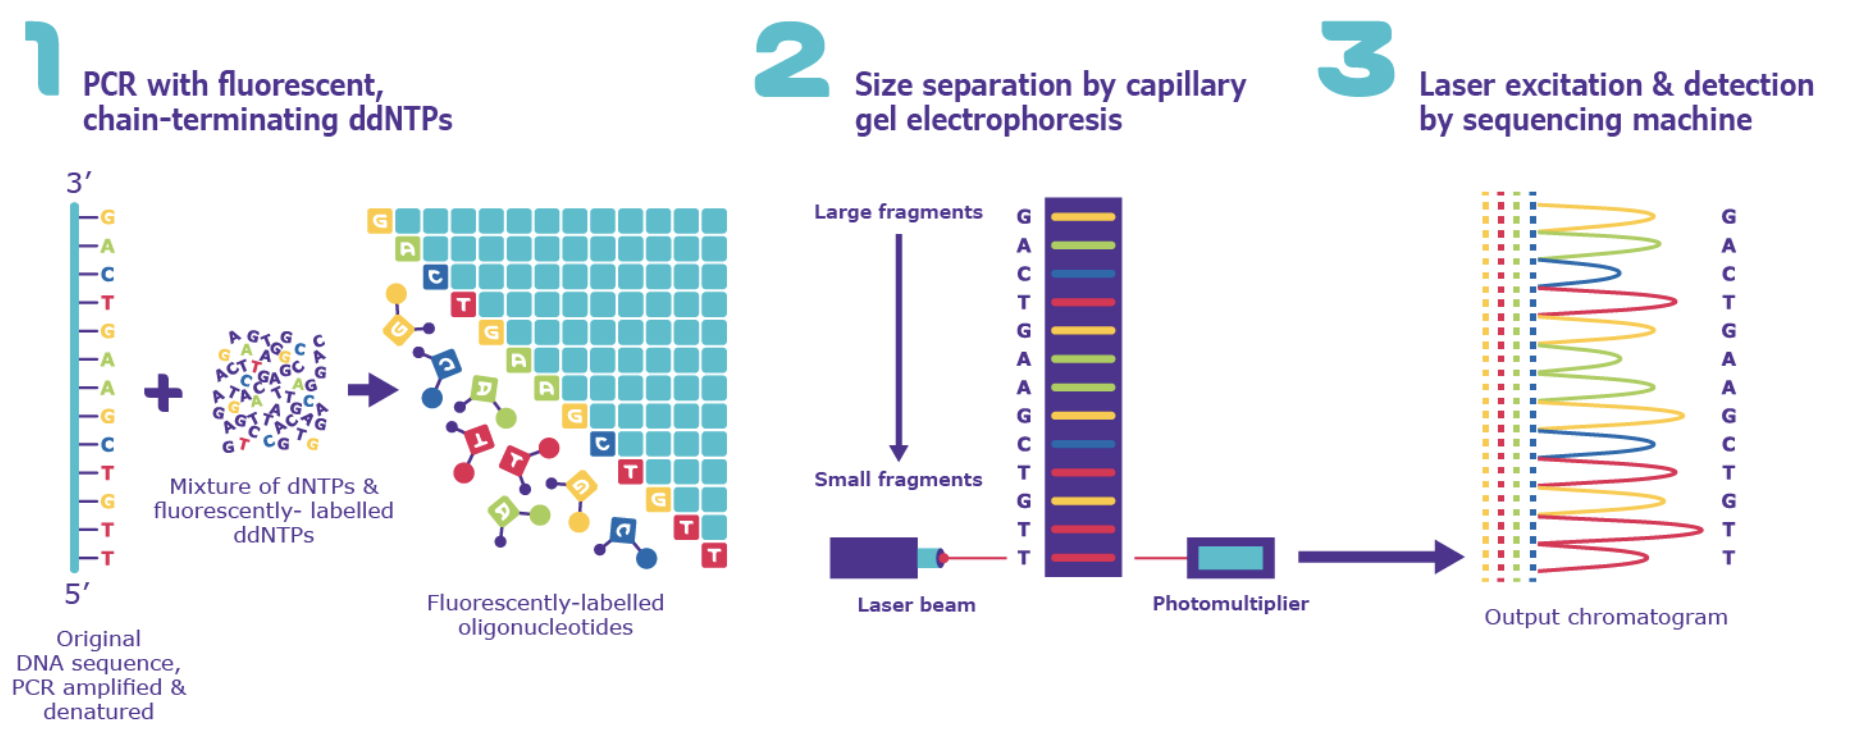
Figure of Sanger Sequencing, From: https://www.sigmaaldrich.com/GB/en/technical-documents/protocol/genomics/sequencing/sanger-sequencing?srsltid=AfmBOooV_i64Bm0LgnnnlshXoIM8Jie-hLw9byG48n9ncECuFkHc_uLL/
The second will be performed using Sanger sequencing.
- Plasmid DNA containing the NahR LacZ construct is used as the sequencing template.
- A sequencing primer binds near the pNah promoter and lacZ coding region.
- DNA polymerase extends the strand using normal nucleotides and fluorescent chain-terminating ddNTPs.
- Incorporation of a ddNTP stops strand extension, generating DNA fragments of different lengths.
- Fragments are separated by size using capillary electrophoresis.
- A detector reads fluorescent labels on the terminal bases to determine the nucleotide sequence.
- The resulting chromatogram is aligned with the Benchling reference sequence to confirm correct construct assembly and absence of mutations.
3. Bio sensor activation, sensitivity and kinetics (limit of detection, time for visible output, response kinetics)
Measurements focusing on the functional performance of the bio-sensor in relation to PAH exposure.
Biosensor activation and sensitivity would be quantified by exposing the system to a defined range of PAH concentrations and measuring the resulting colour output. The limit of detection would be defined as the lowest concentration of analyte that produces a statistically significant increase in signal compared to the negative control. This would be determined by constructing a dose–response curve and applying statistical testing (e.g. t-test or regression-based threshold estimation).
Response kinetics including time to signal onset and time to half-maximal response, would be measured using kinetic absorbance tracking with a UV–Vis spectrophotometer. Absorbance at 570 nm (corresponding to CPRG cleavage by β-galactosidase) would be recorded at regular time intervals. This time/course data would be used to measure response delay and saturation time.
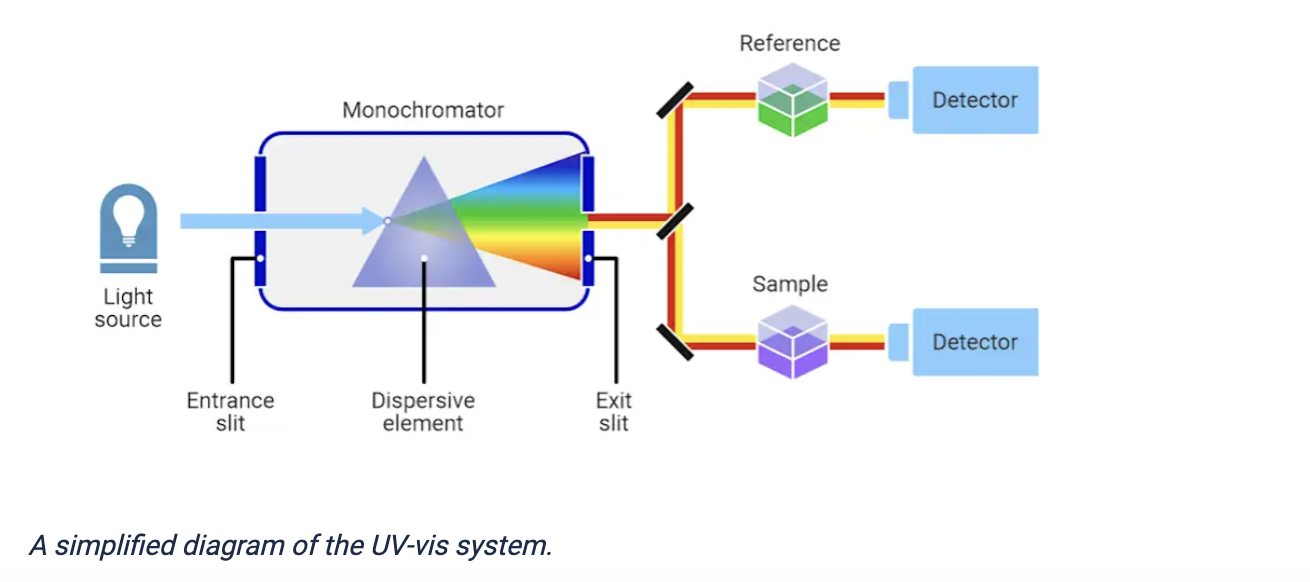
Figure of UV–Vis spectrophotometer, From: https://measurlabs.com/methods/uv-visible-spectroscopy/
This would be done as follows:
- Biosensor culture is placed in microplate well.
- The instrument passes monochromatic light of specific wavelengths ( 570 nm for CPRG) through the sample.
- Molecules in the sample absorb part of the light depending on their chemical properties.
- The incident light intensity and transmitted light intensity are measured by a photodetector
- Absorbance is calculated using the Beer–Lambert relationship and is proportional to analyte concentration.
- Absorbance is recorded as a quantitative measure of molecule concentration (e.g., CPRG colour product or cell density).
- Readings are recorded at defined time intervals to generate a kinetic time-course dataset.
This will be analysed against environmental PAH concentrations and time responsive requirements to demonstrate if the biosensor could function within environmentally relevant exposure levels and produces a detectable signal within a practical timeframe for public-facing installation.
4. Expression levels of β-galactosidase protein
Expression levels of β-galactosidase are measured to confirm successful transcriptional activation and protein production from the NahR–pNah biosensor circuit.
Protein expression would be measured with SDS-PAGE:
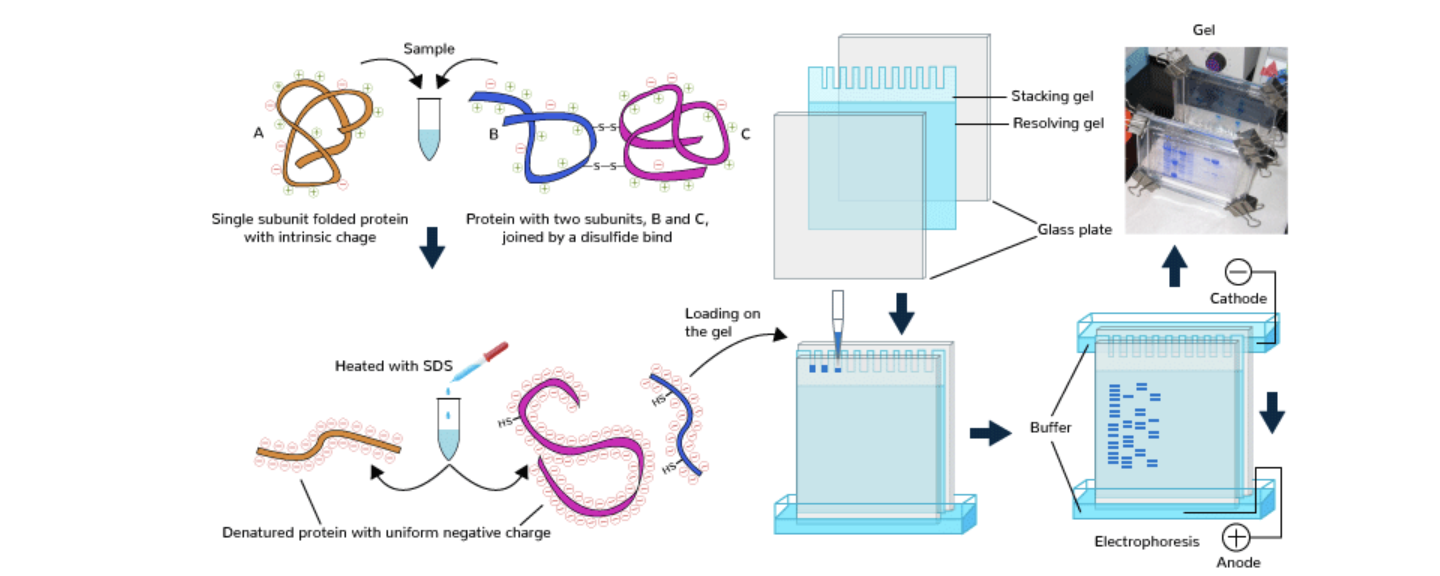
Figure of SDS-PAGE, From: https://www.geeksforgeeks.org/biology/sds-page/
- Cells are lysed using a chemical or mechanical lysis buffer to release proteins.
- Protein concentration is measured and samples are normalised to ensure equal loading.
- Samples are mixed with SDS loading buffer containing SDS detergent and a reducing agent (e.g. β-mercaptoethanol or DTT).
- Samples are heated to denature proteins, ensuring unfolding into linear polypeptide chains.
- Denatured proteins are loaded into wells of a polyacrylamide gel alongside a molecular weight ladder.
- An electric field is applied causing proteins to migrate through the gel matrix toward the positive electrode.
- Proteins separate based on molecular weight.
- The gel is stained to visualise protein bands.
- Bands are compared to the ladder to identify β-galactosidase (approx. 116 kDa) and band intensity is used to estimate relative expression levels.
5. Colourmetric output signal intensity generated through CPRG substrate hydrolysis
The colourimetric output signal measures the visible reporter response produced by β-galactosidase activity in the biosensor circuit. This is our result, it provides a direct readout in response to PAH exposure and it is important to measure this to validate the results of the project and highlight air pollutions quantitively as well as in the artistic installation.
Again, this will be measured using a UV–Vis spectrophotometer, recording absorbance at ~570 nm, which corresponds to the red/purple product formed from CPRG hydrolysis and normalised to cell density (OD600) to ensure comparability across samples.
6. Scaffold porosity and gas diffusion accessibility
Scaffold porosity measures the physical, sculptural structure of the biosensor, specifically how pore size and connectivity influence the diffusion of airborne PAH molecules into the embedded sensing system. This is important to ensure that environmental pollutants can efficiently reach the NahR –lacZ circuit and aid the selection of an appropriate scaffold material.
Porosity and surface morphology would be measured using Scanning Electron Microscopy, which provides high-resolution imaging of scaffold architecture. Image analysis would be used to quantify pore size distribution, pore interconnectivity and overall surface area and gas diffusion accessibility can be analysed from there, based on expected diffusion rates of small aromatic molecules such as PAH.
REFERENCES:
GeeksforGeeks. (n.d.). SDS-PAGE (Sodium dodecyl sulfate–polyacrylamide gel electrophoresis). https://www.geeksforgeeks.org/biology/sds-page/
Khan Academy. (n.d.). Protein electrophoresis and SDS-PAGE. https://www.khanacademy.org/test-prep/mcat/biomolecules/x04f6bc56:protein-analysis-techniques/a/protein-electrophoresis-and-sds-page
Measurlabs. (n.d.). UV-visible spectroscopy. https://measurlabs.com/methods/uv-visible-spectroscopy/
Sigma-Aldrich. (n.d.). Sanger sequencing. https://www.sigmaaldrich.com/GB/en/technical-documents/protocol/genomics/sequencing/sanger-sequencing
Thermo Fisher Scientific. (n.d.). Gas chromatography–mass spectrometry (GC–MS) information. https://www.thermofisher.com/uk/en/home/industrial/mass-spectrometry/mass-spectrometry-learning-center/gas-chromatography-mass-spectrometry-gc-ms-information.html
Nanoscience Instruments. (n.d.). Scanning electron microscopy. https://www.nanoscience.com/techniques/scanning-electron-microscopy/
Nguyen, P. Q., Soenksen, L. R., Donghia, N. M., Angenent-Mari, N. M., de Puig, H., Huang, A., Lee, R., Slomovic, S., Galbersanini, T., Lansberry, G., Sallum, H. M., Zhao, E. M., Niemi, J. B., & Collins, J. J. (2021). Wearable materials with embedded synthetic biology sensors for biomolecule detection. Nature Biotechnology, 39(11), 1366–1374. https://doi.org/10.1038/s41587-021-00950-3
Ho, G., Kubušová, V., Irabien, C., Li, V., Weinstein, A., Chawla, S., Yeung, D., Mershin, A., Zolotovsky, K., & Mogas-Soldevila, L. (2023). Multiscale design of cell-free biologically active architectural structures. Frontiers in Bioengineering and Biotechnology, 11, 1125156. https://doi.org/10.3389/fbioe.2023.1125156
Mass Spectrometry: Waters Part 1 - Molecular Weight
Based only on the predicted amino acid sequence of eGFP (see below), what is the calculated molecular weight? You can use an online calculator like the one at https://web.expasy.org/compute_pi/
VSKGEELFTG VVPILVELDG DVNGHKFSVS GEGEGDATYG KLTLKFICTT GKLPVPWPTL VTTLTYGVQC FSRYPDHMKQ HDFFKSAMPE GYVQERTIFF KDDGNYKTRA EVKFEGDTLV NRIELKGIDF KEDGNILGHK LEYNYNSHNV YIMADKQKNG IKVNFKIRHN IEDGSVQLAD HYQQNTPIGD GPVLLPDNHY LSTQSALSKD PNEKRDHMVL LEFVTAAGIT LGMDELYKLE HHHHHH
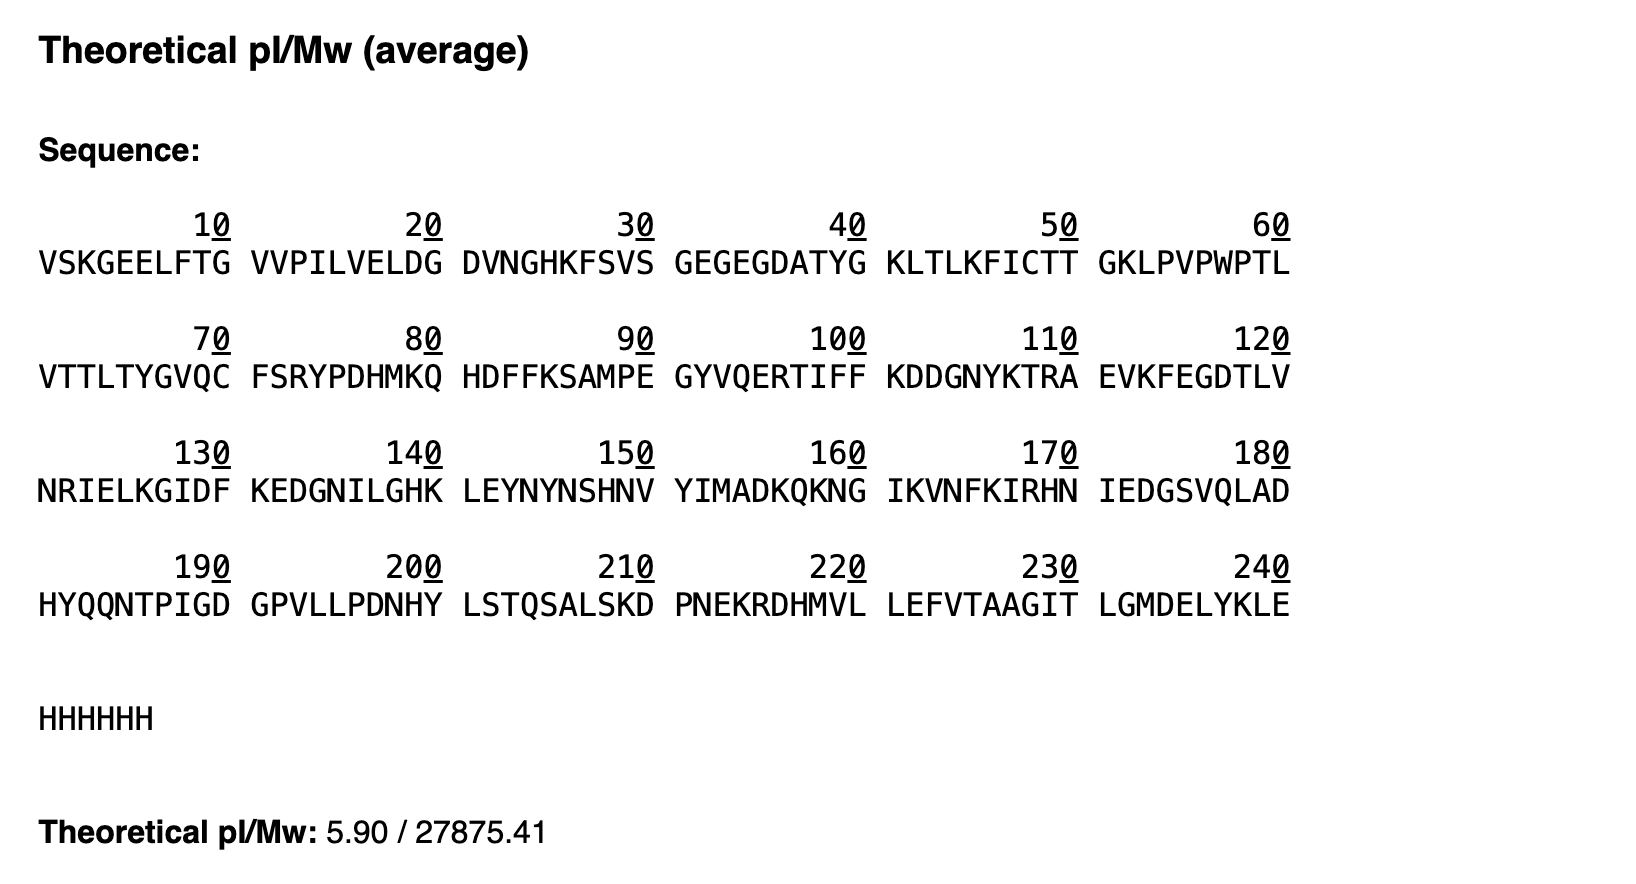
The theoretical calculated molecular weight of the eGFP construct, including the linker and His₆ purification tag, is 27875.41 Da with a theoretical pI of 5.90.
Calculate the molecular weight of the eGFP using the adjacent charge state approach described in the recitation. Select two charge states from the BioAccord data and:
- Determine z for each (n, n+1):
I choose the highest charge state and the one directly to the left.
m/z n = 824.1148
m/z n+1 = 800.6088
Therefore per the formula
z = (m/z n+1 - 1) / (m/zn - m/zn+1)
z = (800.6088-1) / (824.1148 -800.6088)
z= 799.6088/ 23.506
For n, z = 34.017221 For n+1, z = 35.017221
- Determine the MW of the protein using the relationship between m/z , MW and z.
MW = (n x m/zn - n)
MW = (34.017221 x 824.1148 - 34.017221) MW = (34.017221 x 790.0758)
Therefore: MW = 26876.923
- Calculate the mass accuracy of the measurement using the deconvoluted MW from 2.2 and the predicted weight of the protein from 2.1 using these formulae:
Accuracy = ((MW experiment - MW theory) / MW Theory) x 1000000
Accuracy = ((26876.923 - 27875.41) / 27875.41) x 1000000
Accuracy = -35,819.6346 ppm
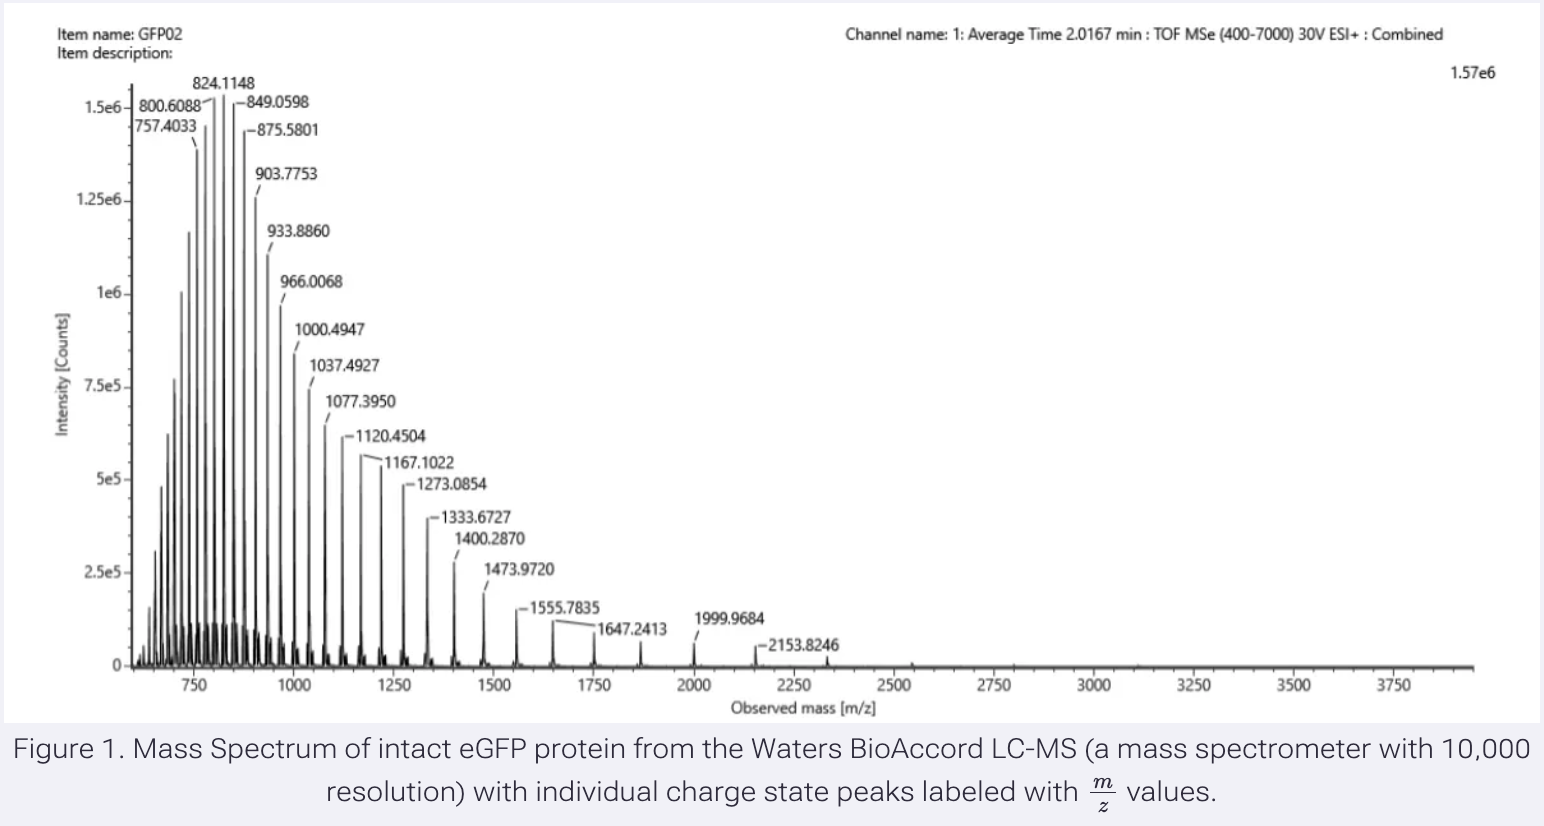
- Can you observe the charge state for the zoomed-in peak in the mass spectrum for the intact eGFP? If yes, what is it? If no, why not?
No, the charge state cannot be directly observed because the charge state is too high for the isotopic peaks to be resolved clearly at the instrument resolution used. At high charge states and large protein masses, the isotope spacing becomes very small causing the peaks to merge together.
Mass Spectrometry: Waters Part 2 : Peptide Map Work, primary structure
How many Lysines (K) and Arginines (R) are in eGFP? Please circle or highlight them in the sequence listed above. (note: Adding the sequence to Benchling as an amino acid file and clicking biochemical properties tab will show you a count for each amino acid)
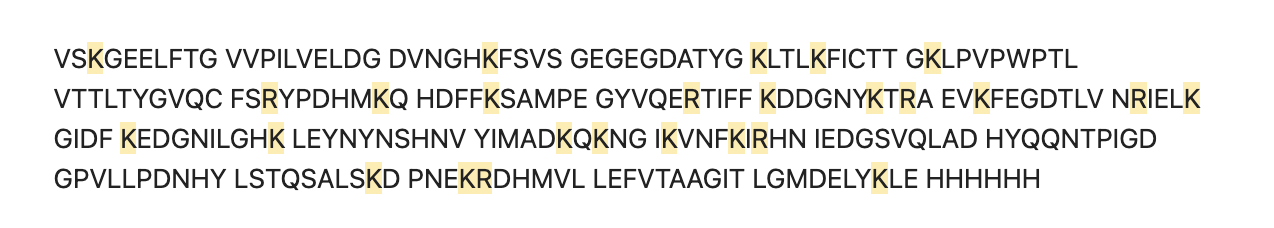
20 K and 6 R
26 Lysines and Arginines in eGFP.
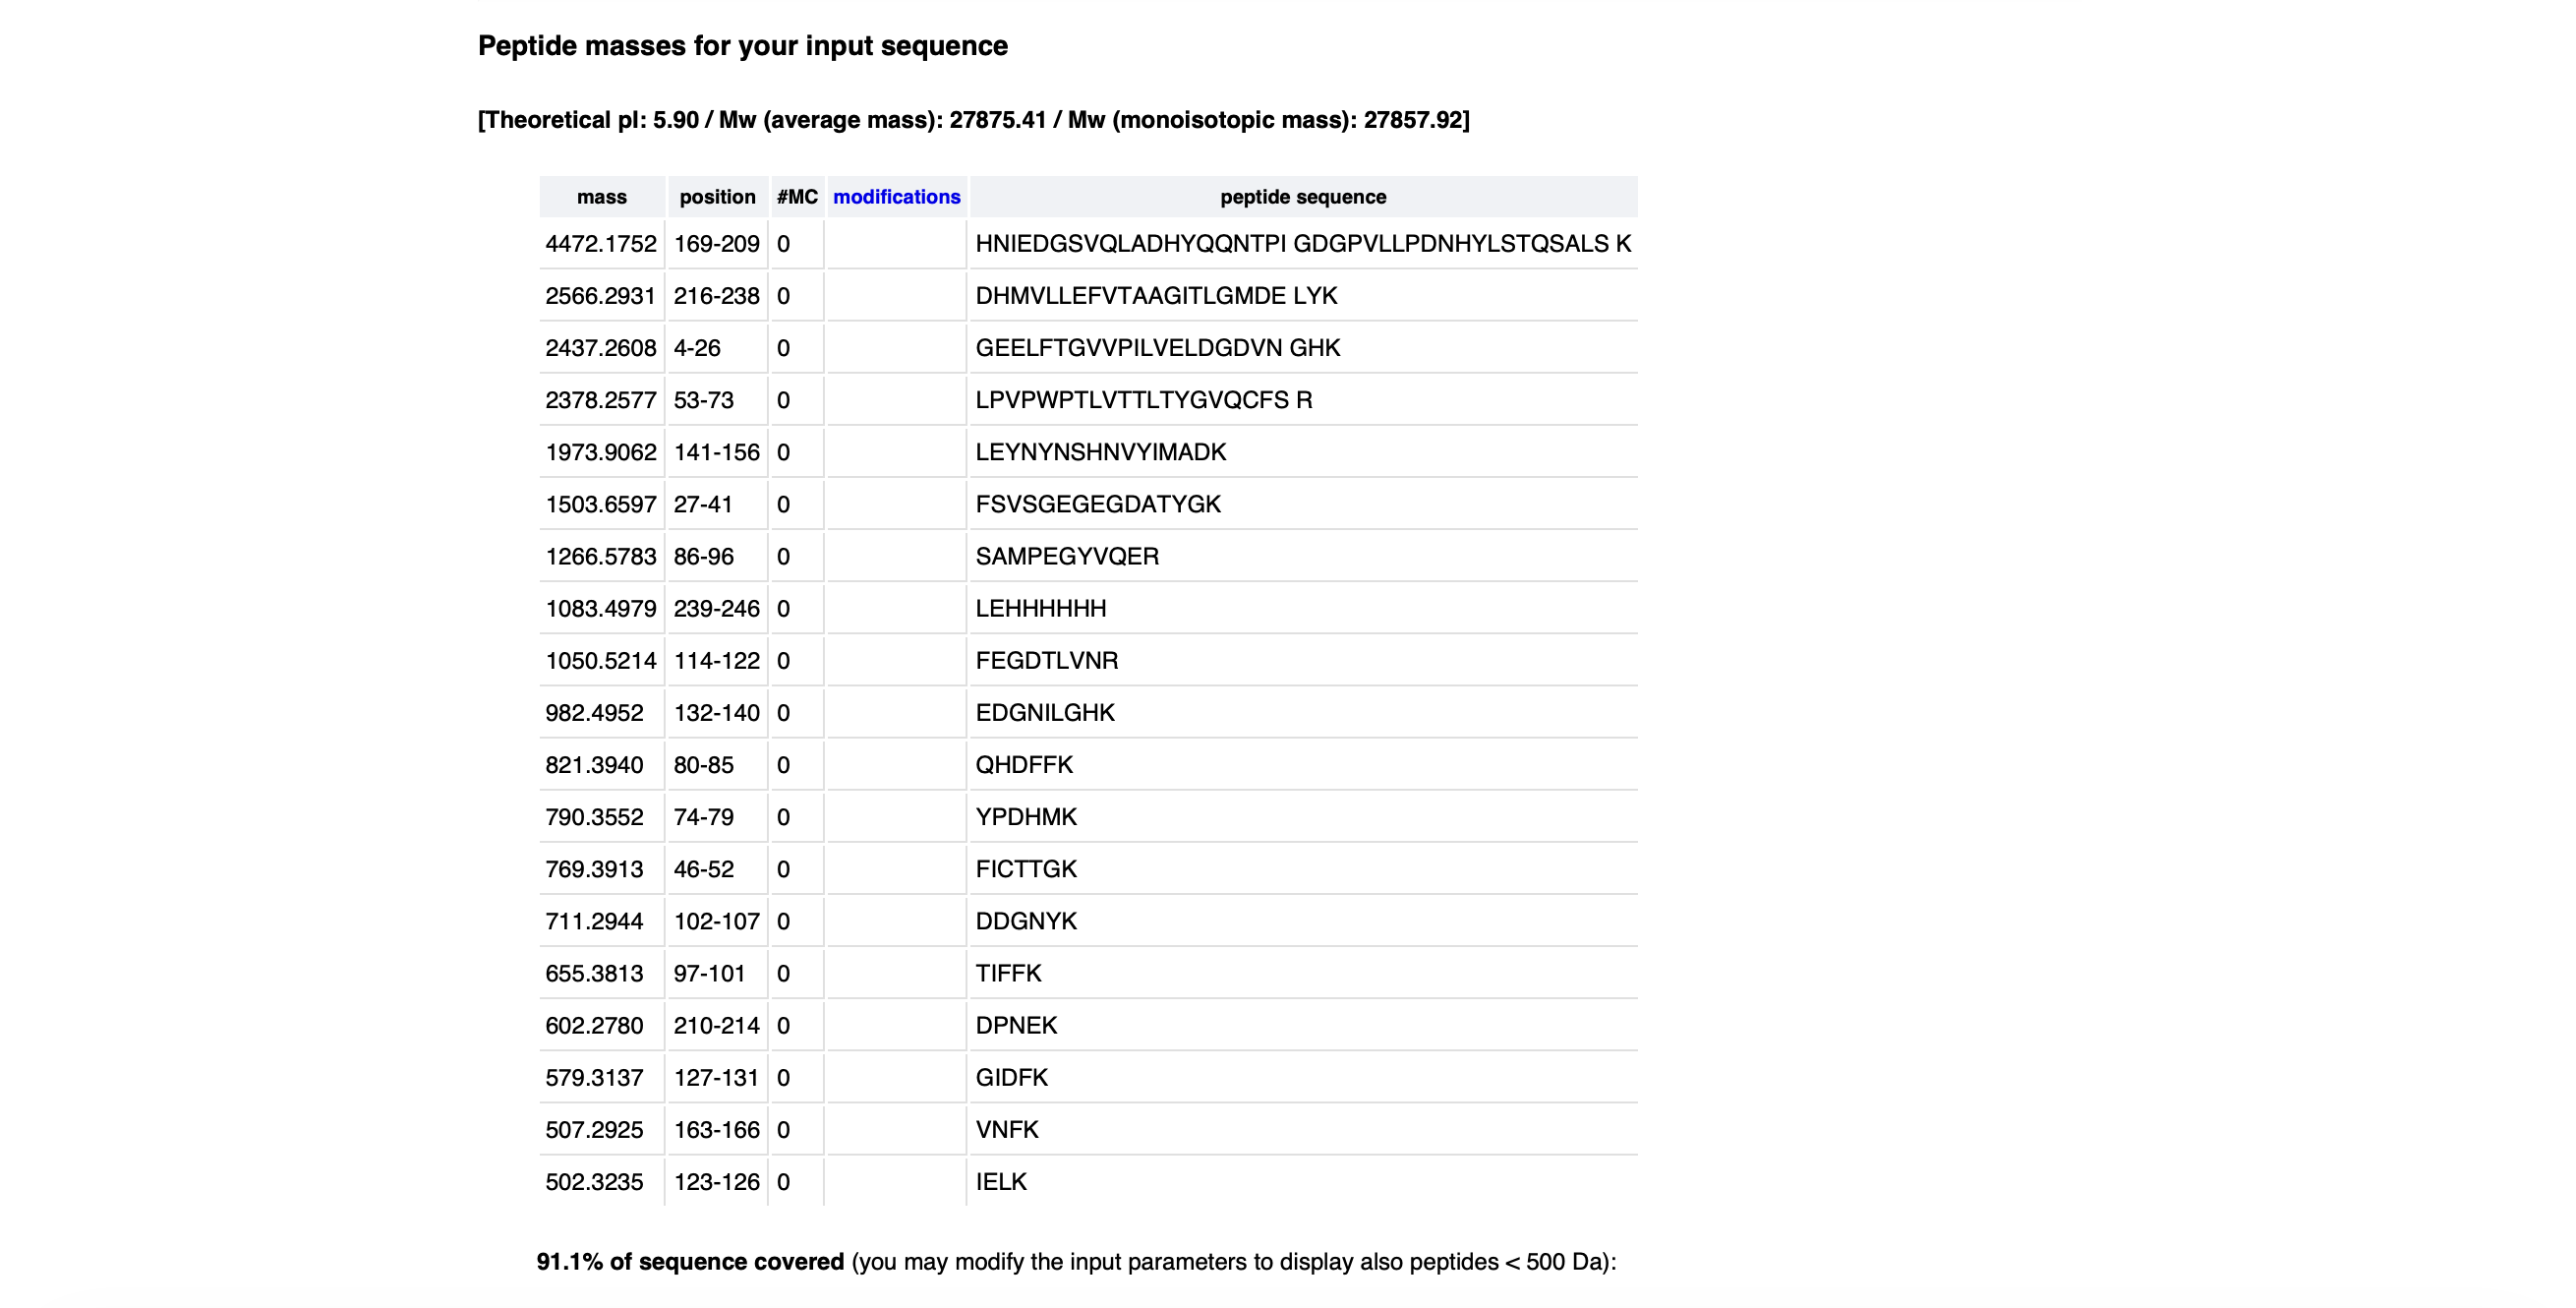
How many peptides will be generated from Tryptic digestion of eGFP?
- Navigate to https://web.expasy.org/peptide_mass/
- Copy/paste the sequence above into the input box in the PeptideMass tool to generate expected list of peptides.
- Use Figure 2 below as a guide for the relevant parameters to predict peptides from eGFP.
- Click “Perform the Cleavage” button in the PeptideMass tool and report the number of peptides generated when using Trypsin.
It generated 19 peptides using Trypsin:
Based on the LC-MS data for the Peptide Map data generated in lab (please use Figure 3a as a reference) how many chromatographic peaks do you see in the eGFP peptide map between 0.5 and 6 minutes?
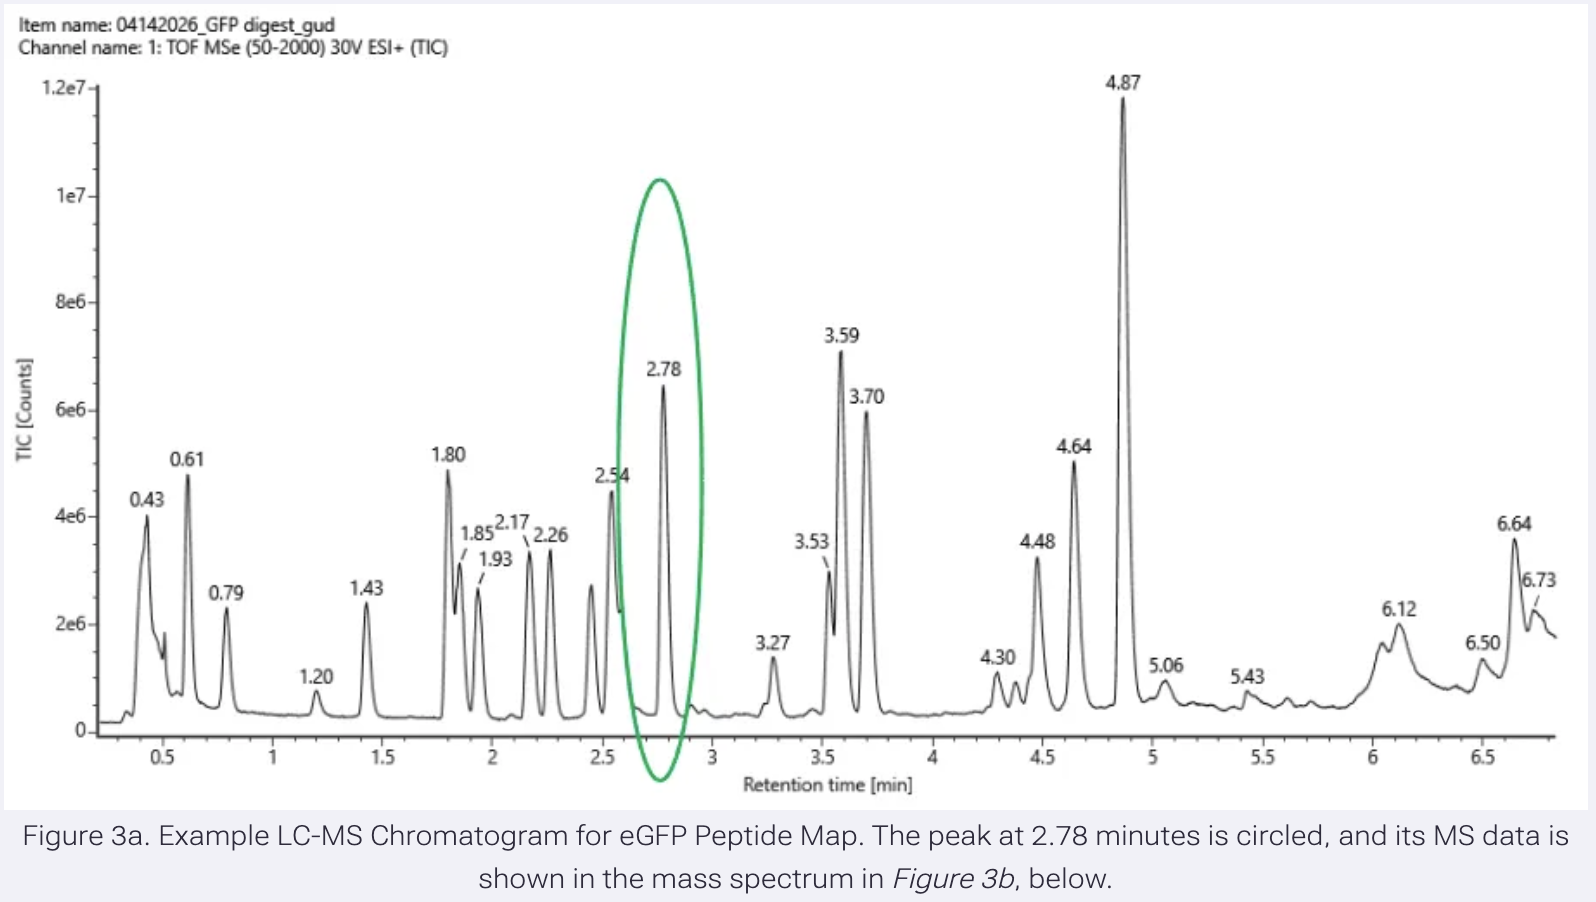
21 peaks
Assuming all the peaks are peptides, does the number of peaks match the number of peptides predicted from Step 2.3 and 2.4? Are there more peaks in the chromatogram or fewer?
No, there are more peaks in the chromatogram.
Identify the mass-to-charge (m/z) of the peptide shown in Figure 3b.
m/z of the peptide is 525.76712.
What is the charge (z) of the most abundant charge state of the peptide (use the separation of the isotopes to determine the charge state).
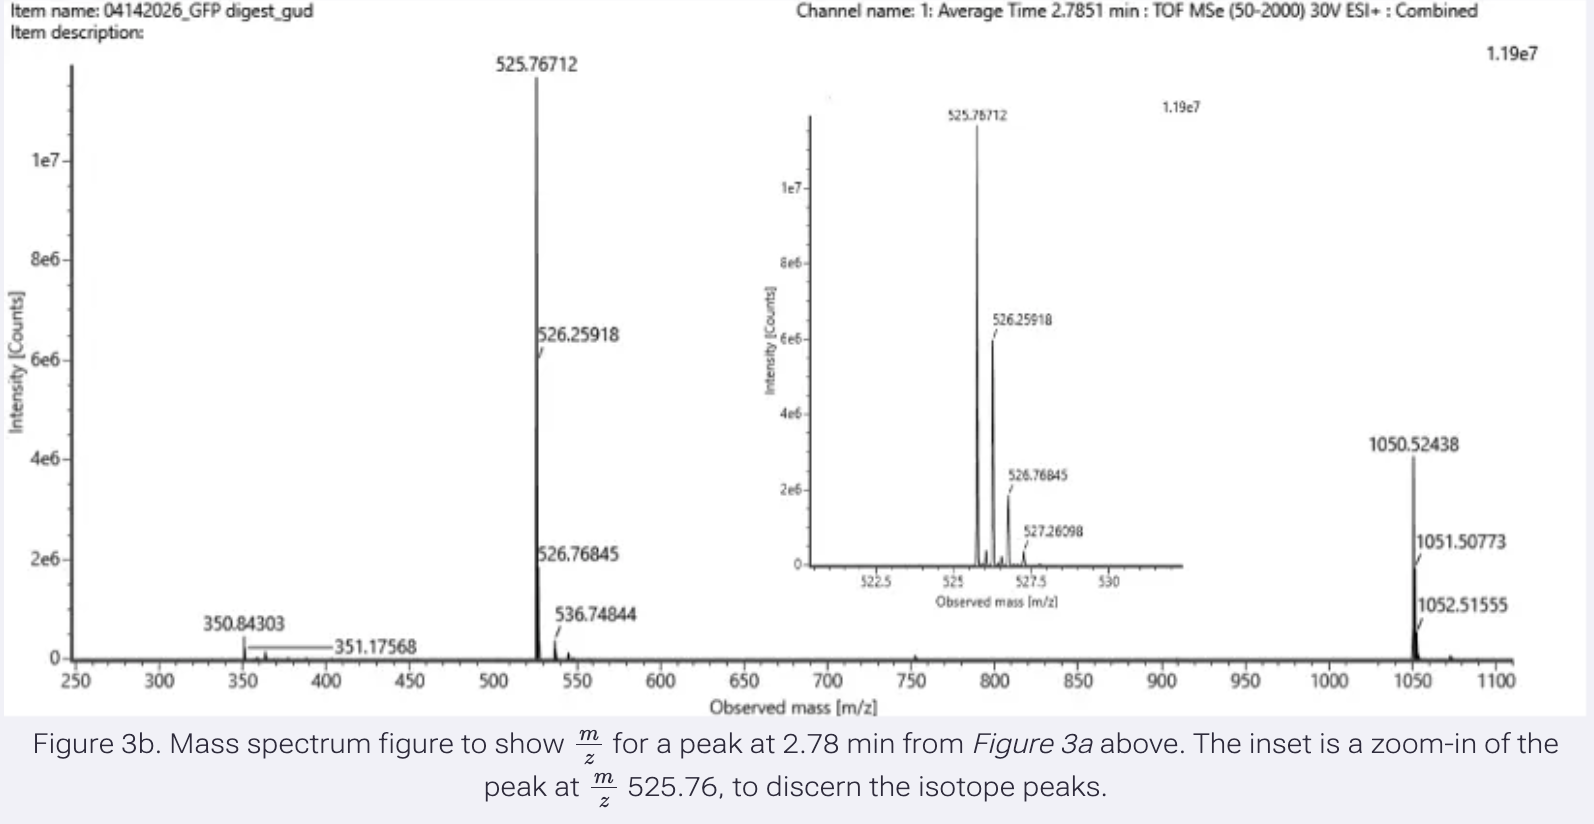
z = 1/ Δ m/z
Δ m/z = spacing between isotopic peaks.
m = 525.76712 m+1 = 526.25918
526.25918 - 525.76712 = 0.49206
Δ m/z = 0.49206
z = 1/ 0.49206
z = 2.0322724 z ≈ 2+
Calculate the mass of the singly charged form of the peptide ([M+H]+) based on its m/z and z.
m/z = (M + nH)/ n
Rearrange to:
[M + H]+ = (m/z x n) -H
where: m/z = 525.76712 n = 2.0322724 H = 1.00727 (mass of a proton H+)
Therefore:
[M+H]+ = (525.76712 x 2.0322724) - 1.00727
525.76712 x 2.0322724 = 1051.53424
[M+H]+ = 1051.53424 - 1.00727
[M+H]+ = 1050.52697 Da
Identify the peptide based on comparison to expected masses in the PeptideMass tool. What is mass accuracy of measurement? (Recall that Accuracy = ((MW experiment - MW theory) / MW Theory) x 1000000 )
Peptide Sequence: FEGDTLVNR Expected Mass: 1050.5214
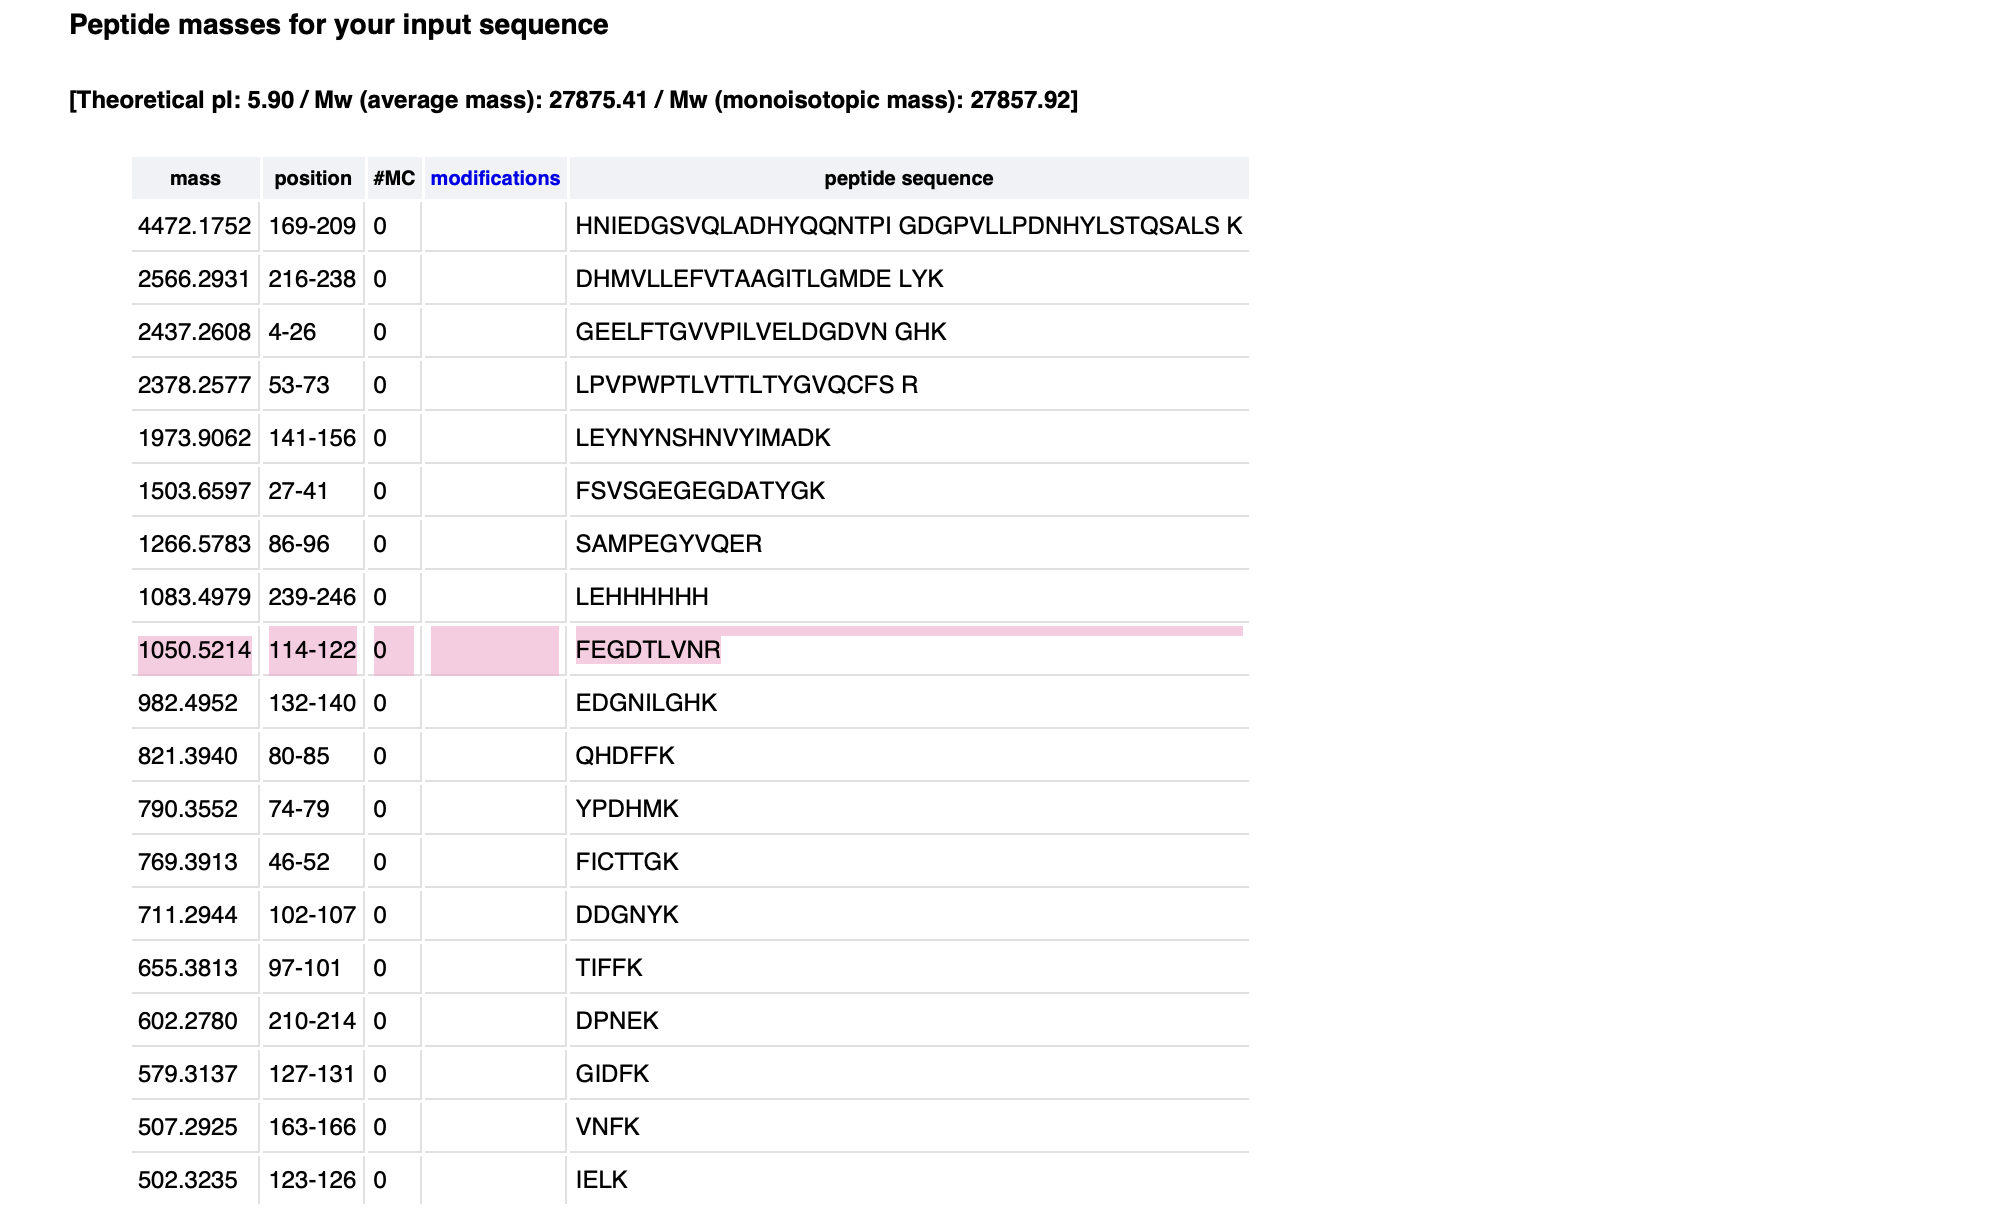
Accuracy = ((MW experiment - MW theory) / MW Theory) x 1000000 )
Accuracy = ((1050.52697 - 1050.5214) / 1050.5214) x 1000000)
Accuracy = (0.00557/1050.5214) x 1000000
Accuracy = 0.00000530212902 x 1000000
Accuracy = 5.30212902
Accuracy = 5.30 ppm
What is the percentage of the sequence that is confirmed by peptide mapping (Figure 5)?
88%
Homework: Waters Part IV — Oligomers
Using the known masses of the polypeptide subunits (Table 1) for KLH, identify where the following oligomeric species are on the spectrum shown below from the CDMS (Figure 7):
- 7FU Decamer
- 8FU Didecamer
- 8FU 3-Decamer
- 8FU 4-Decamer
| Polypeptide Subunit Name | Subunit Mass |
|---|---|
| 7FU | 340 kDa |
| 8FU | 400 kDa |
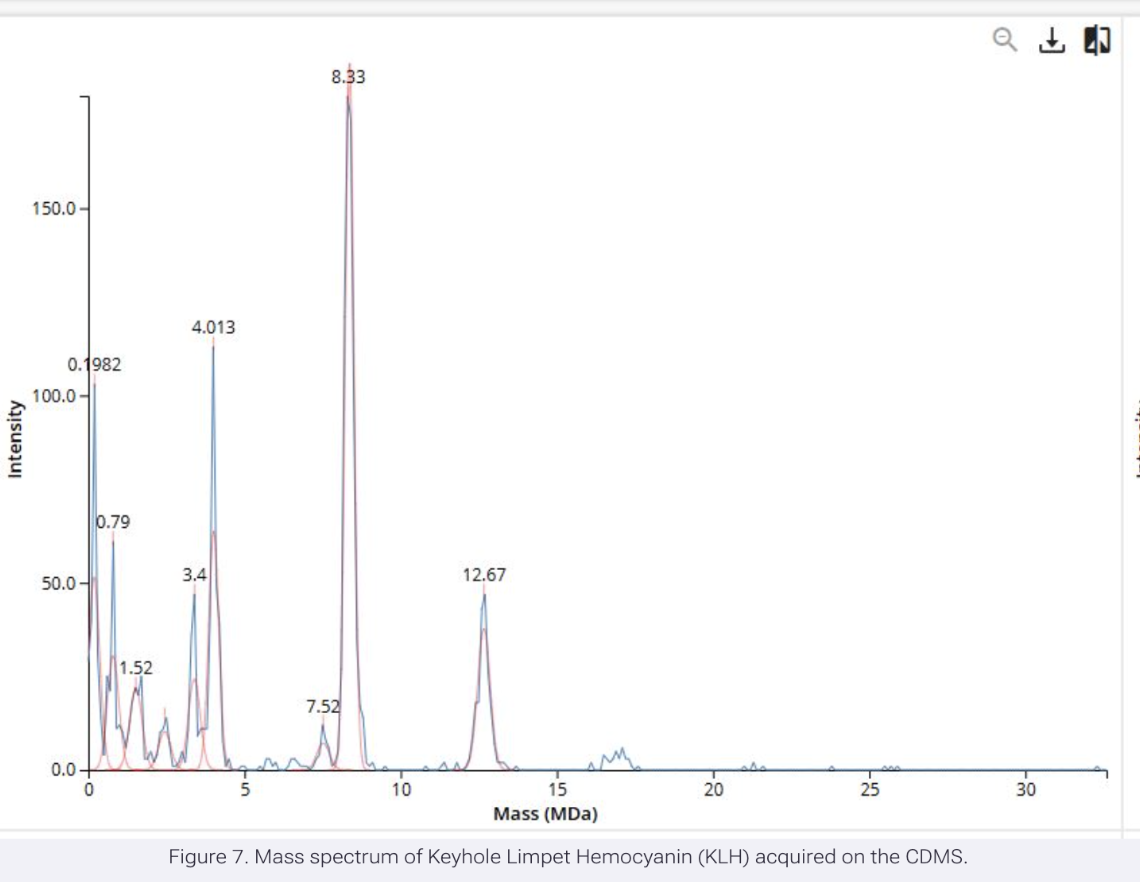
To solve this I calculated the masses of each oligomeric assembly from the monomer masses given in Table 1. I multiplied the subunit mass by the number of subunits in each oligomer:
7FU Decamer A decamer = 10 subunits
10 × 340 kDa = 3400 kDa 7FU Decamer = 3.4 MDa
8FU Didecamer A didecamer = 20 subunits
20 × 400 kDa = 8000 kDa 8FU Didecamer = 8.0 MDa
8FU 3-Decamer Three decamers = 30 subunits
30 × 400 kDa = 12000 kDa 8FU 3-Decamer = 12.0 MDa
8FU 4-Decamer Four decamers = 40 subunits
40 × 400 kDa = 16000 kDa 8FU 4-Decamer = 16.0 MDa
Therefore:
The peak at 3.4 MDa is the 7FU decamer The peak at 8.33 MDa is the 8FU didecamer The peak at 12.67 MDa is the 8FU 3-decamer And the small blue peak at approx. 16.0 MDa is the 8FU 4-Decamer
Homework: Waters Part V — Did I make GFP?
Please fill out this table with the data you acquired from the lab work done at the Waters Immerse Lab in Cambridge, or else the data screenshots in this document if you were unable to have lab work done at Waters.
| Theoretical | Observed / Measured (Intact LC-MS) | PPM Mass Error | |
|---|---|---|---|
| Molecular weight (kDa) | 27.875 kDa | 26.877 kDa | -35,819.6346 ppm |