


Subsections of Homework
Week 1 HW: Principles and Practices

Engineered bacterial cellulose to make self-pigmenting, living textiles.
I have chosen to explore a bioengineering application for creating more sustainable systems in the textile industry and more personally, an alternative material for use in design and the visual arts. Specifically, I am analysing the proposal of engineered bacterial cellulose to produce self-pigmenting textiles. In this analysis, I focus on preventing environmental harm, ensuring bio-safety, and equitable production in the deployment of this technology. I also briefly extend the discussion to the ethical implications of engineered bacterial cellulose for other bio-fabrication applications, such as increasing material yield, creating sensing and responsive materials, or affecting its mechanical structure, all applications that I am intrigued by and are seeds for potential final projects.

Walker, K. T., Li, I. S., Keane, J., Goosens, V. J., Song, W., Lee, K.-Y., & Ellis, T. (2025). Self-pigmenting textiles grown from cellulose-producing bacteria with engineered tyrosinase expression. Nature Biotechnology, 43(3), 345–354. https://doi.org/10.1038/s41587-024-02194-3. Image from online article: https://www.nature.com/articles/s41587-024-02194-3
Describe a biological engineering application or tool you want to develop and why.
I am inspired by the bio-engineered, self- pigmenting Bacterial Cellulous developed by the Future Materials Group (FMG) at Imperial College London in collaboration with Modern Synthesis.
Their research responds to the environmental impact of textile production, largely through uncontrolled microplastic pollution from synthetic fabrics, water pollution from toxic, chemical dyes and its heavy contribution to greenhouse gas emissions. It is responsible for 10% of global carbon emissions,20% of global waste water, 35% of marine microplastic pollution and is expected to account for 25% of the global carbon budget by 2050. The question that interests me here is rather than manufacturing synthetic materials and colours, can we engineer materials to grow with the aesthetic properties we want?
Self-pigmenting bacterial cellulose offers a bio-degradable, non-toxic and grown alternative to synthetic fabrics and chemical dyeing. It builds upon the development of microbial leathers and dyes in the alternative textile field, pioneered by the likes of Suzanne Lee [Biocoutre](https://www.launch.org/innovators/suzanne-lee/, Laura Luchtman and Ilfa Siebenhaar Living Colour by adopting a synthetic biology approach. The Future Materials Group genetically engineering the bacterium Komagataeibacter rhaeticus to grow bacterial cellulose that is self pigmenting.
In carbon-rich growth media, Komagataeibacter metabolize sugars and converts them into cellulose chains, which are secreted outside the cell and self assemble into a fiber network called a pellicle. This pellicle is pure bacterial cellulose and forms the base material for the BC textile.

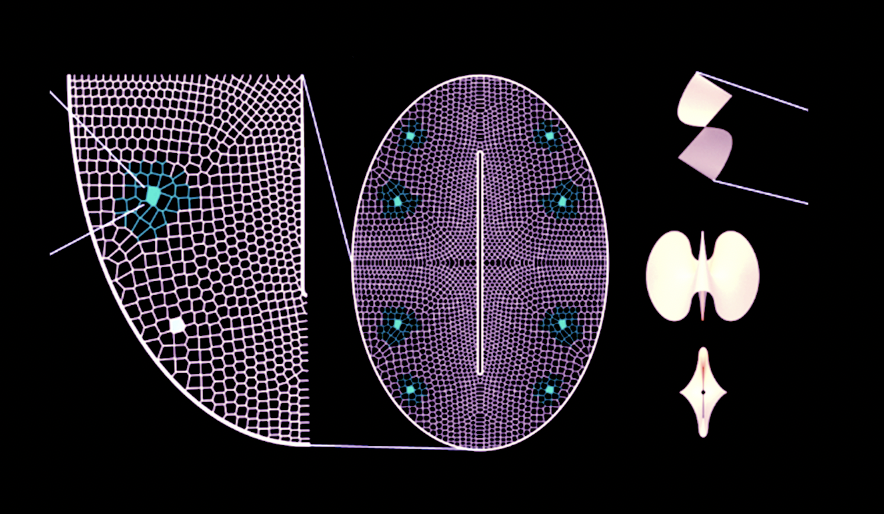
Next, the FMG engineered the biosynthesis of a pigment producing gene, in this case black melanin pigment, Eumelanin. To do this FMG inserted the tyrosinase gene (Tyr1) from Bacillus megaterium. Tyrosinase is an enzyme that converts tyrosine into dopachrome which eventually polymerises and aggregates to make black pigment. Using a modular Golden Gate cloning system, the Tyr1 gene is inserted into K. rhaeticus either on a plasmid or directly into the bacterial chromosome. As the engineered bacteria grow, they produce cellulose while also generating pigment, which becomes embedded throughout the pellicle. Instead of dyeing the textile afterward, the colour is produced from within the engineered living material itself. Additionally, research into engineered bacterial cellulose is opening up possibilities for creating living, programmable biomaterials with a wide range of functionalities. These include increased yield for scalability, embedded bio-sensing and responsive behaviours and the ability to effect its structure.
Such capabilities makes bacterial cellulose an exciting and versatile for sustainable applications in fashion, design and the visual arts, highlighting the importance of carefully considering the ethics guiding its development and broader adoption across these industries.
Walker, K. T., Li, I. S., Keane, J., Goosens, V. J., Song, W., Lee, K.-Y., & Ellis, T. (2025). Self-pigmenting textiles grown from cellulose-producing bacteria with engineered tyrosinase expression. Nature Biotechnology, 43(3), 345–354. Image: Eumelanin production from K. rhaeticus tyrosinase expression. From: Self-pigmenting textiles grown from cellulose-producing bacteria with engineered tyrosinase expression. Available at: https://www.nature.com/articles/s41587-024-02194-3/figures/1
Describe one or more governance/policy goals related to ensuring that this application or tool contributes to an “ethical” future.
1. Ensuring biosafety and laboratory containment:
The World Health Organization defines “Biosafety” in its Laboratory Biosafety Manual as “containment principles, technologies and practices that are implemented to prevent unintentional exposure to biological agents or their inadvertent release (World Health Organization, 2004).”
Genetically engineering Komagataeibacter rhaeticus to produce self-pigmenting bacterial cellulose introduces modified microbes into research and production environments. While K. rhaeticus is non-pathogenic and requires strict growth conditions to survive, the insertion of the tyrosinase gene (Tyr1) creates new biological capabilities which carry some risks of producing unintended, harmful effects to the health of humans and the environment if released.
It is particularly important to protect laboratory personell, scientists, designers, consumers and neighbouring communities from exposure to toxic, infectious or dangerous pathogens and to prevent their accidental release outside the laboratory with strict containment protocol.
2. Preventing harm to the environment:
Self-pigmenting BC textiles offer an environmentally friendly alternative to synthetic fabrics and chemical dyes, but the long-term ecological impact of introducing genetically engineered bacteria must be considered. It is important to ensure that the development, production and onward life of the Bacterial Cellulose Textile does not negatively affect the environment.
Genetic modifications and decisions made for scalability should not compromise biodegradability. Production systems should avoid petroleum-based plastics or toxic media. End-of-life disposal, industrial cultivation and potential escape into natural ecosystems should be monitored to prevent unintended ecological consequences.
3. Ensuring equity:
Access to self-pigmenting BC textiles should extend beyond large corporations and well-funded labs to designers, artisans, and educational institutions.
Development of this technology should ensure low-cost, modular production systems to enable the equitable participation of non-traditional or underprivileged communities in sustainable material creation.
Training in biosafety and handling of engineered microbes should accompany access, ensuring that communities can safely experiment with living textiles while benefiting from environmentally responsible materials.
4. Transparency and education:
Clear communication of the science, benefits and limitations of self-pigmenting BC is critical for stakeholder trust, informed consent and wider uptake of engineered living materials.
Designers, consumers, and regulators should understand how BC reduces reliance on petroleum based textiles and avoids toxic dyes. Transparency should include how the bacteria are engineered, the pigment synthesis process, and any potential environmental or health considerations.
Engaging the public through workshops, open-access resources and participatory design initiatives encourages adoption while supporting ethical decisions about integrating engineered living textiles into daily life.
5. Respect for life:
Self Pigmenting Bacterial cellulose is a living material produced by bacteria and ethical considerations should extend to the organisms themselves.
Scaling self-pigmenting BC production for textiles must balance functionality with respect for life, acknowledging the bacteria as active contributors to the material.
This perspective highlights a distinction between large-scale industrial production and smaller, artisanal or community-based approaches, emphasising that sustainability and innovation should be pursued without disregarding the living organisms at the core of bio-fabrication.
Describe at least three different potential governance “actions”, consider: Purpose, Design, Assumptions, Risks of Failure & Success.
I have outlined 3 categories of actors:
Researchers:
Those involved in the research and development of Self pigmenting Bacterial cellulose e.g Scientists, Universities, Research Centers, Community Bio-labs.
Producers:
Those involved in turning SPBC into actual products and for use in design and manufacturing e.g. Designers, artists, fashion designers, companies, bio-material start ups.
Regulators:
Those involved in control of safely deploying this technology on a local, national and international level e.g Local Authority Environmental Health Department, Waste Management Boards, Research Ethics Committees, Department of Environment, Food and Rural Affairs, The Health and Safety Executive.
1. Ensuring biosafety and laboratory containment
ACTION: Implement strict biosafety protocols and containment standards for research and production facilities handling engineered K. rhaeticus.
PURPOSE: Prevent accidental exposure or environmental release of genetically modified bacteria.
DESIGN:
Researchers should ensure that genetically engineered K. rhaeticus strains are safe and non-pathogenic.
Regulators should require Biosafety Level 1+ facilities, PPE, and biosafety training for all SPBC work.
Researchers should test bio-containment strategies such as kill-switches linked to the Tyr1 pigment pathway.
Producers should gain approval from institutional or local biosafety boards before scaling production.
Regulators should enforce sterilisation of spent cultures prior to disposal and include periodic risk and life-cycle assessments in SPBC workflows.
ASSUMPTION: I assume that risk to biosafety from K. rhaeticus is low and that it cannot survive in open environments. I assume that containment technologies and protocols are sufficient to prevent accidental release. I assume that all researchers and designers would adhere to training and protocol.
RISK OF FAILURE: Failure risks accidental release beyond the laboratory that could lead to unintended effect on the environment or humans.
RISK OF SUCCESS: Safe research and production is wide spread, increasing demand for DIY genetic engineering and biohacking to make SPBC, which may require more wide spread biosafety training and stricter protocol.
2. Preventing harm to the environment
ACTION: Require lifecycle assessment and contained environmental monitoring for large-scale production of self pigmenting bacterial cellulose.
PURPOSE: Ensure that self-pigmenting BC textiles remain a sustainable alternative to synthetical coloured fabrics and monitor its life cycle to ensure that use and disposal of genetic engineering materials has no unintended impact on the environment.
DESIGN:
Researchers should test large-scale cultivation and end-of-life treatment to prevent ecological pollution.
Producers should be required to submit life-cycle assessments covering carbon footprint, biodegradability, toxicity, and disposal.
Regulators should enforce compliance with local environmental and waste-management regulations for genetically engineered materials.
ASSUMPTION: I assume that engineered self-pigmented bacterial cellulose behaves consistently at different scales and with different production methods, when individual producers may need more tailored environmental restrictions. I assume that all environmental monitoring can accurately capture all possible environmental impacts long term. I assume that with scalability and commercialisation, all producers will maintain sustainability as a priority in producing SPBC.
RISK OF FAILURE: Genetic engineering and scalability effects the biodegradability of the material. Unforeseen environmental impact is created by the use and disposal of SPBC at scale.
RISK OF SUCCESS: Wide spread commercial uptake of SPBC creates challenges for scaled manufacturing and efficient cellulose yield, increasing environmental impact.
3. Ensuring equity, transparency and education
ACTION: Develop technology should also fund low-cost and accessible production available to smaller bio-production spaces. Researchers and producers would hold engagement and education initatives so that use of the sustainable material is understood and available to a wide range of stakeholders.
PURPOSE: Allow equitable access to bio-engineered, living material and ensure transparency and consent from the public.
DESIGN:
- Researchers should provide biosafety training and open educational resources for community labs and schools.
- Researchers should establish governed strain-sharing programs for qualified smaller labs.
- Researchers should partner with artists, designers and under-resourced communities to explore local applications.
- Producers should be required to provide clear labelling and marketing explaining pigment production, genetic engineering and environmental benefits.
ASSUMPTION: I assume there would be engagement from non-traditional users. I assume there would be resources and initatives in place to support community engagement and educational initatives. I assume that some smaller labs would be able to maintain proper biosafety practices to accomodate the use of genetically engineered bacterial cellulose.
RISK OF FAILURE: Risk the misuse of genetically engineered material. Risk that underfunding may limit accessibility to use of the material and its development remains expensive and highly centralised. Miscommunication could cause fear or misinformation and create an aversion to the uptake of the material.
RISK OF SUCCESS: Success expands access to sustainable textiles and gentic engineering but poses complexities with a higher demand for DIY biohacking and public access to genetic engineering.
4. Respect for life
ACTION: Establish and enforce ethical guidelines for scaling SPBC production.
PURPOSE: To recognise bacteria as living contributors and discourage unnecessary cultivation, waste or harmful treatment.
DESIGN:
- Regulators should create industry standards for responsible growth volumes (avoiding over-production of Komagataeibacter rhaeticus).
- Open forum for discussion between researchers and producers to establish conduct for most humane termination and sterilisation of cultures after use.
ASSUMPTION: I assume stakeholders value ethical treatment of bacteria. I assume that ethics will be prioritised over industrial production. I assume ethical guidelines influence industrial practices.
RISK OF FAILURE: Industrial production may prioritise efficiency over respect for living organisms.
RISK OF SUCCESS: The inherent conflict of the use of other living beings still exists.
Score (from 1-3 with, 1 as the best) each of your governance actions against your rubric of policy goals.
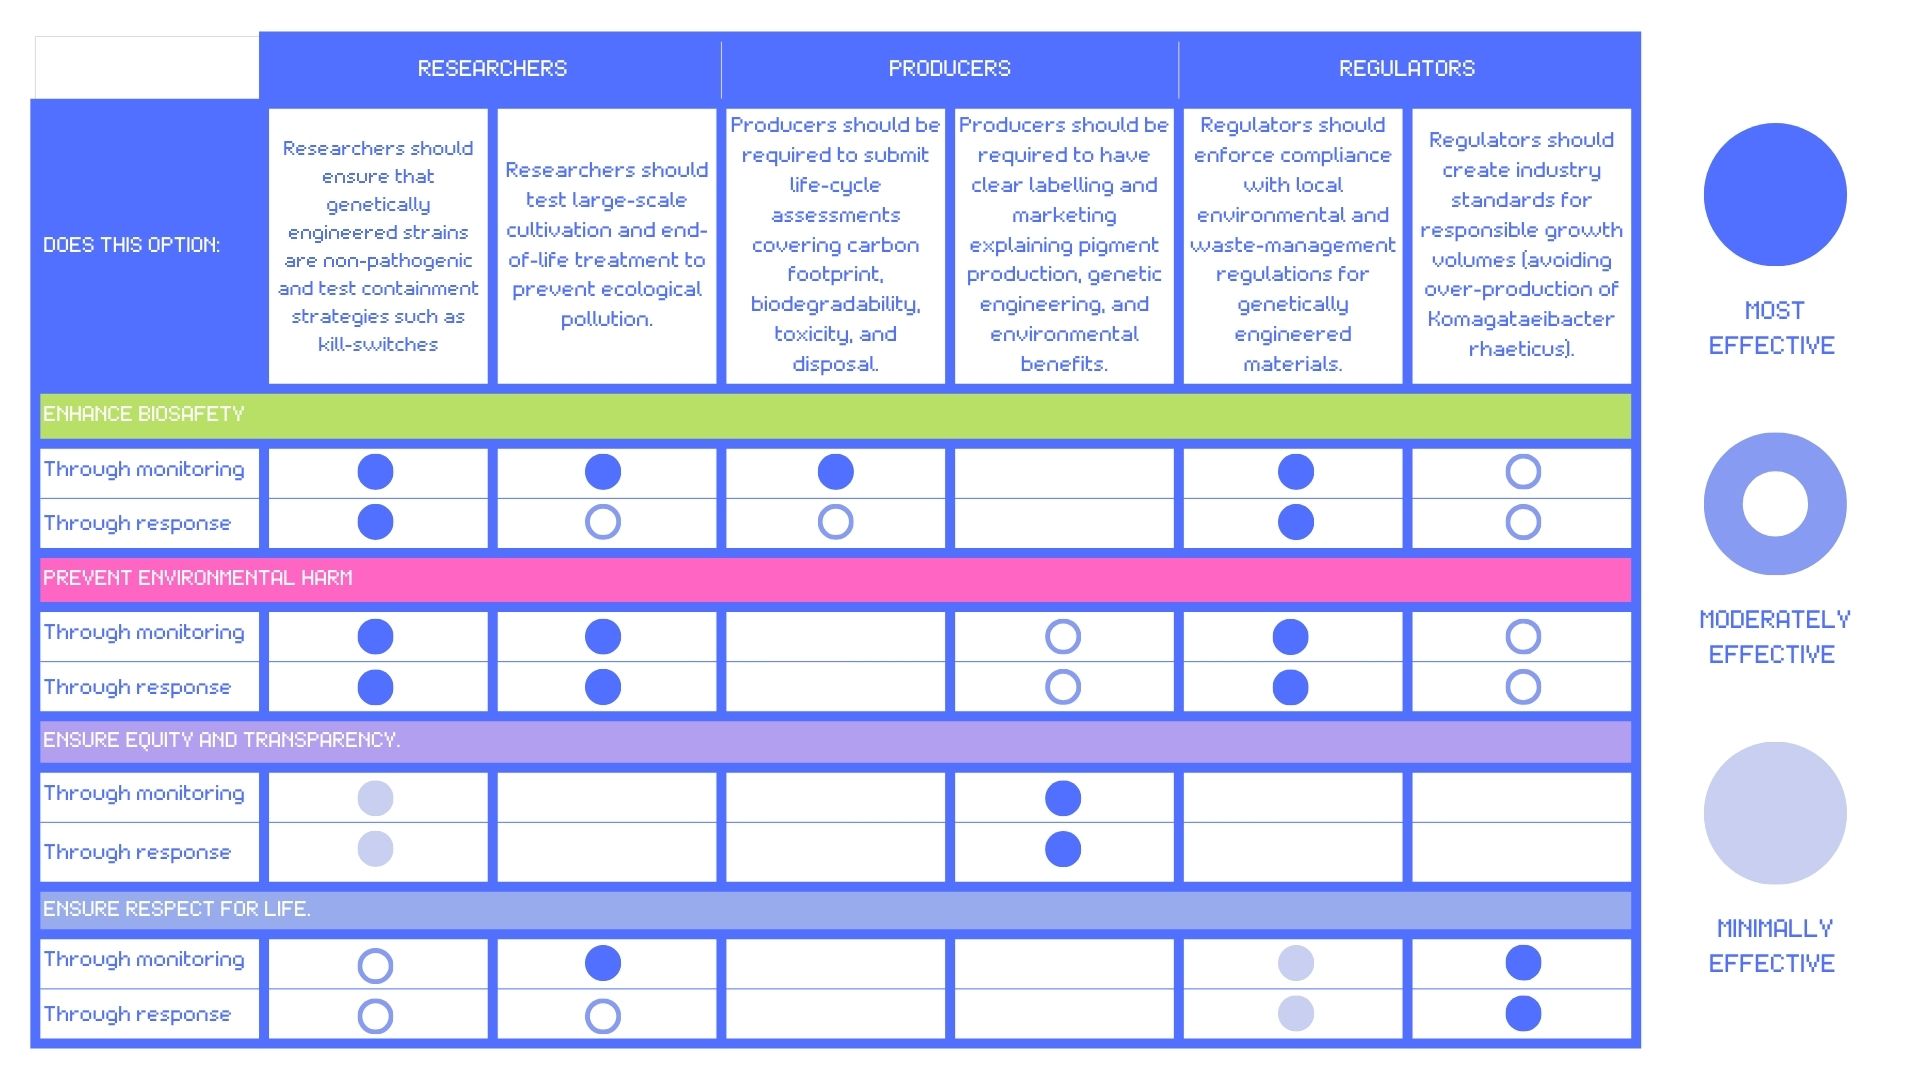
Rubric by Isobel Jo Leonard
Describe which governance option or combination of options, you would prioritise, and why.
Priorities
From the analysis in my table, the governance goals I would prioritise for the ethical development of self-pigmenting bacterial cellulose would be bio-security, prevnting environmental harm and transparency. This would require a hybrid strategy that triangulates researcher responsibility, producer accountability and high regulatory standards on a local, national and international level.
First, I prioritise actions that embed biosafety at the research stage. Researchers engineering Komagataeibacter rhaeticus should be responsible for ensuring non-pathogenic behaviour, testing containment strategies such as Tyr1-linked kill-switches, evaluating large scale cultivation strategies and end-of-life sterilisation. Designing safety into self-pigmenting bacterial cellulose production early is the most effective way of reducing harm when the materials enter production or circulation.
Second, environmental regulation becomes critical as SPBC scales beyond the lab. Producer-level actions such as life-cycle assessment, biodegradability standards and regulated waste management ensure that genetic modification and increased scale and access do not undermine the sustainability goals of replacing petroleum-based textiles, nor does SPBC’s use or disposal disrupting natural ecosystems.
Finally, these technical controls must be supported by transparency and public engagement. Clear labelling and education initiatives surrounding how genetic engineering operate in SPBC allow designers, consumers, and regulators to make informed decisions. Transparency builds trust and supports adoption, ensuring that living, engineered biomaterials can be widely adopted safely.
Trade offs
The rubric highlights a clear trade-off between biosecurity and equity. The stricter regulatory measures for researchers and producers increase the costs and barriers to working with these materials. While it is important that DIY bio-fabrication spaces and small-scale industries maintain access, this access cannot compromise biosafety regulations or the requirement for ethical research training.
Another inherent trade-off involves respect for life. Efforts to expand the development, accessibility and scalability of this technology raise ethical questions regarding the extractavist use of more than human life in the service of human ends.
Assumptions and uncertainties
I think an assumption underpinning my analysis is that producers and regulators will prioritise sustainability over the efficiency and profit of scaling this highly functional material. Although the fundamental process of producing self-pigmenting bacterial cellulose is sustainable, I am uncertain whether its development for applications in industries such as fashion and design, would create pressures for increasing yield, durability and aesthetic that compromise its sustainability. For this reason, my proposed actions may have over stated the influence and enthusiasm of regulatory bodies to prevent harm.
References
Ellis, T. (n.d.) Engineering bacteria to grow a leather that dyes itself black. Available at: https://www.tomellislab.com/post/engineering-bacteria-to-grow-a-leather-that-dyes-itself-black
Florea, M., Hagemann, H., Santosa, G., Abbott, J., Micklem, C.N., Spencer-Milnes, X., de Arroyo Garcia, L., Paschou, D., Lazenbatt, C., Kong, D., Chughtai, H., Jensen, K., Freemont, P.S., Kitney, R., Reeve, B. and Ellis, T. (2016) ‘Engineering control of bacterial cellulose production using a genetic toolkit and a new cellulose-producing strain’, _Proceedings of the National Academy of Sciences of the United States of America. https://doi.org/10.1073/pnas.1522985113
Goosens, V.J., Coussement, P., De Paepe, B., De Maeseneire, S., De Mey, M. and Soetaert, W. (2021) ‘Komagataeibacter tool kit (KTK): a modular cloning system for multigene constructs and programmed protein secretion from cellulose producing bacteria’, ACS Synthetic Biology. https://doi.org/10.1021/acssynbio.1c00365
Huang, Y., Zhu, C., Yang, J., Nie, Y., Chen, C. and Sun, D. (2014) ‘Recent advances in bacterial cellulose’, Cellulose. https://doi.org/10.1007/s10570-013-0088-z
Hunckler, M.D. and Levine, A.D. (2022) ‘Navigating ethical challenges in the development and translation of biomaterials research’, Frontiers in Bioengineering and Biotechnology. https://doi.org/10.3389/fbioe.2022.899428
Malcı, K., Li, I.S., Kisseroudis, N. and Ellis, T. (2024) ‘Modulating microbial materials: Engineering bacterial cellulose with synthetic biology’, ACS Synthetic Biology. https://doi.org/10.1021/acssynbio.4c00615
Next Nature Network (2019) Bio-textiles. Available at: https://nextnature.org/en/magazine/story/2019/bio-textiles
Ou, Y. and Guo, S. (2023) ‘Safety risks and ethical governance of biomedical applications of synthetic biology’, Frontiers in Bioengineering and Biotechnology. https://doi.org/10.3389/fbioe.2023.1292029
Quijano, L., Fischer, D., Ferrero-Regis, T. et al. (2025) ‘Exploring bacterial cellulose as an engineered living and programmable biomaterial across disciplines through qualitative thematic analysis’, Scientific Reports. https://doi.org/10.1038/s41598-025-01931-1
Schiros, T.N. et al. (2022) ‘Microbial nanocellulose biotextiles for a circular materials economy’, Environmental Science: Advances. https://doi.org/10.1039/D1VA00044E
Shuster, V. and Fishman, A. (2009) ‘Isolation, cloning and characterization of a tyrosinase with improved activity in organic solvents from Bacillus megaterium’, Journal of Molecular Microbiology and Biotechnology. https://doi.org/10.1159/000243640
Singhania, R.R., Patel, A.K., Tsai, M.L., Chen, C.W. and Dong, C.D. (2021) ‘Genetic modification for enhancing bacterial cellulose production and its applications’, Bioengineered. https://doi.org/10.1080/21655979.2021.1968989
Tkaczyk, A., Mitrowska, K. and Posyniak, A. (2020) ‘Synthetic organic dyes as contaminants of the aquatic environment and their implications for ecosystems’, Science of the Total Environment. https://doi.org/10.1016/j.scitotenv.2020.137222
Hub for Biotechnology in the built environment. Human–bacteria interfaces. Available at: http://bbe.ac.uk/human-bacteria-interfaces/
Week 2: DNA: Read, Write, Edit Homework Questions
Homework Questions from Professor Jacobson:
Nature’s machinery for copying DNA is called polymerase. What is the error rate of polymerase? How does this compare to the length of the human genome. How does biology deal with that discrepancy?
AI prompts: ChatGPT accessed 2026: “Can you explain Error Correcting Polymerase to me in the stages of extension, extension error and proofreading? “What would the error rate of polymerase be copying the human genome, error rate of polymerase is 1:10⁶”
The Error Rate of polymerase is 1:10⁶. Human genome length is ~3 × 10⁹ bp. Without proofreading, the error rate for copying the human genome would be large (approx. error rate is ~3,000 mistakes per replication.)
Biology deal with this discrepency with Error Correcting Polymerase which works in stages:
Extension: The polymerase adds nucleotides (nucleotide triphosphates) one by one to the growing DNA strand.
Extension error: Occasionally, the polymerase incorporates an incorrect, non-complementary nucleotide and stalls.
Proofreading: The polymerase detects and removes misincorporated nucleotides via 3′→5′ exonuclease activity, drastically reducing errors.
This all allows for accurate replication of the large human genome despite the high error rate of the polymerase.
How many different ways are there to code (DNA nucleotide code) for an average human protein? In practice what are some of the reasons that all of these different codes don’t work to code for the protein of interest?
Due to codon degeneracy, an average human protein (~345 amino acids) can be coded by an astronomically large number of different DNA sequences.
Even though they code for the same amino acids, many sequences are unusable due to:
- Codon bias: different organisms prefer different codons due to tRNA abundance. If an organism uses a rare codons it can slow or stall translation because trna is scarce causing the protien to misfold.
- mRNA stability and folding: some DNA nucleotide sequences produce mRNA that folds into secondary structures, which can prevent efficient translation even though the amino acid sequence is correct.
Homework Questions from Dr. LeProust:
What’s the most commonly used method for oligo synthesis currently?
Solid-phase phosphoramidite synthesis.
Why is it difficult to make oligos longer than 200nt via direct synthesis?
AI prompts: ChatGPT accessed 2026: Explain this section to me simply: “A key challenge in DNA synthesis is the generation of >300- nucleotide DNA, which is limited by the elongation cycle efficiency, that is, the efficiency with which each nucleotide is incorporated in the sequence. For example, with the elongation cycle efficiency of 99%, the theoretical yield for an oligonucleotide comprising 120 nucleotides is ~30%(0.99 120 × 100%). However,for a 200 bp polymer/ oligonucleotide,this is reducedtojust 13%. Attempts to over come this issue have focused on improving the accuracy and speed of DNA assembly processes.”
It is difficult to make oligonucleotides longer than 200 nt via direct chemical synthesis because of the elongation cycle efficiency (the efficiency with which each nucleotide is added during synthesis). Even if the per-step efficiency is high (e.g. 99%), the overall yield of full-length oligos drops exponentially with length. For example, a 120 nt oligo would have ~30% full-length product, while a 200-nt oligo drops to ~13%. This cumulative effect of imperfect nucleotide addition makes direct synthesis of long oligos impractical.
Why can’t you make a 2000bp gene via direct oligo synthesis?
AI prompts: “What would be the difference to synthesise a 2000bp gene via direct synthesis?”
Essentially for the same reason. Oligos are synthesised with solid phase phosphormidite one nucleotide at a time. A 2000bp gene is double stranded DNA meaning 1bp is 2 nucleotides, that is 4000 nt. The yield of full-length product declines rapidly as the length exceeds 150-200 nucleotides. 200 nt is already low (~13% full-length at 99% efficiency per step). For a 2000 bp, the theoretical yield of the correct molecule becomes negligibly small, often less than 1%.
Homework Question from George Church:
What are the 10 essential amino acids in all animals and how does this affect your view of the “Lysine Contingency”?
Histidine (His),Isoleucine (Ile), Leucine (Leu),Lysine (Lys), Methionine (Met), Phenylalanine (Phe), Threonine (Thr), Tryptophan (Trp), Valine (Val), Arginine (Arg).
By “Lysine Contingency” I assume this is refering to Jurassic Park, where scientists genetically engineer the Dinosaurs DNA so they cannot synthesise lysine. This creates a dependency on the lysine supplements provided by the park staff. Given that lysine is an essential amino acid for metabolising proteins and the dinasaurs would not be able to survive without it, the “Lysine Contingency” is effectively a kill switch, a clever containment strategy which prevents the survival of the dinosaurs if they escaped the island and ensuring they could not harm the outside world or global ecosystems.
Week 2 HW: DNA Read, Write and Edit

Important
Part 1: Benchling & In-silico Gel Art
Using Benchling, I imported the Lambda DNA and began simulating the Restriction Enzyme Digestion with the following enzymes: EcoRI-HF, HindIII-HF, BamHI-HF, KpnI-HF, EcoRV-HF, SacI-HF, SalI-HF.
Here is the Virtual Digest (left) and Linear Sequence Map (right) I produced in Benchling:


Click here to see the linear sequence map in Benchling
Next, I create a pattern/image in the style of Paul Vanouse’s Latent Figure Protocol artworks using this Ronan’s iterating tool. This is preparation for a Gel Electrophoresis lab, a fundamental laboratory technique used to separate and analyze DNA but with the added fun of using the process to make DNA Gel art.
I made this funky design:


Part 3: DNA Design Challenge
Choose your protein:
I have been thinking a lot about Chronobiology. I have an interest in our connection to the temporalities and rhythms of more than human species. Brainstorming for my final project, I am thinking about ways that I could use speculative bio-design to explore the patterns of presence and absence of other species and make tangible specific patterns of activity that are less visible, illusive or little known.

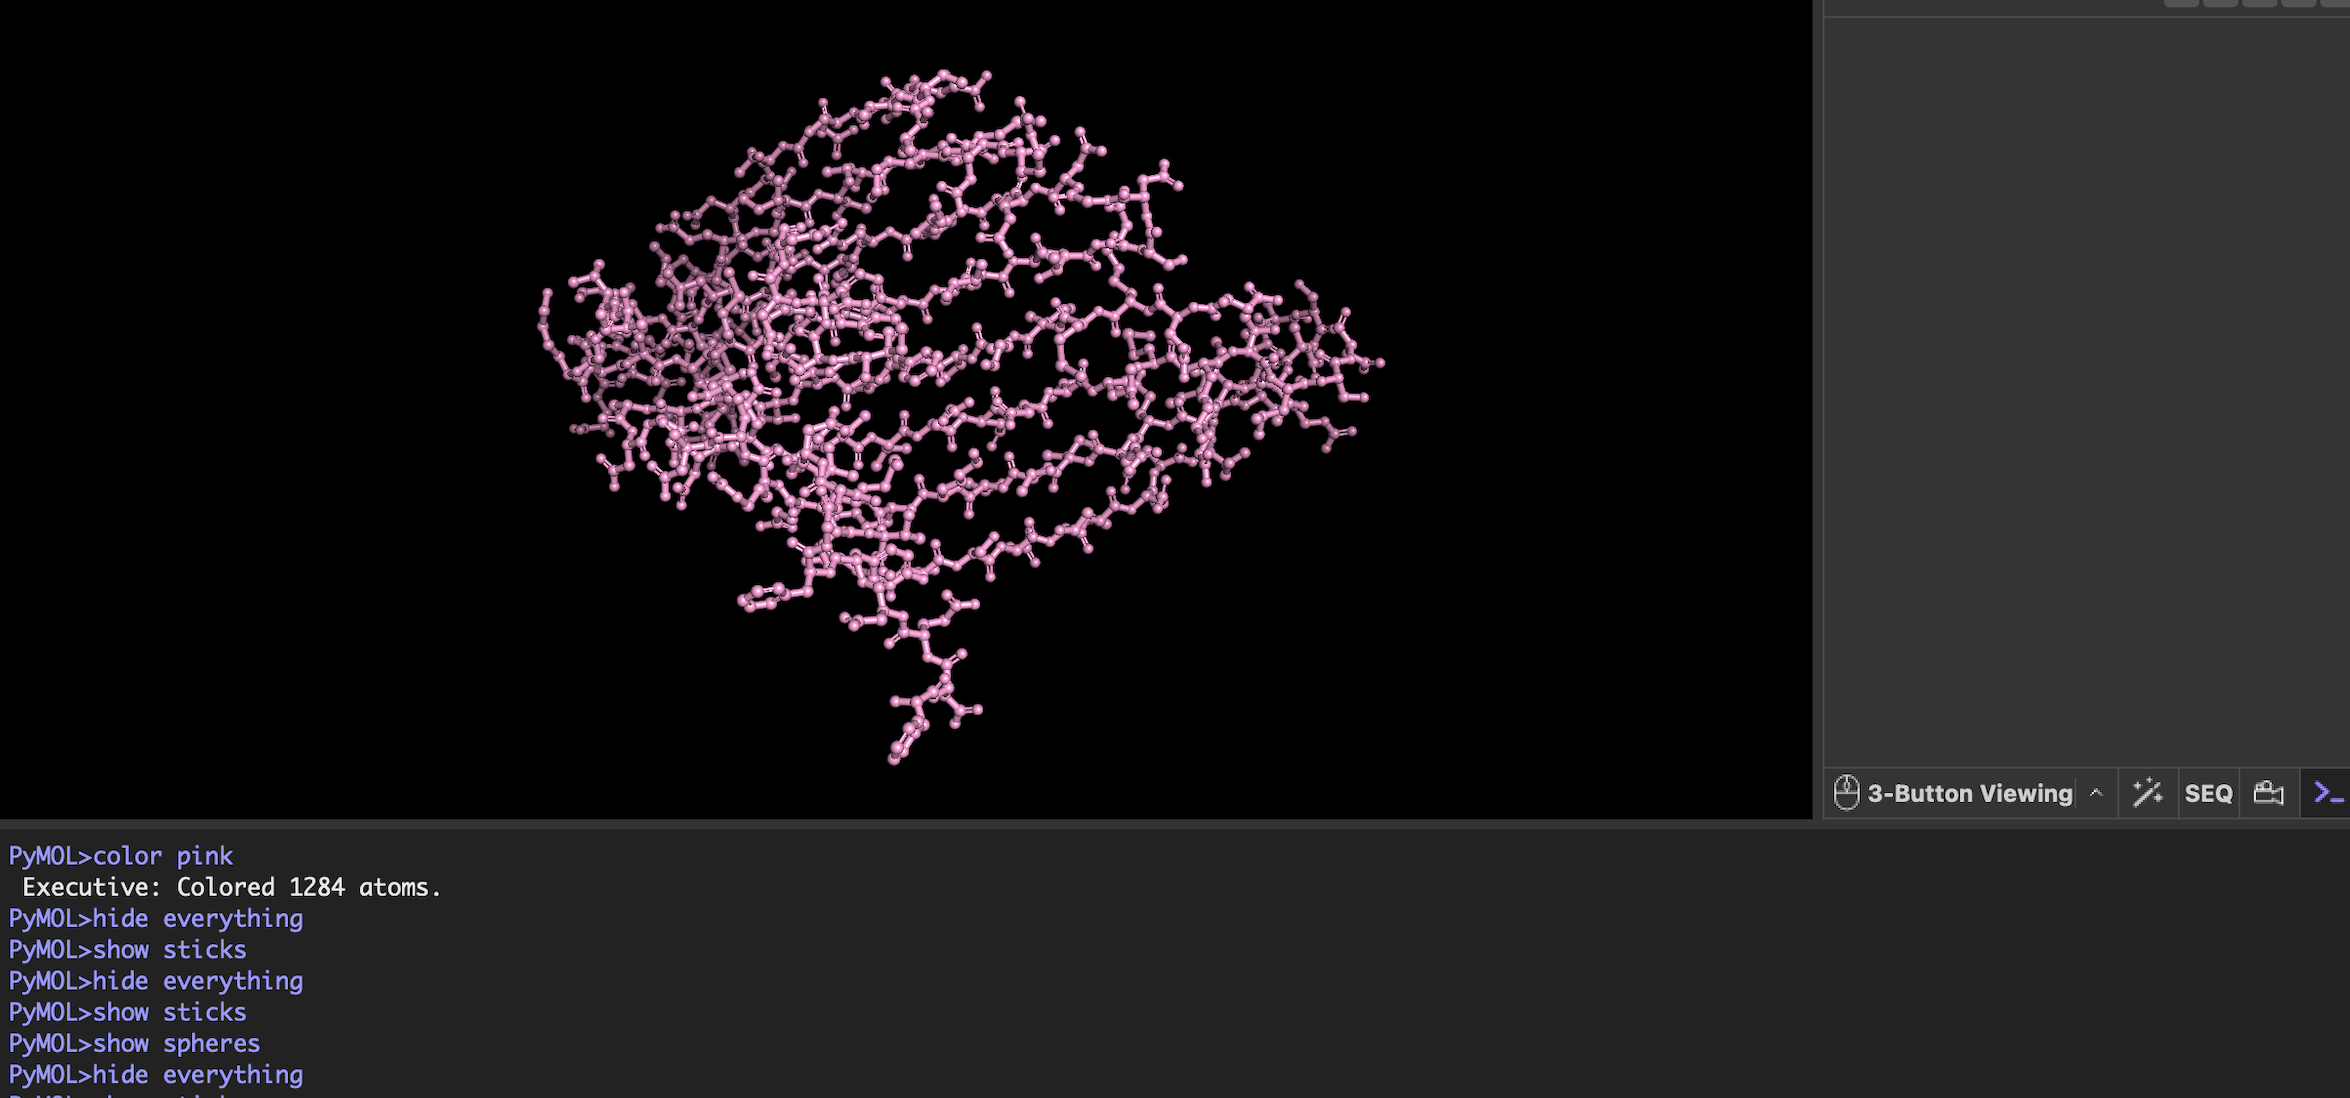
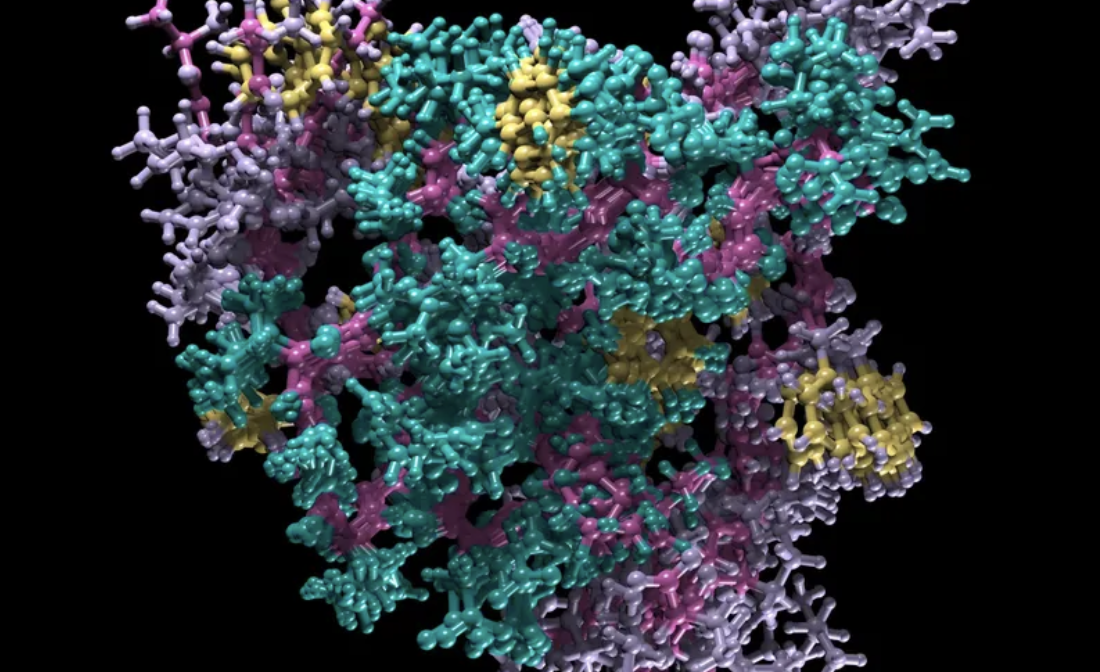
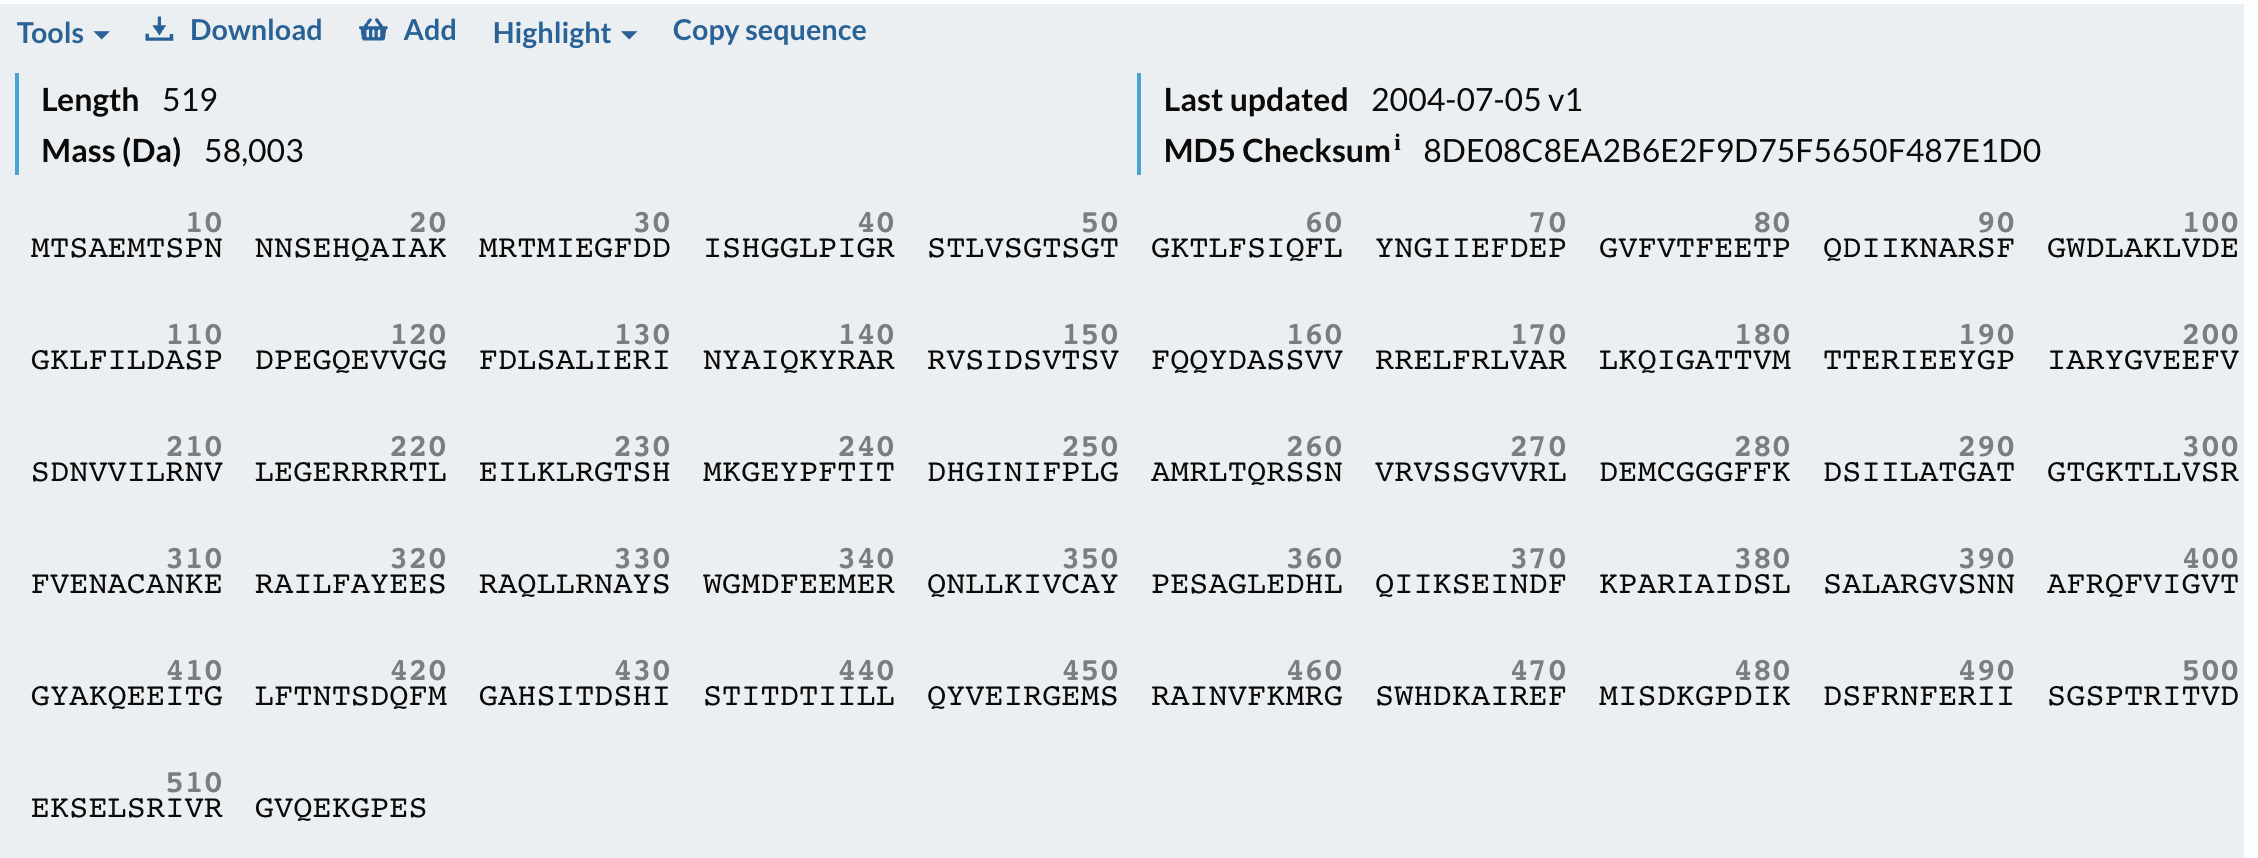
So I chose two proteins for the bio-design challenge. Below are the details, structure and DNA sequence from Uniprot
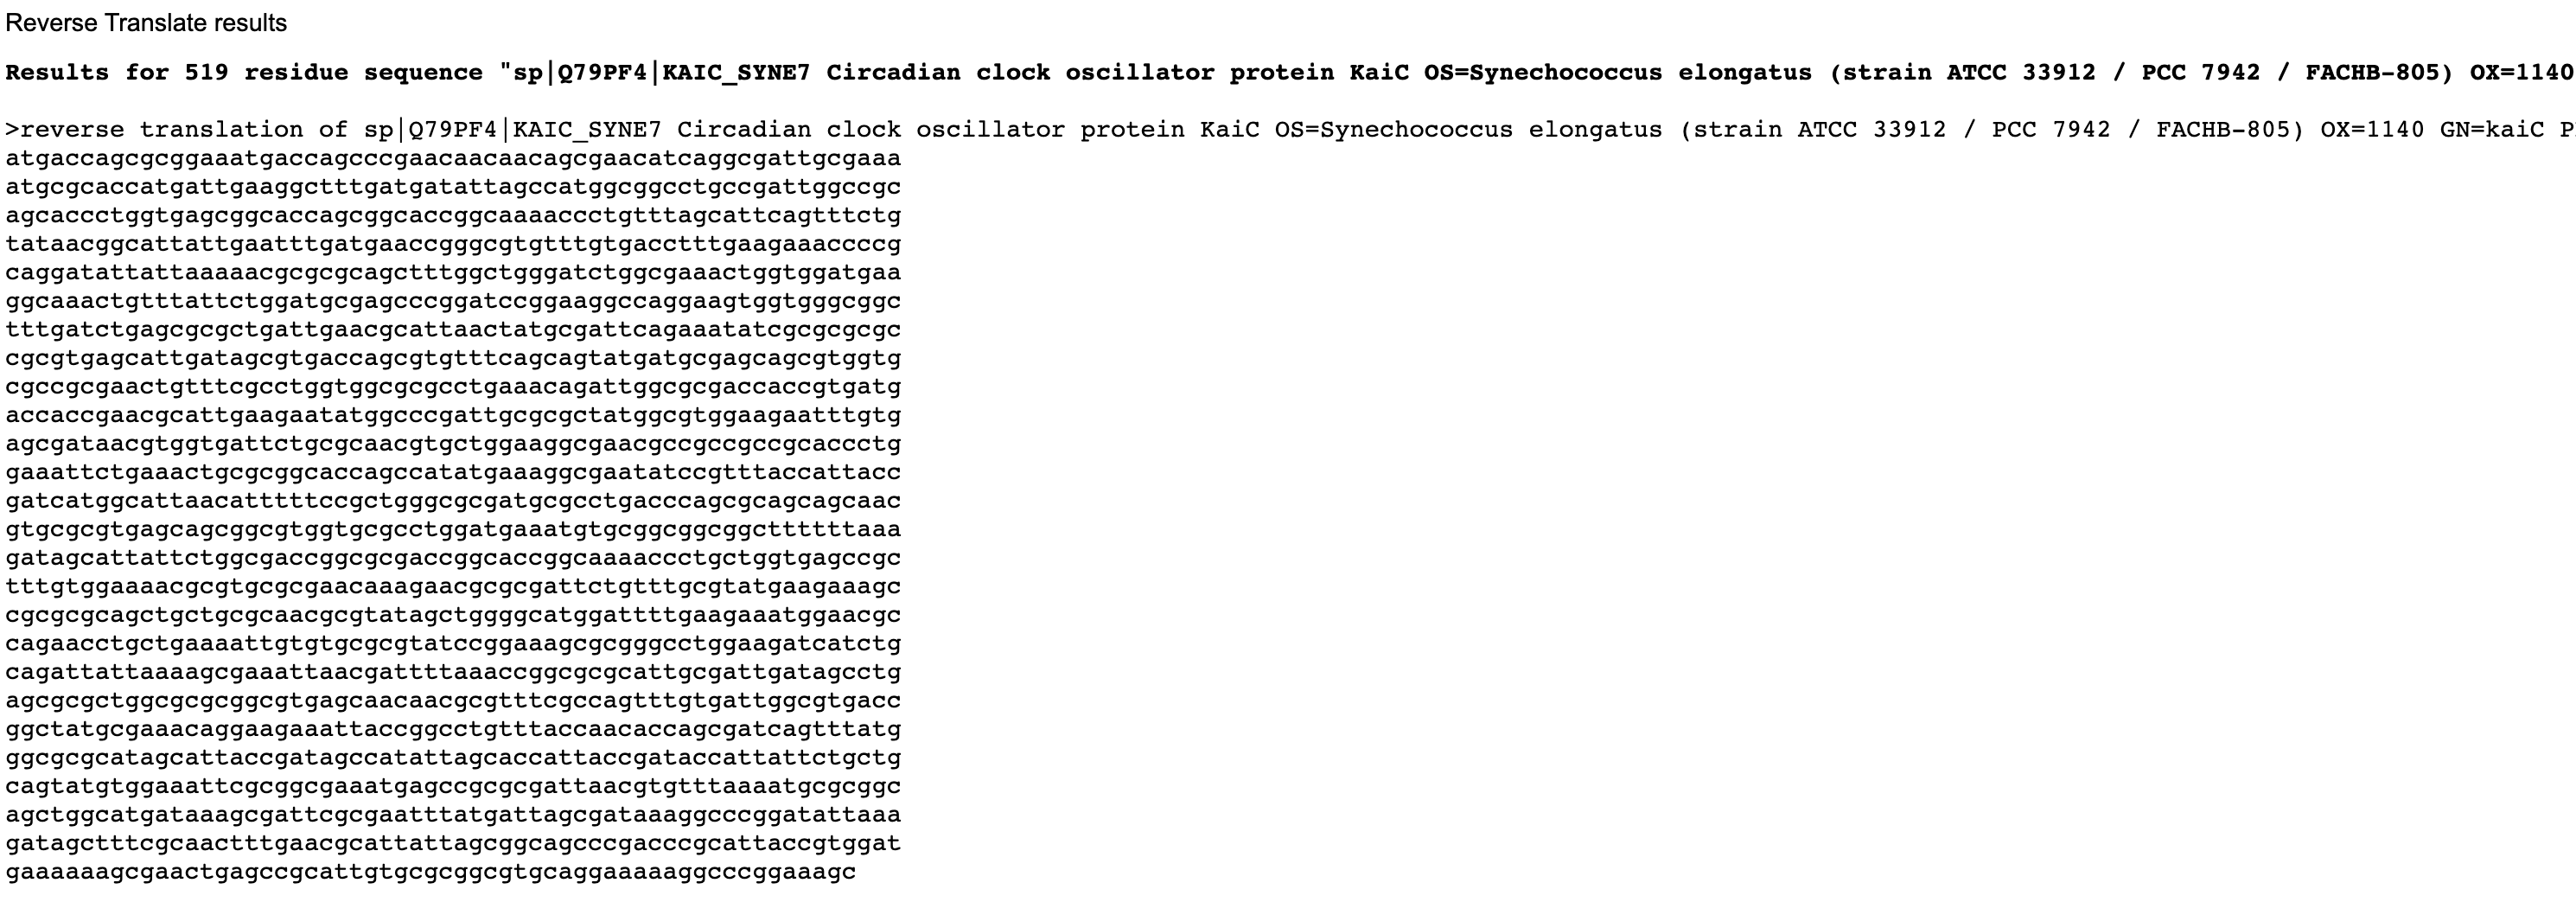
- The circadian clock oscillator protein KaiC in Synechococcus elongatus (cyanobnacteria).
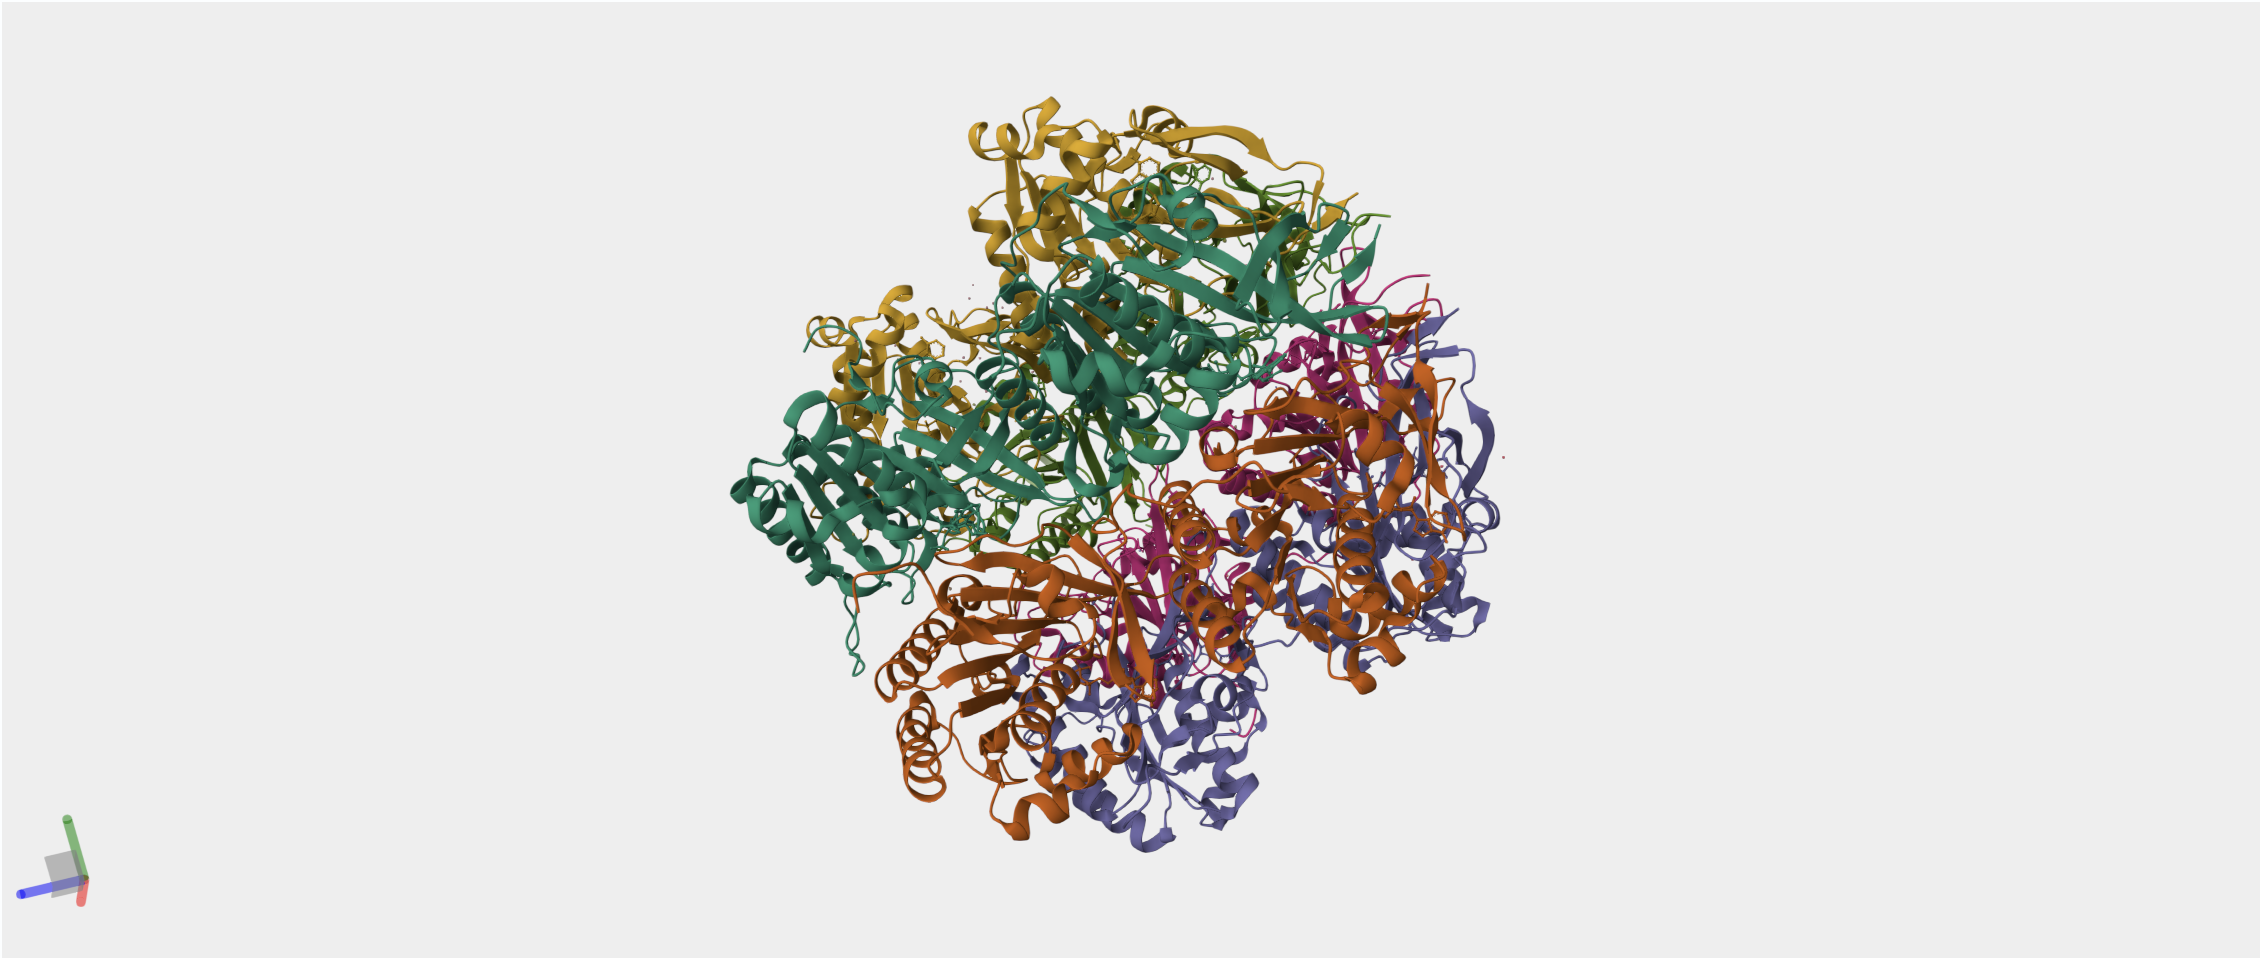
I have chosen the KaiC protein from Synechococcus elongatus PCC 7942 because it is the core component of the cyanobacterial circadian clock (The KaiABC). KaiC undergoes a precise phosphorylation and dephosphorylation cycle that repeats approximately every 24 hours, creating a reliable biological oscillator.
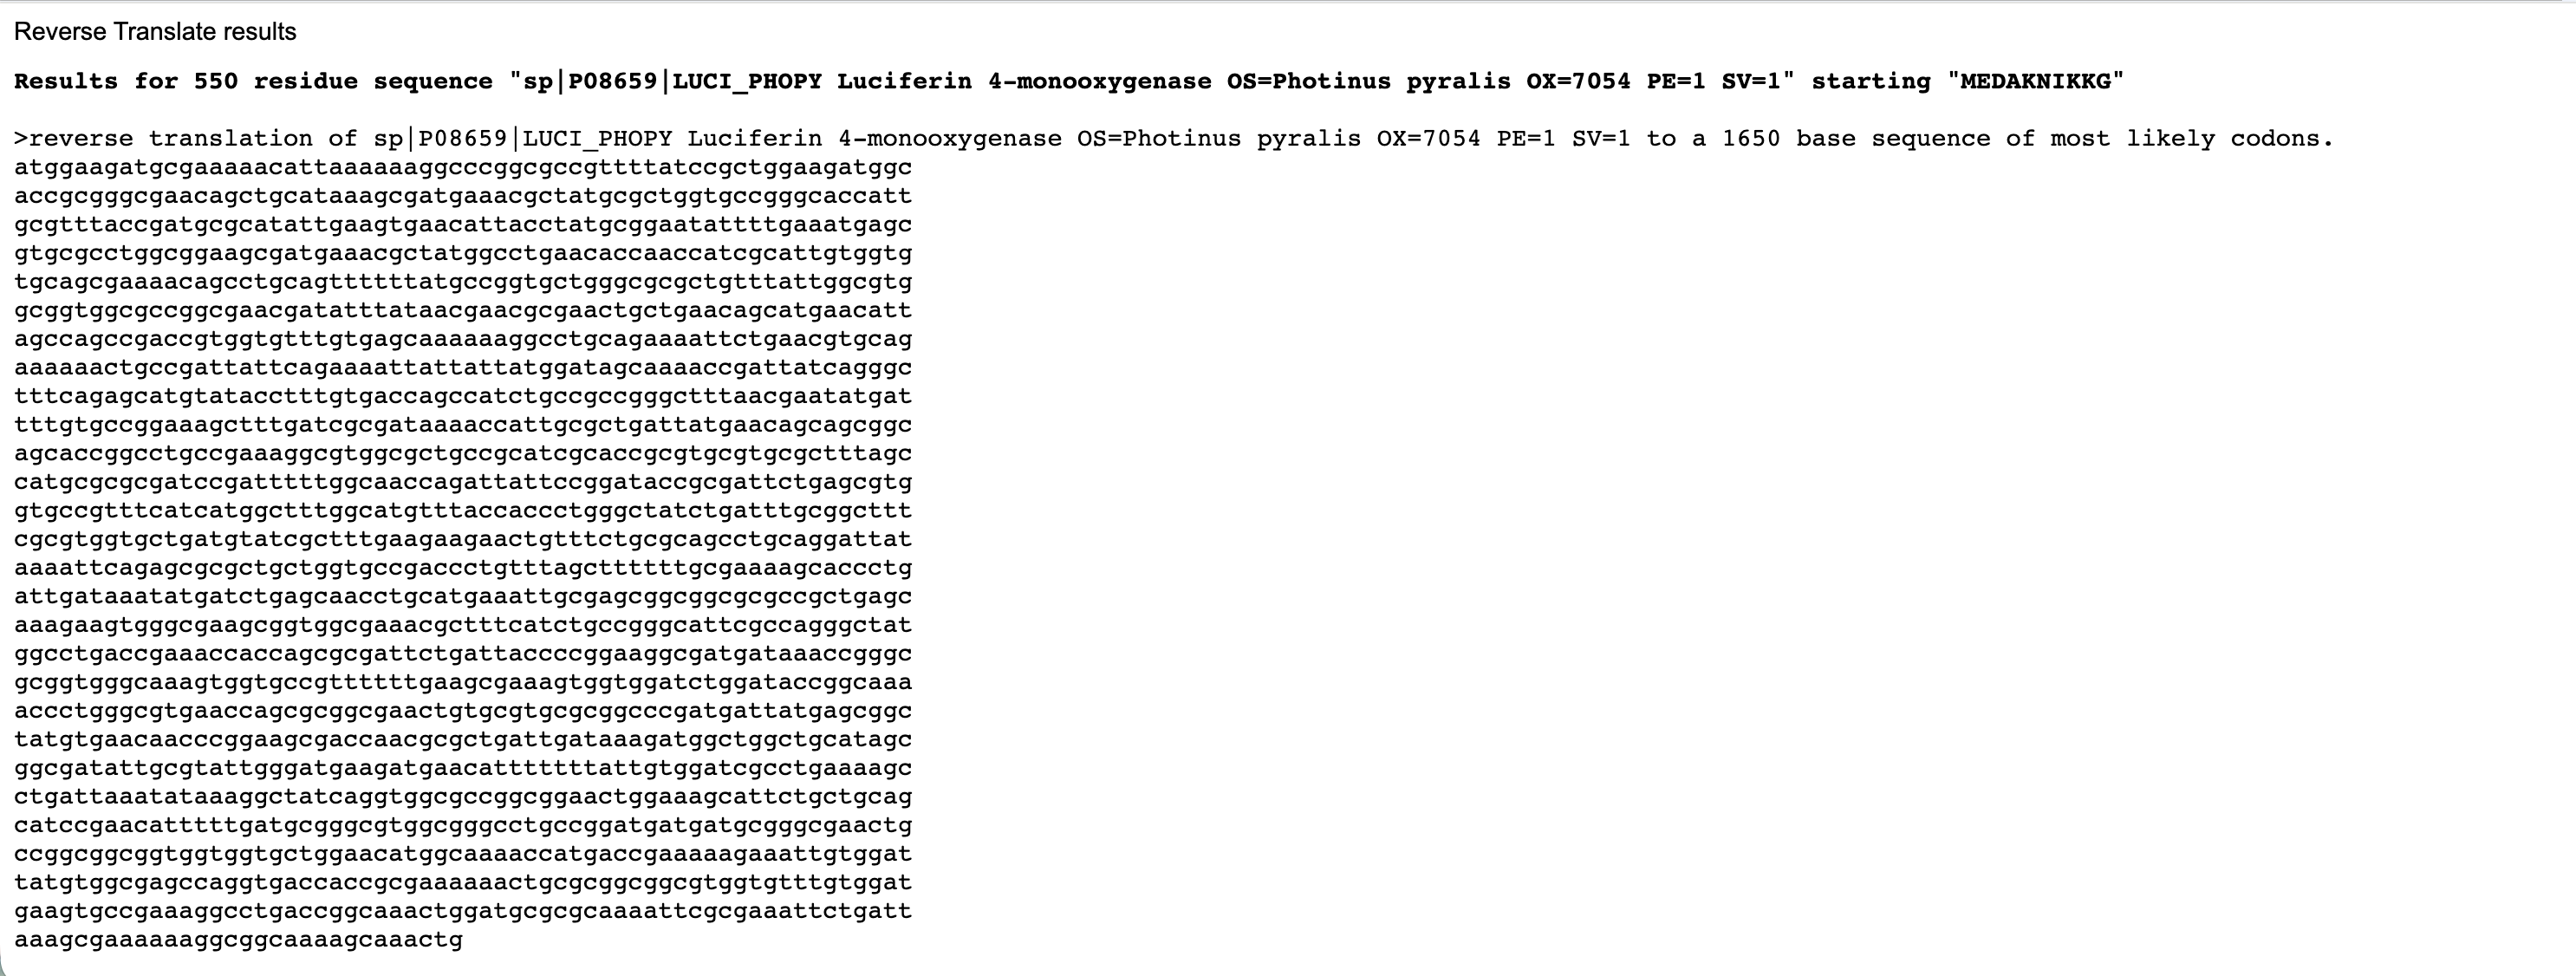
- Firefly Luciferase from the North American firefly Photinus pyralis that catalyzes bioluminescence.

It produces the firefly’s characteristic yellow-green light through oxidation of the small molecule luciferin. I also chose to study the Firefly Luciferase sequence from Photinus pyralis because it is a well-characterized bioluminescent enzyme used extensively as a reporter in gene expression studies.
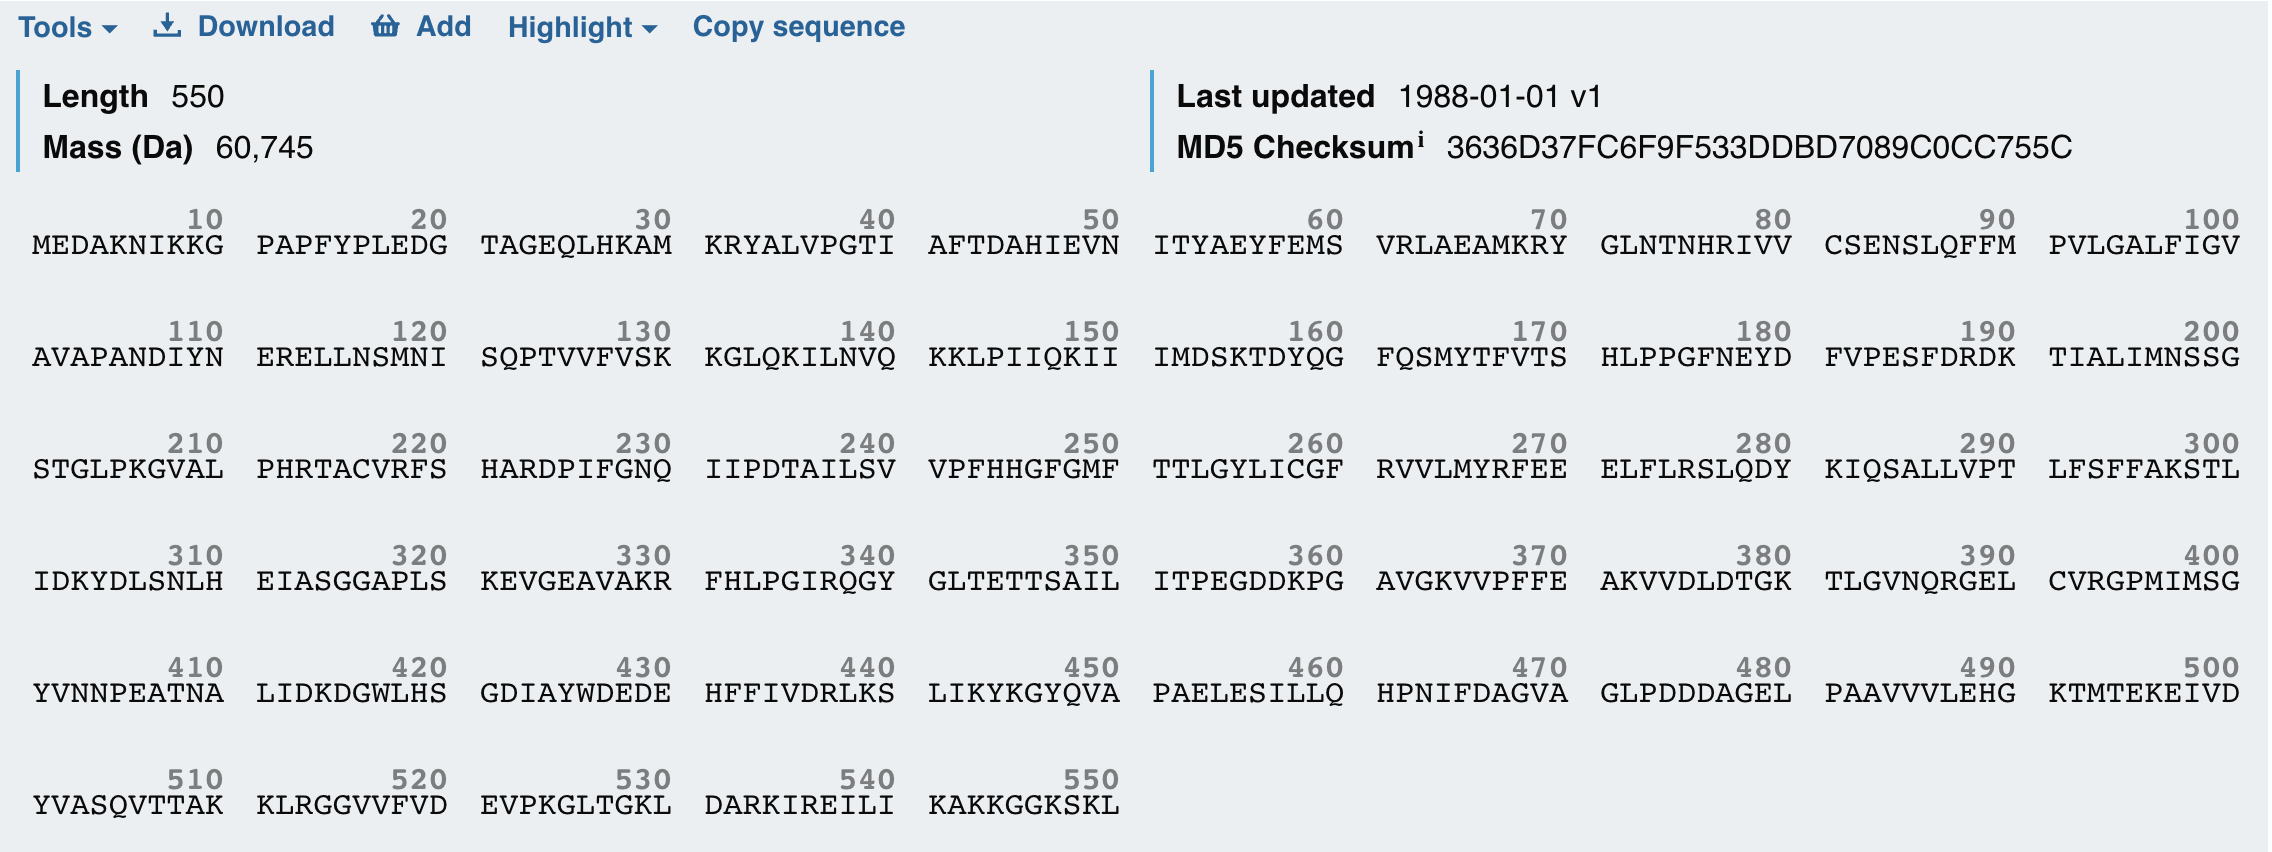
By fusing Luciferase to KaiC, I can convert these molecular oscillations into a measurable bioluminescent signal. This fusion allows real-time monitoring of the circadian rhythm, with peaks in light output corresponding to high KaiC activity and troughs corresponding to low activity. I wanted to explore both proteins today because together KaiC provides the biological timing mechanism and Luciferase provides a visible readout, making them an ideal pair for a circadian biological clock.

Reverse Translate: Protein (amino acid) sequence to DNA (nucleotide) sequence.
The central dogma of molecular biology, proposed by Francis Crick, describes the flow of genetic information: DNA is transcribed into RNA, which is translated into protein (DNA>RNA>PROTEINS).
In Transcription DNA sequences are converted to RNA. This occurs in the nucleus and is mediated by RNA polymerase.
In Translation messenger RNA is decoded to synthesize a specific polypeptide chain and occurs in the cytoplasm where ribosomes read mRNA instructions to make proteins.
The Central Dogma gives us the framework to work backwards from a given protein sequence and infer the DNA sequence that the protein is derived from.

Below are the nucleotide sequences (reverse translation) for KaiC (above) and Luciferase (below). I used the online tool Sequence Manipulation Tool from Bioinformatics by entering the raw amino acid sequence for each protein.
Codon optimization: Describe why you need to optimize codon usage?
Codon optimisation is a process used to make translation more efficient and improve gene expression.
Different organisms have codon usage bias, meaning they prefer to use certain codons to specify each amino acid based on their abundance of matching tRNAs.
Codon optimisation replaces codons rare to the host organism with codons it prefers, allowing the ribosome to translate the mRNA more efficiently. This is especially important when expressing a gene from one organism in a different host, because unoptimised codons can slow translation, reduce protein yield, or cause errors in protein production.

Codon optimization: _Which organism have you chosen to optimize the codon sequence for and why?
I have chosen to optimise both KaiC and Luciferase for Escherichia coli strain K-12 by inputting the nucleotide sequence into the Integrated DNA Technologie’s Codon Optimisation Tool
This is because:
It is a standard laboratory organism that is widely available, cheap, has a well understood codon usage bias and established protocols for isolating plasmids and cloning.
Its fast growing with high protein expression efficiency.
Specifically, for a possible project where I would like to fuse Luciferase to KaiC to act as a bioluminescent reporter of circadian rhythms, codon optimisation would be important. Codon optimisation of both KaiC (from cyanobacteria) and firefly Luciferase (from eukaryotes) ensures that E. coli can efficiently translate the fusion protein using its tRNA pool, allowing high-level expression suitable for detecting and reporting circadian rhythms. The KaiC portion reliably maintains its role in the circadian oscillator, while the Luciferase portion generates strong bioluminescence that creates a good visualisation of the circadian rhythmns.
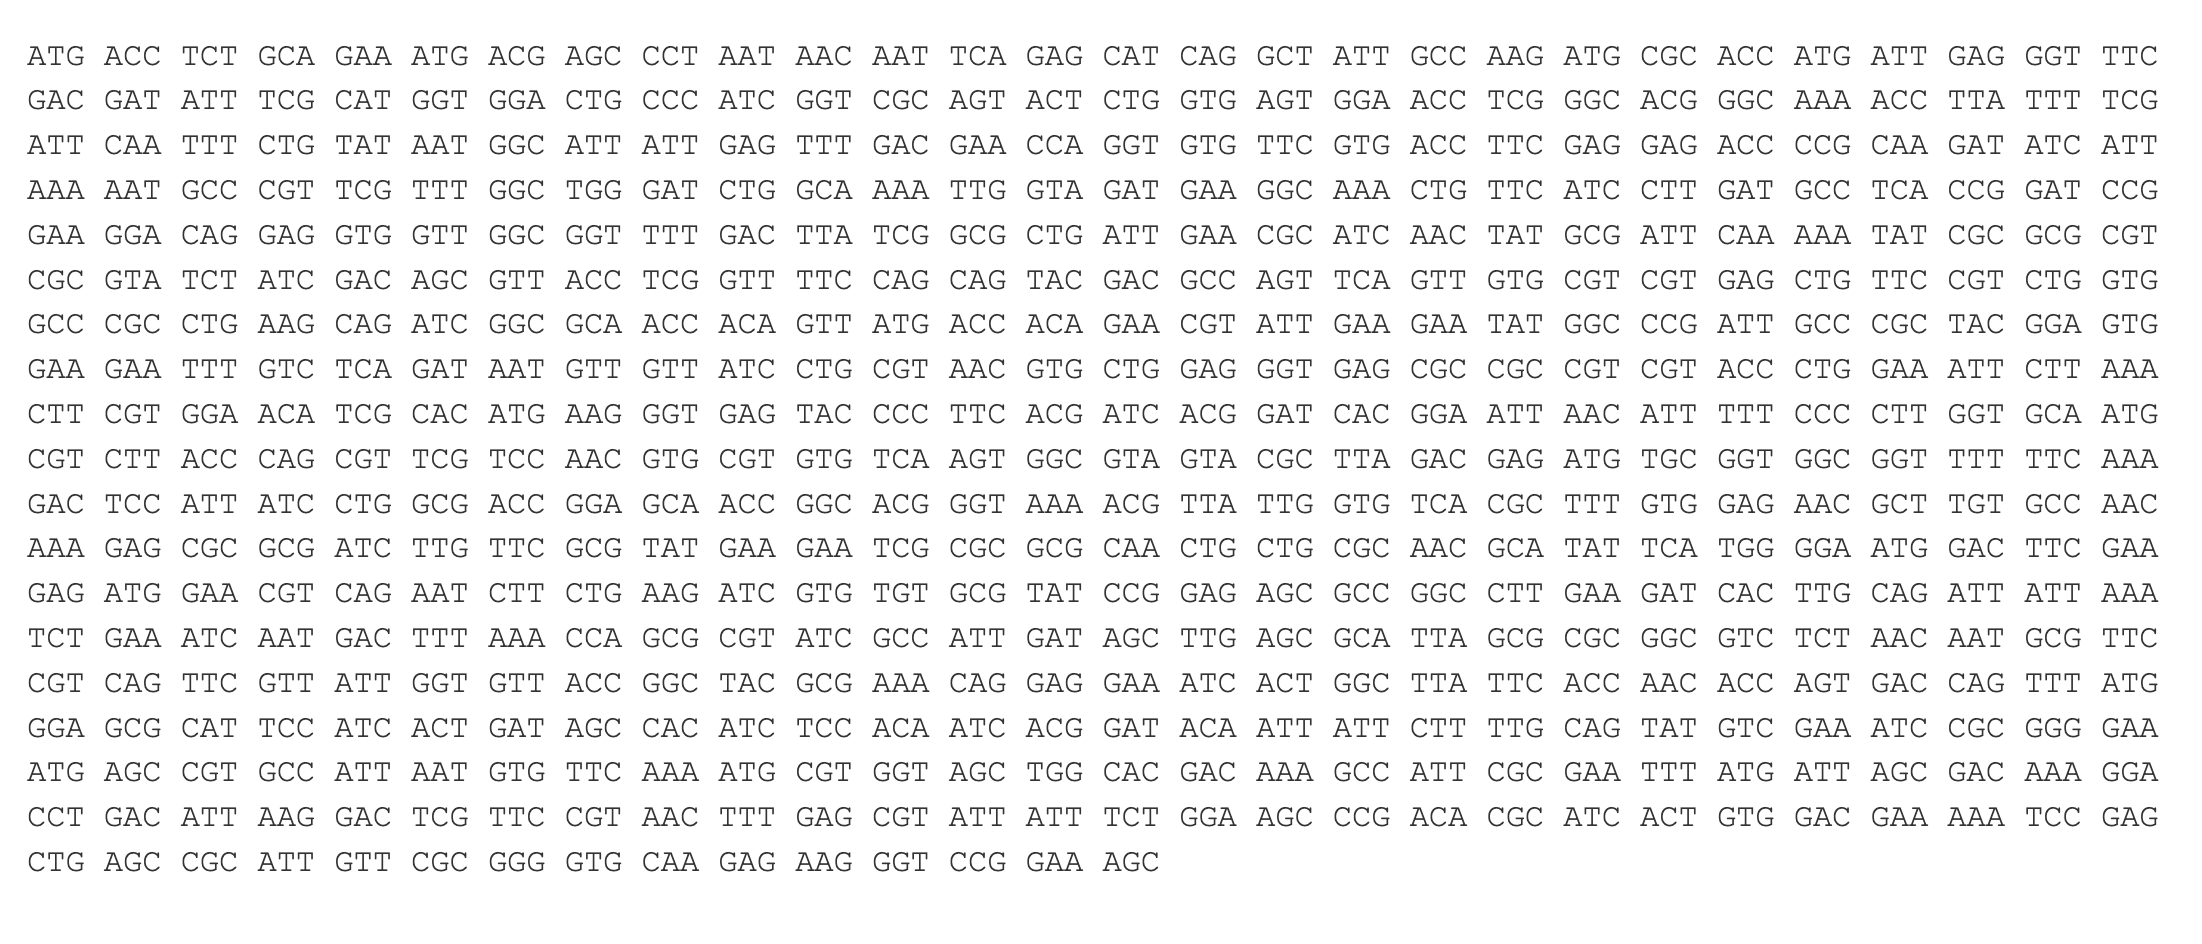
Codon optimised nucleotide sequence for KaiC.
KaiC comes from Synechococcus a prokaryotic cyanobacterium, but its codon usage bias is different from E. coli. Optimising KaiC for E. coli ensures efficient translation and more abundant protein production. Firefly Luciferase is eukaryotic meaning its codons are rare in bacteria, so without optimisation translation could be inefficient. Optimising each gene independently for E. coli ensures that translation of one protein does not impact the other. Optimising both genes for the same host ensures coordinated and efficient expression within a single engineered system, allowing it to accurately report the dynamics of the circadian clock.
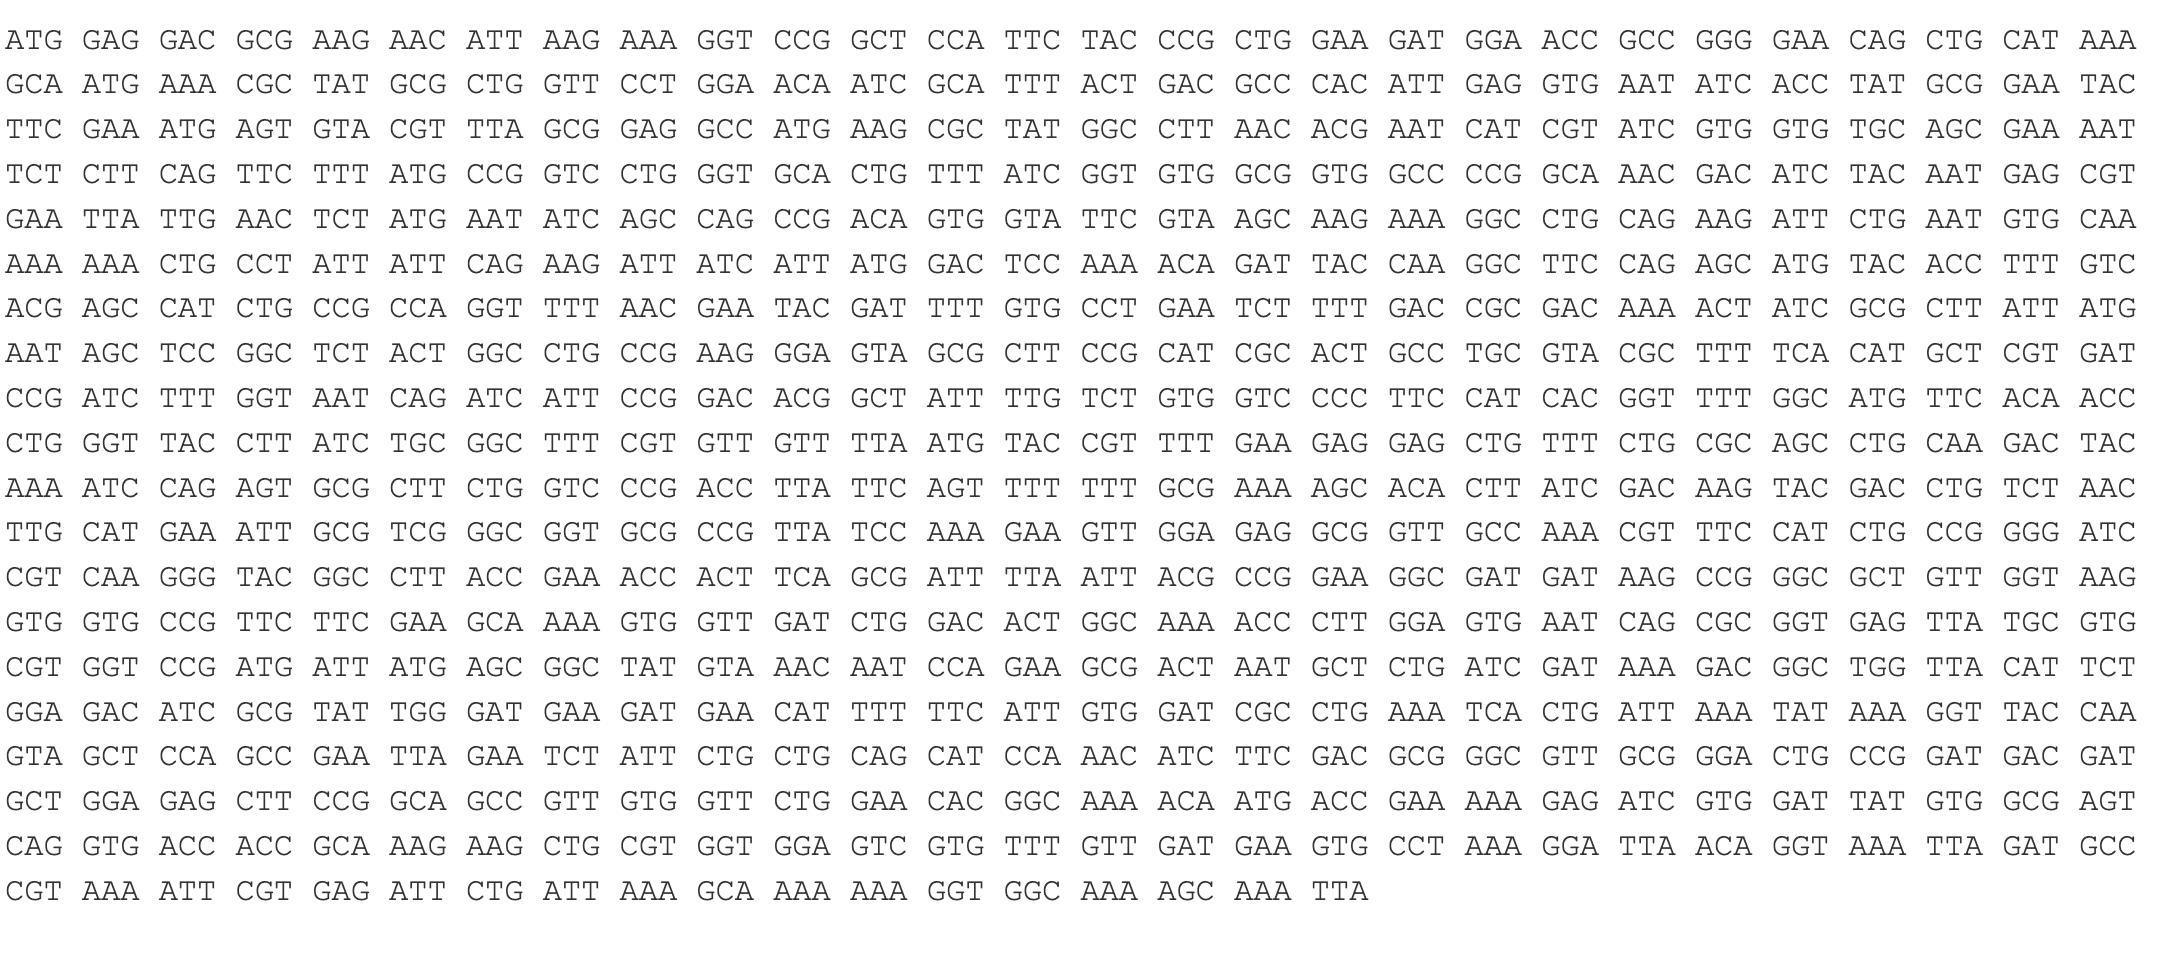
Codon optimised nucleotide sequence for Firefly Luciferase.
Cell-dependent production of Luciferase in _E. coli
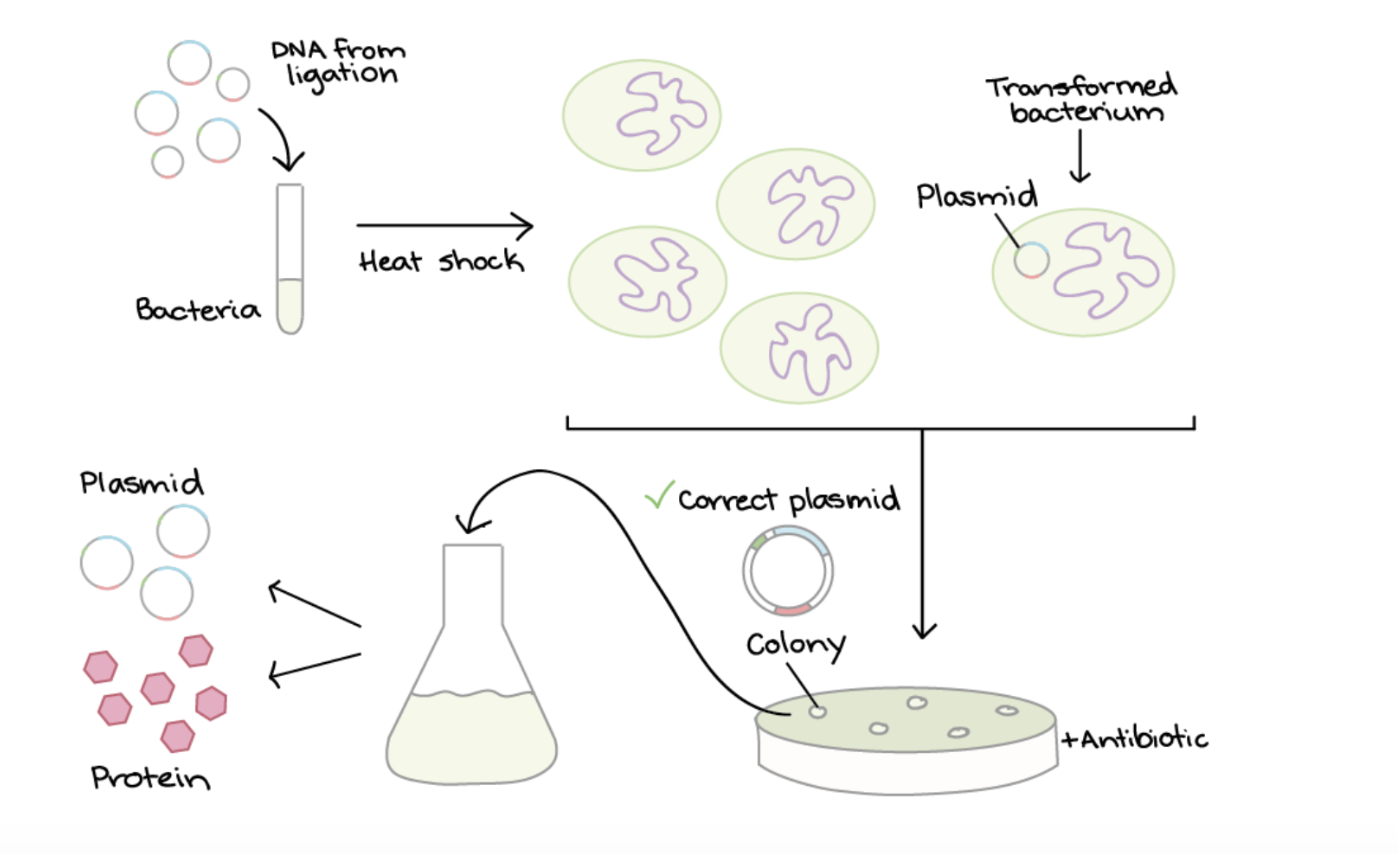
LIGATION:
Plasmids are a small circular piece of DNA used that replicate independantly fromthe hosts chromosomal DNA. They are used to introduce foreign DNA into another cell. To produce the protein Luciferase by cell dependant production in Ecoli, first the plasmid (designed for expression in E.coli) and the Luciferase gene are cut using restriction enzymes to make compatible ends. The gene is then inserted into the the plasmid through ligation. This is where DNA ligase enzyme binds the compatible ends of plasmid and Luciferase gene. The plasmid contains a promoter to drive transcription in the E.coli and an antibiotic resistance gene for selection.
TRANSFORMATION:
This plasmid is then introduced into E. coli through transformation, where heat shock encourages some bacteria to take up the plasmid. The shock makes the bacterial membrane more permeable to the plasmids.

SELECTION:
The bacteria are grown on an antibiotic plate. The plasmids contain a antibiotic gene so only bacteria that successfully took up the plasmid survive and form bacterial cultures.
SCREENING:
Colonies are screened using PCR, restriction digest or sequencing to identify a plasmid with the Luciferase gene in the correct direction relative to the promoter and to ensure the plasmid hasn’t closed back up without taking in the gene.
PROTEIN PRODUCTION:
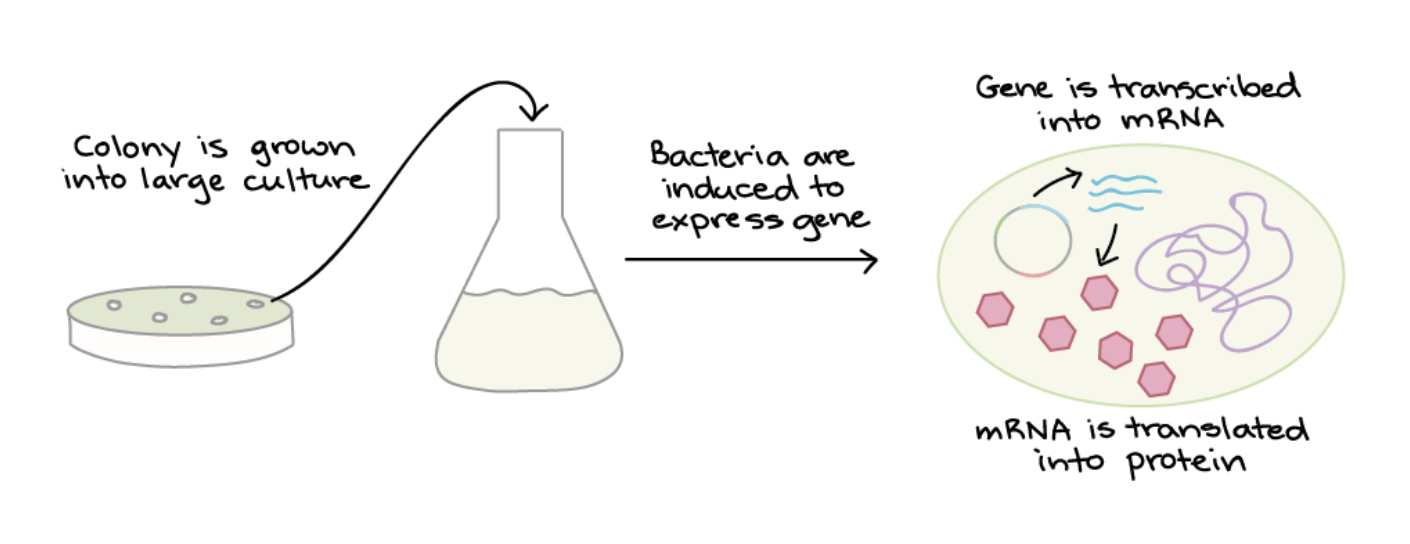
Once a colony with the correct plasmid is identified, it is grown in bulk, and protein expression is induced by adding a chemical signal. Inside the bacteria, the codon-optimised Luciferase DNA is transcribed into mRNA and then translated by bacterial ribosomes into luciferase protein. The codon optimisation ensuring that translation is efficient, even though Luciferase is originally a eukaryotic protein.The bacteria can then be lysed (split open) to release the protein.
PURIFICATION:
Finally, the Luciferase protein can either be used directly in bacterial cells or purified. Purification techniques include affinity chromatography, where antibodies specific to luciferase bind and isolate the protein.
Part 4: Prepare a Twist DNA Synthesis Order
Finally, I’ve done a test order from Twist inserting Bioscience the codon optimised sequence for Luciferase.


Click here to go to my linear map

And Click here for baby’s first plasmid!
5.1 DNA Read
What DNA would you want to sequence (e.g., read) and why?
Sequencing ELF3 to track impact of climate changing on circadianflowering in plants.
I would sequence the ELF3 (EARLY FLOWERING 3) gene, which is a key player in the circadian clock of plants such as Arabidopsis thaliana’s. It’s function includes the regulation of flowering time in response to light and temperature variations, therefore mutations within the ELF3 DNA can lead to the loss of photoperiod sensitivity and shifts in seasonal flowering.
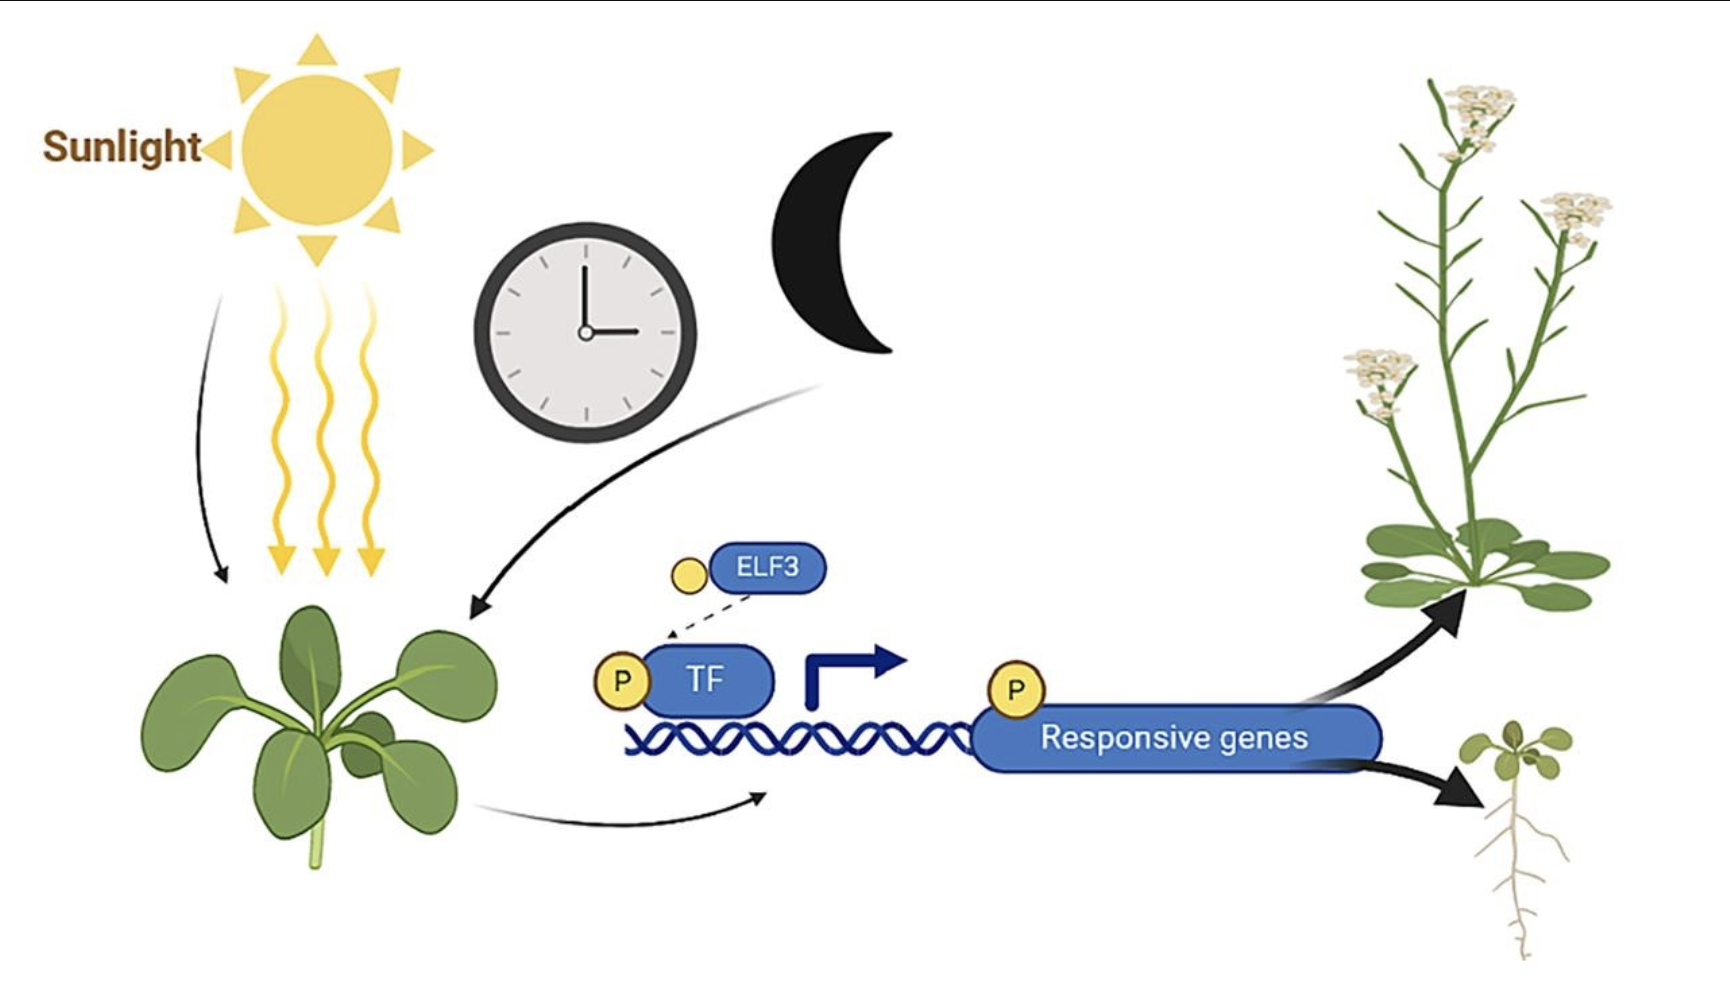
Zhu X, Wang H. Revisiting the role and mechanism of ELF3 in circadian clock modulation. Gene. 2024 Jun 30;913:148378. doi: 10.1016/j.gene.2024.148378. Epub 2024 Mar 13. PMID: 38490512.
Sequencing ELF3 allows us to identify genetic variations or mutations such as single nucleotide polymorphisms (SNPs) or insertions/deletions that could shift flowering schedules, which is particularly important for studying how climate change may disrupt plant phenology. Changes in flowering time can misalign plant/pollinator interactions, affecting ecosystems and crops so it is a crucial thing to understand.
ELF3 would be interesting to sequence because its variations make invisible molecular changes visible and can show illusive shifts in the rhythms of plant cycles. Through comparative sequencing of ELF3 across different plant populations, climates or even historical samples, we could track shifts in flowering schedules in different conditions and relate gene variations to observable plant traits that respond to climate (e.g., flowering date). This would be interesting to infer how plants are responding to environmental pressures or predicting how future climate conditions may effect flowering cycles.
What technology or technologies would you use to perform sequencing on your DNA and why?
Illumina Sequencing. Next Generation Sequencing (2nd gen).
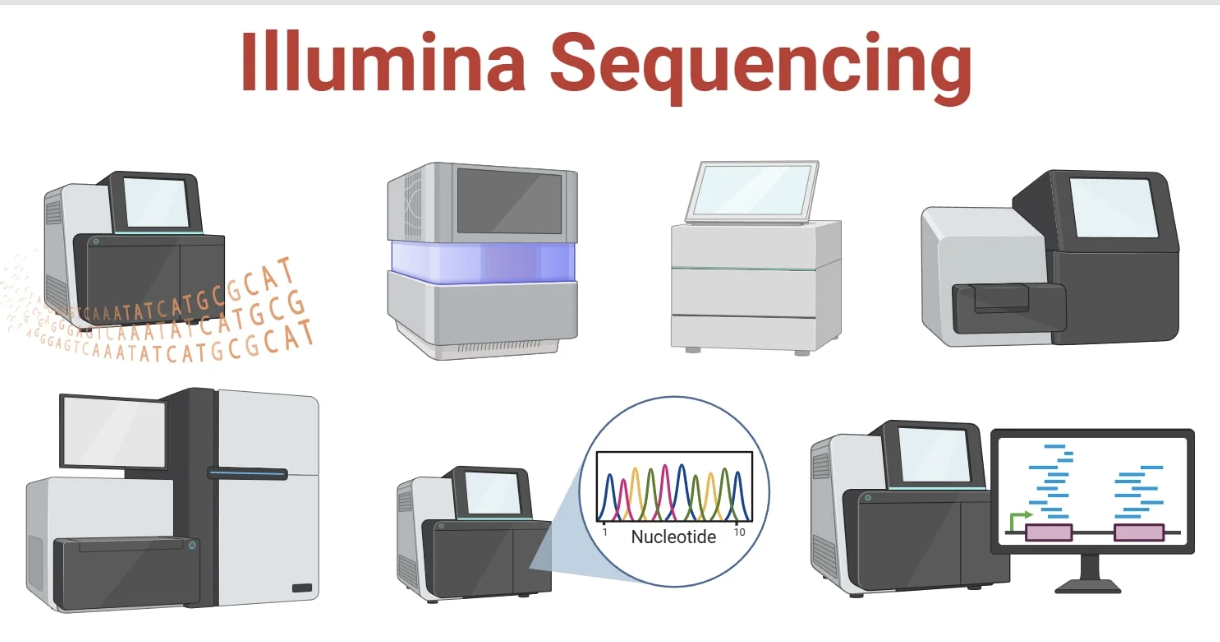
It has a similar principle to Sanger sequencing which was historically used in combination with positional cloning to first isolate the ELF3 gene. Both methods use fluorescently-labelled nucleotides and identifies each nucleotide by its fluorescent tag. However, while Sanger sequencing handles one DNA fragment at a time, Illumina allows millions of fragments to be sequenced simultaneously in a single run. For my project, I would use Illumina sequencing to read ELF3 DNA because:
- High accuracy for detecting variants, single nucleotide polymorphisms (SNPs) and small insertions/deletions in ELF3 (approx 99.9% short reads).
- Widely used in circadian biology studies and with plant DNA samples
- High throughput which is suitable for single-gene sequencing across many plant samples.
Illumina sequencing works on the principle of sequencing by synthesis (SBS). It identifies DNA bases as they are added to a DNA strand. Each of the four DNA bases is labelled with a unique fluorescent dye, allowing the sequencing system to detect which nucleotide has been added during each cycle. The system captures images of these signals which are then used to determine the exact sequence of the DNA fragment.
Essential Steps:
DNA extraction: The input is genomic DNA isolated from plant tissue in the leaf or seeds. It is important the nucleic acids are of high quality so there will be a quality control check in preparation.
Fragmentation: The DNA is broken down into smaller pieces suitable for Illumina sequencing (typically 200–500 bp) using processes such as mechanical shearing or enzyme digestion.
Adapter ligation: Sequencing adapters are attached to both ends of each fragment to ensure they bind to the sequencing flow cell. They can also be used for barcoding multiple samples.
Library amplification: Bridge PCR is used to bend each DNA strand to form a bridge over a chip. This amplifies the bridge creating clusters at each spot and generates a strong, clear signal.
5. Sequencing by Synthesis: Fluorescently labeled nucleotides are added one by one to the growing DNA strand. Each nucleotide emits a fluorescence as it attaches, specifying the base (base calling) and allowing the sequence to be determined over cycles of synthesis.
6. Analysis: Images collected from each cycle are converted into base sequences by analysing fluorescent signals. The sequences are compared to a reference genome of ELF3 to identify variants.
By sequencing ELF3 in this way, we can generate a detailed map of how plants’ circadian clock genes vary with environmental conditions and over time, providing insights into the elusive rhythms of plants.

https://microbenotes.com/illumina-sequencing/
5.2 DNA Write – Fibroin for Bio-printing
What DNA would you want to synthesize (e.g., write) and why?


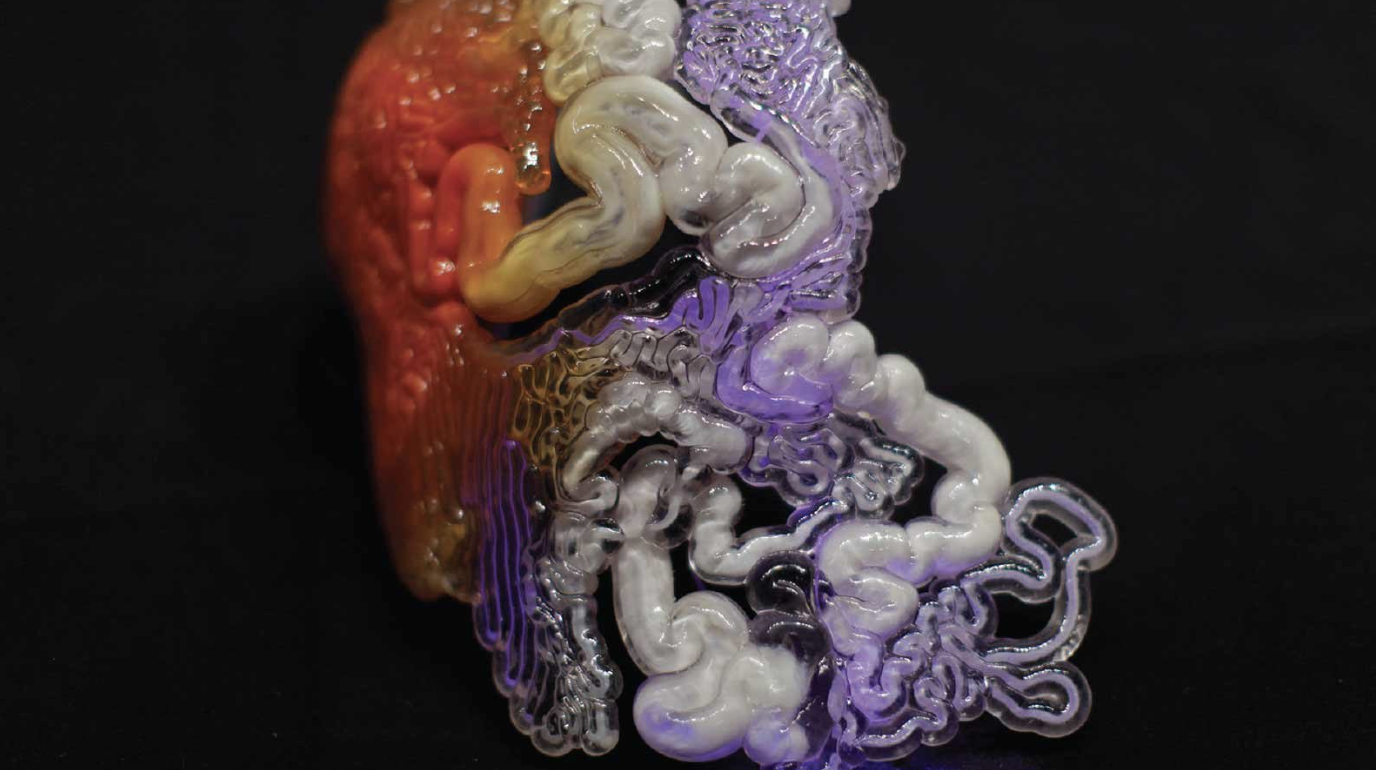
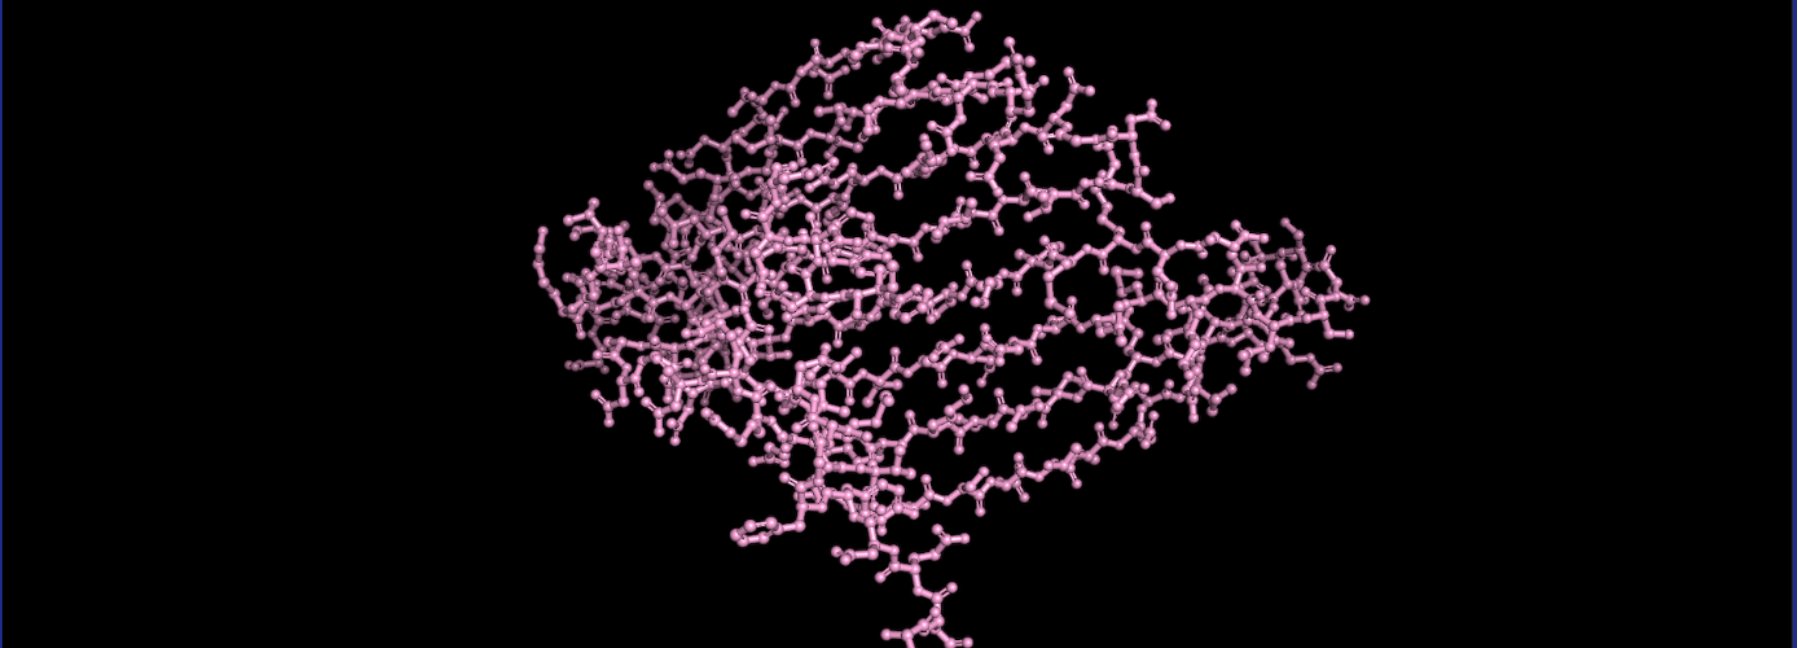
Image left: Fibrinogen-Based Bioink for Application in Skin Equivalent 3D Bioprinting. Image right: silkworm
The DNA I would like to synthesise is the fibroin gene (FibH) from silkworms (Bombyx mori) codon optimised for an Ecoli host. This gene encodes the structural protein fibroin, the main component of silk.
Fibroin has amazing mechanical properties that would be interesting for experimentation for biomaterials and bio-printing to create transparent, complex or bioactive structures. Fibroin is non-toxic and biodegradable, however, unlike its partnering gene Sericin it cannot be extracted from waste product of the silk production industry. By synthesising fibroin DNA, I could produce recombinant fibroin in an Ecoli host for sustainable and cruelty free bio-fabrication.
Some of the qualities of Fibroin that make it interesting are:
High mechanical strength: β-sheet crystalline regions give stiffness and shape retention
Transparency: can form clear films and scaffolds
Compatible with composites: can be mixed with water, polymers, hydrogels, nonparticles.
Biocompatible: widely used in tissue engineering, non toxic, biodegradable
Tuneable properties: could be engineered for responsiveness or added functionality. Recombinant production allows precise control over sequence, length etc. enabling tuneable transparency, stiffness, and degradation rates in printed structures.
Scarlett Yang Sericin Bioplastics
What technology or technologies would you use to perform this DNA synthesis and why?
I would use oligonucleotide synthesis via Twist Bioscience. This is because unlike past methods of DNA synthesis Twist writes DNA:
Has very high throughput and extremely accurate oligo synthesis. Twist uses silicon-based DNA synthesis which allows them to make 1 million oligos per chip and up to 9,600 genes. This is perfect for assembling long or repetitive genes like FibH.
Its high fidelity reduces errors in the gene sequence to an error rate of 1:5000 bases which allows for longer sequences to be synthesised. FibH is a very long and repetitive gene which is tricky to synthesise accurately. They also handle codon optimization and cloning into plasmids for insertion into ecoli host, saving me a lot of time.
It is a process which requires them to synthesis very little reagent meaning the process is cheap and sustainable.
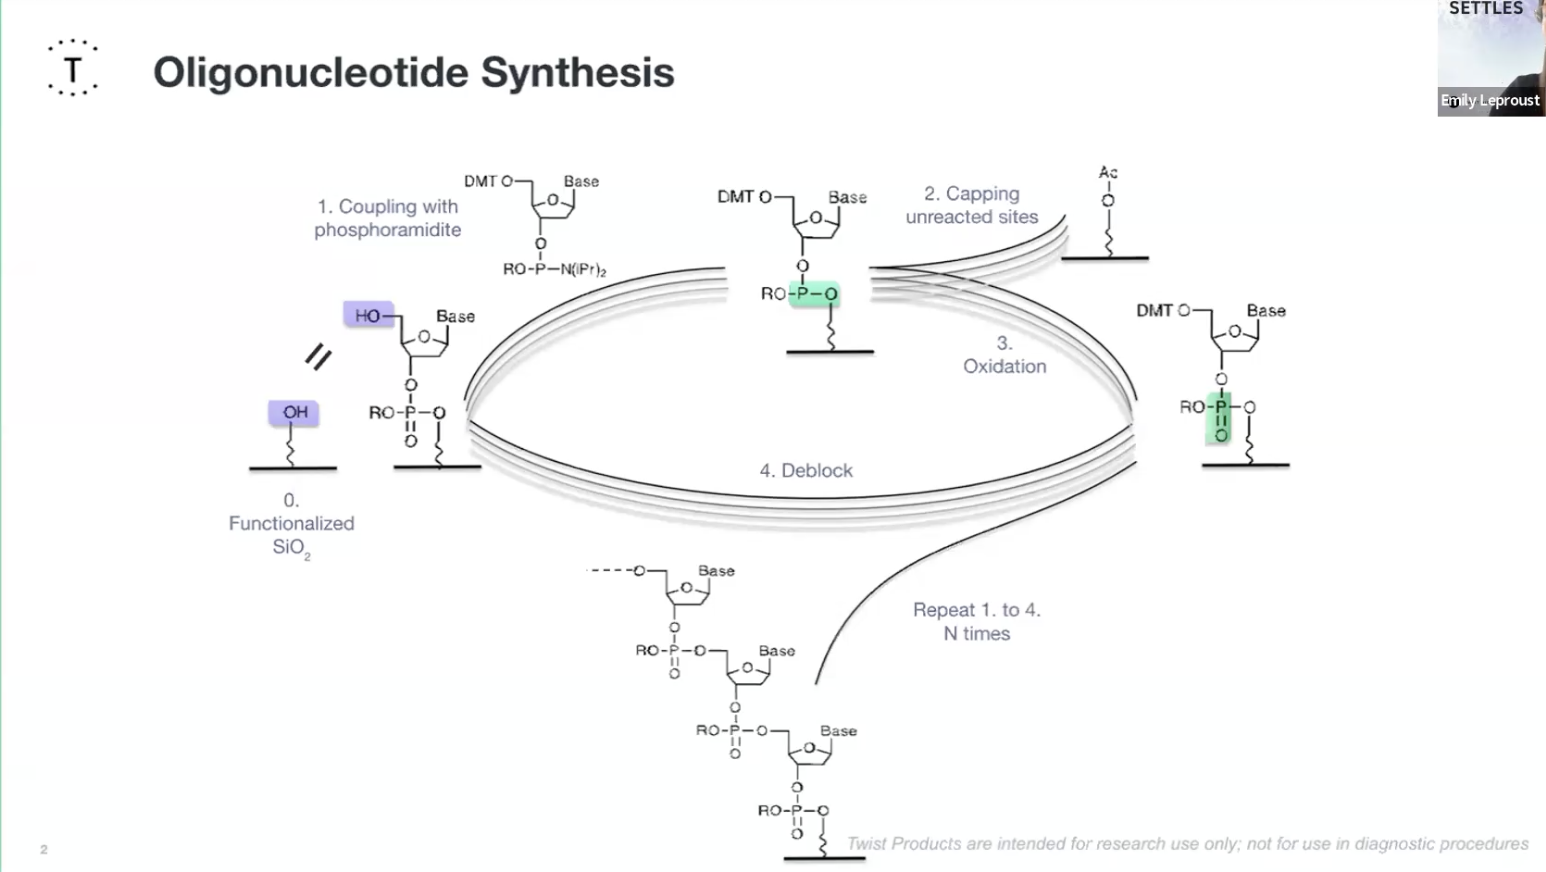
Oligionucleotide Synthesis slide Emily Le Proust
Essential Steps
Design the sequence in Benchling and codon-optimize fibroin DNA for Ecoli’s codon usage bias.
Oligonucleotide synthesis: Twist synthesises hundreds of short DNA fragments (oligos) that come together to form the entire gene sequence.
- Deprotection: The protecting group on the 5′ end is removed from the support-bound nucleoside leaving a reactive 5′-OH group.
- Coupling: This couples to a nucleotide base to form a phosphite triester bond.. This needs to be a very efficient reaction and that is extremely complete.
- Capping: Unreacted 5′-OH groups are capped to ensures that only one base can be added at a time and any unreacted sites are chemically blocked to prevent them causing errors in future cycles. The phosphide is then oxidised into a P5 phosphate creating the natural bone of DNA.
- Oxidisation: The unstable phosphite triester bond is oxidised to form a stable phosphorus phosphodiester bond creating the backbone of DNA.
- Deblocking: finally they deblock the 5" end to regenerate an O-H for the next cycle.
- Post-Synthesis Processing: Twist will undergo cleavage, where the completed oligonucleotide is detached from the solid support, deprotection, where the protecting groups on the base residues are removed and purification of the final product and quality control from mass spectrometry.
Limitations
While Twist can produce many constructs in parallel, very long or highly repetitive sequences are more challenging to synthesize and may need extra optimisation.
5.3 DNA Edit
What DNA would you want to edit and why?

Studio Lionne van Deursen exhibits material created by microorganisms at Milan Design Week
I am very interested in bio and bio-hybrid soft robotics, bio-actuated movement and responsive structures. I am intrigued by the possible applications of genetic editing to design self-actuating and responsive materials and systems.
As an entry point to this idea I have been researching self-folding biomaterials.
So I would like to edit cellulose-producing bacteria Komagataeibacter to create self-folding, pleated bacterial cellulose by genetically programming differences in water retention.
Specifically, I would insert the BslA gene from Bacillus subtilis along with a secretion tag, so that the bacteria secrete BslA protein that binds to cellulose. This protien increases the materials hydrophobicity meaning it will retain less water and shrinks less and becomes more rigid when dry.
Unengineered bacterial cellulose is highly hydrophilic and shrinks significantly during drying and is more pliable.
By layering the two types of cellulose you can create a bilayer structure with a differential shrinkage and controlled folding. By cutting and assembling layers strategically, pleats or origami folds can be programmed. This creates a fully bio-fabricated, biodegradable actuator.
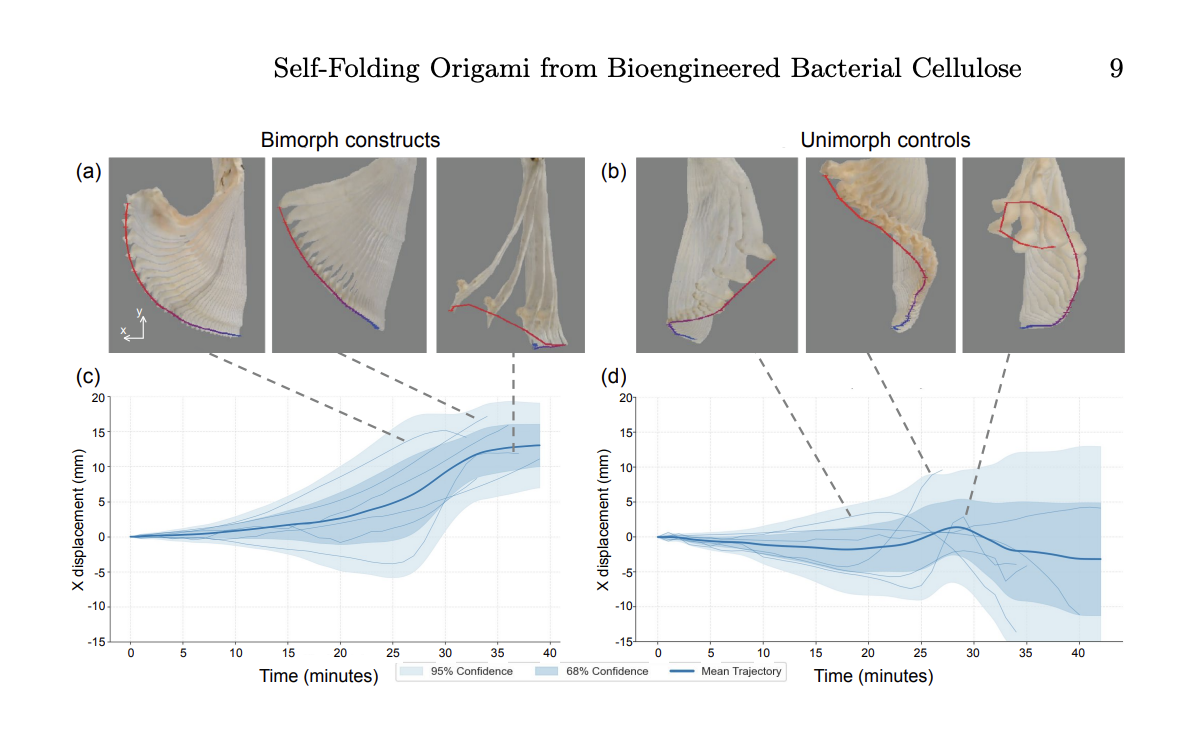
Renewable Self-Folding Origami Constructed from Bioengineered Bacterial Cellulose, Yitong Tseo, Morgan Guempel, Cathy Hogan and Ian Hunter
I think this has interesting applications for design, fashion and sculpture to create a programmable, structured material that is fully degradable. Lots of research has also been done for use in soft robotics for biomedical application. It shows the broader concept of DNA editing to change the genetic instructions of an organism to engineer functional and sustainable materials.
What technology or technologies would you use to perform these DNA edits and why?
Plasmid-based gene expression
I would use a plasmid-based system to introduce the BslA gene into Komagataeibacter. This method allows controlled expression of a non-native protein.
Plasmids are circular DNA molecules that can carry a gene of interest along with regulatory elements, such as promoters, signal peptides and terminators all required for this project. They will replicate independently inside the the bacterial cellulose, providing multiple copies of the gene for strong expression.
This method allows precise control over when and how much BslA is expressed without permanently altering the bacterial genome. It is easier to implement and is ideal for experiments because it allows rapid testing. CRISPR is probably overkill but for long-term, wide-scale production integrating the gene into the genome via CRISPR might be more stable.
The Essential Steps:
Prepare DNA sequence: In Benchling assemble the DNA sequence and design regulatory elements e.g a promotor, a signal peptide to direct secretion of BslA outside the cell and a terminator. Previous studies have used Promoter (PLux) that turns on BslA expression in response to chemical signaling, Signal peptide (N22 tag) which directs the BslA-CBM fusion protein to the CsgG gene for secretion in to the cellulose and the LuxR gene
Copy the DNA (PCR): using PCR take a small amount of the BslA gene template, add primers and run it through a thermal cycler to produce billions of copies.
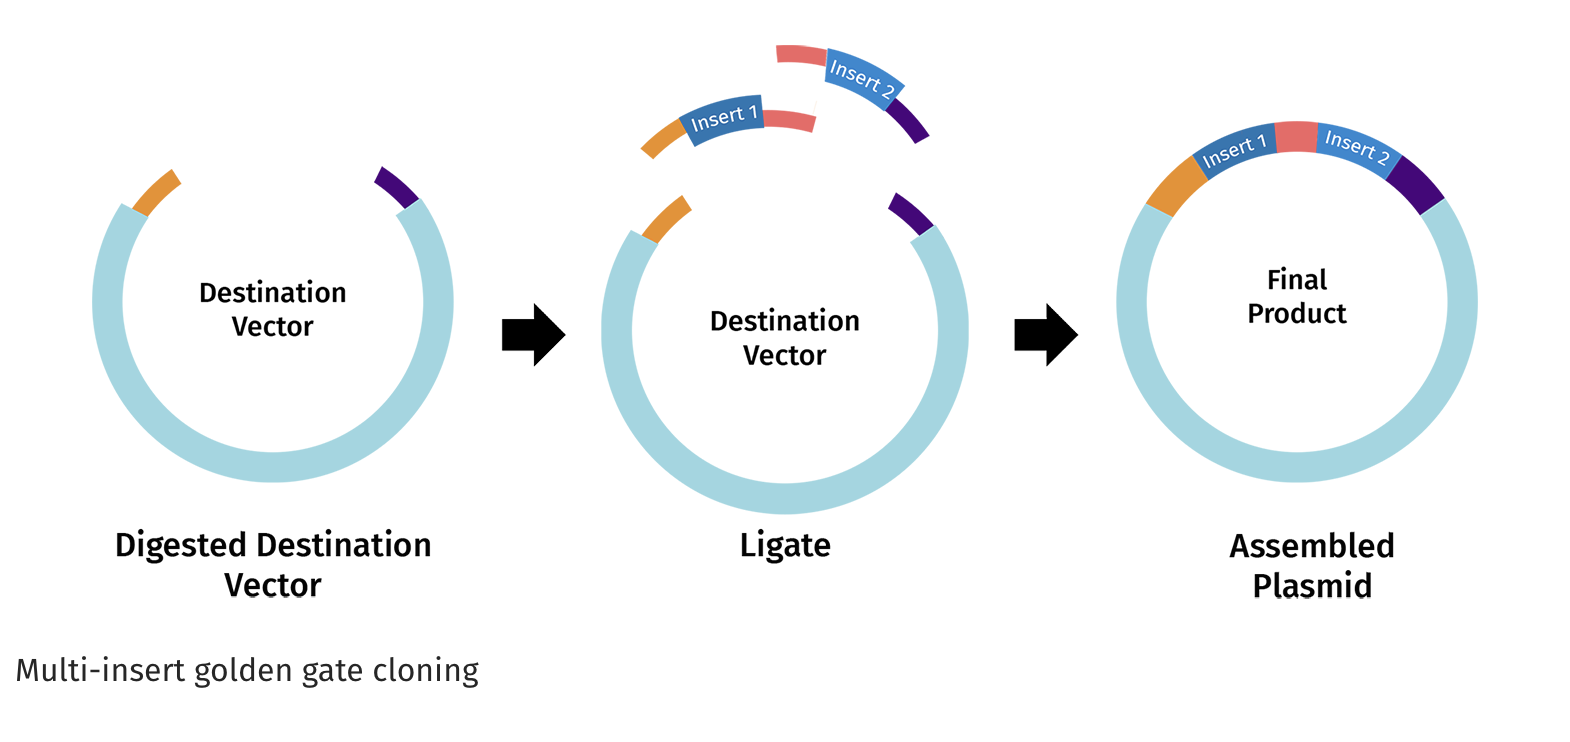
https://www.snapgene.com/guides/golden-gate-assembly
Assemble the plasmid: Use Golden Gate cloning, which employs restriction enzymes to create cuts at precise sites and create unique overhangs (sticky ends) and ligase complimetry sticky ends together to assemble the BslA gene into a plasmid backbone in one reaction with accuracy.
Transformation: Shock the cells via chemical treatment or electroporation to make them competent and deliver the plasmid. Antibiotic resistance genes on the plasmid allow selection of bacteria that have successfully taken up the plasmid.
Expression and secretion: Grow the engineered bacteria in nutrient media, as cellulose is produced, BslA is secreted and binds to the cellulose surface.
The Limitations
The limitations of this process include inconsistency of BsIA production across the bacterial cellulose population as plasmids replicate independently and the number of plasmids per cell can vary.
Stabilityis also an issue as the gene is not permenently integrated into the genome so the plasmids could be lost, for long term or industrial-scale production a genome-integrated systems (e.g. CRISPR knock-in), which maintain stable expression over generations would be better.
References
Zhu, X., & Wang, H. (2024). Revisiting the role and mechanism of ELF3 in circadian clock modulation. Gene, 913, 148378. https://doi.org/10.1016/j.gene.2024.148378
Covington, M. F., Panda, S., Liu, X. L., Strayer, C. A., Wagner, D. R., & Kay, S. A. (2001). ELF3 modulates resetting of the circadian clock in Arabidopsis. Plant Cell, 13(6), 1305–1315. https://doi.org/10.1105/tpc.13.6.1305
Zahn, T., Zhu, Z., Ritoff, N., Krapf, J., Junker, A., Altmann, T., Schmutzer, T., Tüting, C., Kastritis, P. L., Babben, S., Quint, M., Pillen, K., & Maurer, A. (2023). Novel exotic alleles of EARLY FLOWERING 3 determine plant development in barley. Journal of Experimental Botany, 74(12), 3630–3650. https://doi.org/10.1093/jxb/erad127
Richard, L. J., Giordano, V. R., Leite, V. B. P., Wigge, P. A., & Hanson, S. M. (2024). Molecular dynamics simulations illuminate the role of sequence context in the ELF3-PrD-based temperature sensing mechanism in plants. eLife, 13, RP102410. https://doi.org/10.7554/eLife.102410.1
Millar, A. J., Straume, M., Chory, J., Chua, N. H., & Kay, S. A. (1995). Circadian clock mutants in Arabidopsis identified by luciferase imaging. Science, 267, 1161–1163. https://doi.org/10.1126/science.7855595
Hicks, K. A., Albertson, T. M., & Wagner, D. R. (2001). EARLY FLOWERING3 encodes a novel protein that regulates circadian clock function and flowering in Arabidopsis. Plant Cell, 13(6), 1281–1292. https://doi.org/10.1105/tpc.13.6.1281
MicrobeNotes. (n.d.). Illumina sequencing. Retrieved from https://microbenotes.com/illumina-sequencing/
Lee, J., Park, S., Lee, S., Kweon, H. Y., Jo, Y. Y., Kim, J., Chung, J. H., & Seonwoo, H. (2023). Development of silk fibroin-based non-crosslinking thermosensitive bioinks for 3D bioprinting. Polymers (Basel), 15(17), 3567. https://doi.org/10.3390/polym15173567
Trucco, D., Sharma, A., Manferdini, C., Gabusi, E., Petretta, M., Desando, G., Ricotti, L., Chakraborty, J., Ghosh, S., & Lisignoli, G. (2021). Modeling and fabrication of silk fibroin-gelatin-based constructs using extrusion-based three-dimensional bioprinting. ACS Biomaterials Science & Engineering, 7(7), 3306–3320. https://doi.org/10.1021/acsbiomaterials.1c00410
Tseo, Y., Guempel, M., Hogan, C., & Hunter, I. (2025). Renewable self-folding origami constructed from bioengineered bacterial cellulose. bioRxiv. https://doi.org/10.1101/2025.0.0
University of the West of England. (n.d.). Research develops environmentally-friendly e-textiles. Retrieved from https://www.uwe.ac.uk/news/research-develops-environmentally-friendly-e-textiles
Week 3 HW: Lab Automation

Important
FINAL PROJECT IDEAS: 3 Initial Proposals.
Final Project Ideas by Isobel LeonardHomework Part 1: Python Script for Opentrons Artwork
This week we are creating a Python file to run on an Opentrons OT-2 liquid handling robot to create flourescent designs. This is achieved by depositing E.coli genetically engineered to express different fluorescent proteins onto black agar plates. The flouresence will be visible under UV light and so will our designs!
I started first quite ambitious and used The Automation Art Interface to upload a image of Hello Kitty.

I have no experience programming or coding so this was quite a daunting task and I ended up needing to use Google Gemini to assist. I gave it some of the example code e.g the mathematical heart example and DNA helix as well as the “important notes” highlighted in the Opentrons Collab. Then I gave it the co-ordinates generated in the Automation Art Interface and asked it to assigned each group of co-ordinate to Red, green and orange. I then gave it “Your code” template and asked it to help complete it with my co-ordinates.
CLICK HERE TO EXPAND CODE
from opentrons import types

      metadata = {    # see https://docs.opentrons.com/v2/tutorial.html#tutorial-metadata
          'author': '',
          'protocolName': '',
          'description': '',
          'source': 'HTGAA 2026 Opentrons Lab',
          'apiLevel': '2.20'
      }

      ##############################################################################
      ###   Robot deck setup constants - don't change these
      ##############################################################################

      TIP_RACK_DECK_SLOT = 9
      COLORS_DECK_SLOT = 6
      AGAR_DECK_SLOT = 5
      PIPETTE_STARTING_TIP_WELL = 'A1'

      well_colors = {
          'A1' : 'Red',
          'B1' : 'Green',
          'C1' : 'Orange'
      }


      def run(protocol):
        ##############################################################################
        ###   Load labware, modules and pipettes
        ##############################################################################

        # Tips
        tips_20ul = protocol.load_labware('opentrons_96_tiprack_20ul', TIP_RACK_DECK_SLOT, 'Opentrons 20uL Tips')

        # Pipettes
        pipette_20ul = protocol.load_instrument("p20_single_gen2", "right", [tips_20ul])

        # Modules
        temperature_module = protocol.load_module('temperature module gen2', COLORS_DECK_SLOT)

        # Temperature Module Plate
        temperature_plate = temperature_module.load_labware('opentrons_96_aluminumblock_generic_pcr_strip_200ul',
                                                            'Cold Plate')
        # Choose where to take the colors from
        color_plate = temperature_plate

        # Agar Plate
        agar_plate = protocol.load_labware('htgaa_agar_plate', AGAR_DECK_SLOT, 'Agar Plate')  ## TA MUST CALIBRATE EACH PLATE!
        # Get the top-center of the plate, make sure the plate was calibrated before running this
        center_location = agar_plate['A1'].top()

        pipette_20ul.starting_tip = tips_20ul.well(PIPETTE_STARTING_TIP_WELL)

        ##############################################################################
        ###   Patterning
        ##############################################################################

        ###
        ### Helper functions for this lab
        ###

        # pass this e.g. 'Red' and get back a Location which can be passed to aspirate()
        def location_of_color(color_string):
          for well,color in well_colors.items():
            if color.lower() == color_string.lower():
              return color_plate[well]
          raise ValueError(f"No well found with color {color_string}")

        # For this lab, instead of calling pipette.dispense(1, loc) use this: dispense_and_detach(pipette, 1, loc)
        def dispense_and_detach(pipette, volume, location):
            """
            Move laterally 5mm above the plate (to avoid smearing a drop); then drop down to the plate,
            dispense, move back up 5mm to detach drop, and stay high to be ready for next lateral move.
            5mm because a 4uL drop is 2mm diameter; and a 2deg tilt in the agar pour is >3mm difference across a plate.
            """
            assert(isinstance(volume, (int, float)))
            above_location = location.move(types.Point(z=location.point.z + 5))  # 5mm above
            pipette.move_to(above_location)       # Go to 5mm above the dispensing location
            pipette.dispense(volume, location)    # Go straight downwards and dispense
            pipette.move_to(above_location)       # Go straight up to detach drop and stay high

        ###
        ### YOUR CODE HERE to create your design
        ###

          # Coordinate sets for Hello Kitty outline
        point_sets = [
            ('Red', [(3.3, 23.1),(5.5, 23.1),(18.7, 23.1),(-18.7, 20.9),(7.7, 20.9),(18.7, 20.9),(-20.9, 18.7),(-14.3, 18.7),(-12.1, 18.7),(-5.5, 18.7),(-3.3, 18.7),(-1.1, 18.7),(20.9, 18.7),(-1.1, 16.5),(7.7, 16.5),(20.9, 16.5),(-1.1, 14.3),(20.9, 14.3),(-1.1, 12.1),(7.7, 12.1),(14.3, 12.1),(23.1, 12.1),(-20.9, 9.9),(14.3, 9.9),(16.5, 9.9),(23.1, 9.9),(23.1, 7.7),(-23.1, 5.5),(14.3, 5.5),(16.5, 5.5),(18.7, 5.5),(20.9, 5.5),(23.1, 5.5),(-23.1, 3.3),(23.1, 3.3),(-23.1, 1.1),(25.3, 1.1),(-25.3, -1.1),(-23.1, -1.1),(20.9, -1.1),(23.1, -1.1),(25.3, -1.1),(27.5, -1.1),(-27.5, -3.3),(-25.3, -3.3),(-23.1, -3.3),(25.3, -3.3),(-23.1, -5.5),(-12.1, -5.5),(12.1, -5.5),(23.1, -5.5),(-23.1, -7.7),(-20.9, -7.7),(-12.1, -7.7),(-1.1, -7.7),(1.1, -7.7),(3.3, -7.7),(12.1, -7.7),(20.9, -7.7),(23.1, -7.7),(25.3, -7.7),(27.5, -7.7),(-23.1, -9.9),(3.3, -9.9),(23.1, -9.9),(-20.9, -12.1),(-18.7, -12.1),(20.9, -12.1),(25.3, -12.1),(-16.5, -14.3),(18.7, -14.3),(-14.3, -16.5),(-12.1, -16.5),(12.1, -16.5),(14.3, -16.5),(-9.9, -18.7),(-7.7, -18.7),(-5.5, -18.7),(-3.3, -18.7),(-1.1, -18.7),(1.1, -18.7),(3.3, -18.7),(5.5, -18.7),(7.7, -18.7),(9.9, -18.7)]),
            ('Green', [(7.7, 23.1),(-20.9, 20.9),(-14.3, 20.9),(9.9, 20.9),(-23.1, 18.7),(-23.1, 16.5),(-23.1, 14.3),(14.3, 14.3),(-23.1, 12.1),(-23.1, 7.7),(18.7, 3.3),(-25.3, 1.1),(-29.7, -3.3),(12.1, -3.3),(23.1, -3.3),(-25.3, -14.3),(-23.1, -14.3),(-14.3, -14.3)]),
            ('Orange', [(16.5, 23.1),(-16.5, 20.9),(1.1, 20.9),(12.1, 20.9),(14.3, 20.9),(16.5, 20.9),(20.9, 20.9),(-7.7, 18.7),(1.1, 18.7),(9.9, 18.7),(5.5, 16.5),(5.5, 14.3),(9.9, 14.3),(12.1, 14.3),(16.5, 14.3),(18.7, 14.3),(23.1, 14.3),(5.5, 12.1),(1.1, 9.9),(3.3, 9.9),(5.5, 9.9),(7.7, 9.9),(9.9, 9.9),(12.1, 7.7),(23.1, 1.1),(29.7, -1.1),(-20.9, -3.3),(-12.1, -3.3),(25.3, -5.5),(-25.3, -9.9),(-20.9, -9.9),(16.5, -14.3)]),
            ('Red', [(-1.1, -9.9),(1.1, -9.9)])
        ]

        import numpy as np
        for color, points in point_sets:
            pts = np.array(points)
            pts[:,0] -= np.mean(pts[:,0])
            pts[:,1] -= np.mean(pts[:,1])
            radii = np.sqrt(pts[:,0]**2 + pts[:,1]**2)
            scale = 40 / np.max(radii)
            pts *= scale

            pipette_20ul.pick_up_tip()
            cell_well = location_of_color(color)
            for i, (x, y) in enumerate(pts):
                if i % 20 == 0:
                    pipette_20ul.aspirate(min(20, len(pts)-i), cell_well)
                adjusted_location = center_location.move(types.Point(x, y))
                dispense_and_detach(pipette_20ul, 1, adjusted_location)
            pipette_20ul.drop_tip()
        # Don't forget to end with a drop_tip()
RESULTS:

Kitty went quite wonky and I battled for quite some time with Gemini, but I think it is something wrong with the scaling that I didn't understand. I kept getting issues with my indentation, so I decided to pivot and try a simpler design.
PIVOT!
Instead I tried a little lady face: Published Here.


Again, I used Google Gemini in the same way feeding it the example codes and then the new co-ordinates catagorised into each colour- red, green and orange. I initially had an issue that the Opentrons library wasn’t available so I added the top line on the code from troubleshooting with Gemini and it worked.
CLICK HERE TO EXPAND CODE
        # 1. Install the library (Required for Google Colab)
        !pip install opentrons

        from opentrons import types

        metadata = {
            'author': 'Your Name',
            'protocolName': 'Microbial Art Assignment',
            'description': 'Simple design with Red, Green, and Orange dots',
            'source': 'HTGAA 2026 Opentrons Lab',
            'apiLevel': '2.20'
        }

        ##############################################################################
        ###   Robot deck setup constants
        ##############################################################################

        TIP_RACK_DECK_SLOT = 9
        COLORS_DECK_SLOT = 6
        AGAR_DECK_SLOT = 5
        PIPETTE_STARTING_TIP_WELL = 'A1'

        well_colors = {
            'A1' : 'Red',
            'B1' : 'Green',
            'C1' : 'Orange'
        }

        def run(protocol):
            # Load labware
            tips_20ul = protocol.load_labware('opentrons_96_tiprack_20ul', TIP_RACK_DECK_SLOT, 'Opentrons 20uL Tips')
            pipette_20ul = protocol.load_instrument("p20_single_gen2", "right", [tips_20ul])
            temperature_module = protocol.load_module('temperature module gen2', COLORS_DECK_SLOT)
            temperature_plate = temperature_module.load_labware('opentrons_96_aluminumblock_generic_pcr_strip_200ul', 'Cold Plate')
            color_plate = temperature_plate
            agar_plate = protocol.load_labware('htgaa_agar_plate', AGAR_DECK_SLOT, 'Agar Plate')

            center_location = agar_plate['A1'].top()
            pipette_20ul.starting_tip = tips_20ul.well(PIPETTE_STARTING_TIP_WELL)

            # Helper functions
            def location_of_color(color_string):
                for well, color in well_colors.items():
                    if color.lower() == color_string.lower():
                        return color_plate[well]
                raise ValueError(f"No well found with color {color_string}")

            def dispense_and_detach(pipette, volume, location):
                above_location = location.move(types.Point(z=5))
                pipette.move_to(above_location)
                pipette.dispense(volume, location)
                pipette.move_to(above_location)

            ### YOUR DESIGN DATA ###
            red_points = [(-23.1, 14.3),(-20.9, 14.3),(-18.7, 14.3),(-16.5, 14.3),(-14.3, 14.3),(14.3, 14.3),(16.5, 14.3),(18.7, 14.3),(20.9, 14.3),(23.1, 14.3)]
            green_points = [(-18.7, 7.7),(18.7, 7.7),(-20.9, 5.5),(-18.7, 5.5),(-16.5, 5.5),(16.5, 5.5),(18.7, 5.5),(20.9, 5.5),(-18.7, 3.3),(18.7, 3.3)]
            orange_points = [(-1.1, -14.3),(3.3, -14.3),(-3.3, -16.5),(-1.1, -16.5),(1.1, -16.5),(3.3, -16.5),(5.5, -16.5),(-5.5, -18.7),(-3.3, -18.7),(-1.1, -18.7),(1.1, -18.7),(3.3, -18.7),(5.5, -18.7),(7.7, -18.7),(-3.3, -20.9),(-1.1, -20.9),(1.1, -20.9),(3.3, -20.9),(5.5, -20.9),(1.1, -23.1)]

            # Drawing Red
            if red_points:
                pipette_20ul.pick_up_tip()
                for i in range(0, len(red_points), 20):
                    batch = red_points[i:i+20]
                    pipette_20ul.aspirate(len(batch), location_of_color('Red'))
                    for x, y in batch:
                        target = center_location.move(types.Point(x=x, y=y))
                        dispense_and_detach(pipette_20ul, 1, target)
                pipette_20ul.drop_tip()

            # Drawing Green
            if green_points:
                pipette_20ul.pick_up_tip()
                for i in range(0, len(green_points), 20):
                    batch = green_points[i:i+20]
                    pipette_20ul.aspirate(len(batch), location_of_color('Green'))
                    for x, y in batch:
                        target = center_location.move(types.Point(x=x, y=y))
                        dispense_and_detach(pipette_20ul, 1, target)
                pipette_20ul.drop_tip()

            # Drawing Orange
            if orange_points:
                pipette_20ul.pick_up_tip()
                for i in range(0, len(orange_points), 20):
                    batch = orange_points[i:i+20]
                    pipette_20ul.aspirate(len(batch), location_of_color('Orange'))
                    for x, y in batch:
                        target = center_location.move(types.Point(x=x, y=y))
                        dispense_and_detach(pipette_20ul, 1, target)
                pipette_20ul.drop_tip()
Results:

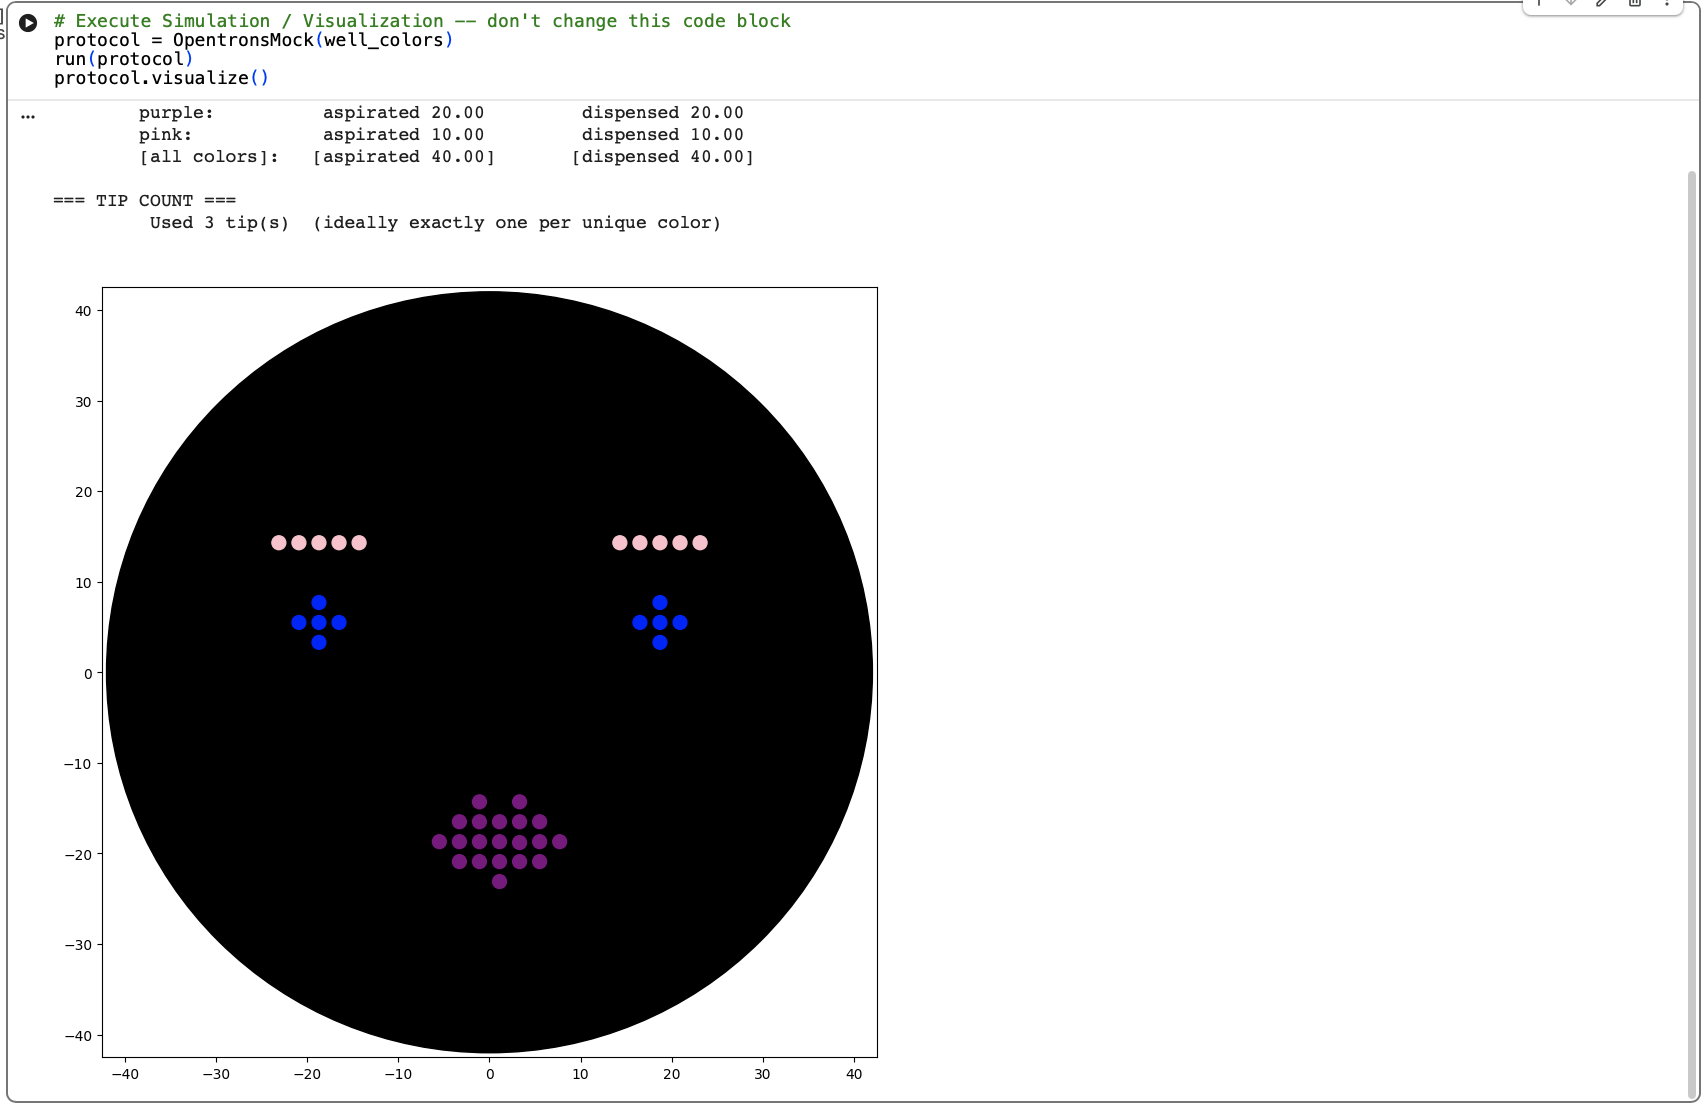
This worked well and although not as cute as the kitty, I am happy with the design.
Preparing for Lifelabs Opentron
Finally, I needed to update my Opentron design to work with the colours we had available at Lifelabs London Node. This was A1: pink, B1 : blue and C1: purple.
CLICK HERE TO EXPAND CODE
from opentrons import types

metadata = {    # see https://docs.opentrons.com/v2/tutorial.html#tutorial-metadata
    'author': 'isobel jo leonard',
    'protocolName': 'ladyface',
    'description': 'opentron protocol',
    'source': 'HTGAA 2026 Opentrons Lab',
    'apiLevel': '2.20'
}

##############################################################################
###   Robot deck setup constants - don't change these
##############################################################################

TIP_RACK_DECK_SLOT = 9
COLORS_DECK_SLOT = 6
AGAR_DECK_SLOT = 5
PIPETTE_STARTING_TIP_WELL = 'A1'

well_colors = {
    'A1' : 'pink',
    'B1' : 'blue',
    'C1' : 'purple'
}


def run(protocol):
  ##############################################################################
  ###   Load labware, modules and pipettes
  ##############################################################################

  # Tips
  tips_20ul = protocol.load_labware('opentrons_96_tiprack_20ul', TIP_RACK_DECK_SLOT, 'Opentrons 20uL Tips')

  # Pipettes
  pipette_20ul = protocol.load_instrument("p20_single_gen2", "right", [tips_20ul])

  # Modules
  temperature_module = protocol.load_module('temperature module gen2', COLORS_DECK_SLOT)

  # Temperature Module Plate
  temperature_plate = temperature_module.load_labware('opentrons_96_aluminumblock_generic_pcr_strip_200ul',
                                                      'Cold Plate')
  # Choose where to take the colors from
  color_plate = temperature_plate

  # Agar Plate
  agar_plate = protocol.load_labware('htgaa_agar_plate', AGAR_DECK_SLOT, 'Agar Plate')  ## TA MUST CALIBRATE EACH PLATE!
  # Get the top-center of the plate, make sure the plate was calibrated before running this
  center_location = agar_plate['A1'].top()

  pipette_20ul.starting_tip = tips_20ul.well(PIPETTE_STARTING_TIP_WELL)

  ##############################################################################
  ###   Patterning
  ##############################################################################

  ###
  ### Helper functions for this lab
  ###

  # pass this e.g. 'Red' and get back a Location which can be passed to aspirate()
  def location_of_color(color_string):
    for well,color in well_colors.items():
      if color.lower() == color_string.lower():
        return color_plate[well]
    raise ValueError(f"No well found with color {color_string}")

  # For this lab, instead of calling pipette.dispense(1, loc) use this: dispense_and_detach(pipette, 1, loc)
  def dispense_and_detach(pipette, volume, location):
      """
      Move laterally 5mm above the plate (to avoid smearing a drop); then drop down to the plate,
      dispense, move back up 5mm to detach drop, and stay high to be ready for next lateral move.
      5mm because a 4uL drop is 2mm diameter; and a 2deg tilt in the agar pour is >3mm difference across a plate.
      """
      assert(isinstance(volume, (int, float)))
      above_location = location.move(types.Point(z=location.point.z + 5))  # 5mm above
      pipette.move_to(above_location)       # Go to 5mm above the dispensing location
      pipette.dispense(volume, location)    # Go straight downwards and dispense
      pipette.move_to(above_location)       # Go straight up to detach drop and stay high

  ###
  ### YOUR CODE HERE to create your design
  ###

  # Define your design points
  sfgfp_points = [(-23.1, 14.3),(-20.9, 14.3),(-18.7, 14.3),(-16.5, 14.3),(-14.3, 14.3),(14.3, 14.3),(16.5, 14.3),(18.7, 14.3),(20.9, 14.3),(23.1, 14.3)]
  mrfp1_points = [(-18.7, 7.7),(18.7, 7.7),(-20.9, 5.5),(-18.7, 5.5),(-16.5, 5.5),(16.5, 5.5),(18.7, 5.5),(20.9, 5.5),(-18.7, 3.3),(18.7, 3.3)]
  electra2_points = [(-1.1, -14.3),(3.3, -14.3),(-3.3, -16.5),(-1.1, -16.5),(1.1, -16.5),(3.3, -16.5),(5.5, -16.5),(-5.5, -18.7),(-3.3, -18.7),(-1.1, -18.7),(1.1, -18.7),(3.3, -18.8),(5.5, -18.7),(7.7, -18.7),(-3.3, -20.9),(-1.1, -20.9),(1.1, -20.9),(3.3, -20.9),(5.5, -20.9),(1.1, -23.1)]

  # --- Design for sfgfp_points (Pink) ---
  pipette_20ul.pick_up_tip()
  color_source_pink = location_of_color('pink')
  # Aspirate enough volume for all points (1uL per point)
  pipette_20ul.aspirate(len(sfgfp_points), color_source_pink)
  for x, y in sfgfp_points:
    adjusted_location = center_location.move(types.Point(x, y))
    dispense_and_detach(pipette_20ul, 1, adjusted_location)
  pipette_20ul.drop_tip()

  # --- Design for mrfp1_points (Blue) ---
  pipette_20ul.pick_up_tip()
  color_source_blue = location_of_color('blue')
  pipette_20ul.aspirate(len(mrfp1_points), color_source_blue)
  for x, y in mrfp1_points:
    adjusted_location = center_location.move(types.Point(x, y))
    dispense_and_detach(pipette_20ul, 1, adjusted_location)
  pipette_20ul.drop_tip()

  # --- Design for electra2_points (Purple) ---
  pipette_20ul.pick_up_tip()
  color_source_purple = location_of_color('purple')
  pipette_20ul.aspirate(len(electra2_points), color_source_purple)
  for x, y in electra2_points:
    adjusted_location = center_location.move(types.Point(x, y))
    dispense_and_detach(pipette_20ul, 1, adjusted_location)
  pipette_20ul.drop_tip()
You can access the Google Collab also.
Part 2: Postlab Questions.
Find and describe a published paper that utilizes the Opentrons or an automation tool to achieve novel biological applications.
They actually use the Opentrons in the research project I discussed in Week 1: Self-dyeing textiles grown from cellulose-producing bacteria with engineered tyrosinase expression by Walker et al (2023).

Self-dyeing textiles grown from cellulose-producing bacteria with engineered tyrosinase expression Kenneth T. Walker, Jennifer Keane, Vivianne J. Goosens, Wenzhe Song, Koon-Yang Lee, View ORCID ProfileTom Ellis doi: https://doi.org/10.1101/2023.02.28.530172
In this study, they engineered bacteria Komagataeibacter rhaeticus to produce melanin (a black pigment) in bacterial cellulose, creating a sustainable, self-dyeing textile for the fashion industry.
To measure and compare how much melanin the bacteria make under controlled conditions, they conducted a eumelanin production assay and used an Opentrons OT-2 liquid handling robot to prepare 384-well reaction plates
The robot handled transferring precise amounts of development buffer into the reaction plates using an 8-channel 300 μL OT-2 Gen2 pipette. The reaction plates were kept cold at 4°C using the OT-2 Thermo-module to slow eumelanin production during preparation.
Bacterial cells were mixed in one round of aspiration using the OT-2 Gen2 pipette, then a defined volume was transferred into each well of the 384-well plate.
After centrifugation, the Opentrons Absorbance Plate Reader Module was heated to 45°C to accelerate eumelanin production and prevent potential cell growth from affecting optical density readings. Optical density measurements were then taken over time to assess melanin production.
This setup allowed them to run hundreds of controlled reactions simultaneously and automatically measure pigment formation over time. This is novel because they are using automation to perform an experiment at this scale, which would be very difficult manually. This allows them to generate a large, consistent dataset for analysis.
Write a description about what you intend to do with automation tools for your final project. You may include example pseudocode, Python scripts, 3D printed holders, a plan for how to use Ginkgo Nebula, and more. You may reference this week’s recitation slide deck for lab automation details.
Light-Controlled textile patterning with bacterial pigment production.
One possible direction for my final project is to use light to control where pigment-producing bacteria grow on textiles and other objects, essentially creating a form of “bacterial exposure printing.” I want to explore whether projecting patterns of colored light onto a surface can direct the expression of genes that help bacteria stick and form biofilms in specific areas.
This idea is inspired by research showing that Escherichia coli can be patterned onto materials by controlling curli fiber production with light, which anchors the cells in place. If successful, this system could be further engineered so that the bacteria produce pigment only where they are induced to grow, offering a controlled, reproducible, and sustainable method for creating patterns on fabric.
Automation could be useful in this research project as a way of ensuring bacterial preparation and placement is consistent and reproducible.


Moser, Felix, Tham, Eléonore, González, Lina M., Lu, Timothy K. and Voigt, Christopher A. 2019. "Light Controlled, High Resolution Patterning of Living Engineered Bacteria Onto Textiles, Ceramics, and Plastic." Advanced Functional Materials, 29 (30).
Automated Preparation
First, the Opentrons OT-2 could be used for automating the culture preparation before pigment patterning begins. The robot could dispense sterile growth media into wells, inoculate bacteria from starter cultures and measure identical volumes to ensure consistency.
It can also perform precise dilutions so each sample has the same concentration of bacteria. This automation reduces variables between pigment producing bacteria, so that it is possible to determine if pigment production differences are due to light patterning rather than inconsistent culture preparation. This being automated also saves time preparing lots of bacteria.
3D Printed Holders:
Textile is not a standard lab plates, so it would be necessary to design custom 3D-printed holders that fit onto the Opentron deck slots and clamp the fabric preventing it from any movement or folding that would effect the placement of the bacteria. This holder would allow the robot to treat non-standard materials like regular labware and create automated precision over an organic process.
Similarly, a custom holder for the light source could ensure that the projected patterns are always at a fixed distance and angle from the surface, providing uniform exposure for precise control over where the bacteria adheres. The exposure, duration or intensity of the light could also be programmed or automated by arduino script and sequenced with the Opentrons protocol.
Precisely Depositing Bacterial
Using the Opentrons robot, I could dispense precise amounts of pigment producing bacterial culture onto specific co-ordinates on the textile. This would allows for a controlled a base pattern. This means that there would be consistency across trials to see whether the bacteria responds to growth in the light induced areas so we could reliably compare samples.
Automated Washing
The Opentron can be used for a standardised washing cycle to gently remove excess bacteria from the textile. This would ensure an identical timescales of bacterial growth and light exposure then the same washing force to be able to reliably compare results and reproduce patterns.
Documentation
The Opentron can also be used to capture standardised images under the controlled lighting and see results of pigment production. It can also be used to analyse the images and compare pigment intensity.
References:
Moser, F., Tham, E., González, L. M., Lu, T. K., & Voigt, C. A. (2019). Light-controlled, high-resolution patterning of living engineered bacteria onto textiles, ceramics, and plastic. Advanced Functional Materials, 29(27), 201901788. https://doi.org/10.1002/adfm.201901788
Walker, K. T., Keane, J., Goosens, V. J., Song, W., Lee, K.-Y., & Ellis, T. (2023). Self‑dyeing textiles grown from cellulose‑producing bacteria with engineered tyrosinase expression [Preprint]. bioRxiv. https://doi.org/10.1101/2023.02.28.530172
Week 4 HW: Protein Design Part I
Important
PART A: Conceptual Questions
How many molecules of amino acids do you take with a piece of 500 grams of meat? (on average an amino acid is ~100 Daltons)
On average raw meat contains 20% protein by mass (but this varies depending on the type of meat)
500g of meat x 20% = 100g of protein
The average molecular weight of an amino acid is approx 100 Da (daltons the mass of a single molecule)
Da has the same numerical value as g/mol
Therefore 100 Da = 100 g/mol
Therefore, 1 mole of amino acids weighs 100g
1 mole = 6.022 × 10²³ particles (Avogadro constant: the ratio between an amount of substance and the number of particles that it contains)
If 100g = 1 mole
consuming 100g of protein = consuming 6.022 × 10²³ amino acid molecules.
Therefore if you consumed 500g of meat, you took 6.022 × 10²³ amino acid molecules.
Why do humans eat beef but do not become a cow, eat fish but do not become fish?
Humans do not become the animals they eat because the our bodies only absorb the molecular building blocks from food, not the genetic information. Proteins from meat are broken down into amino acids and DNA is broken down into nucleotides before being absorbed in digestion. These molecules are then reassembled to make human proteins, tissues, and organs according to the human genome. The DNA in the food does not alter human cells, so humans remain human.
Why are there only 20 natural amino acids?
According to Bywater et all (2018), the standard 20 amino acids were selected during prebiotic chemical evolution based on the principle of “parsimony whereby the simplest possible structures that have value in terms of function are retained.” Between the 20 amino acids Bywater et al show that significant “function space” is covered, properties such as different polarities, hydrophobicity and reactivity are present in the 20. Other possible amino acids were rejected due to being too complex, redundant or difficult to form naturally. Therefore, the 20 selected form the simplest set of molecules that together would provide sufficient chemical diversity for all protein structures and functions.
As all organisms share a common ancestor, the protein synthesis machinery (e.g ribosomes, tRNAs and enzymes) evolved using the same set of 20 amino acids. This selection likely became evolutionarily “locked in”, or a “frozen accident” as proposed by Francis Crick in 1968, since changing the set would require re-engineering the entire translation system, something strongly discouraged by natural selection (Ribas de Pouplana et al, 2017).
Where did amino acids come from before enzymes that make them, and before life started?
Amino acids formed before life on earth through abiotic (non-biological) chemical reactions occuring on the early earth or in space. Simple molecules carbon dioxide, methane, ammonia, and water reacted with energy from lightning, ultraviolet radiation or volcanic activity to produce amino acids. In 1953 the Miller- Urey experiments demonstrated this through the production of biomolecules from simple gaseous starting materials that simulated the primordial Earth (Parker et al, 2014).
Amino acids may also have been formed in space in asteroids and comets (planetesimals). Planetesimals contained water ice and organic compounds such as methanol, carbon monoxide, and ammonia etc. When radioactive elements heated them, liquid water was produced (termed aqueous alterations) enabling reactions such as Strecker synthesis and Formose-like reactions that form amino acids within asteroids which were delivered later to earth through collision (Cowing, 2023)
If you make an α-helix using D-amino acids, what handedness (right or left) would you expect?
a left-handed a-helix
Biological proteins use L-amino acids (left handed enantiomers) and form right handed a-helices. Synthetic D-amino acids (right handed enantiomers) form left handed a-helices. This preference for one handedness over the other is called homochirality (Ozturk and Sasselov, 2025).
Can you discover additional helices in proteins?
Yes, a-helices are the most common but scientists have discovered that proteins can fold into many different helical structures such as the π- helix, 3₁₀-helix, Polyproline helix or Collagen triple helix usually identified by analysing the 3D geometry of the protein backbone, (Cao et al, 2015).
Why are most molecular helices right-handed?
Most molecular helices are right-handed due to evolutionary selection and structural stability. Research from Scripps Research (Yu, Deng, & Blackmond, 2024) found that in early Earth chemistry, “kinetic resolution” acted as a filter. Chemical reactions in pre-biotic conditions favoured the production of L-amino acids by depleting their right-handed counterparts. These findings suggest that the initial dominance of left-handed enantiomers resulted in the pure, single-handed building blocks necessary for life. Because natural proteins are built from these L-amino acids they naturally twist into right-handed coils to minimise steric hindrance (clashing) between the side chains and the backbone. Moreover, right-handed structures are preferred because their side chains point away from the backbone, making them more stable than the alternative (Banerjee et al., 1996). Finally, Cole and Bystroff (2009) identify a kinetic trapping mechanism where the folding helix exerts a “mechanical torque” on the protein. This torque reinforces right-handed connections while physically pulling apart left-handed ones, ensuring the right-handed form is more dominant.
Why do β-sheets tend to aggregate?
Beta-sheets tend to aggregate because they have sticky edges with unsatisfied hydrogen bonds looking for a compatible protein strand. This allows them to link onto other Beta-strands or sheets indefinitely to form long, stable structures like amyloid fibrils (Niu et al 2024). In a folded protein, beta-sheets are usually protected, however if a protein misfolds or denatures, the backbone amide amide and carbonyl groups are exposed. These groups seek stability by forming intermolecular hydrogen bonds with other available beta-strands.
What is the driving force for β-sheet aggregation?
The primary driving force is the backbone’s need to satisfy hydrogen bonds. The edge of a beta-sheet need to bond with any compatible protein strand to complete its structural requirements.
Another force is Hydrophobicity. Beta-sheets often have one side that is hydrophobic. To avoid contact with water, these hydrophobic faces aggregate into beta-sheets with a dry internal core. Moreover, in many aggregates, the side chains of two opposing sheets interlock tightly in whats termed a steric zipper. This excludes water from the center, creating a dry and stable core (Matthes et al, 2012).
Why do many amyloid diseases form β-sheets?
Many amyloid diseases involve proteins that misfold and form β-sheets because these structures are thermodynamically stable and can stack together to resist degradation. In Beta-sheets, an extensive network of intermolecular hydrogen bonds and tightly packed side chains (steric zippers) provde stability. This creates a rigid, sheet-like structure, stacked further into fibrils, which are insoluble and resistant to degradation causing the toxic aggregates seen in diseases such as Alzheimers (Makin et al, 2005)
Can you use amyloid β-sheets as materials?
These same properties e.g rigidity, stability, resistance to degradation and self-assembly make amyloid β-sheets useful as materials. Scientists are exploring their purpose as programmable scaffolds for tissue engineering, templates for conductive nanowires in electronics and robust membranes for filtering heavy metals from wastewater etc.
References
Bywater RP. Why twenty amino acid residue types suffice(d) to support all living systems. PLoS One. 2018 Oct 15;13(10):e0204883. doi: 10.1371/journal.pone.0204883. PMID: 30321190; PMCID: PMC6188899.
Ribas de Pouplana L, Torres AG, Rafels-Ybern À. What Froze the Genetic Code? Life (Basel). 2017 Apr 5;7(2):14. doi: 10.3390/life7020014. PMID: 28379164; PMCID: PMC5492136.
Cowing, Keith. How were amino acids formed before the origin of life on earth: https://astrobiology.com/2023/04/how-were-amino-acids-formed-before-the-origin-of-life-on-earth.html. 2023.
Parker ET, Cleaves JH, Burton AS, Glavin DP, Dworkin JP, Zhou M, Bada JL, Fernández FM. Conducting miller-urey experiments. J Vis Exp. 2014 Jan 21;(83):e51039. doi: 10.3791/51039. PMID: 24473135; PMCID: PMC4089479.
Ozturk SF, Sasselov DD. Life’s homochirality: Across a prebiotic network. Proc Natl Acad Sci U S A. 2025 Aug 26;122(34):e2505126122. doi: 10.1073/pnas.2505126122. Epub 2025 Aug 19. PMID: 40828029; PMCID: PMC12403148.
Cao C, Xu S, Wang L. An Algorithm for Protein Helix Assignment Using Helix Geometry. PLoS One. 2015 Jul 1;10(7):e0129674. doi: 10.1371/journal.pone.0129674. PMID: 26132394; PMCID: PMC4488512.
Cole BJ, Bystroff C. Alpha helical crossovers favor right-handed supersecondary structures by kinetic trapping: the phone cord effect in protein folding. Protein Sci. 2009 Aug;18(8):1602-8. doi: 10.1002/pro.182. PMID: 19569186; PMCID: PMC2776948.
Banerjee, A., Datta, S.A., Pramanik, A., Shamala, N., & Balaram, P. (1996). Heterogeneity and stability of helical conformations in peptides: crystallographic and NMR studies of a model heptapeptide. Journal of the American Chemical Society, 118, 9477-9483.
Yu, J., Darú, A., Deng, M., & Blackmond, D. G. (2024). Prebiotic access to enantioenriched amino acids via peptide-mediated transamination reactions. Proceedings of the National Academy of Sciences, 121(7), e2315447121. https://doi.org/10.1073/pnas.2315447121
Z. Niu, X. Gui, S. Feng, B. Reif, Chem. Eur. J. 2024, 30, e202400277. https://doi.org/10.1002/chem.202400277
Petersson, E., Williams, M. A., & Shea, J.-E. (2012). Driving forces and structural determinants of steric zipper peptide oligomer formation elucidated by atomistic simulations. Journal of Molecular Biology, 421(2–3), 390–416. https://doi.org/10.1016/j.jmb.2012.02.007
O.S. Makin, E. Atkins, P. Sikorski, J. Johansson, & L.C. Serpell, Molecular basis for amyloid fibril formation and stability, Proc. Natl. Acad. Sci. U.S.A. 102 (2) 315-320, https://doi.org/10.1073/pnas.0406847102 (2005).
PART B: Protein Analysis and Visualization
- Briefly describe the protein you selected and why you selected it.
For this exercise I have chosen the same protein I explored in Week 2 which is a silk worm protein, Bombyx mori Fibroin heavy chain (FibH). It is the primary component of Bombyx mori silk consisting of 75% of its weight. Fibroin has amazing mechanical properties used by insects to construct various marvellous structures including a cocoon, nest, and egg case (Zhang et al. 2024). Therefore, it would be interesting to experiment with for the production of biomaterials and bio-inks to create transparent, complex or bioactive structures. Moreover, Fibroin is non-toxic and biodegradable offering an interesting material alternative to traditional sculptural materials such as glass, resin or plastic. For this task it will also be a great pick as it has a clear relationship between its unique repetitive amino acid sequence and beta sheet secondary structure, responsible for the high tensile strength, elasticity, and toughness of silk fibers.

Scarlett Yang Serecin Protein Bioplastic
- Identify the amino acid sequence of your protein.
Its incredibly long. You can also find it on Uniprot
Important
MRVKTFVILCCALQYVAYTNANINDFDEDYFGSDVTVQSSNTTDEIIRDASGAVIEEQITTKKMQRKNKNHGILGKNEKMIKTFVITTDSDGNESIVEEDVLMKTLSDGTVAQSYVAADAGAYSQSGPYVSNSGYSTHQGYTSDFSTSAAVGAGAGAGAAAGSGAGAGAGYGAASGAGAGAGAGAGAGYGTGAGAGAGAGYGAGAGAGAGAGYGAGAGAGAGAGYGAGAGAGAGAGYGAGAGAGAGAGYGAGAGAGAGAGYGAASGAGAGAGYGQGVGSGAASGAGAGAGAGSAAGSGAGAGAGTGAGAGYGAGAGAGAGAGYGAASGTGAGYGAGAGAGYGGASGAGAGAGAGAGAGAGAGYGTGAGYGAGAGAGAGAGAGAGYGAGAGAGYGAGYGVGAGAGYGAGYGAGAGSGAASGAGSGAGAGSGAGAGSGAGAGSGAGAGSGAGAGSGAGAGSGAGAGSGAGAGSGTGAGSGAGAGYGAGAGAGYGAGAGSGAASGAGAGSGAGAGSGAGAGSGAGAGSGAGAGSGAGAGYGAGAGAGYGAGAGAGYGAGAGVGYGAGAGSGAASGAGAGSGAGAGSGAGAGSGAGAGSGAGAGSGAGAGSGAGAGSGAGAGSGAGAGSGAGVGYGAGVGAGYGAGYGAGAGAGYGAGAGSGAASGAGAGAGAGAGTGSSGFGPYVANGGYSRSDGYEYAWSSDFGTGSGAGAGSGAGAGSGAGAGSGAGAGSGAGAGSGAGAGYGAGVGVGYGAGYGAGAGAGYGAGAGSGAASGAGAGSGAGAGSGAGAGSGAGAGSGAGAGSGAGAGSGAGAGSGAGAGSGAGAGSGAGAGSGAGVGSGAGAGSGAGAGVGYGAGAGVGYGAGAGSGAASGAGAGSGAGAGSGAGAGSGAGAGSGAGAGSGAGAGSGAGAGSGAGAGSGAGAGSGAGVGYGAGVGAGYGAGYGAGAGAGYGAGAGSGAASGAGAGSGAGAGSGAGAGSGAGAGSGAGAGSGAGAGSGAGAGSGAGAGSGAGAGSGAGAGSGAGAGSGAGAGYGAGAGAGYGAGYGAGAGAGYGAGAGSGAASGAGSGAGAGSGAGAGAGSGAGAGSGAGAGSGAGAGSGAGAGSGAGAGSGAGAGYGAGVGAGYGAGYGAGAGAGYGAGAGSGAASGAGAGSGAGAGSGAGAGSGAGAGSGAGAGSGAGAGSGAGAGSGAGVGYGAGYGAGAGAGYGAGAGSGAASGAGAGAGAGAGTGSSGFGPYVAHGGYSGYEYAWSSESDFGTGSGAGAGSGAGAGSGAGAGSGAGAGSGAGYGAGVGAGYGAGYGAGAGAGYGAGAGSGAGSGAGAGSGAGAGSGAGAGSGAGAGSGAGAGSGAGAGSGAGAGSGAGAGSGAGAGYGAGYGAGAGAGYGAGAGSGAGSGAGAGSGAGAGSGAGAGSGAGAGSGAGAGSGAGAGSGAGAGSGAGAGYGAGVGAGYGAGYGAGAGAGYGAGAGSGAGSGAGAGSGAGAGSGAGAGSGAGVGSGAGAGSGAGAGSGAGAGSGAGAGYGAGYGAGAGAGYGAGAGSGAGSGAGAGSGAGAGSGAGAGSGAGAGSGAGAGSGAGAGSGAGAGSGAGVGYGAGVGAGYGAGYGAGAGAGYGAGAGSGAASGAGAGAGAGAGTGSSGFGPYVANGGYSGYEYAWSSESDFGTGSGAGAGSGAGAGSGAGAGSGAGAGSGAGAGYGAGYGAGAGAGYGAGAGSGAGSGAGAGSGAGAGSGAGAGSGAGAGSGAGAGSGAGAGSGAGAGSGAGSGSGAGAGSGAGAGSGAGAGYGAGVGAGYGVGYGAGAGAGYGAGAGSGAASGAGAGAGAGAGTGSSGFGPYVAHGGYSGYEYAWSSESDFGTGSGAGAGSGAGAGSGAGAGSGAGAGSGAGAGSGAGAGSGAGAGYGAGVGAGYGAAYGAGAGAGYGAGAGSGAASGAGAGSGAGAGSGAGAGSGAGAGSGAGAGSGAGAGSGAGAGSGAGAGSGAGAGSGAGAGSGAGAGYGAGAGAGYGAGAGSGAGSGAGAGSGAGAGSGAGAGSGAGAGSGAGAGSGAGSGSGAGAGSGAGAGSGAGAGYGAGVGAGYGAGYGAGAGAGYGAGAGSGAGSGAGAGSGAGAGYGAGAGAGYGAGYGAGAGAGYGAGAGTGAGSGAGAGSGAGAGSGAGAGSGAGAGSGAGAGSGAGAGSGAGSGSGAGAGSGAGAGSGAGAGSGAGAGSGAGAGSGAGAGYGAGAGAGYGAGYGAGAGAGYGAGAGSGAGSGAGAGSGAGAGSGAGAGSGAGAGYGAGYGAGAGSGAASGAGAGAGAGAGTGSSGFGPYVAHGGYSGYEYAWSSESDFGTGSGAGAGSGAGAGAGAGAGSGAGAGYGAGVGAGYGAGYGAGAGAGYGAGAGSGTGSGAGAGSGAGAGYGAGVGAGYGAGAGSGAAFGAGAGAGAGSGAGAGSGAGAGSGAGAGSGAGAGSGAGAGYGAGYGAGVGAGYGAGAGSGAASGAGAGSGAGAGSGAGAGSGAGAGSGAGAGSGAGAGYGAGVGAGYGAGYGAGAGAGYGAGAGSGAASGAGAGSGAGAGAGSGAGAGSGAGAGSGAGAGSGAGSGAGAGSGAGAGSGAGAGYGAGAGSGAASGAGAGAGAGAGTGSSGFGPYVANGGYSGYEYAWSSESDFGTGSGAGAGSGAGAGSGAGAGSGAGAGSGAGAGYGAGVGAGYGAGYGAGAGAGYGAGAGSGAGSGAGAGSGAGAGSGAGAGSGAGAGSGAGAGSGAGAGSGAGAGYGAGAGSGAASGAGAGSGAGAGSGAGAGSGAGAGSGAGAGSGAGAGSGAGAGYGAGVGAGYGVGYGAGAGAGYGAGAGSGAGSGAGAGSGAGAGSGAGAGSGAGAGSGAGSGAGAGSGAGAGSGAGAGSGAGSGAGAGSGAGAGYGVGYGAGAGAGYGAGAGSGAGSGAGAGSGAGAGSGAGAGSGAGSGAGAGSGAGAGSGAGAGSGAGAGYGAGVGAGYGVGYGAGAGAGYGAGAGSGAGSGAGAGSGAGAGSGAGAGSGAGAGSGAGAGSGAGAGSGAGAGSGAGSGAGAGSGAGAGSGAGAGSGAGAGSGAGSGAGAGSGAGAGSGAGAGSGAGAGYGAGVGAGYGVGYGAGVGAGYGAGAGSGAASGAGAGSGAGAGAGSGAGAGSGAGAGSGAGAGSGAGAGSGAGAGSGAGAGYGAGYGAGVGAGYGAGAGVGYGAGAGAGYGAGAGSGAASGAGAGAGSGAGAGTGAGAGSGAGAGYGAGAGSGAASGAGAGAGAGAGTGSSGFGPYVANGGYSGYEYAWSSESDFGTGSGAGAGSGAGAGSGAGAGSGAGAGSGAGAGYGAGVGAGYGAGAGSGAGSGAGAGSGAGAGSGAGAGSGAGAGSGAGAGYGAGAGSGTGSGAGAGSGAGAGSGAGAGSGAGAGSGAGAGSGAGAGSGVGAGYGVGYGAGAGAGYGVGYGAGAGAGYGAGAGSGTGSGAGAGSGAGAGSGAGAGSGAGAGSGAGAGSGAGAGSGAGAGYGAGVGAGYGVGYGAGAGAGYGAGAGSGAGSGAGAGSGAGAGSGAGAGSGAGAGSGAGSGAGAGSGAGAGSGAGAGSGAGSGAGAGSGAGAGYGVGYGAGAGAGYGAGAGSGAGSGAGAGSGAGAGSGAGAGSGAGSGAGAGSGAGAGSGAGAGSGAGAGYGAGVGAGYGVGYGAGAGAGYGAGAGSGAGSGAGAGSGAGAGSGAGAGSGAGAGSGAGAGSGAGAGSGAGAGSGAGSGAGAGSGAGAGSGAGAGSGAGAGYGAGVGAGYGVGYGAGAGAGYGAGAGSGAASGAGAGAGAGAGTGSSGFGPYVANGGYSGYEYAWSSESDFGTGSGAGAGSGAGAGSGAGAGYGAGYGAGVGAGYGAGAGVGYGAGAGAGYGAGAGSGAASGAGAGAGAGAGSGAGAGSGAGAGAGSGAGAGYGAGYGIGVGAGYGAGAGVGYGAGAGAGYGAGAGSGAASGAGAGSGAGAGSGAGAGSGAGAGSGAGAGSGAGAGSGAGAGYGAGYGAGVGAGYGAGAGVGYGAGAGAGYGAGAGSGAASGAGAGAGAGAGAGSGAGAGSGAGAGSGAGAGSGAGAGSGAGAGSGAGAGSGAGAGSGAGAGSGAGAGYGAGVGAGYGAGYGGAGAGYGAGAGSGAASGAGAGSGAGAGSGAGAGSGAGAGSGAGAGSGAGAGYGAGAGSGAASGAGAGAGAGAGTGSSGFGPYVNGGYSGYEYAWSSESDFGTGSGAGAGSGAGAGSGAGAGYGAGVGAGYGAGYGAGAGAGYGAGAGSGAASGAGAGSGAGAGSGAGAGSGAGAGSGAGSGAGAGSGAGAGSGAGAGSGAGAGSGAGAGSGAGAGYGAGVGAGYGAGYGAGAGAGYGAGAGSGAASGAGAGSGAGAGAGSGAGAGSGAGAGSGAGAGSGAGAGSGAGAGSGAGSGAGAGSGAGAGYGAGYGAGVGAGYGAGAGVGYGAGAGAGYGAGAGSGAASGAGAGSGSGAGSGAGAGSGAGAGSGAGAGAGSGAGAGSGAGAGSGAGAGYGAGYGAGAGSGAASGAGAGAGAGAGTGSSGFGPYVANGGYSGYEYAWSSESDFGTGSGAGAGSGAGAGSGAGAGYGAGVGAGYGAGYGAGAGAGYGAGAGSGAGSGAGAGSGAGAGSGAGAGSGAGAGSGAGAGSGAGAGSGAGAGSGAGAGYGAGYGAGAGAGYGAGAGVGYGAGAGAGYGAGAGSGAGSGAGAGSGSGAGAGSGSGAGSGAGAGSGAGAGSGAGAGSGAGAGSGAGAGSGAGAGSGAGAGYGAGYGIGVGAGYGAGAGVGYGAGAGAGYGAGAGSGAASGAGAGSGAGAGSGAGAGSGAGAGSGAGAGSGAGAGSGAGAGSGAGAGSGAGAGSGAGAGYGAGAGVGYGAGAGSGAASGAGAGSGAGAGSGAGAGSGAGAGSGAGAGSGAGAGSGAGAGSGAGSGAGAGSGAGAGYGAGYGAGVGAGYGAGAGYGAGYGVGAGAGYGAGAGSGAGSGAGAGSGAGAGSGAGAGSGAGAGSGAGAGSGAGSGAGAGYGAGAGAGYGAGAGAGYGAGAGSGAASGAGAGAGAGSGAGAGSGAGAGSGAGSGAGAGSGAGAGYGAGAGSGAASGAGAGSGAGAGAGAGAGAGSGAGAGSGAGAGYGAGAGSGAASGAGAGAGAGTGSSGFGPYVANGGYSRREGYEYAWSSKSDFETGSGAASGAGAGAGSGAGAGSGAGAGSGAGAGSGAGAGGSVSYGAGRGYGQGAGSAASSVSSASSRSYDYSRRNVRKNCGIPRRQLVVKFRALPCVNC
How long is it? What is the most frequent amino acid? You can use this Colab notebook to count the frequency of amino acids.
The length of the protein is: 5263 amino acids. The most common amino acid is: G, Glycine which appears 2415 times.
How many protein sequence homologs are there for your protein? Hint: Use Uniprot’s BLAST tool to search for homologs.
The Fibroin protein sequence is really long! and consists largely of highly repetitive, low-complexity patterns that were causing BLAST to time out across all my devices. Instead, I decided to narrow the homologs search to the N-terminal domain (residues 1–151).
MRVKTFVILCCALQYVAYTNANINDFDEDYFGSDVTVQSSNTTDEIIRDASGAVIEEQITTKKMQRKNKNHGILGKNEKMIKTFVITTDSDGNESIVEEDVLMKTLSDGTVAQSYVAADAGAYSQSGPYVSNSGYSTHQGYTSDFSTSAAVGAGAG
This domain is the non-repetitive ‘molecular switch’ responsible for pH-dependent silk assembly before the silk is secreted by the insect.
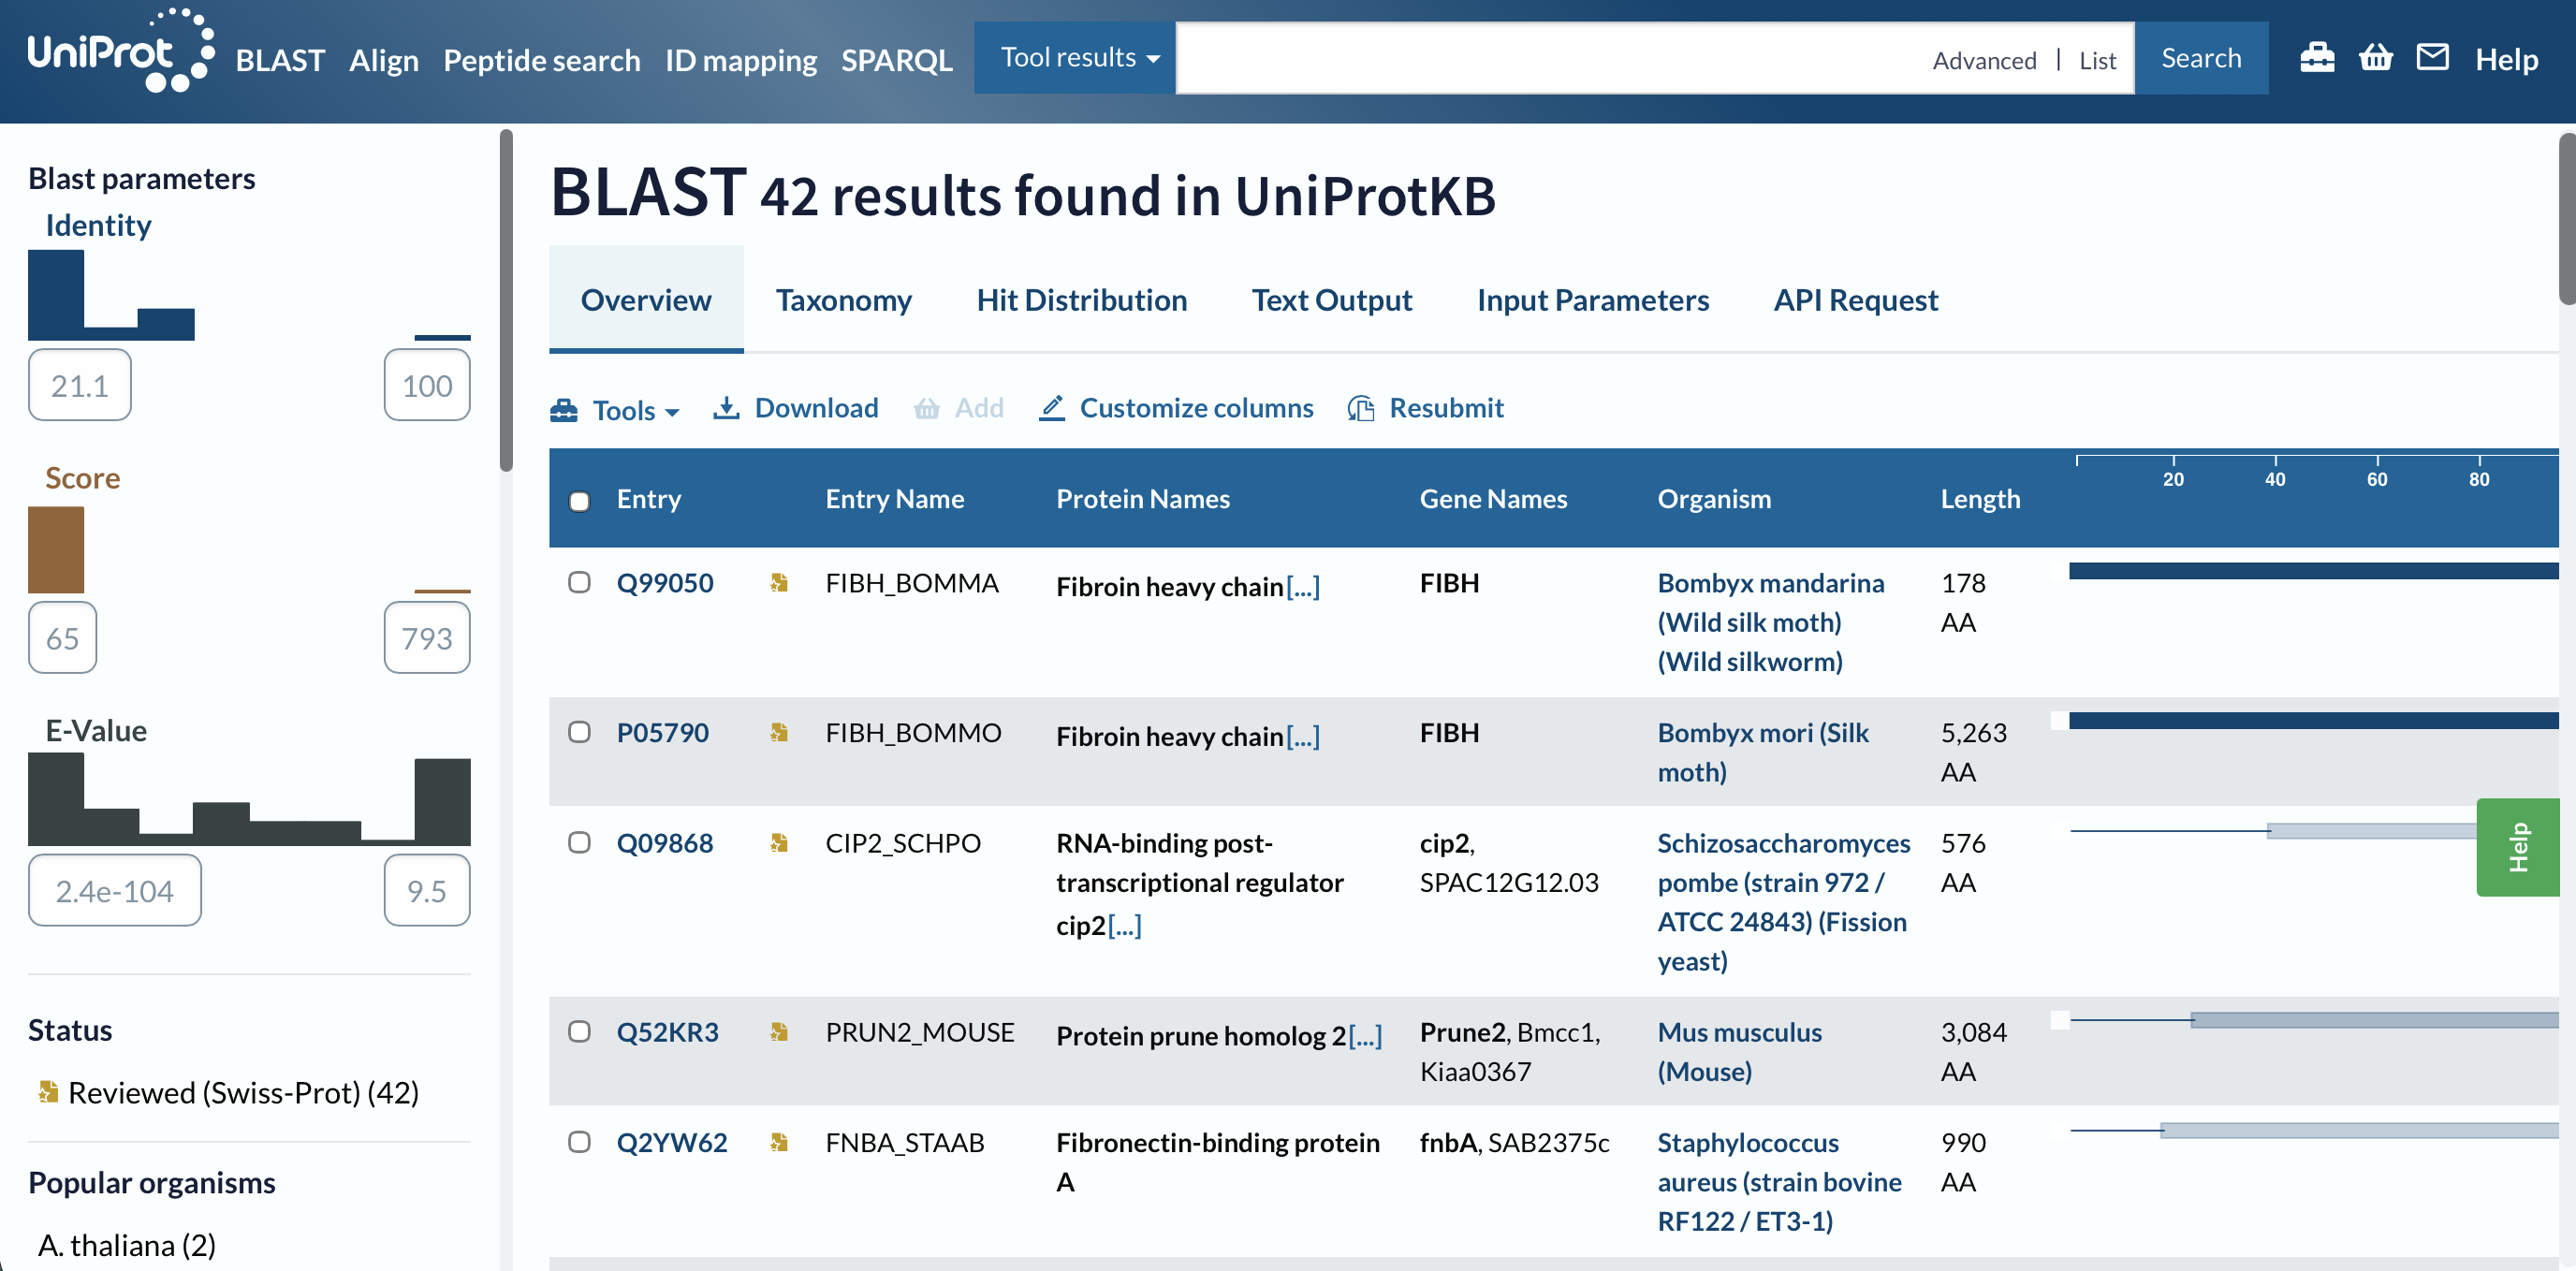
I got 42 results.
The E-values range from 2.4e-104 (basically 0, significant matches ) to 9.5 (really insignificant)
The BLAST search returned 42 results with identities ranging from 21.1% to 100%. The top hit Fibroin heavy chain from Bombyx mandarina (Wild silk moth)showed a maximum score of 793 and an E-value of 2.4×10-104 confirming a highly significant evolutionary relationship with other silk-producing insect species.
Does your protein belong to any protein family?
UniProt and the PANTHER database classify it specifically under the Fibroin Heavy Chain Fib-H Like Protein 1 family. It is defined by its signature Fib-H N terminal domain.
This family is central to the production of silk fibers in insects and spiders and the N-terminal domain mediates the pH responsive assembly of silk proteins as they are secreted.
Identify the structure page of your protein in RCSB
Entry: 3UA0 N-Terminal Domain of Bombyx mori Fibroin Mediates the Assembly of Silk in Response to pH Decrease.
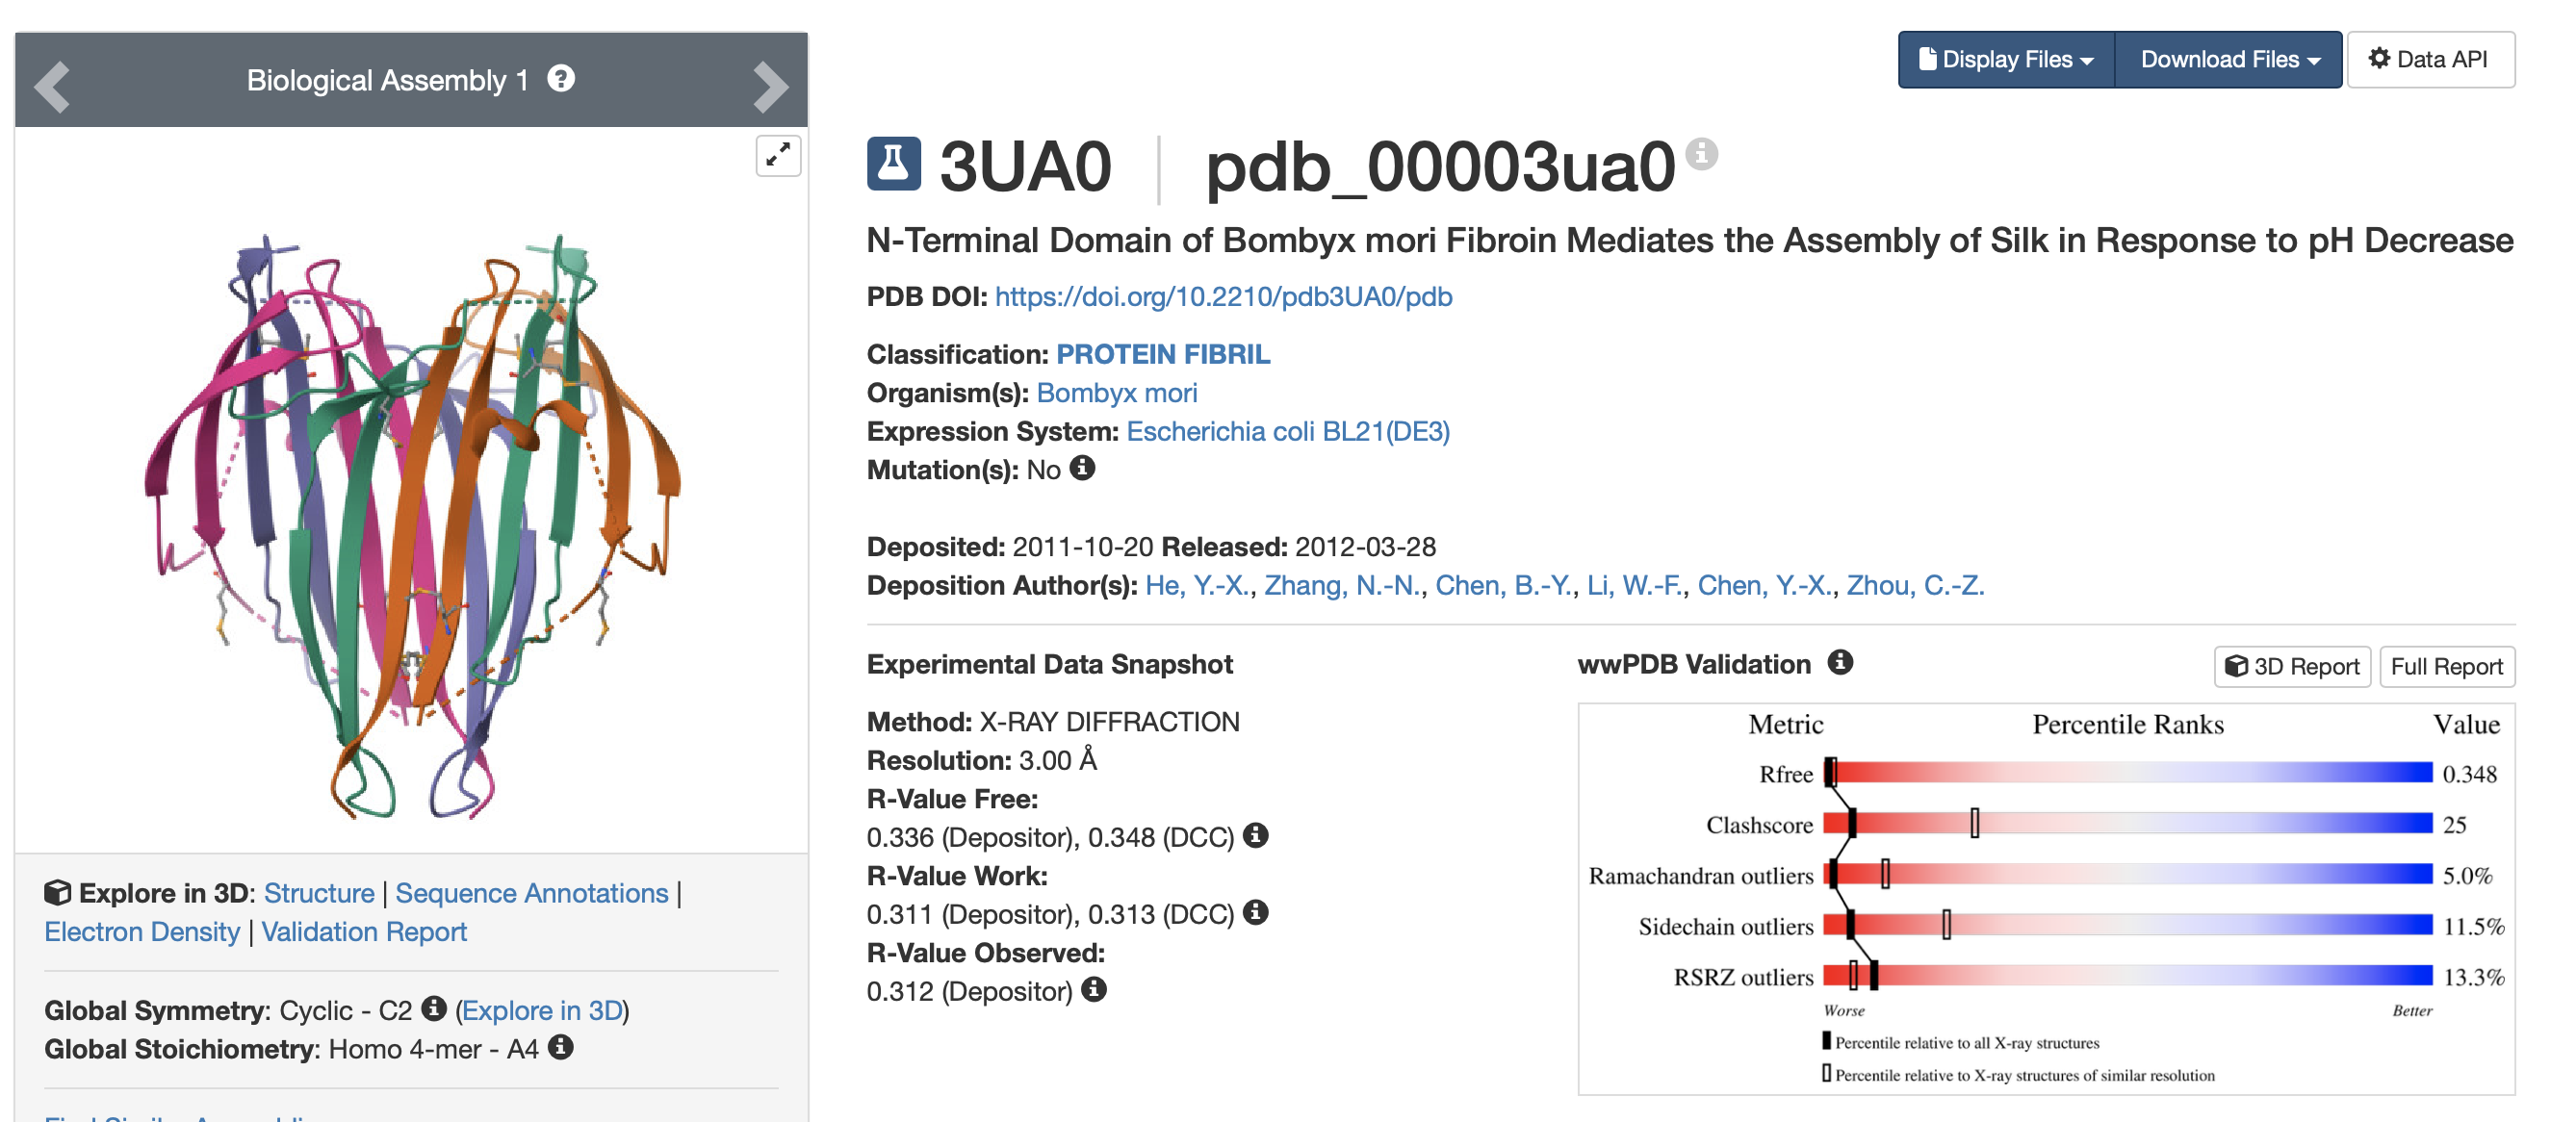
When was the structure solved? Is it a good quality structure? Good quality structure is the one with good resolution. Smaller the better (Resolution: 2.70 Å)
The structure was solves on the 20/10/2011 and released publicly on the 28/03/2012. The resolution is moderate to low at 3.00Å using X-ray diffraction.
Are there any other molecules in the solved structure apart from protein?
MSE (Selenomethionine) a naturally occuring amino acid in some plant materials such as cereal grains, soybeans and enriched yeast.
Does your protein belong to any structure classification family?
No SCOP 2 Classification was available for this protein.
Open the structure of your protein in any 3D molecule visualisation software:
First I used the code “fetch 3UA0” to load the 3UA0 | pdb_00003ua0 from RCSB.
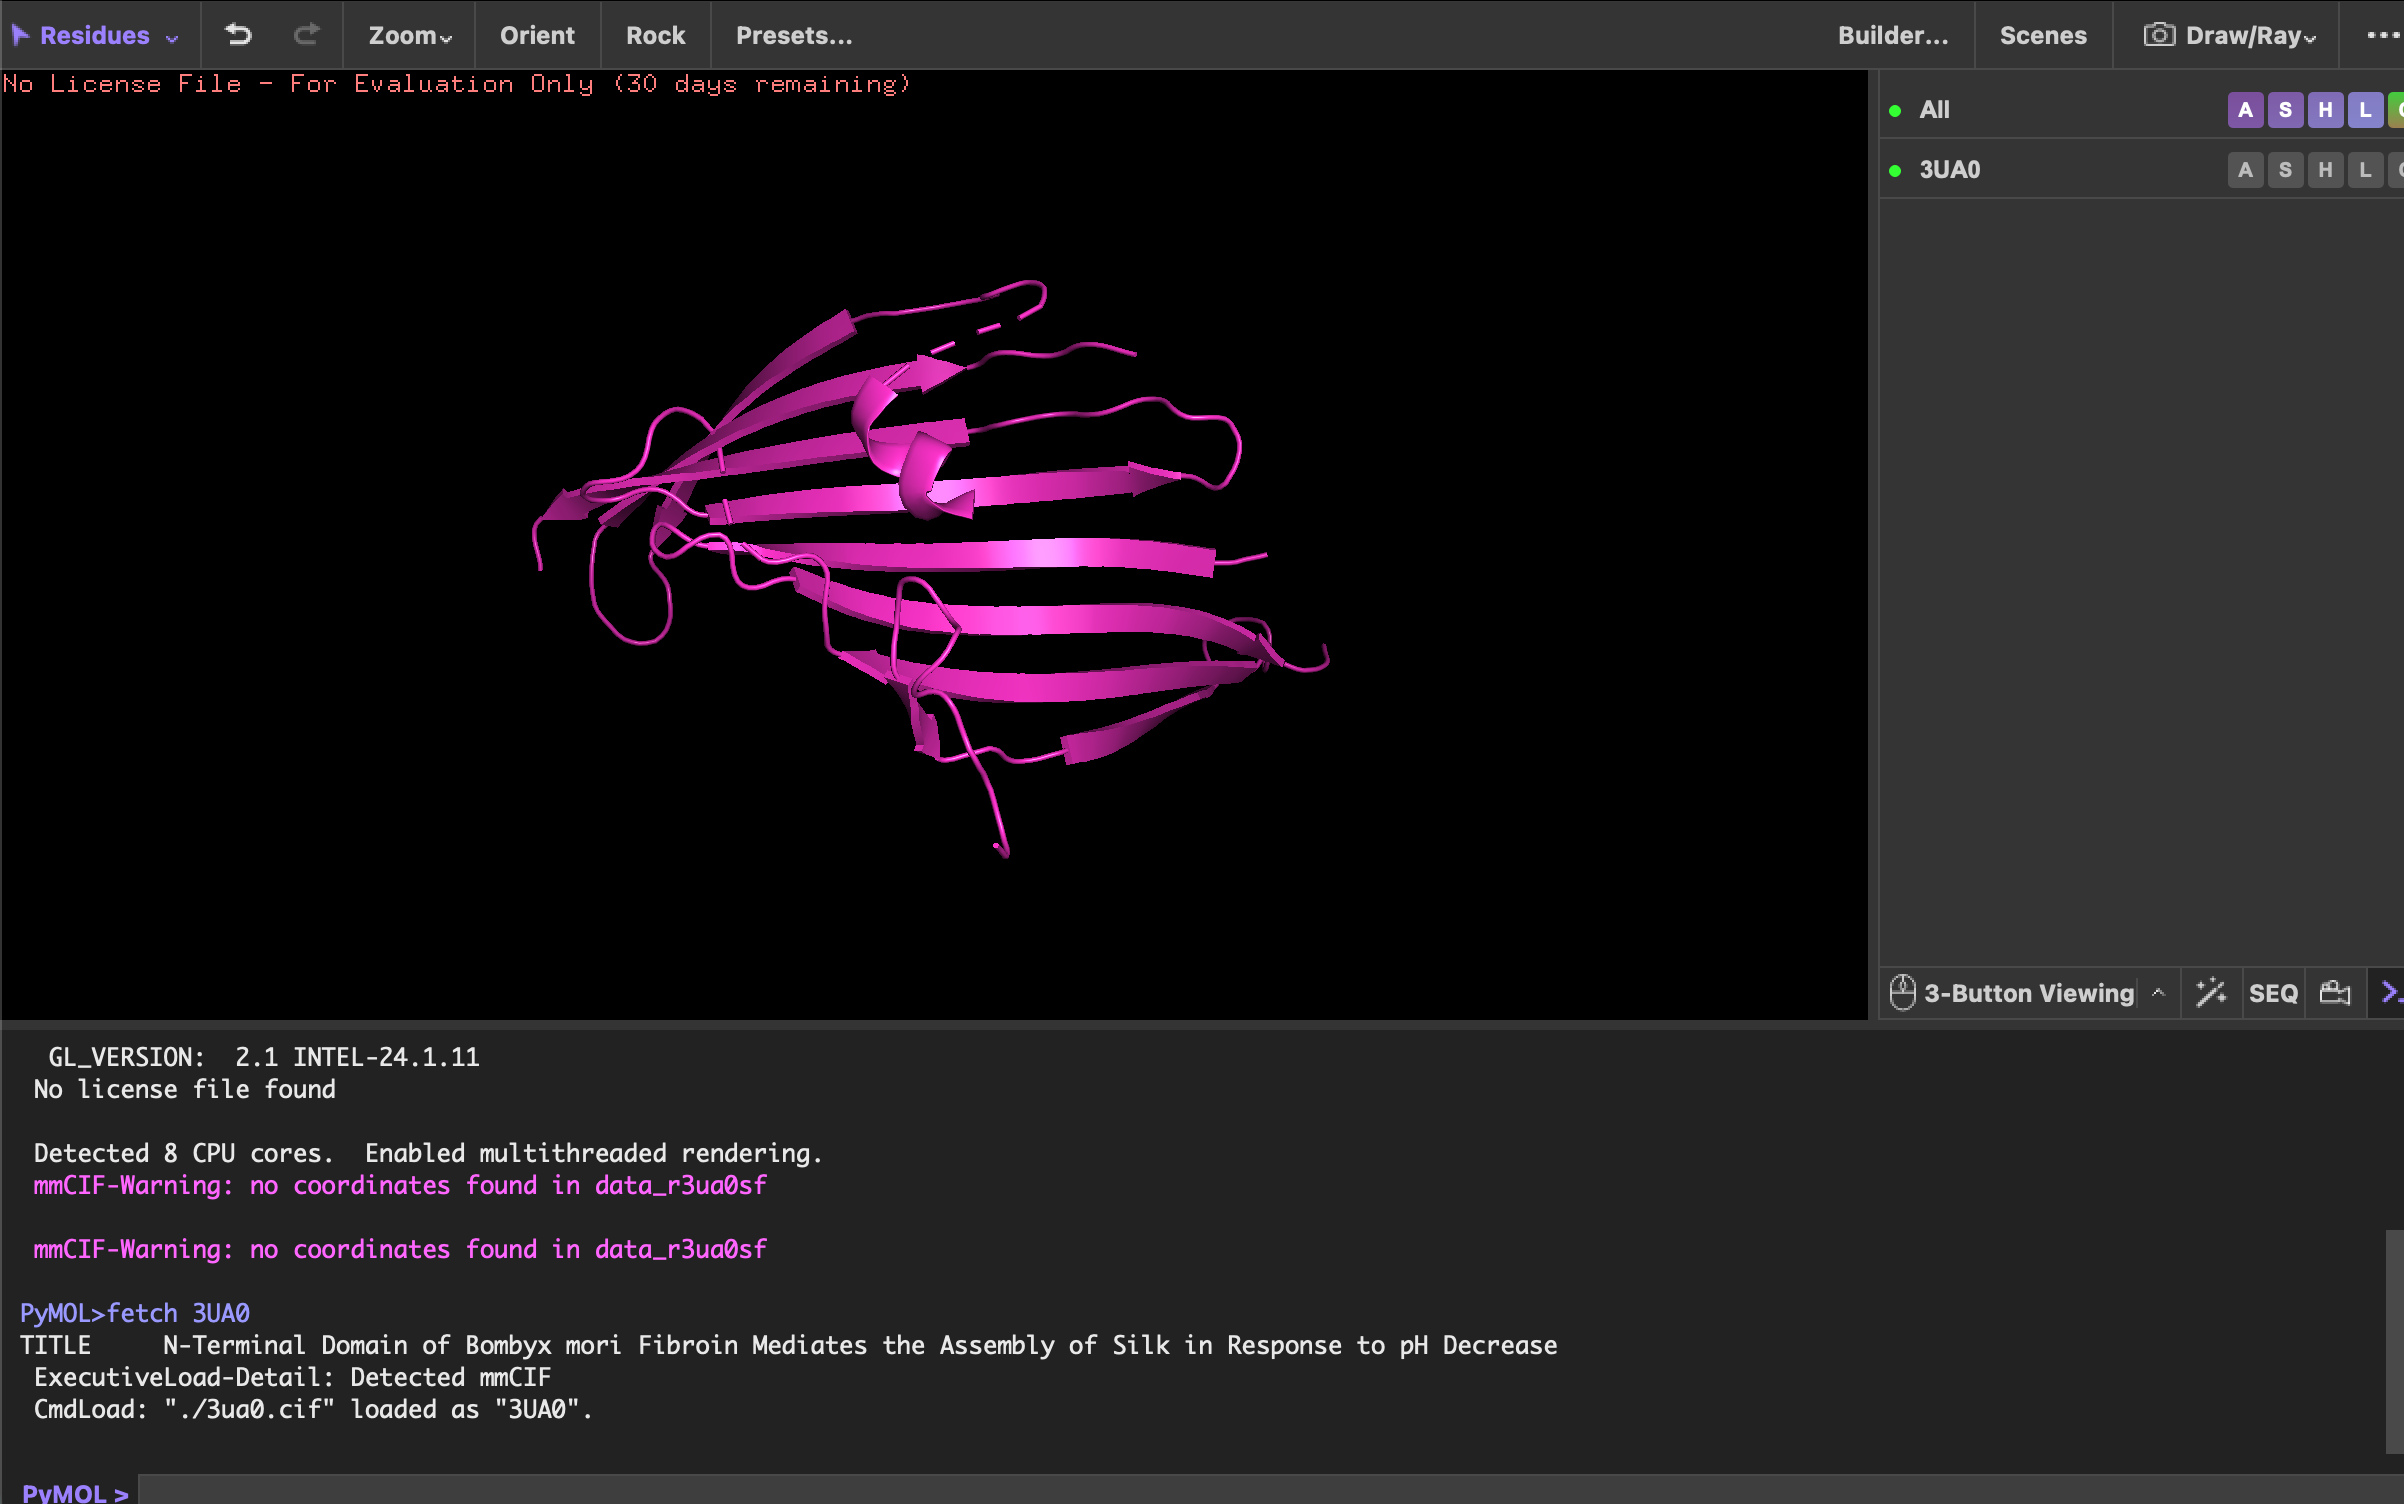
Visualise the protein as “cartoon”, “ribbon” and “ball and stick”.
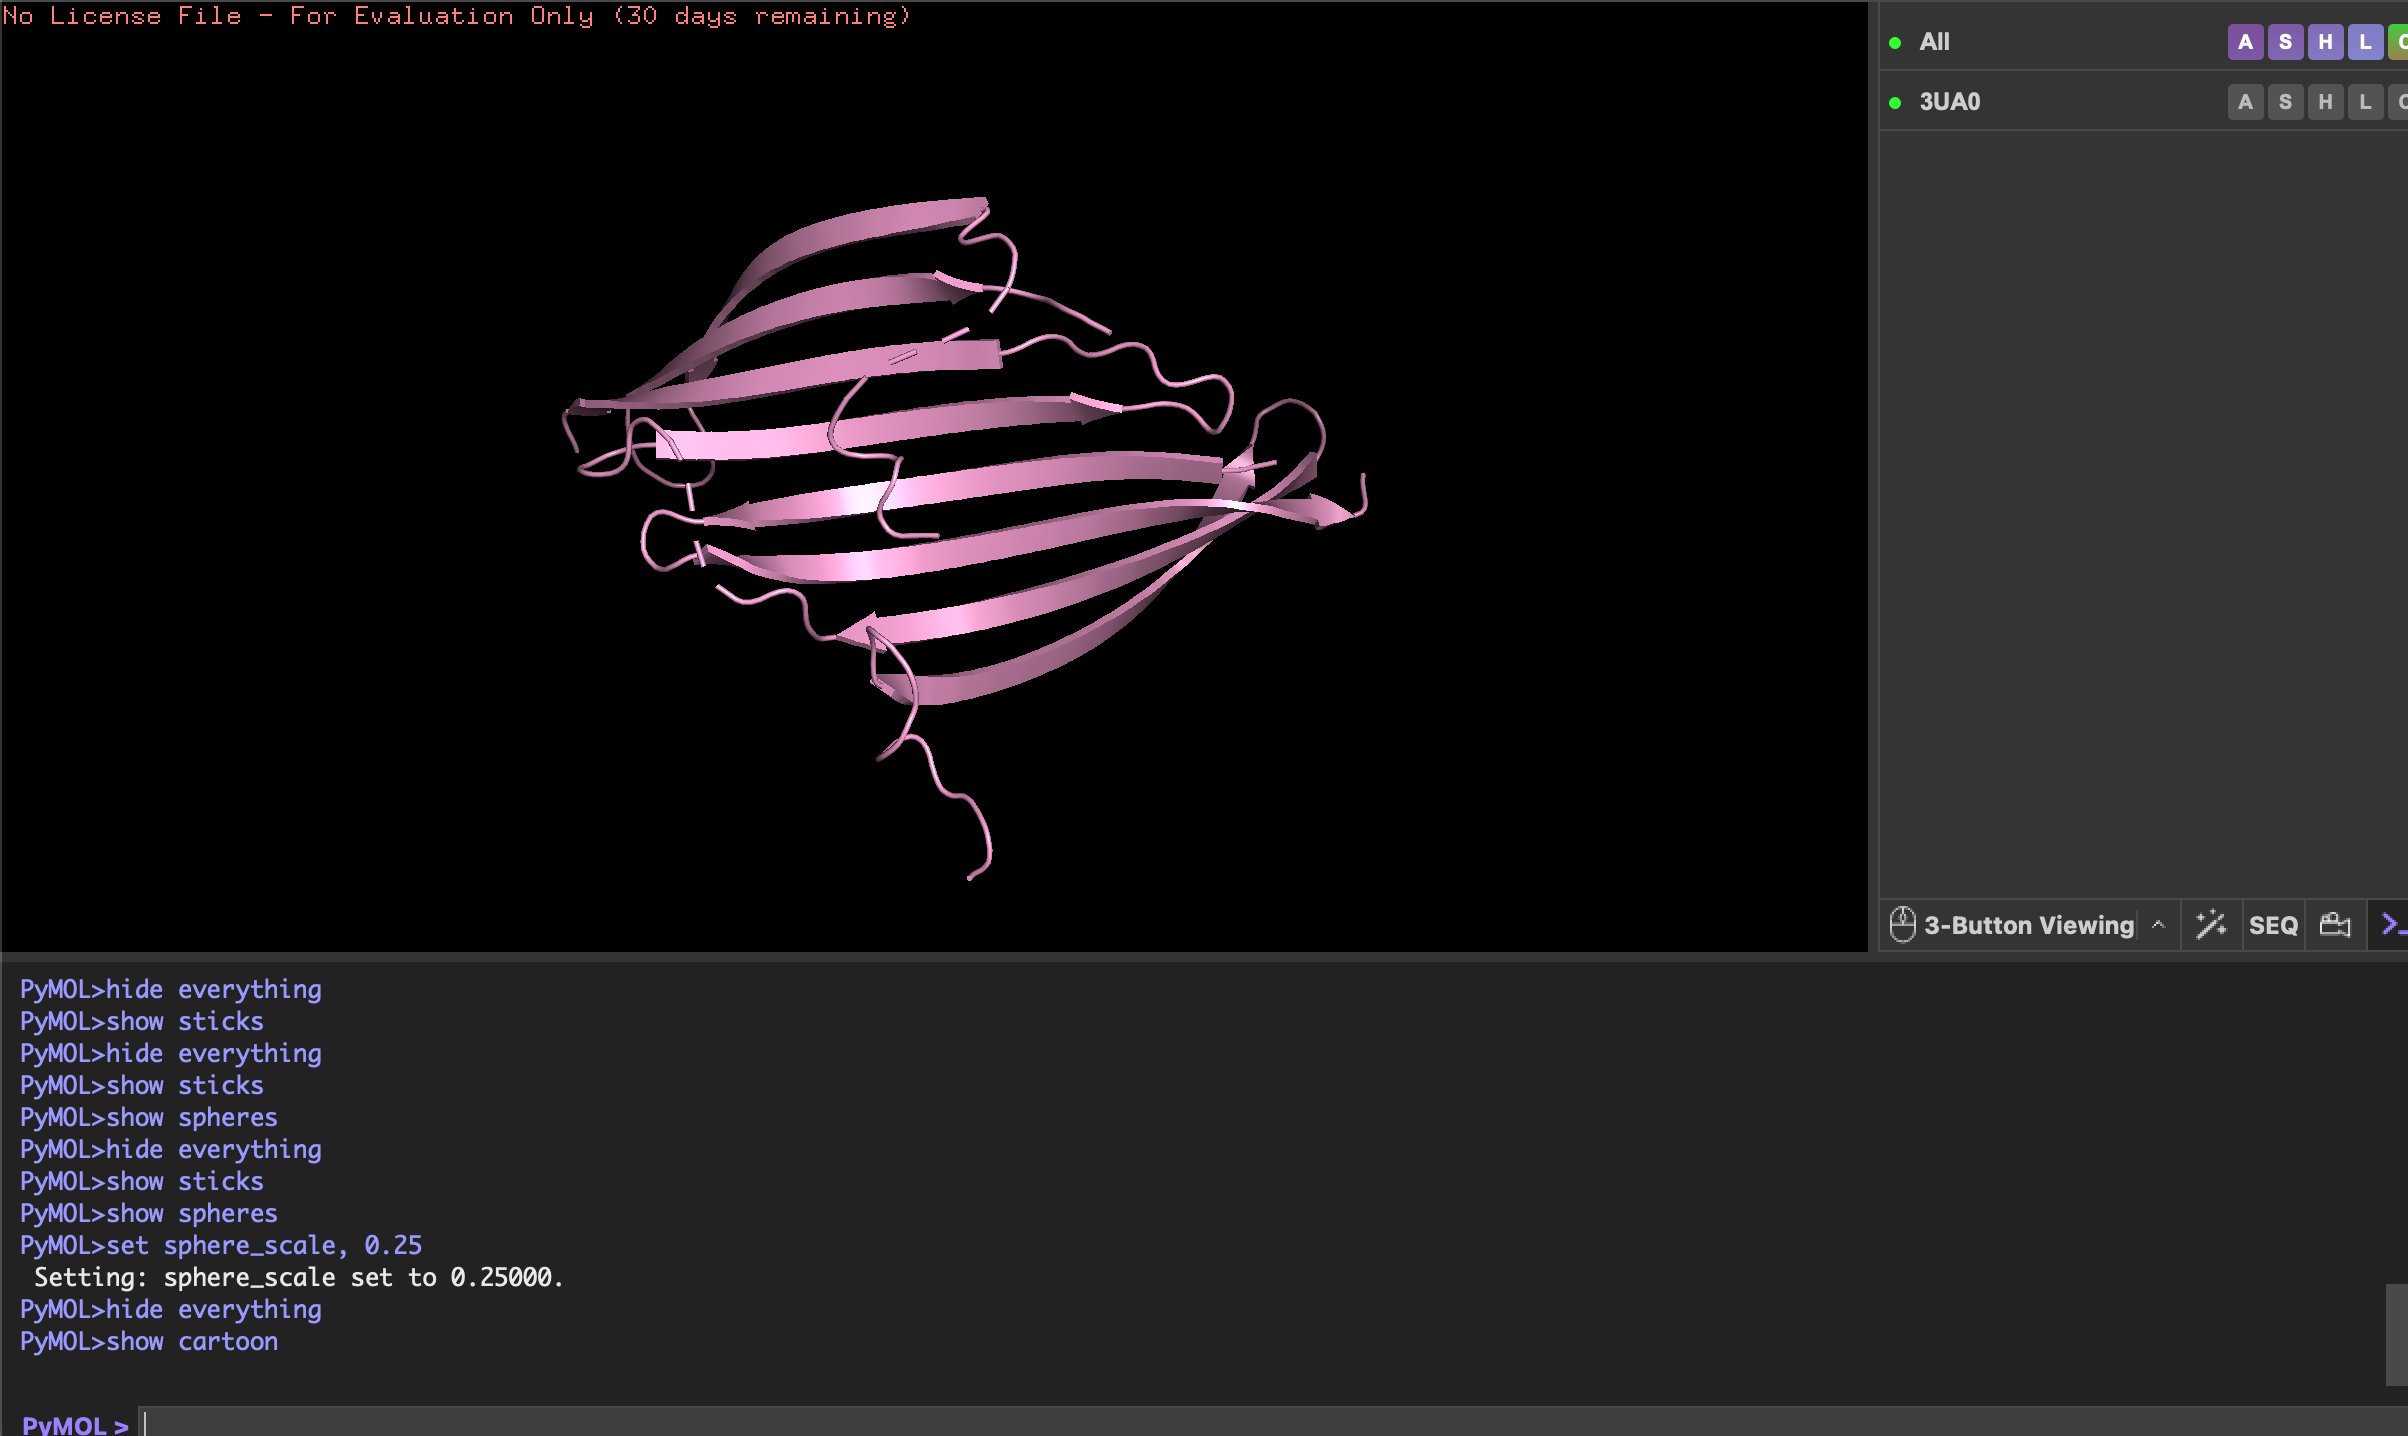
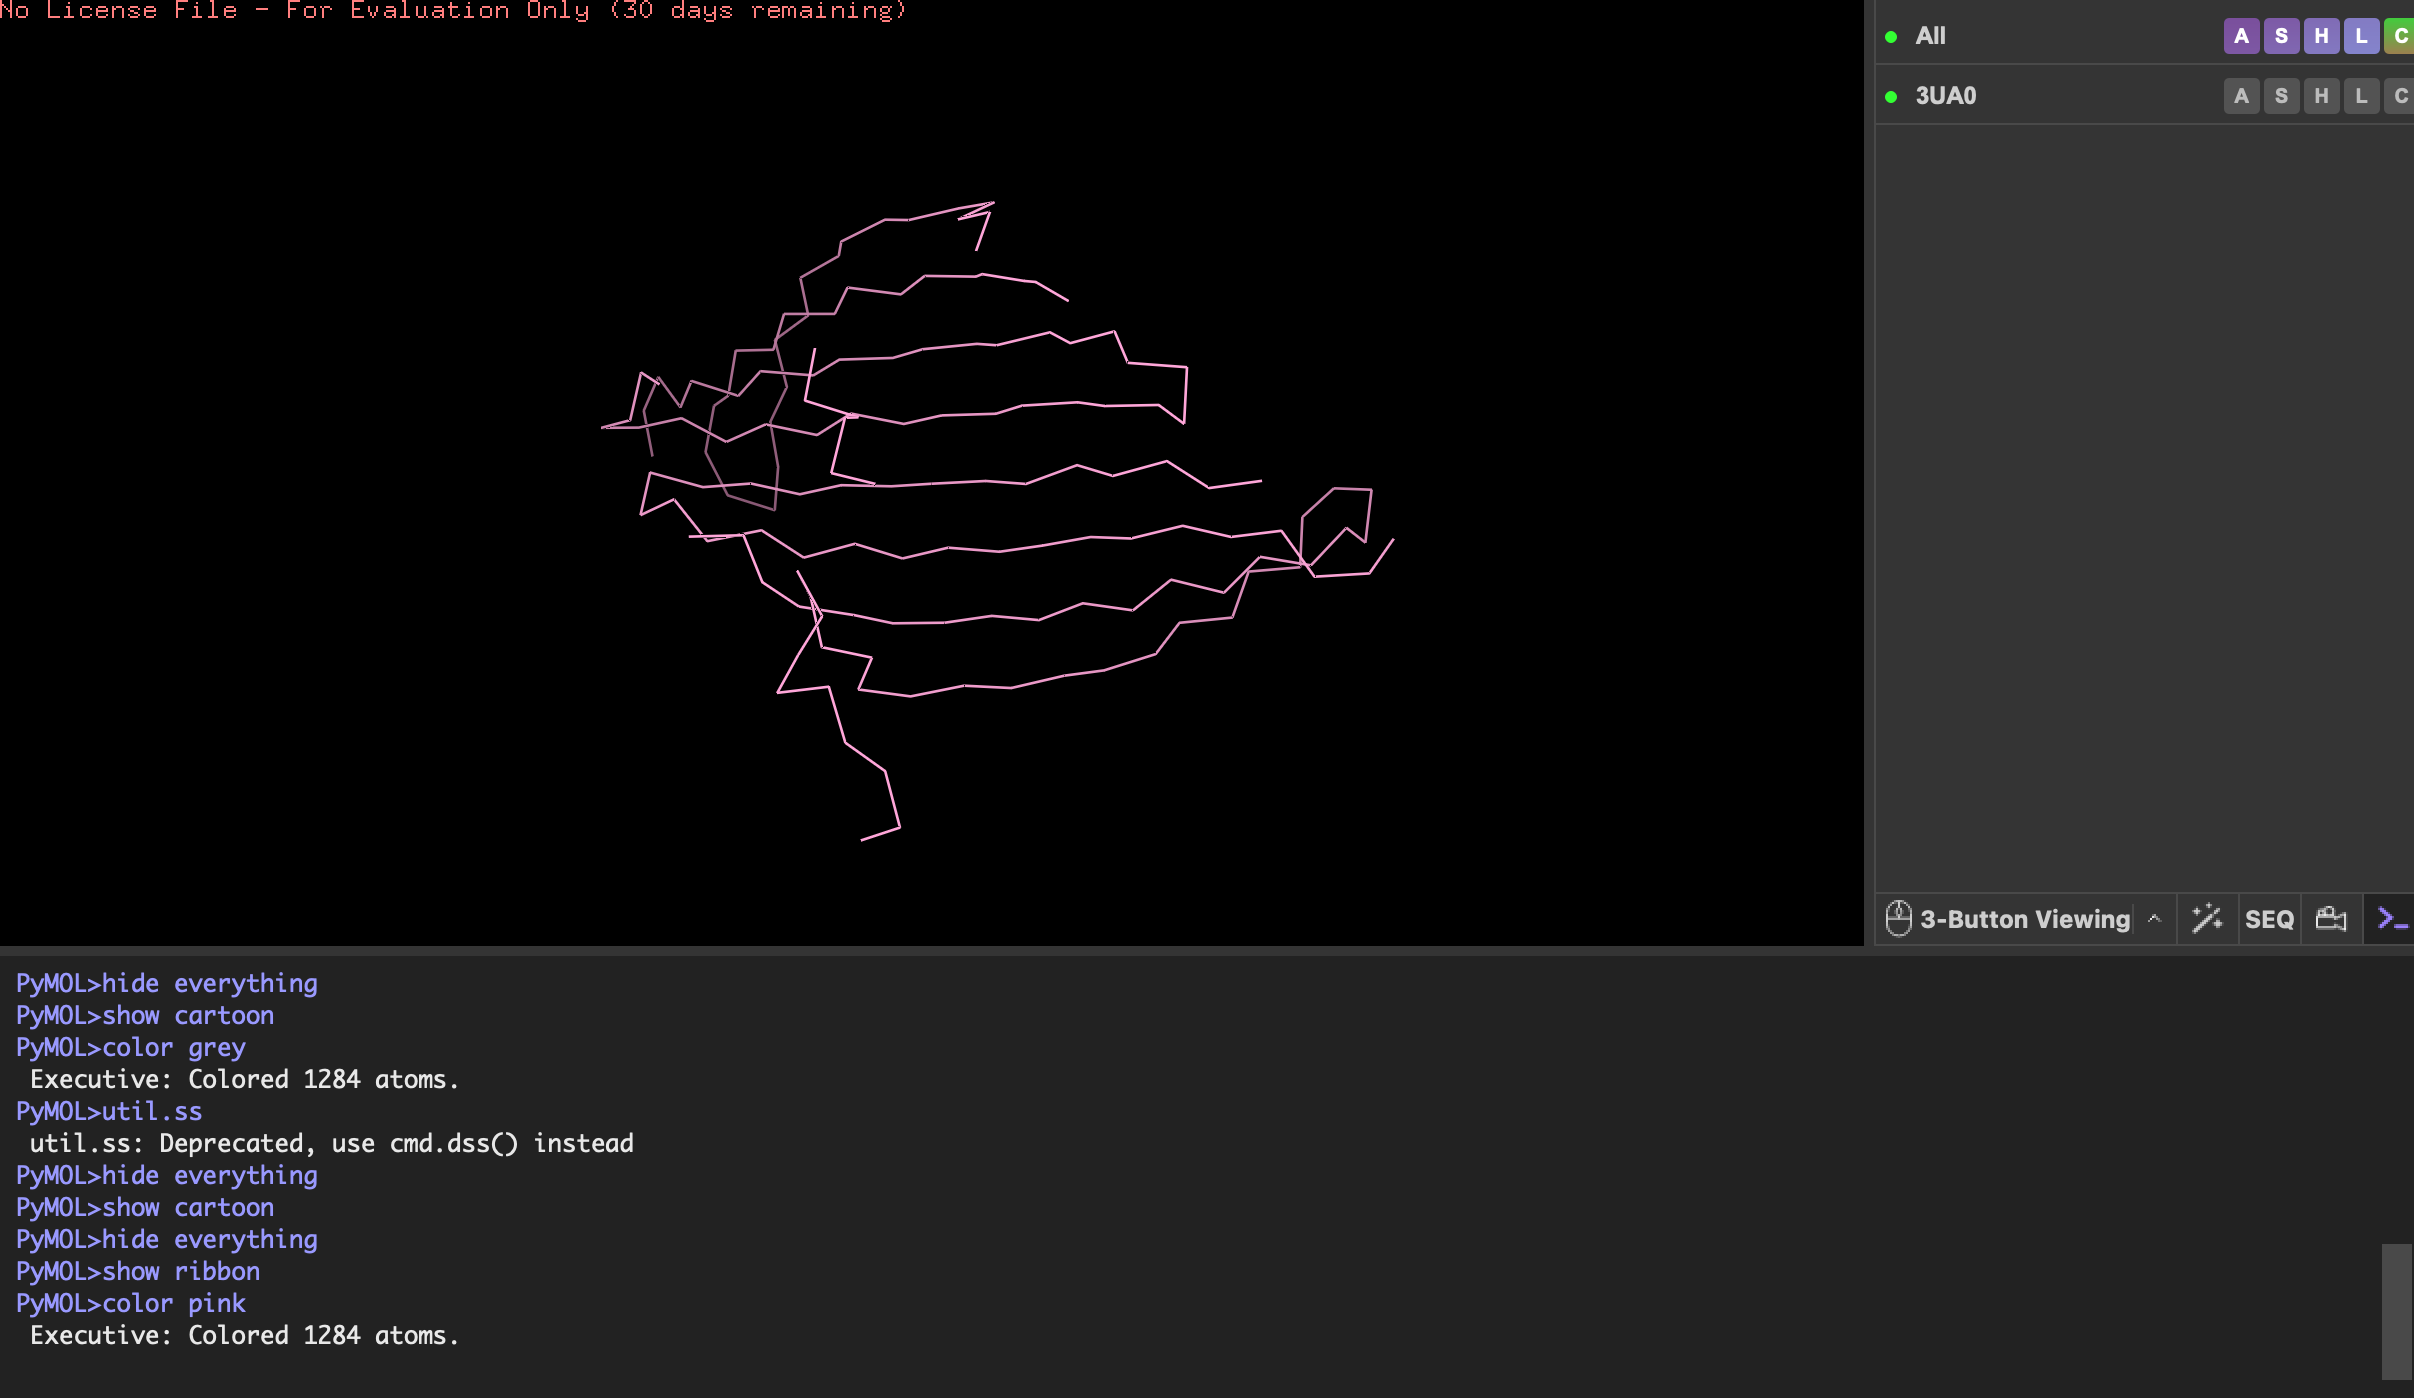
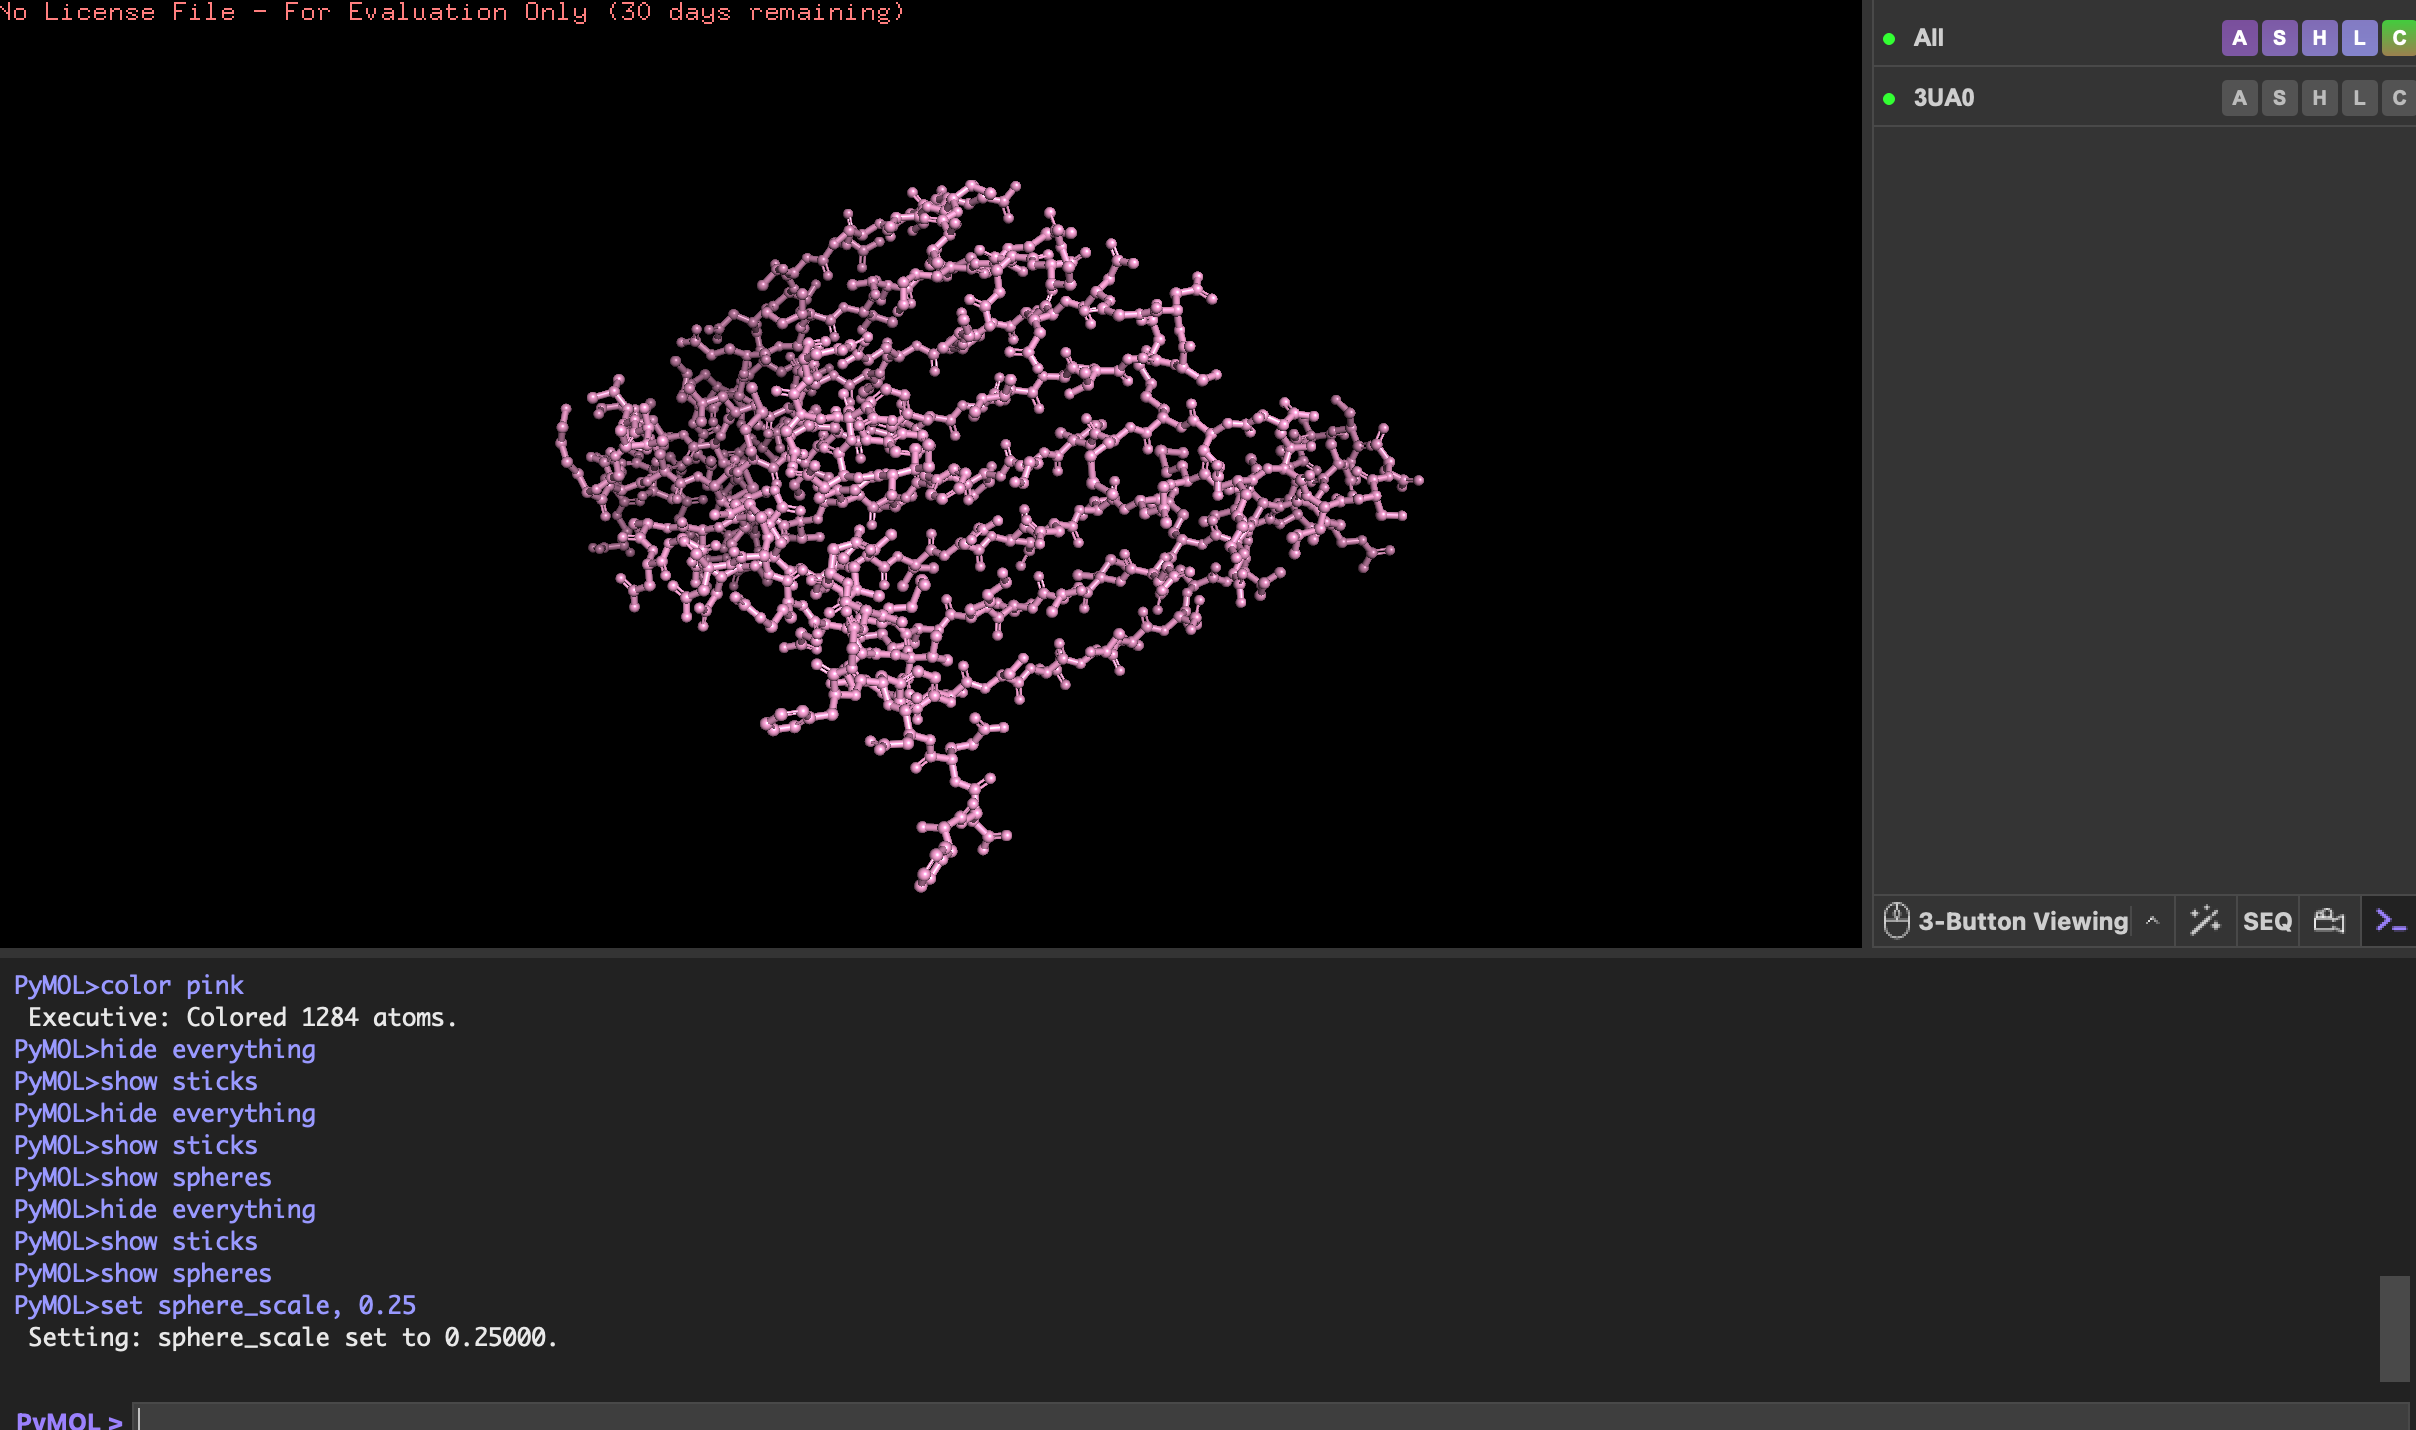
Color the protein by secondary structure. Does it have more helices or sheets?
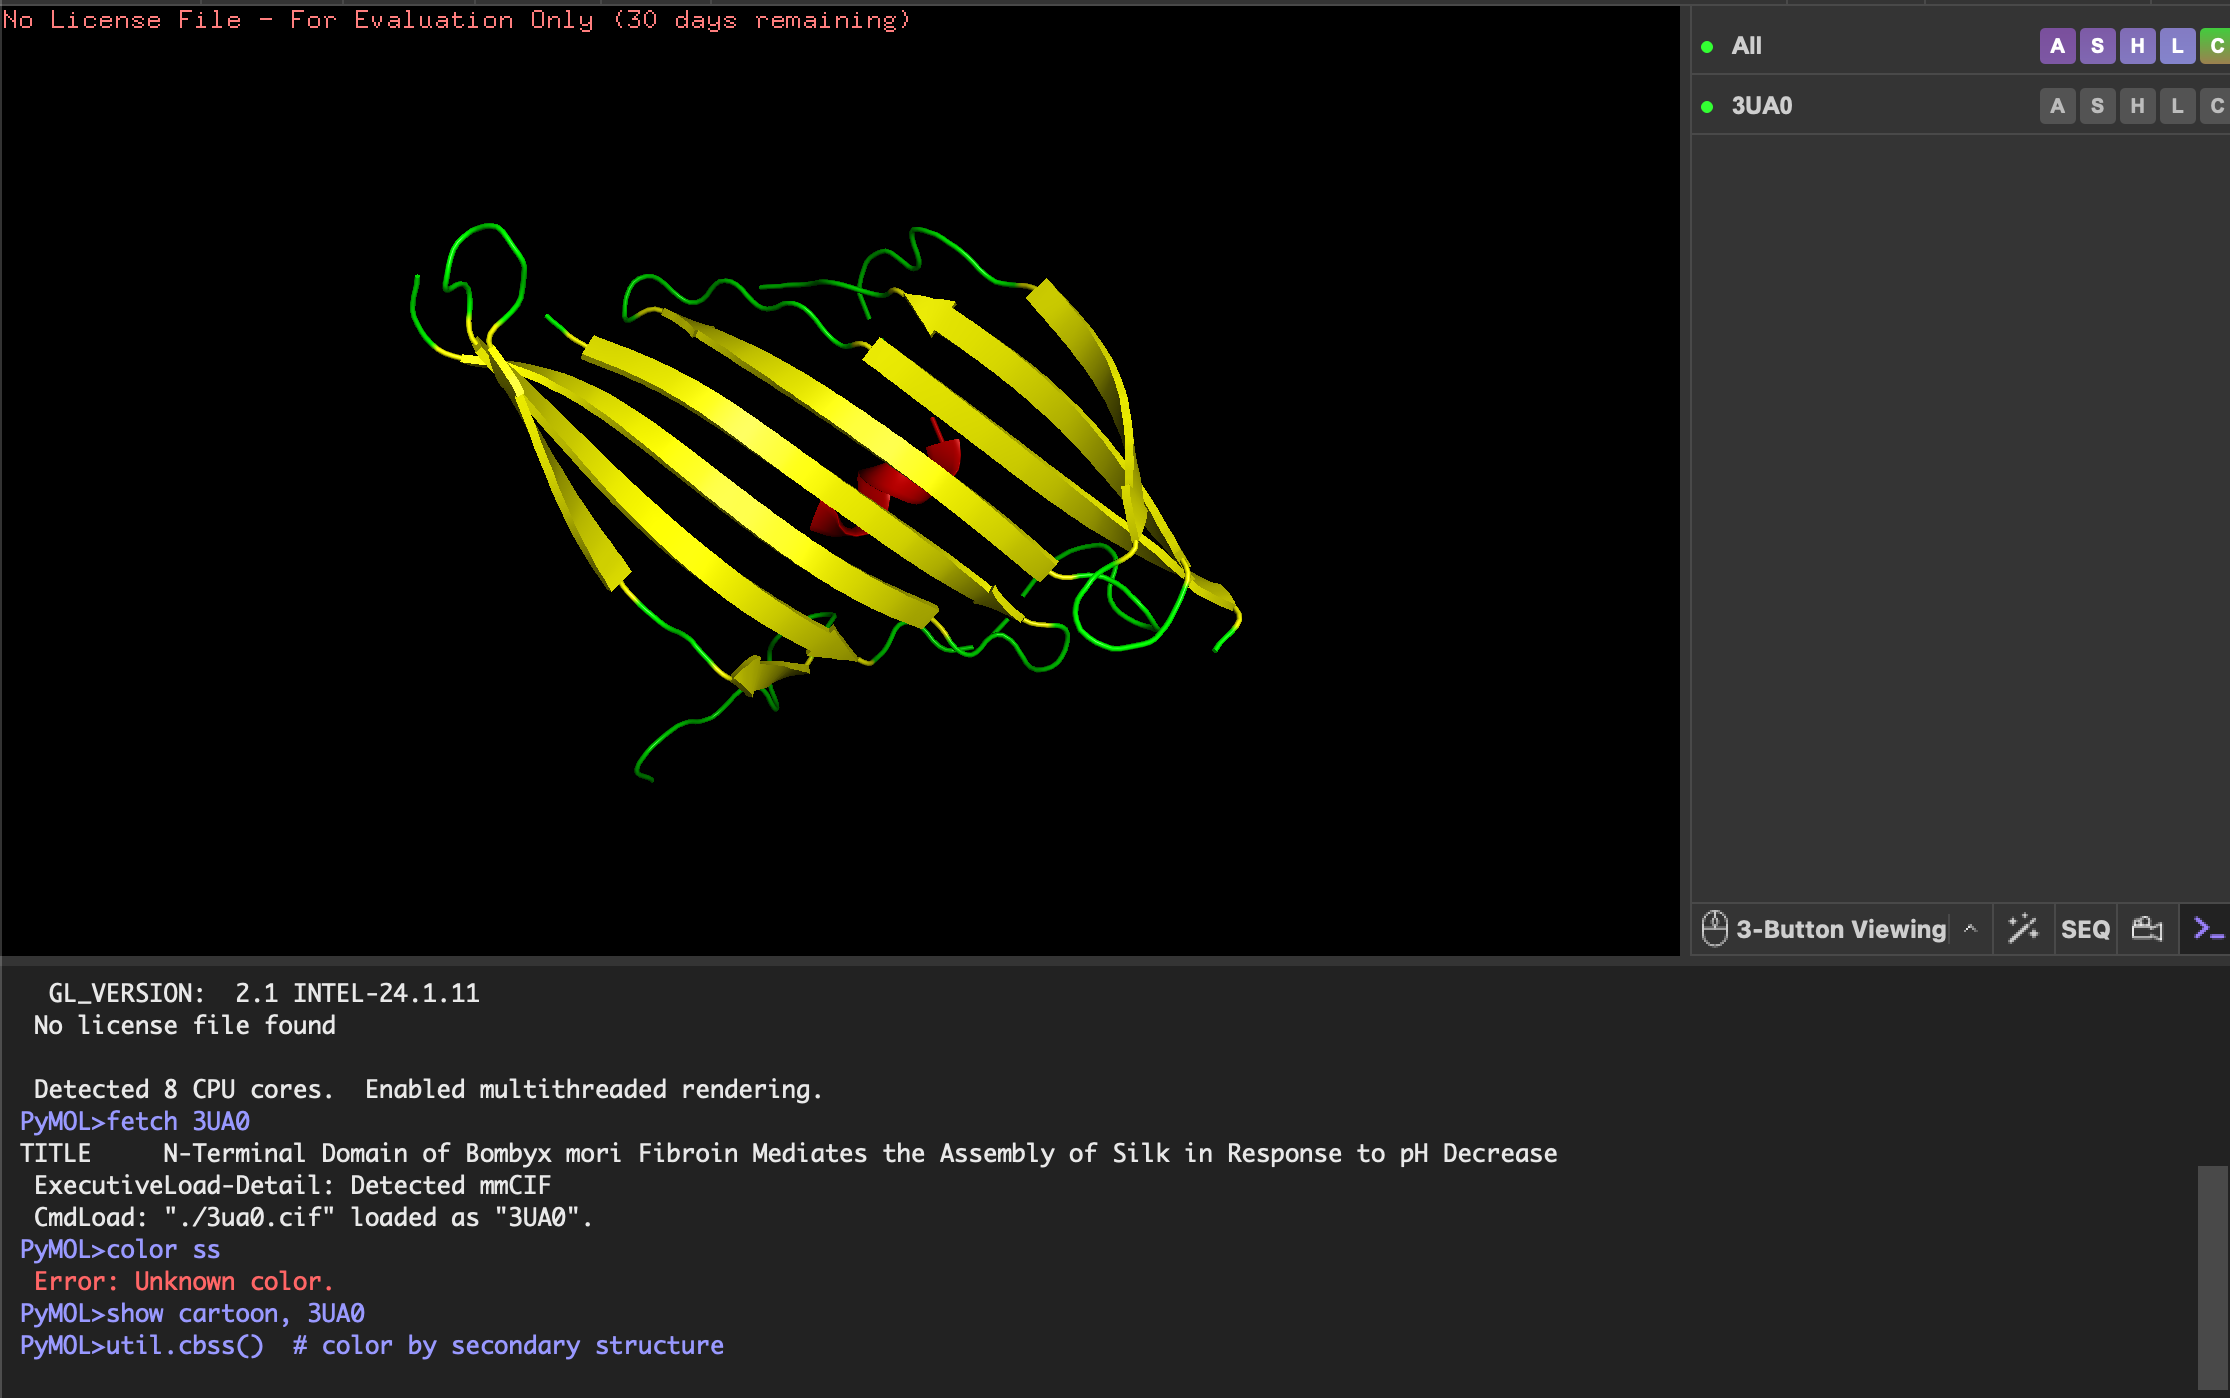
- Helices: red
- Beta-sheets: yellow
- Loops/coils: green
As expected the Beta-sheets are the most abundant!
Color the protein by residue type. What can you tell about the distribution of hydrophobic vs hydrophilic residues?
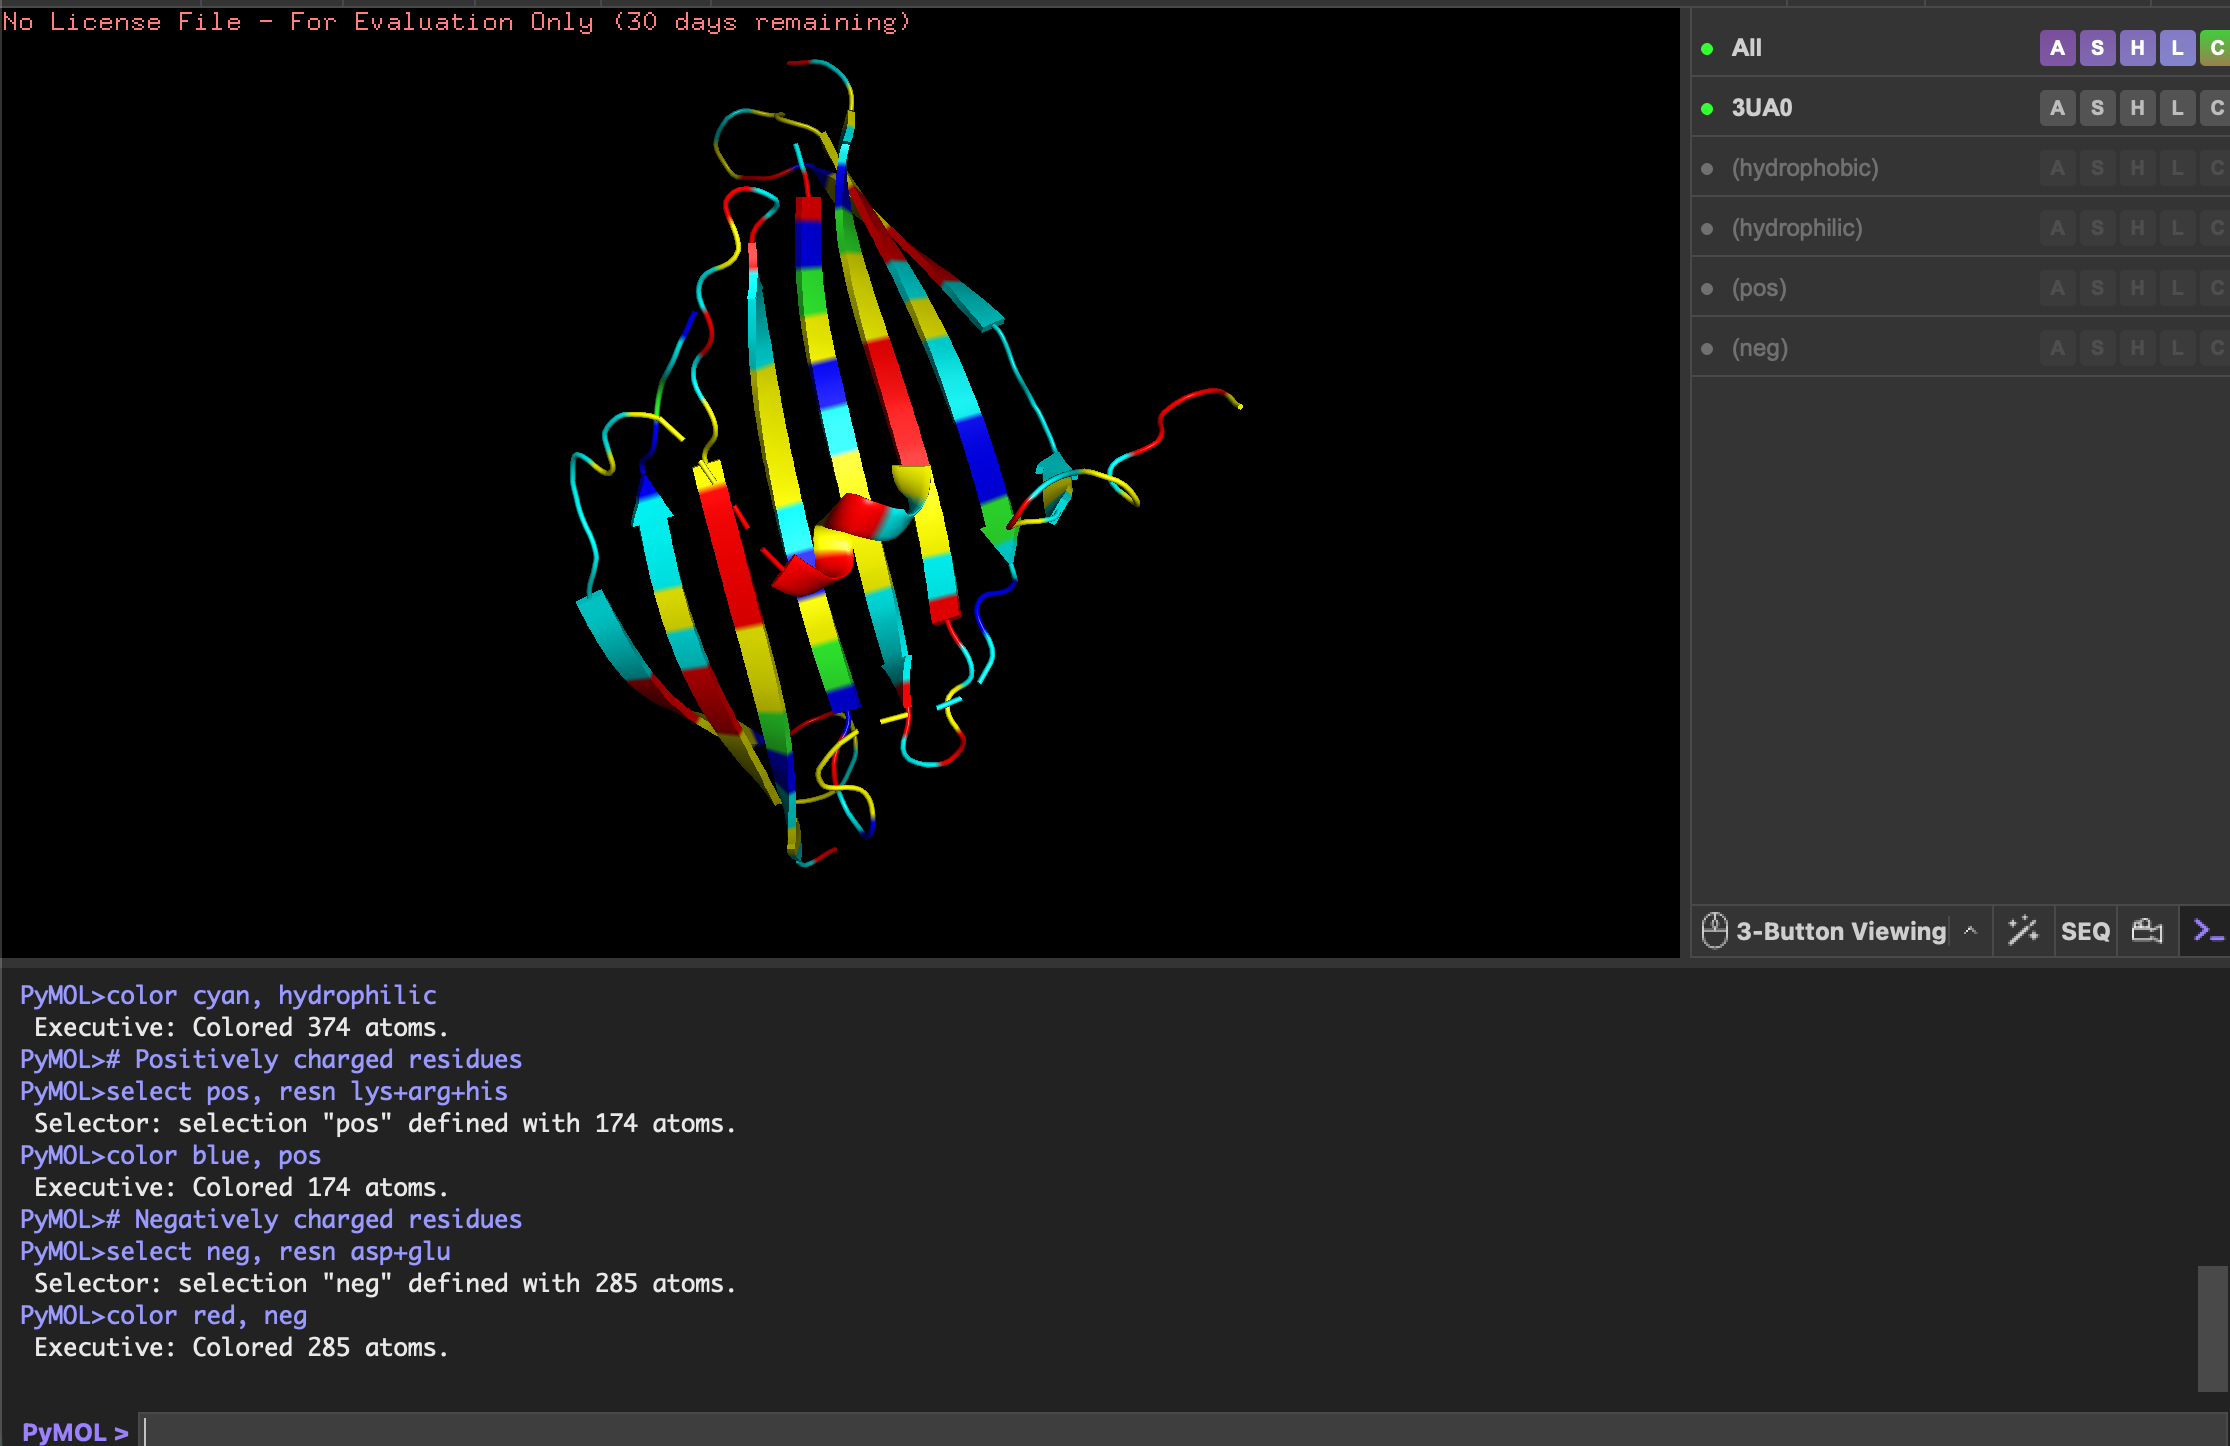
- Yellow: hydrophobic
- Cyan: hydrophilic
- Blue: positively charged
- Red: negatively charged
Although quite evenly distributed, the hydrophilic residues (cyan) are more exposed on the ends of sheets and loops, interacting with water to keep protein soluble. The hydrophobic residues (yellow) are more buried in the center of the sheets and helix, stabilising the fold.
Visualise the surface of the protein. Does it have any “holes” (aka binding pockets)?
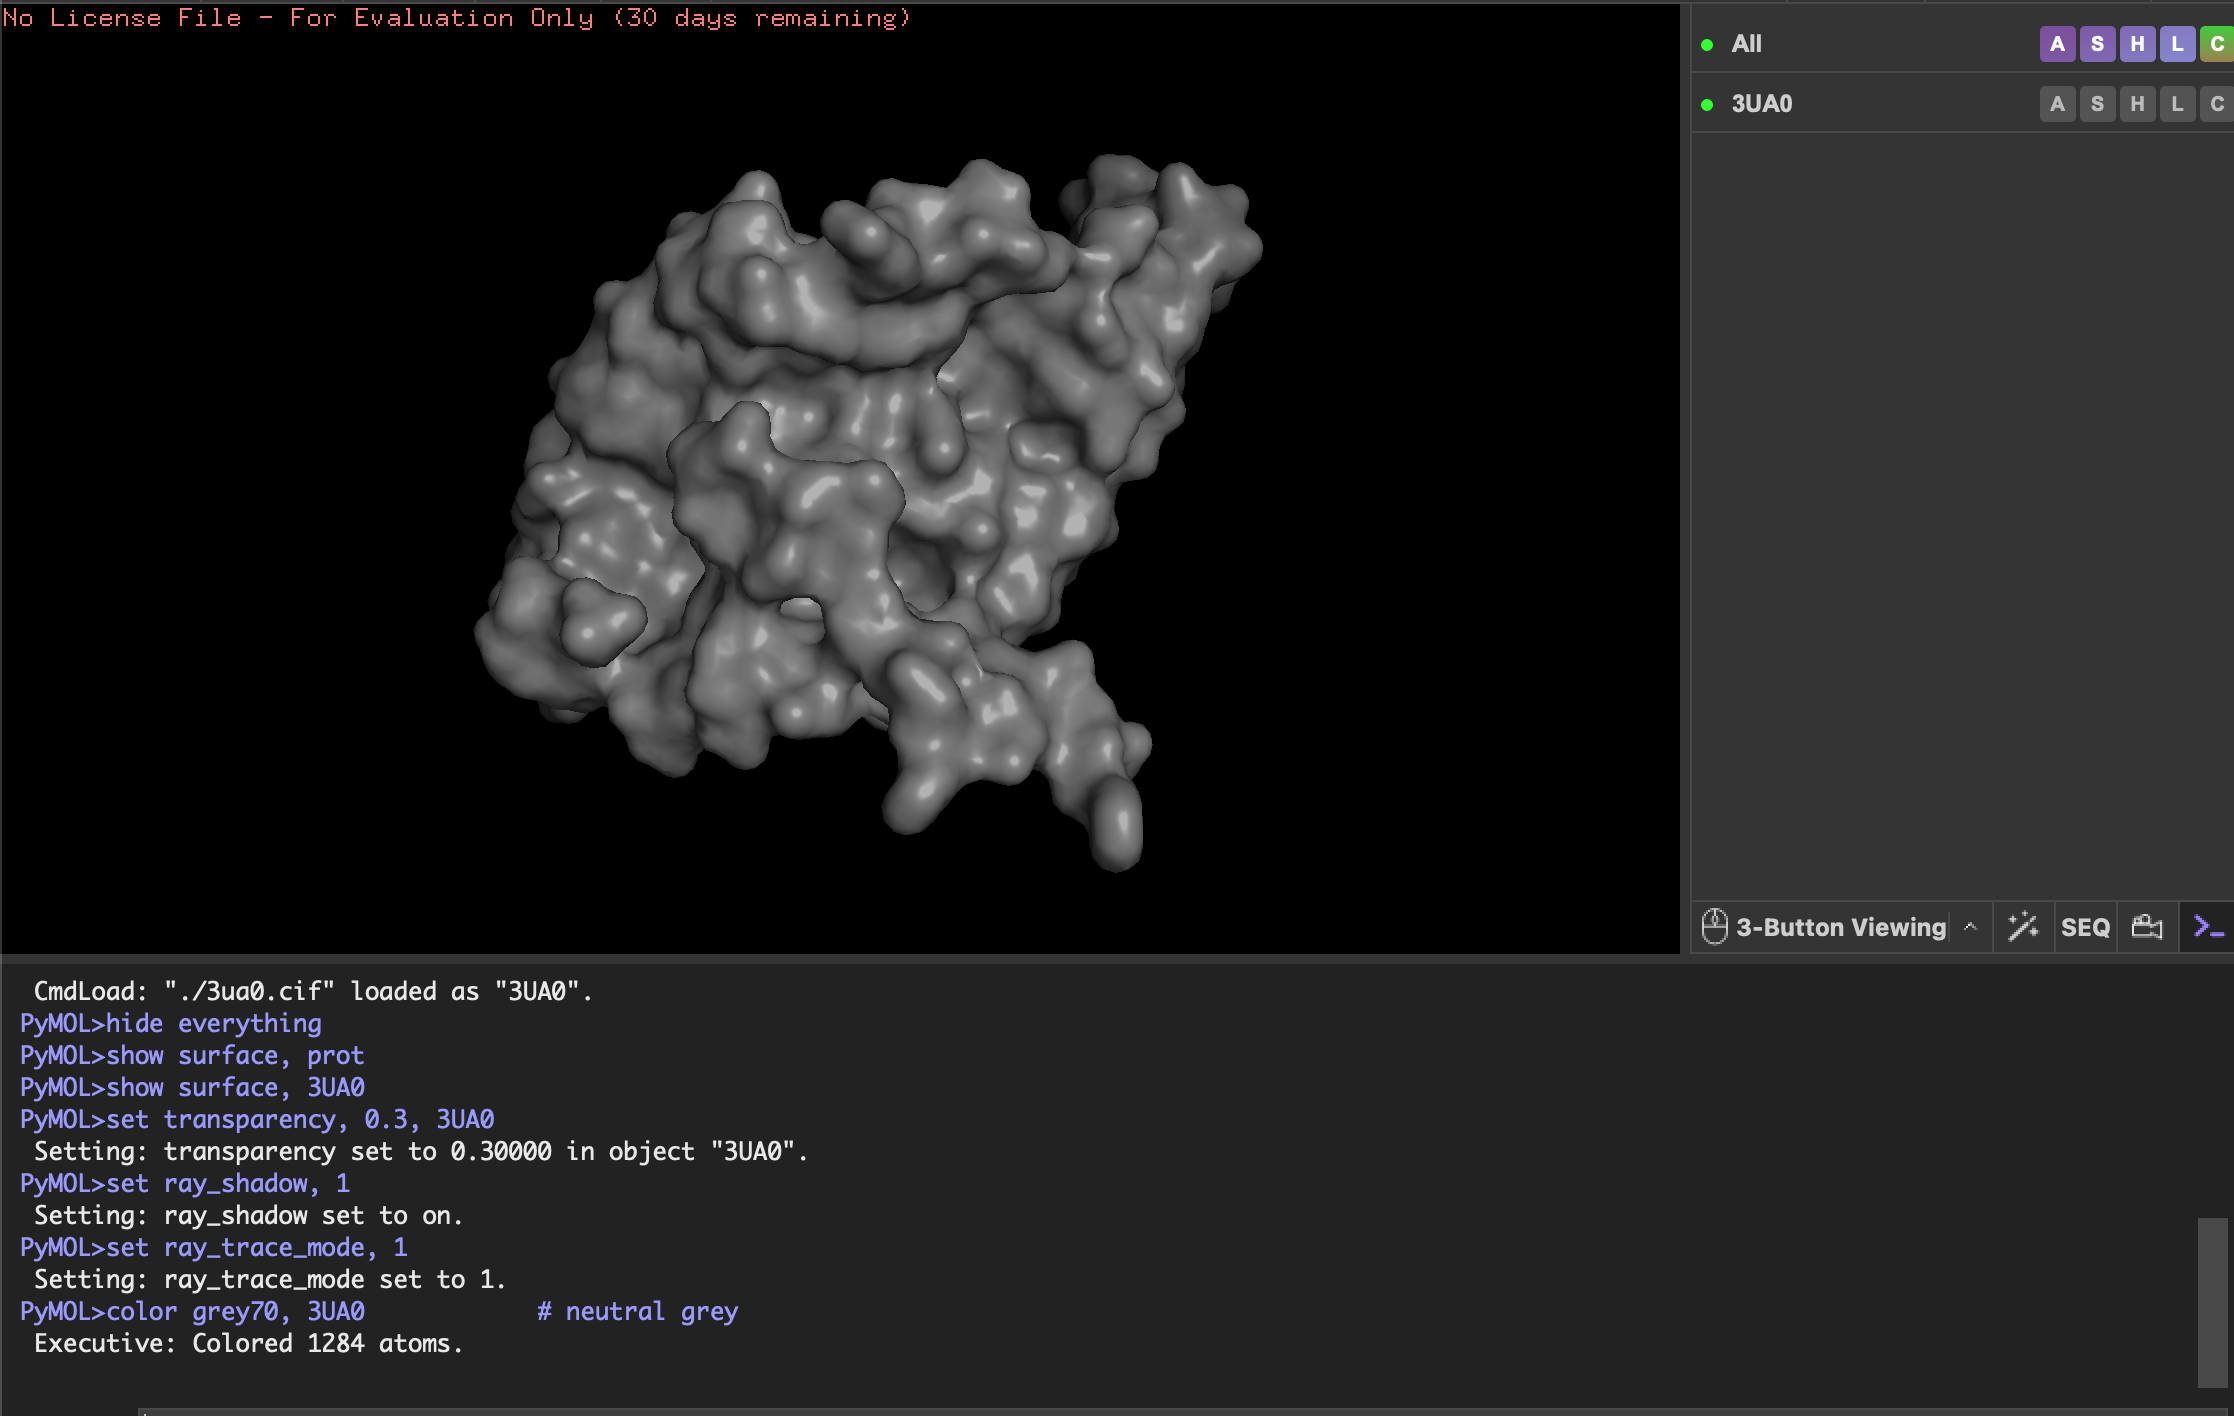
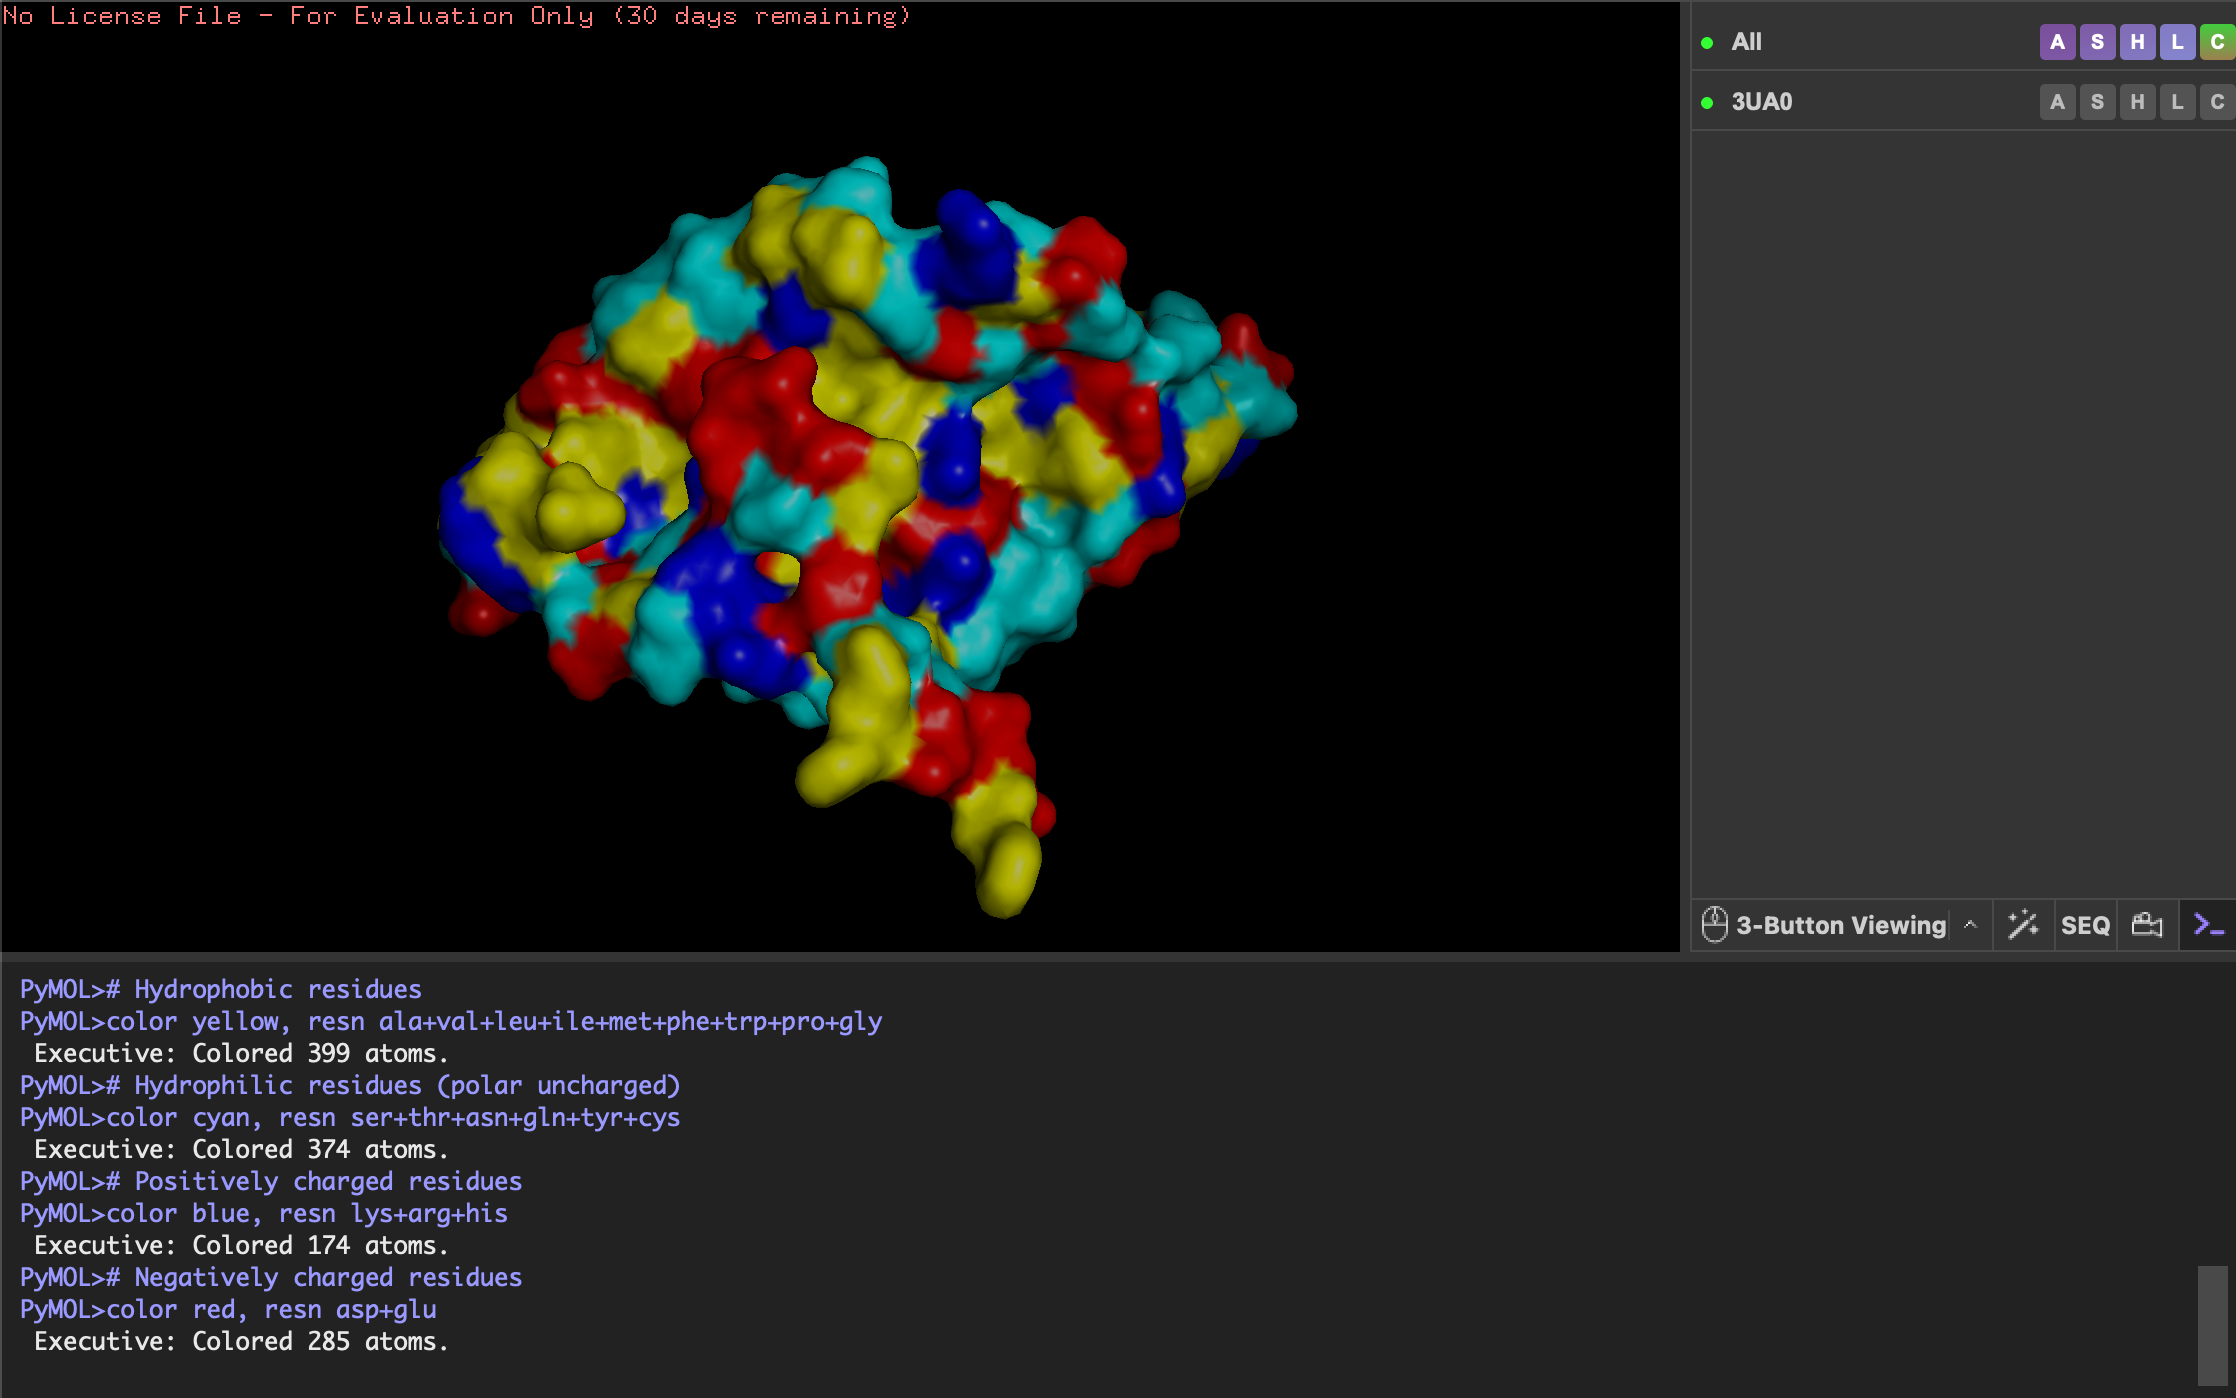
The protein surface does not show any obvious holes, but there are several deep grooves and clefts. These grooves are likely substrate-binding or interaction sites where ligands or substrates can fit. These grooves (binding pockets) are lined with hydrophobic (yellow) and positively charged (blue) residues so are potentially involved in interacting with hydrophobic and negatively charged molecules. This would make sense for Fibroin known for its hydrophobic core lending to its stability.
PART C. Using ML-Based Protein Design Tools
C1. Protein Language Modeling
Choose your favorite protein from the PDB.
Lysozyme: An enzyme that breaks down bacterial cell walls.
1LYZ, pbd 00001lyz
SEQUENCE:
KVFGRCELAAAMKRHGLDNYRGYSLGNWVCAAKFESNFNTQATNRNTDGSTDYGILQINSRWWCNDGRTPGSRNLCNIPCSALLSSDITASVNCAKKIVSDGNGMNAWVAWRNRCKGTDVQAWIRGCRL
Deep Mutational Scans
Use ESM2 to generate an unsupervised deep mutational scan of your protein based on language model likelihoods.
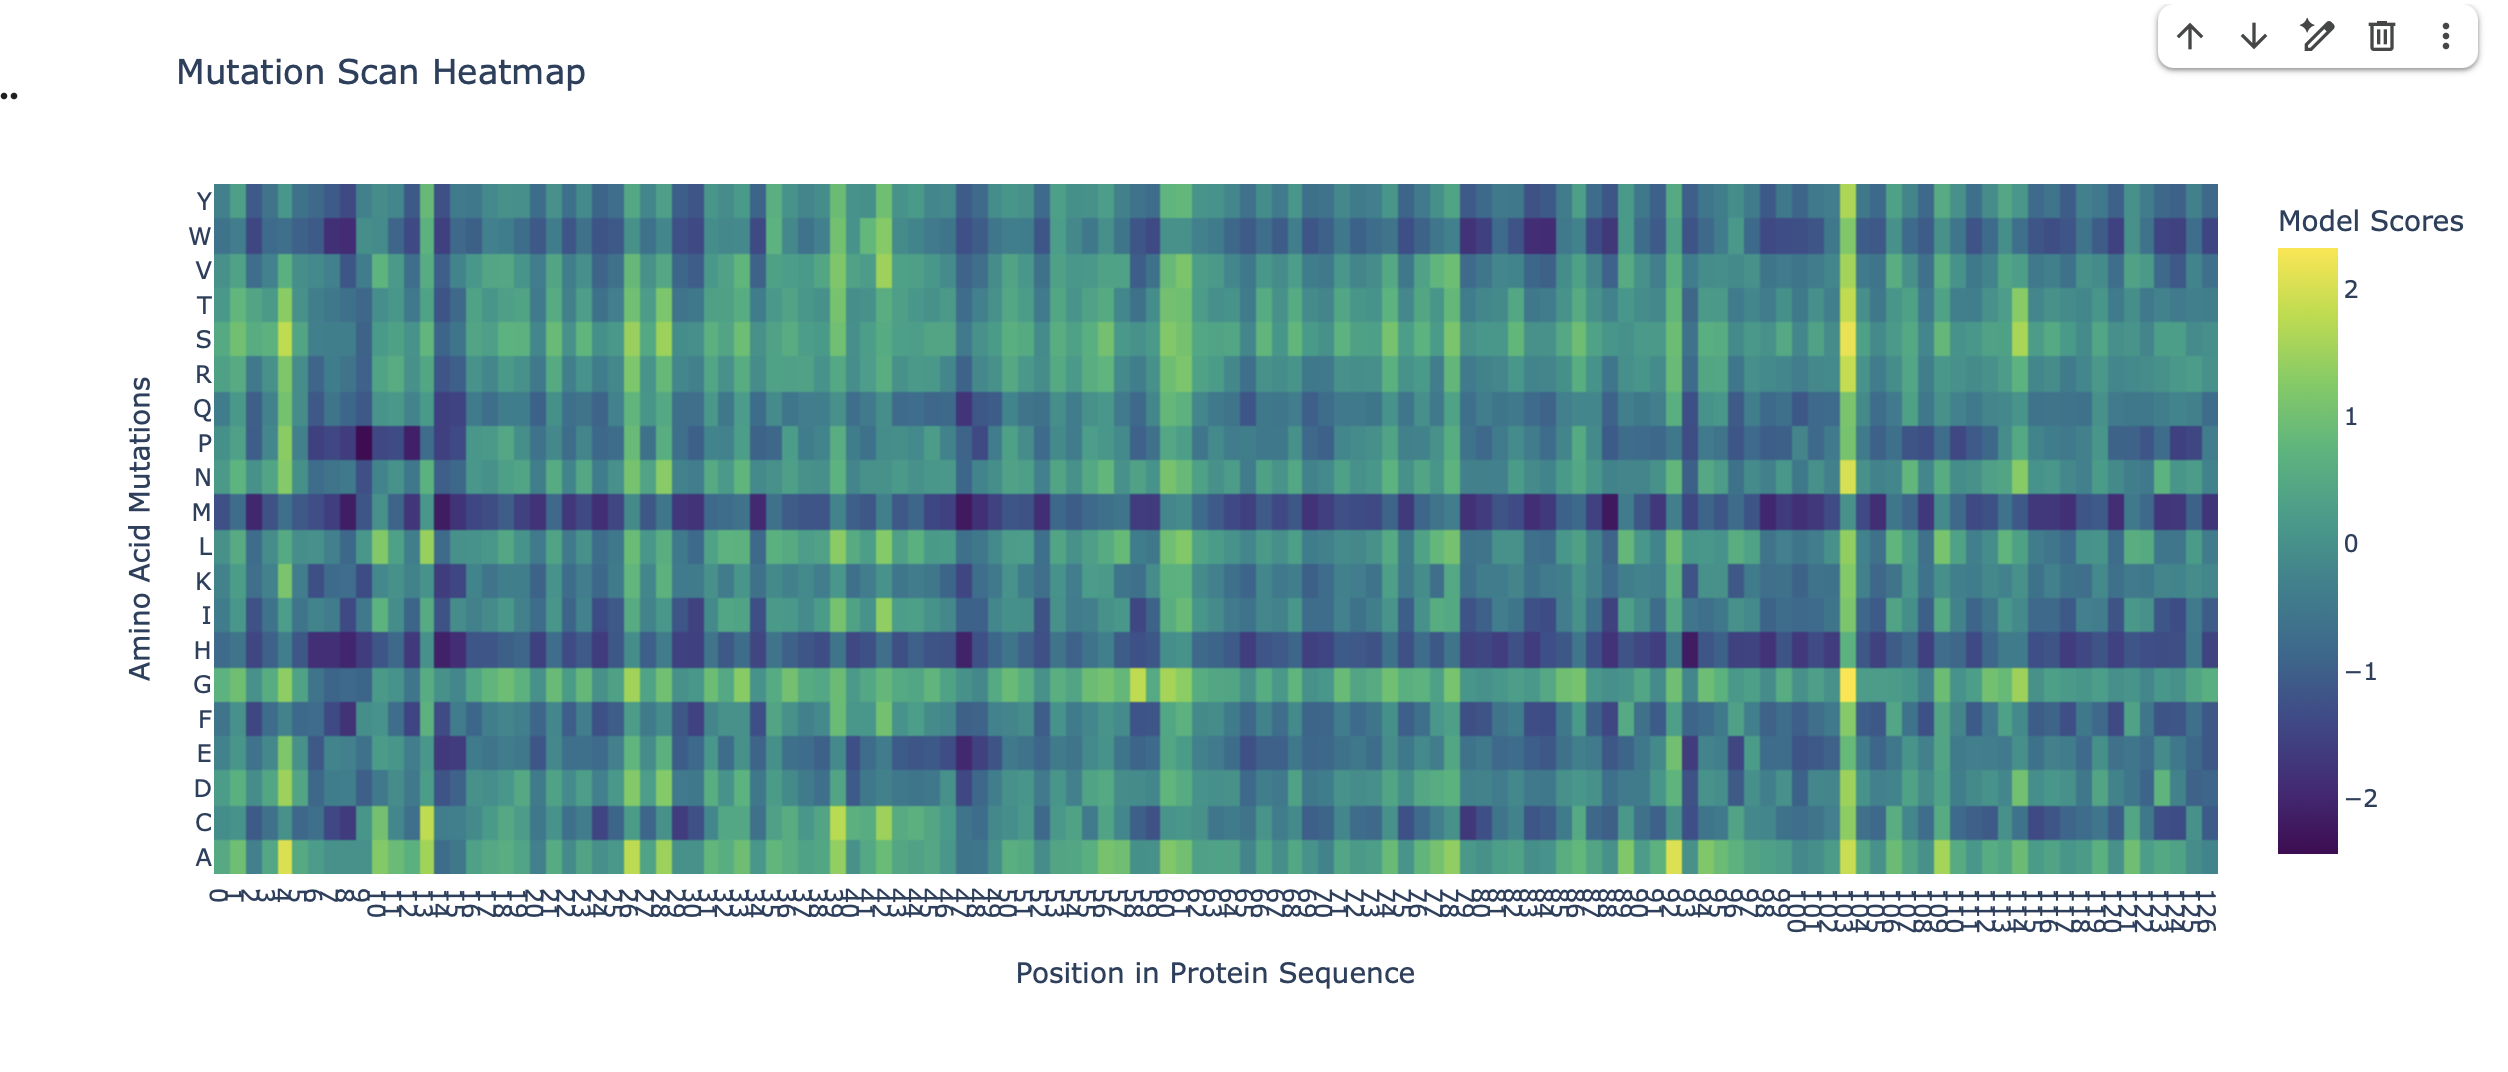
Can you explain any particular pattern? (choose a residue and a mutation that stands out)
The heatmap as a visual guide to how ’tolerant’ the protein is to changes in its amino acids at different positions. Each colored square tells us about the mutational tolerance at that specific spot for a specific amino acid change.
Bright Colors: Indicate high mutational tolerance. This means the protein can easily accept (or even prefer) that particular amino acid change without negatively affecting its function or stability.
Dark Colors (like deep blue/purple): Indicate low mutational tolerance. This means the protein is very sensitive to that amino acid change, and it’s likely to cause problems, making the protein less functional or unstable.
Stand outs:
Consistent Low Mutational Tolerance for Methionine (dark blue horizontal line on M row). This signifies that, for many different residues in the protein, mutating to a Methionine is predicted to be highly unfavorable(low LLR). This suggests a generally low mutational tolerance for introducing Methionine into the protein structure.
Consistent High Mutational Tolerance at residue position 104 (which corresponds to x axis 102 on the heatmap). The wild type amino acid at this position in the sequence is Glycine (G). The entire vertical column 102 is yellow and green. This is a strong indicator of high mutational tolerance at residue position 104, the Glycine can accommodate a wide variety of amino acid mutations as they are predicted by the model to be either favorable (high LLRs) or at least neutral (LLR around 0).
Latent Space Analysis
Use the provided sequence dataset to embed proteins in reduced dimensionality.
Using the Collab to embed proteins in reduced dimensionality, I first downloaded a dataset of protein sequences in FASTA format. Then, I processed these sequences through the ESM2 language model to generate high-dimensional embeddings for each protein. Finally, I used t-SNE, a dimensionality reduction technique to transform these high-dimensional embeddings into a 3D representation, making them suitable for visualszation and analysis in a lower-dimensional space.
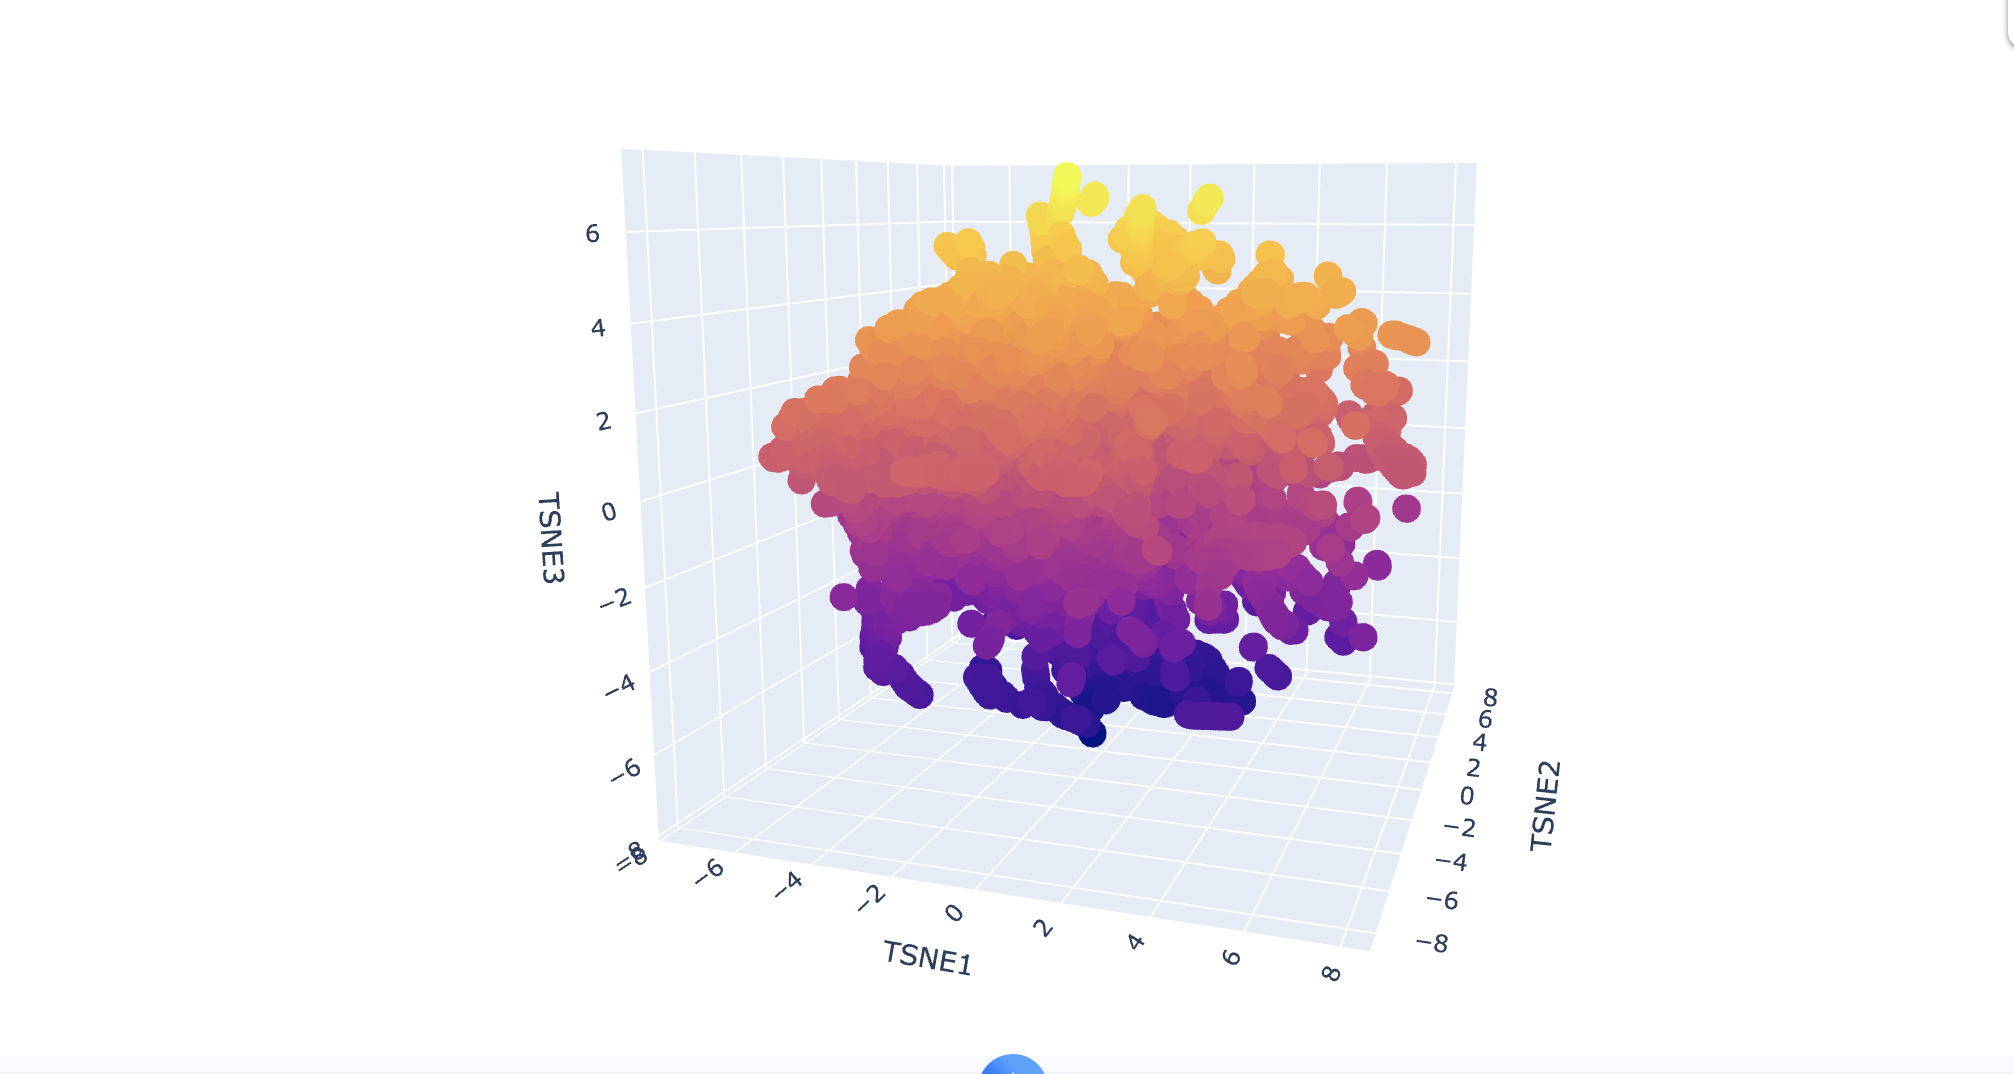
Analyze the different formed neighborhoods: do they approximate similar proteins?
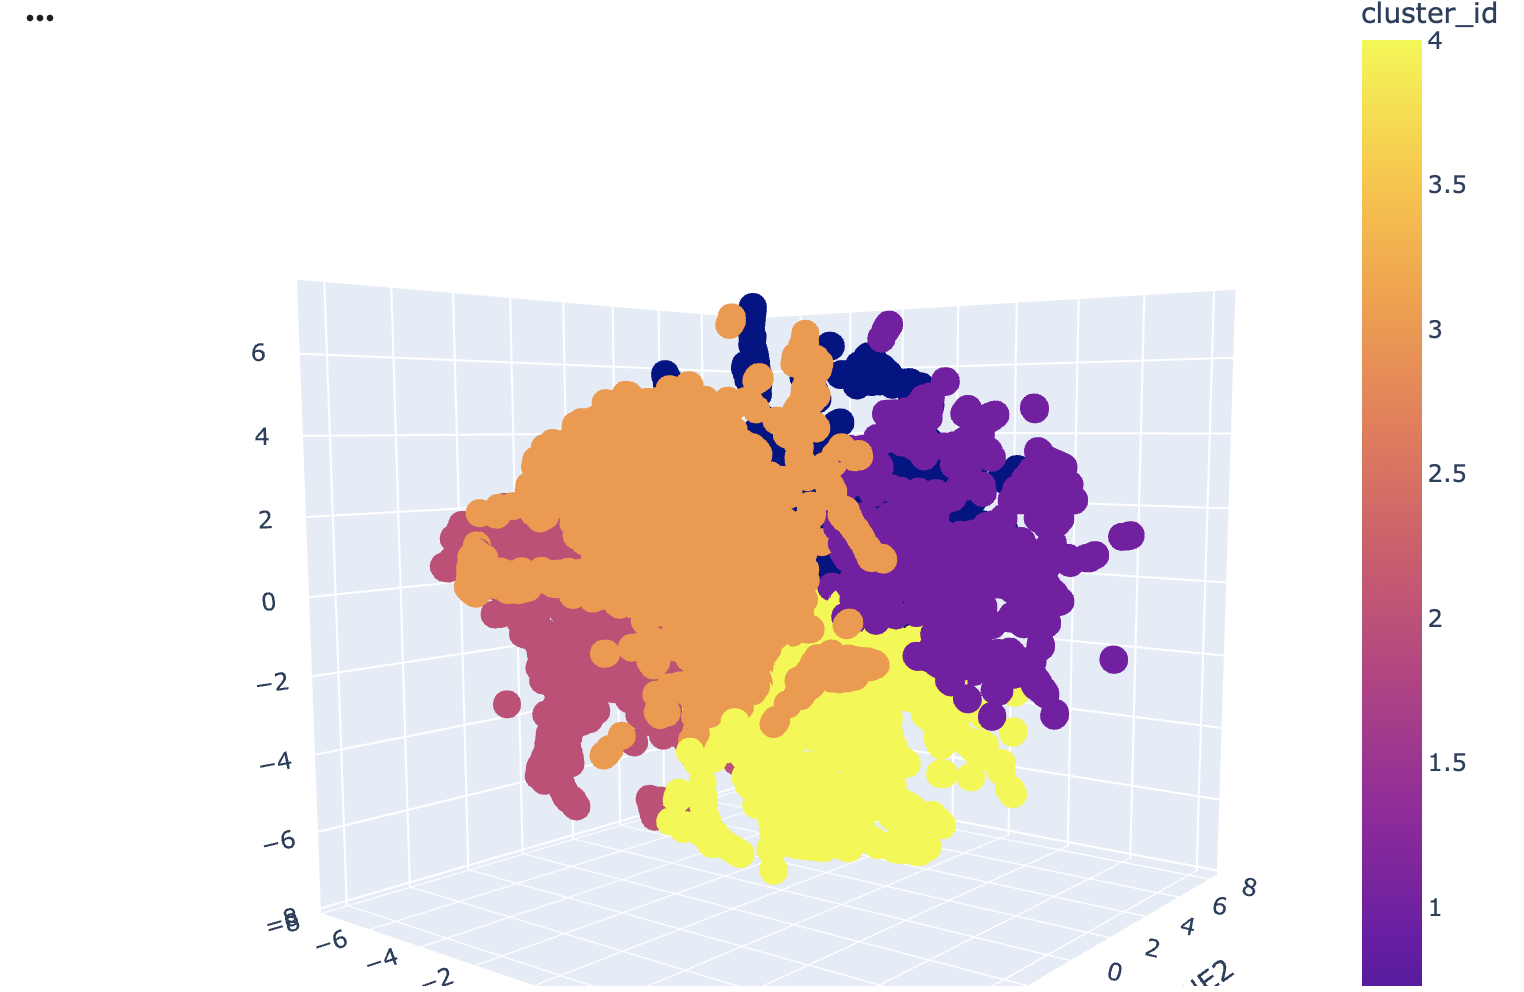
Yes, the latent space neighbourhoods as represented by the t-SNE clusters do approximate similar proteins. I used the gemini add on in Collab to do an analysis of keyword frequencies in the protein annotations within each neighbouring cluster reveals that proteins are grouped primarily by their organismal origin and shared structural or functional characteristics. You can see the clusters used in the image above.
For instance Cluster 2 (pink) is predominantly composed of human proteins, as indicated by the high frequency of keywords like human, homo, and sapiens. Additionally, the term domain appears with significant frequency within this cluster. A protein domain refers to a distinct functional within a larger protein, this suggests that the proteins in Cluster 2 have complex, multi-domain architectures.

Place your protein in the resulting map and explain its position and similarity to its neighbours.
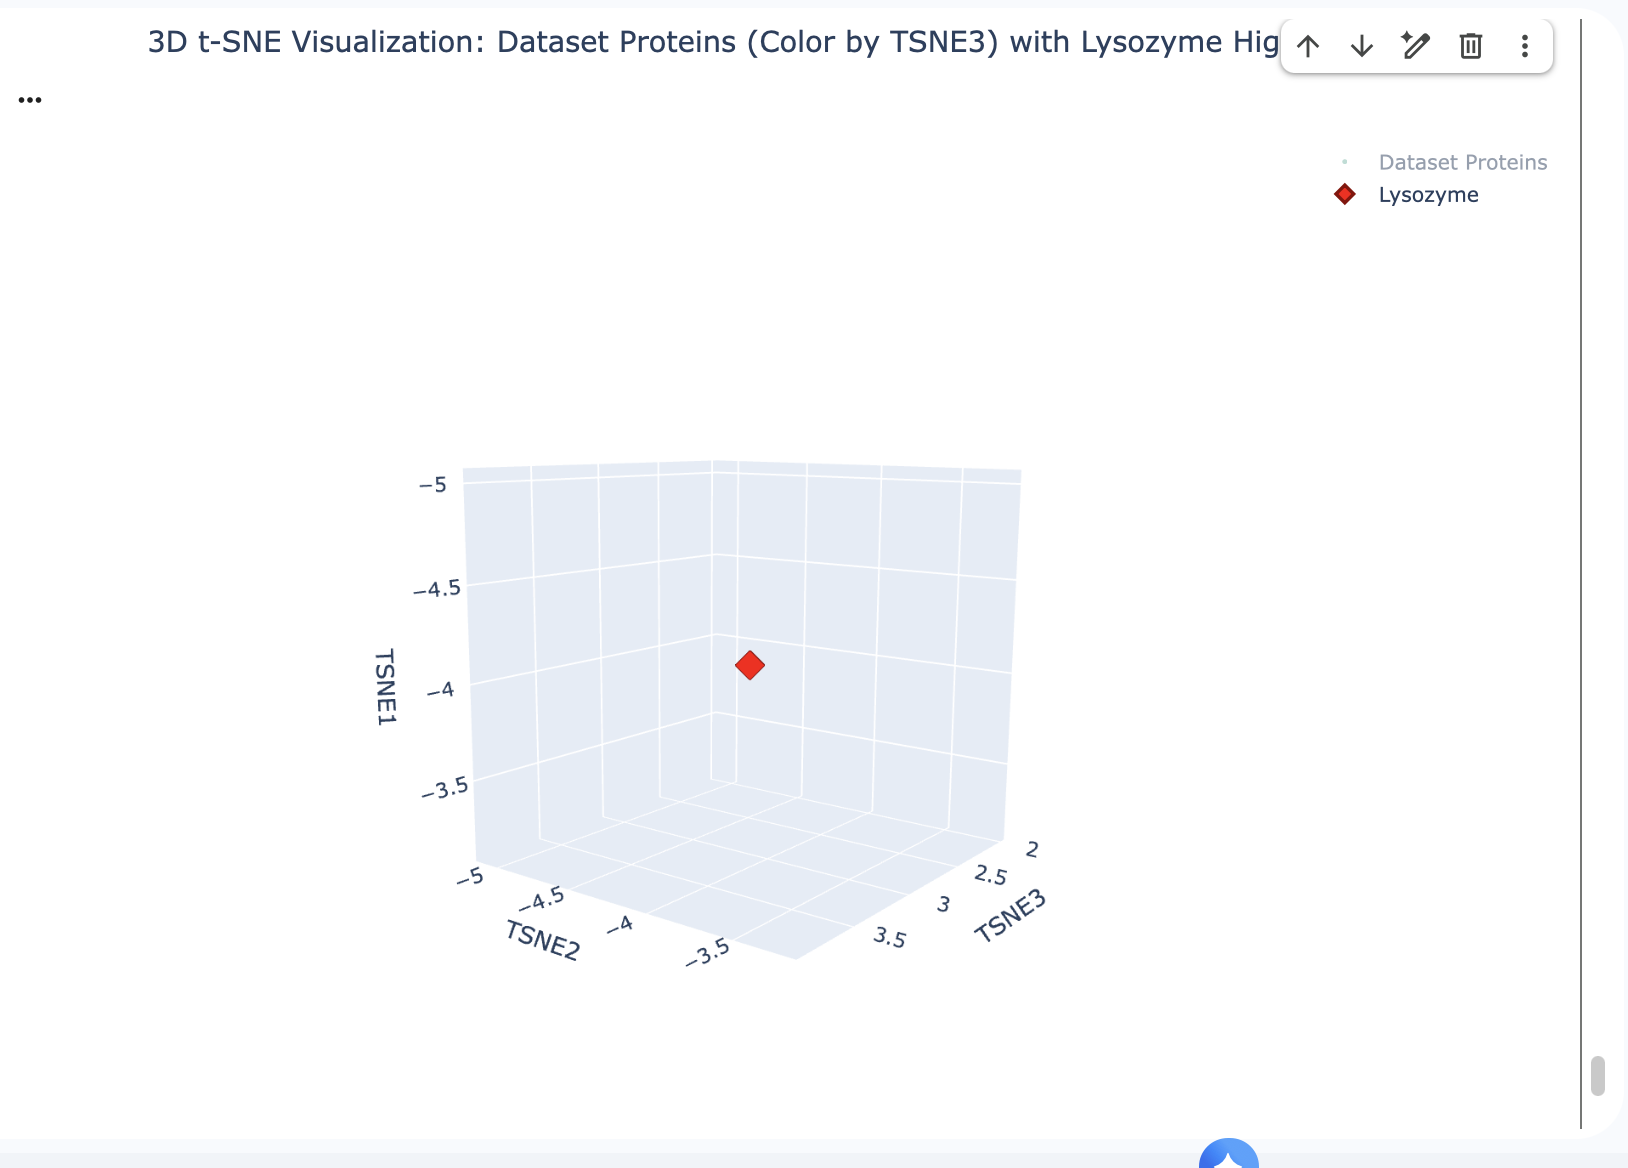
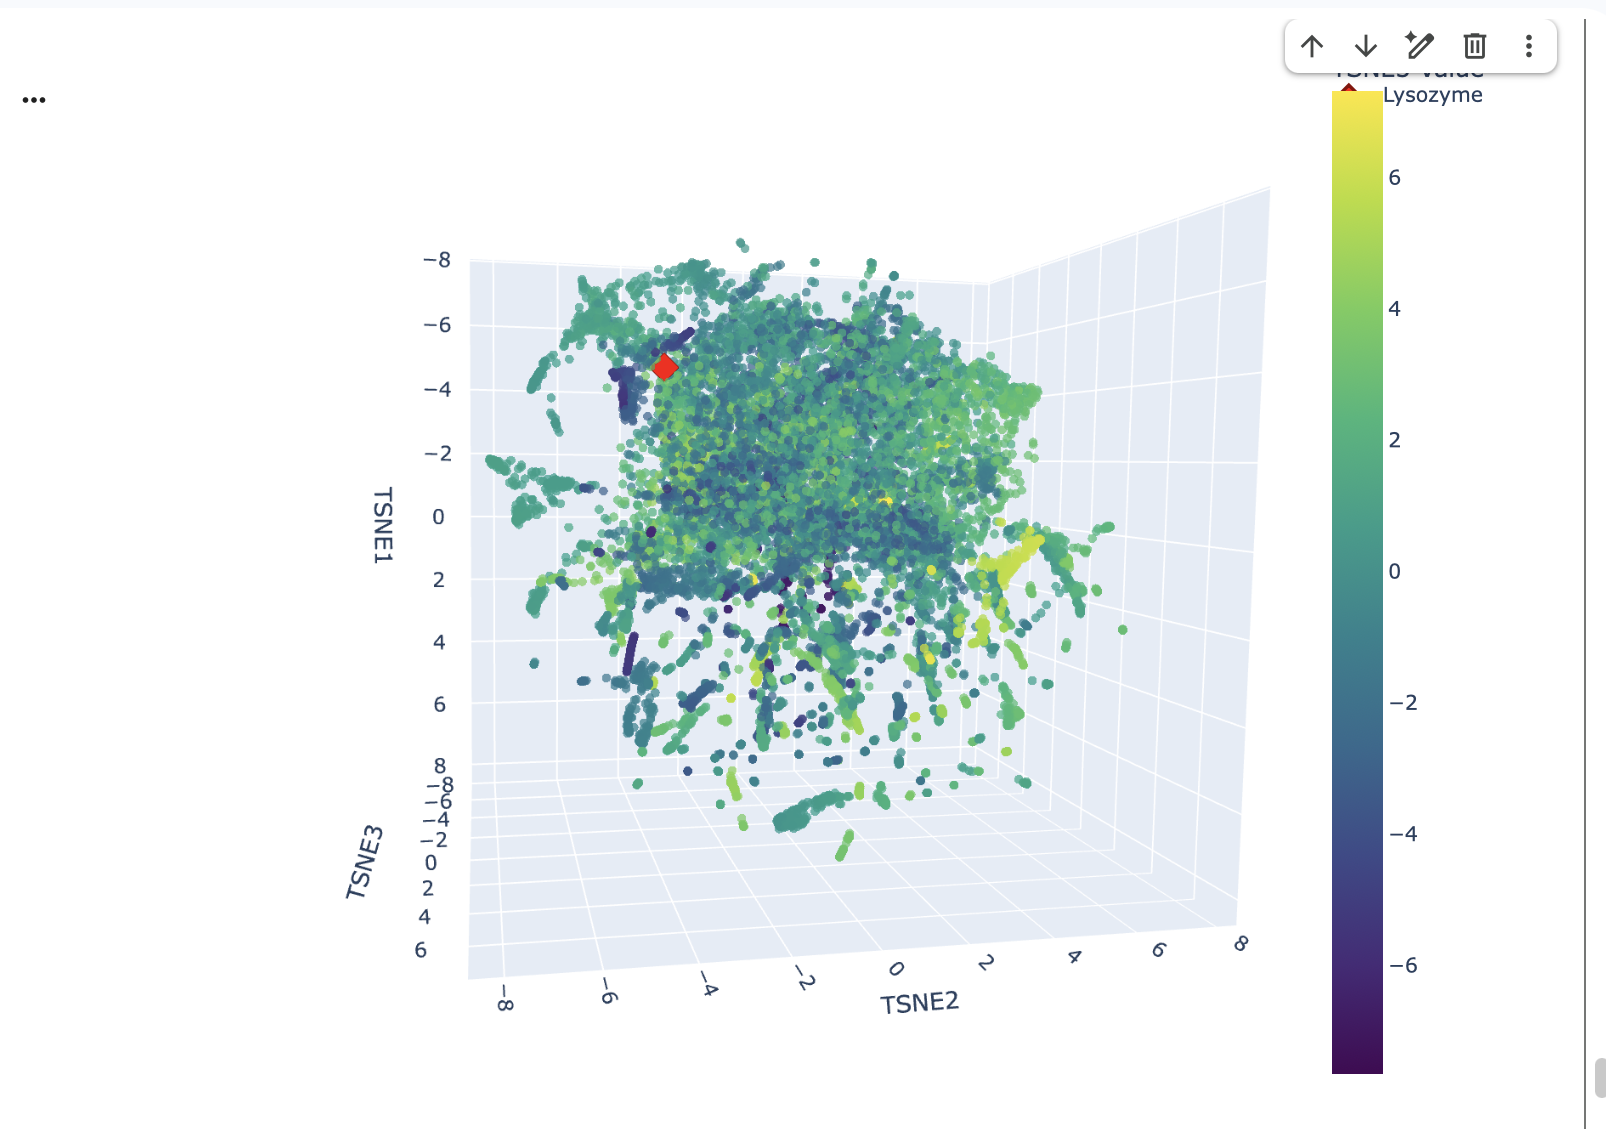
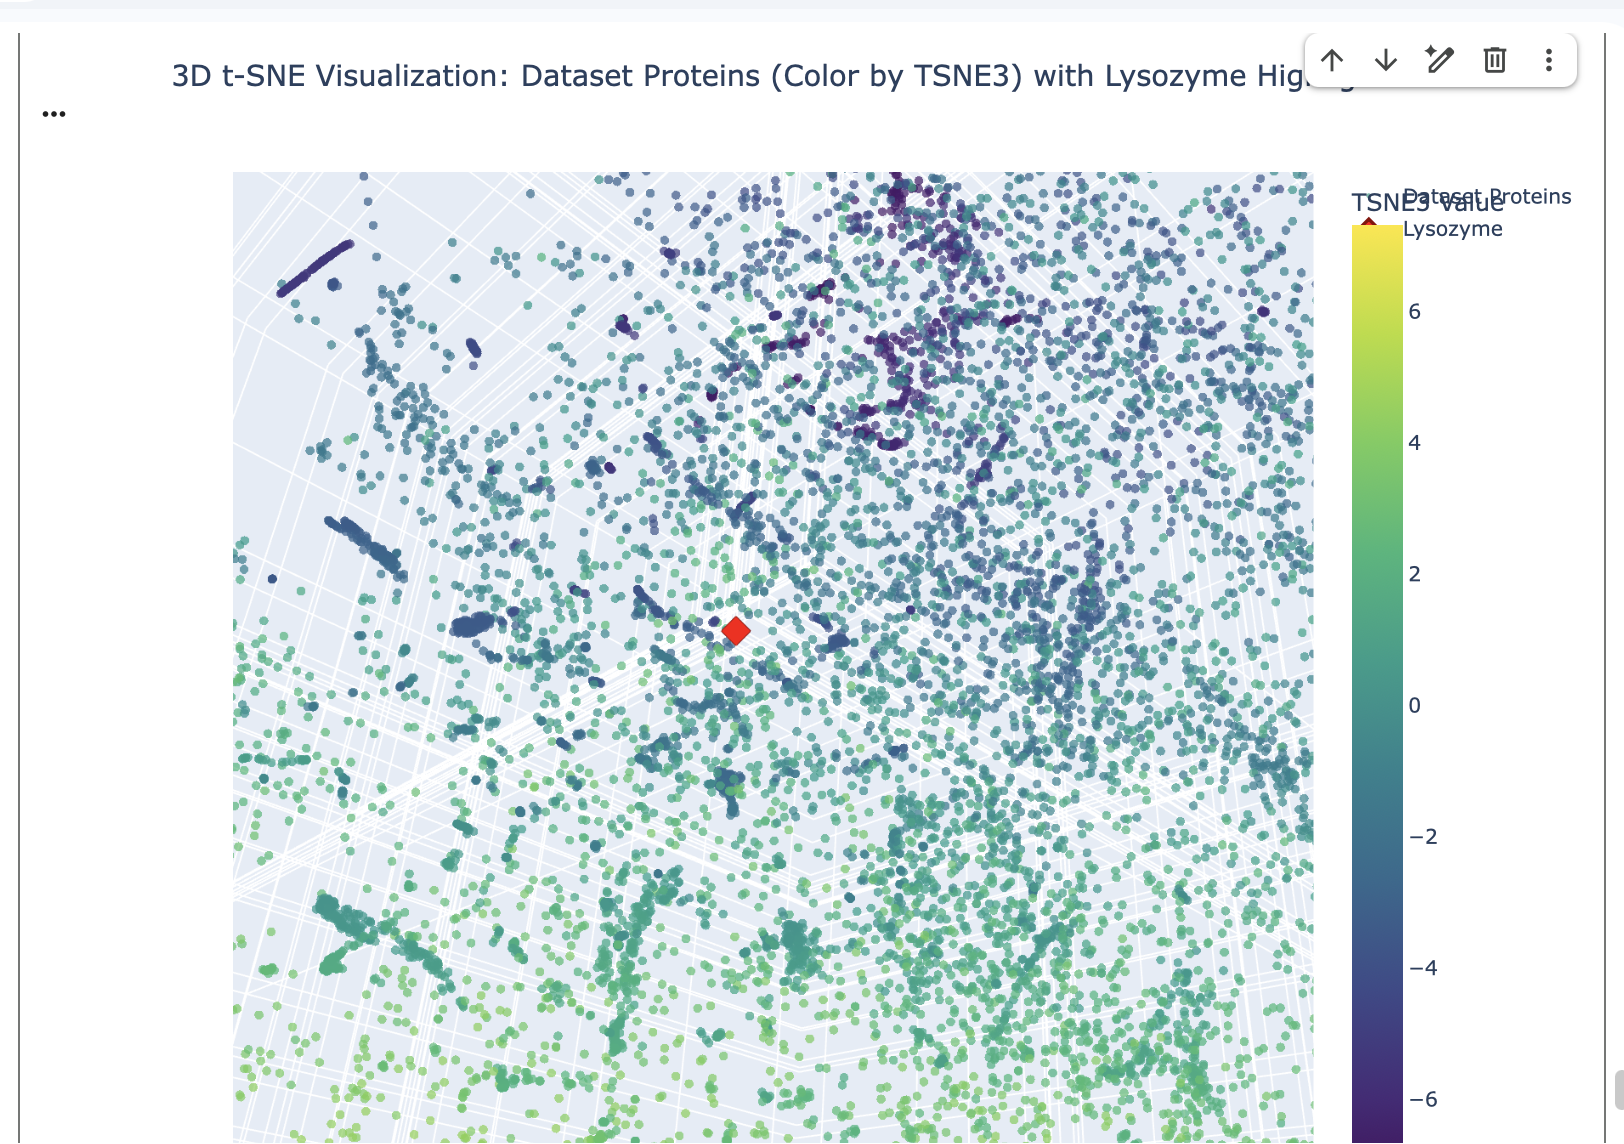
The position of Lysozyme on the t-SNE map is in close proximity to other Lysozyme proteins and grouped with proteins with similar functions related to antimicrobial activity or general proteolytic degradation.
Lysozyme’s single closest neighbour (cosine distance of 0.5614) is another Lysozyme (d2vb1a_ d.2.1.2 (A:) Lysozyme {Chicken (Gallus gallus)}). This demonstrates that the ESM-2 embeddings are highly effective at identifying direct homologs placing them very close together in the latent space.
- 2nd Nearest (Distance: 1.0996): d1kp6a_ d.58.25.1 (A:) Killer toxin KP6 alpha-subunit {Smut fungus (Ustilago maydis)}
- 3rd Nearest (Distance: 1.1177): d4jp6a_ b.52.1.2 (A:) automated matches {Papaya (Carica papaya)}
- 5th Nearest (Distance: 1.1413): d1deua_ d.3.1.1 (A:) (Pro)cathepsin X {Human (Homo sapiens)}
Other nearby proteins include the Killer toxin KP6 alpha-subunit, a protein from Carica papaya, and the pro-domain of Cathepsin X. Although these proteins originate from different organisms and perform different biological roles, they share several structural characteristics with lysozyme. In particular, they are relatively small, compact proteins that are often secreted and stabilised by disulphide bonds. As a result, they can display similar secondary-structure arrangements, cysteine patterns and surface properties.
Functionally, there are also some broad parallels. Lysozyme acts as an antimicrobial enzyme that degrades bacterial cell walls, while killer toxins are secreted proteins that inhibit competing microorganisms. Similarly, Cathepsin X is a lysosomal cysteine protease involved in protein degradation. While their specific biological roles differ, all three proteins participate in processes involving extracellular defense or proteolytic activity.
C2. Protein Folding
Fold your protein with ESMFold. Do the predicted coordinates match your original structure?
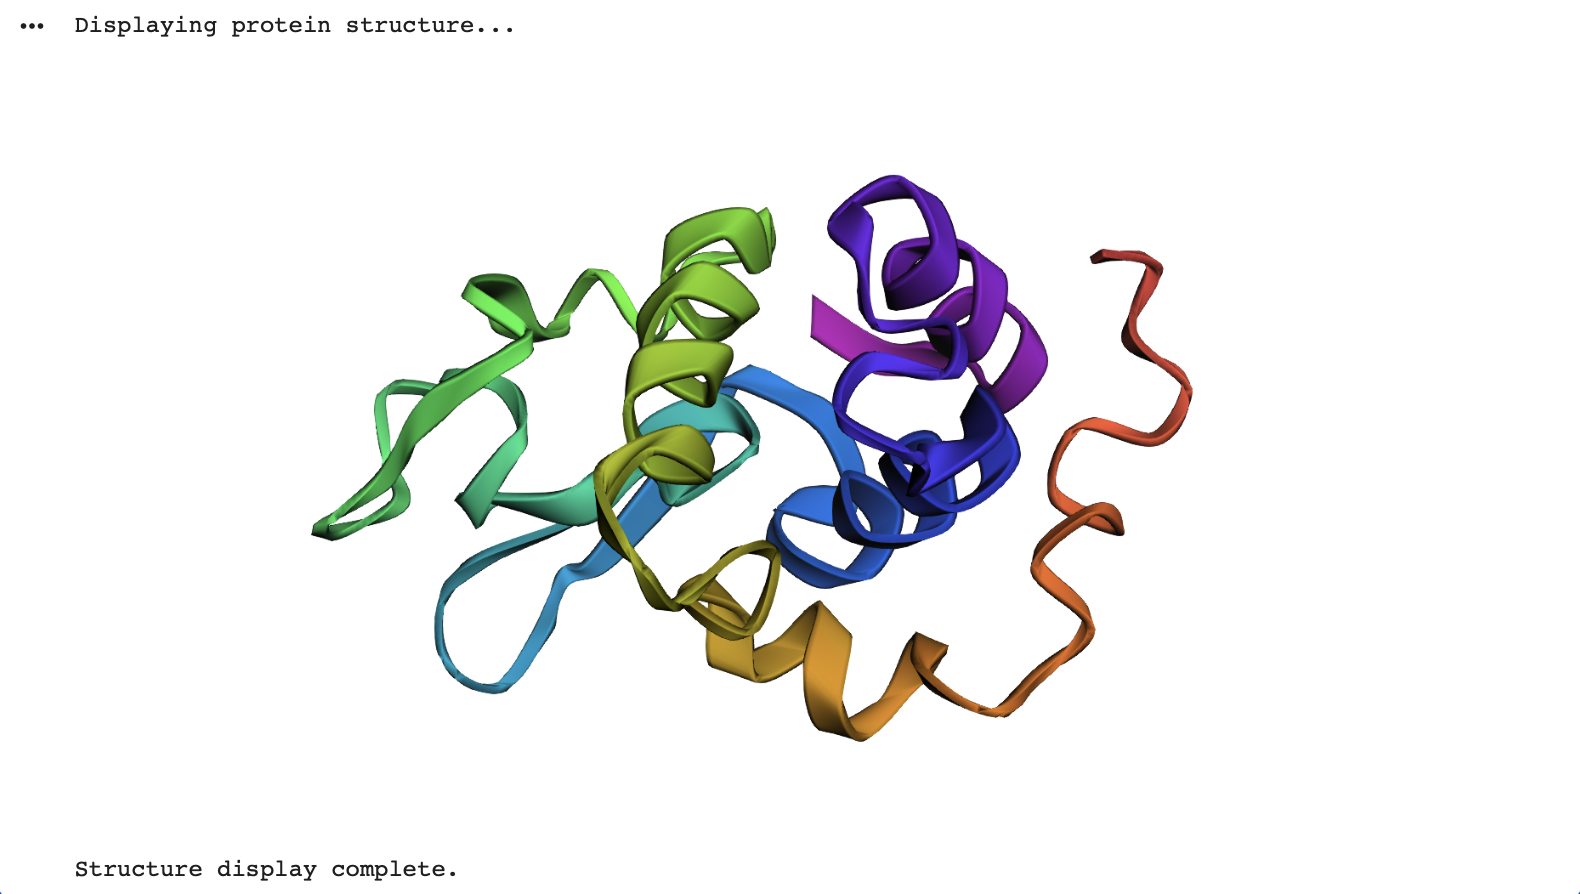
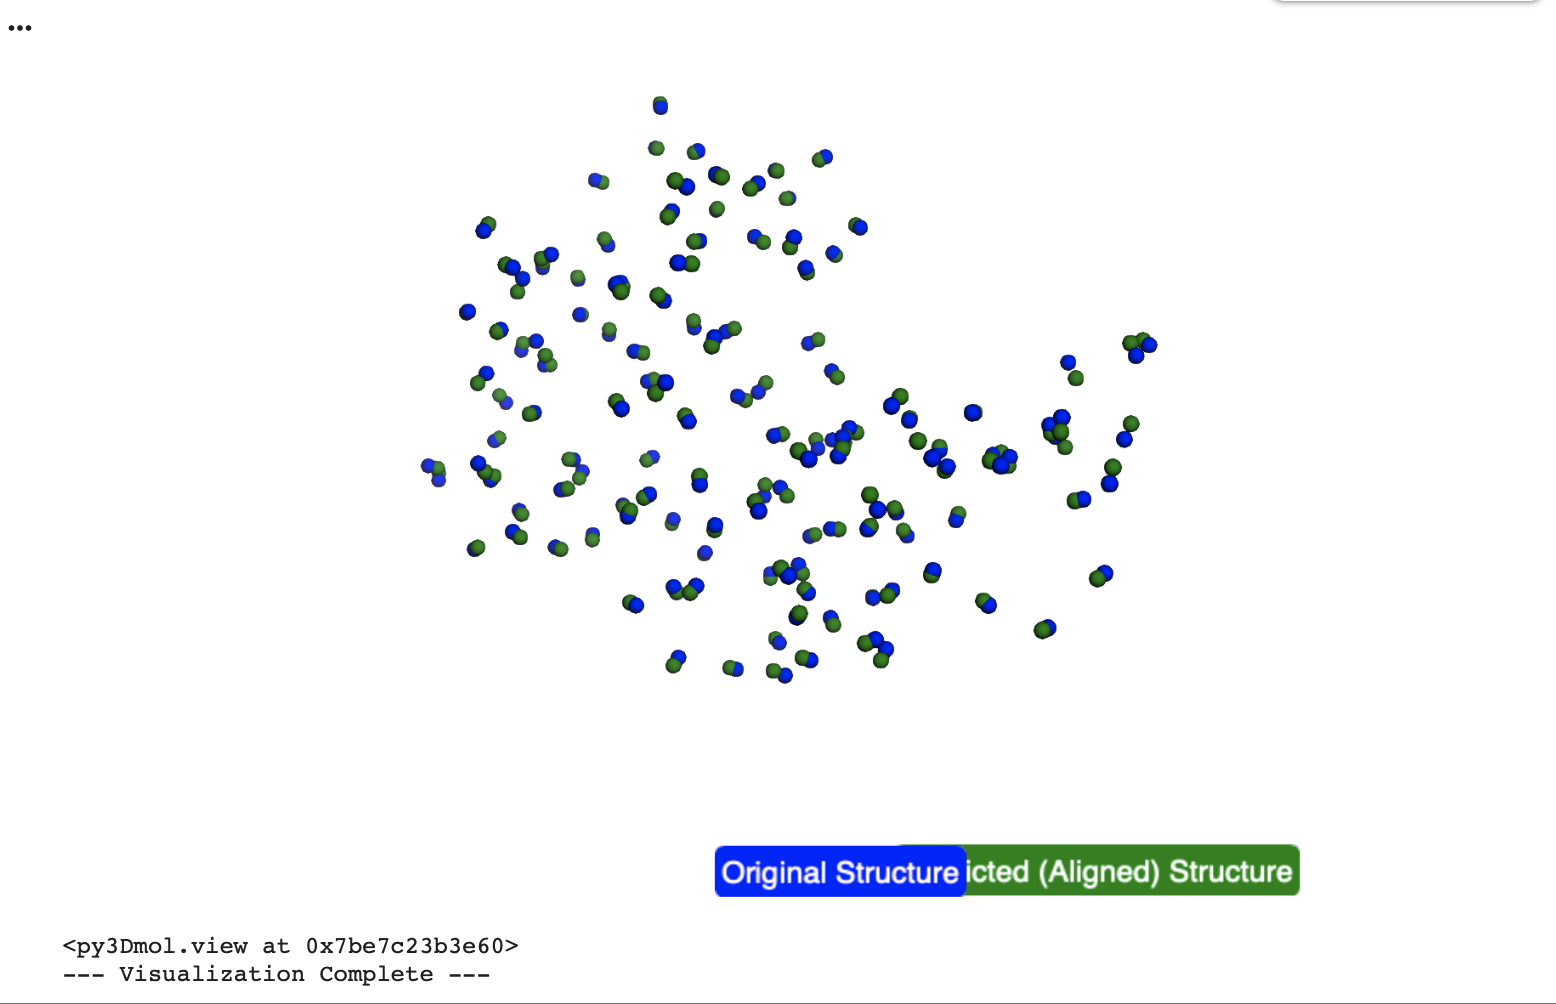
Yes, the predicted coordinates closely match the original structure. The Root Mean Square Deviation (RMSD) calculated in the collab between the C-alpha atomic co-ordinates extracted from the original pdb co-ordinates and the ESM Fold predicted Lysozyme structures is 0.553 Angstroms (low = more accurate), indicating a very high degree of structural similarity.
In the below visualisation, both the original and predicted structures contained 129 C-alpha atoms, ensuring a consistent basis for comparison. The original (blue) and predicted (green) structures were successfully superimposed and visualized using py3Dmol, allowing for a clear visual confirmation of their alignment.
Try changing the sequence, first try some mutations, then large segments. Is your protein structure resilient to mutations?
I generated three point mutated versions of Lysozyme and predicted their structures using ESMFold.
- Lysozyme_K1A_mutant (single mutation: Lysine at position 1 to Alanine)
- Lysozyme_F3L_G4A_mutant (double mutation: Phenylalanine at position 3 to Leucine, Glycine at position 4 to Alanine)
- Lysozyme_V2I_W28Y_mutant (double mutation: Valine at position 2 to Isoleucine, Tryptophan at position 28 to Tyrosine)
Structural comparisons of these mutated proteins against the original 1LYZ using Gemini showed consistently low RMSD values:
Lysozyme_K1A_mutant: RMSD = 0.555 ÅLysozyme_F3L_G4A_mutant: RMSD = 0.596 ÅLysozyme_V2I_W28Y_mutant: RMSD = 0.608 Å
These low RMSD values (all below ~0.6 Å)(Root Mean Square Deviation (RMSD), which quantifies the structural difference along with the visualisation of the overlat indicate a high degree of structural similarity between the original Lysozyme, the initial ESMFold prediction and the mutated structures.
The ptm and plddt scores for the mutated proteins were also high (e.g., ptm ~0.906-0.909, plddt ~94.7-95.2), indicating high confidence in ESMFold’s predictions for these variants.
This suggests that these specific single or double point mutations do not drastically alter the overall global fold of the protein, which is expected for minor changes in a well-folded, stable protein like Lysozyme.
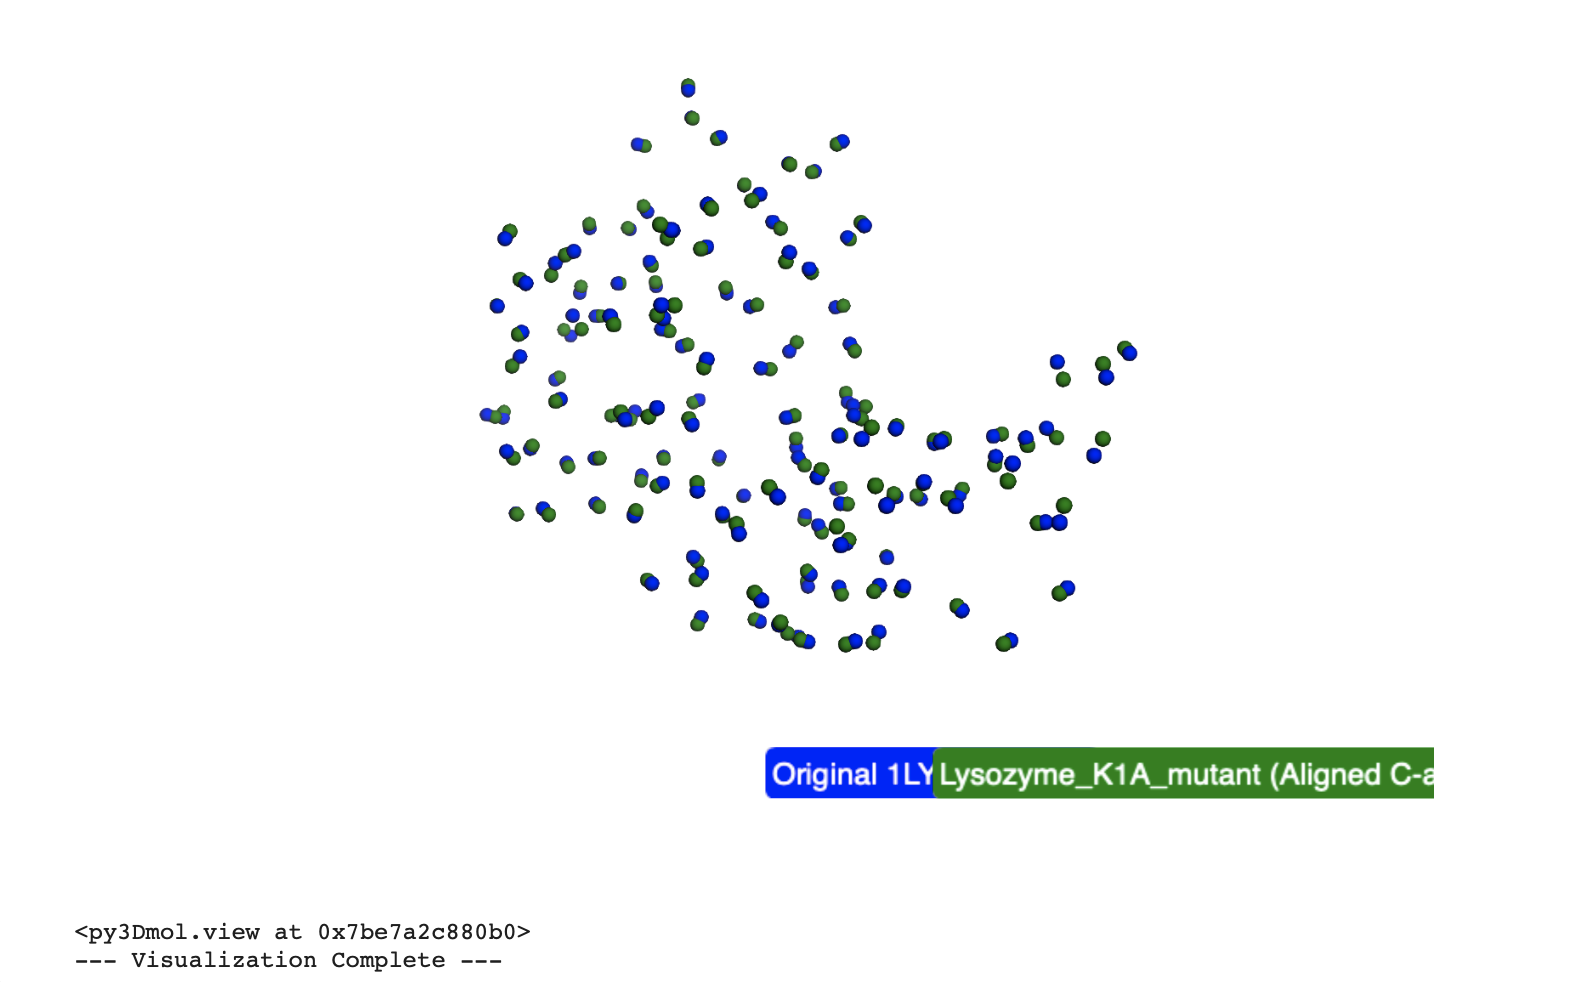
Based on the analysis of these point mutations, the Lysozyme protein structure appears highly resilient to these specific 1-2 point mutations.
Large Segment Mutation
I replaced a 15-residue segment of the original Lysozyme sequence (from position 50 to 64) with a new segment, “AAAAAGGGGGPPPPP”, resulting in a segment-mutated Lysozyme sequence of the same length (129 residues).
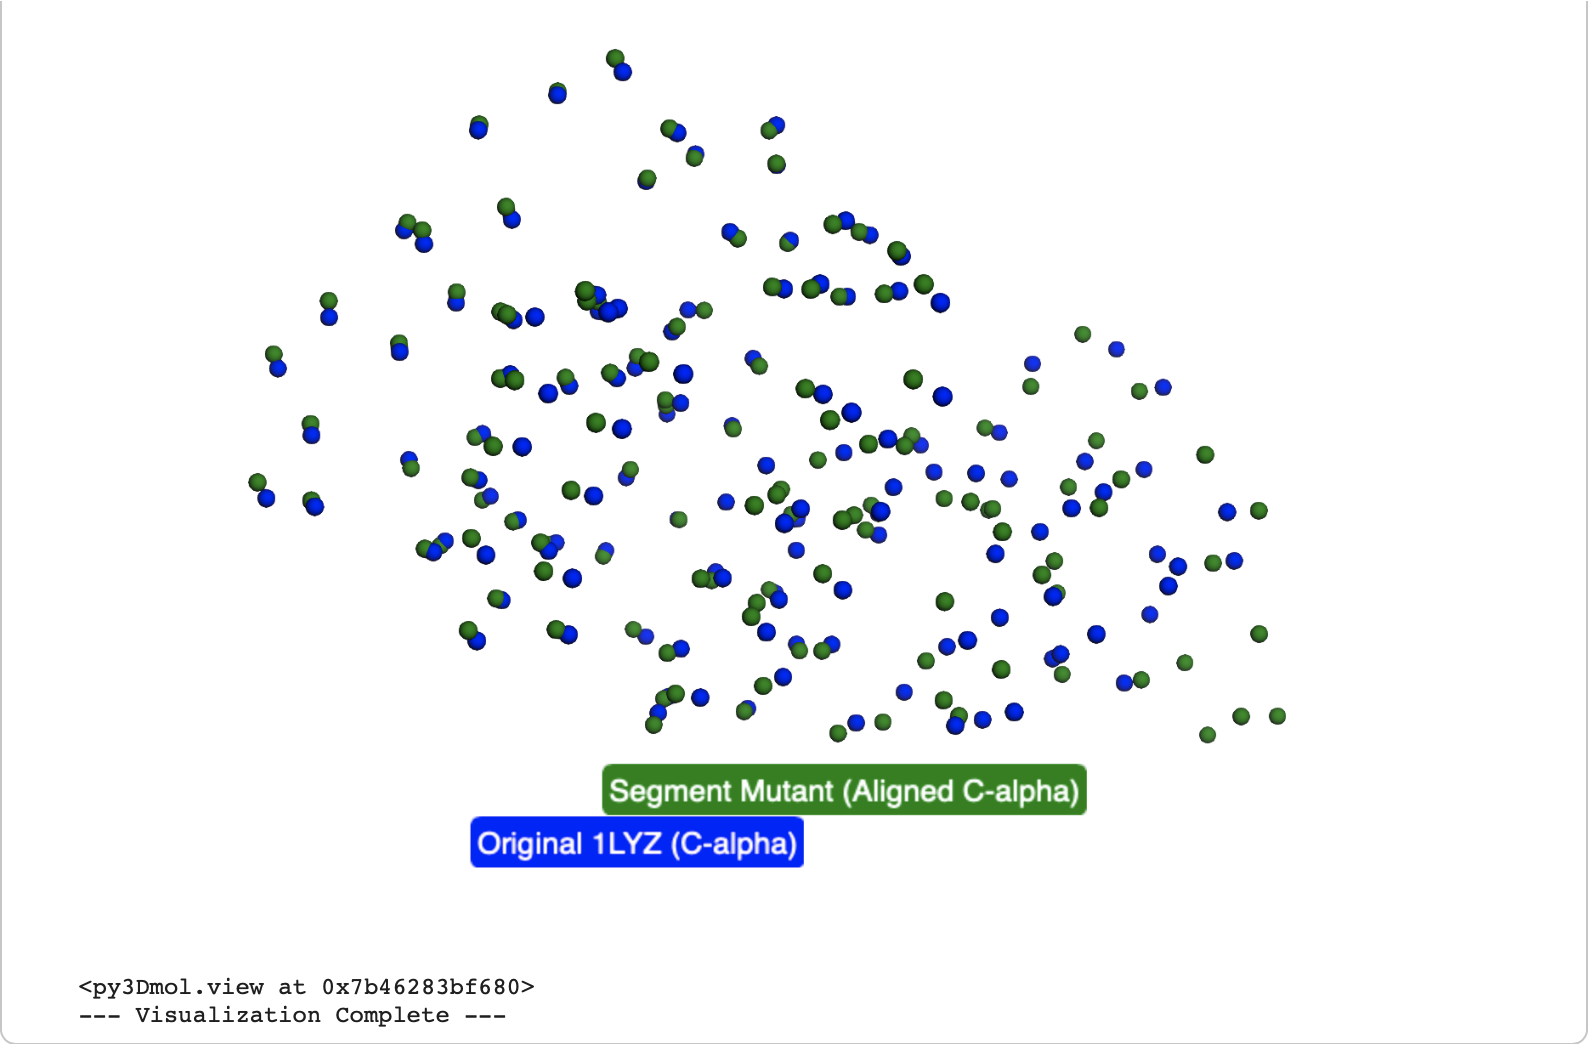
The Root Mean Square Deviation (RMSD) calculated between the original Lysozyme and the Lysozyme_segment_mutant C-alpha atoms after structural alignment is 3.163 Å.
The visual shows significant difference between the original (blue ) and the transformed segment mutant (green ) structures. While some parts of the protein backbone might still align, the region corresponding to the large segment mutation shows clear structural differences, leading to a much higher RMSD compared to the point mutants.
The ptm and plddt scores for the segment mutant were noticeably lower (ptm ~0.768, plddt ~75.559) compared to the original ESMFold prediction (ptm: 0.907, plddt: 95.138) and the point mutants which indicates a lower confidence in the predicted structure and a less well-folded.
Based on these results, the Lysozyme protein structure is not resilient to large segment mutations of this magnitude.
Inverse-Folding a protein: Using the backbone of Lysozyme to propose sequence candidates via ProteinMPNN
Analyze the predicted sequence probabilities and compare the predicted sequence vs the original one. 2. Input this sequence into ESMFold and compare the predicted structure to your original.
The heatmap generated visualises the probability distribution for each amino acid at every position along the 5MBA lysozyme backbone. For each position, ProteinMPNN assigns a high probability to one specific amino acid, which forms the basis of its generated sequence.
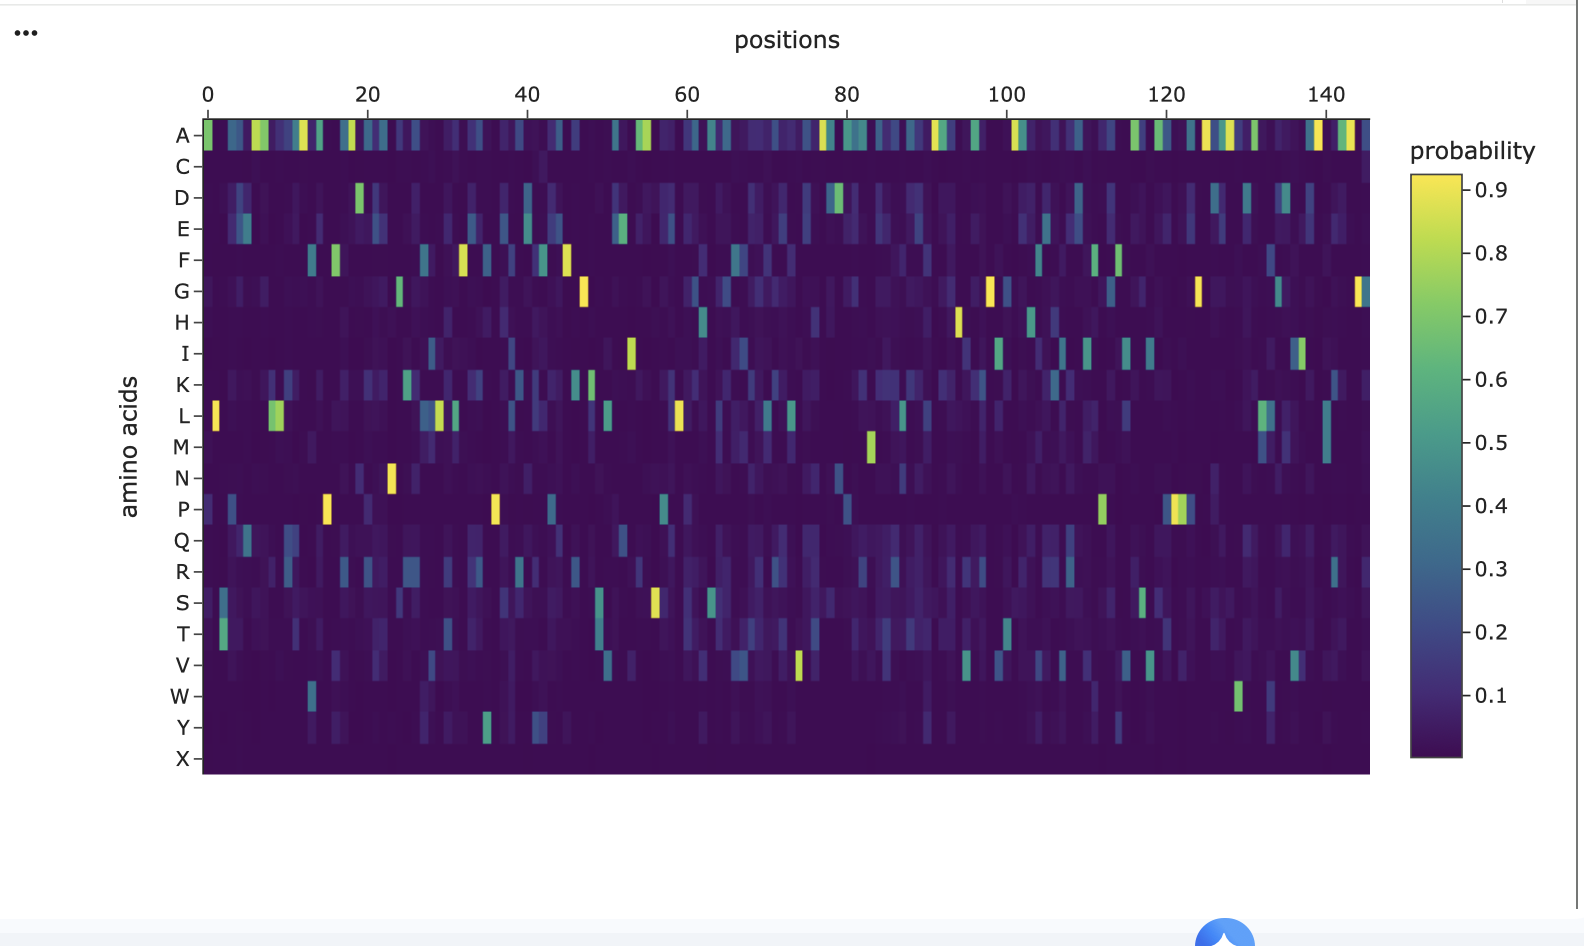
Original Lysozyme Sequence (Length129):
KVFGRCELAAAMKRHGLDNYRGYSLGNWVCAAKFESNFNTQATNRNTDGSTDYGILQINSRWWCNDGRTPGSRNLCNIPCSALLSSDITASVNCAKKIVSDGNGMNAWVAWRNRCKGTDVQAWIRGCRLProteinMPNN Generated Sequence (Length 146):
ALTPEEAALLRAAAAPVFADREANGRAFVLRLFEAYPELAELFPEFKGKTLAEIAASPALGAIAGAIMDGLATLVEHADDPARMATLLAALAAAHRARGITAAHFERIRALFPGFIASVAPPPPGADAAWDRLLGLVIDAMRAAGG
Differences
Out of the 129 positions in the original Lysozyme sequence, 124 positions show differences when compared to the ProteinMPNN-generated sequence. This means the model proposed a significantly different amino acid at almost every position. This creates a very low sequence recovery rate of 3.88%, indicating that only a small fraction of the residues in the generated sequence match the original Lysozyme sequence at corresponding positions.
This means ProteinMPNN found a very different sequence that it believes is stable for the backbone of Lysozyme which is to be expected given I didn’t give the model any sequence constraints.
I then took this newly generated sequence and fed it into ESMFold to predict its structure
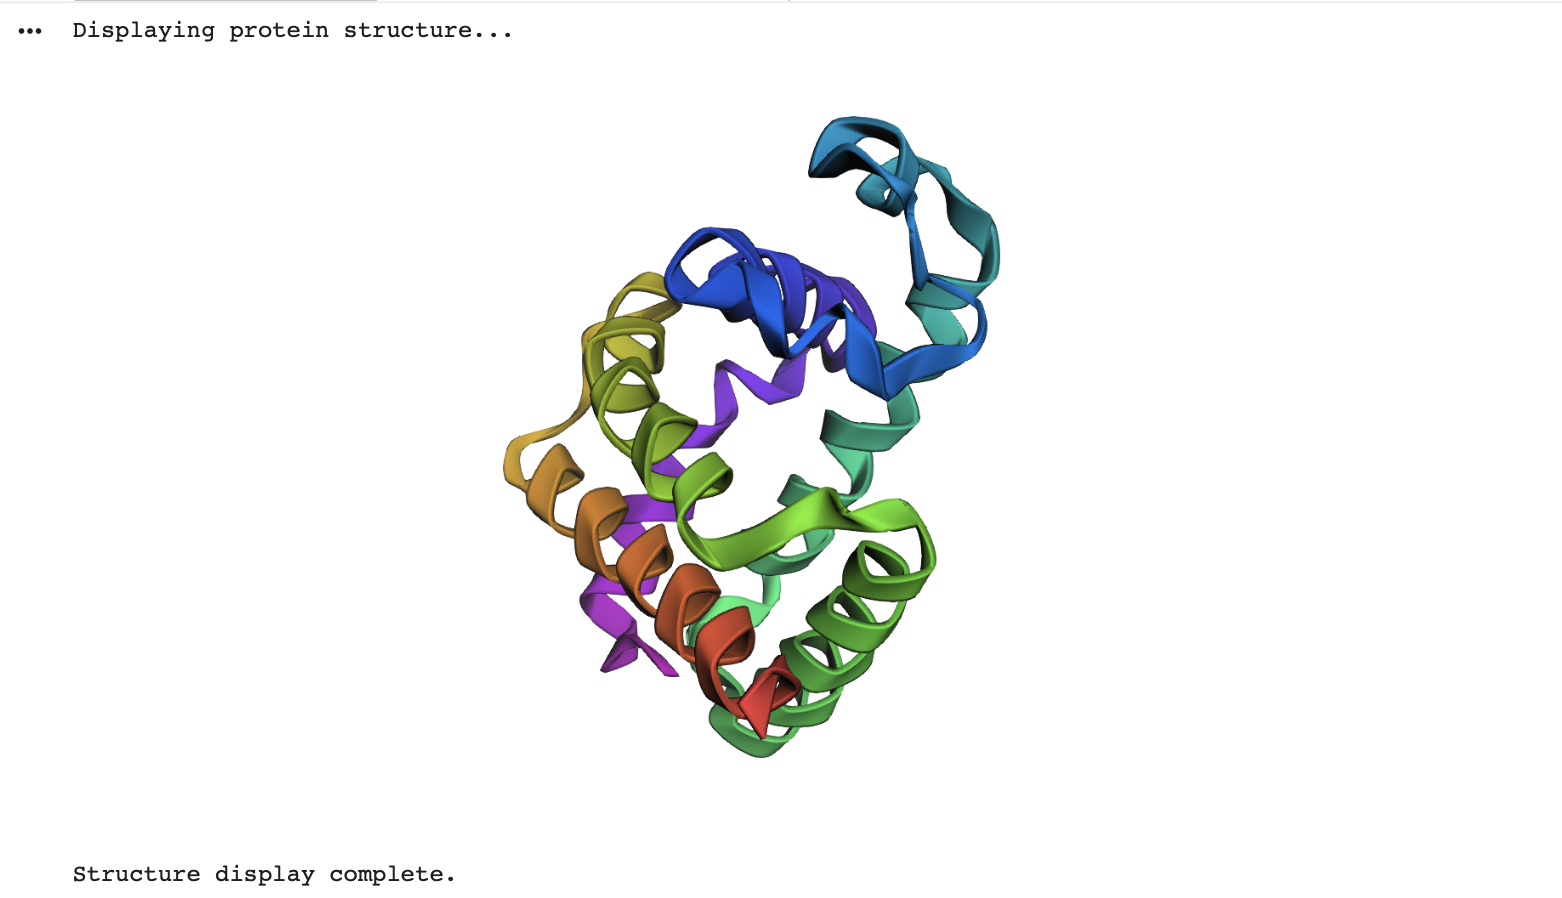
Structural Comparison to Original
Root Mean Square Deviation (RMSD): After performing structural alignment of the C-alpha atoms between the original Lysozyme structure and the ESMFold predicted structure of the ProteinMPNN-generated sequence, an RMSD of 14.459 Å was calculated which is very high.
Visual Overlay: The 3D visualisation displayed the original Lysozyme structure (blue) superimposed with the ESMFold-predicted structure of the new sequence (green). Visually, these two structures were indeed very different.
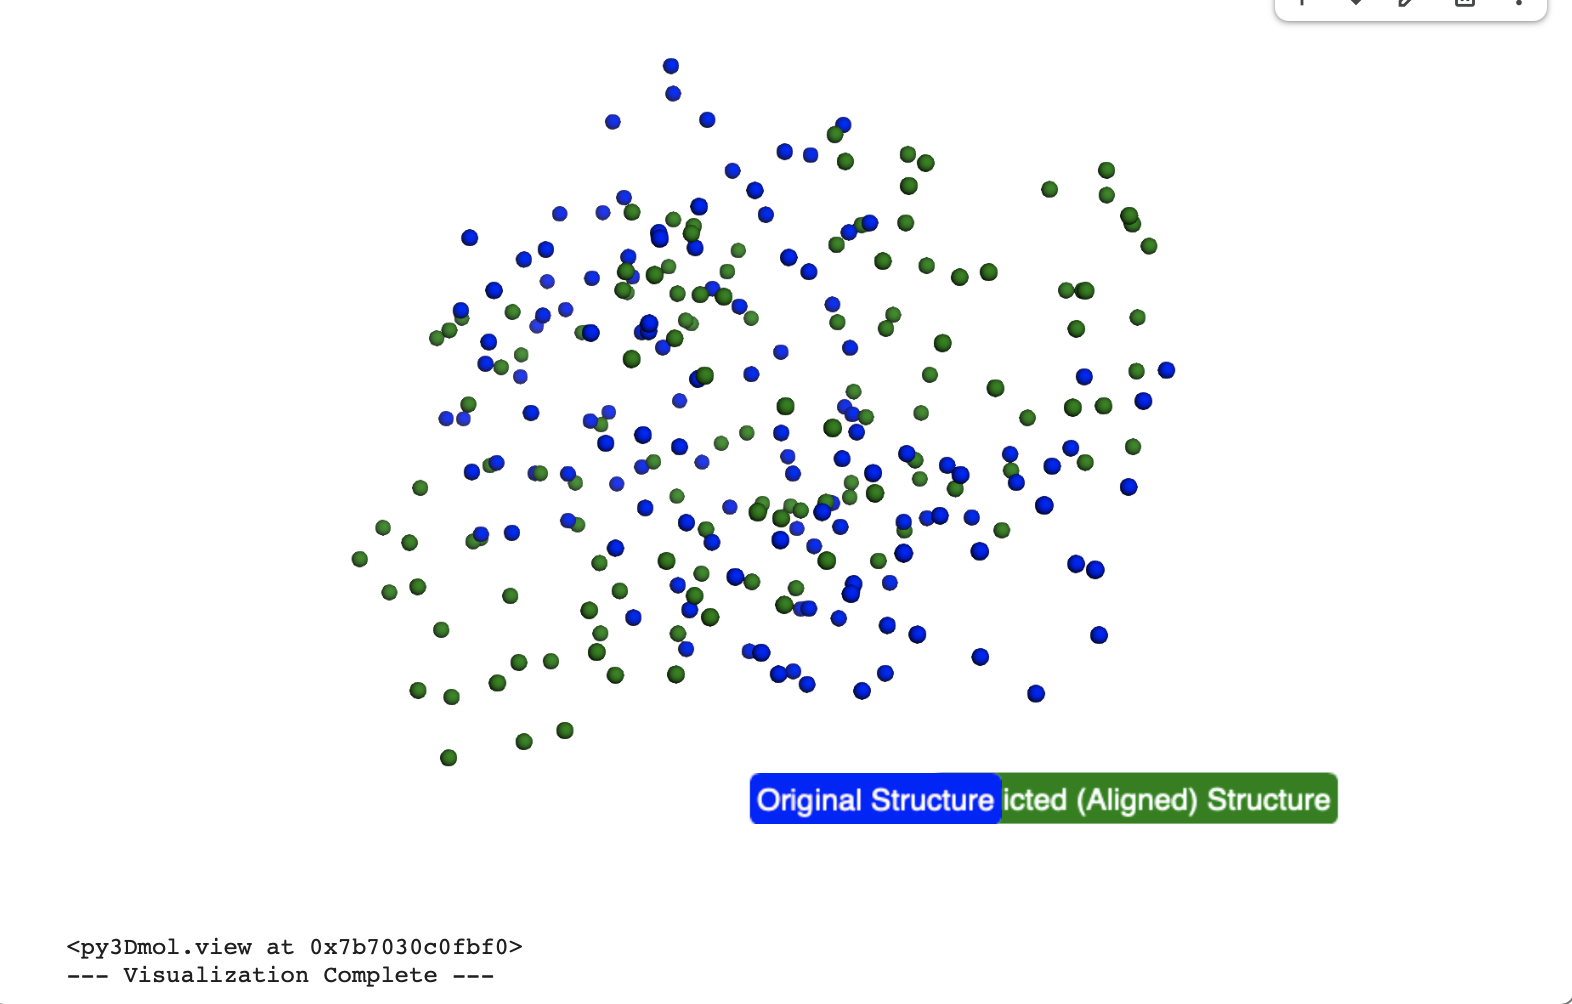
References
Zhang T, Ma S, Zhang Z, Guo Y, Yang D, Lu W. Overview and Evolution of Insect Fibroin Heavy Chain (FibH). Int J Mol Sci. 2024 Jun 29;25(13):7179. doi: 10.3390/ijms25137179. PMID: 39000286; PMCID: PMC11241164.
PART D: Bacteriophage Engineering
Schematic:
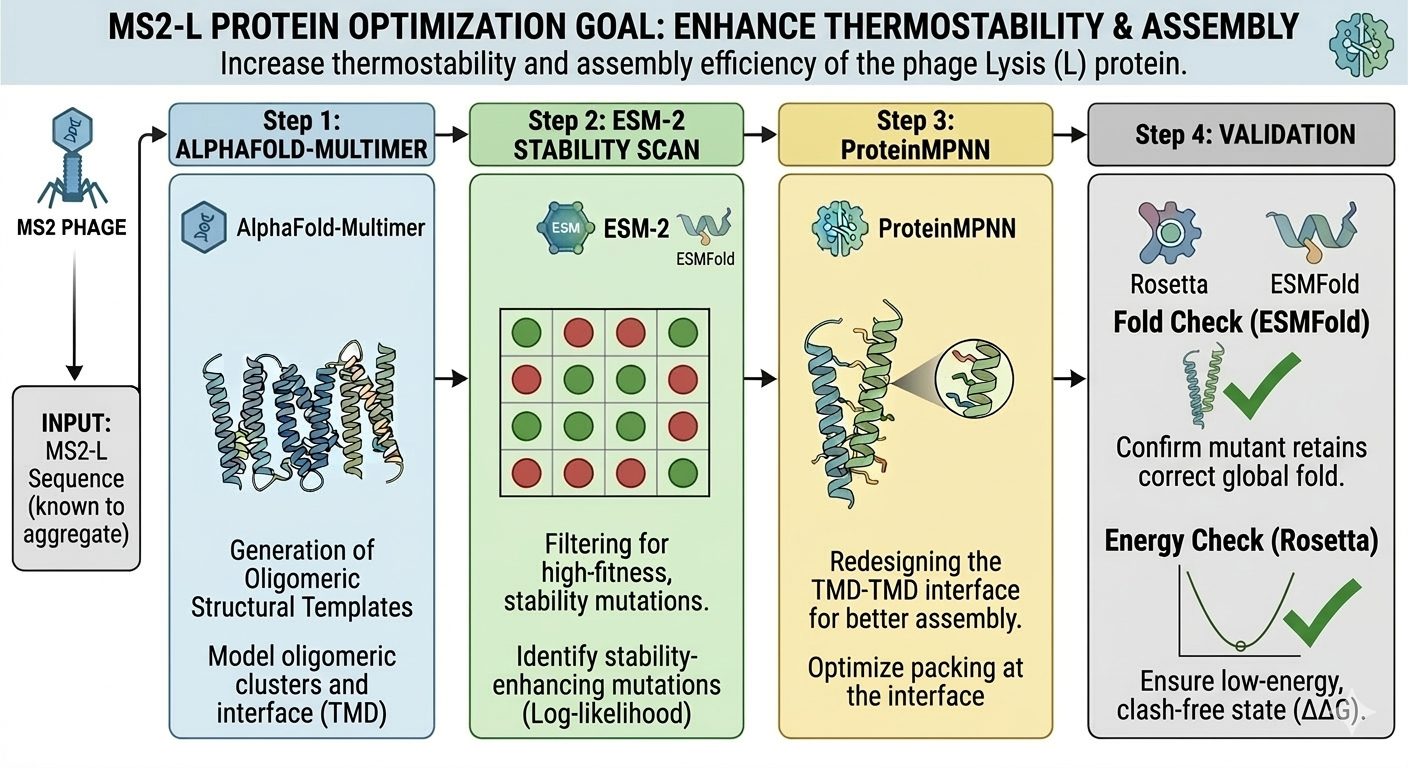
Schematic made with Gemini
Initial Proposal
Bacteriophage Engineering by Isobel LeonardWeek 5 HW: Protein Design Part II
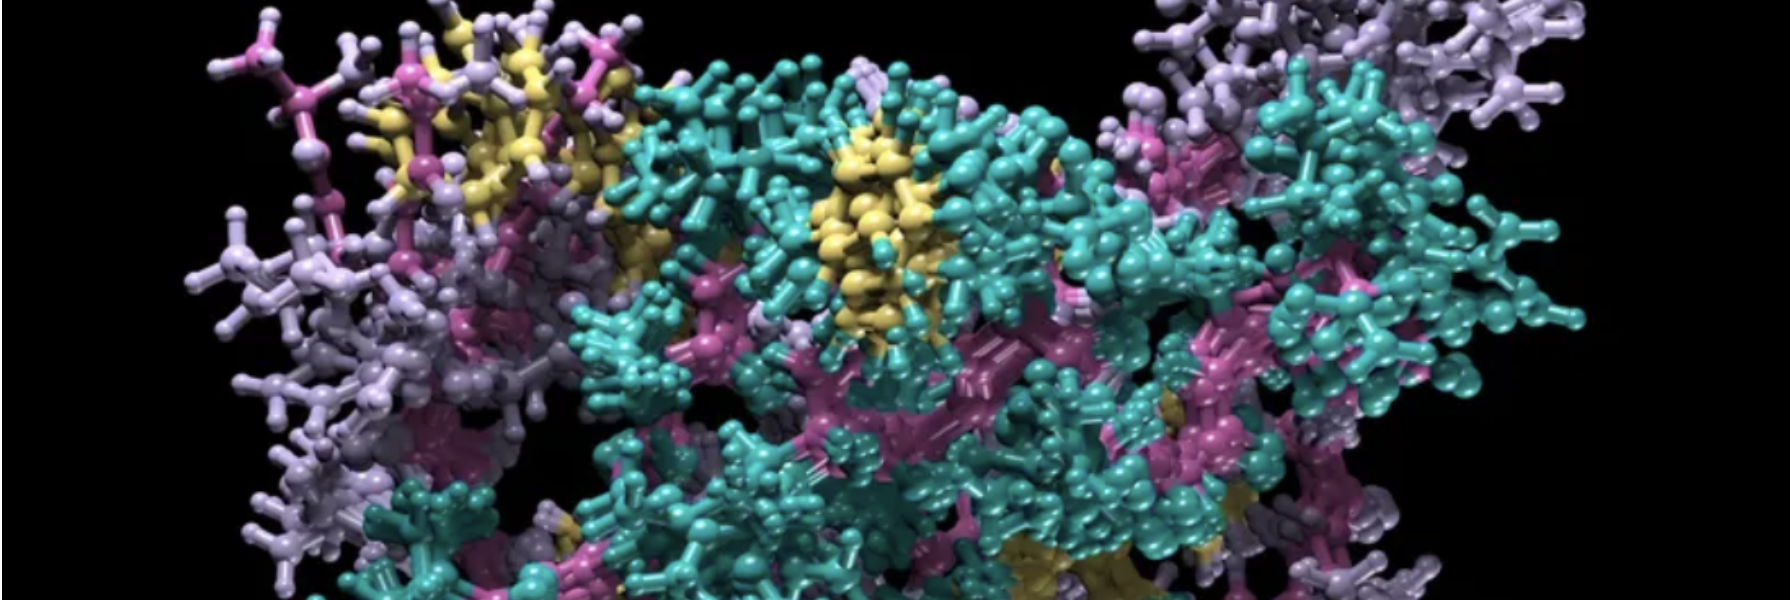
PART 1: Generate Binders with PepMLM
Begin by retrieving the human SOD1 sequence from UniProt (P00441) and introducing the A4V mutation.
SOD1 Sequence from Uniprot is:
MATKAVCVLKGDGPVQGIINFEQKESNGPVKVWGSIKGLTEGLHGFHVHEFGDNTAGCTS AGPHFNPLSRKHGGPKDEERHVGDLGNVTADKDGVADVSIEDSVISLSGDHCIIGRTLVV HEKADDLGKGGNEESTKTGNAGSRLACGVIGIAQ
Mutations in SOD1 causes familial Amyotrophic Lateral Sclerosis (ALS). Among these mutations, one that causes a very aggressive form of the disease is the A4V mutation (where residue 4 is changed from Alanine → Valine). Introducing A4V mutation makes the sequence:
MATKVVCVLKGDGPVQGIINFEQKESNGPVKVWGSIKGLTEGLHGFHVHEFGDNTAGCTS AGPHFNPLSRKHGGPKDEERHVGDLGNVTADKDGVADVSIEDSVISLSGDHCIIGRTLVV HEKADDLGKGGNEESTKTGNAGSRLACGVIGIAQ
From this A4V mutated sequence, I generate four peptides of length 12 amino acids using the PpPMLM Colab
MKLLLLELQLKIMKKLLLELRKILSSKILLEAQLKKSSTLLEQLLLLK
I added the known SOD1-binding peptide FLYRWLPSRRGG to the list for comparison with perplexity scores that indicate PepMLM’s confidence in the binder.
- Binder 1: MKLLLLELQLKI | Perplexity Score: 15.09267260097674
- Binder 2: MKKLLLELRKIL | Perplexity Score: 9.666623275735994
- Binder 3: SSKILLEAQLKK | Perplexity Score: 11.727098975582301
- Binder 4: SSTLLEQLLLLK | Perplexity Score: 10.224047521763415
- Control Binder: FLYRWLPSRRGG | Perplexity Score: 13.767869
2 of the generated binders have a lower perplexity (higher confidence) than the control and the highest confidence binder is no. 2 but they are all pretty moderate to low!
Part 2: Evaluate Binders with AlphaFold3
For each peptide, I submitted the mutant SOD1 sequence followed by the peptide sequence into Alphafold to model the protein-peptide complex.
Binder 1: MKLLLLELQLKI
Alpha Fold Predicted Structure:
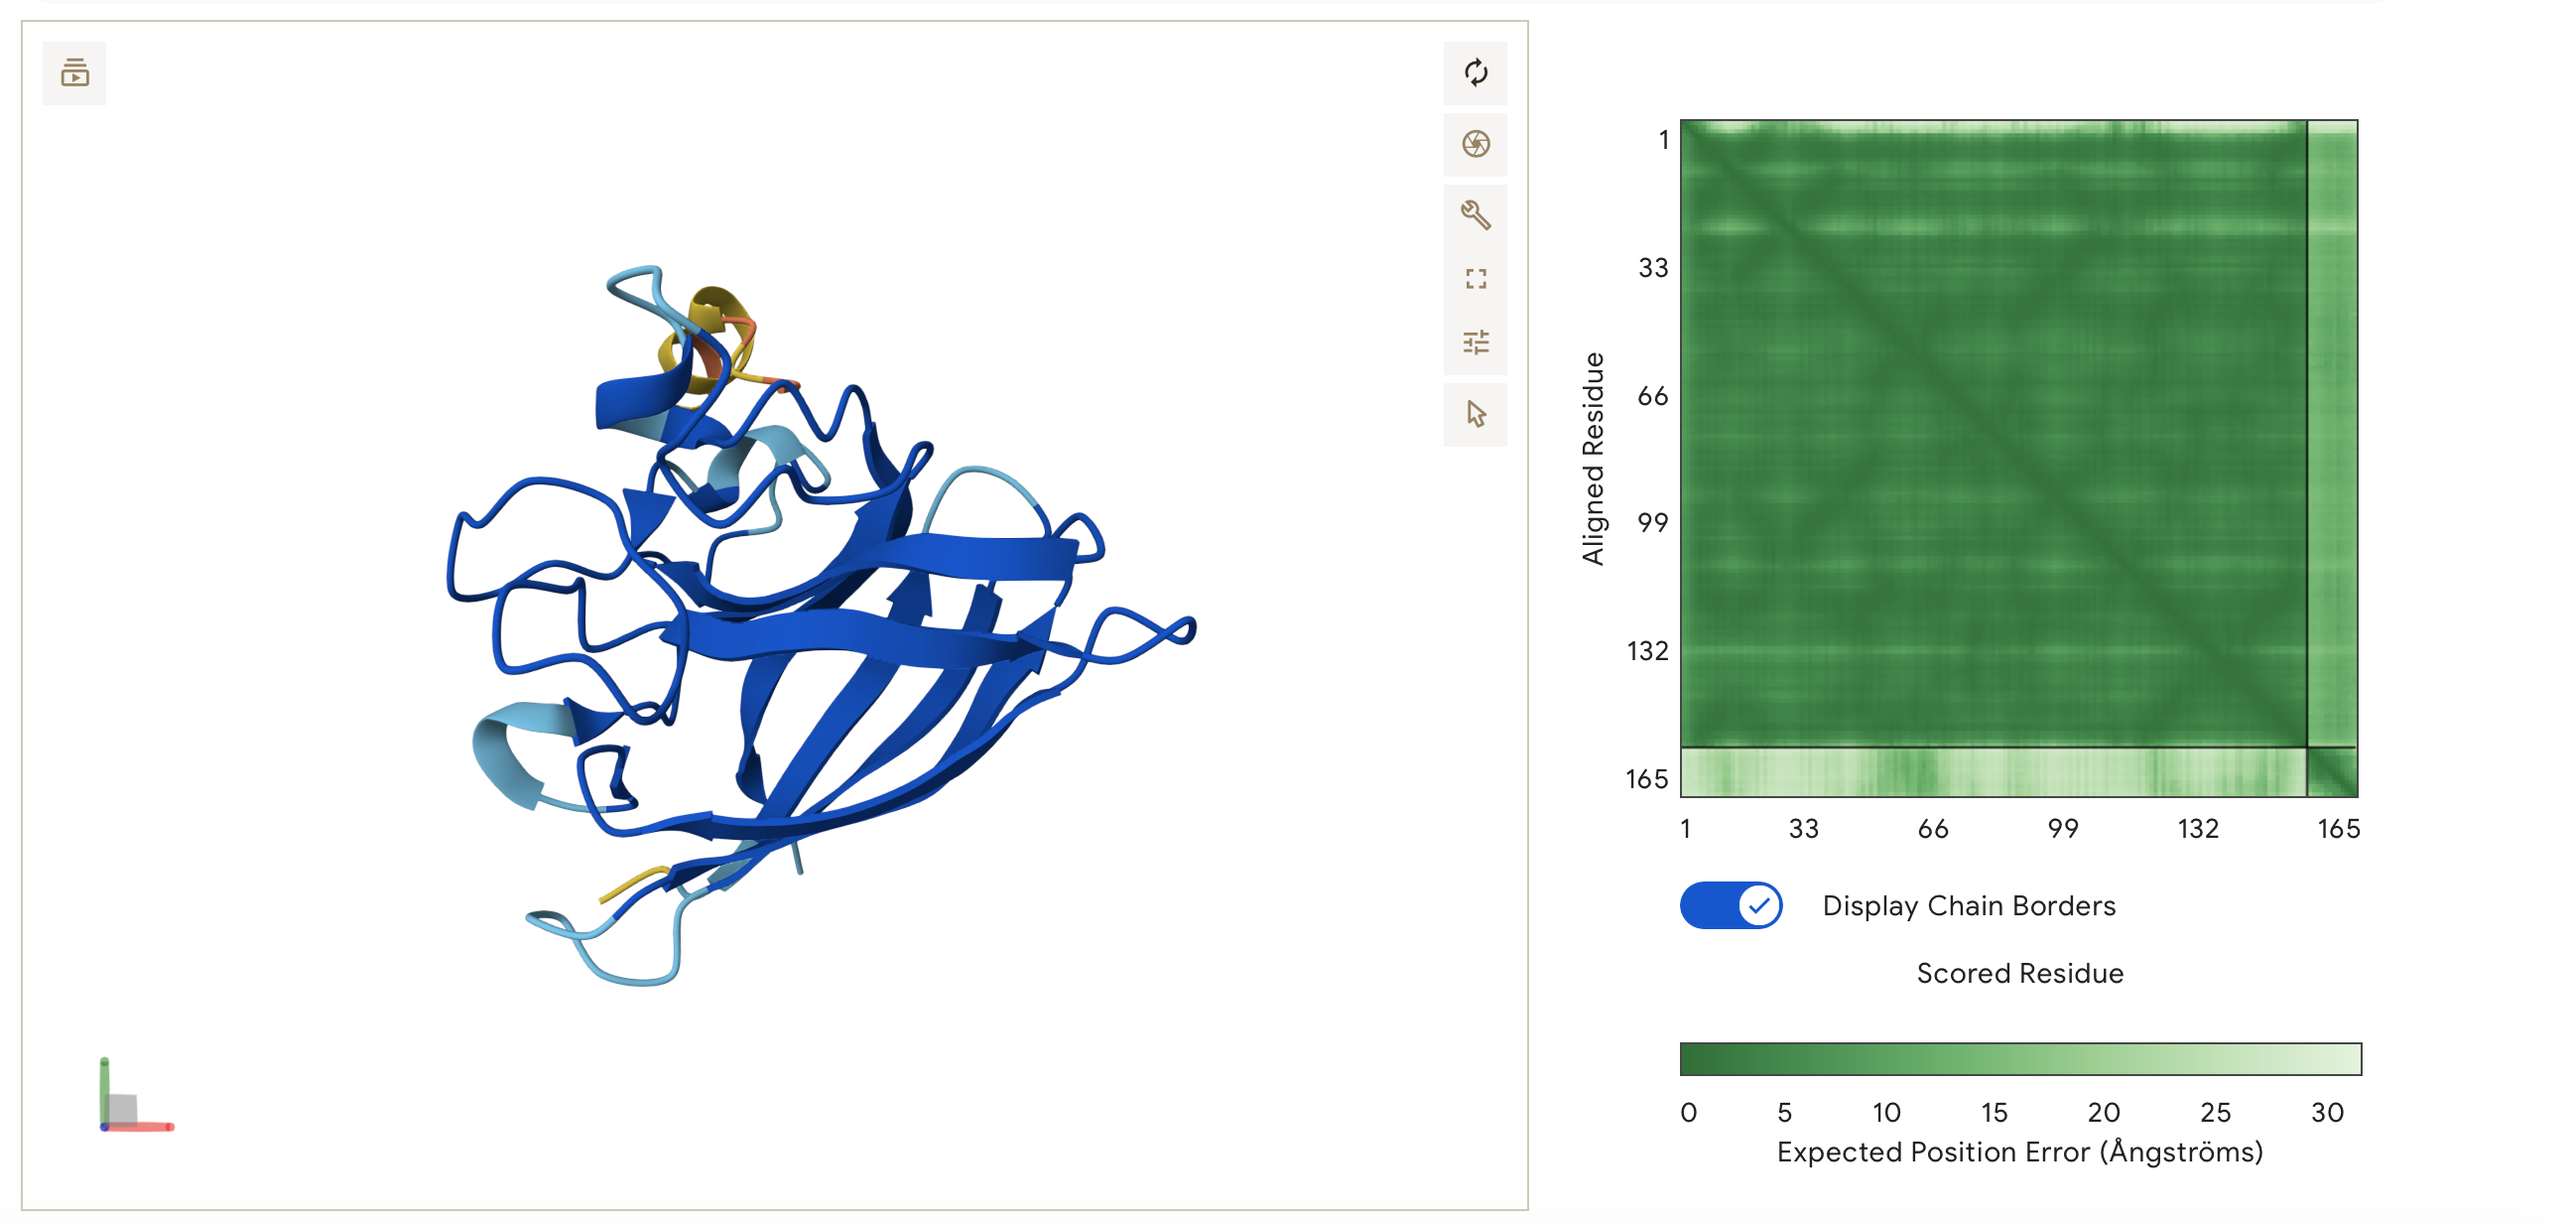
ipTM = 0.35, pTM = 0.83
Low Confidence: A ipTM score of 0.35 suggests that AlphaFold is struggling to find a stable, locking interaction between the peptide and the SOD1 protein. AlphaFold is not confident that the peptide is actually binding to it in a meaningful way as approx 0.5 score or higher would suggest a real interaction.
High pTM: However, the high pTM of 0.83 means AlphaFold is very confident that the SOD1 protein itself is folded correctly.
This is reflected in the visualisation. The peptide MKLLLLELQLKI does not appear to bind. It is predicted by Alphafold to float in the solvent space near the protein. It is not localised near the N-terminus and remains disassociated from the B-barrel and dimer interface.
Binder 2: MKKLLLELRKIL
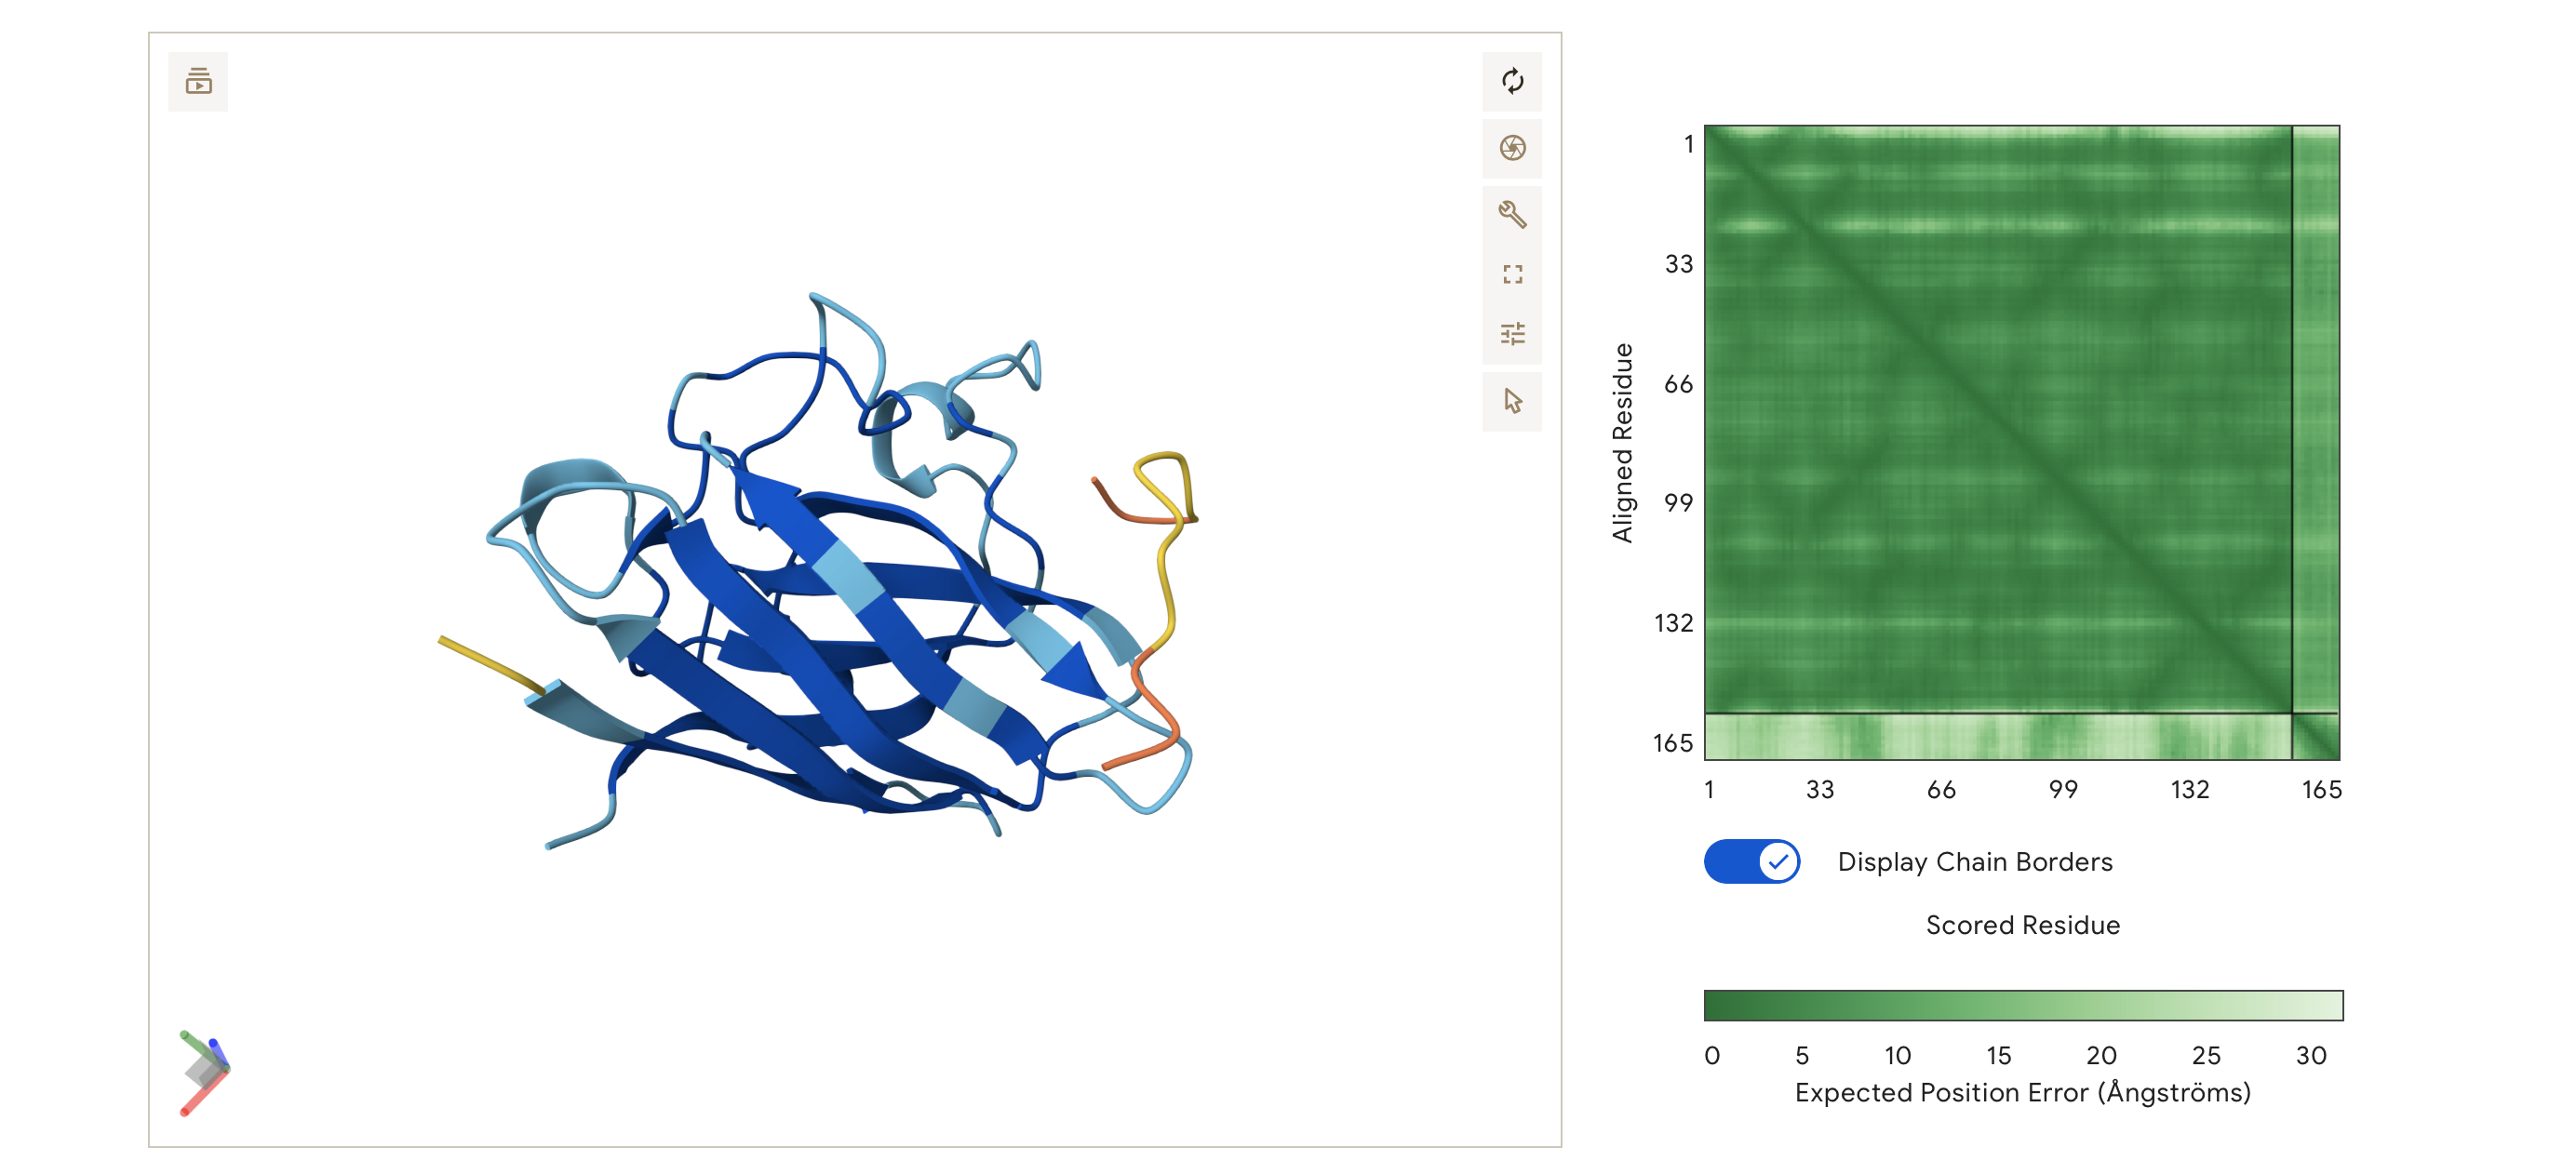
ipTM = 0.46, pTM = 0.78
Low confidence: Binder 2’s ipTM score is slightly higher at 0.46 but still a non-binder and the peptide is disassociated for the main SOD1 protein body.
It does not localise to any specific region it is distant from both terminuses and is unbound from the protein surface.
Binder 3: SSKILLEAQLKK
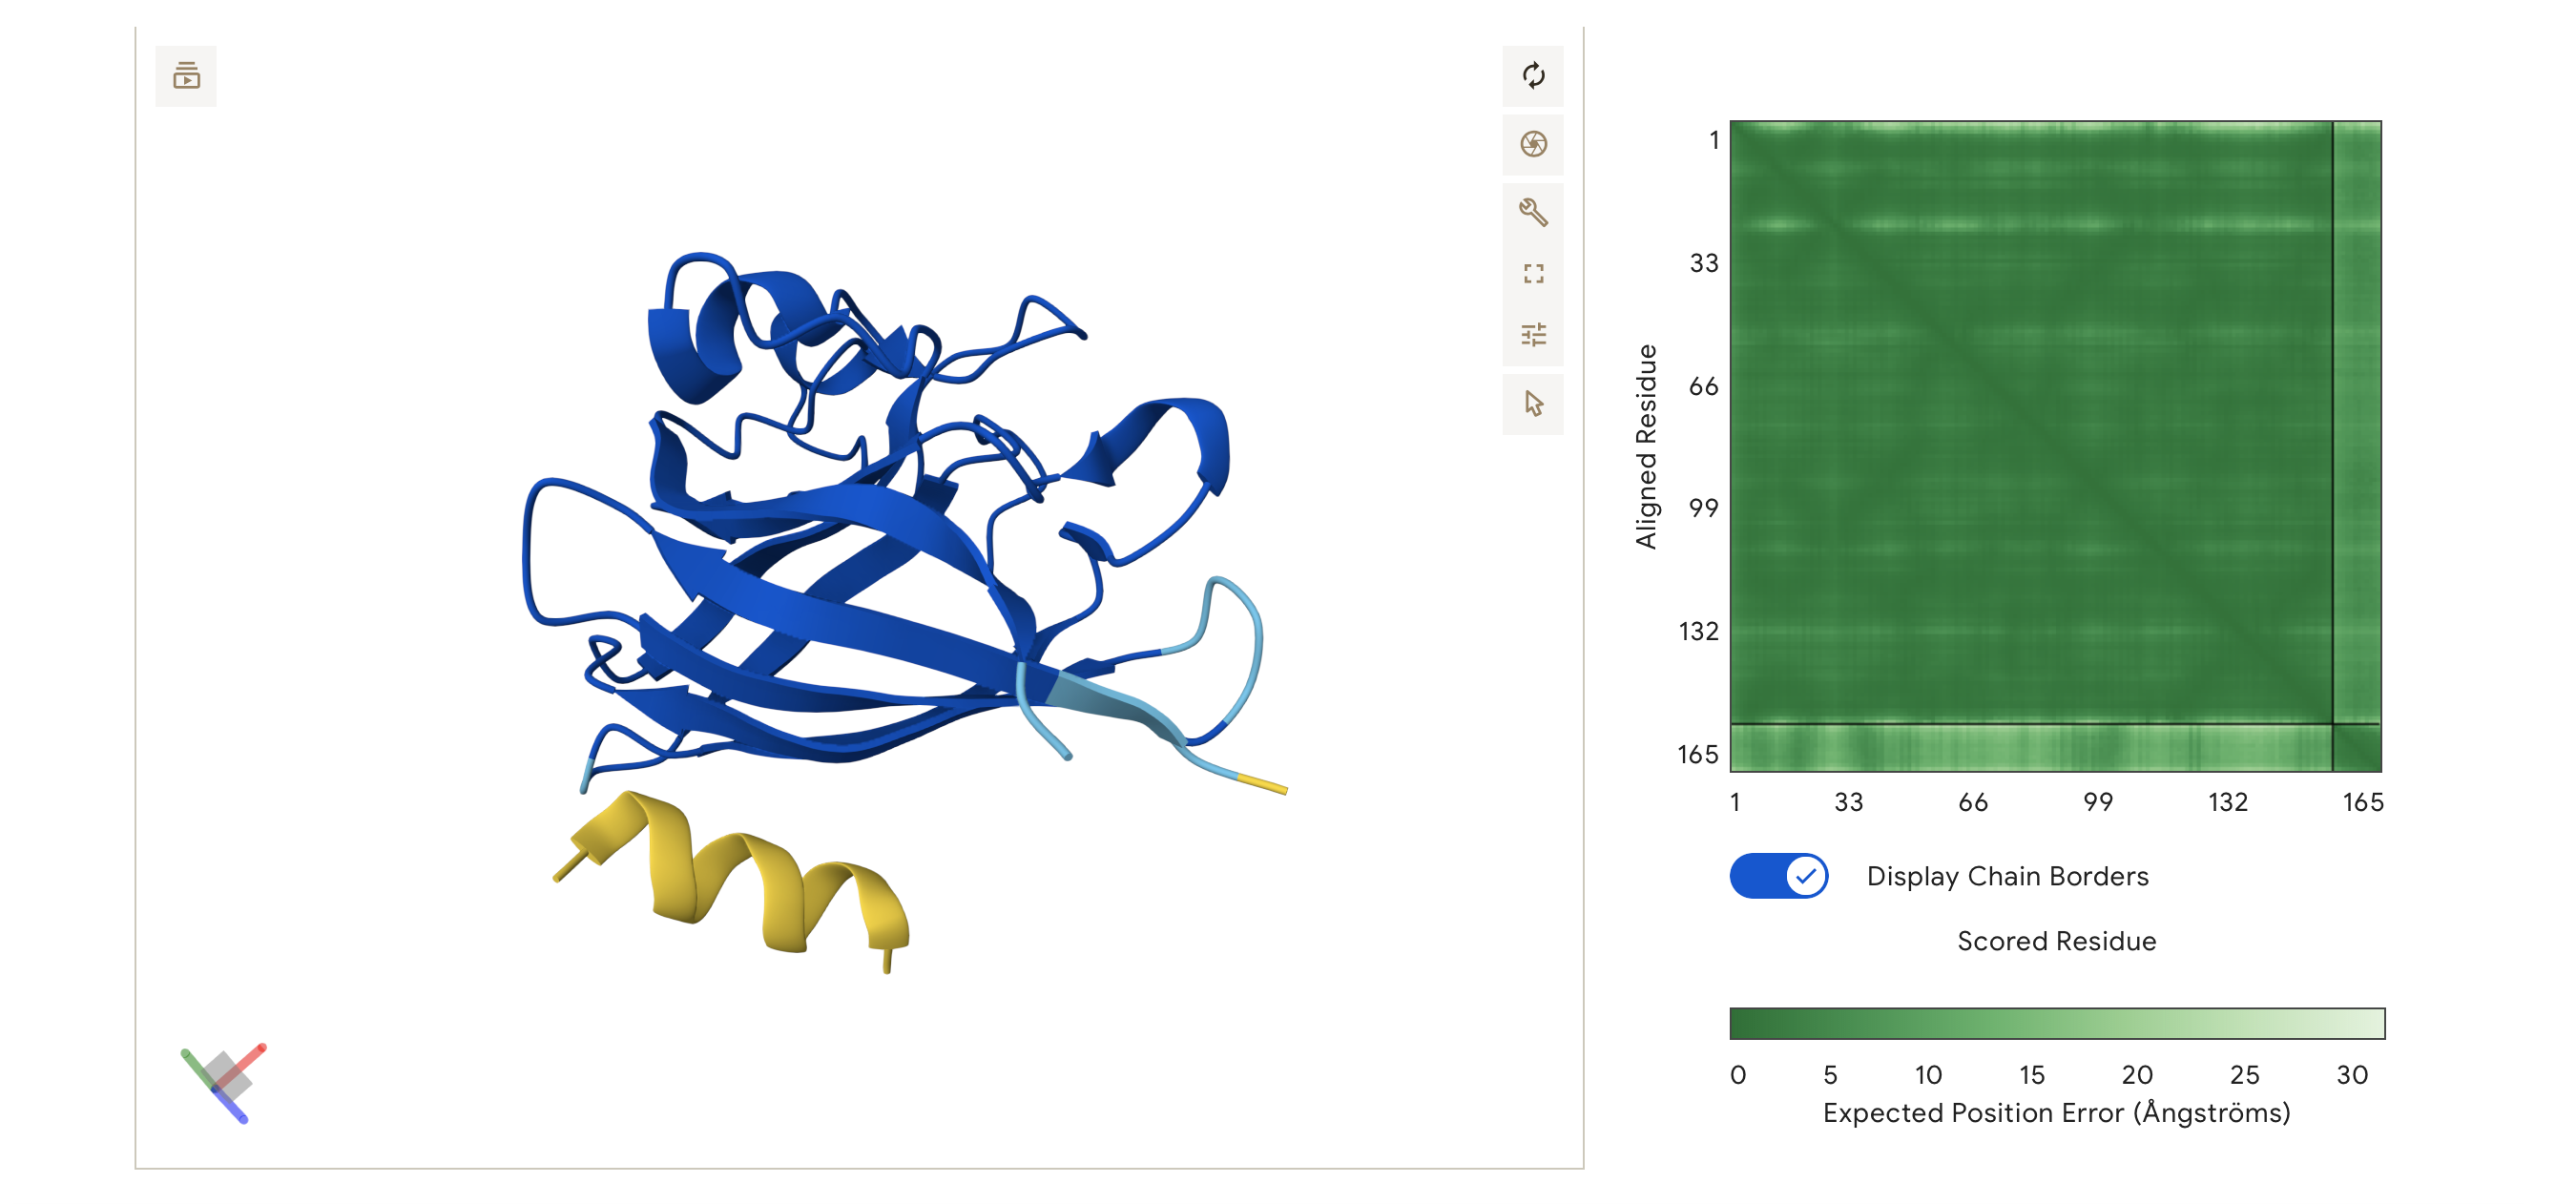
ipTM = 0.64, pTM = 0.9
Moderate Confidence Even though the 3D viewer shows the peptide and the protein structure as separate, the ipTM score is 0.64 which is significantly higher than my previous binders scores, showing that AlphaFold has found a statistically likely docking spot but the peptide might be loosely held.
The pTM is also very high, meaning the SOD1 structure is extremely stable in this simulation.
The peptide appears to localise near the N-terminus of the SOD1 protein and the A4V mutation. It hovers parallel to the first few flexible loops of the N-terminus and the initial strands of the b-barrel. The peptide is surface-bound, following the contour of the protein surface but maintaining a slight gap in the predicted structure.
Binder 4: SSTLLEQLLLLK
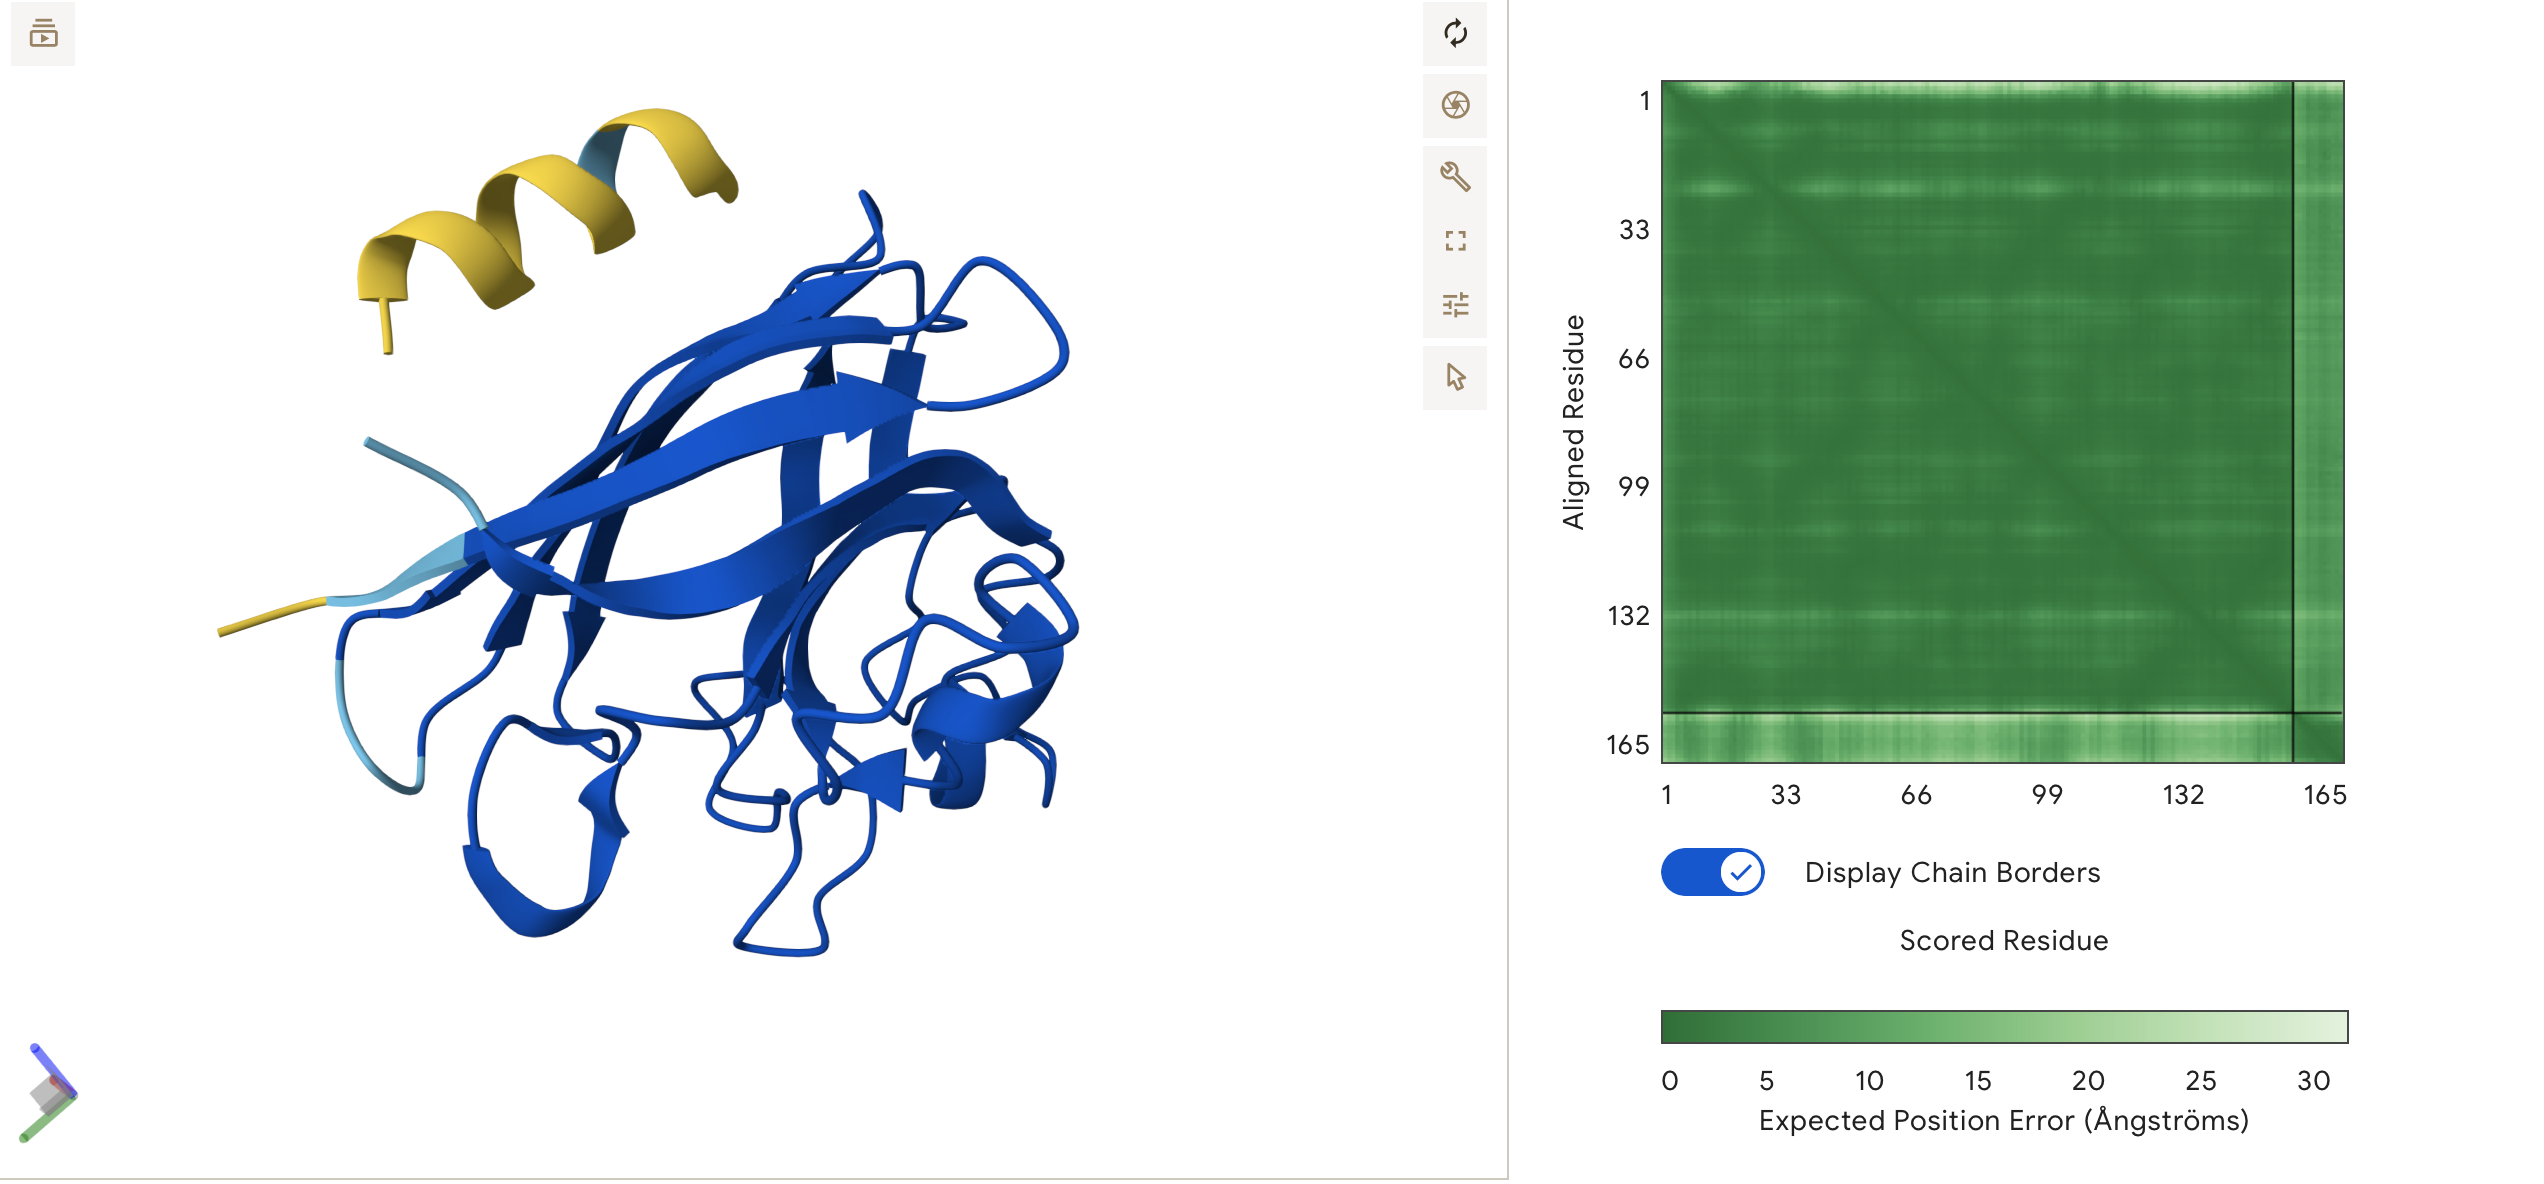
ipTM = 0.6, pTM = 0.9
Very similar results to Binder 3. Again a moderate confidence suggesting more docking potential between the binder and the protein.
This peptide localizes near to the N-terminus and A4V mutation. The peptide forms a helix that sits parallel to the first few beta-sheets of the barrel, remaining surface-bound and floating.
The consistency between Binders 3 and 4 suggests a clear preference for the N-terminal region when using these Serine/Leucine-rich sequences.
Control Binder: FLYRWLPSRRGG
ipTM = 0.35, pTM = 0.83
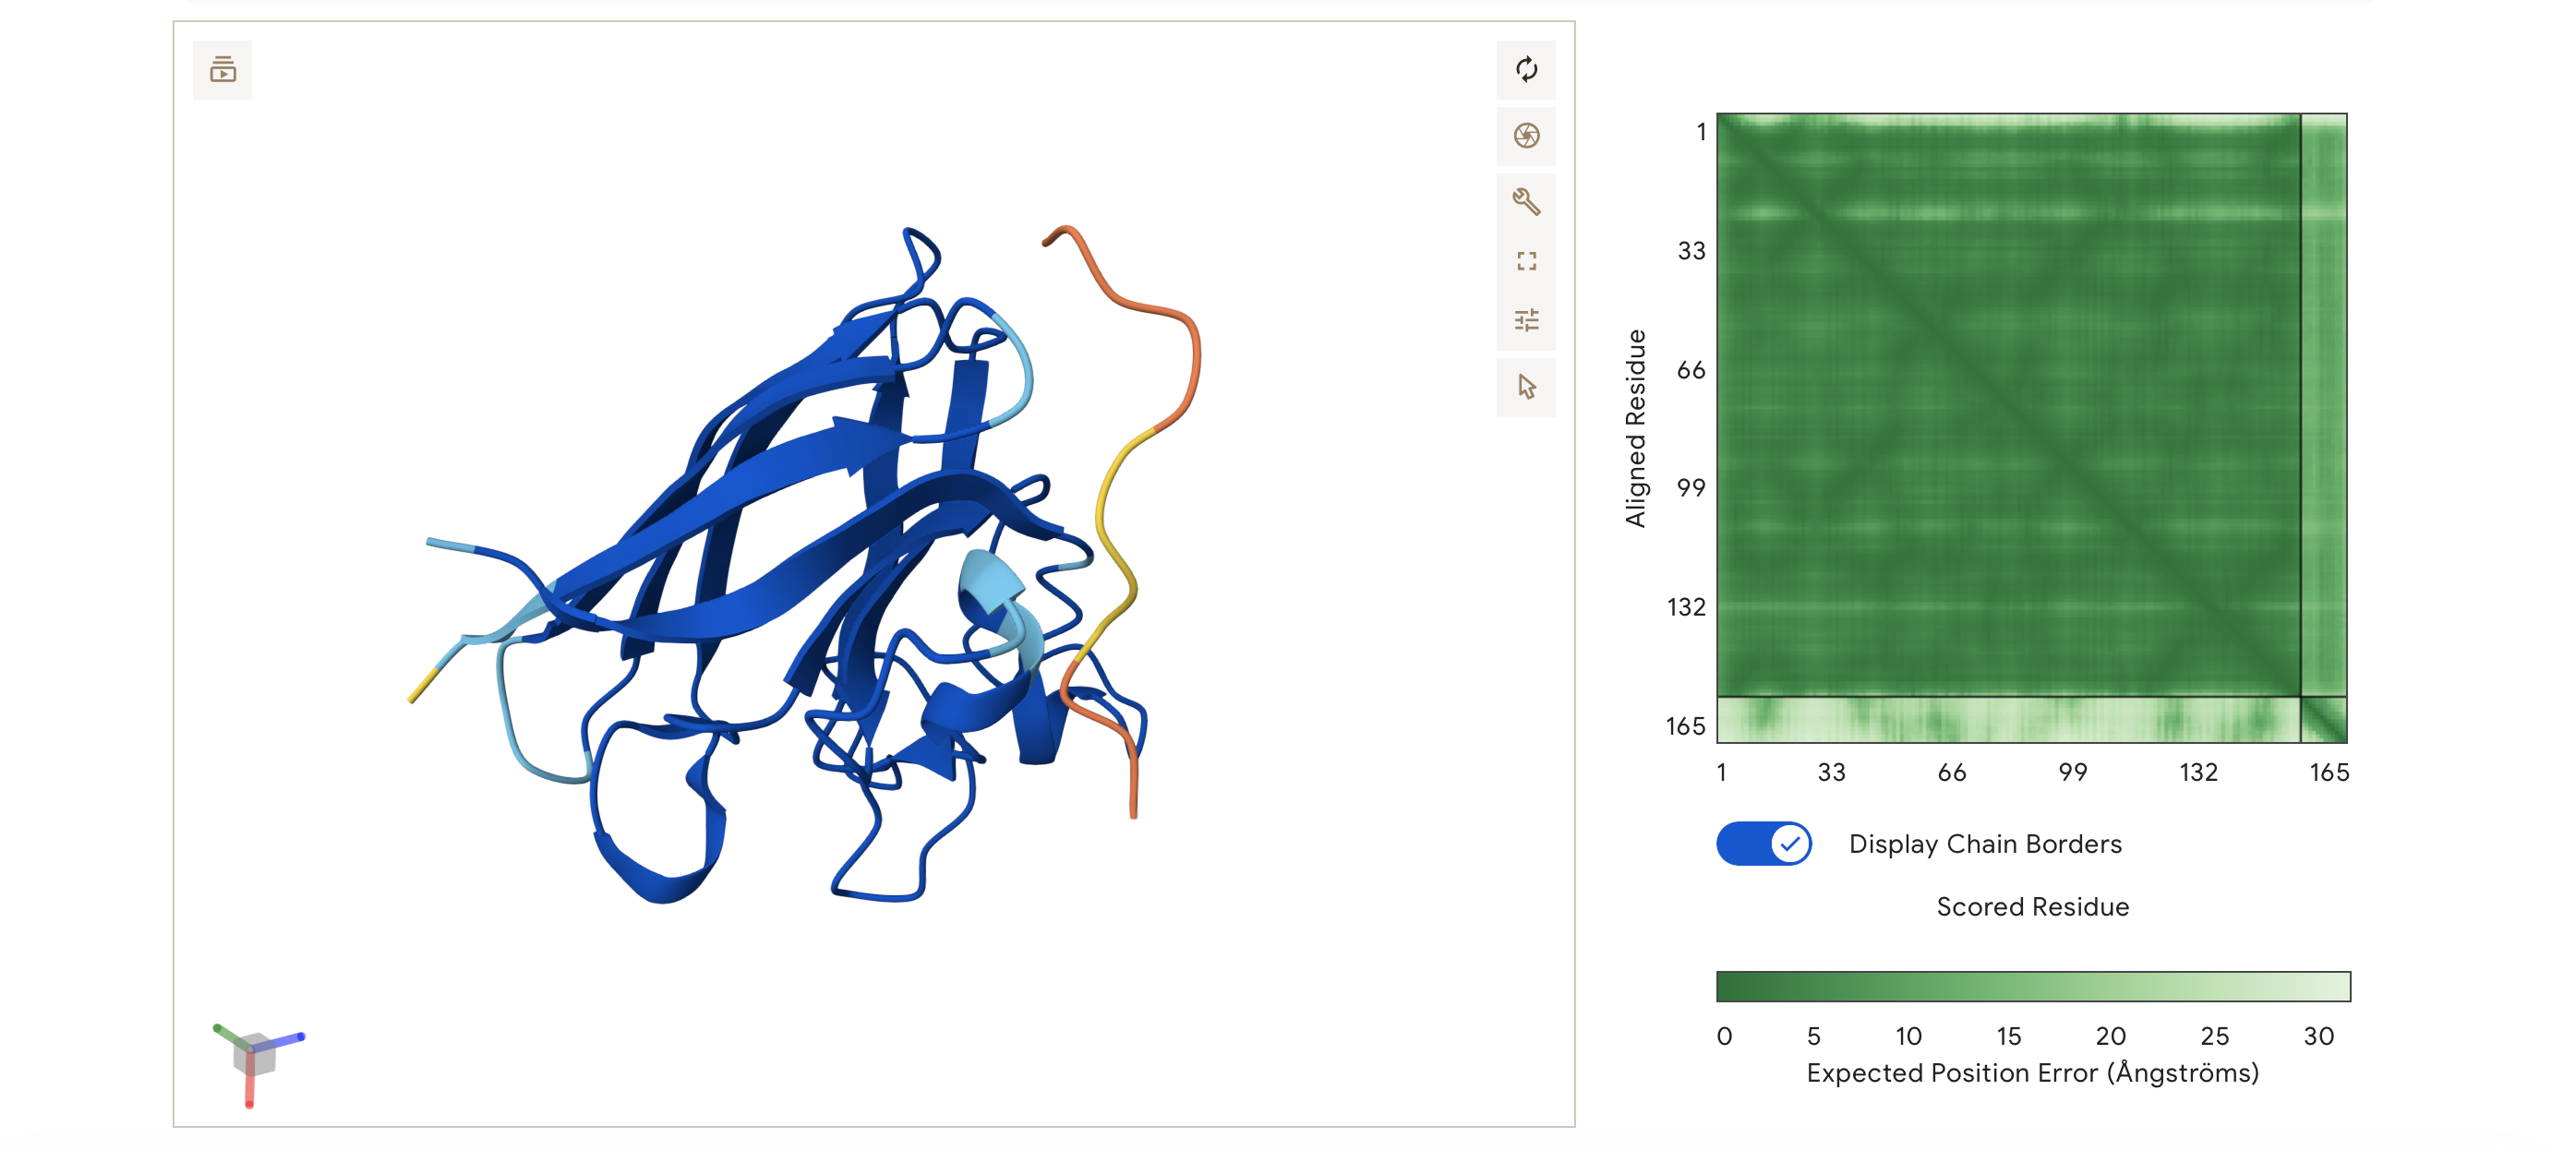
ipTM = 0.35, pTM = 0.83
The peptide does not localise near to the N-terminus. Instead, it hovers on the opposite side of the protein, away from the A4V mutation site. Like Binders 1 and 2, it appears dissociated/unbound in this specific simulation, not engaging the β-barrel.
Despite being a known binder, the control has the lowest score of the ones I have tested all my generated peptides matched or exceeded the control binder.
Part 3: Evaluate Properties of Generated Peptides in the PeptiVerse
Binder 1: MKLLLLELQLKI
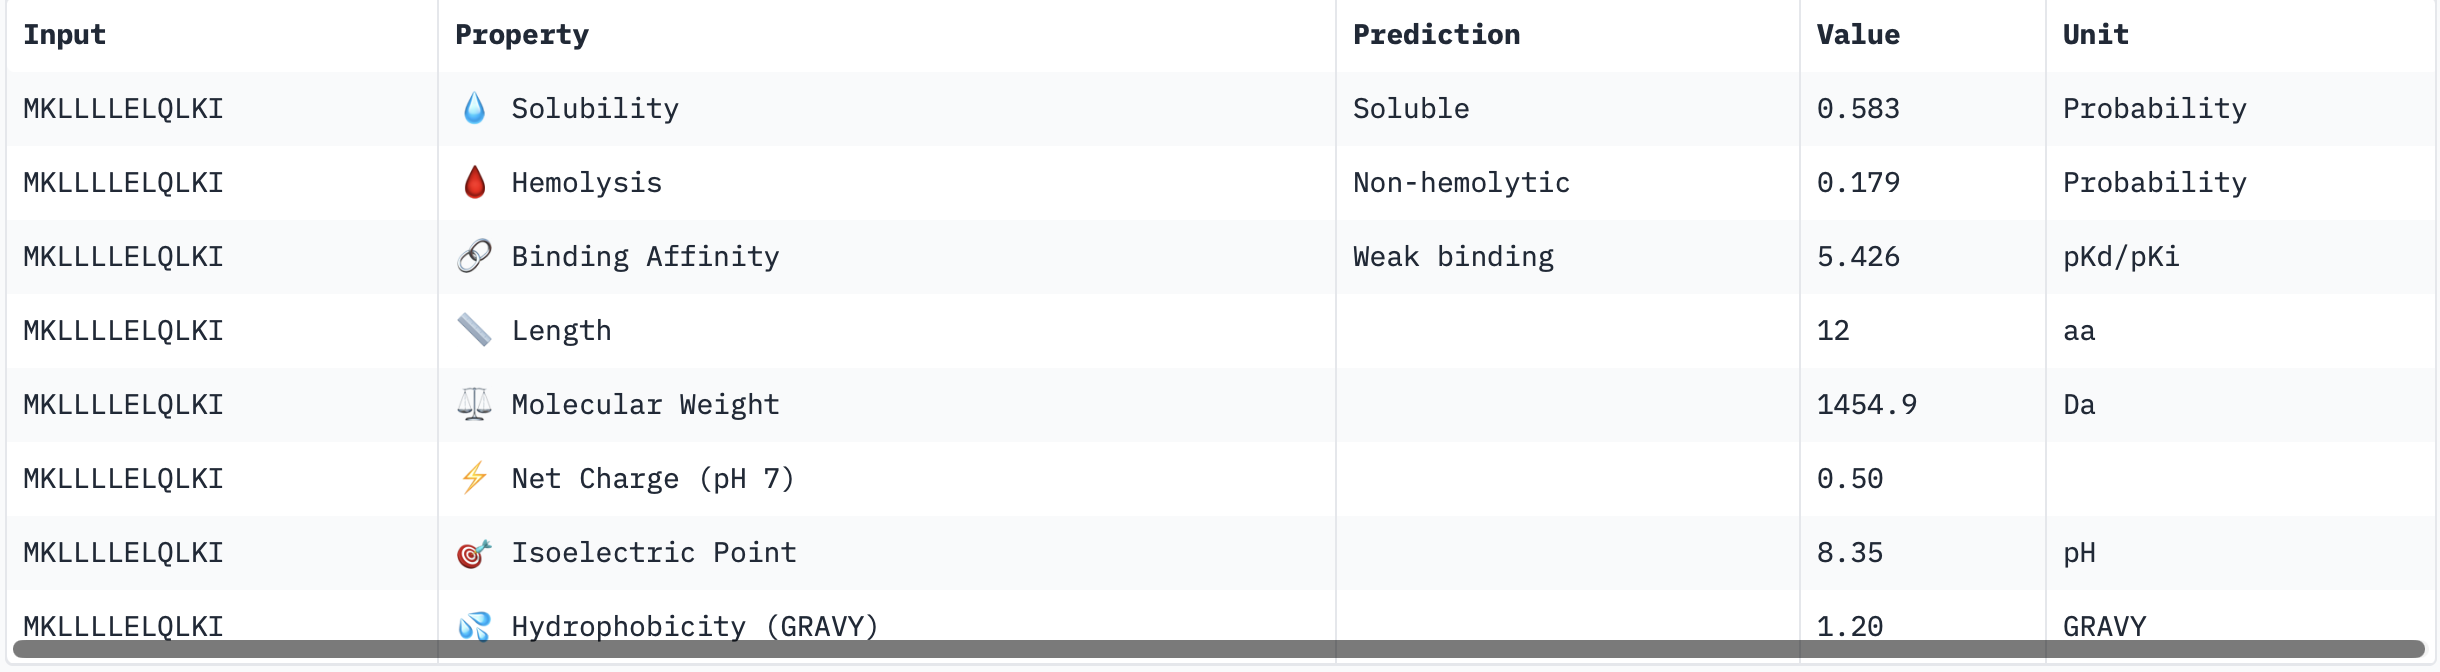
Binder 2: MKKLLLELRKIL
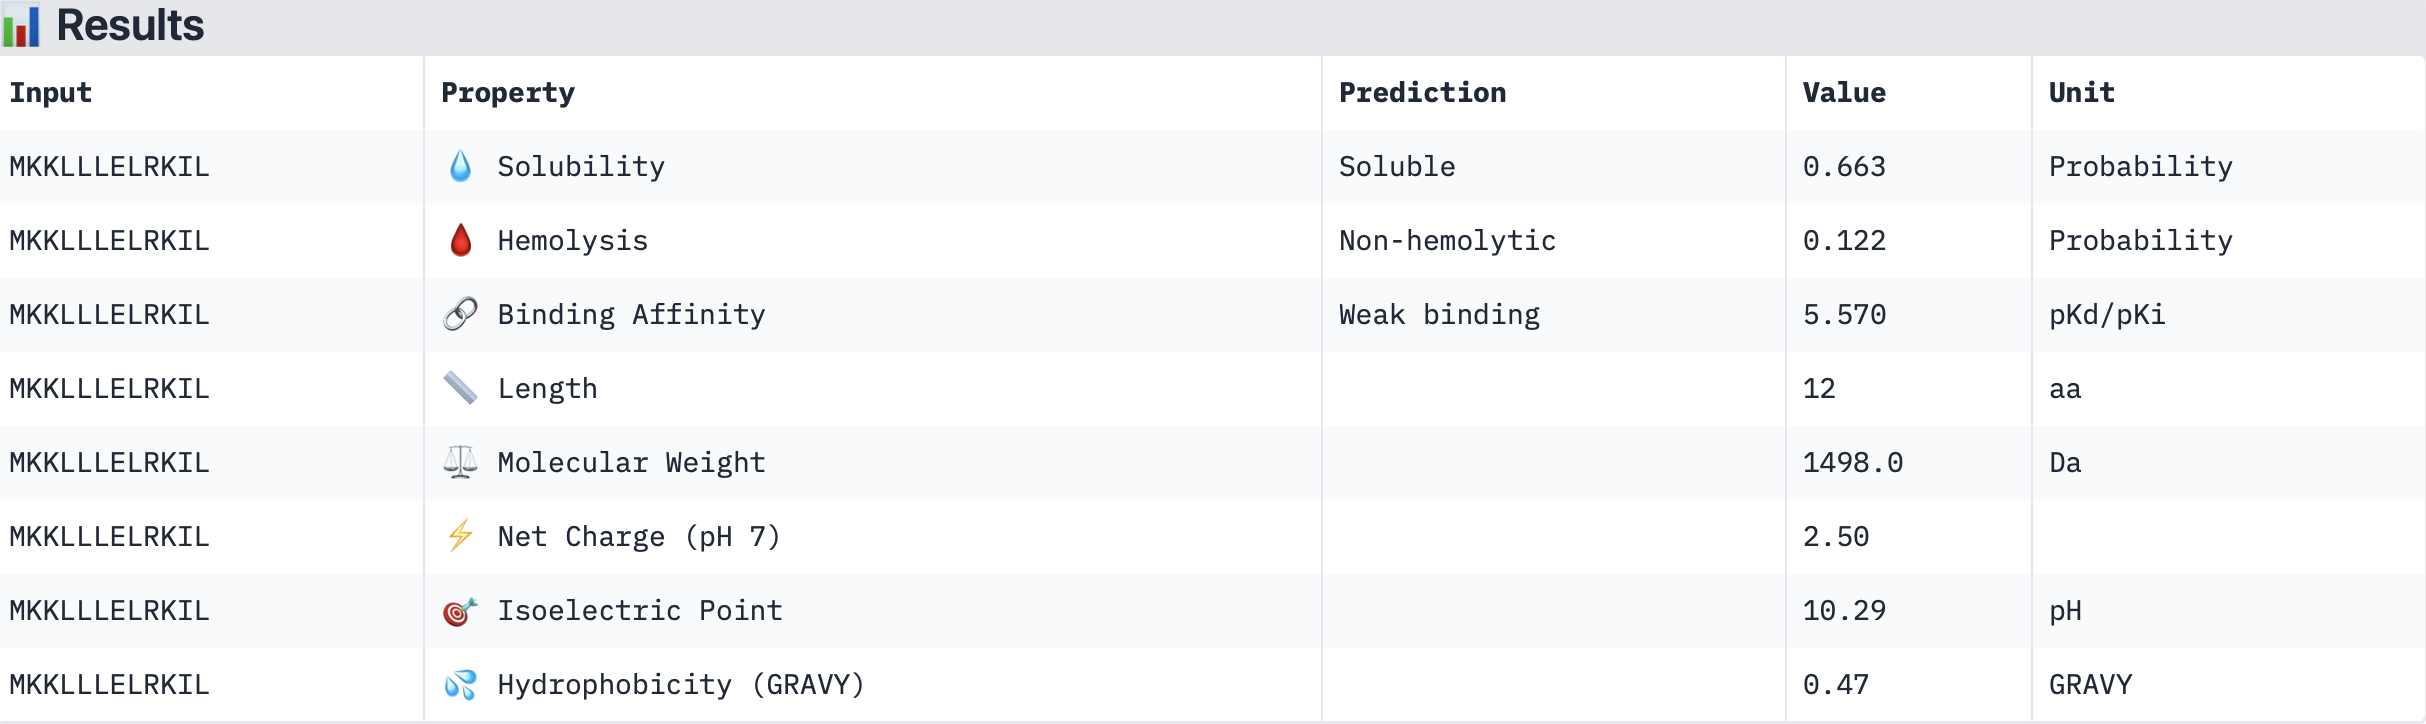
Binder 3: SSKILLEAQLKK
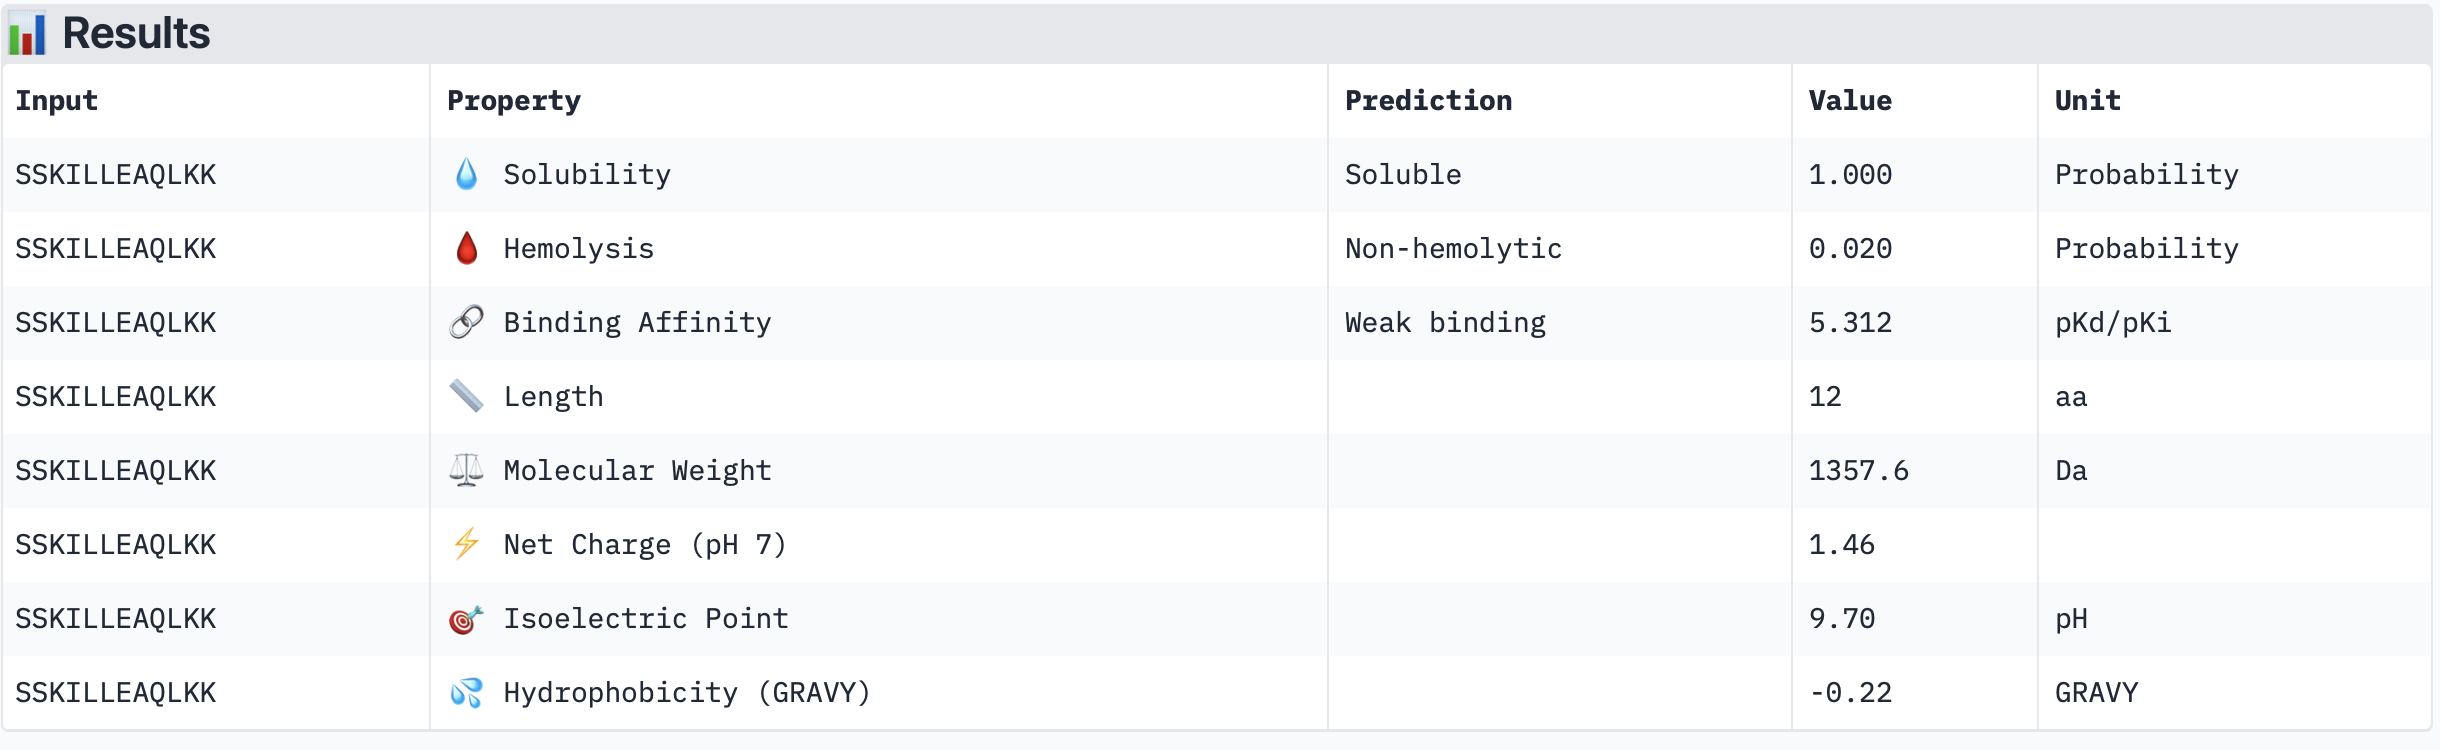
Binder 4: SSTLLEQLLLLK
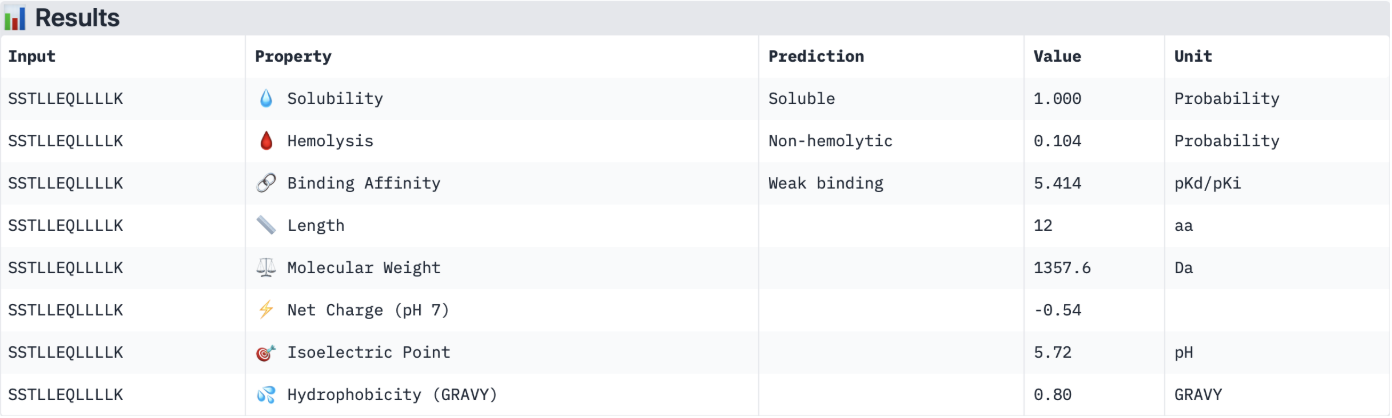
The PeptiVerse results for predicted affinity show a divergence with the structural confidence scores from AlphaFold. Binder 3 (SSKILLEAQLKK) has the highest structural confidence (ipTM = 0.64) of my generated binders and a clear localisation near to the N-terminus. However, PeptiVerse suggests it has the lowest predicted binding affinity (5.312 pKd/pKi). Conversely, Binder 2 (MKKLLLELRKIL) had the highest predicted affinity (5.570 pKd/pKi) but the lower structural confidence (ipTM = 0.46) and a unbound structure in AlphaFold.
All four peptides are predicted to be soluble and non-hemolytic, with Binders 3 and 4 reaching perfect solubility scores (1.000 probability). While Binder 2 offers the highest binding affinity, its lower ipTM suggests it may not target the A4V mutation site specifically. In contrast, Binder 3 offers a superior structural fit near the N terminus and possesses a favourable cationic charge (+1.46) and the lowest hemolysis risk (0.020), making it the most stable and safe candidate in an aqueous physiological environment.
Therefore, I would advance Binder 3 (SSKILLEAQLKK) for further development. While its predicted chemical affinity is slightly lower than Binder 2, its high structural confidence (ipTM 0.64) and specific localization to the A4V mutation site (N-terminus) make it a more promising lead for targeted ALS therapy. Furthermore, its perfect solubility and negligible hemolytic probability suggest an excellent safety profile, providing a stable scaffold that can be chemically optimized to enhance its binding strength in future iterations.
Part 4: Generate Optimized Peptides with moPPIt
While PepMLM generates binders based on the general language of the protein sequence, I used moPPIt to engineer a peptide that specifically recognises the A4V mutation site. By setting the target motif to residues 1-6 (mutation in position 4), I focused the design on the motif around the N-terminal where the toxic mis-folding begins in diseases such as ALS.
I selected 3 samples and chose the objectives:
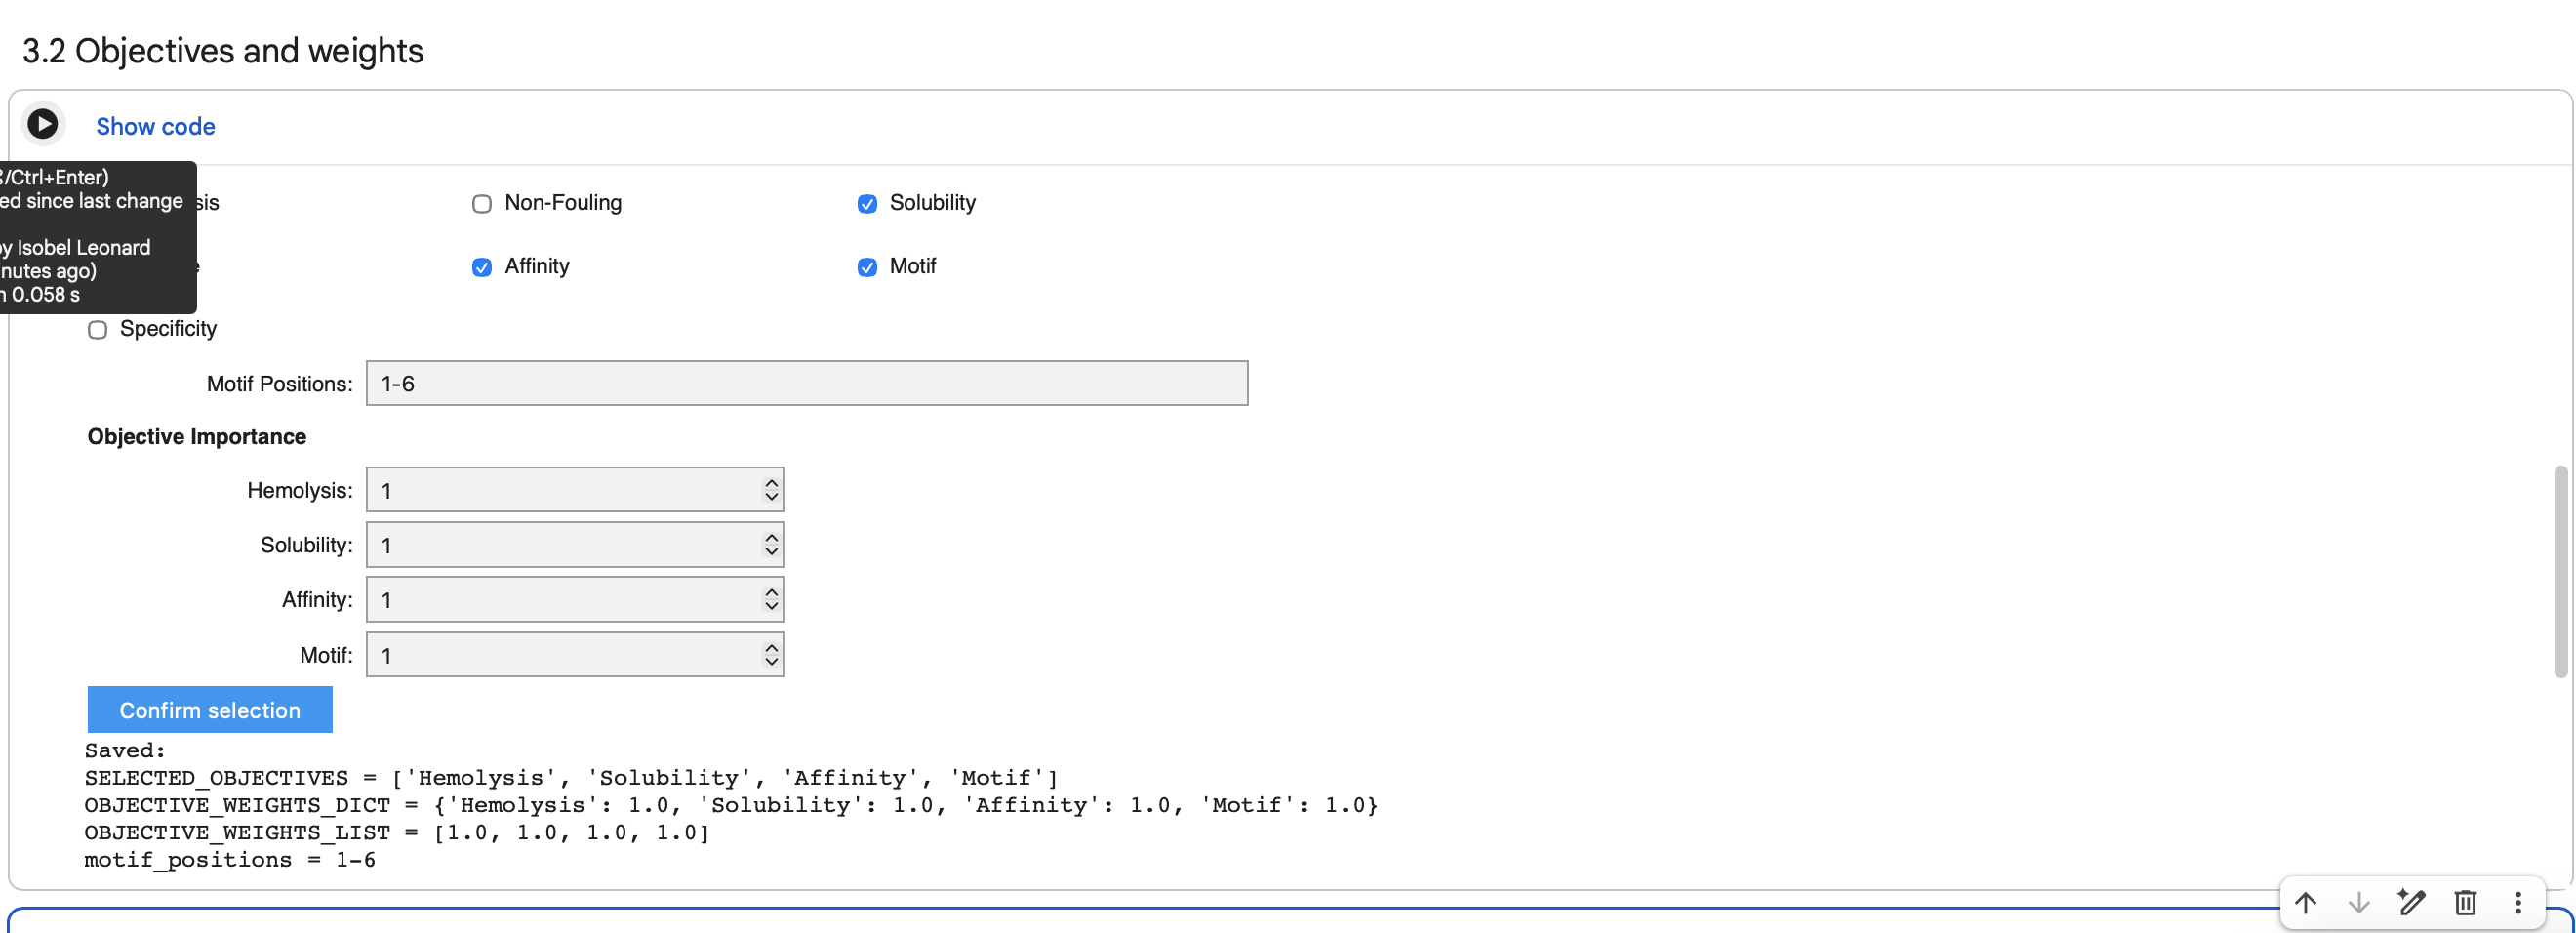
Affinity: Prioritized sequences with high predicted binding strength.
Motif: Forced the interaction to occur at residues 1-6 (the N-terminus).
Solubility: Ensured the peptide remains stable in aqueous environments.
Hemolysis: Filtered out sequences with potential toxicity to red blood cells.
Binder Generation:
| Binder | Hemolysis | Solubility | Affinity | Motif |
|---|---|---|---|---|
| KWTFKFEKQKQK | 0.9835032857954502 | 0.75 | 5.448083400726318 | 0.8681516647338867 |
| KKKISVTAKNGY | 0.9790930487215519 | 0.75 | 6.005250930786133 | 0.5721415281295776 |
| LQKCIELKLTTP | 0.9543265551328659 | 0.5833333134651184 | 5.929729461669922 | 0.8600120544433594 |
Briefly describe how these moPPit peptides differ from your PepMLM peptides.
Compared with the PepMLM peptides the moPPIt peptides look quite different. The earlier PepMLM candidates were heavily enriched in Leucine (L) (e.g., MKLLLLELQLKIand MKKLLLELRKIL), which were likely chosen to mimic common natural hydrophobic cores. In contrast, moPPIt binder 1 (KWTFKFEKQKQK) and moPPIt binder 2 (KKKISVTAKNGY) are heavily enriched with Lysine and Arginine. This shifts towards a high positive charge density, possibly as a result of choosing to target optimise for solubility and hemolysis.
This shift makes sense because moPPIt was run with an explicit multi objective targeting objective (Affinity, Solubility, Hemolysis, and Motif) rather than using sequence conditioned generation based on behaviour most like general surface binders, where as moPPIt was used here to focus peptide design toward the N-terminal A4V mutation region of SOD1.
How would you evaluate these peptides before advancing them to clinical studies?
Predict their structures with AlphaFold-Multimer to verify the high motif scores (0.86). Check if moPPIt binders achieve an ipTM score higher than 0.64 (my previous best from PepMLM) and translate to a physical dock at the residues 1–6 N-terminal site.
Check the new binders with PeptiVerse, check the Net Charge, Molecular weight and Isoelectric Point (pI) of the new binders as well as re-validating the solubility, affinity and hemolysis scores from moPPit.
If the computational results hold, use Surface Plasmon Resonance (SPR) to measure the actual Equilibrium Dissociation Constant. Compare the binding affinity of the new binders to wild-type SOD1 vs the A4V Mutant.
Perform a standardised red blood cell assay to confirm the moPPIt prediction of non-hemolytic. Additionally, perform a Serum Stability Assay by incubating the peptides in human serum to determine their half-life and susceptibility to protease degradation.
Test the peptides in SOD1 aggregation assays (cell-free or cell-based) to see if binding actually prevents the formation of toxic protein aggregates.
The most successful candidates would advance to an ALS mouse model.
PART C: Final Project: L-Protein Mutants
The objective is to improve the stability and autofolding of the lysis protein.
Option 1: Mutagenesis
Lysis Protein Sequence (UniProtKB ID: https://www.uniprot.org/uniprotkb/P03609/entry) (75 residues)
METRFPQQSQQTPASTNRRRPFKHEDYPCRRQQRSSTLYVLIFLAIFLSKFTNQLLLSLLEAVIRTVTTLQQLLT
Lysis protein contains a soluble N-terminal domain followed by a transmembrane protein (last 35 residues).
Transmembrane protein affects the lysis activity.
The soluble domain is the domain responsible for interaction with DnaJ.
METRFPQQSQQTPASTNRRRPFKHEDYPCRRQQRSSTLYV(Soluble: 1–40)LIFLAIFLSKFTNQLLLSLLEAVIRTVTTLQQLLT(Transmembrane: 41–75)
| Domain | Residues | Sequence Length | Goal |
|---|---|---|---|
| Soluble Domain | 1 – 40 | 40 residues | Overcome DnaJ dependency (Folding) |
| Transmembrane | 41 – 75 | 35 residues | Increase Lysis Speed (Pore formation) |
DnaJ sequence (UniProtKB ID: https://www.uniprot.org/uniprotkb/P03609/entry)
MAKQDYYEILGVSKTAEEREIRKAYKRLAMKYHPDRNQGDKEAEAKFKEIKEAYEVLTDSQKRAAYDQYGHAAFEQGGMGGGGFGGGADFSDIFGDVFGDIFGGGRGRQRAARGADLRYNMELTLEEAVRGVTKEIRIPTLEECDVCHGSGAKPGTQPQTCPTCHGSGQVQMRQGFFAVQQTCPHCQGRGTLIKDPCNKCHGHGRVERSKTLSVKIPAGVDTGDRIRLAGEGEAGEHGAPAGDLYVQVQVKQHPIFEREGNNLYCEVPINFAMAALGGEIEVPTLDGRVKLKVPGETQTGKLFRMRGKGVKSVRGGAQGDLLCRVVVETPVGLNERQKQLLQELQESFGGPTGEHNSPRSKSFFDGVKKFFDDLTR
Generating mutated sequences:
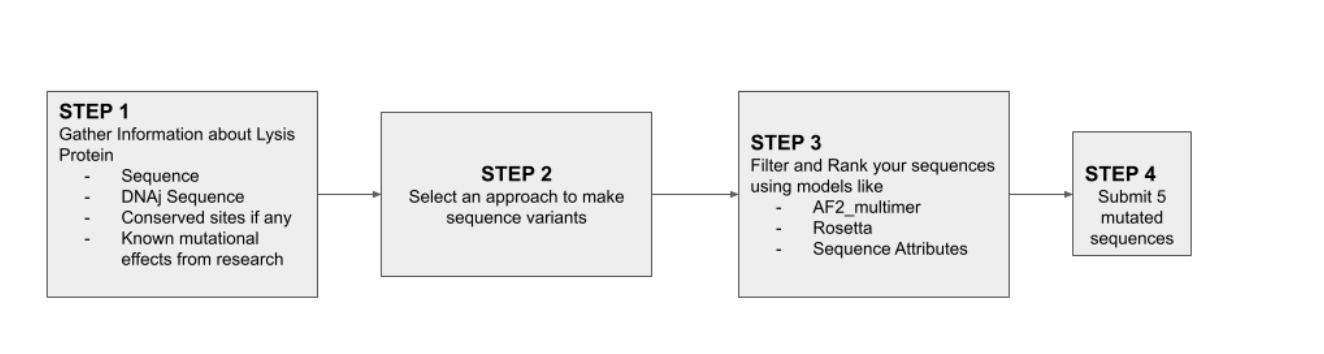
First I input the L-protein sequence into the ESM collab and ran a zero-shot mutational scan. This will result in a log-likelihood ratio (LLR) score for substituting each amino acid at each position in the L-protein sequence.
The LLR score can either be positive or negative for the protein.
Positive scores (>0): The protein language model has confidence in the mutation vs the existing amino acid. It suggests the change is likely stabilising or fits well within the protein
Negative score (<0): The protein language model has low confidence in the mutation. It suggests the change is likely destabilising or could break the protein’s structure.
This is the heat map generated. The colour relates to the predicted LLR score meaning the results range from brighter yellow as most favourable to the darker purple as least favourable.
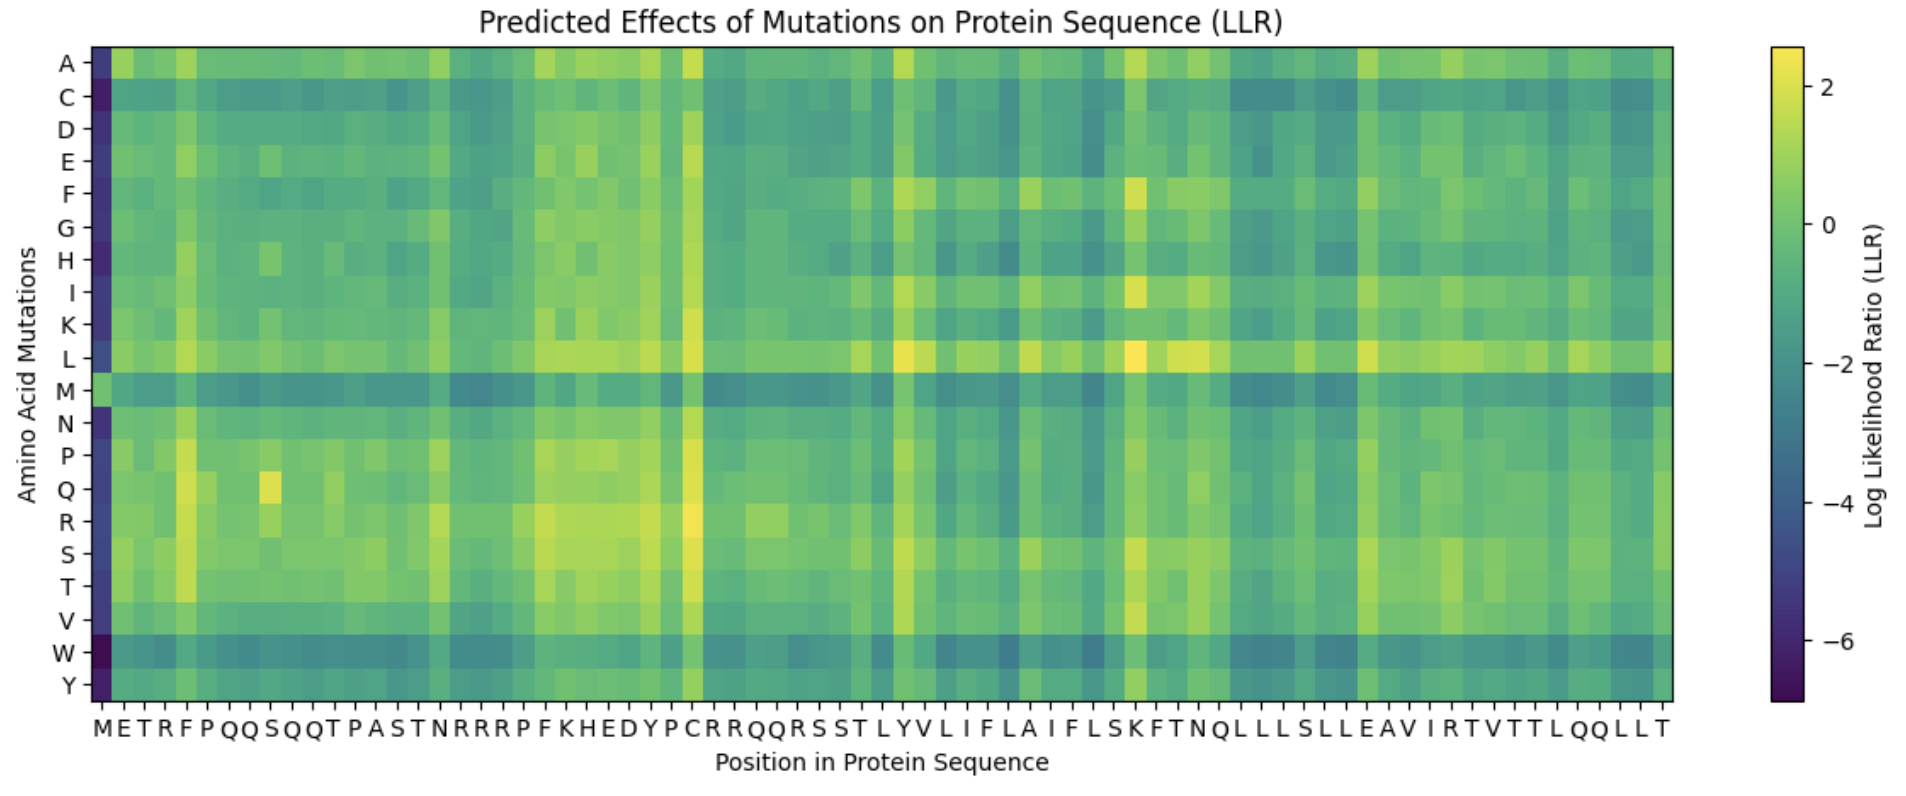
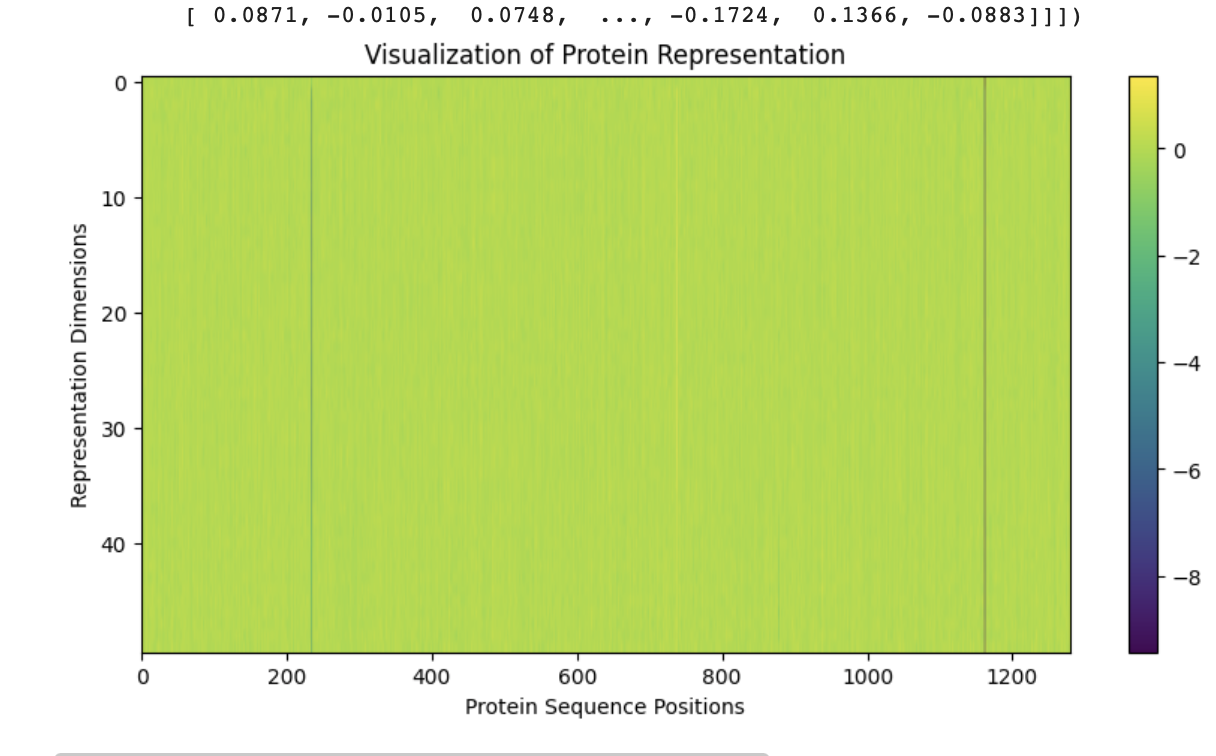
Top 20 L-protein Mutation Scores
| Position | Wild Type AA | Mutation AA | LLR Score | Domain |
|---|---|---|---|---|
| 50 | K | L | 2.561 | TM |
| 29 | C | R | 2.395 | Soluble |
| 39 | Y | L | 2.242 | Soluble |
| 29 | C | S | 2.043 | Soluble |
| 9 | S | Q | 2.014 | Soluble |
| 29 | C | Q | 1.997 | Soluble |
| 29 | C | P | 1.971 | Soluble |
| 29 | C | L | 1.961 | Soluble |
| 50 | K | I | 1.929 | TM |
| 53 | N | L | 1.865 | TM |
| 61 | E | L | 1.818 | TM |
| 52 | T | L | 1.814 | TM |
| 50 | K | F | 1.802 | TM |
| 29 | C | T | 1.797 | Soluble |
| 29 | C | K | 1.796 | Soluble |
| 5 | F | Q | 1.795 | Soluble |
| 5 | F | R | 1.660 | Soluble |
| 29 | C | A | 1.649 | Soluble |
| 27 | Y | R | 1.628 | Soluble |
| 22 | F | R | 1.602 | Soluble |
| 5 | F | P | 1.597 | Soluble |
| 50 | K | V | 1.595 | TM |
| 50 | K | S | 1.575 | TM |
| 5 | F | T | 1.559 | Soluble |
| 5 | F | S | 1.556 | Soluble |
| 45 | A | L | 1.539 | TM |
| 39 | Y | S | 1.517 | Soluble |
| 27 | Y | S | 1.497 | Soluble |
| 40 | V | L | 1.478 | Soluble (End) |
| 27 | Y | L | 1.475 | Soluble |
| 22 | F | S | 1.423 | Soluble |
| 29 | C | E | 1.383 | Soluble |
| 39 | Y | A | 1.365 | Soluble |
| 29 | C | N | 1.363 | Soluble |
| 50 | K | A | 1.358 | TM |
| 29 | C | I | 1.344 | Soluble |
| 5 | F | L | 1.333 | Soluble |
| 17 | N | R | 1.324 | Soluble |
| 39 | Y | I | 1.320 | Soluble |
| 39 | Y | T | 1.303 | Soluble |
| 26 | D | R | 1.269 | Soluble |
| 29 | C | H | 1.246 | Soluble |
| 39 | Y | F | 1.246 | Soluble |
| 39 | Y | V | 1.244 | Soluble |
| 23 | K | R | 1.237 | Soluble |
| 25 | E | R | 1.229 | Soluble |
| 24 | H | R | 1.228 | Soluble |
| 50 | K | T | 1.222 | TM |
| 27 | Y | Q | 1.219 | Soluble |
| 27 | Y | T | 1.216 | Soluble |
The highest LLR of 2.561 was scored at position 50 where the wild type K (Lysine) is changed to L (Leucine).
Positions with the many high scoring mutations were positions 50, 29 and 39suggesting they are “hotspots” for positive redesign as the Wild-Type AA is predicted as quite unoptimised for that specific spot.
Experimental Dataset
Next, I checked if the ESM scores (theoretical fitness) correlated with this L-Protein Mutants Experimental Dataset which included results of different mutations and their effects on lysis.
Using Gemini I checked whether the data correlated by comparing the LLR score from ESM against the functional outcomes (Lysis and Protein expression) in the experimental dataset.
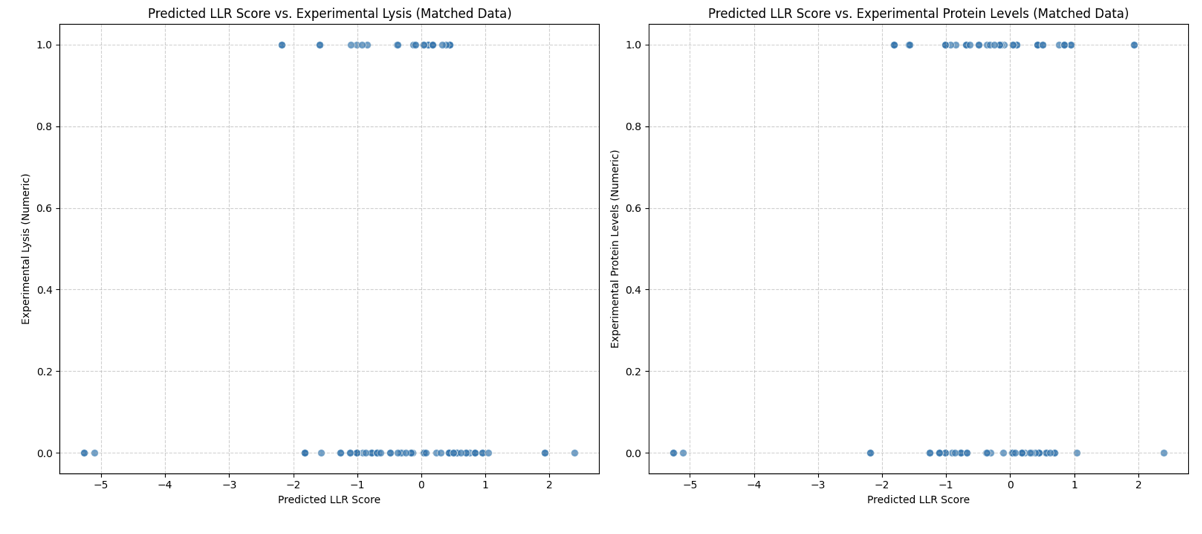
Gemini found weak statistical correlation. The Pearson correlation coefficients was 0.0922 for the Lysis Activity with the LLR and 0.0602 for Protein Levels with the LLR.
I was concerned this outcome was due to the binary vales of the experimental dataset vs the range of scores in the LLR. So I binarised the LLR scores into positive and negative but even then the correlations remained weak.
Significantly, the highest performing predicted mutations had N.D results or no experimental result which meant they lacked direct experimental validation in the provided dataset making the comparison limited.
pBlast and Clustal Omega: Multiple Sequence Alignment
Next, I put the pBLAST results for Lysis Protein into Clustal Omega to identify the conserved regions so the mutations recommended don’t impact protein function.
I learnt using Gemini to interpret the results that:
- Asterisk (*): Perfectly conserved across all 52 sequences. Do not mutate these.
- Colon (:): Strong conservation of chemical properties.
- Period (.): Weak conservation.
- Blank space: Highly variable. These are the safest regions to mutate.
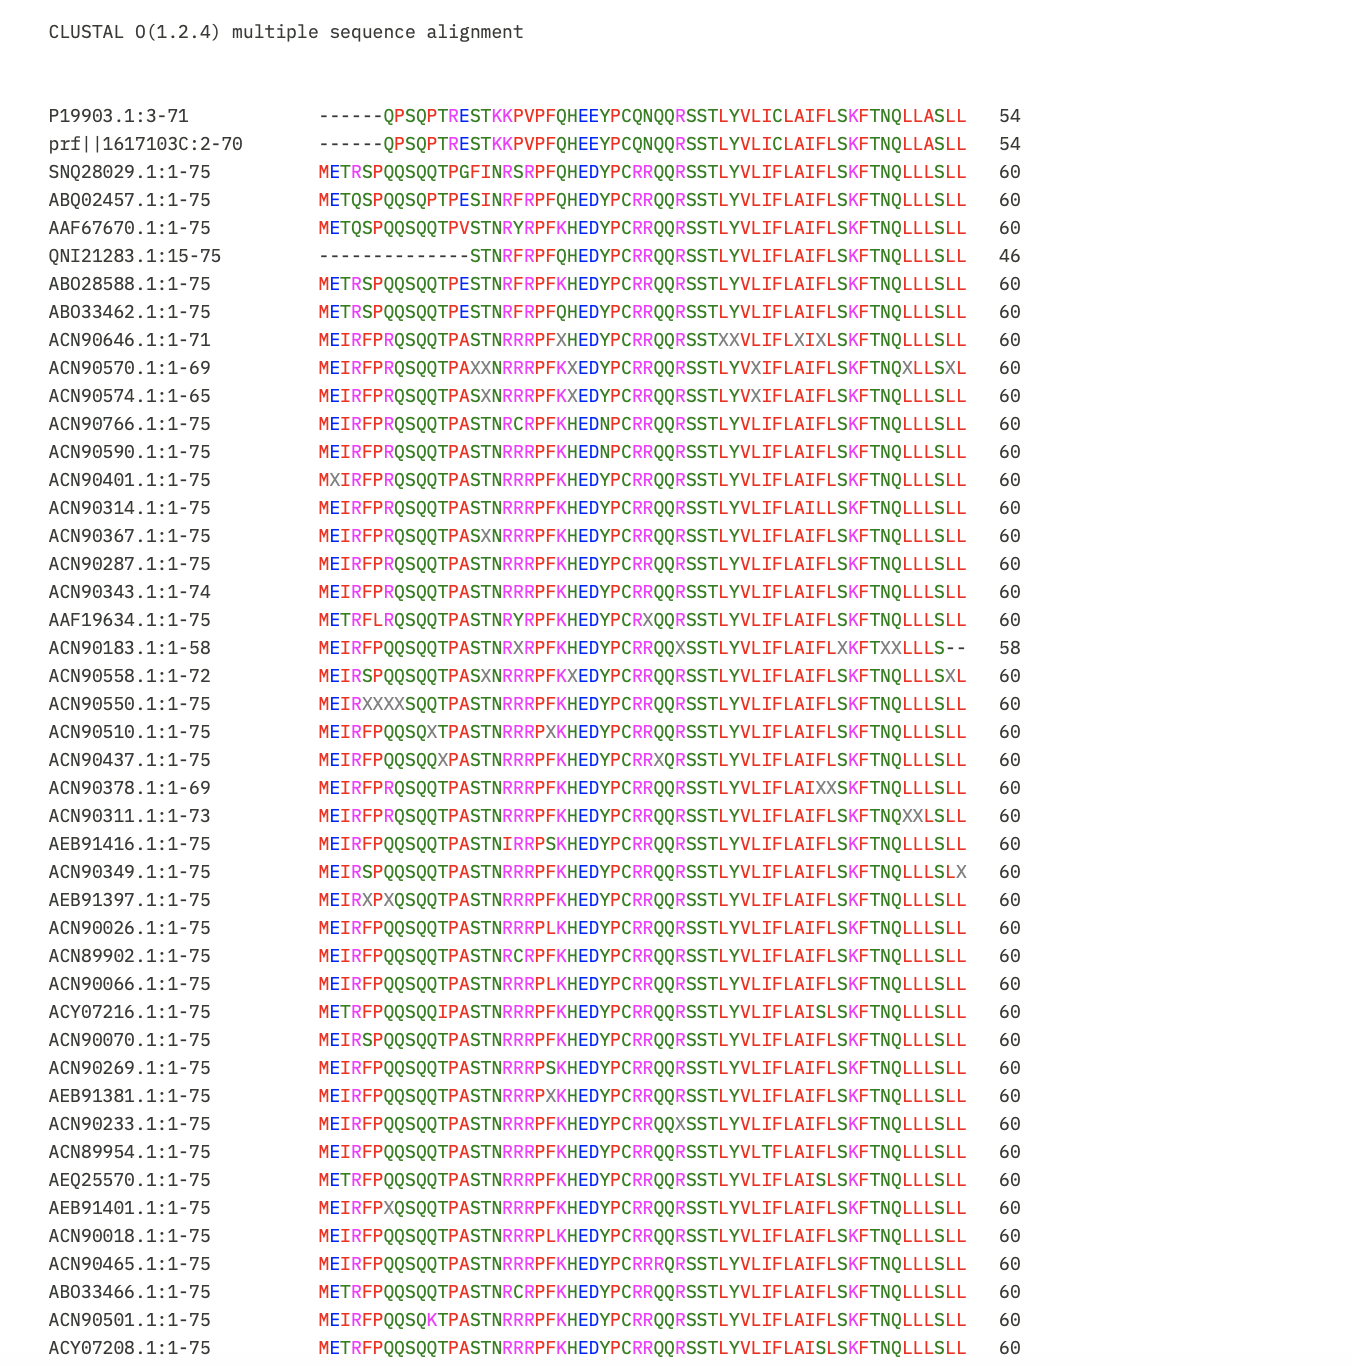
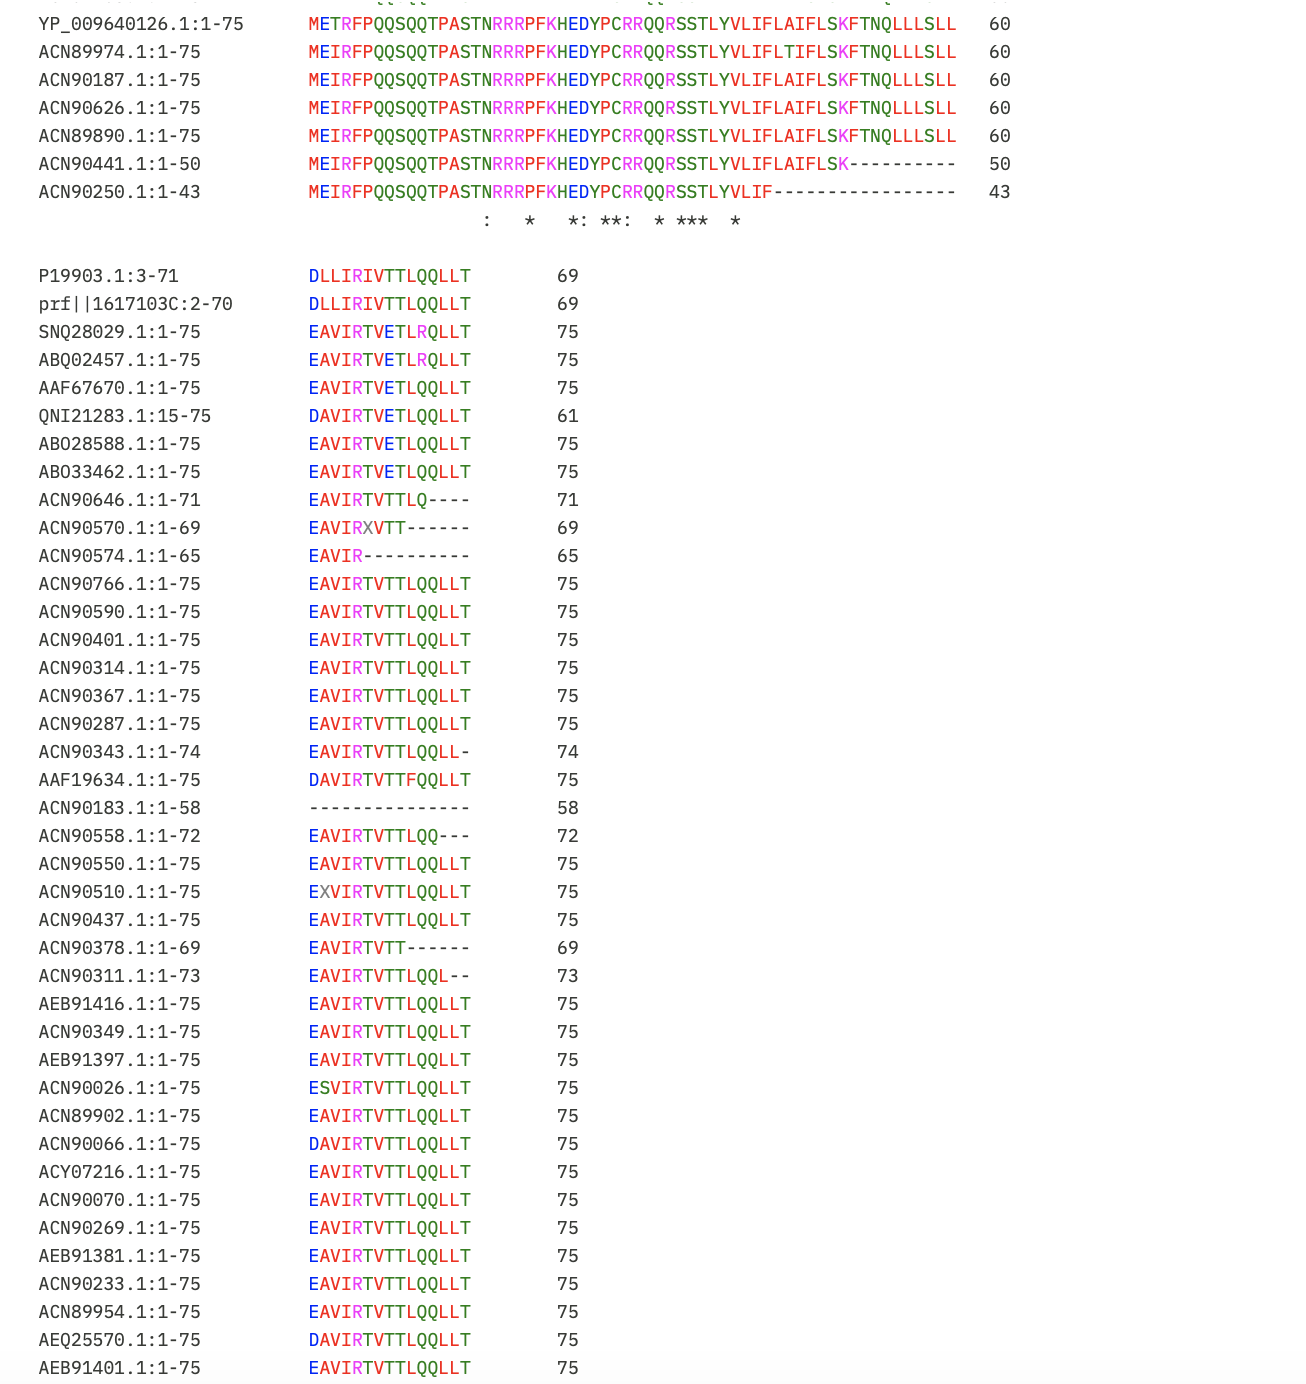
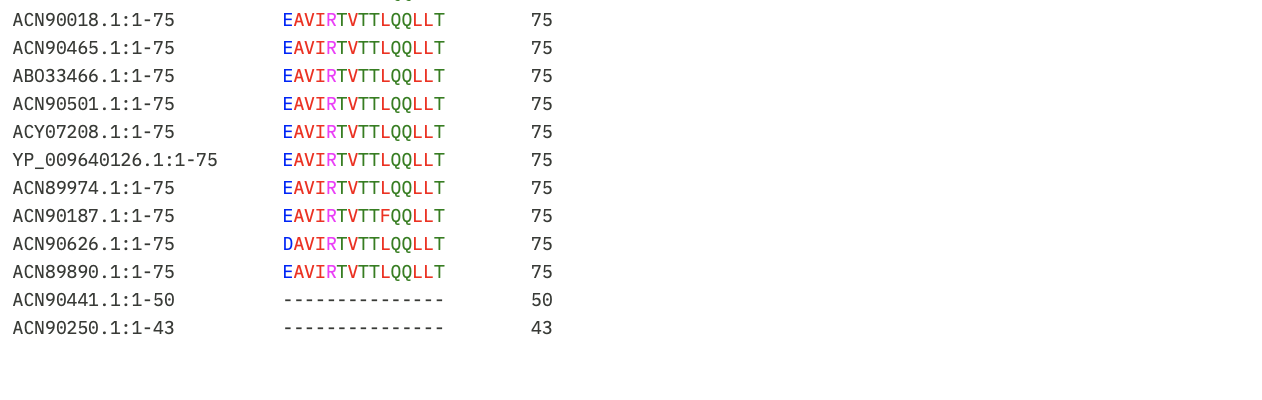
Selected Mutations
I have selected five mutations by prioritising those with high positive LLR scores while cross-referencing experimental data. I avoided mutations in conserved regions by analyzing the multiple sequence alignment generated by Clustal Omega using pBLAST results.
| Mutation | Region | LLR Score | Rational |
|---|---|---|---|
| K50L | Transmembrane | 2.56 | This is the highest LLR score in the entire dataset, indicating high confidence in the mutation. The Clustal Omega alignment shows this position is variable, meaning it is a safe candidate for functional enhancement. |
| N53L | Transmembrane | 1.86 | A top LLR score. The alignment shows that while the surrounding motif is conserved, position 53 itself is not strictly conserved suggesting it is a safe site for substitution. |
| S9Q | Soluble | 2.01 | This is the highest-scoring mutation in the N-terminal soluble region (1–17). The clustal omega alignment confirms this site is in a highly variable spot in the N-terminal tail. |
| F5Q | Soluble | 1.79 | Position 5 is located at the N-terminus, which the Clustal alignment identifies as the most variable part of the protein. By choosing a high-scoring mutation in this flexible region it can minimise the risk of negatively impacting protein stability. |
| Y39L | Transmembrane | 2.24 | This mutation sits at the boundary of the transmembrane region. It was selected because it is the highest-scoring remaining variant that is not at a conserved site. Using a Leucine substitution here aligns with the hydrophobic nature of the membrane entry domain. |
Check in AlphaFold-Multimer
I will proceed to the last step with mutation K50L. ESM says the mutation is high confidence (LLR 2.56) and pBLAST/Clustal Omega says the position is flexible and safe to change. Finally, I will check with AlphaFold-Multimer to see if the mutation allows the protein to assemble into a stable, 8-unit pore that can perforate a membrane.
I chose to try a homooctamer (8 chains), this is because it is suggested that the protein functions by assembling to make a perforation in the bacterial membrane.
Query Sequence for K50L:
METRSPQQSQQTPGFINRSRPFQHEDYPCRRQQRSSTLYVLIFLAIFLSLFTNQLLLSLLDAVIRTVETLRQLLT:METRSPQQSQQTPGFINRSRPFQHEDYPCRRQQRSSTLYVLIFLAIFLSLFTNQLLLSLLDAVIRTVETLRQLLT:METRSPQQSQQTPGFINRSRPFQHEDYPCRRQQRSSTLYVLIFLAIFLSLFTNQLLLSLLDAVIRTVETLRQLLT:METRSPQQSQQTPGFINRSRPFQHEDYPCRRQQRSSTLYVLIFLAIFLSLFTNQLLLSLLDAVIRTVETLRQLLT:METRSPQQSQQTPGFINRSRPFQHEDYPCRRQQRSSTLYVLIFLAIFLSLFTNQLLLSLLDAVIRTVETLRQLLT:METRSPQQSQQTPGFINRSRPFQHEDYPCRRQQRSSTLYVLIFLAIFLSLFTNQLLLSLLDAVIRTVETLRQLLT:METRSPQQSQQTPGFINRSRPFQHEDYPCRRQQRSSTLYVLIFLAIFLSLFTNQLLLSLLDAVIRTVETLRQLLT:METRSPQQSQQTPGFINRSRPFQHEDYPCRRQQRSSTLYVLIFLAIFLSLFTNQLLLSLLDAVIRTVETLRQLLT
Results:
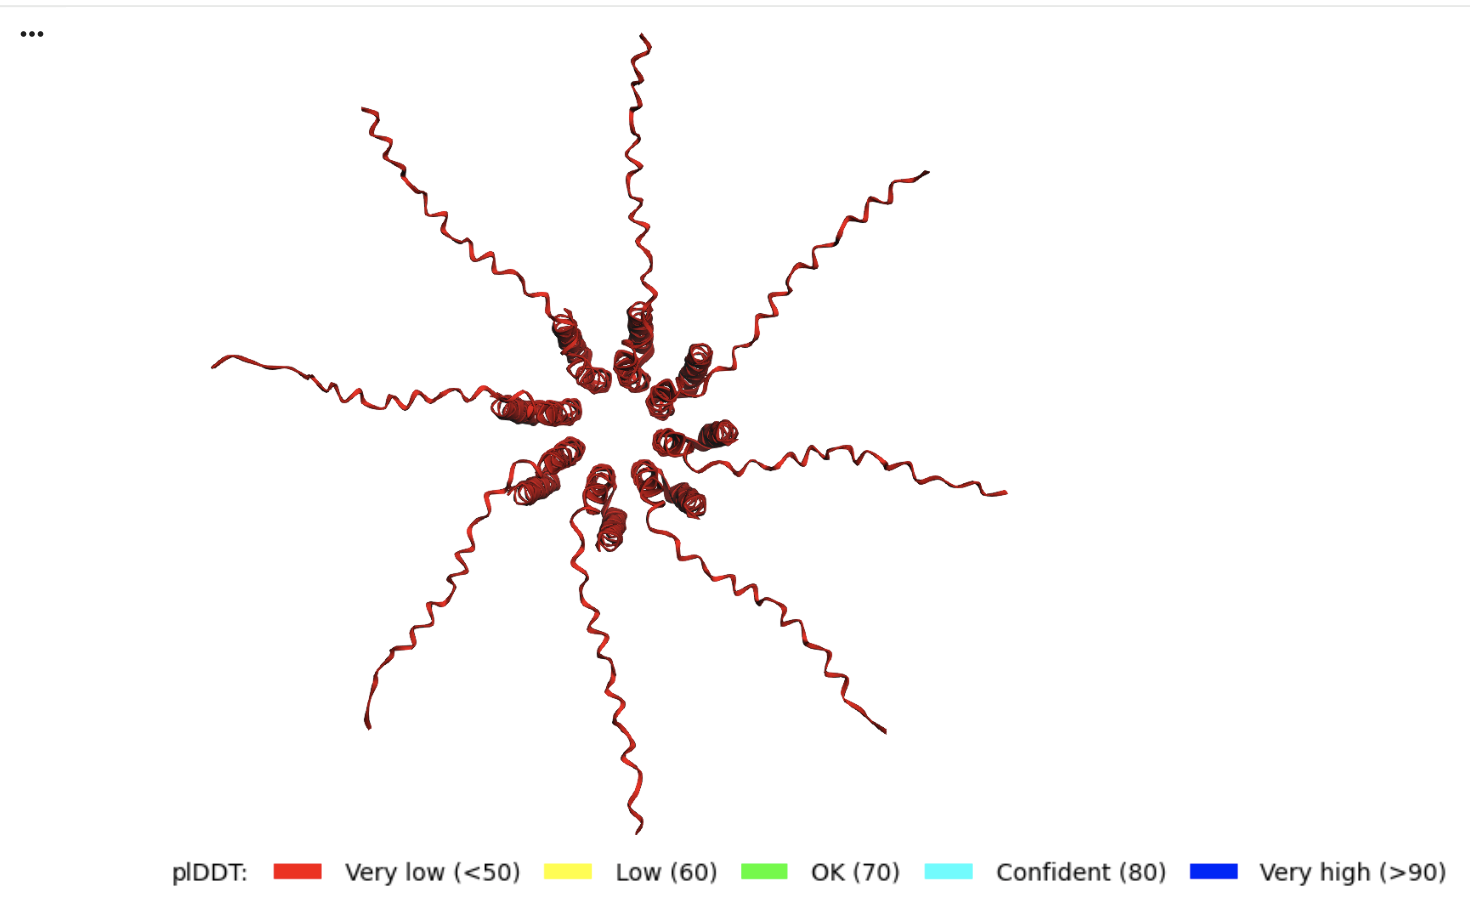
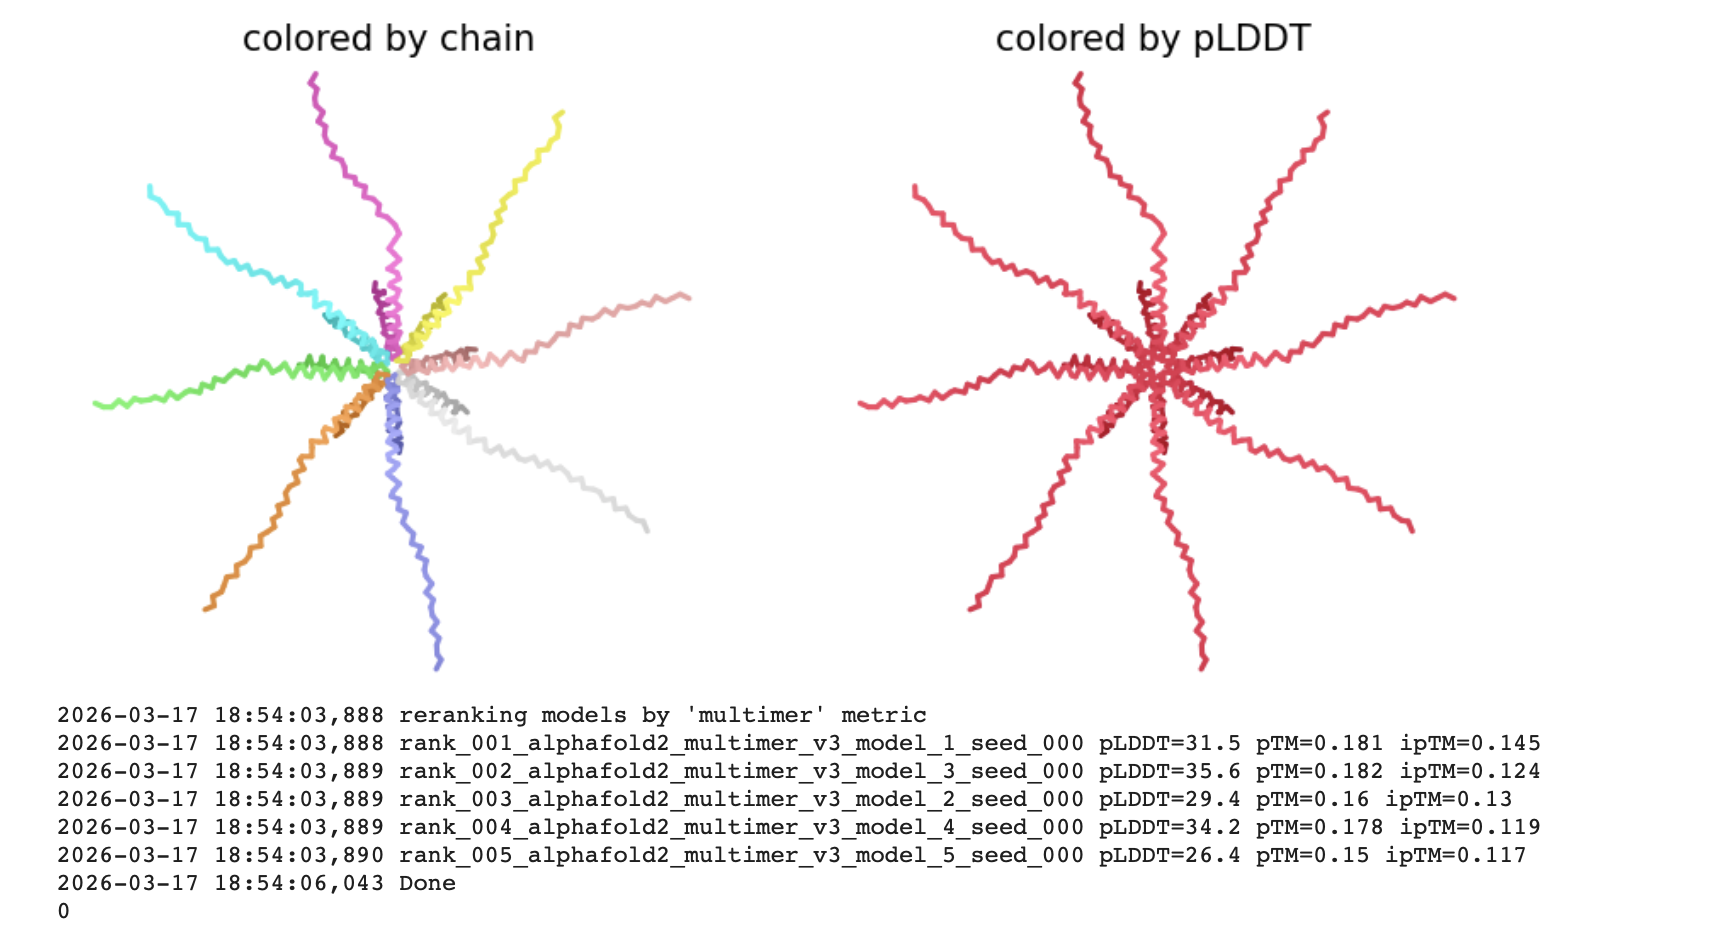
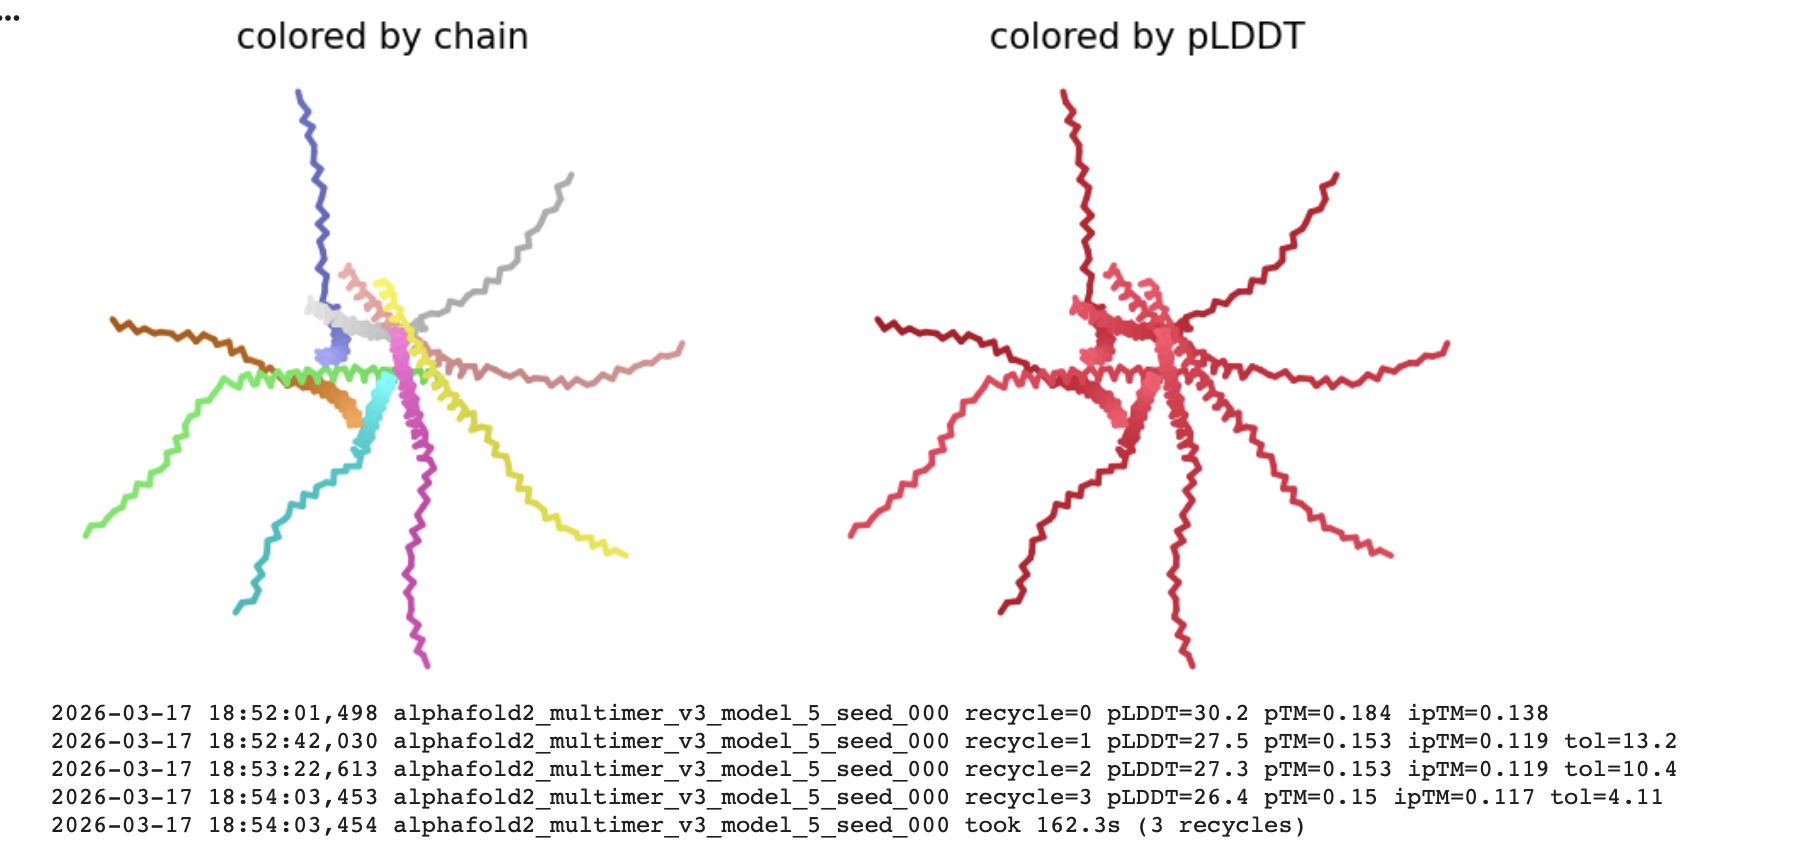
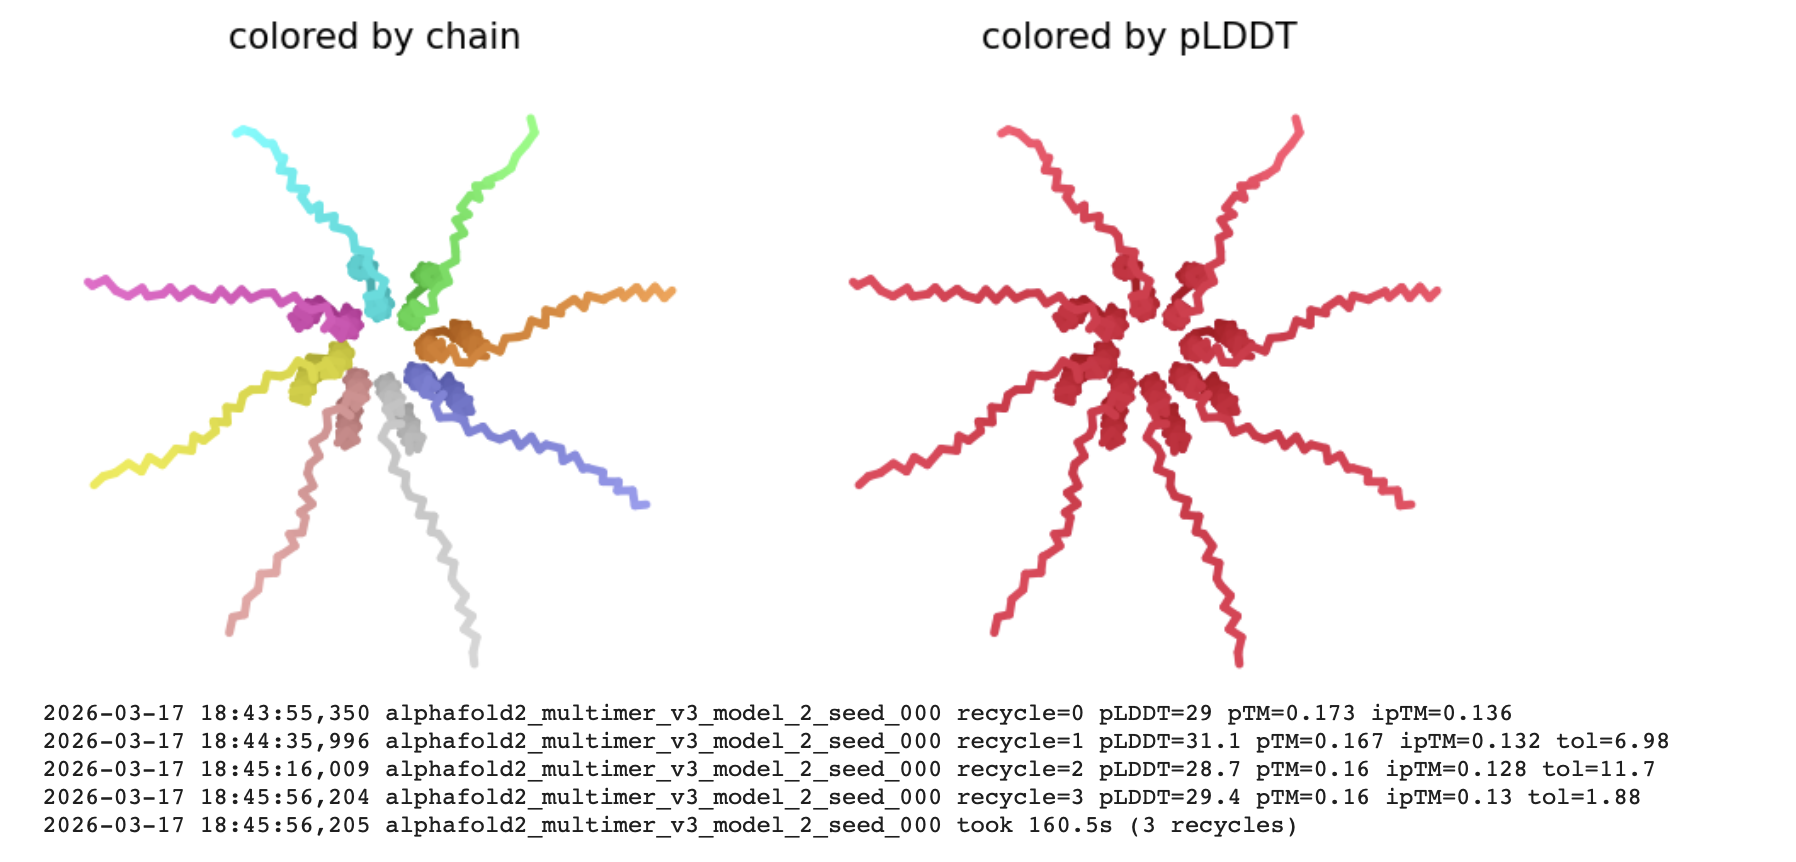
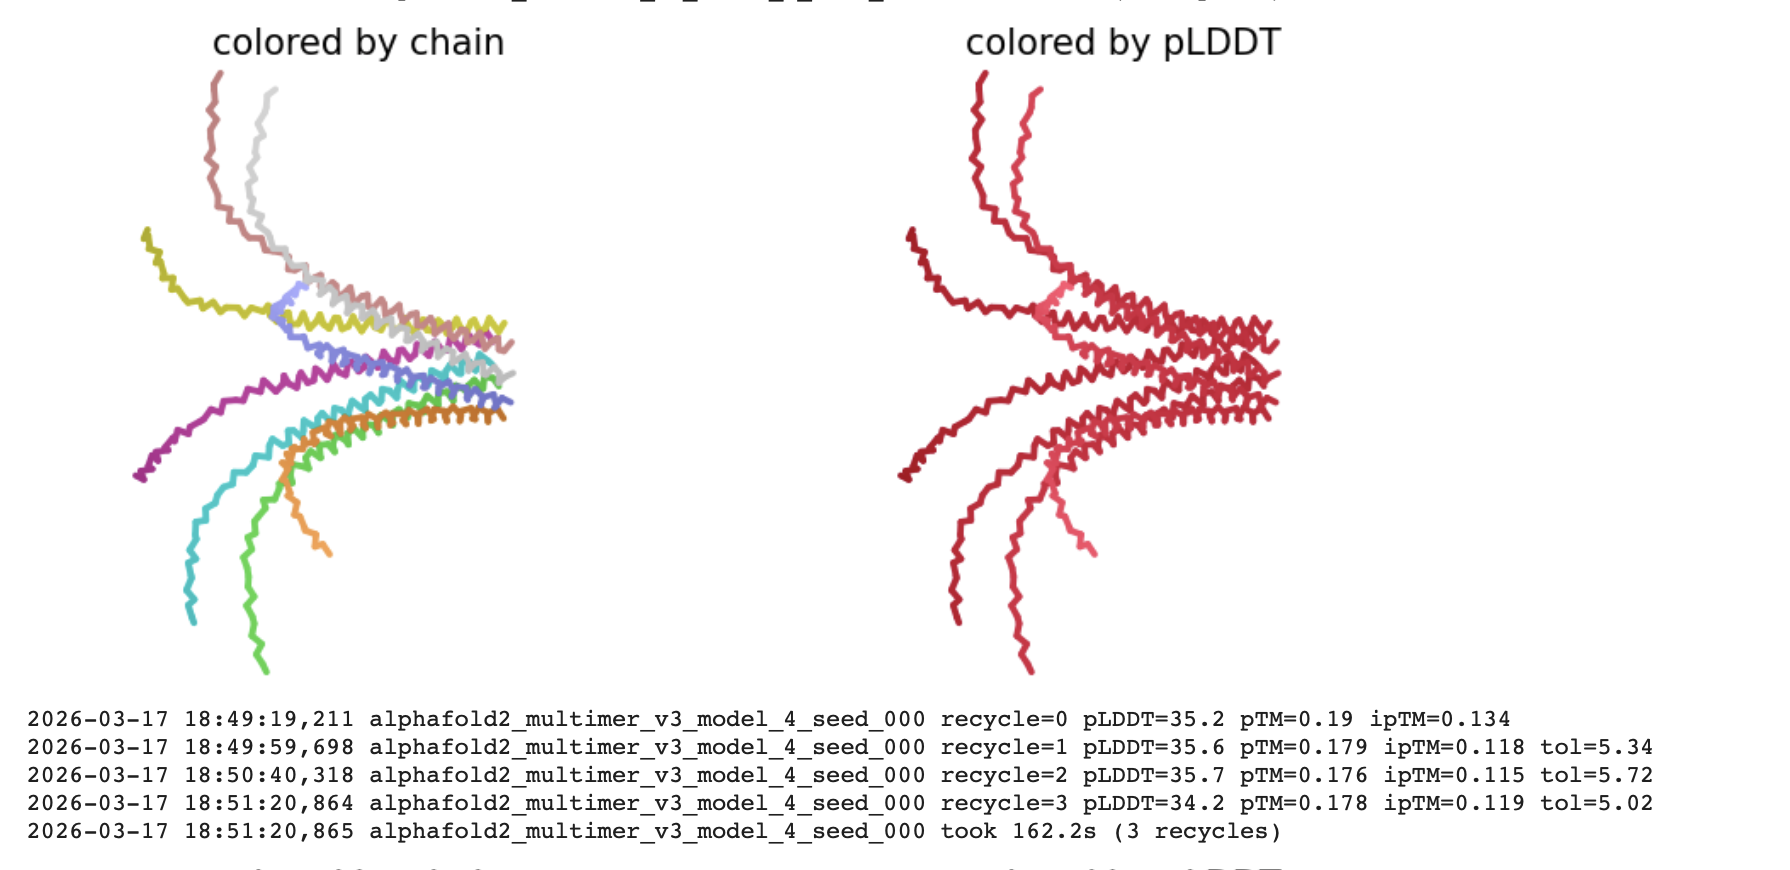
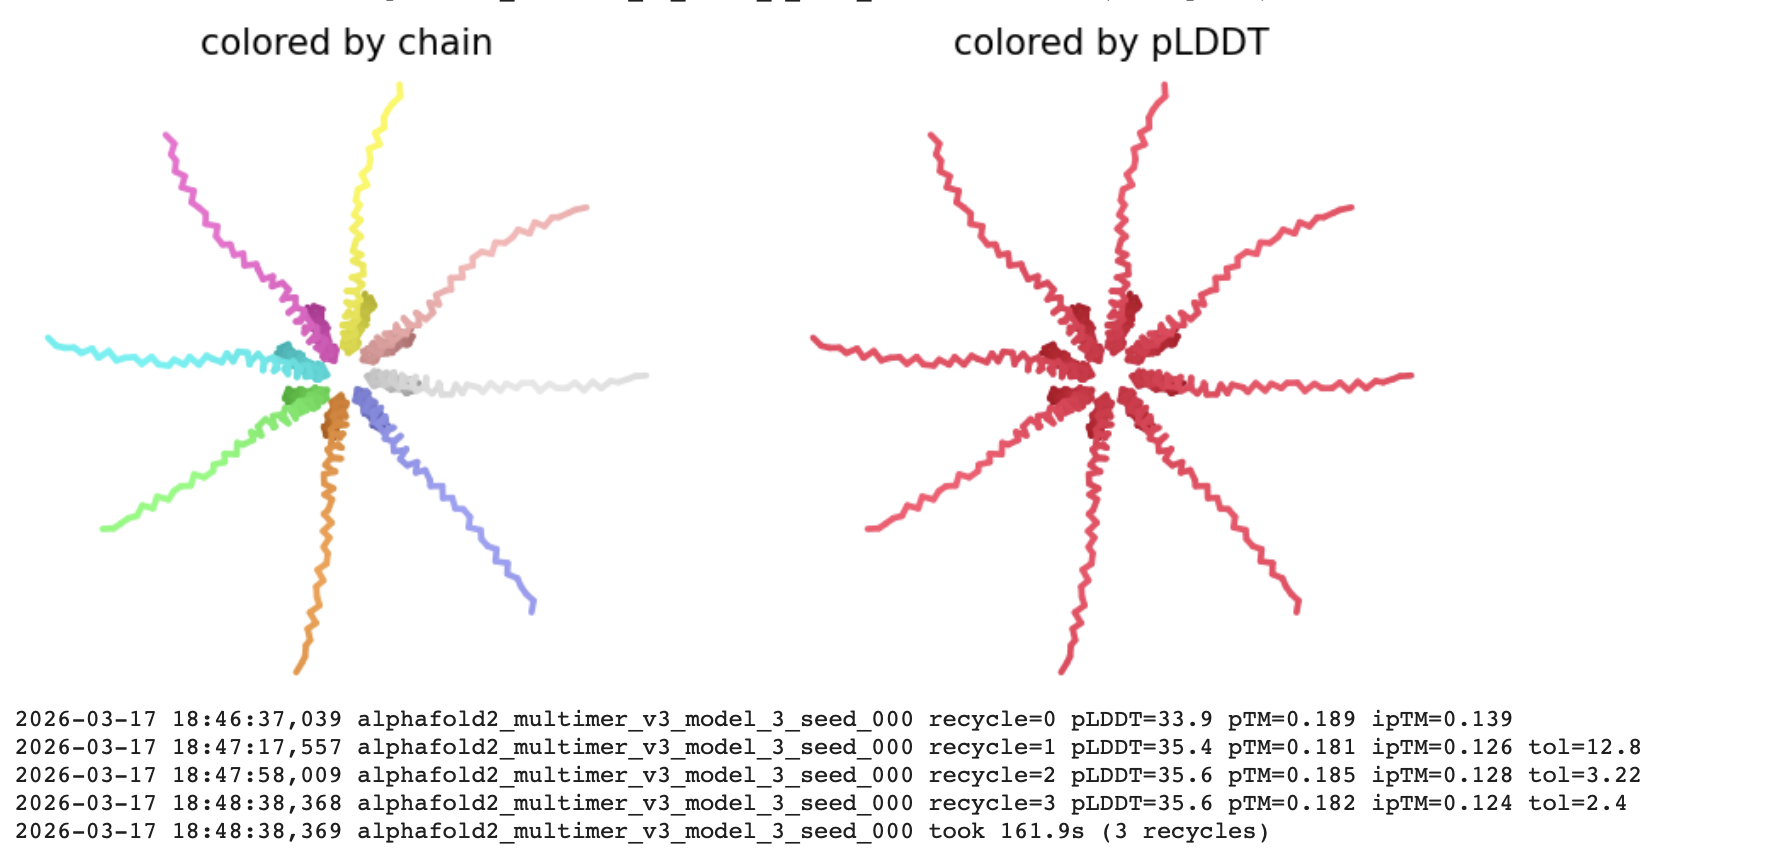
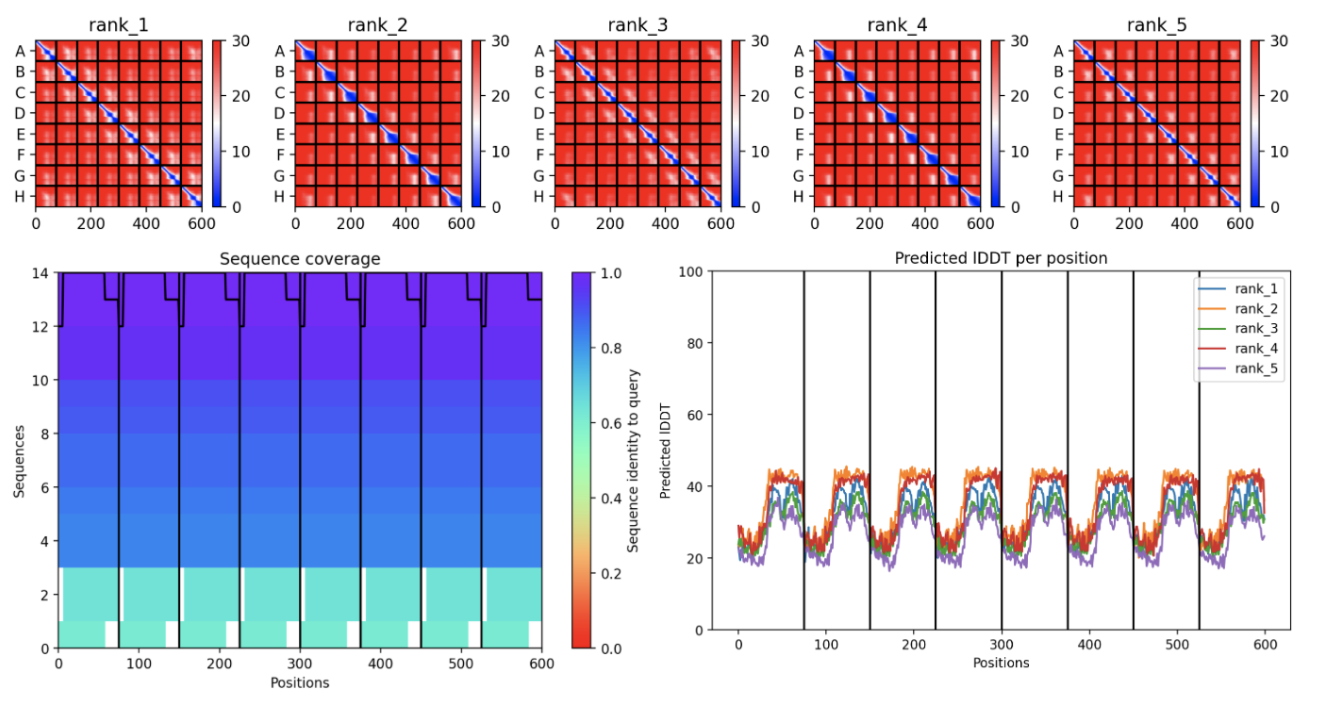
Interpretation
The pLDDT (Predicted Local Distance Difference Test)
The all red structure suggests the pLDDT is very low (below 50). This is a strong indicator that the Alphafold has very low confidence in the predicted 3D structure.
Predicted Aligned Error (PAE) Plot:
The ‘blue diagonal’ across rank 1-5 suggests that the model is generally confident about the relative positions of residues within each individual chain. However, large proportion of red implies low confidence in the relative positioning of residues between different chains. This indicates that while the internal structure of each monomer might be reasonably predicted, the way these monomers assemble into the octamer might be highly uncertain.
The MSA Sequence Coverage Plot:
The predominantly purple and dark blue’ areas signify a strong and diverse Multiple Sequence Alignment. This means the low prediction confidence (seen in the PAE and pLDDT) is likely not due to insufficient evolutionary information but inherent challenges in the modelling such a large and complex octamer.
Week 6 HW: Genetic Circuits Part I
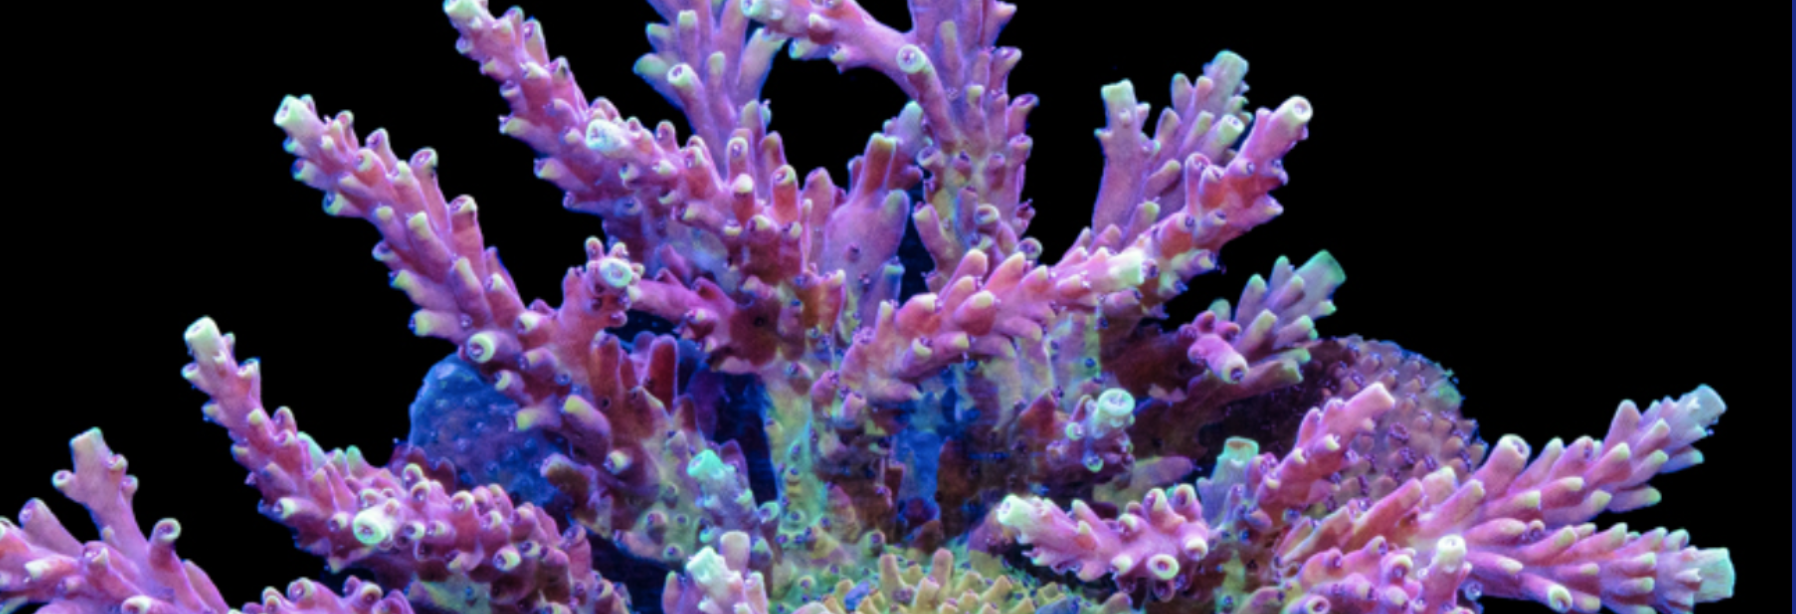
PART A: DNA Assembly
The Phusion Flash High-Fidelity PCR Master Mix is a ready made reagent kit for fast and accurate PCR, used to select specific DNA sequences and amplify them for cloning, genotyping, sequencing, and pathogen detection.

What are some components in the Phusion High-Fidelity PCR Master Mix and what is their purpose?
Phusion DNA Polymerase:
This is the enzyme that synthesises the new complementary strands of DNA during the extension step of a PCR by proofreading the nucleotide sequence and adding complementary nucleotides in a 5’ to 3’ direction, starting from the 3’ end of a primer to form a complementary strand to those split during denaturation. The Phusion technology enhances the enzymes ability to bind to the DNA strand and also has 3’to 5’ exonuclease activity so that if the wrong base is added it can be removed and replaced with the correct base.
dNTP (deoxynucleoside triphosphates):
These are the nucleotides, the building blocks of the DNA that the DNA Polymerase used to build the new complimentary strand of DNA from.
HF reaction buffer (high fidelity):
This provides the ideal chemical environment (salts, pH) for the Phusion enzyme. This buffer specifically is optimised to prioritise the accuracy of the polymerase to ensure the lowest possible error rate.
MgCl2:
Is a catalytic co-factor that binds to the active site of the polymerase and facilitate the biochemical reaction.
100% DMSO (Dimethyl Sulphoxide):
DMSO is a chemical additive that can be introduced for difficult PCRs. It acts as a denaturant that lowers the melting temperature of the DNA if needed for a PCR with DNA templates that are GC rich or have complex secondary structures.
What are some factors that determine primer annealing temperature during PCR?
The annealing temperature for the Phusion mix is slightly higher than ordinary PCR polymerase so it is recommended to us the Tm calculator for Thermo fisher DNA polymerase.
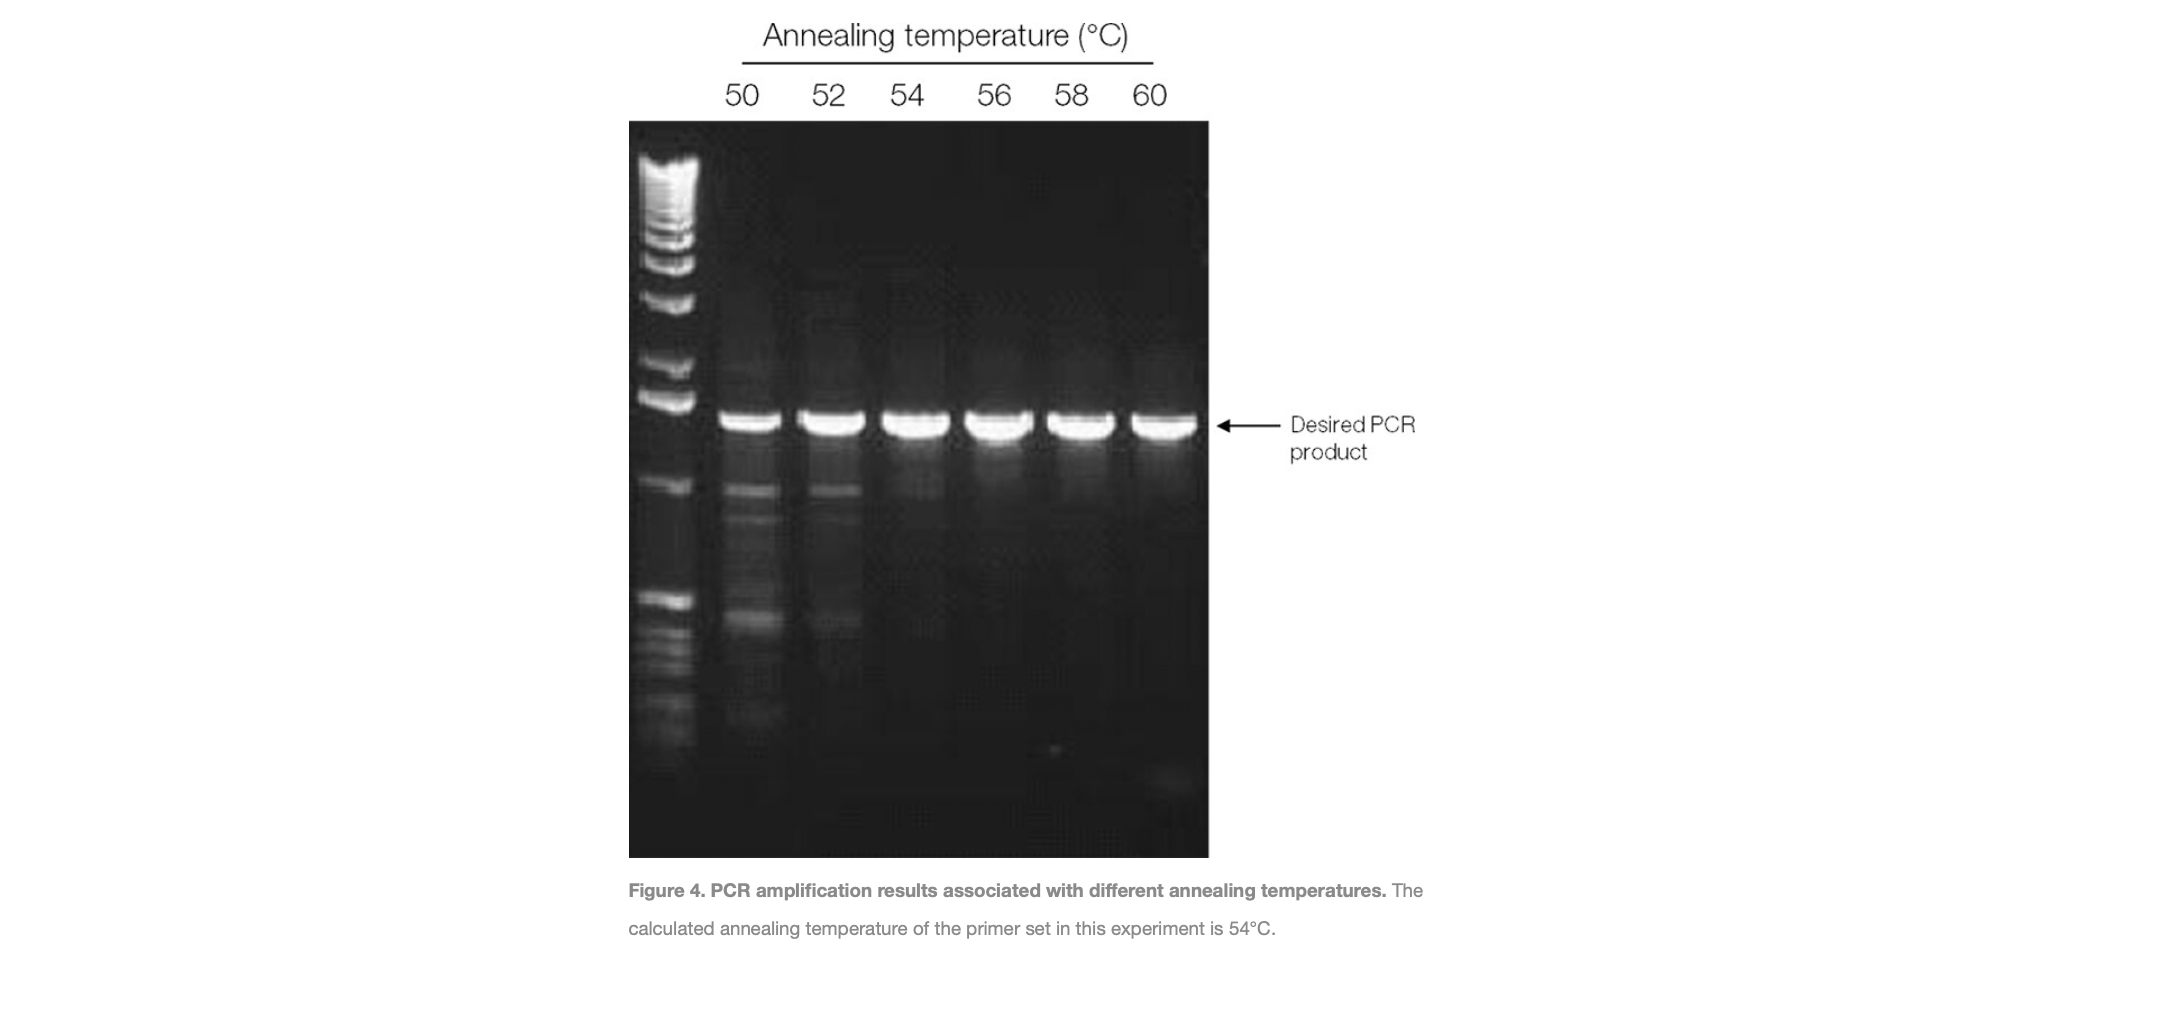
Figure from Thermofisher: https://www.thermofisher.com/uk/en/home/life-science/cloning/cloning-learning-center/invitrogen-school-of-molecular-biology/pcr-education/pcr-reagents-enzymes/pcr-cycling-considerations.html
The Melting Temperature of the primers (Tm)
This is defined as the temperature at which 50% of the primer form a duplex with the target DNA.
This is determined by the primers:
Base Composition: The number of Hydrogen bonds. Since G-C pairs have three bonds and A-T pairs have two, a higher GC content increases the Tm.
Primer Length: Longer primers generally have higher thermodynamic stability and require a higher Tm.
The Buffer Environment
The reaction buffer components significantly affect annealing temperature:
Salt Concentration (Na+ or K+): Cations neutralise the negative charge of the DNA backbone, increasing the stability of the primer-template duplex and raising the required Tm.
PCR Additives, co-solvents and modified nucleotides lower the Tm e.g DMSO, using 7-deaza-dGTP instead of dGTP
Specialized Buffers: some buffers contain isostabilizing components designed to allow a universal annealing temperature (regardless of the specific primer sequence.)
Experimental Optimisation
The final annealing temperature used in the thermal cycler is often adjusted based on the observed experimental results based on PCR yield.
If there is no or low amplification the temperature is lowered (in 2–3∘C increments) to encourage binding.
If non-specific PCR products appear, the temperature is raised to enhance specificity.
There are two methods from this class that create linear fragments of DNA: PCR, and restriction enzyme digests. Compare and contrast these two methods, both in terms of protocol as well as when one may be preferable to use over the other.
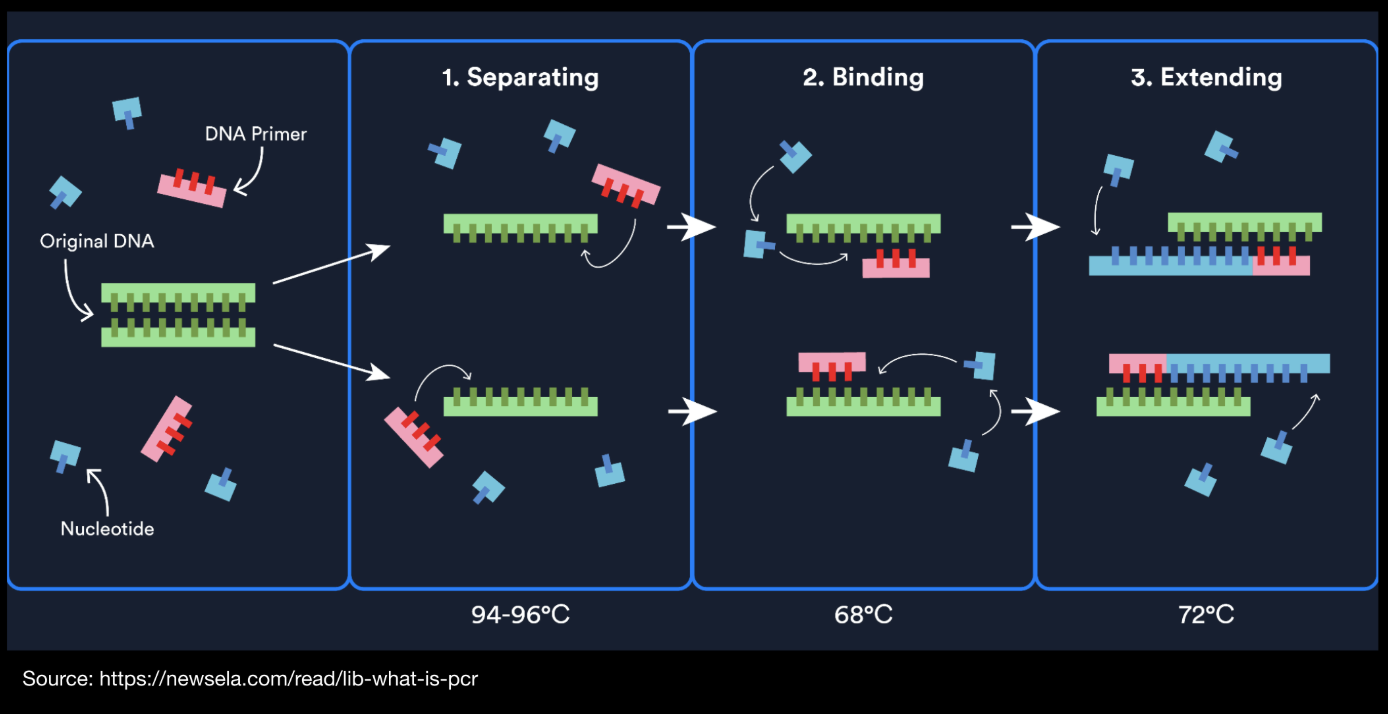
Figure from Newsela: https://app.newsela.com/view/ck9nooouh094h0iqjb6jgexg5/
PCR
PCR is an amplification technique which uses primers to targets a specific DNA sequences of interest from a template and creating many linear copies through a cycle of denaturation, annealing and extension via DNA polymerase.
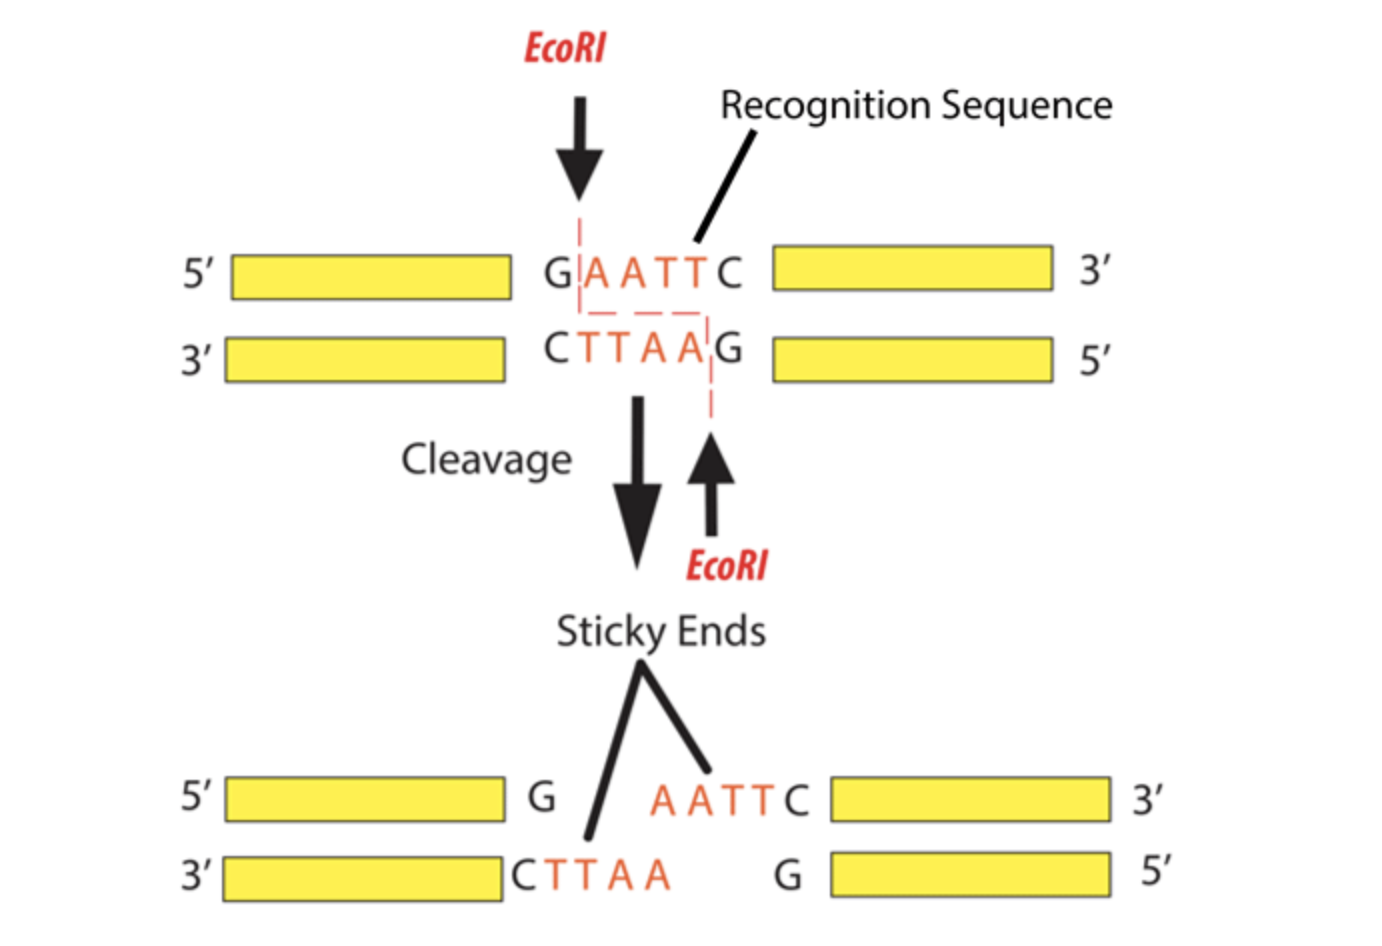
Figure from Addgene: https://www.addgene.org/protocols/restriction-digest/
Restriction Enzyme Digest
In contrast, a restriction enzyme digest is a cleavage technique where restriction endonucleases recognise and cut the phosphodiester bonds at specific recognition sites within an existing DNA molecule.
Compare and Contrast
| Properties | PCR | Restriction Enzyme Digest |
|---|---|---|
| Action | Amplification (Building new DNA) | Cleavage (Cutting existing DNA) |
| Components Requirements | Template DNA (not much needed), Primers, dNTPs, MgCl2, reaction buffer | Larger quantities of DNA (with specific recognition sequence), restriction enzymes, reaction buffer, water |
| Targeting | customisable: primers define the specific boundaries of the target DNA, allowing for the amplification of any sequence of interest provided the flanking sequences are known. | Fixed: dna fragments are defined by the location and frequency of specific palindromic recognition sites within the existing DNA molecule |
| Temperature | dynamic cycles of 95°C, 60°C, 72°C | Usually stable 37°C incubation |
| Output | High yield of copies of a specific DNA segment | Cleaved fragments of existing molecule |
| End Type | Often blunt | Often sticky |
| Mutation | Not possible | Possible |
PCR is the preferred technique when you have a small amount of starting template, need to define the exact boundaries of a fragment where no natural cut sites exist or intend to perform precise engineering by introducing mutations or adding overlaps for Gibson Assembly.
In contrast, a restriction digest is preferable for diagnostic applications, linearising plasmids and traditional sub-cloning where the DNA sequence must be perfectly preserved. Since it is a cleavage method that does not involve synthesis, it is highly predictable and stable. It is the simpler, more reliable choice when suitable recognition sites are already located in the DNA and it is excellent for creating compatible sticky ends for ligation. Additionally, because it only requires a single incubation temperature in a stable buffer, it is often a faster and more cost-effective option for routine tasks.
How can you ensure that the DNA sequences that you have digested and PCR-ed will be appropriate for Gibson cloning?
Verify that the insert sequence and backbone have long, matching overlaps of 20–22 base pairs of sequence identity between adjoining fragments and that a high fidelity polymerase like Phusion is used in PCR to to ensure that the overlap sequences are accurate.
Eliminate the template DNA with a Dpnl digest. In the lab, this specifically targets and digests methylated GATC sequences found in the template. Since the amplified fragments are unmethylated, they remain intact. This ensures that the only circular DNA formed during the 50°C incubation comes from the new assembly.
Purify the DNA with the Zymo DNA Clean & Concentrator kit. This remove the Phusion enzyme, dNTPs and salts from the PCR reaction because they can interfere with the Gibson Master Mix enzymes (the exonuclease and ligase).
Diagnostic Gel Electrophoresis. Run the samples on an agarose gel to confirm that the backbone and insert are the expected band sizes, the DNA is linearised and that there are no non-specific contaminants that might compete for binding during the assembly.
DNA Quantification. Use a Nanodrop or Qubit to identify the exact DNA concentration in the sample (ng/μL). Gibson Assembly depends on a specific molar ratio (lab states generally 2:1 Insert to Vector). Accurate quantification ensures that the correct volume of each fragment is added so that the overlapping ends can find each other and anneal efficiently.
How does the plasmid DNA enter the E. coli cells during transformation?
Plasmids are introduced into the E.coli cells via transformation (transfection in mammalian cells). These processes create pores in bacterial cell walls though heat shock, electroporation, chemical or physical transformation, sonication or micro shockwaves.
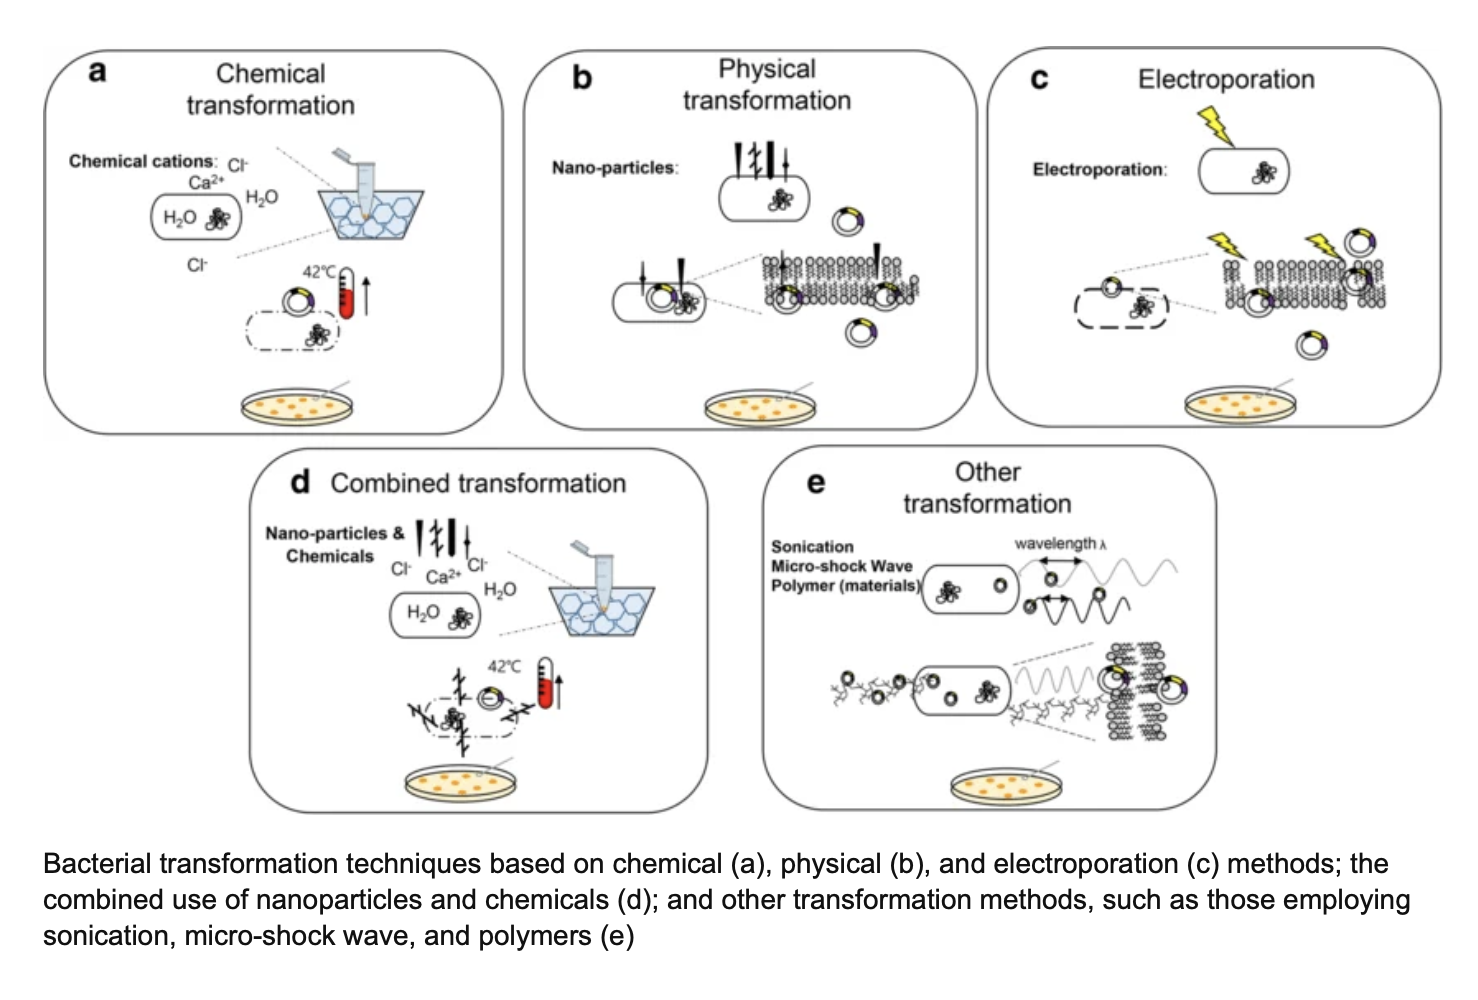
Figure from Research Gate: https://www.researchgate.net/figure/Bacterial-transformation-techniques-based-on-chemical-a-physical-b-and_fig1_336797847
In the lab heat shock is used. The sudden temperature change of moving the cells from ice to a 42°C water bath causes the bacterial cell wall and membrane to open up by generating temporary pores. The plasmid can then enter the E.coli cells from the surrounding liquid through diffusion.
Immediately after the 45-second heat shock, the cells are transferred back to ice for 5 mins to stabilise the membranes.
The cells are then added to SOC growth media and incubated at 37°C for 60 minutes. This recovery period allows the pores to close and gives the bacteria time to start multiplying and expressing the antibiotic resistance gene before being placed on selective agar plates.
Only cells that had successfully received the plasmid will survive the antibiotics and grow.
Describe another assembly method in detail (such as Golden Gate Assembly)
Golden Gate assembly is a cloning technique that allows for a seamless and ordered assembly of multiple DNA fragments in a single reaction.
- Type IIS Restriction Enzyme Digest
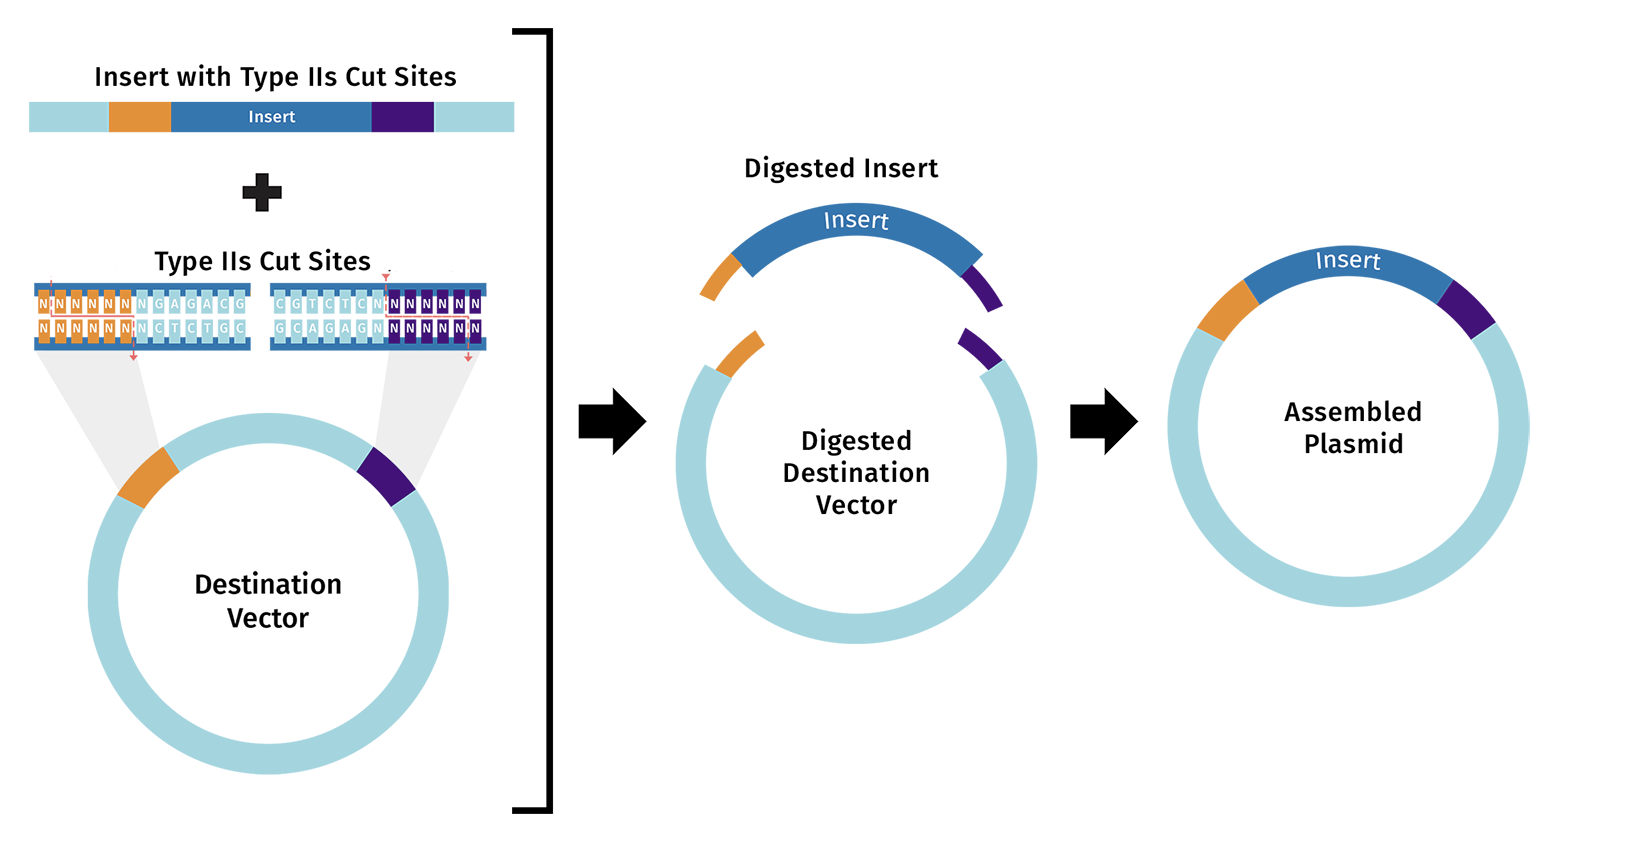
Figure from Snap Gene :https://www.snapgene.com/guides/golden-gate-assembly
The method first uses Type IIS restriction enzymes (e.g BsaI) to perform a digest. These enzymes are unique as they recognise non-palindromic sequences and cleave the DNA at a shifted site outside of the recognition sequence. This shifted cleavage creates variable sticky ends (fusion sites).
- DNA Ligation
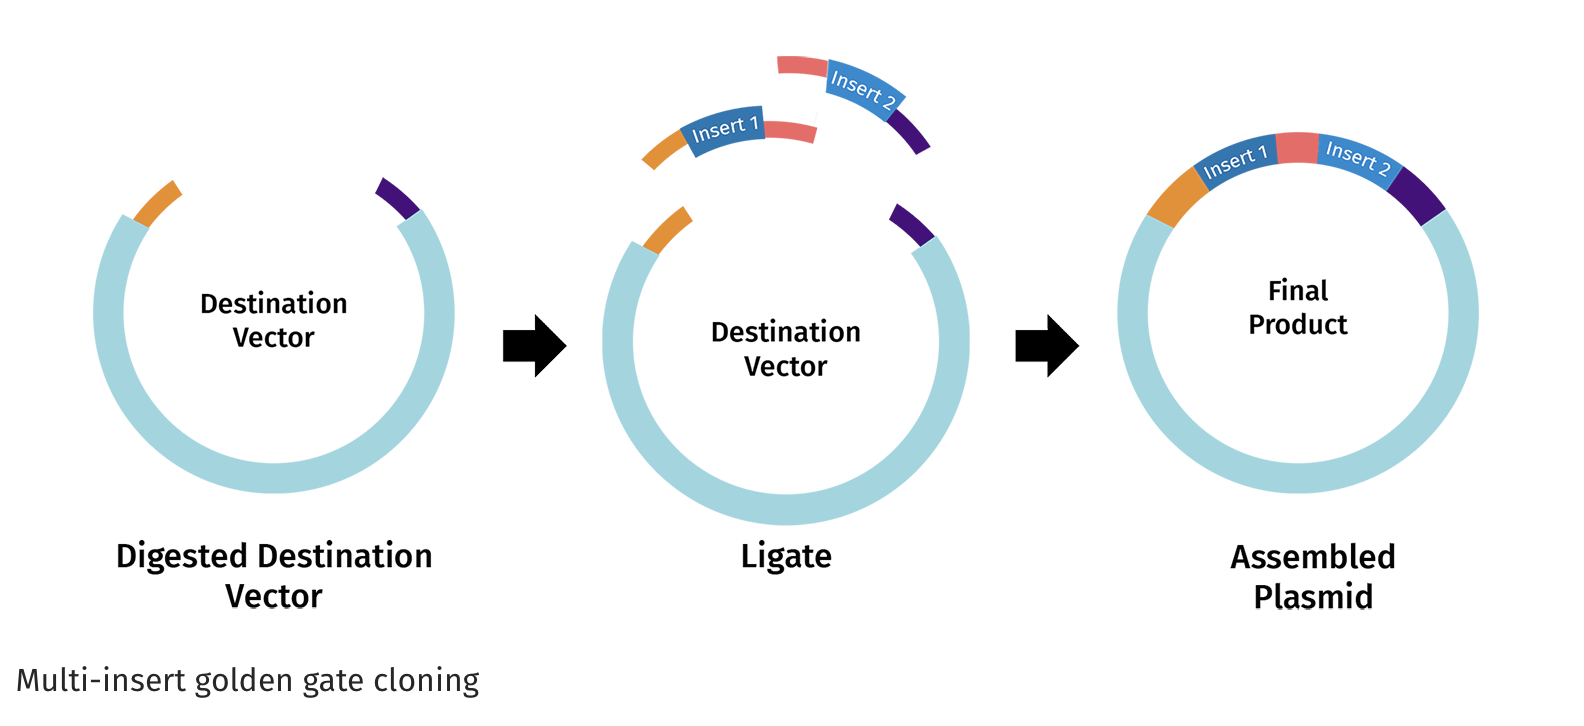
Figure from Snap Gene :https://www.snapgene.com/guides/golden-gate-assembly
Once the vector and DNA insert are digested, the complementary overhangs are joined together by DNA ligase to create the assembled plasmid. The process is seamless because the restriction sites are eliminated in the final construct.
Model this assembly method with Benchling!
To model a simple Golden Gate Assembly in Benchling:
I first prepared my vector and insert. I downloaded a empty pET-28a(+) vector from Snapgene and found a standard GFP sequence from the Registry of Standard Biological Parts.
In Benchling I screened both for exisiting BsaI cut sites and luckily we were all clear:
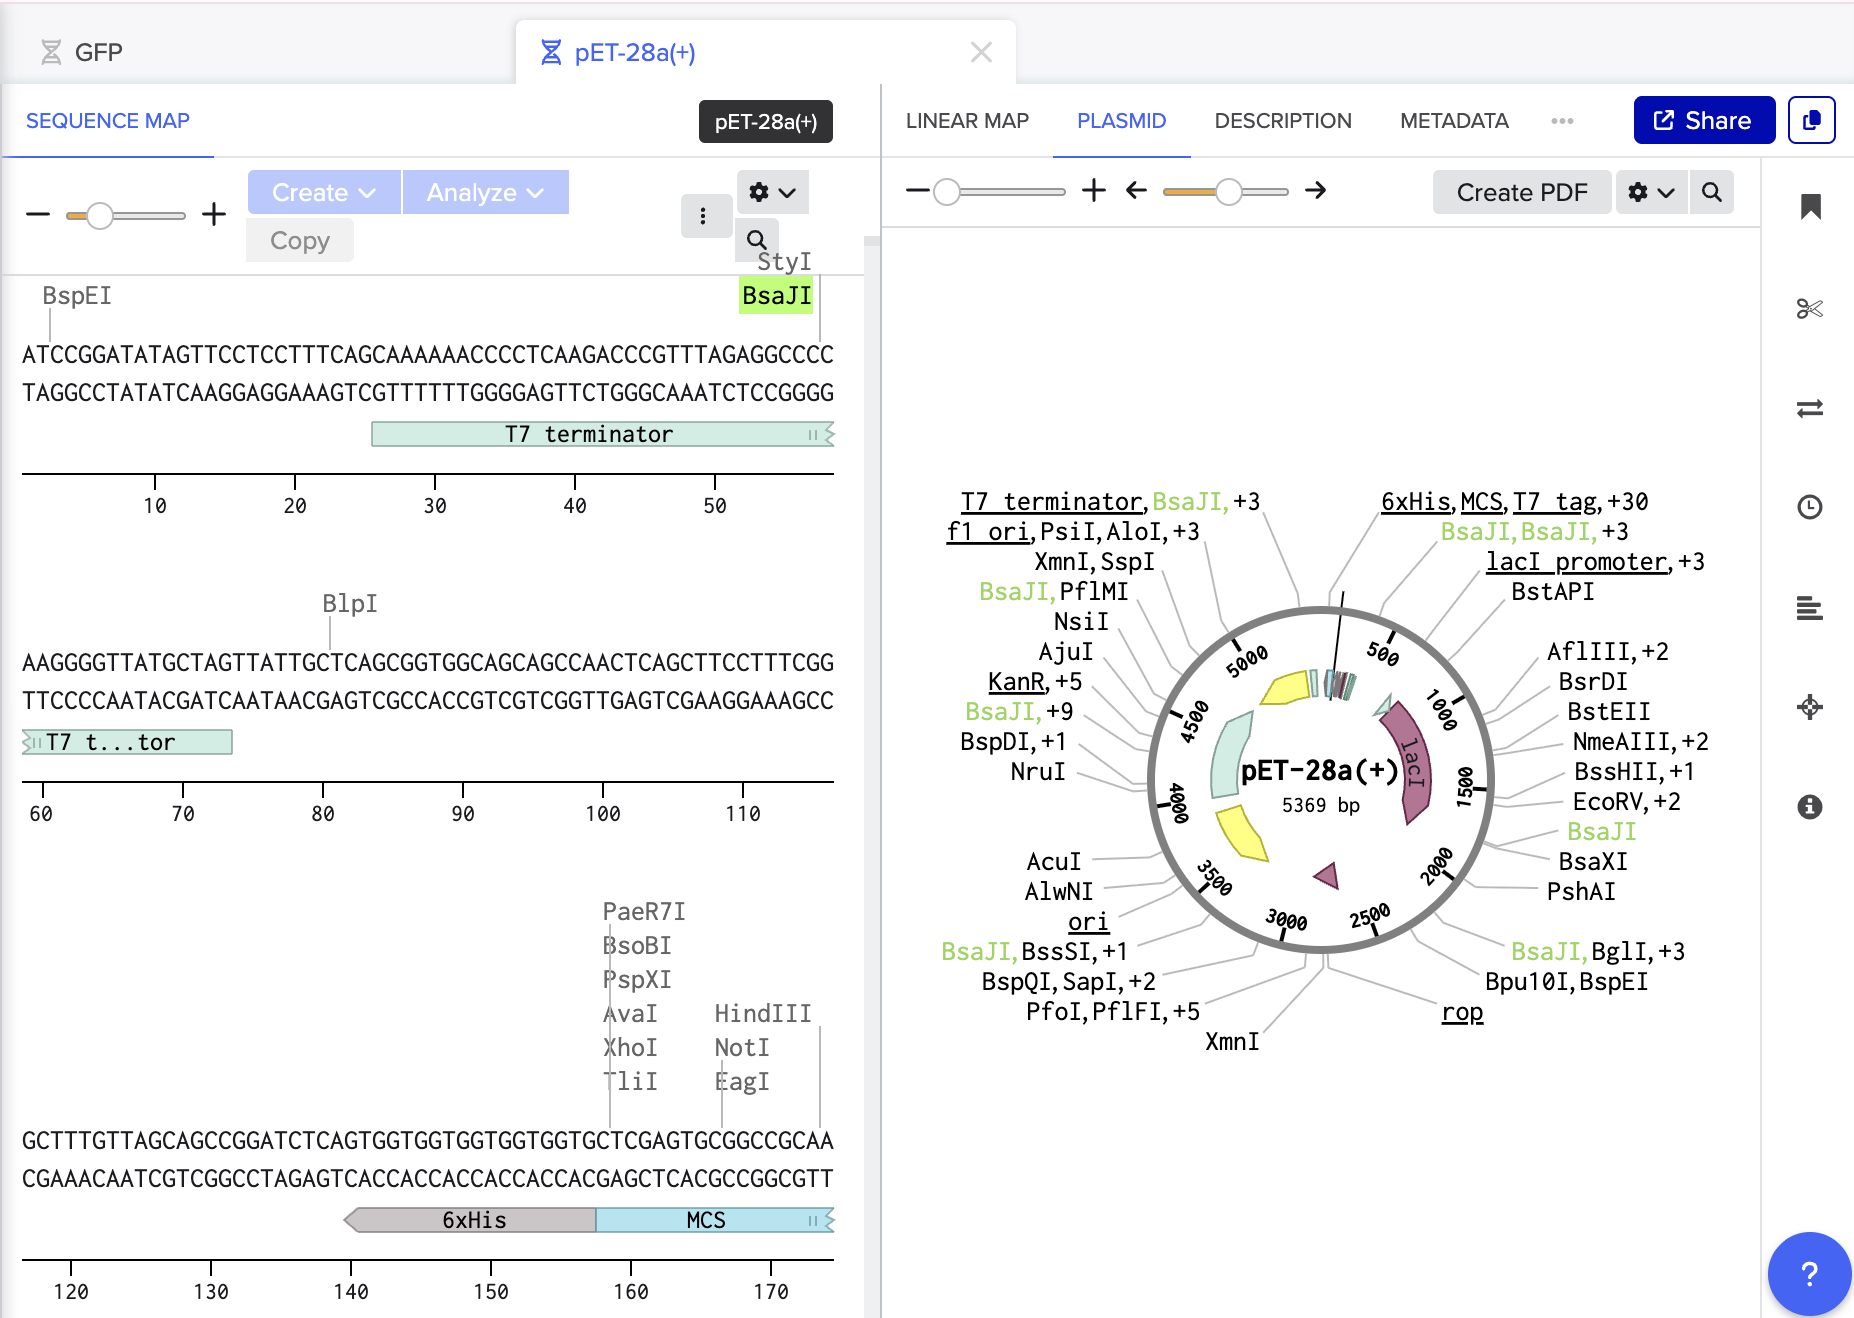
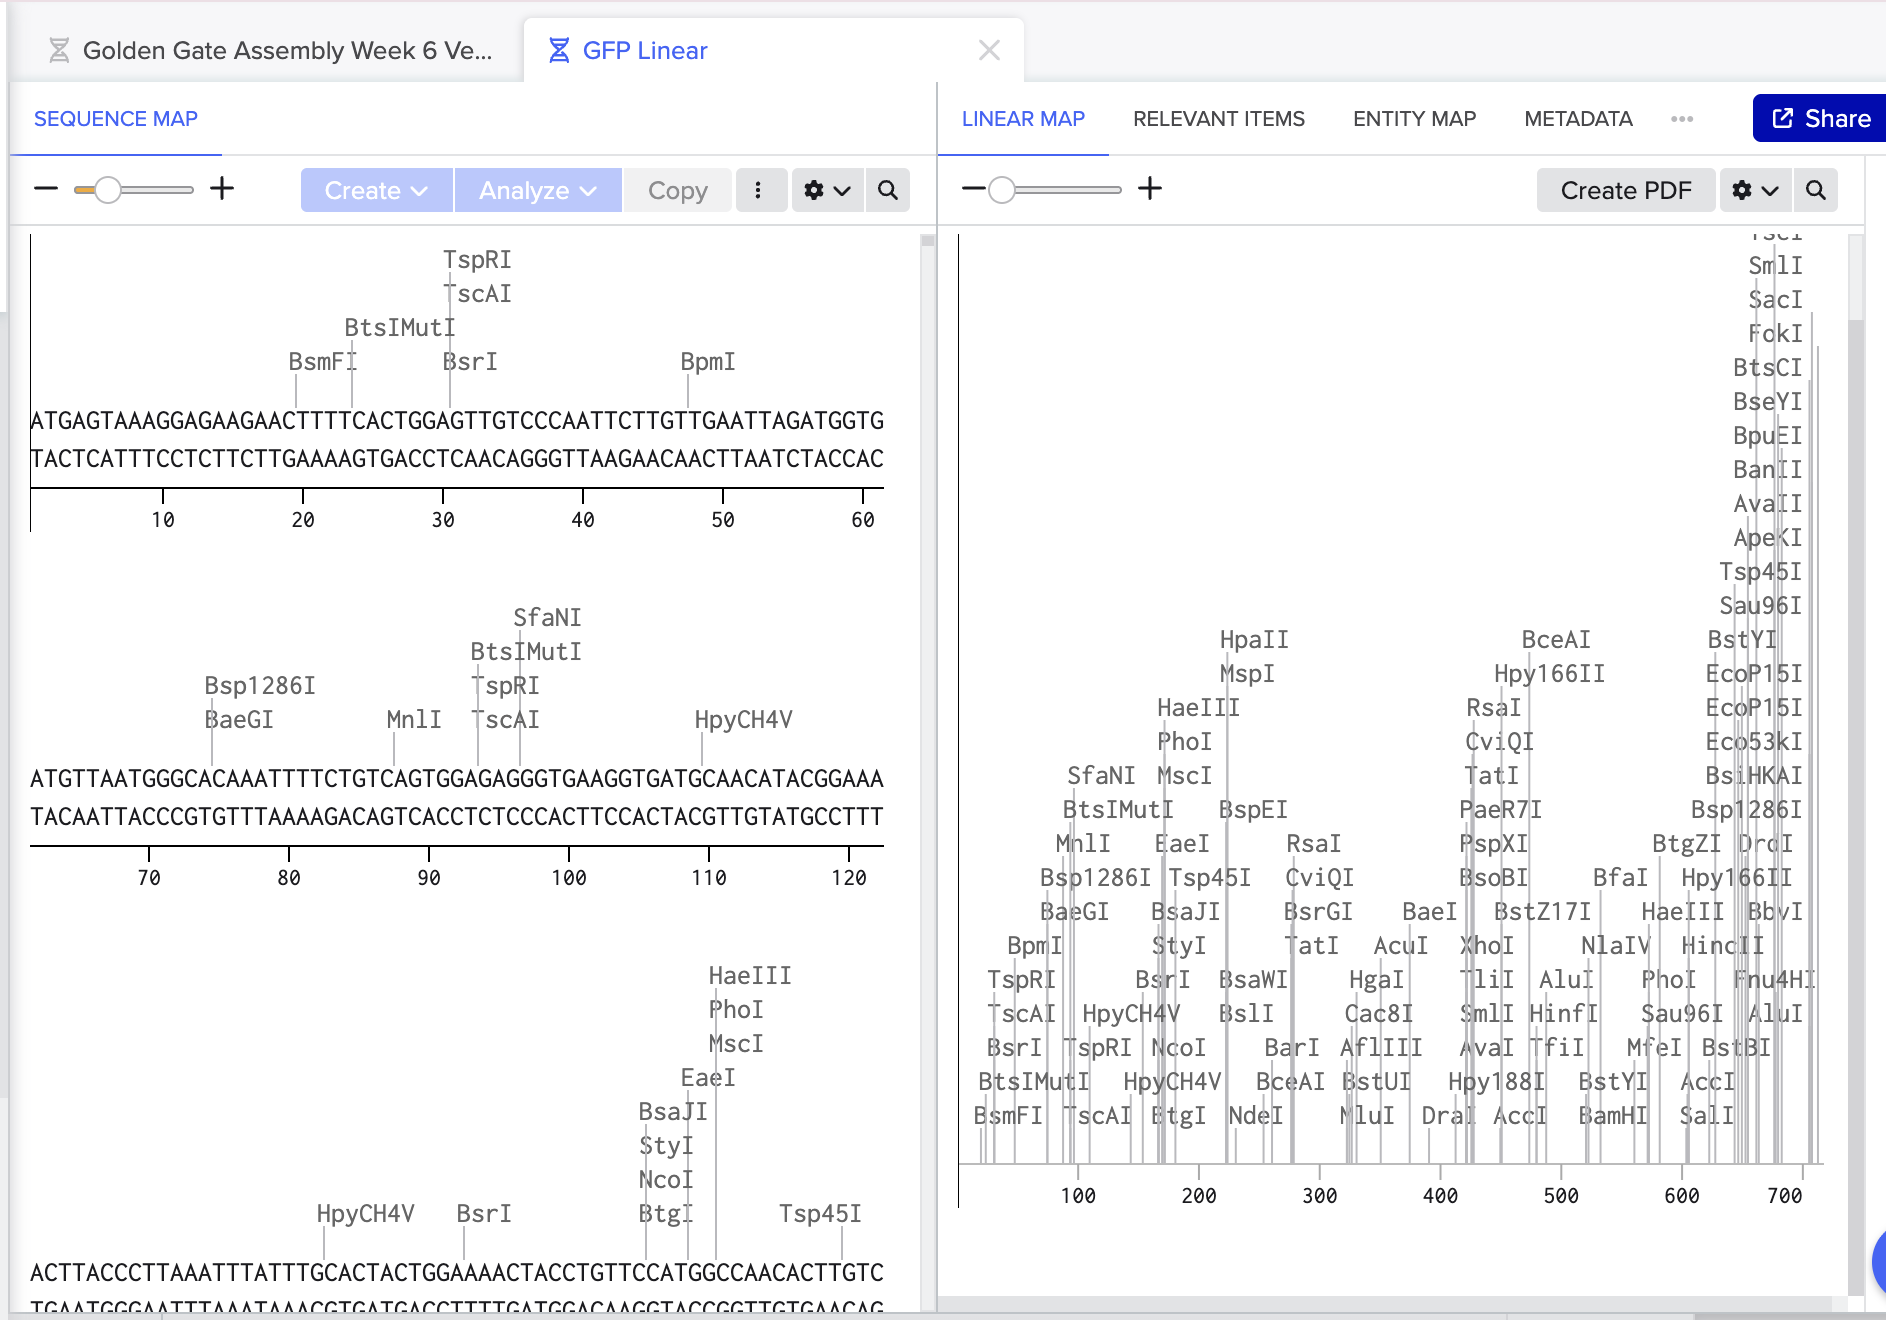
- I then prepared my BsaI restriction sites and overhangs for both the vector and insert ensuring correct directionality.
For my Vector we are cutting out the MCS so:
OVERHANG - RESTRICTION SITE - MCS - RESTRICTION SITE - OVERHANG
CTGAC GAGACC MCS GGTCTC TAGCA
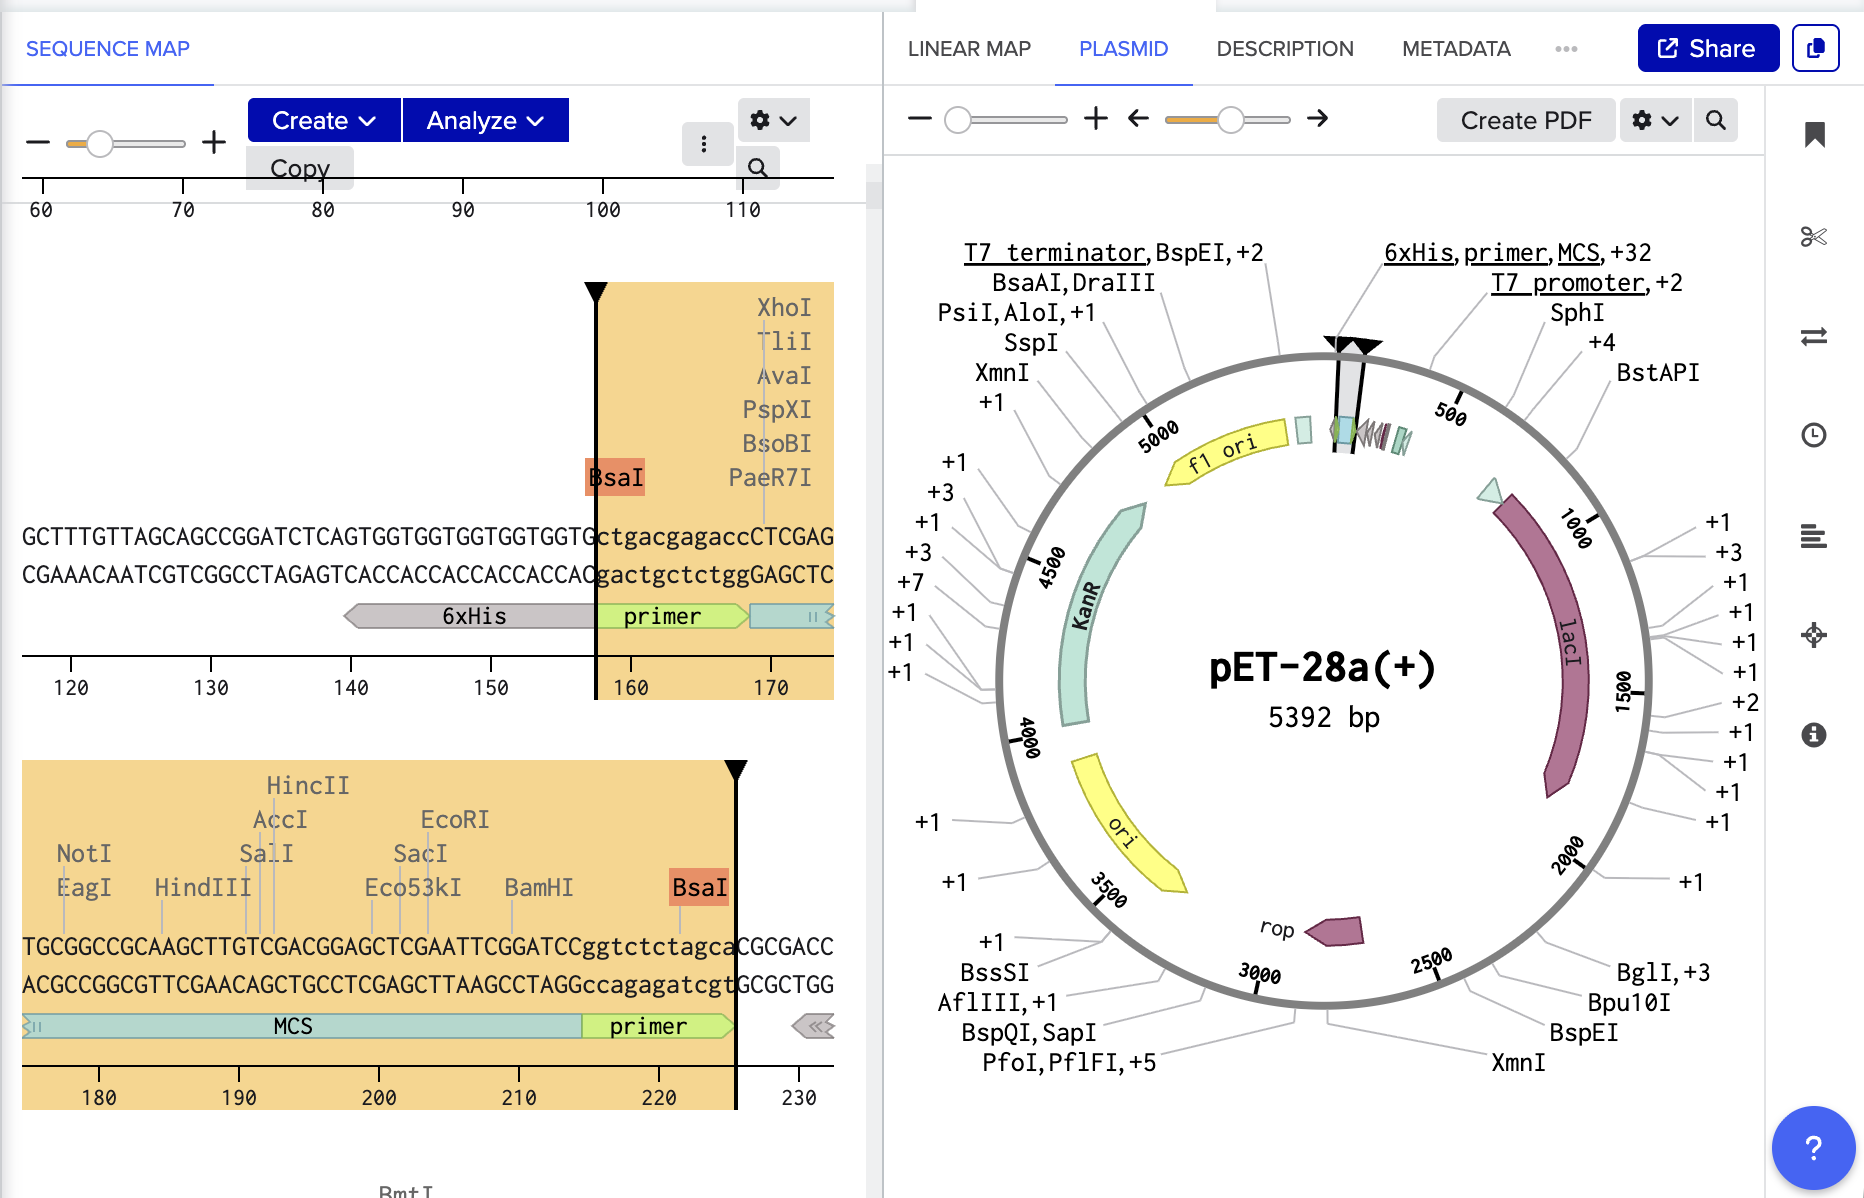
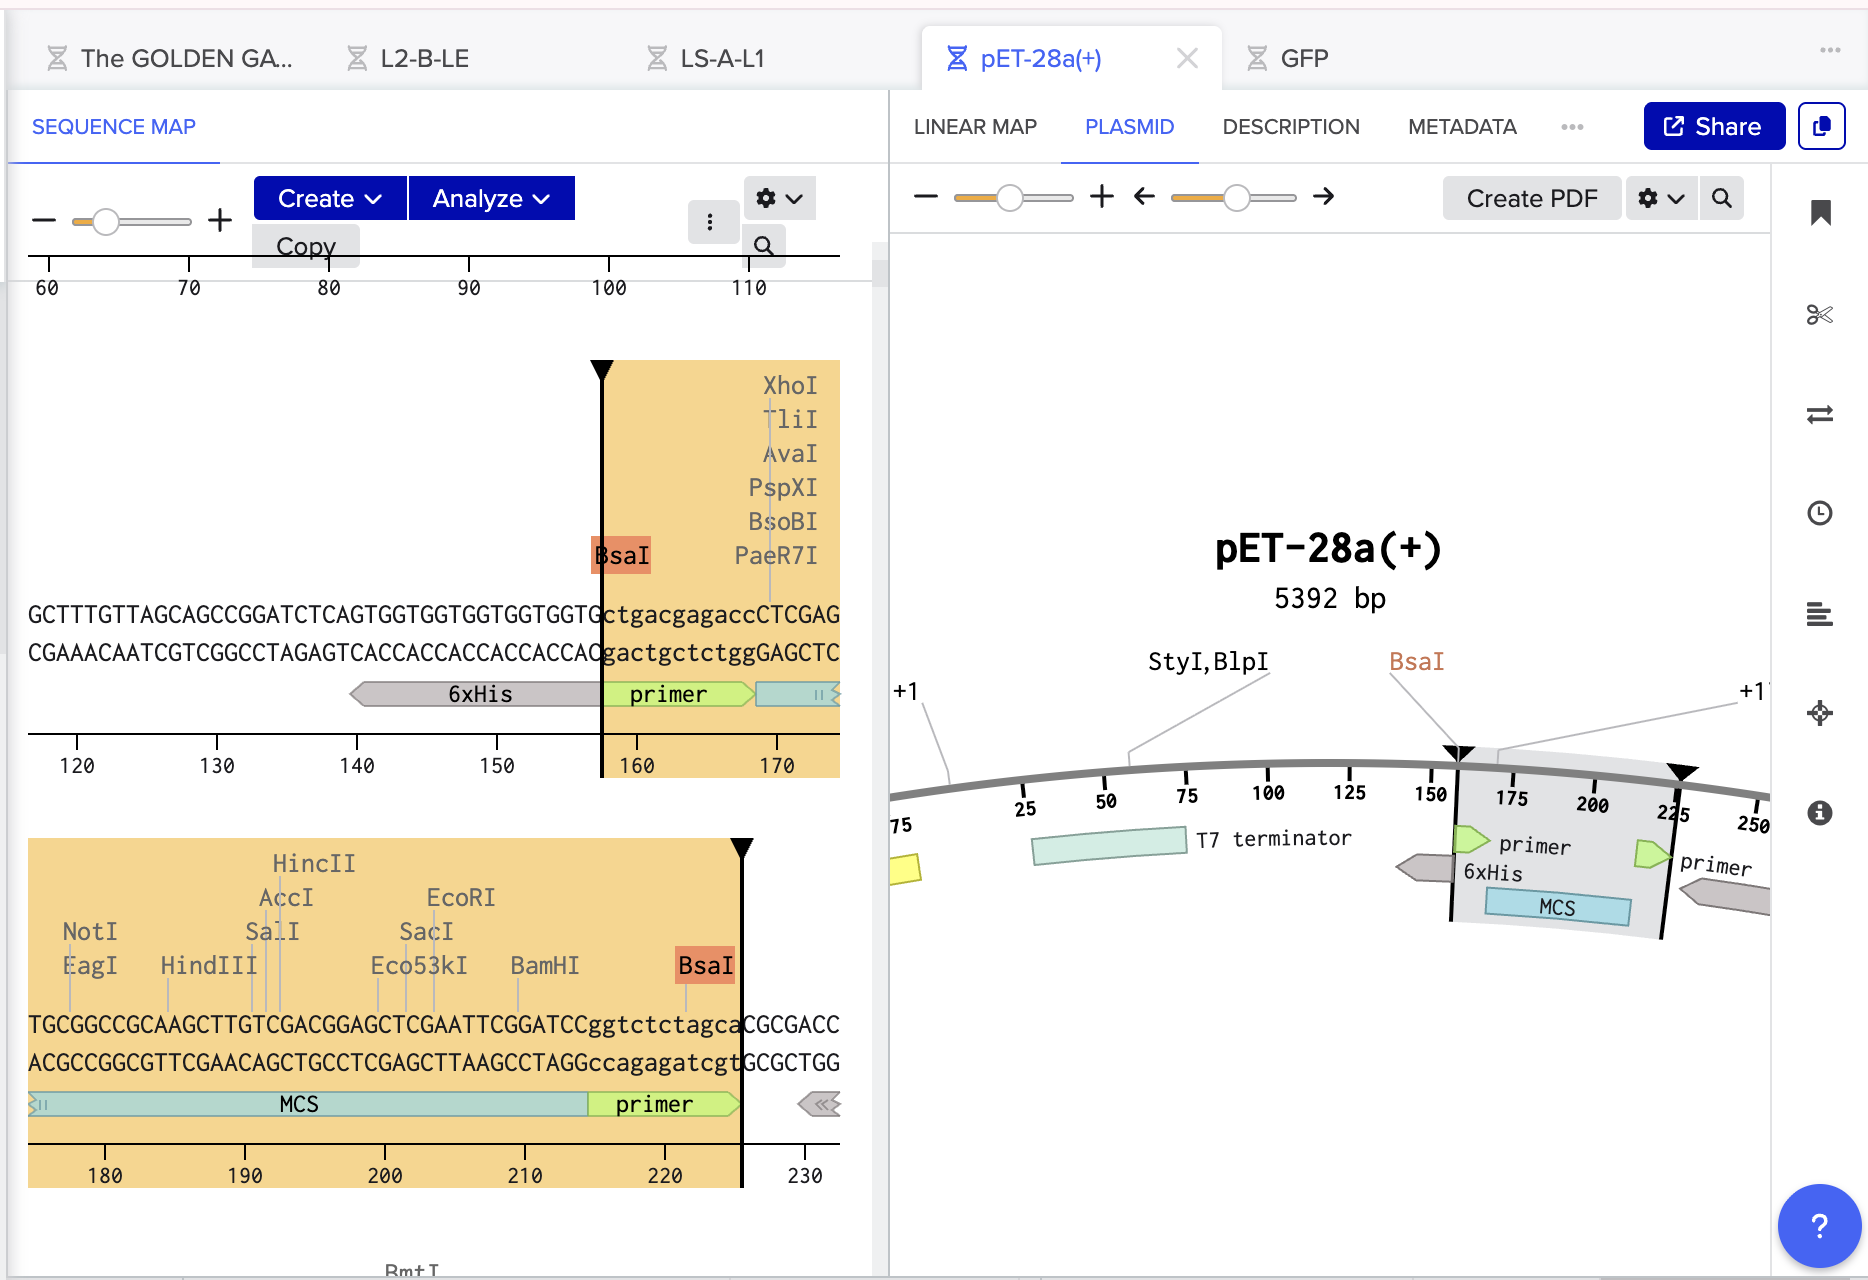
For my GFP Insert we are creating complimentry sticky end so:
RESTRICTION SITE - OVERHANG - GFP - OVERHANG - RESTRICTION SITE
GGTCTC GCTGA GFP AGCAC GAGACC
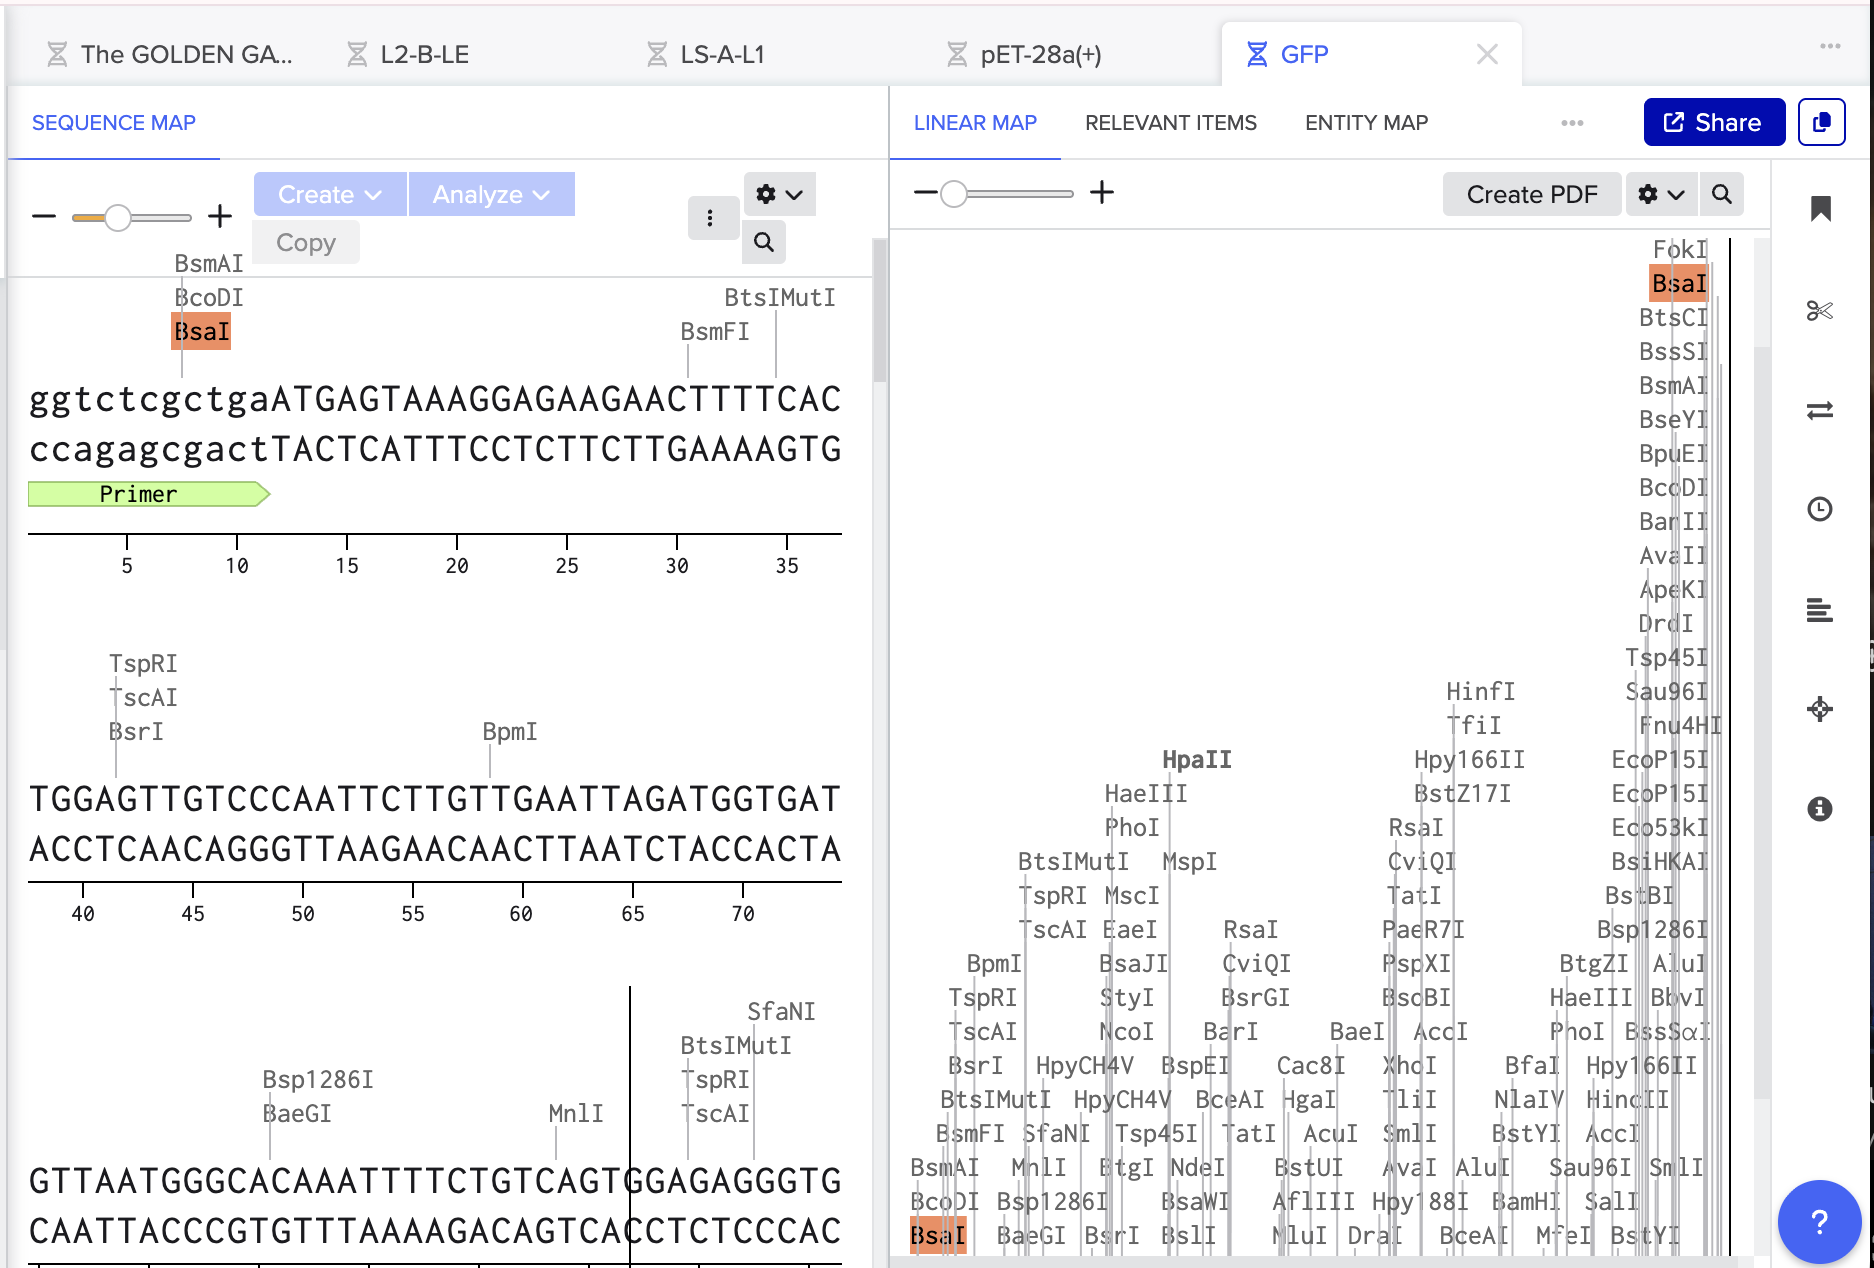
- Then I opened the Benchling Assembly Tool and selected Golden Gate. I added my vector as the backbone, making sure to select existing BsaI cut sites. I then added my GFP as the insert.
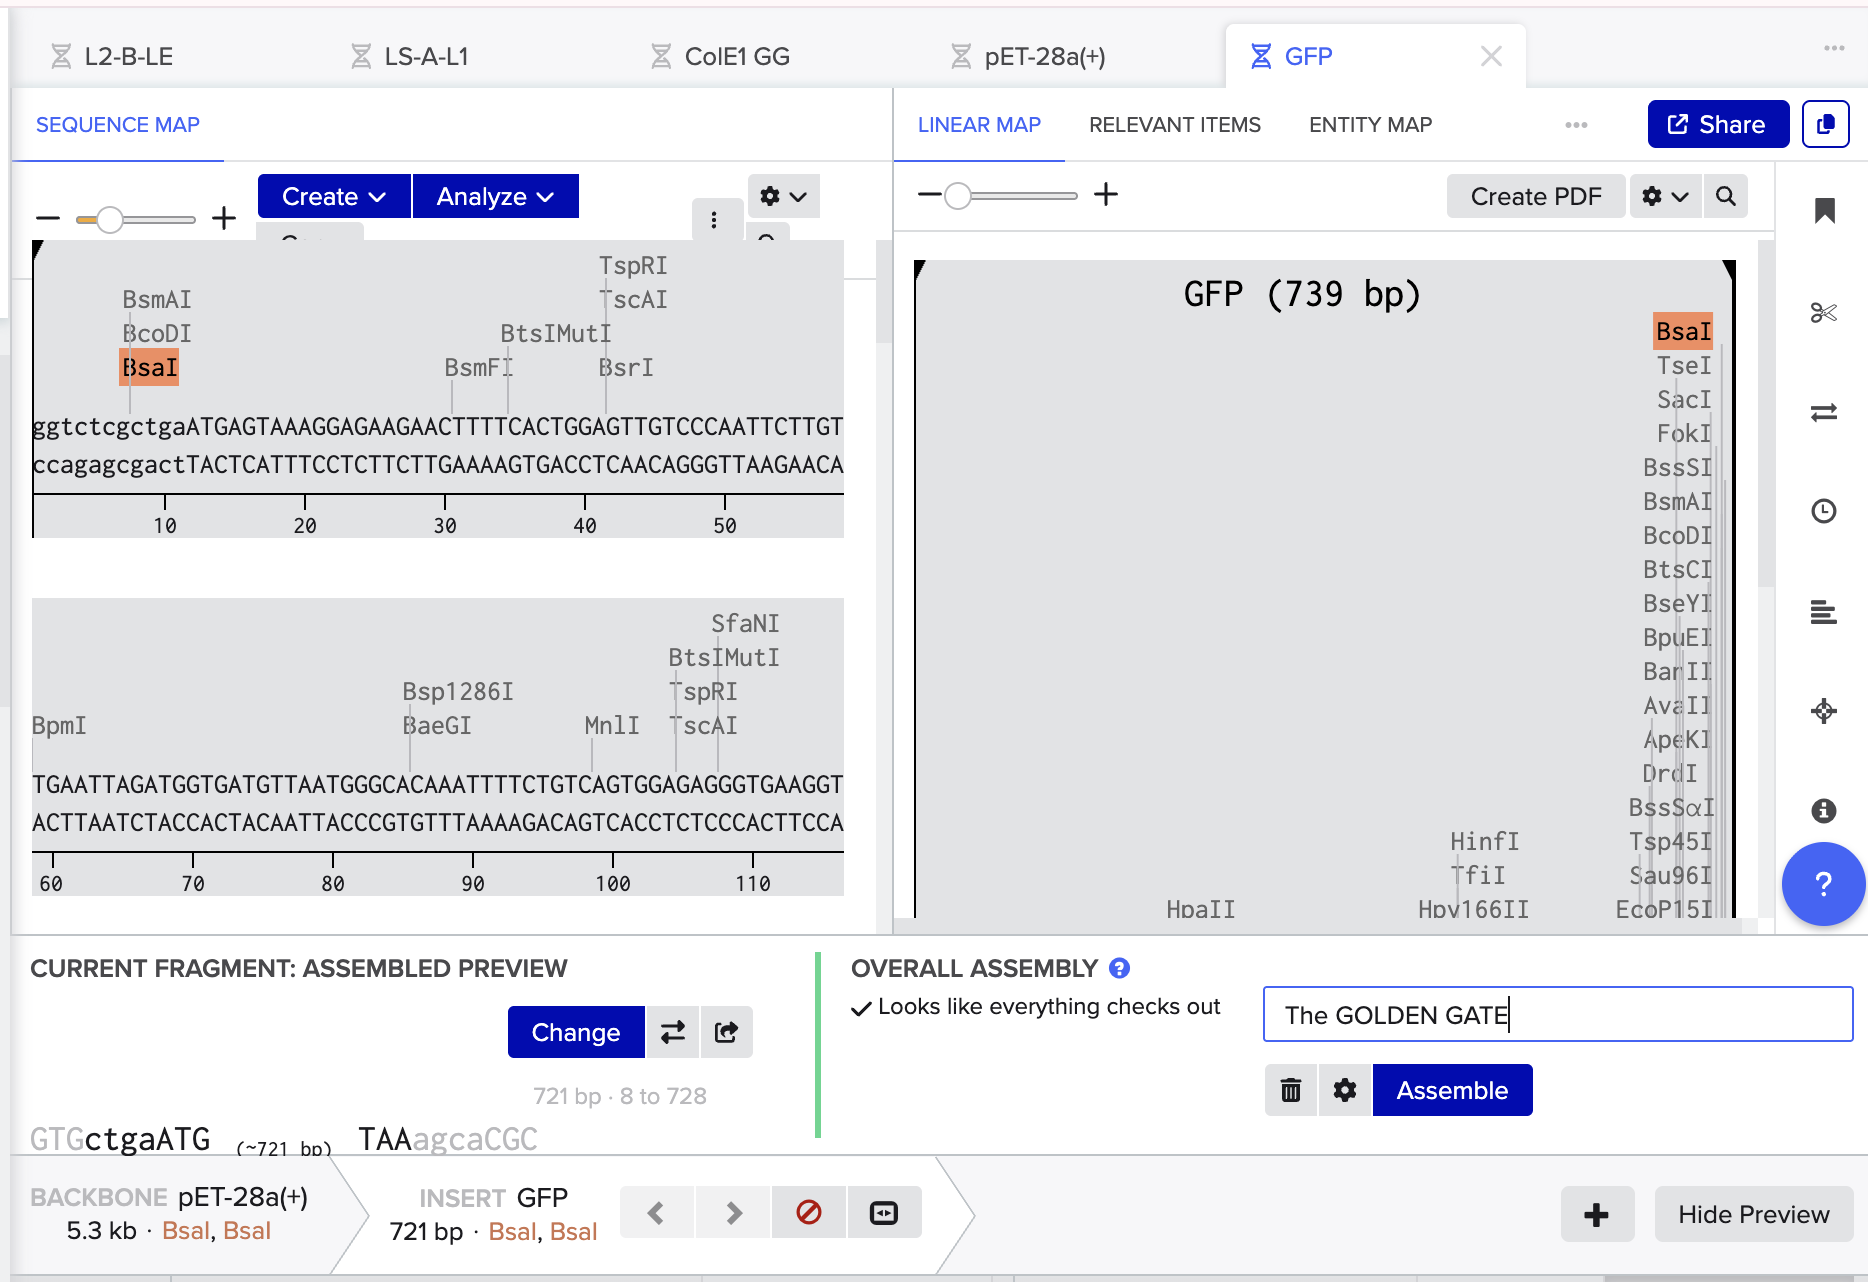
- Mercifully, this was accepted by Benchling and everything was complimentary and happy so I pressed assemble! And here we have the recombinant plasmid pET-28a(+)/ GFP:
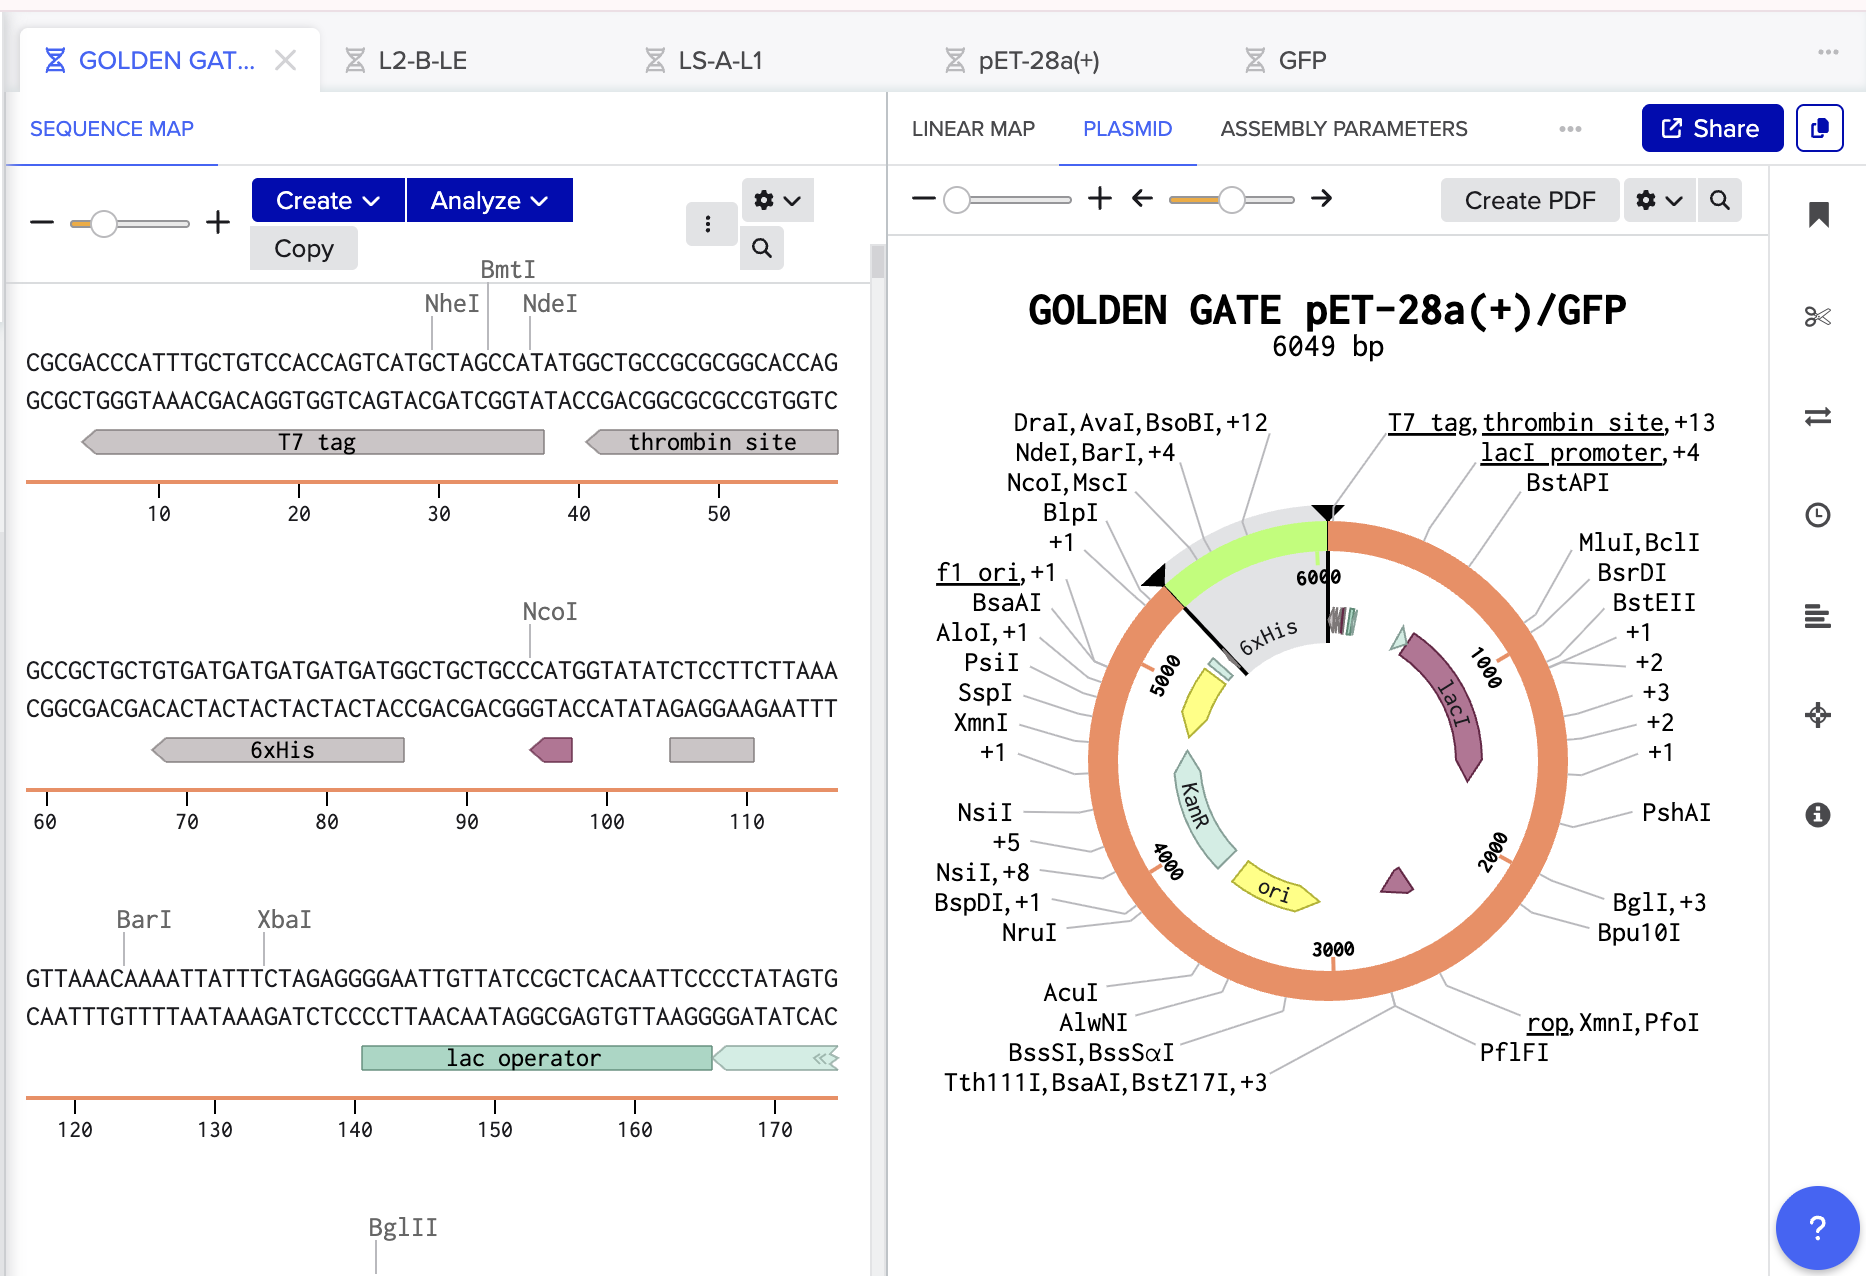
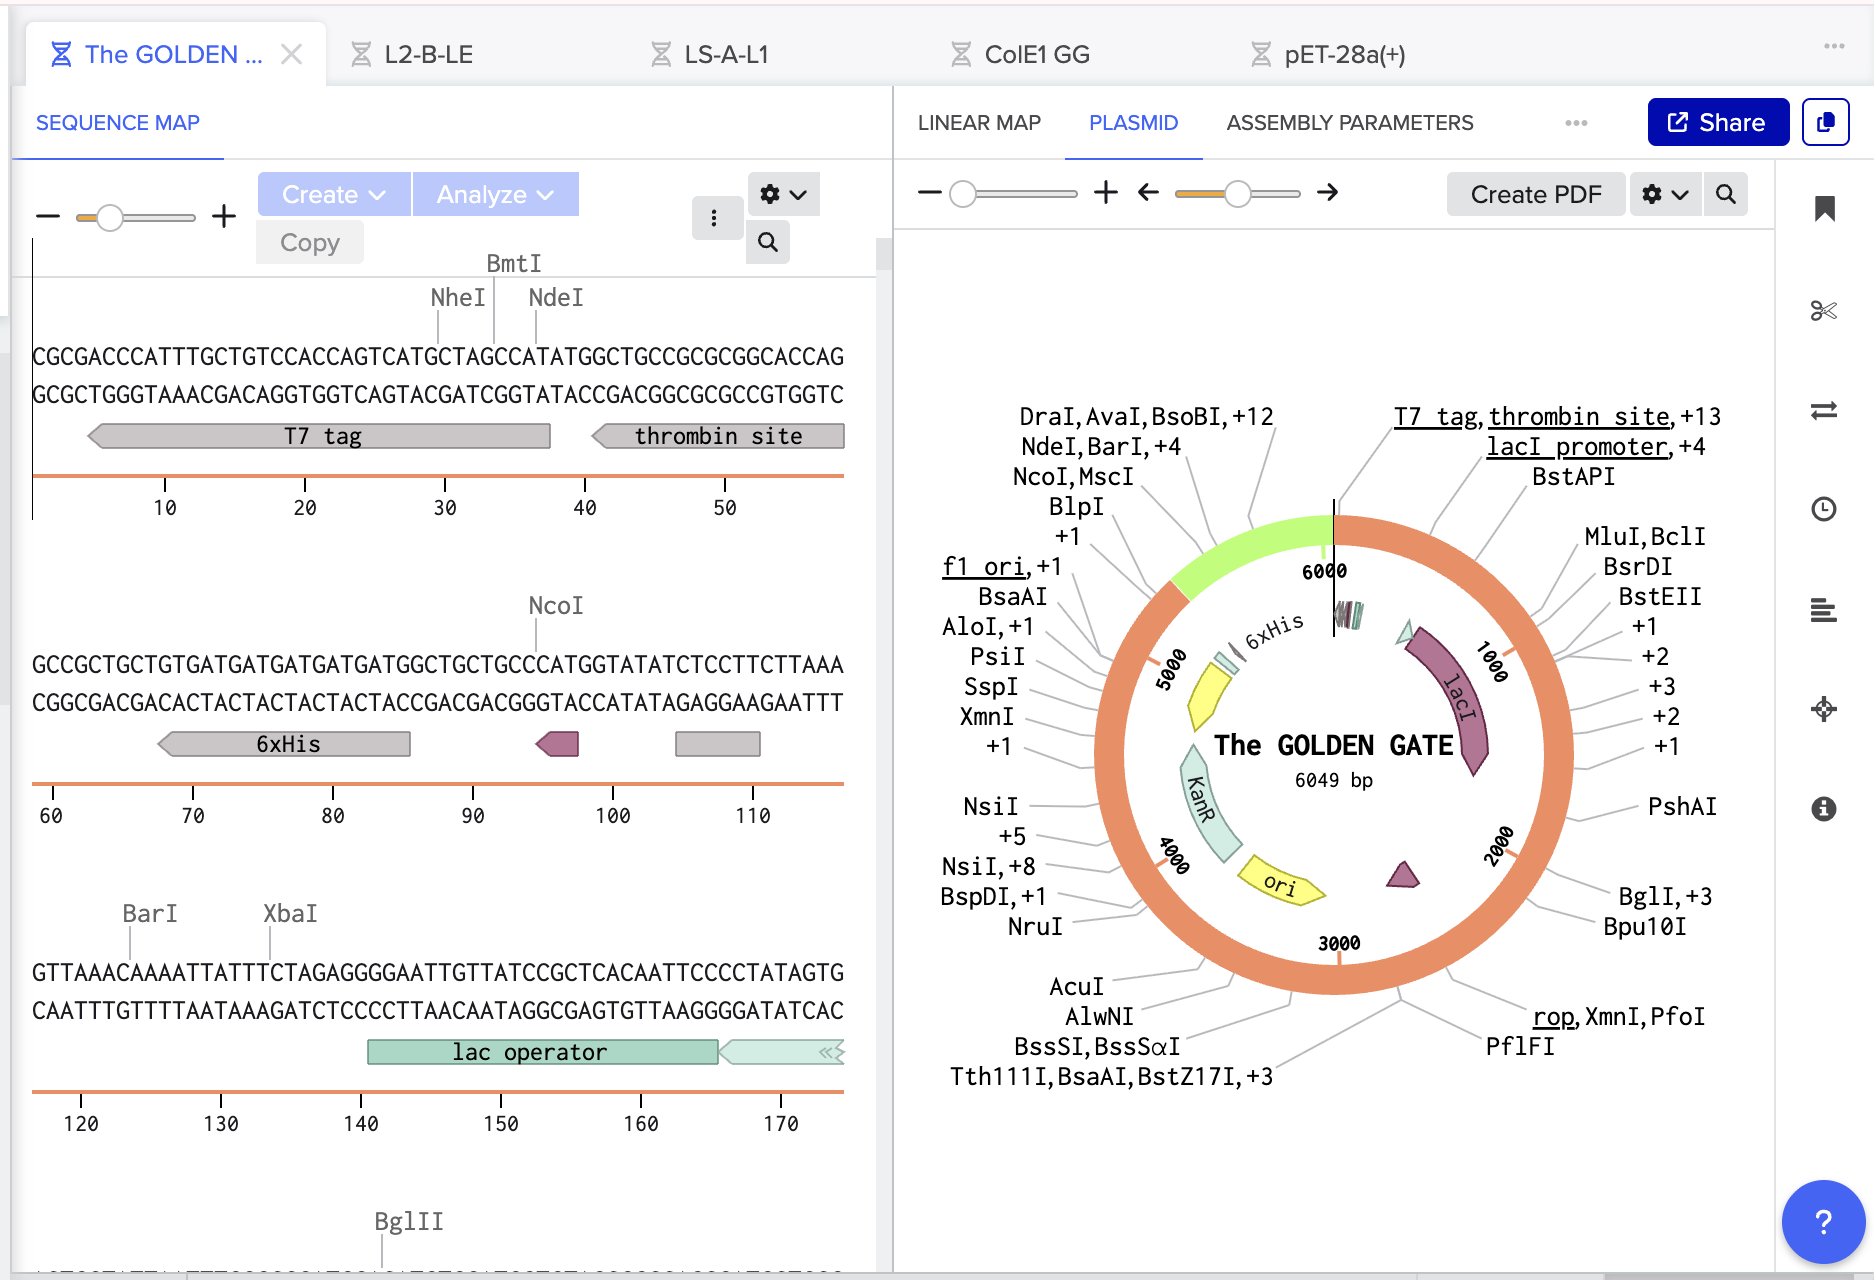
The Benchling Links are below:
Recombinant Plasmid: https://benchling.com/s/seq-kne6FeCThT1SY8yJEm6Y?m=slm-OTGqNj7vDDl0cWvWRb6E
Vector: https://benchling.com/s/seq-Sk6djpIs6kgEsF0KKI6H?m=slm-SvPeLVKrZAmtwOunSb27
Insert: https://benchling.com/s/seq-I2fzIiisOFvixW8peO3l?m=slm-uqvbBCJ0iNJbn08LPcx0
- Following Ice’s Benchling Basics Tutorial I also simulated a multifragment Golden Gate:
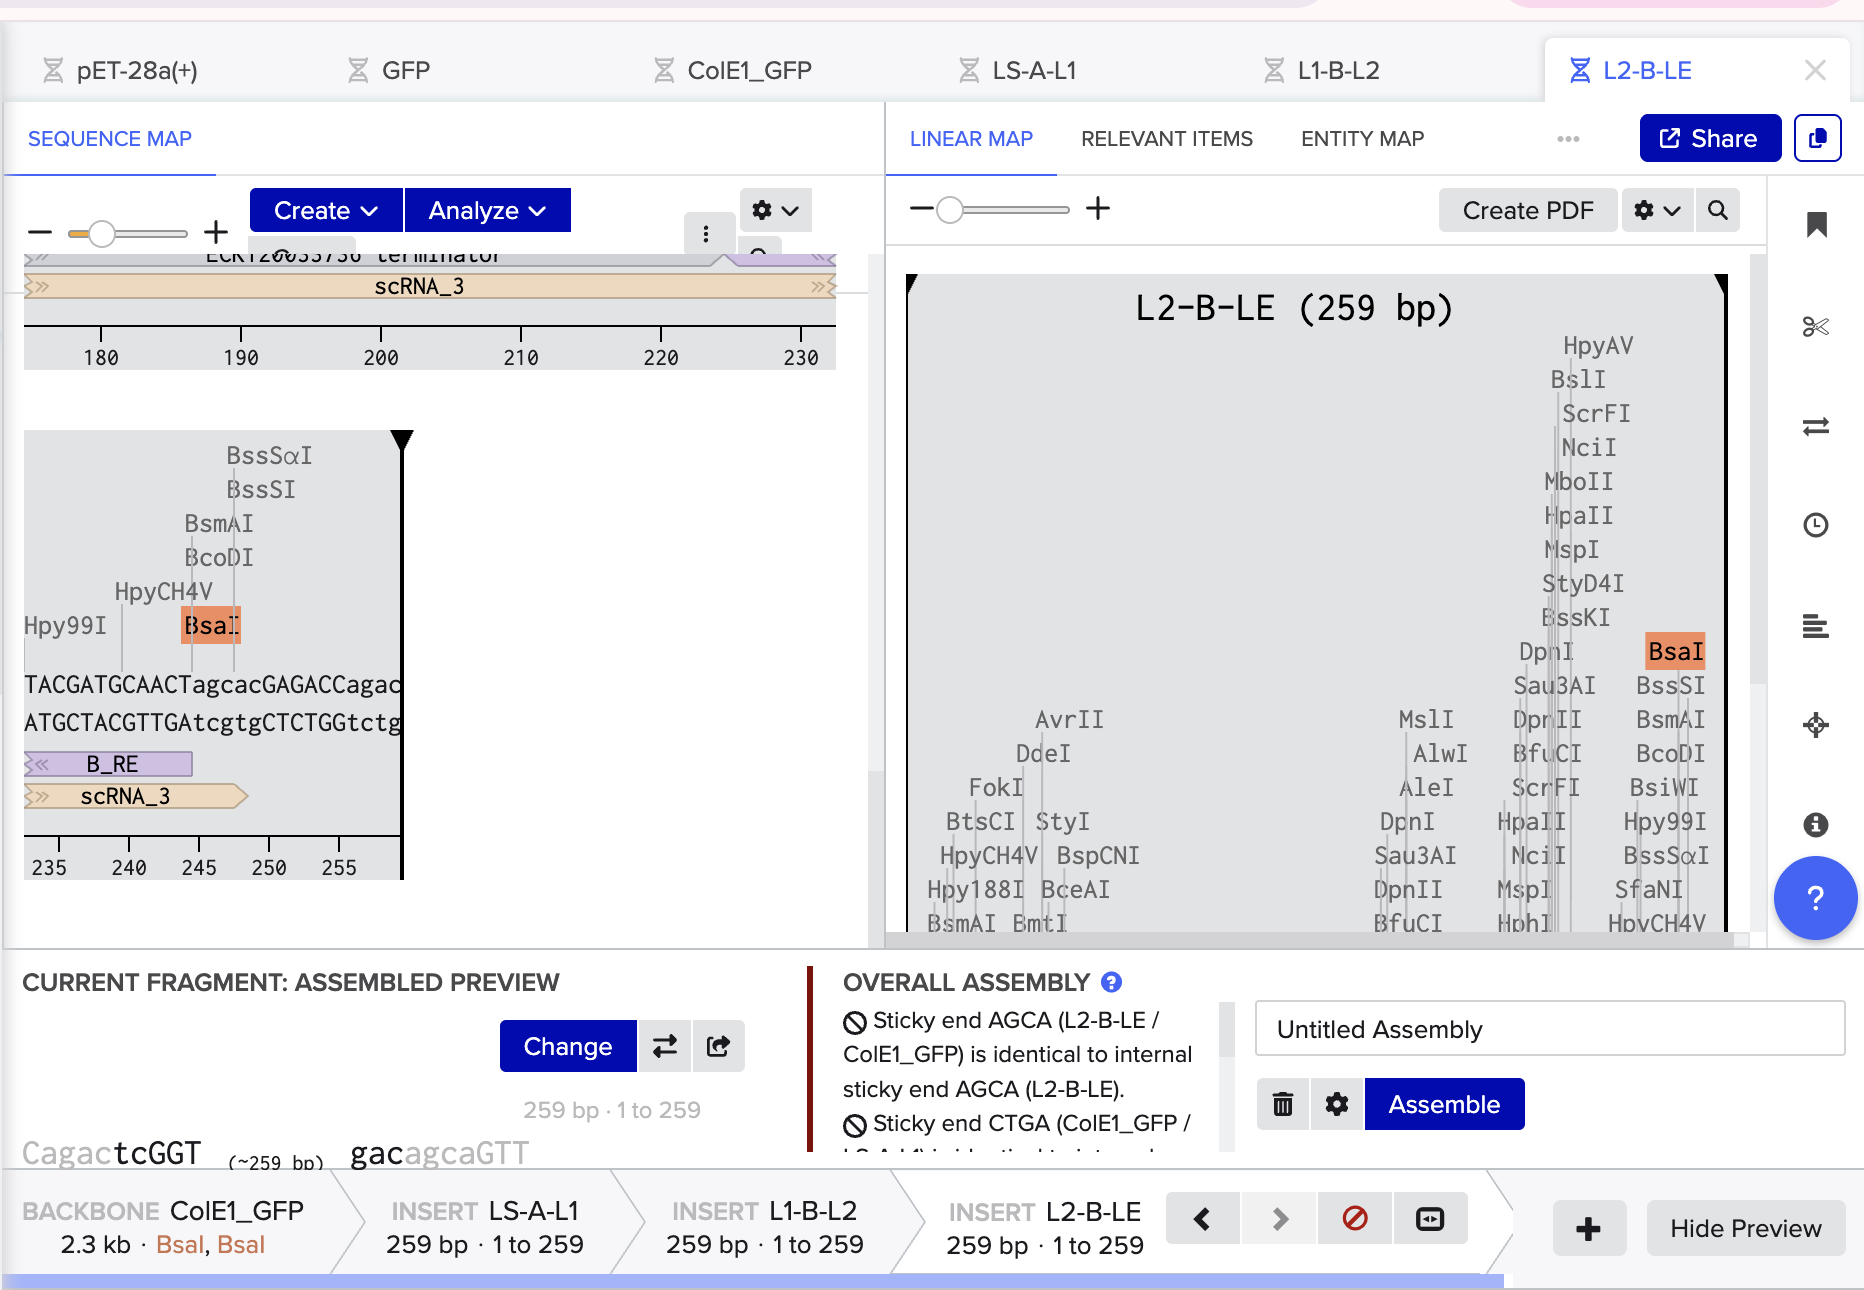
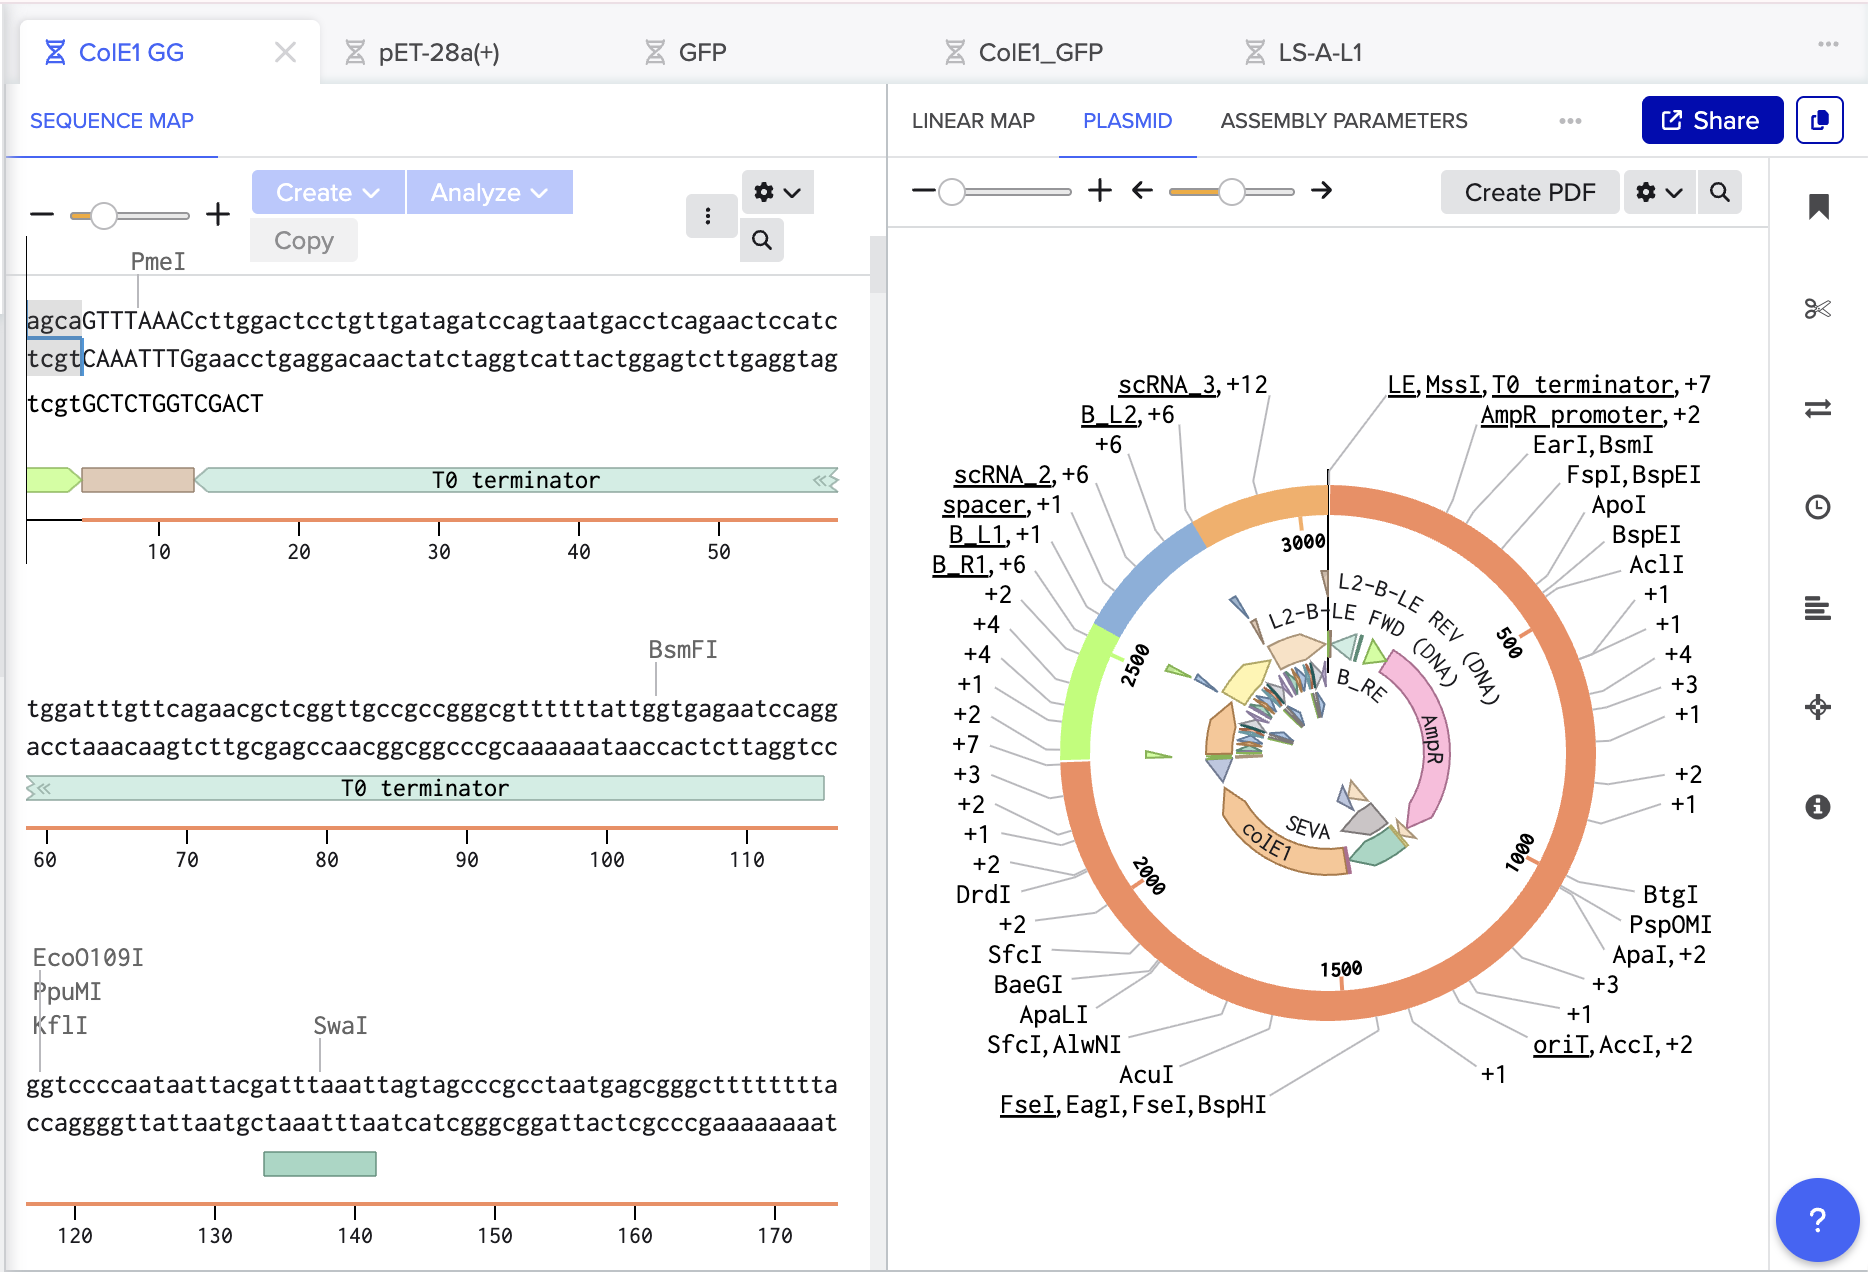
The Benchling Links is below:
PART B: Asimov Kernel not possible to complete without liscence access.
References:
Addgene. (n.d.). PCR protocol (thermal cycling). https://www.addgene.org/protocols/pcr/
Bloch, K. D., & Grossmann, B. (2001). Digestion of DNA with restriction endonucleases. Current Protocols in Molecular Biology, Chapter 3, Unit 3.1. https://doi.org/10.1002/0471142727.mb0301s31
Massachusetts Institute of Technology. (2015). Molecular cloning using the Gibson Assembly cloning kit (NEB E5510S). 7.15 Experimental Molecular Genetics. MIT OpenCourseWare. https://ocw.mit.edu/courses/7-15-experimental-molecular-genetics-spring-2015/857fcd5fb6b6b392ab478e8167337b8f_MIT7_15S15_Molecular.pdf
SnapGene. (n.d.). Gibson Assembly guide. https://www.snapgene.com/guides/gibson-assembly SnapGene. (n.d.). Golden Gate Assembly guide. https://www.snapgene.com/guides/golden-gate-assembly
Thermo Fisher Scientific. (n.d.). PCR cycling considerations—Time and temperature. https://www.thermofisher.com/uk/en/home/life-science/cloning/cloning-learning-center/invitrogen-school-of-molecular-biology/pcr-education/pcr-reagents-enzymes/pcr-cycling-considerations.html
Thermo Fisher Scientific. (n.d.). Phusion High-Fidelity DNA Polymerase (F531L). https://www.thermofisher.com/order/catalog/product/F531L
Week 7 HW: Genetic Circuits Part II

Important
PART 1: Intracellular Artificial Neural Networks (IANNs)
What advantages do IANNs have over traditional genetic circuits, whose input/output behaviors are Boolean functions?
Non-linear computing:
Boolean genetic circuits can only compute linearly separable functions. As Halužan Vasle and Moškon state, a single-layer perceptron “can solely learn to classify linearly separable classes” meaning XOR and more complex classifications are unachievable without exponentially more logic gates which rapidly becoming unscalable (Britto Bisso et al. 2025). The multilayer architecture of IANNs instead allows hierarchical processing across layers, where the output of one layer becomes a weighted regulatory signal for the next. This gives IANNS the advantage of being able to encode sophisticated behaviours with far fewer biological parts.
Analogue computation better suited to biological signals:
Boolean circuits treat gene expression as on or off, forcing continuous biological signals into discrete, binary categories. IANNs can speak the same language as biologically regulated networks with intermediate levels, analogue values, multi-input systems and non-monotonic behaviours (Gago et al., 2010). E.g. Britto Bisso et al. identify four ubiquitous chemical reaction networks: molecular sequestration, catalytic degradation, competitive binding, and activation/deactivation cycles, that all produce continuous threshold-like input-output curves resembling ReLU or sigmoidal activation functions. Since real intracellular signals are rarely binary, IANNs are architecturally better suited to these naturally graded, multi-dimensional inputs whereas Boolean circuits must artificially threshold them, introducing error and information loss.
Tuneable weights:
In Boolean circuits the logic function is hardwired into their topology and changing behaviour requires redesigning the circuit entirely. In IANNs, weights are encoded in production rates e.g promoter strengths, ribosome binding site efficiencies or enzyme catalytic rates, meaning the same circuit architecture can be reprogrammed to implement different functions simply by tuning these parameters (Britto Bisso et al. 2025) which is a flexibility Boolean circuits fundamentally cannot achieve.
Limitations:
Current IANNs predominantly rely on in silico pre-training with weights hardwired biologically afterwards, online learning within a living cell remains unsolved (Halužan Vasle & Moškon, 2024). Furthermore, the number of perceptrons stably deliverable into a cell is limited by current DNA delivery methods which constrains the circuit complexity achieveable in practice (Britto Bisso et al. 2025).
Describe a useful application for an IANN; include a detailed description of input/output behavior, as well as any limitations an IANN might face to achieve your goal.
A useful future application for IAAN is as a intracellular diagnostic biosensor. These could continuously monitoring multiple molecular biomarkers to distinguish early-stage oncogenic signalling from normal cellular behaviour. Ultimately, the IAAN could control a targeted response e.g trigger apoptosis or a therpeutic pathway when a cancerous state is confirmed.
While this has not yet been experimentally realised, Britto Bisso et al. (2025) demonstrate in silico that biomolecular neural networks can classify healthy versus cancerous cells across 19 tissue types using non-linear decision boundaries impossible, Rizik et al. (2022) proved that genuine multilayer perceptron architectures can be physically implemented in living cells using the perceptgene framework and Senn et al. (2026) demonstrate that synthetic gene circuits sensing multiple RAS-driven oncogenic inputs can selectively kill cancer cells in vivo (using Boolean AND-gate logic). An future IANN biosensor would provide a multilayer, continuously weighted circuit capable of detecting and responding to cancerous cells.
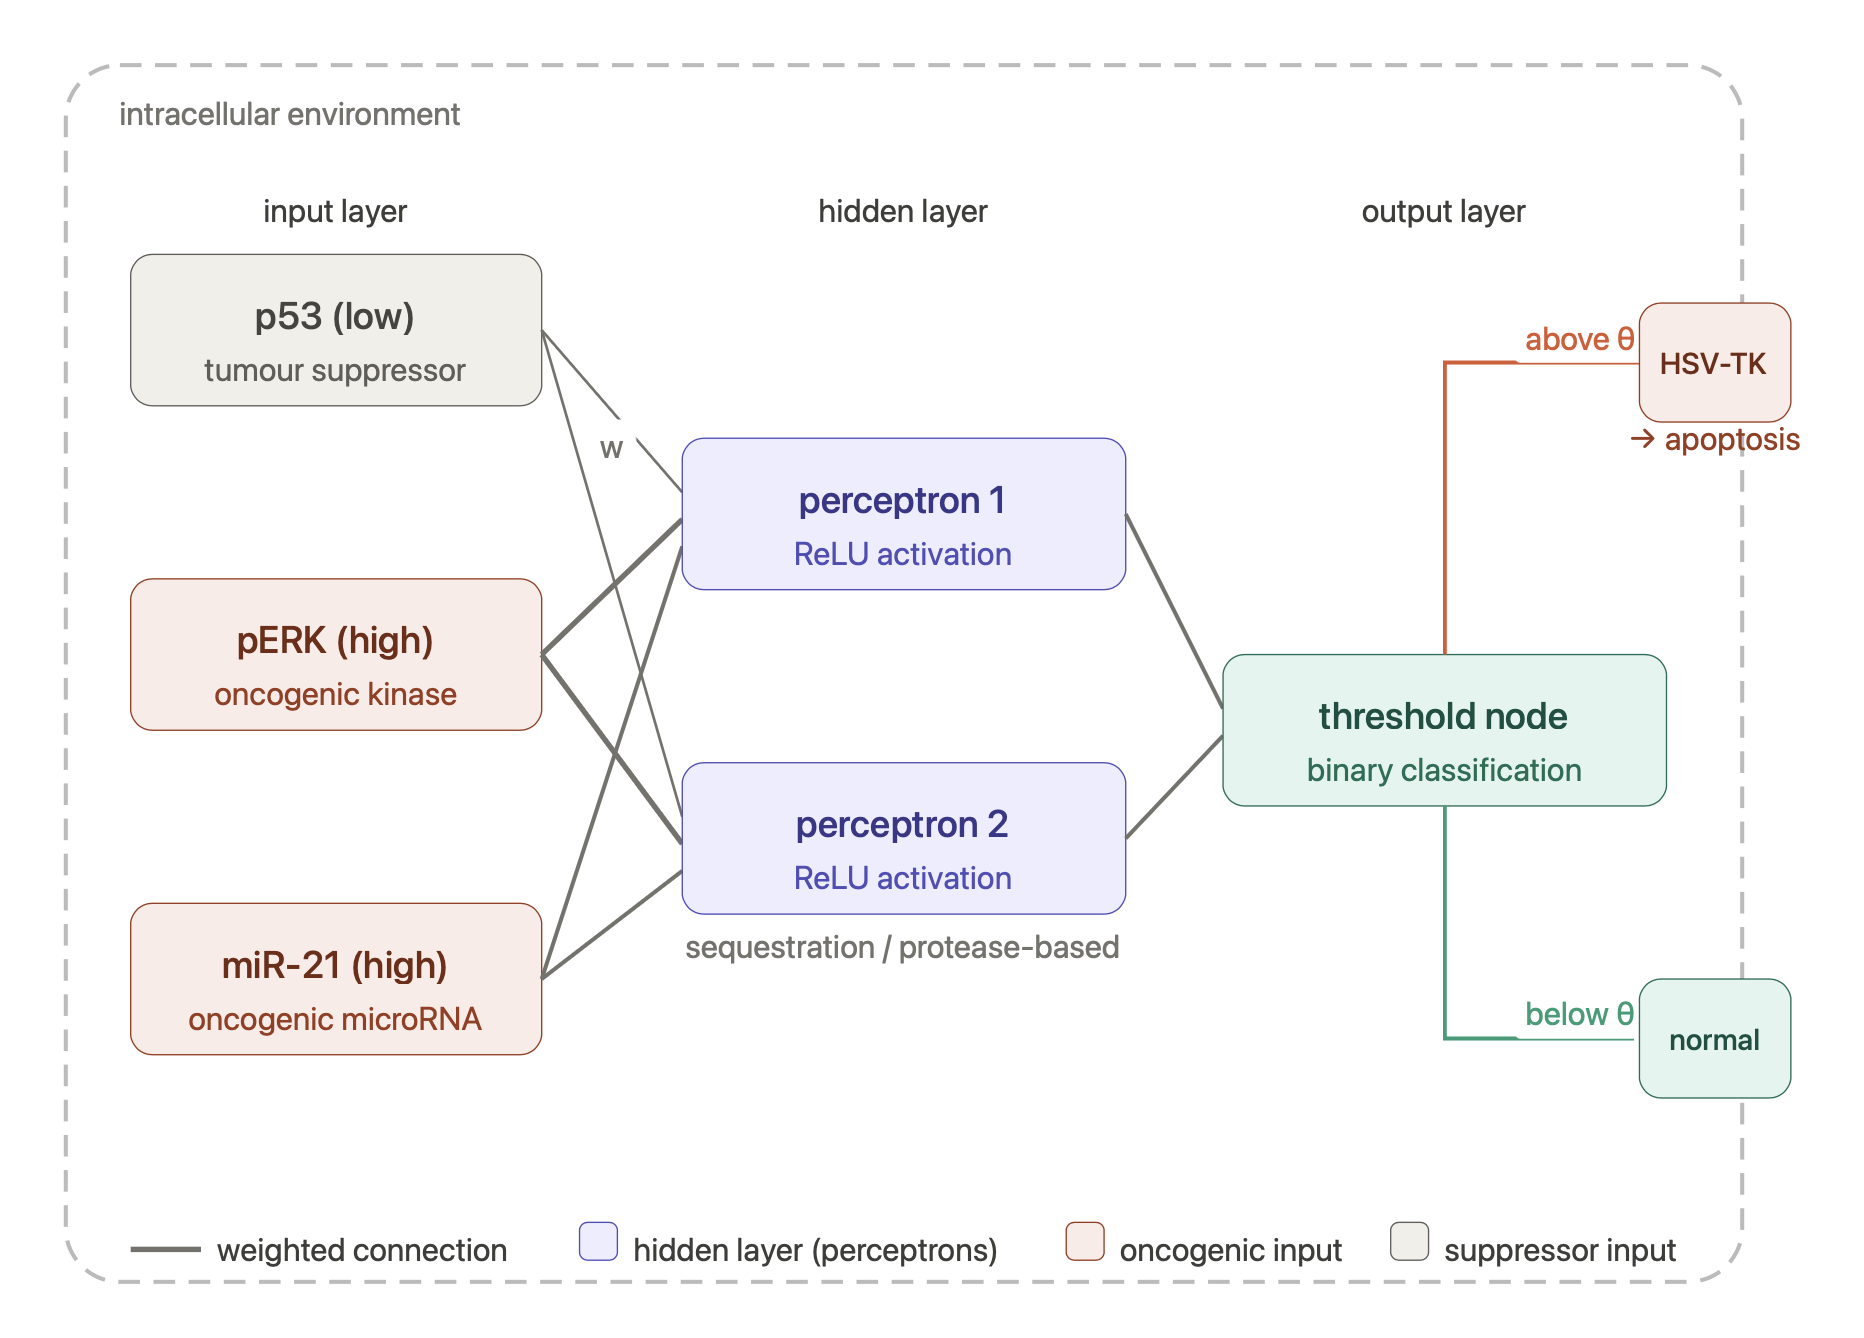
Schematic made with Claude
Input/Output Behaviour:
The IANN uses molecular concentrations as inputs, processes them through a bio-molecular circuit (protein-protein interactions, DNA strand displacement or RNA interference) and produces a molecular output.
Several biomarkers are simultaneously monitored and their combined weighted pattern identifies the cancerous state (encoding weights in binding affinities, Hill coefficients and promoter strengths) reflecting the reality that healthy and cancerous cells differ in degree of expression rather than binary presence or absence(Rizik et al. 2022).
Inputs could include biomarkers such as:
- Low concentration of a tumor suppressor protein (e.g p53)
- High concentration of an oncogenic signaling kinase (e.g phosphorylated ERK)
- High expression of a specific microRNA associated with cancer progression (e.g miR-21)
These inputs would be processed through a hidden layer of sequestration-based or protease-based perceptrons implementing ReLU-like activation functions.
The output layer then produces a binary classification e.g below threshold the cell is deemed healthy and no action is taken but above threshold a therapeutic effector such as the HSV-TK suicide gene demonstrated by Senn et al. (2026) is expressed and selectively trigger cancer cell death. Critically, because the decision boundary is non-linear and continuously tuneable, the IANN could discern overlapping expression profiles that would cause a Boolean circuit to misfire.
Limitations:
- Adaption:
Current IANNs rely on in silico pre-training with fixed weights , the network cannot adapt to tumour evolution or emerging resistance mutations once deployed (Halužan Vasle & Moškon, 2024). Even Senn et al. (2026), working with a simpler Boolean architecture, acknowledge that heterogeneous cancer cell lines required circuit adaptation for each target cell type, highlighting how demanding this problem is.
- Metabolic Burden:
Any synthetic gene circuit introduces exogenous components (DNA/RNA/proteins) that consume the host cell’s resources such as ATP, amino acids. This creates a metabolic burden that can weaken the cell, alter its normal function or lead to cell death before the IANN completes its task (Halužan Vasle & Moškon, 2024). This is an even greater challenge for multilayer IANNs, where each additional layer further adds to this burden.
- Scalability:
Britto Bisso et al. (2025) note there is an upper limit to the number of perceptrons stably deliverable into primary therapeutic cell lines, constraining classification accuracy. Senn et al. (2026) acknowledge, multi-component delivery into solid tumours remains a fundamental barrier and integrating the additional complexity of a multilayer IANN architecture onto a deliverable vector is even more challenging.
Draw a diagram for an intracellular multilayer perceptron where layer 1 outputs an endoribonuclease that regulates a fluorescent protein output in layer 2.
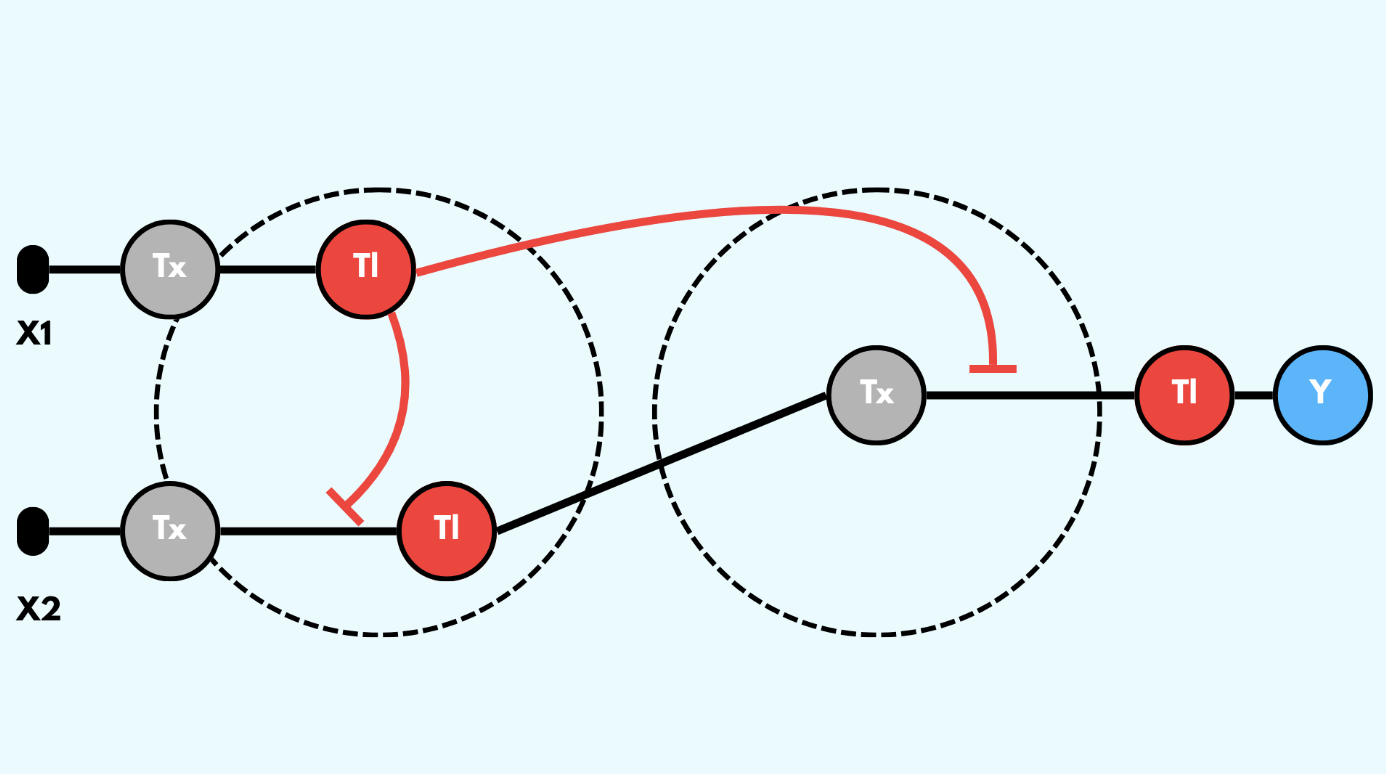
Part 2: Fungal Materials
What are some examples of existing fungal materials and what are they used for? What are their advantages and disadvantages over traditional counterparts?
Fungal Materials, Applications and Analysis by Isobel LeonardWhat might you want to genetically engineer fungi to do and why?
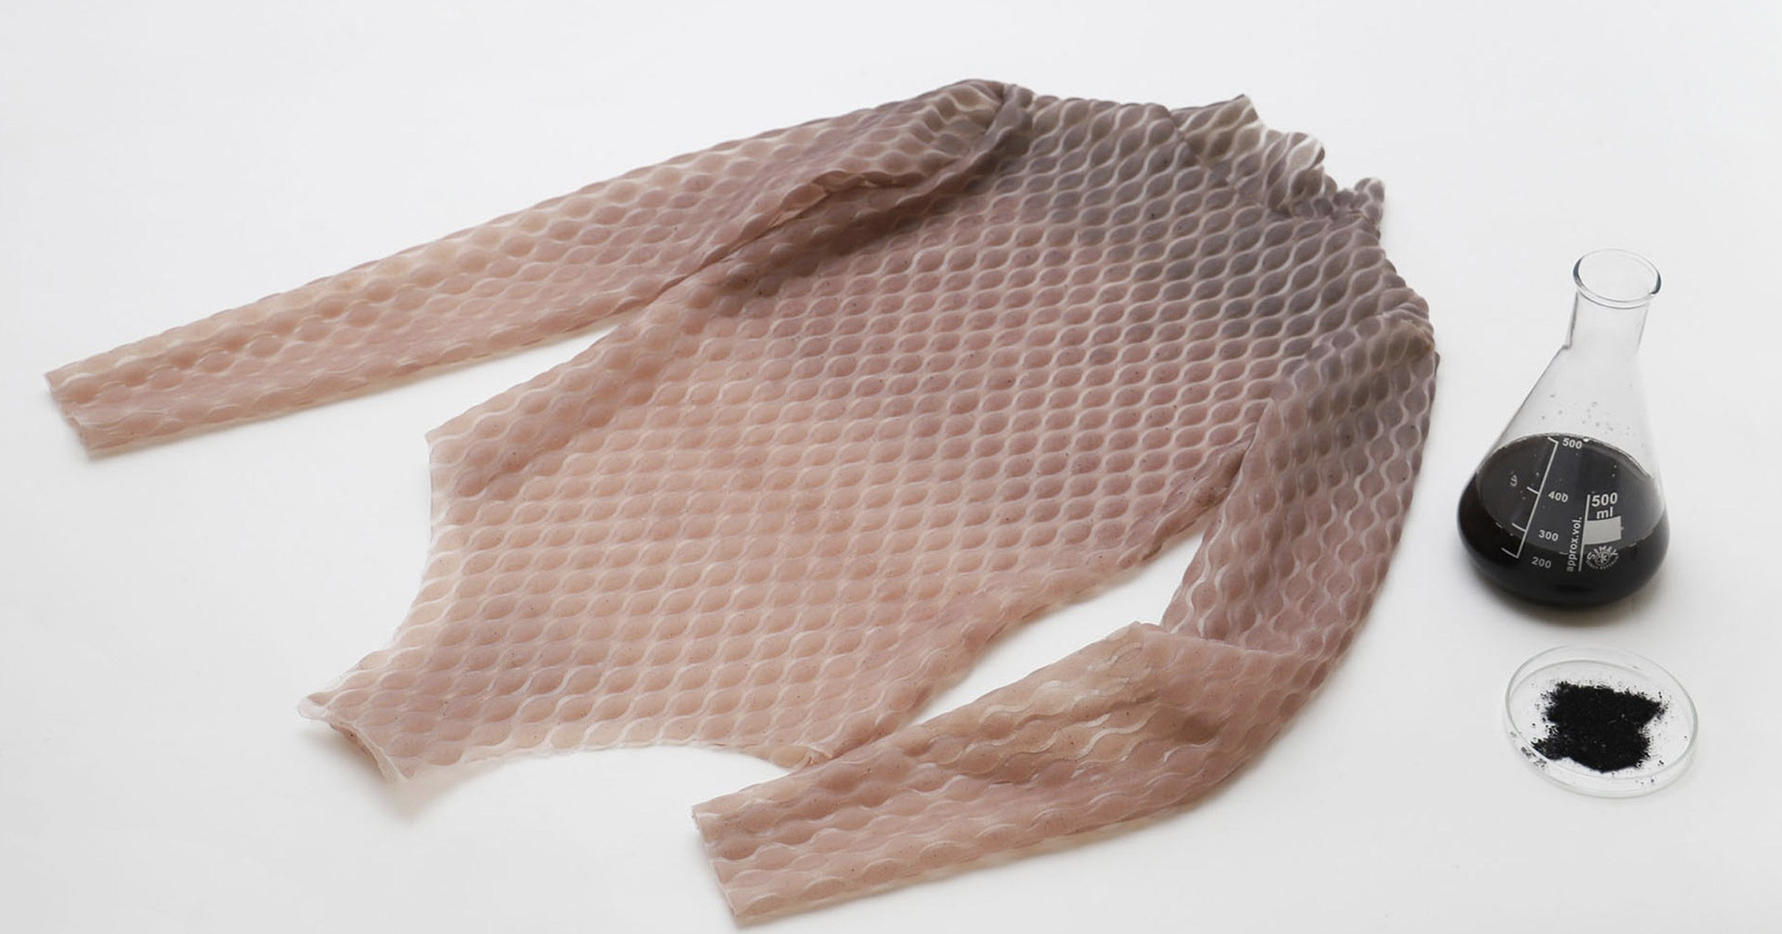
Maca Barrera 2024, Melanin-spiked bodysuits provide sun protection in Melwear concept :https://www.dezeen.com/2024/06/10/melanin-melwear-maca-barrera-design-technology/
I am interested in the genetic engineering of the pigmentation pathways of fungi to create an engineered living material for textiles and design. Fungi naturally produce a diverse palette of pigments including carotenoids, flavins, melanins, quinones and violacein. Genetically engineering the over-expression or selective activation of these pathways could eliminate the need for post-processing dyeing entirely in the textile industry which accounts for approximately 20% of global industrial water pollution. This concept has already been demonstrated in bacterial cellulose, where recombinant tyrosinase expression achieved dark black melanin coloration robust to material use, with the potential for optogenetic patterning of gene expression to create spatially controlled pigment patterns (Walker et al .2025).
Beyond static colour, engineering responsive pigmentation in fungal materials could have interesting applications in bio-sensing or environmentally responsive wearables that could function as a reactive fungal second skin. For example, by placing melanin-producing enzymes under the control of environmentally sensitive promoters, a fungal materials could be designed to change colour in response to mechanical stress, humidity, UV exposure or temperature and provide real-time feedback on the body or environmental conditions of the wearer without the addition of electronics.
What are the advantages of doing synthetic biology in fungi as opposed to bacteria?
Eukaryotic:
Fungi are eukaryotes, meaning that unlike bacteria they possess specialised organelles like the Endoplasmic Reticulum (ER) and Golgi apparatus which enable post-translational modifications e.g. glycosylation, chaperone assisted folding to help complex proteins into the correct 3D strcuture and disufide bond formation, necessary to stabilise the structure of secreted proteins, such as antibodies. These are fundamentally eukaryotic properties and cannot be replicated in bacterial systems. They is essential for engineering structurally complex proteins such as hydrophobins or silk-like fibres require proper folding to function mechanically.
Substrate extension:
Fungi extend their mycelium to reach organic food sources and incorporate these particles into their hyphal network, with glucan and chitin rich hyphae binding themselves to low-cost and renewable substrates that are rich in cellulose and lignin together. Bacteria generally cannot efficiently degrade lignocellulosic agricultural waste. This means fungal synthetic biology can be deployed directly on cheap, abundant waste substrates without expensive pre-treatment, making it more economical at scale.
Metabolic and genetic diversity:
Fungi have extensive secondary metabolic pathways encoded by Biosynthetic Gene Clusters, this means they produce diverse compounds such as terpenoids and polyketides e.g.statins, antibiotics. Fungi can generate four times as many secondary metabolites as bacteria.
Secretory Pathways:
Fungi are high-volume producers of extracellular enzymes and are capable of secreting large amounts of proteins directly into the culture medium. This makes downstream purification much easier when compared to bacteria.
References
Britto Bisso, F., Shree, D., Zhu, Y., & Cuba Samaniego, C. (2025). Design principles of neuromorphic computing using genetic circuits. bioRxiv. https://doi.org/10.64898/2025.12.01.691482
Gago, J., Landín, M., & Gallego, P. P. (2010). Strengths of artificial neural networks in modelling complex plant processes. Plant Signaling & Behavior, 5(6), 743–745. https://doi.org/10.4161/psb.5.6.11711
Halužan Vasle, A., & Moškon, M. (2024). Synthetic biological neural networks: From current implementations to future perspectives. BioSystems, 238, 105164. https://doi.org/10.1016/j.biosystems.2024.105164
Rizik, L., Danial, L., Habib, M., Weiss, R., & Daniel, R. (2022). Synthetic neuromorphic computing in living cells. Nature Communications, 13, 5602. https://doi.org/10.1038/s41467-022-33288-8 Senn, G. V., Nissen, L., & Benenson, Y. (2026). Synthetic gene circuits that selectively target RAS-driven cancers. eLife. https://doi.org/10.7554/eLife.104320.3
Smole, A., Lainšček, D., Bezeljak, U., Horvat, S., & Jerala, R. (2017). A synthetic mammalian therapeutic gene circuit for sensing and suppressing inflammation. Molecular Therapy, 25(1), 102–119. https://doi.org/10.1016/j.ymthe.2016.10.005
Gago, J., Landín, M., & Gallego, P. P. (2010). Strengths of artificial neural networks in modelling complex plant processes. Plant Signaling & Behavior, 5(6), 743–745. https://doi.org/10.4161/psb.5.6.11711
Alaneme, K. K., Anaele, J. U., Oke, T. M., Kareem, S. A., Adediran, M., Ajibuwa, O. A., & Anabaranze, Y. O. (2023). Mycelium-based composites: A review of their processing, properties and applications. Alexandria Engineering Journal, 83, 234–250.
Appels, F. V. W., Camere, S., Montalti, M., Karana, E., Jansen, K. M. B., Dijksterhuis, J., Krijgsheld, P., & Wösten, H. A. B. (2019). Fabrication factors influencing mechanical, moisture- and water-related properties of mycelium-based composites. Materials & Design, 161, 64–71. https://doi.org/10.1016/j.matdes.2018.11.027
Haneef, M., Ceseracciu, L., Canale, C., Bayer, I. S., Heredia-Guerrero, J. A., & Athanassiou, A. (2017). Advanced materials from fungal mycelium: Fabrication and tuning of physical properties. Scientific Reports, 7, 41292. https://doi.org/10.1038/srep41292
IDTechEx. (2024). Emerging leather alternatives — mushrooms, microbial and lab grown. https://www.idtechex.com/en/research-article/emerging-leather-alternatives-mushrooms-microbial-and-lab-grown/31706
Jones, M., Bhat, T., Kandare, E., Thomas, A., Joseph, P., Dekiwadia, C., Yuen, R., John, S., Ma, J., & Wang, C. H. (2018). Thermal degradation and fire properties of fungal mycelium and mycelium-biomass composite materials. Scientific Reports, 8, 17583. https://doi.org/10.1038/s41598-018-36032-9
Pelletier, M. G., Holt, G. A., Wanjura, J. D., Bayer, E., & McIntyre, G. (2013). An agroecological approach to the creation of a new building material. Industrial Crops and Products, 43, 612–616. https://doi.org/10.1016/j.indcrop.2012.07.047
Vandelook, S., Elsacker, E., Van Wylick, A., De Laet, L., & Peeters, E. (2021). Current state and future prospects of pure mycelium materials. Fungal Biology and Biotechnology, 8, 20. https://doi.org/10.1186/s40694-021-00128-7
Elsacker, E., Martin, J. S., Sangosanya, A., Verstuyft, A., Van Wylick, A., & Peeters, E. (2025). Gradients of aliveness and engineering: A taxonomy of fungal engineered living materials. Advanced Materials. https://doi.org/10.1002/adma.202502728
Walker, K. T., Li, I. S., Keane, J., Goosens, V. J., Song, W., Lee, K.-Y., & Ellis, T. (2025). Self-pigmenting textiles grown from cellulose-producing bacteria with engineered tyrosinase expression. Nature Biotechnology, 43(3), 345–354. Available at: https://www.nature.com/articles/s41587-024-02194-3/figures/1_
Week 9 HW: Cell Free Systems
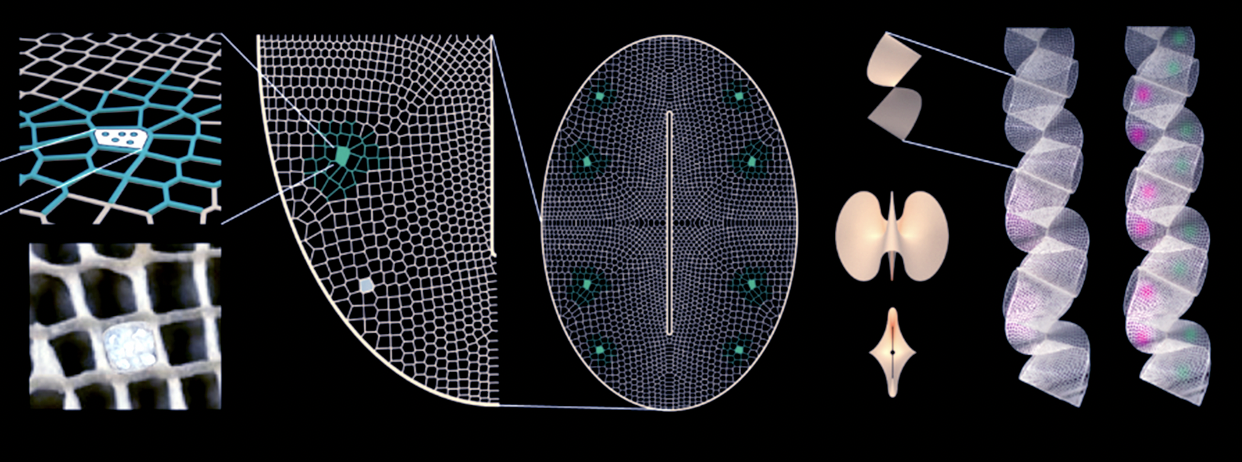
Important
General Homework Questions
Explain the main advantages of cell-free protein synthesis over traditional in vivo methods, specifically in terms of flexibility and control over experimental variables. Name at least two cases where cell-free expression is more beneficial than cell production.
In traditional in vivo methods of protein synthesis, the cell is a “black box” that prioritises its own survival (Adamala, 2026). In CFPS, there is greater flexibility and control due to these advantages:
- Direct Access
In a living cell, the cell membrane acts as a barrier. To change the internal environment, you have to rely on transport proteins or passive diffusion. In CFPS you can directly add or remove components during the reaction e.g change salt concentration, adjust the ph or add a specific enzyme, allowing for a greater tune-ability over experimental variables.
- Elimination of host cell bias
Living cells have their own metabolic priorities (like maintaining membrane integrity, energy conservation) which often conflict with the goal of synthesising a target protein. In CFPS there isn’t the restriction of the host cells bias, 100% of the energy and raw materials are dedicated to protein production.
CASE 1:
The production of proteins that are difficult to express such as toci or membrane proteins acts as a bottleneck to protein yeild in traditional methods. In vivo systems often fail when expressing proteins that interfere with the host’s essential functions such as pore forming toxins or antimicrobial peptides which are designed to puncture bacterial membranes. In a living host, the expression of these molecules leads to rapid membrane depolarisation and cell death (Katzen et al., 2005).
As CFPS operates without living cells, this allows for the synthesis of membrane active proteins (Lyukmanova et al., 2012). Additionally, researchers can aid the cell-free reaction with specific detergents or lipids to assist in the proper folding and stabilisation of complex membrane proteins, a level of environmental tuning that is impossible within the constraints of a living cell (Wuu and Swartz, 2008).
CASE 2:
In addition, the direct access to the cell-free environment allows control over the tRNA and synthetase levels, meaning the system can incorporate modified or unnatural amino acids (e.g. ncAAs such as canavanine), which would otherwise trigger the cell’s stress response or lead to non-functional products (Worst et al. 2015) (Cui et al.2020). This is used to create proteins with new chemical properties. For example, these ncAAs allow for the precise attachment of analysis tags, such as fluorophores for molecular imaging or functionalised probes for investigating protein-small molecule interactions (Parker and Pratt, 2020) (Streit et al. 2025).
- Efficiency
In cell-based methods, every change requires a new transformation and days of cell growth. In CFPS, there is the immediate reaction upon mixing components, you can produce a desired protein in hours rather than days. This high efficiency makes CFPS advantageous for protein engineering, mutagenesis studies and enzyme screening applications.
Describe the main components of a cell-free expression system and explain the role of each component.
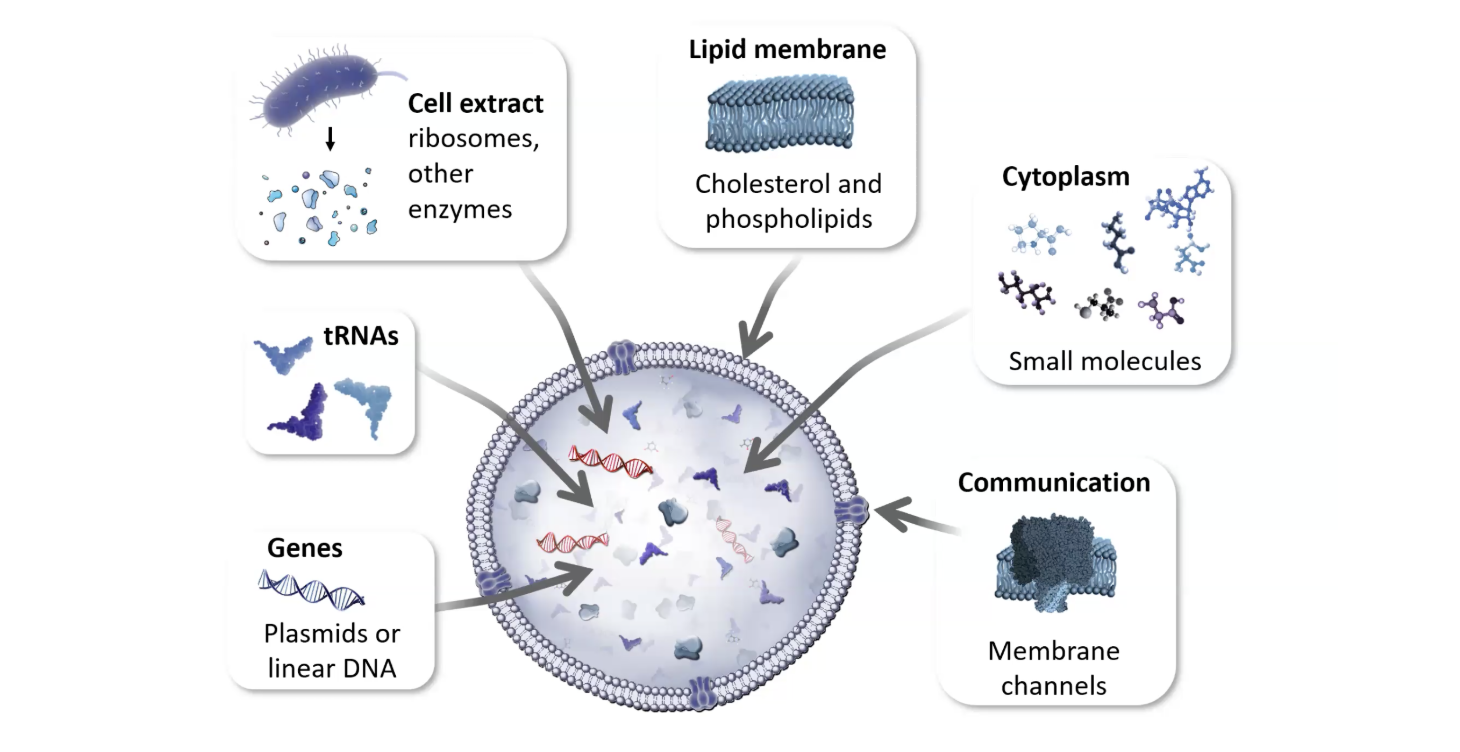
Lecture Slide by Kate Adamala
1. Plasmids or Linear DNA
The genetic template provides the encoded information for protein synthesis. It consists of a coding sequence for the target protein, regulated by a specific promoter and ribosome binding site. These sequences are recognized by the transcriptional and translational machinery to initiate protein production.
2. Cell Extract
The cell extract is a complex mixture of biomolecular machinery harvested from a host organism (e.g., E. coli) including:
RNA Polymerase: Catalyses the transcription of DNA into messenger RNA (mRNA).
Ribosomes: Coordinate the translation of mRNA into polypeptide chains.
Other Enzymes: Include aminoacyl-tRNA synthetases, chaperones for protein folding and metabolic enzymes that facilitate energy regeneration.
3. tRNAs
tRNA is charged with a specific amino acid and utilises its anticodon to recognise the corresponding codon on the mRNA strand, ensuring the accurate primary structure of the protein produced.
4. The cytoplasm: Small Molecules and Reaction Buffer
The reaction environment contains small molecules to sustain the biochemical reaction:
Amino Acids: The raw building blocks required to construct the protein chain.
Energy Source: High-energy molecules (like Phosphoenolpyruvate or Creatine Phosphate) are used to regenerate ATP and GTP, which power the transcription and translation processes.
NTPs (Nucleoside Triphosphates): The building blocks for RNA synthesis.
Salts and Buffers: Magnesium and potassium salts are essential for ribosome stability, while buffers maintain the pH required for enzymatic activity.
5. Lipid Membrane (Cholesterol and Phospholipids)
This turns a chemical reaction into a cell. By encapsulating the extract in a lipid bilayer (liposome), you create a protected micro-environment.
-Phospholipids form the main structure. -Cholesterol is often added to modulate the fluidness and stability of that membrane.
6. Communication (membrane channels)
Selective pores that allow the cell to interact with its environment by letting specific small molecules pass through the lipid barrier.
Why is energy provision regeneration critical in cell-free systems? Describe a method you could use to ensure continuous ATP supply in your cell-free experiment.
Energy regeneration is fundamental to cell free protein synthesis because translation is a very energy consuming process, requiring the hydrolysis of at least four high-energy phosphate bonds per peptide bond formed (two ATP for aminoacyl-tRNA charging; two GTP for ribosomal elongation and translocation). Without energy provision, the initial ATP pool is depleted within minutes, leading to reaction stalling. In addition, the accumulation of inorganic, metabolic byproducts exerts a negative effect, inhibiting enzymatic activity and further compromising protein synthesis efficiency (Ganesh and Maerkl, 2024 )
A approach for ATP regeneration in a cell-free protein synthesis system is to create a secondary energy substrate coupled with an enzymatic regeneration pathway e.g Phosphoenolpyruvate (PEP) as a high-energy phosphate donor and the enzyme Pyruvate Kinase (PK) as the catalyst. As ATP is consumed and produces ADP, the Pyruvate Kinase enzyme facilitates the transfer of a phosphate group from the PEP substrate directly back to the ADP. This cycle maintains a high ATP:ADP ratio, preventing the reaction from stalling due to energy depletion or the accumulation of byproducts (Kim and Swartz, 2001).
Compare prokaryotic versus eukaryotic cell-free expression systems. Choose a protein to produce in each system and explain why.
The essential dichotomy comes down to high yield prokaryotic systems (E.coli) vs the high fidelity eukaryotic systems (Wheat Germ, Rabbit Reticulocyte). Prokaryotic systems are cost-effective factory for simple, soluble protein manufacturing, allowing for high concentration yields and continuous-flow reactions. They also allow for efficient incorporation of non-natural amino acids, due to easy depletion of natural amino acids in the lysate.
However, they lacks the machinery (PDI, chaperones, microsomal membranes) for correct folding and processing of complex eukaryotic proteins, often resulting in inclusion bodies or inactive constructs. Conversely, eukaryotic systems ensure functional correctness of complex proteins through the integrated post-translational machinery in mammalian systems, including ribosomes, tRNA pools and PTM enzymes. However, their yield constraints and high lysate cost create an accessibility issue. (CD Biosynsis )
Protein Choice: GFP
For Prokaryotic systems: GFP is a small, structurally robust protein that does not require complex post-translational modifications or disulfide bonds to function and florese. E. coli lysates offer superior speed, high yield and lower cost to produce this simple reporter protein(Zemella et al. 2015).
Protein Choice: scFv Antibody Fragments e.g anti-HER2 scFv
scFv antibody fragments e.g anti-HER2 scFv fragments are better suited to eukaryotic cell-free systems such as Sf21 or rabbit reticulocyte lysates because they require correct disulphide bond formation and assisted folding to remain functional. Unlike E. coli lysates, eukaryotic lysates contain microsomal vesicles, chaperones and oxidative folding environments that support antibody maturation.
Stech et al. (2014) demonstrated that targeting scFv constructs into microsomal vesicles using a signal peptide significantly improved antigen-binding activity compared with proteins expressed in open lysate conditions. This shows that eukaryotic CFPS systems are preferable for producing structurally complex, disulphide-bonded proteins requiring post-translational processing, even though they produce lower yields than prokaryotic systems.
How would you design a cell-free experiment to optimise the expression of a membrane protein? Discuss the challenges and how you would address them in your setup.
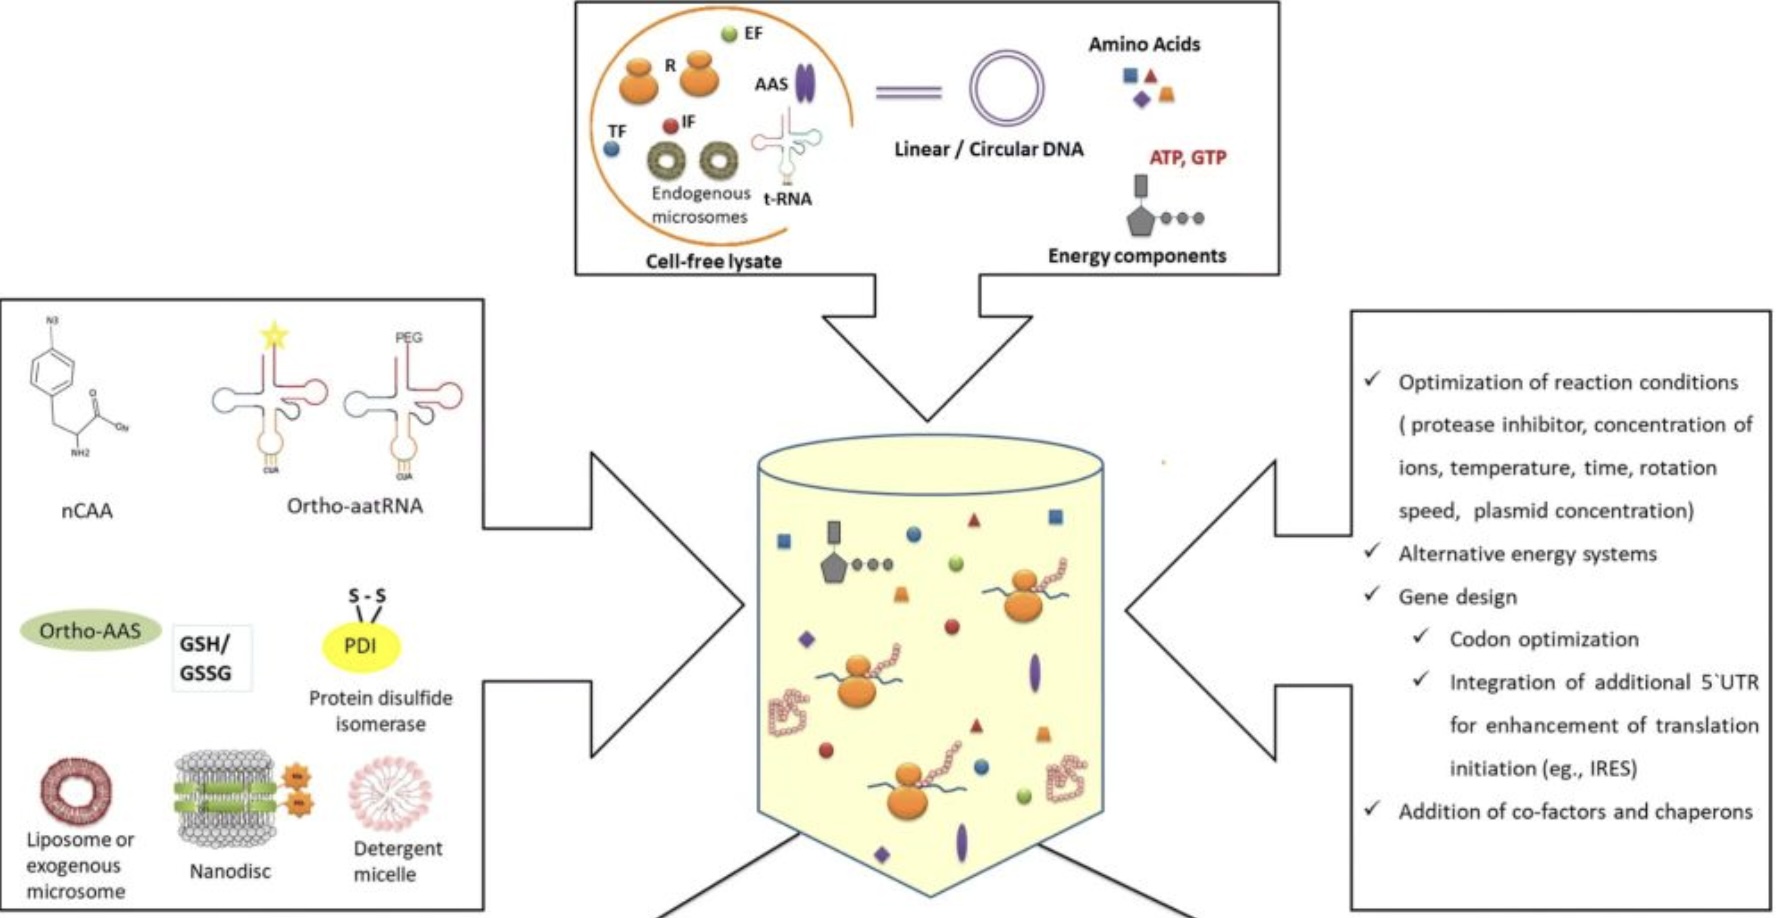
The overall process of cell-free protein synthesis. (Dondapati S K, et al. 2020)
1. System choice
I would choose a eukaryotic lysate, specifically Sf21 insect cell extract, as it naturally contains microsomes housing the Sec61 translocon, a protein channel that physically threads the membrane protein into the lipid bilayer, ensuring correct orientation and folding (Itskanov and Park, 2023).
2. Optimisation
I would optimise the DNA sequence through codon optimisation matched to the host lysate’s tRNA availability to prevent ribosomal stalling. I would also attach a short N-terminal tag to act as a ribosome handle, reducing mRNA secondary structures and accelerating translation initiation (Lyukmanova et al., 2012; Steinkühler et al., 2024). A C-terminal sfGFP tag would also be included as a folding reporter, in-gel fluorescence after SDS-PAGE immediately distinguishes folded from aggregated protein without requiring a Western blot for every condition tested (Drew et al. 2008)
3. Lipid environment
Since membrane proteins cannot fold in water, a lipid environment must be provided to prevent aggregation upon synthesis (Carpenter et al. 2008). I would use GOA-based lipid sponge droplets to provide a massive 3D hydrophobic surface area, which is particularly effective for achieving high yields with small membrane proteins (Jiang et al., 2024). Alongside this, MSP-nanodiscs would be included for detergent-free stabilisation, maintaining the protein in a native-like lipid bilayer patch, the best option for any downstream functional or structural work (Denisov and Sligar, 2017).
4. Reaction conditions
To maximise yield I would use a CECF (continuous exchange cell-free) format, where a dialysis membrane continuously replenishes NTPs and amino acids while removing inhibitory byproducts. I would incubate at 30°C with high-speed shaking, as static conditions can drop yields due to the heavy lipid components settling at the bottom of the tube. I would also include PEG 8000 as a molecular crowding agent to mimic the dense intracellular environment, promoting correct folding over aggregation (Schwarz et al. 2007)
5. Folding validation
Screening using the green fluorescent protein fusion strategy.
Challenges and how they were addressed:
Aggregation: Membrane proteins have hydrophobic regions that repel water, without a lipid environment they will clump together and precipitate out of solution. This is addressed by incorperating the lipid sponge droplets and MSP nanodiscs.
Low yield: Membrane proteins express poorly in cell free systems. This is addressed by the CECF format to ensure the supply of energy and raw materials and removal of byproduct and optimal reaction conditions maintained with the high speed shaking and PEG 8000.
Misfolding: Without the correct machinery, membrane proteins won’t fold correctly. This is addressed by the Sec61 translocon, codon optimisation and addition of ribosome handle that have been studied measures to improve membrane protein folding.
Validating folding: The expression of the protein doesn’t guarantee functionality, so the inclusion of the sfGFP reporter allows for screening of correct protein folding.
Imagine you observe a low yield of your target protein in a cell-free system. Describe three possible reasons for this and suggest a troubleshooting strategy for each.
1. Ribosomal stalling due to rare codons.
If the DNA sequence contains codons that are rarely used by the host lysate, the ribosome stalls or drops off entirely, reducing the amount of full-length protein produced. This is particularly common when expressing mammalian or human proteins in insect cell extracts.
Troubleshoot:
Lower the temperature of the reaction to 30C (or even lower). This will slow translation down, allowing time for the correct tRNA to be recruited. Re-synthesise the gene with codon optimisation matched to the host lysate’s tRNA pool and to eliminate any rare codons and replace them with more common ones (Shoba, 2025).
2. Depletion of energy substrates
In a standard batch reaction, NTPs and amino acids are consumed and inhibitory byproducts accumulate, shutting down transcription and translation long before the protein reaches useful yields.
Troubleshoot:
Switch to CECF format, where a dialysis membrane continuously replenishes substrates and removes byproducts, significantly extending the reaction and improving yields (Zemella et al. 2015).
3. Protein misfolding
If membrane proteins misfold during synthesis, it will be targeted for degradation by proteases present in the lysate, reducing the yield. Some proteins require post-translational modification, chaperones, or even disulfide bridges to fold properly.
Troubleshoot:
Introduce chaperones to assist co-translational folding. Ensure an adequate lipid environment is present via nanodiscs or lipid sponge droplets. Use the sfGFP folding reporter to quickly identify which conditions improve the ratio of folded to misfolded protein. For proteins that require post-translational modifications, use rabbit reticulocyte system (with canine microsomal membranes) or wheat germ extract would be a better choice. (Shoba, 2025)
REFERENCES:
Worst E. G., Exner M. P., De Simone A., Schenkelberger M., Noireaux V., Budisa N., et al. (2015). Cell-free expression with the toxic amino acid canavanine. Bioorg. Med. Chem. Lett. 25.
Khambhati K, Bhattacharjee G, Gohil N, Braddick D, Kulkarni V, Singh V. Exploring the Potential of Cell-Free Protein Synthesis for Extending the Abilities of Biological Systems. Front Bioeng Biotechnol. 2019 Oct 11;7:248. doi: 10.3389/fbioe.2019.00248. PMID: 31681738; PMCID: PMC6797904.
Cui, Z., Johnston, W. A., & Alexandrov, K. (2020). Cell-free approach for non-canonical amino acids incorporation into polypeptides. Frontiers in Bioengineering and Biotechnology, 8.
Parker, C. G., & Pratt, M. R. (2020). Click chemistry in proteomic investigations. Cell, 180(4), 605–632.
Streit, M., Budiarta, M., Jungblut, M., & Beliu, G. (2025). Fluorescent labeling strategies for molecular bioimaging. Biophysical Reports, 5, 100200.
Katzen, F., Chang, G., & Kudlicki, W. (2005). The past, present and future of cell-free protein synthesis. Trends in Biotechnology, 23(3), 150-156.
Lyukmanova, E. N., et al. (2012). Lipid–protein nanodiscs for cell-free production of integral membrane proteins. Methods in Enzymology, 506, 255-276.
Wuu, J. J., & Swartz, J. R. (2008). High yield cell-free production of integral membrane proteins without surfactants. Biochimica et Biophysica Acta (BBA)-Biomembranes, 1778(10), 2350-2361.
Kim, D. M., & Swartz, J. R. (2001). Regeneration of adenosine triphosphate from glycolytic intermediates for cell-free protein synthesis. Biotechnology and Bioengineering, 74(4), 309–316.
Ganesh, R. B., & Maerkl, S. J. (2024). Towards self-regeneration: Exploring the limits of protein synthesis in the protein synthesis using recombinant elements (PURE) cell-free transcription–translation system. ACS Synthetic Biology, 13(8), 2555–2566.
CD Biosynsis. (n.d.). A comparative guide: Prokaryotic vs. eukaryotic cell-free expression systems for eukaryotic proteins. Retrieved April 5, 2026, from https://www.biosynsis.com/a-comparative-guide-prokaryotic-vs-eukaryotic-cell-free-expression-systems-for-eukaryotic-proteins.html
Zemella, A., Thoring, L., Hoffmeister, C., & Kubick, S. (2015). Cell-free protein synthesis: Pros and cons of prokaryotic and eukaryotic systems. ChemBioChem, 16(17), 2420–2431. https://doi.org/10.1002/cbic.201500340
Hodot, R., et al. (2023). “Cell-Free Protein Synthesis: A Powerful Tool for the Expression of Membrane Proteins.” Frontiers in Bioengineering and Biotechnology.
Jiang, S., Çelen, G., Glatter, T., Niederholtmeyer, H., & Yuan, J. (2024). “A cell-free system for functional studies of small membrane proteins.” Journal of Biological Chemistry.
Denisov, I. G., & Sligar, S. G. (2017). “Nanodiscs in Membrane Biology and Drug Discovery.” Chemical Reviews.
Carpenter, E. P., et al. (2008). Overcoming the challenges of membrane protein crystallography. Current Opinion in Structural Biology, 18(5), 581–586.
Itskanov, S., & Park, E. (2023). Mechanism of protein translocation by the Sec61 translocon complex. Cold Spring Harbor Perspectives in Biology, 15(1), a041250. https://doi.org/10.1101/cshperspect.a041250
Lyukmanova, E. N., Shenkarev, Z. O., Khabibullina, N. F., Kulbatskiy, D. S., Shulepko, M. A., Petrovskaya, L. E., Arseniev, A. S., Dolgikh, D. A., & Kirpichnikov, M. P. (2012). N-terminal fusion tags for effective production of G-protein-coupled receptors in bacterial cell-free systems. Acta Naturae, 4(4), 58–64.
Steinkühler, J., Peruzzi, J. A., Krüger, A., Villaseñor, C. G., Jacobs, M. L., Jewett, M. C., & Kamat, N. P. (2024). Improving cell-free expression of model membrane proteins by tuning ribosome cotranslational membrane association and nascent chain aggregation. ACS Synthetic Biology, 13(1), 129–140. https://doi.org/10.1021/acssynbio.3c00357
Drew, D., Newstead, S., Sonoda, Y., Kim, H., von Heijne, G. and Iwata, S. (2008) ‘GFP-based optimization scheme for the overexpression and purification of eukaryotic membrane proteins in Saccharomyces cerevisiae’, Nature Protocols, 3(5), pp. 784–798. doi: 10.1038/nprot.2008.44.
Schwarz, D., Junge, F., Durst, F., Frölich, N., Schneider, B., Reckel, S., Sobhanifar, S., Dötsch, V., & Bernhard, F. (2007). Preparative scale expression of membrane proteins in Escherichia coli-based continuous exchange cell-free systems. Nature Protocols, 2(11), 2945–2957. https://doi.org/10.1038/nprot.2007.426
Shoba (2025) ‘Solved: Low yields in cell-free protein synthesis’, Bitesize Bio. Available at: https://bitesizebio.com/10234/solvedlow-yields-in-cell-free-protein-synthesis/ (Accessed: 5 April 2026).
Creative Biostructure. (n.d.). Cell-free membrane protein synthesis. Creative Biostructure. https://www.creative-biostructure.com/cellfree-membrane-protein-synthesis.htm
Homework question from Kate Adamala
Design an example of a useful synthetic minimal cell as follows:
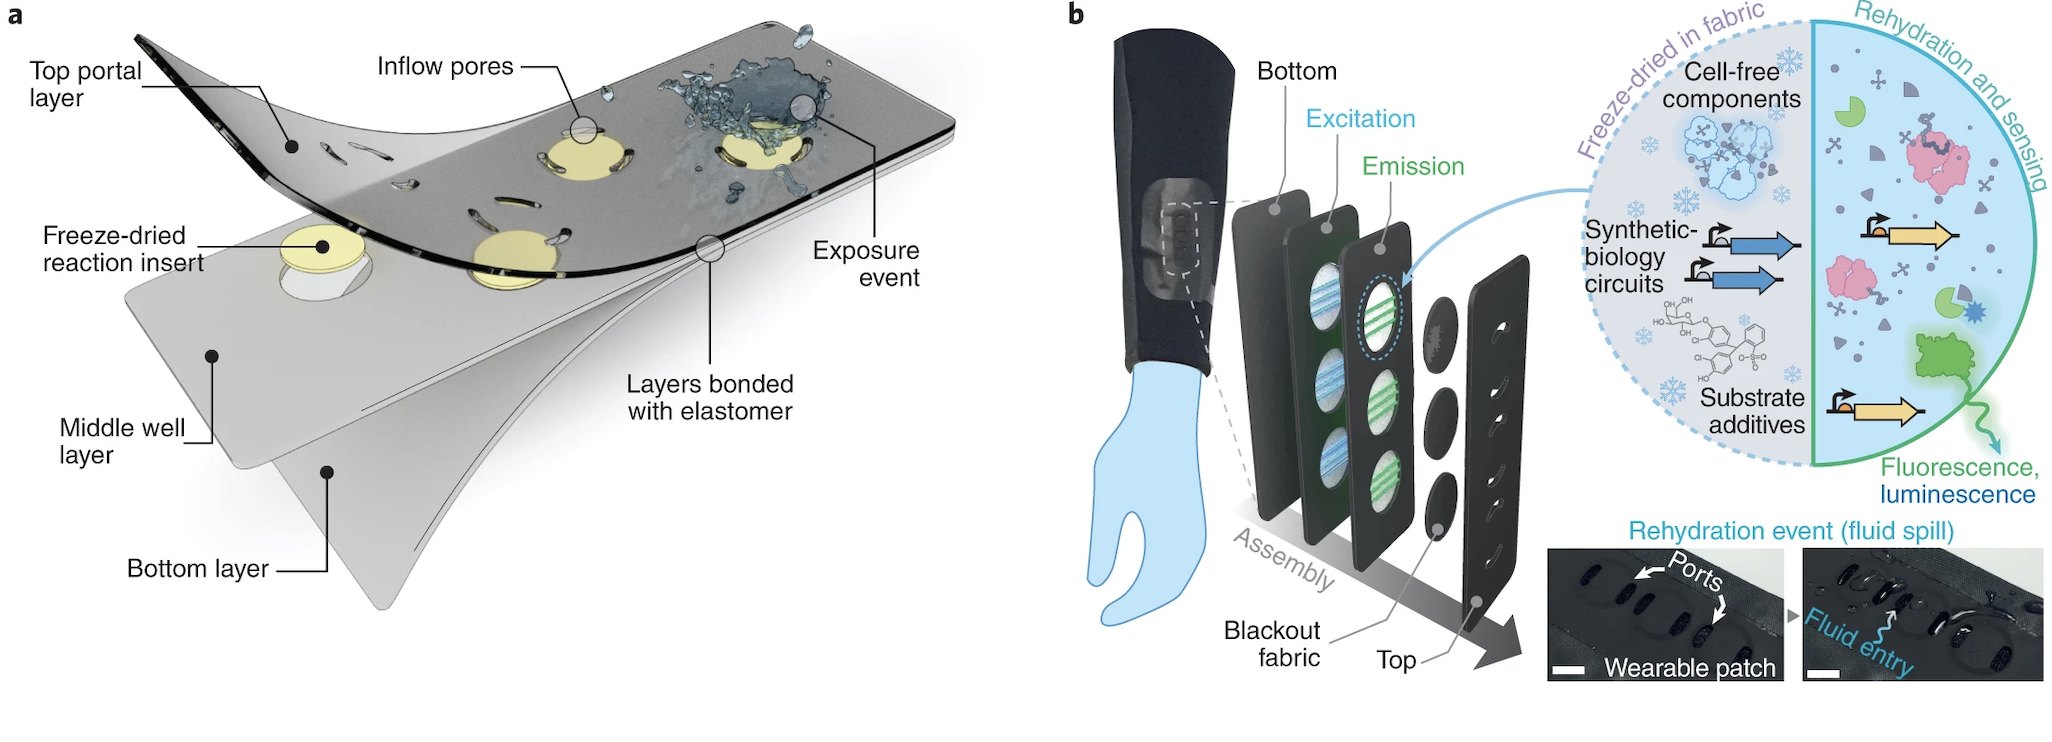
Wearable textile-embedded biosensors relying on freeze-dried cell-free synthetic biology. From: https://www.nature.com/articles/s41551-022-00869-3/figures/1
1. Pick a function and describe it.
The synthetic minimal cell functions as a gaseous biosensor designed to detect Polycyclic Aromatic Hydrocarbons (PAHs), for this case specifically naphthalene, in the atmosphere and create a visible, colourmetric output. This is linked to ideas I am exploring in my final project, related to creating a bio-hybrid public sculptures that offer a visible read out to atmospheric pollutants in order to create social engagement with air pollution inequalities.
2. What would your synthetic cell do? What is the input and what is the output?
The synthetic minimal cell acts as an environmental reporter. Its function is to indicate urban air quality by detecting specific toxic markers (PAHs) and providing a visual, colorimetric readout.
Input: Gas-phase Polycyclic Aromatic Hydrocarbons (PAHs). Output: Colorimetric change (Yellow to Red) via the hydrolysis of CPRG by the enzyme $\beta$-galactosidase.
3. Could this function be realised by cell-free Tx/Tl alone, without encapsulation?
Yes it could technically work, NahR would detect the PAH metabolite, activates transcription of lacZ and β-galactosidase hydrolyses CPRG to give a colour change. This chemistry doesn’t inherently require encapsulation to function.
But practically for my application no. For a public-facing sculpture you need the reaction to be stable over time, contained and accessible to gaseous PAH. An unprotected solutions would degrade quickly, evaporate or be contaminated. For a real application (like a public sensor), encapsulation in a solid/gel is preferable.
Could this function be realized by genetically modified natural cell?
Yes, NahR-lacZ constructs have been expressed in E. coli as whole-cell biosensors but a synthetic minimal cell is advantageous for public art installations (Cho et al. 2015). It is bio-contained and non-living, meaning it cannot replicate, mutate or pose a bio-safety risk to the public environment and it doesn’t require nutrients and waste disposal to survive.
Describe the desired outcome of your synthetic cell operation.
A stable, portable and safe minimal cell that:
- Detects environmental PAHs in real time.
- Produces a visible colour change without requiring handling of live cells.
- Is long-lasting and stable
- Can communicate with the environment .
Design all components that would need to be part of your synthetic cell.
1. What would be the membrane made of?
A liposome composed of phosphatidylcholine and cholesterol (7:3) provides a stable bilayer permeable to small, hydrophobic PAHs without requiring a protein channel (Plant et al, 1987).. Cholesterol reduces membrane leakage and improves stability across variable temperatures, important for different deployment contexts. Moreover, as noted in the Shin et al. (2005), PC membranes, when protected by a cryoprotectant like sucrose, can survive the freeze-drying process and rehydrate successfully when they encounter atmospheric moisture in the public installation.
2. What would you encapsulate inside? Enzymes, small molecules.
- NahR transcription factor and lacZ gene – incorporated in a plasmid under a PAH-inducible promoter (e.g. Psal) to detect environmental PAHs and trigger β-galactosidase expression.
- Cell-free Tx/Tl machinery (E. coli extract) – including ribosomes, RNA polymerase, translation factors (initiation, elongation, and release factors), aminoacyl-tRNA synthetases, and tRNAs. This machinery enables transcription of the plasmid and translation of β-galactosidase.
- CPRG substrate – a chromogenic substrate for β-galactosidase, which produces a visible color change when cleaved.
- NTPs, amino acids – provide the building blocks.
- Mg-glutamate and K-glutamate — ions that support ribosome activity and maintain optimal chemical environment for transcription and translation.
- 3-phosphoglyceric acid (3-PGA) - regenerates ATP to sustain transcription and translation throughout the reaction, without accumulating inhibitory phosphate byproducts (Caschera and Noireaux, 2014).
Which organism your Tx/Tl system will come from? Is bacterial OK, or do you need a mammalian system for some reason? _(hint: for example, if you want to use small molecule modulated promotors, like Tet-ON, you need mammalian)
Bacterial (E. coli) extract is sufficient here, the NahR-Psal promoter system is prokaryotic and functions natively in E. coli based cell-free systems. A mammalian system is not needed as there are no mammalian-specific promoters (e.g. Tet-ON) or PTMs required.
How will your synthetic cell communicate with the environment? _(hint: are substrates permeable? or do you need to express the membrane channel?)
PAHs are sufficiently hydrophobic to passively diffuse across the lipid bilayer membrane into the synthetic cell, where they interact with the NahR transcription factor and trigger lacZ expression. No membrane channel is required.
Experimental details
1. List all lipids and genes. _(bonus: find the specific genes; for example, instead of just saying “small molecule membrane channel” pick the actual gene.)
LIPIDS:
- POPC (1-palmitoyl-2-oleoyl-sn-glycero-3-phosphocholine)- primary bilayer lipid, permeable to hydrophobic PAHs
- Cholesterol (7:3 POPC:cholesterol molar ratio)- tightens the bilayer, reduces leakage and improves stability across variable temperatures
GENES:
- NahR encodes the NahR transcription factor from Pseudomonas putida, binds PAH and activates transcription at the Psal promoter.
- lacZ encodes β-galactosidase from E. coli, placed under the Psal promoter, hydrolyses CPRG to produce the colorimetric output
- Psal promoter - PAH-inducible regulatory sequence from Pseudomonas putida that NahR binds to activate lacZ transcription
How will you measure the function of your system?
- Colorimetric assay : absorbance at 570 nm to quantify CPRG hydrolysis (yellow to pink/red) as a direct readout of PAH detection. Include control tests to known PAH concentrations and compare colour change intensity.
REFERENCES:
Cho, J. H., Lee, D. Y., Lim, W. K., & Shin, H. J. (2014). A recombinant Escherichia coli biosensor for detecting polycyclic aromatic hydrocarbons in gas and aqueous phases. Journal of Environmental Science and Health, Part A, 49(13), 1521–1527. https://doi.org/10.1080/10826068.2014.887577
Shin, H. J., Park, H. H., & Lim, W. K. (2005). Freeze-dried recombinant bacteria for on-site detection of phenolic compounds by color change. Journal of Biotechnology, 119(1), 36–43. https://doi.org/10.1016/j.jbiotec.2005.06.002
Plant, A. L., Knapp, R. D., & Smith, L. C. (1987). Mechanism and rate of permeation of cells by polycyclic aromatic hydrocarbons. Journal of Biological Chemistry, 262(6), 2514–2519.
Caschera, F., & Noireaux, V. (2014). Synthesis of 2.3 mg/ml of protein with an all Escherichia coli cell-free transcription-translation system. Biochimie, 99, 162–168. https://doi.org/10.1016/j.biochi.2013.11.025
Homework question from Peter Nguyen
Again, I will be basing this answer on my final project idea.
Write a one-sentence summary pitch sentence describing your concept.
A series of bio-sensing public sculptures that offer a naked eye, colourmetric response to air pollutants (PAHs) in order to encourage engage with air quality injustice.
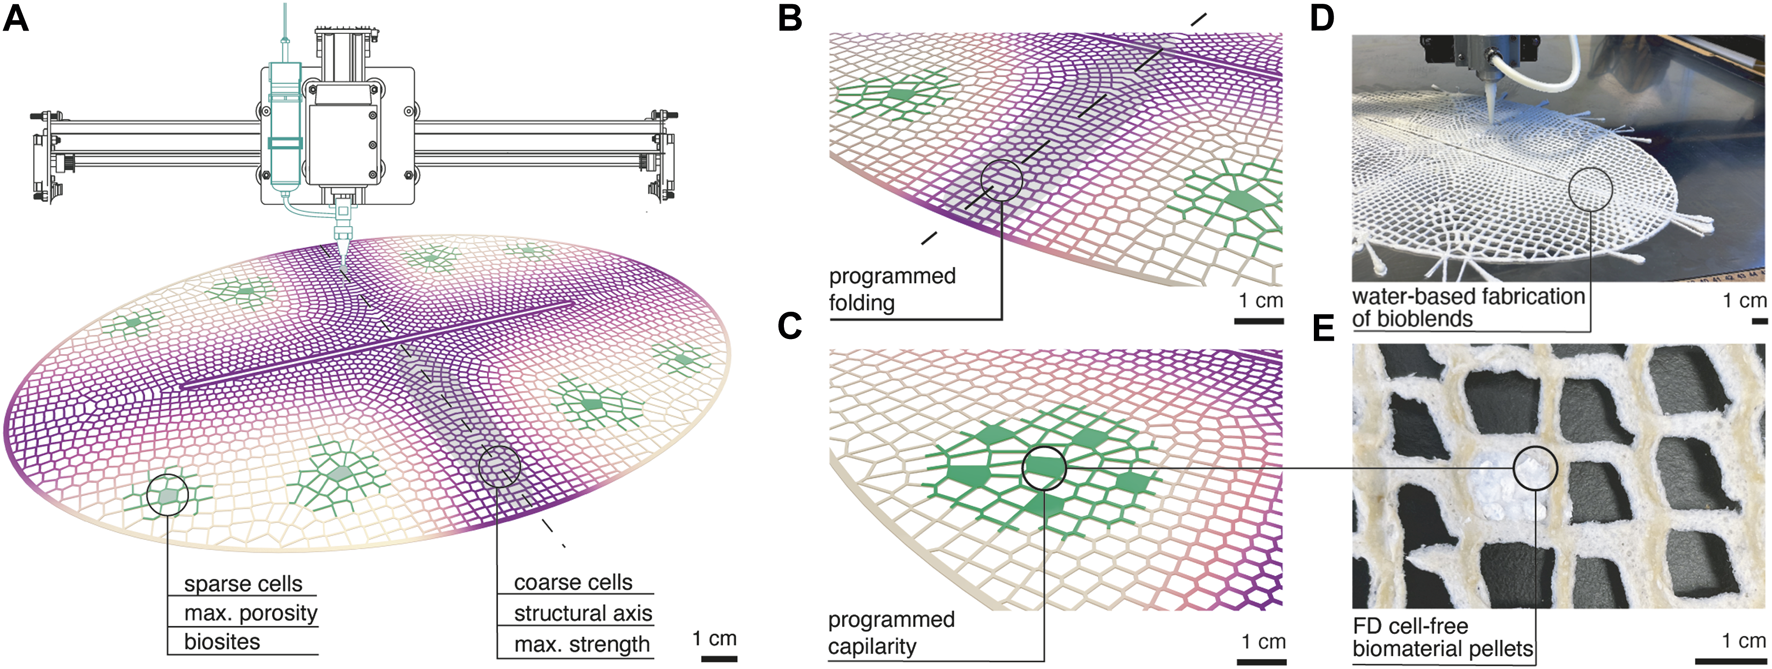
Cell-free biologically active architectural structures. From: https://www.frontiersin.org/journals/bioengineering-and-biotechnology/articles/10.3389/fbioe.2023.1125156/full/1
How will the idea work, in more detail? Write 3-4 sentences or more.
The sculptures will contain freeze-dried cell-free bio-sensing modules embedded in a 3D printed structure made of a biopolymer matrix (sodium alginate or silk fibroin) (Ho et al. 2023). The modules contain a freeze-dried cell-free NahR-lacZ genetic circuit. When PAHs diffuse passively into the module, the NahR transcription factor binds and triggers β-galactosidase expression, hydrolysing the CPRG substrate and producing a visible yellow to red colour change proportional to PAH concentration (Cho et al. 2014). The sculptures will be strategically placed in public areas across urban environments and across global cities, creating a living, real-time visualisation of invisible pollution translating an abstract environmental justice issue into a visceral, public-facing experience that requires no scientific literacy to interpret. I am keen for the sculptures to be presented together to aid visual comparison and discussion of systems that contribute to inequalities.
What societal challenge or market need will this address?
Air pollution disproportionately affects low-income and marginalised urban communities, yet the data that demonstrates this inequality is largely inaccessible to the public and communicated through abstract data, unactionable for the communities most affected. This project address this challenge by translating invisible, structural environmental injustice into a visible, intuitive experience that anyone can engage with regardless of background. There is a growing need for public-facing environmental monitoring tools that go beyond data and create emotional and social engagement with air quality as a justice issue. It would be interesting to push this further in future in to remediation also.
How do you envision addressing the limitation of cell-free reactions (e.g., activation with water, stability, one-time use)?
Stability: the cell-free bio-sensing modules will be freeze-dried with sucrose as a cryoprotectant, which protects the liposome membrane and encapsulated machinery during storage and extends shelf life significantly (Shin et al., 2005)
Activation with water: As explored by Ho et al. (2023) the biosites are embedded in a porous biopolymer lattice designed with specific porosity and capillarity properties, meaning atmospheric water and humidity travels through the lattice structure to the biosites naturally upon exposure to moisture, rehydrating and activating the cell-free reaction without any handling.
One-time use: the biosensors could be designed as replaceable cartridges modules embedded within the sculpture, allowing periodic replacement without dismantling the installation itself? However, this is a limitation I am going to need to research further.
REFERENCES
Cho, J. H., Lee, D. Y., Lim, W. K., & Shin, H. J. (2014). A recombinant Escherichia coli biosensor for detecting polycyclic aromatic hydrocarbons in gas and aqueous phases. Journal of Environmental Science and Health, Part A, 49(13), 1521–1527. https://doi.org/10.1080/10826068.2014.887577
Ho, G., Kubušová, V., Irabien, C., Li, V., Weinstein, A., Chawla, S., Yeung, D., Mershin, A., Zolotovsky, K., & Mogas-Soldevila, L. (2023). Multiscale design of cell-free biologically active architectural structures. Frontiers in Bioengineering and Biotechnology, 11, 1125156. https://doi.org/10.3389/fbioe.2023.1125156
Shin, H. J., Park, H. H., & Lim, W. K. (2005). Freeze-dried recombinant bacteria for on-site detection of phenolic compounds by color change. Journal of Biotechnology, 119(1), 36–43. https://doi.org/10.1016/j.jbiotec.2005.06.002
Homework question from Ally Huang

From: https://www.the-scientist.com/stem-cells-age-faster-in-space-73357
Provide background information that describes the space biology question or challenge you propose to address. Explain why this topic is significant for humanity, relevant for space exploration, and scientifically interesting. _(Maximum 100 words)
During long-duration spaceflight, astronauts experience skeletal muscle atrophy caused by microgravity, reducing strength, endurance and motor performance(Wang, 2013). The early molecular events driving this process remain poorly understood and current studied biomarkers focus on those detectable after muscle loss has begun. Studying human muscle precursor cells in real space conditions allows investigation of how microgravity disrupts muscle differentiation and regeneration. Muscle-specific microRNAs (myomiRs), which regulate satellite-cell activity, change before measurable tissue loss occurs and therefore provide early indicators of muscle adaptation during long-duration space missions (Di Filippo et al. 2024) . This project proposes to detect coordinated changes in myomiRs in human muscle precursor cells in real microgravity using freeze-dried BioBits cell-free systems to better understand how microgravity alters muscle gene regulation and support development of future diagnostic and preventative countermeasures to muscle atrophy for astronauts.
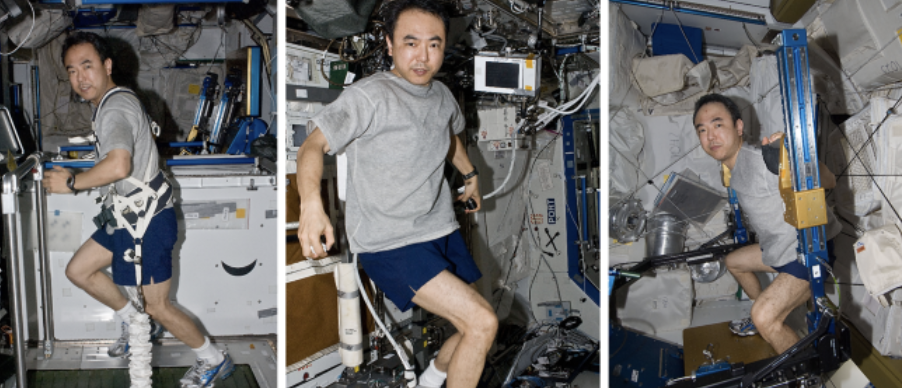
Japanese astronaut Satoshi Furukawa exercising on the T2 treadmill, the Cycle Ergometer with Vibration Isolation and Stabilization System (CEVIS), and the Advanced Resistive Exercise Device (ARED) in the ISS. From: https://www.nature.com/articles/s41526-021-00145-9
Name the molecular or genetic target that you propose to study. Examples of molecular targets include individual genes and proteins, DNA and RNA sequences, or broader -omics approaches. (Maximum 30 words)
A panel of muscle-specific microRNAs miR-1, miR-133a, miR-133b and miR-206, key regulators of satellite cell differentiation, myotube formation and skeletal muscle regeneration during early muscle adaptation to microgravity (Di Fillippo et al 2014).
Describe how your molecular or genetic target relates to the space biology question or challenge your proposal addresses. (Maximum 100 words)
These myomiRs regulate satellite cell activation, proliferation and differentiation, which are essential for maintaining skeletal muscle mass. Studies show their expression changes early during exposure to microgravity, before measurable muscle tissue loss occurs (Di Fillippo et al 2014). Measuring changes in miR-1, miR-133a, miR-133b and miR-206 in human muscle precursor cells cultured in real microgravity conditions will help identify how microgravity disrupts muscle regeneration pathways. Understanding these early regulatory changes provides insight into the molecular events driving muscle atrophy and supports development of targeted countermeasures for long-duration missions.
Clearly state your hypothesis or research goal and explain the reasoning behind it. (Maximum 150 words)
I hypothesise that exposure of human muscle precursor cells to real microgravity will produce downregulation in muscle-specific microRNAs miR-1, miR-133a, miR-133b and miR-206, reflecting early disruption of gene regulatory pathways controlling muscle atrophy. Detecting these changes using freeze dried BioBits cell-free protein expression reactions combined with miniPCR amplification will demonstrate a compact and space compatible strategy for studying regulators of muscle differentiation and regeneration whose dysregulation contributes to atrophy in space. This experiment aims to improve understanding of the molecular mechanisms underlying microgravity induced muscle atrophy by identifying early regulatory responses in muscle precursor cells. I aim to establishing a workflow for detecting myomiRs in real microgravity, using portable cell-free systems. This will support future studies investigating muscle adaptation in space and help guide development of effective countermeasures to maintain astronaut musculoskeletal health during long-duration missions.
Outline your experimental plan - identify the sample(s) you will test in your experiment, including any necessary controls, the type of data or measurements that will be collected, etc. (Maximum 100 words)
Human muscle precursor cells isolated from skeletal muscle biopsies on Earth will be expanded and cryopreserved before launch in space. Cells will be differentiated under microgravity conditions alongside parellel Earth gravity controls. RNA will be collected at defined timepoints and target myomiRs (miR-1, miR-133a, miR-133b, miR-206) reverse transcribed and amplified using miniPCR. Amplified products will activate a panel of freeze-dried BioBits cell-free toehold switch reporter reactions, each specific to one myomiR. Fluorescence output measured with the P51 Molecular Fluorescence Viewer will be compared between microgravity and control samples to determine relative expression changes. Negative controls will confirm assay specificity.
REFEERENCES
Wang XH. MicroRNA in myogenesis and muscle atrophy. Curr Opin Clin Nutr Metab Care. 2013 May;16(3):258–66. doi: 10.1097/MCO.0b013e32835f81b9. PMID: 23449000; PMCID: PMC3967234.
Di Filippo, E. S., Chiappalupi, S., Falone, S., Dolo, V., Amicarelli, F., Marchianò, S., Carino, A., Mascetti, G., Valentini, G., Piccirillo, S., Balsamo, M., Vukich, M., Fiorucci, S., Sorci, G., & Fulle, S. (2024). The MyoGravity project to study real microgravity effects on human muscle precursor cells and tissue. npj Microgravity, 10, 92. https://doi.org/10.1038/s41526-024-00392-1
Vitry, G., Finch, R., Mcstay, G., Behesti, A., Déjean, S., Larose, T., Wotring, V., & da Silveira, W. A. (2022). Muscle atrophy phenotype gene expression during spaceflight is linked to a metabolic crosstalk in both the liver and the muscle in mice. Communications Biology, 5, 1056. https://doi.org/10.1038/s42003-022-04006-1
Teodori, L., Costa, A., Campanella, L., & Albertini, M. C. (2019). Skeletal muscle atrophy in simulated microgravity might be triggered by immune-related microRNAs. Frontiers in Physiology, 9, 1926. https://doi.org/10.3389/fphys.2018.01926
Homework Part B: Individual Final Project
Final Project Slide by Isobel LeonardWeek 10 HW: Imaging and Measurement

Important
Homework Part 1: Final Project
Please identify at least one (ideally many) aspect(s) of your project that you will measure. It could be the mass or sequence of a protein, the presence, absence, or quantity of a biomarker, etc.
I am going to work on my final project in silico, but I will answer this question as if I had access to measuring and imaging equiptment and wetlabs.
- Environmental PAH concentration
- DNA construct accuracy (length and sequence)
- Bio sensor activation, sensitivity and kinetics (limit of detection, time for visible output, response kinetics)
- Expression levels of β-galactosidase protein
- Colourmetric output signal intensity generated through CPRG substrate hydrolysis
- Scaffold porosity and gas diffusion accessibility
Please describe all of the elements you would like to measure, and furthermore describe how you will perform these measurements.What are the technologies you will use (e.g., gel electrophoresis, DNA sequencing, mass spectrometry, etc.) Describe in detail.
1. Environmental PAH concentration:
It is important to measure the actual concentration of polycyclic aromatic hydrocarbons (PAHs) present in environmental air at deployment sites and similar conditions. This will determine whether pollutant levels fall within the detectable range of the biosensor and to optimise the genetic circuit to real world air quality conditions.
These measurements would be performed using Gas Chromatography–Mass Spectrometry. Air would first be collected using particulate filters or adsorption cartridges positioned at installation sites. The collected samples would then be extracted and analysed using GC–MS to determine the concentration of target PAH biomarkers.
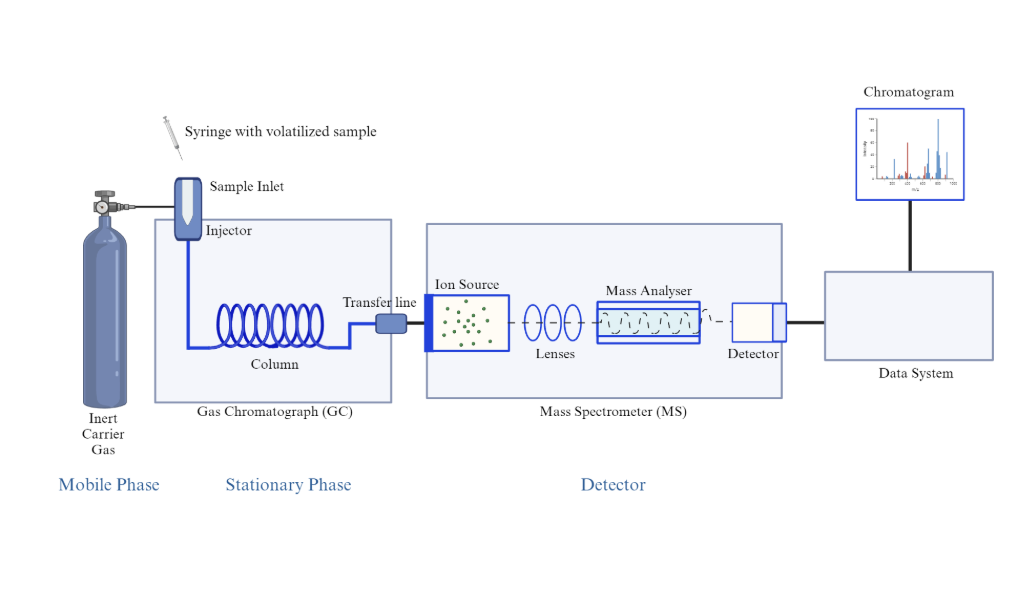
Figure of GC-MS, From: https://measurlabs.com/methods/gas-chromatography-mass-spectrometry-gc-ms/
GC:
- Air samples collected at installation sites (with a filter or cartridge)
- Samples undergo solvent extraction to isolate the retained organic molecules
- Sample is heated and vaporised
- Sample is injected into a capillary chromatography column containing a stationary phase optimised for separation of semi-volatile organic compounds such as PAHs
- Molecules travel through the column at different speeds depending on size, weight, polarity or interaction with the stationary phase, meaning they exit the column at different retention times. E.g PAH like napthalene has a short retention time.
MS:
- Molecules enters the mass spectrometer
- Ionised by electron impact ionisation
- The molecule fragment into predictable charged ions
- Fragments are measured by mass and compared against confirmed molecular identity
- Data outputted to Chromatogram used to used to determine the concentration of PAH present in the air sample.
These results would be compared with the predicted activation thresholds and sensitivity range of the NahR LacZ biosensor to evaluate whether it would produce a detectable colourimetric response under realistic environmental exposure conditions in a public installation setting.
2. DNA construct correctness and integrity
To ensure the designed biosensor functions, the NahR LacZ plasmid construct should be verified. Measurements include the DNA fragment size (in relation to molecular weight ladder) and sequence in relation to the designed Benchling construct and confirm the absence of mutations.
The first will be performed using Gel electrophoresis to confirm expected plasmid size via migration distance compared to a molecular weight ladder. Specific restriction enzymes designed in Benchling will cut the plasmid at predicted locations flanking the pNah promoter and lacZ reporter cassette. The resulting DNA fragments will migrate through an agarose gel matrix under an applied electric field, allowing fragment sizes to be compared against a molecular weight ladder.
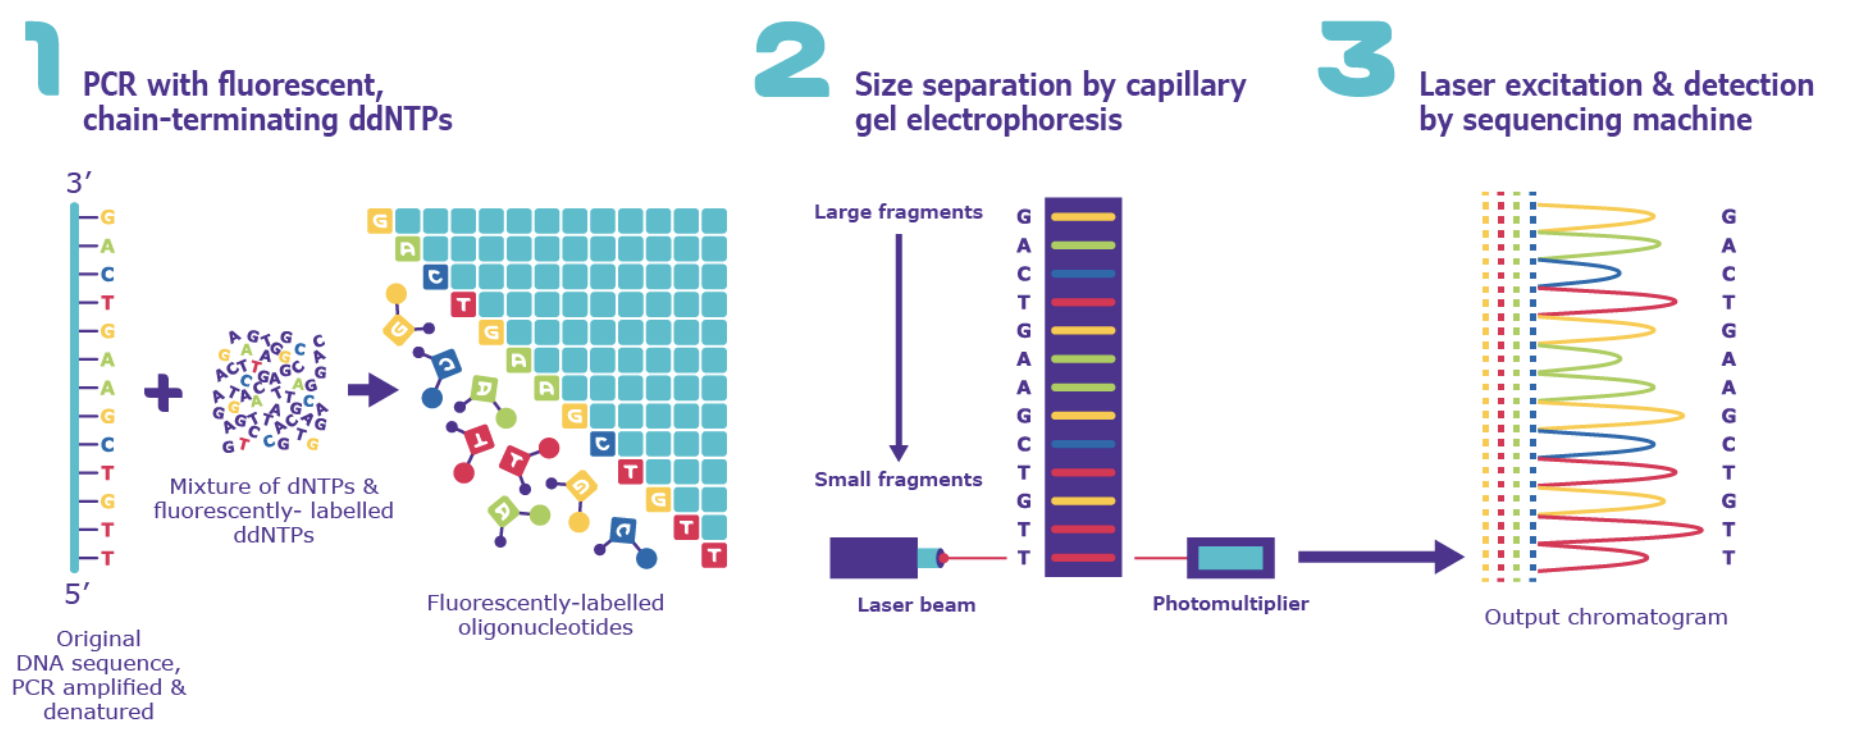
Figure of Sanger Sequencing, From: https://www.sigmaaldrich.com/GB/en/technical-documents/protocol/genomics/sequencing/sanger-sequencing?srsltid=AfmBOooV_i64Bm0LgnnnlshXoIM8Jie-hLw9byG48n9ncECuFkHc_uLL/
The second will be performed using Sanger sequencing.
- Plasmid DNA containing the NahR LacZ construct is used as the sequencing template.
- A sequencing primer binds near the pNah promoter and lacZ coding region.
- DNA polymerase extends the strand using normal nucleotides and fluorescent chain-terminating ddNTPs.
- Incorporation of a ddNTP stops strand extension, generating DNA fragments of different lengths.
- Fragments are separated by size using capillary electrophoresis.
- A detector reads fluorescent labels on the terminal bases to determine the nucleotide sequence.
- The resulting chromatogram is aligned with the Benchling reference sequence to confirm correct construct assembly and absence of mutations.
3. Bio sensor activation, sensitivity and kinetics (limit of detection, time for visible output, response kinetics)
Measurements focusing on the functional performance of the bio-sensor in relation to PAH exposure.
Biosensor activation and sensitivity would be quantified by exposing the system to a defined range of PAH concentrations and measuring the resulting colour output. The limit of detection would be defined as the lowest concentration of analyte that produces a statistically significant increase in signal compared to the negative control. This would be determined by constructing a dose–response curve and applying statistical testing (e.g. t-test or regression-based threshold estimation).
Response kinetics including time to signal onset and time to half-maximal response, would be measured using kinetic absorbance tracking with a UV–Vis spectrophotometer. Absorbance at 570 nm (corresponding to CPRG cleavage by β-galactosidase) would be recorded at regular time intervals. This time/course data would be used to measure response delay and saturation time.
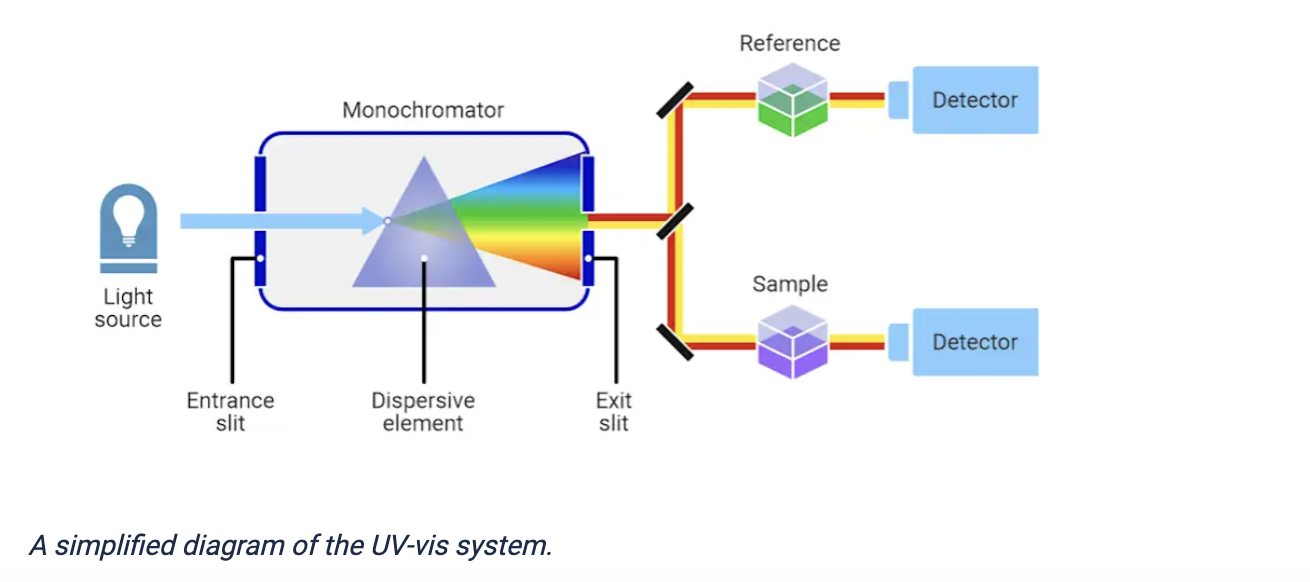
Figure of UV–Vis spectrophotometer, From: https://measurlabs.com/methods/uv-visible-spectroscopy/
This would be done as follows:
- Biosensor culture is placed in microplate well.
- The instrument passes monochromatic light of specific wavelengths ( 570 nm for CPRG) through the sample.
- Molecules in the sample absorb part of the light depending on their chemical properties.
- The incident light intensity and transmitted light intensity are measured by a photodetector
- Absorbance is calculated using the Beer–Lambert relationship and is proportional to analyte concentration.
- Absorbance is recorded as a quantitative measure of molecule concentration (e.g., CPRG colour product or cell density).
- Readings are recorded at defined time intervals to generate a kinetic time-course dataset.
This will be analysed against environmental PAH concentrations and time responsive requirements to demonstrate if the biosensor could function within environmentally relevant exposure levels and produces a detectable signal within a practical timeframe for public-facing installation.
4. Expression levels of β-galactosidase protein
Expression levels of β-galactosidase are measured to confirm successful transcriptional activation and protein production from the NahR–pNah biosensor circuit.
Protein expression would be measured with SDS-PAGE:
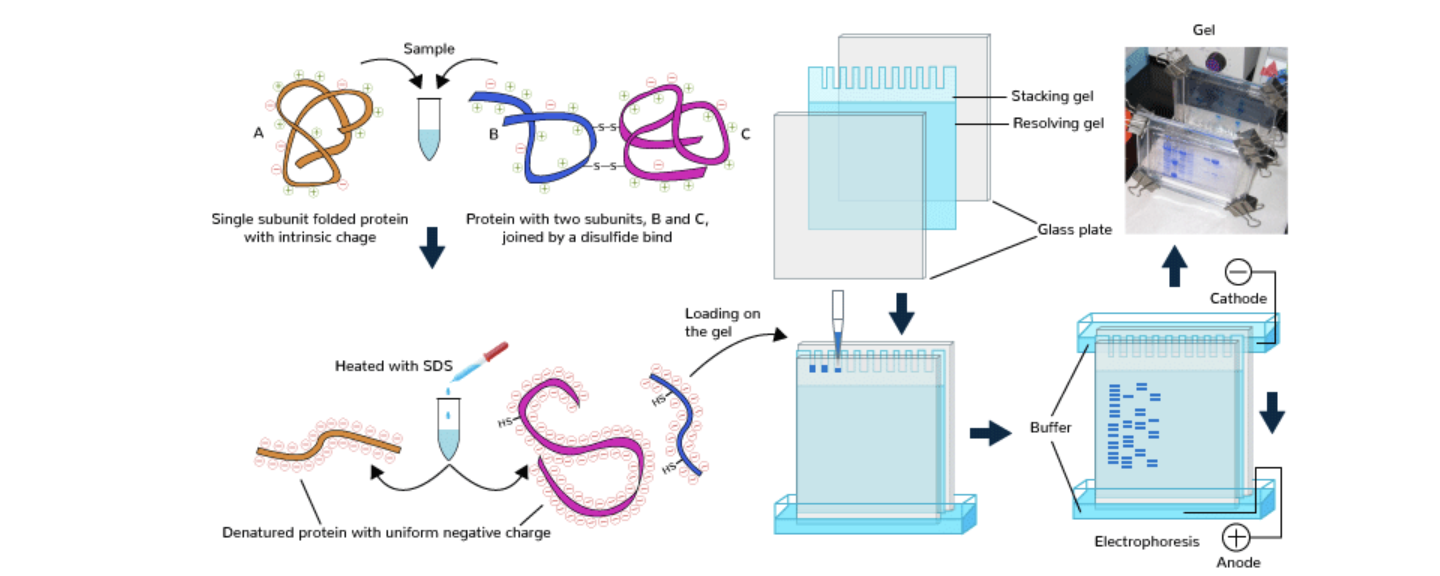
Figure of SDS-PAGE, From: https://www.geeksforgeeks.org/biology/sds-page/
- Cells are lysed using a chemical or mechanical lysis buffer to release proteins.
- Protein concentration is measured and samples are normalised to ensure equal loading.
- Samples are mixed with SDS loading buffer containing SDS detergent and a reducing agent (e.g. β-mercaptoethanol or DTT).
- Samples are heated to denature proteins, ensuring unfolding into linear polypeptide chains.
- Denatured proteins are loaded into wells of a polyacrylamide gel alongside a molecular weight ladder.
- An electric field is applied causing proteins to migrate through the gel matrix toward the positive electrode.
- Proteins separate based on molecular weight.
- The gel is stained to visualise protein bands.
- Bands are compared to the ladder to identify β-galactosidase (approx. 116 kDa) and band intensity is used to estimate relative expression levels.
5. Colourmetric output signal intensity generated through CPRG substrate hydrolysis
The colourimetric output signal measures the visible reporter response produced by β-galactosidase activity in the biosensor circuit. This is our result, it provides a direct readout in response to PAH exposure and it is important to measure this to validate the results of the project and highlight air pollutions quantitively as well as in the artistic installation.
Again, this will be measured using a UV–Vis spectrophotometer, recording absorbance at ~570 nm, which corresponds to the red/purple product formed from CPRG hydrolysis and normalised to cell density (OD600) to ensure comparability across samples.
6. Scaffold porosity and gas diffusion accessibility
Scaffold porosity measures the physical, sculptural structure of the biosensor, specifically how pore size and connectivity influence the diffusion of airborne PAH molecules into the embedded sensing system. This is important to ensure that environmental pollutants can efficiently reach the NahR –lacZ circuit and aid the selection of an appropriate scaffold material.
Porosity and surface morphology would be measured using Scanning Electron Microscopy, which provides high-resolution imaging of scaffold architecture. Image analysis would be used to quantify pore size distribution, pore interconnectivity and overall surface area and gas diffusion accessibility can be analysed from there, based on expected diffusion rates of small aromatic molecules such as PAH.
REFERENCES:
GeeksforGeeks. (n.d.). SDS-PAGE (Sodium dodecyl sulfate–polyacrylamide gel electrophoresis). https://www.geeksforgeeks.org/biology/sds-page/
Khan Academy. (n.d.). Protein electrophoresis and SDS-PAGE. https://www.khanacademy.org/test-prep/mcat/biomolecules/x04f6bc56:protein-analysis-techniques/a/protein-electrophoresis-and-sds-page
Measurlabs. (n.d.). UV-visible spectroscopy. https://measurlabs.com/methods/uv-visible-spectroscopy/
Sigma-Aldrich. (n.d.). Sanger sequencing. https://www.sigmaaldrich.com/GB/en/technical-documents/protocol/genomics/sequencing/sanger-sequencing
Thermo Fisher Scientific. (n.d.). Gas chromatography–mass spectrometry (GC–MS) information. https://www.thermofisher.com/uk/en/home/industrial/mass-spectrometry/mass-spectrometry-learning-center/gas-chromatography-mass-spectrometry-gc-ms-information.html
Nanoscience Instruments. (n.d.). Scanning electron microscopy. https://www.nanoscience.com/techniques/scanning-electron-microscopy/
Nguyen, P. Q., Soenksen, L. R., Donghia, N. M., Angenent-Mari, N. M., de Puig, H., Huang, A., Lee, R., Slomovic, S., Galbersanini, T., Lansberry, G., Sallum, H. M., Zhao, E. M., Niemi, J. B., & Collins, J. J. (2021). Wearable materials with embedded synthetic biology sensors for biomolecule detection. Nature Biotechnology, 39(11), 1366–1374. https://doi.org/10.1038/s41587-021-00950-3
Ho, G., Kubušová, V., Irabien, C., Li, V., Weinstein, A., Chawla, S., Yeung, D., Mershin, A., Zolotovsky, K., & Mogas-Soldevila, L. (2023). Multiscale design of cell-free biologically active architectural structures. Frontiers in Bioengineering and Biotechnology, 11, 1125156. https://doi.org/10.3389/fbioe.2023.1125156
Mass Spectrometry: Waters Part 1 - Molecular Weight
Based only on the predicted amino acid sequence of eGFP (see below), what is the calculated molecular weight? You can use an online calculator like the one at https://web.expasy.org/compute_pi/
VSKGEELFTG VVPILVELDG DVNGHKFSVS GEGEGDATYG KLTLKFICTT GKLPVPWPTL VTTLTYGVQC FSRYPDHMKQ HDFFKSAMPE GYVQERTIFF KDDGNYKTRA EVKFEGDTLV NRIELKGIDF KEDGNILGHK LEYNYNSHNV YIMADKQKNG IKVNFKIRHN IEDGSVQLAD HYQQNTPIGD GPVLLPDNHY LSTQSALSKD PNEKRDHMVL LEFVTAAGIT LGMDELYKLE HHHHHH
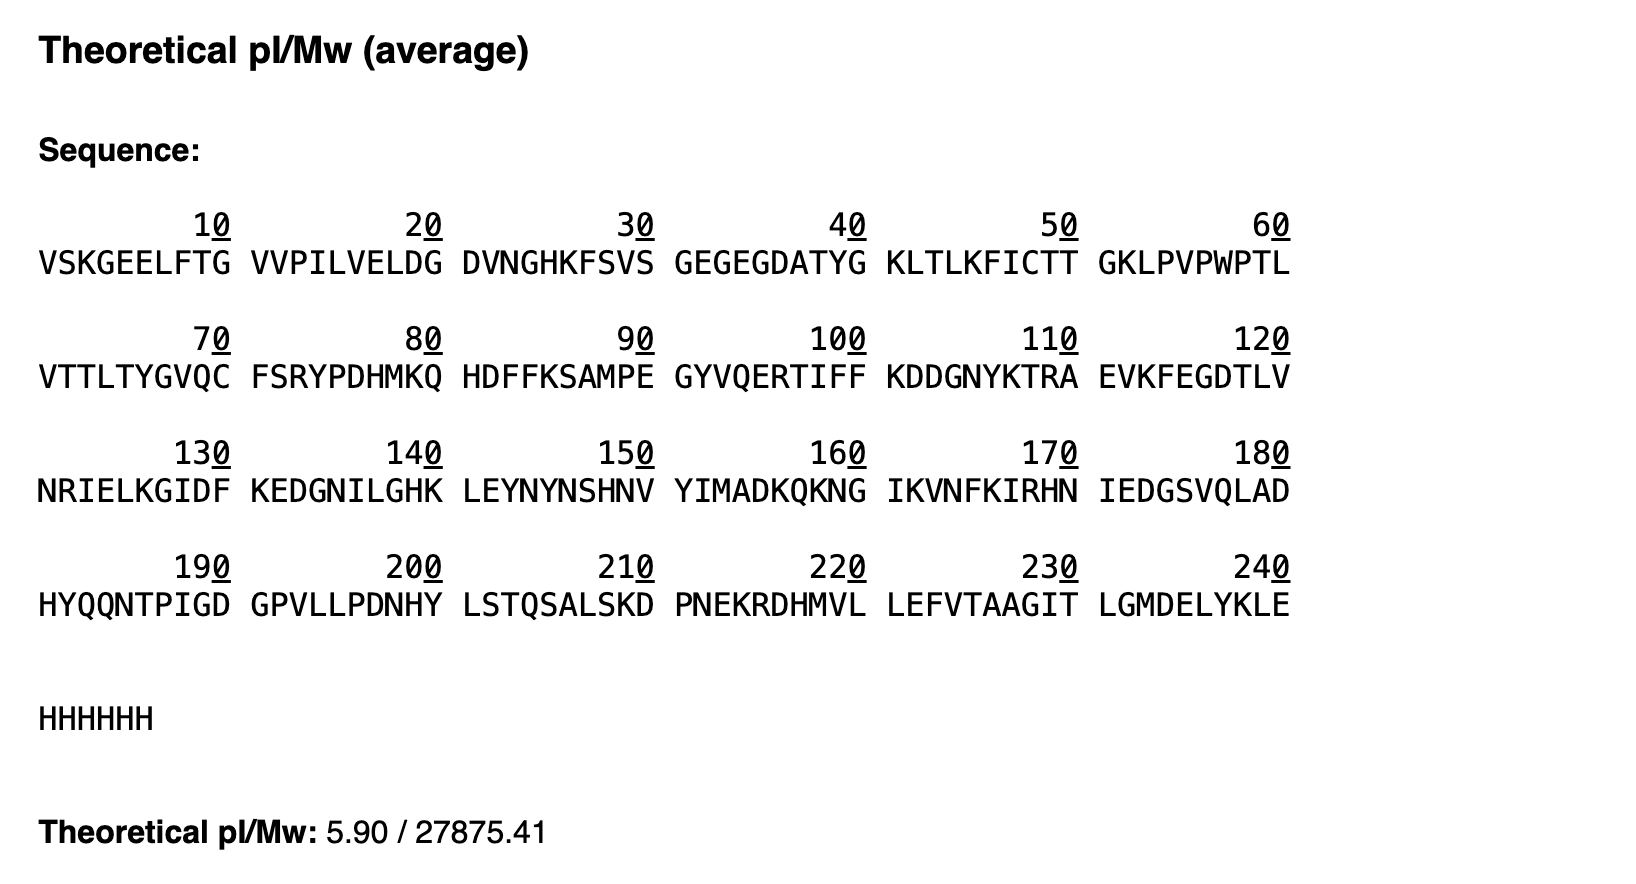
The theoretical calculated molecular weight of the eGFP construct, including the linker and His₆ purification tag, is 27875.41 Da with a theoretical pI of 5.90.
Calculate the molecular weight of the eGFP using the adjacent charge state approach described in the recitation. Select two charge states from the BioAccord data and:
- Determine z for each (n, n+1):
I choose the highest charge state and the one directly to the left.
m/z n = 824.1148
m/z n+1 = 800.6088
Therefore per the formula
z = (m/z n+1 - 1) / (m/zn - m/zn+1)
z = (800.6088-1) / (824.1148 -800.6088)
z= 799.6088/ 23.506
For n, z = 34.017221 For n+1, z = 35.017221
- Determine the MW of the protein using the relationship between m/z , MW and z.
MW = (n x m/zn - n)
MW = (34.017221 x 824.1148 - 34.017221) MW = (34.017221 x 790.0758)
Therefore: MW = 26876.923
- Calculate the mass accuracy of the measurement using the deconvoluted MW from 2.2 and the predicted weight of the protein from 2.1 using these formulae:
Accuracy = ((MW experiment - MW theory) / MW Theory) x 1000000
Accuracy = ((26876.923 - 27875.41) / 27875.41) x 1000000
Accuracy = -35,819.6346 ppm
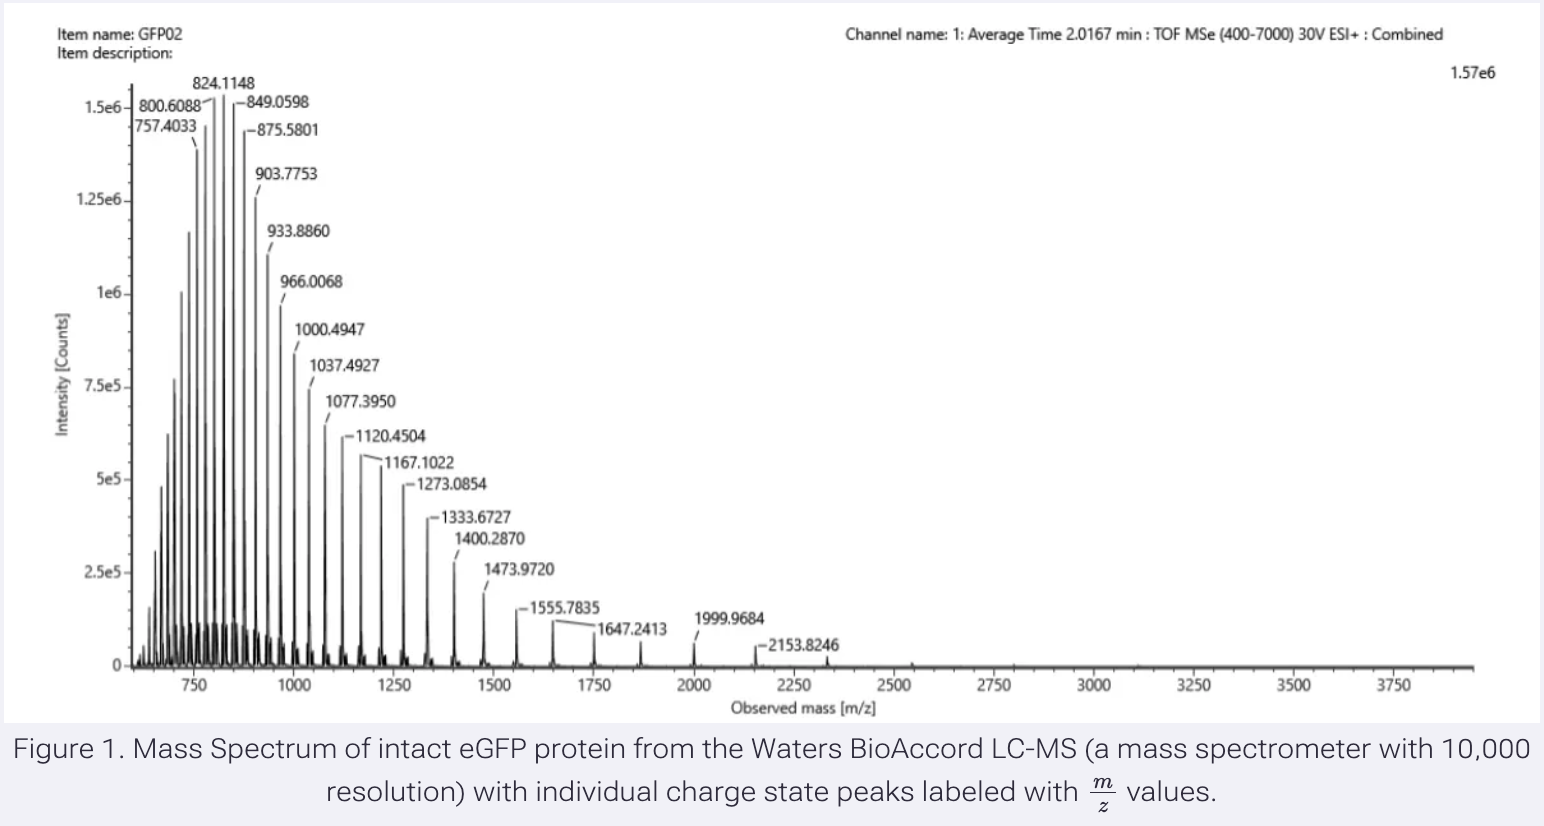
- Can you observe the charge state for the zoomed-in peak in the mass spectrum for the intact eGFP? If yes, what is it? If no, why not?
No, the charge state cannot be directly observed because the charge state is too high for the isotopic peaks to be resolved clearly at the instrument resolution used. At high charge states and large protein masses, the isotope spacing becomes very small causing the peaks to merge together.
Mass Spectrometry: Waters Part 2 : Peptide Map Work, primary structure
How many Lysines (K) and Arginines (R) are in eGFP? Please circle or highlight them in the sequence listed above. (note: Adding the sequence to Benchling as an amino acid file and clicking biochemical properties tab will show you a count for each amino acid)

20 K and 6 R
26 Lysines and Arginines in eGFP.
How many peptides will be generated from Tryptic digestion of eGFP?
- Navigate to https://web.expasy.org/peptide_mass/
- Copy/paste the sequence above into the input box in the PeptideMass tool to generate expected list of peptides.
- Use Figure 2 below as a guide for the relevant parameters to predict peptides from eGFP.
- Click “Perform the Cleavage” button in the PeptideMass tool and report the number of peptides generated when using Trypsin.
It generated 19 peptides using Trypsin:
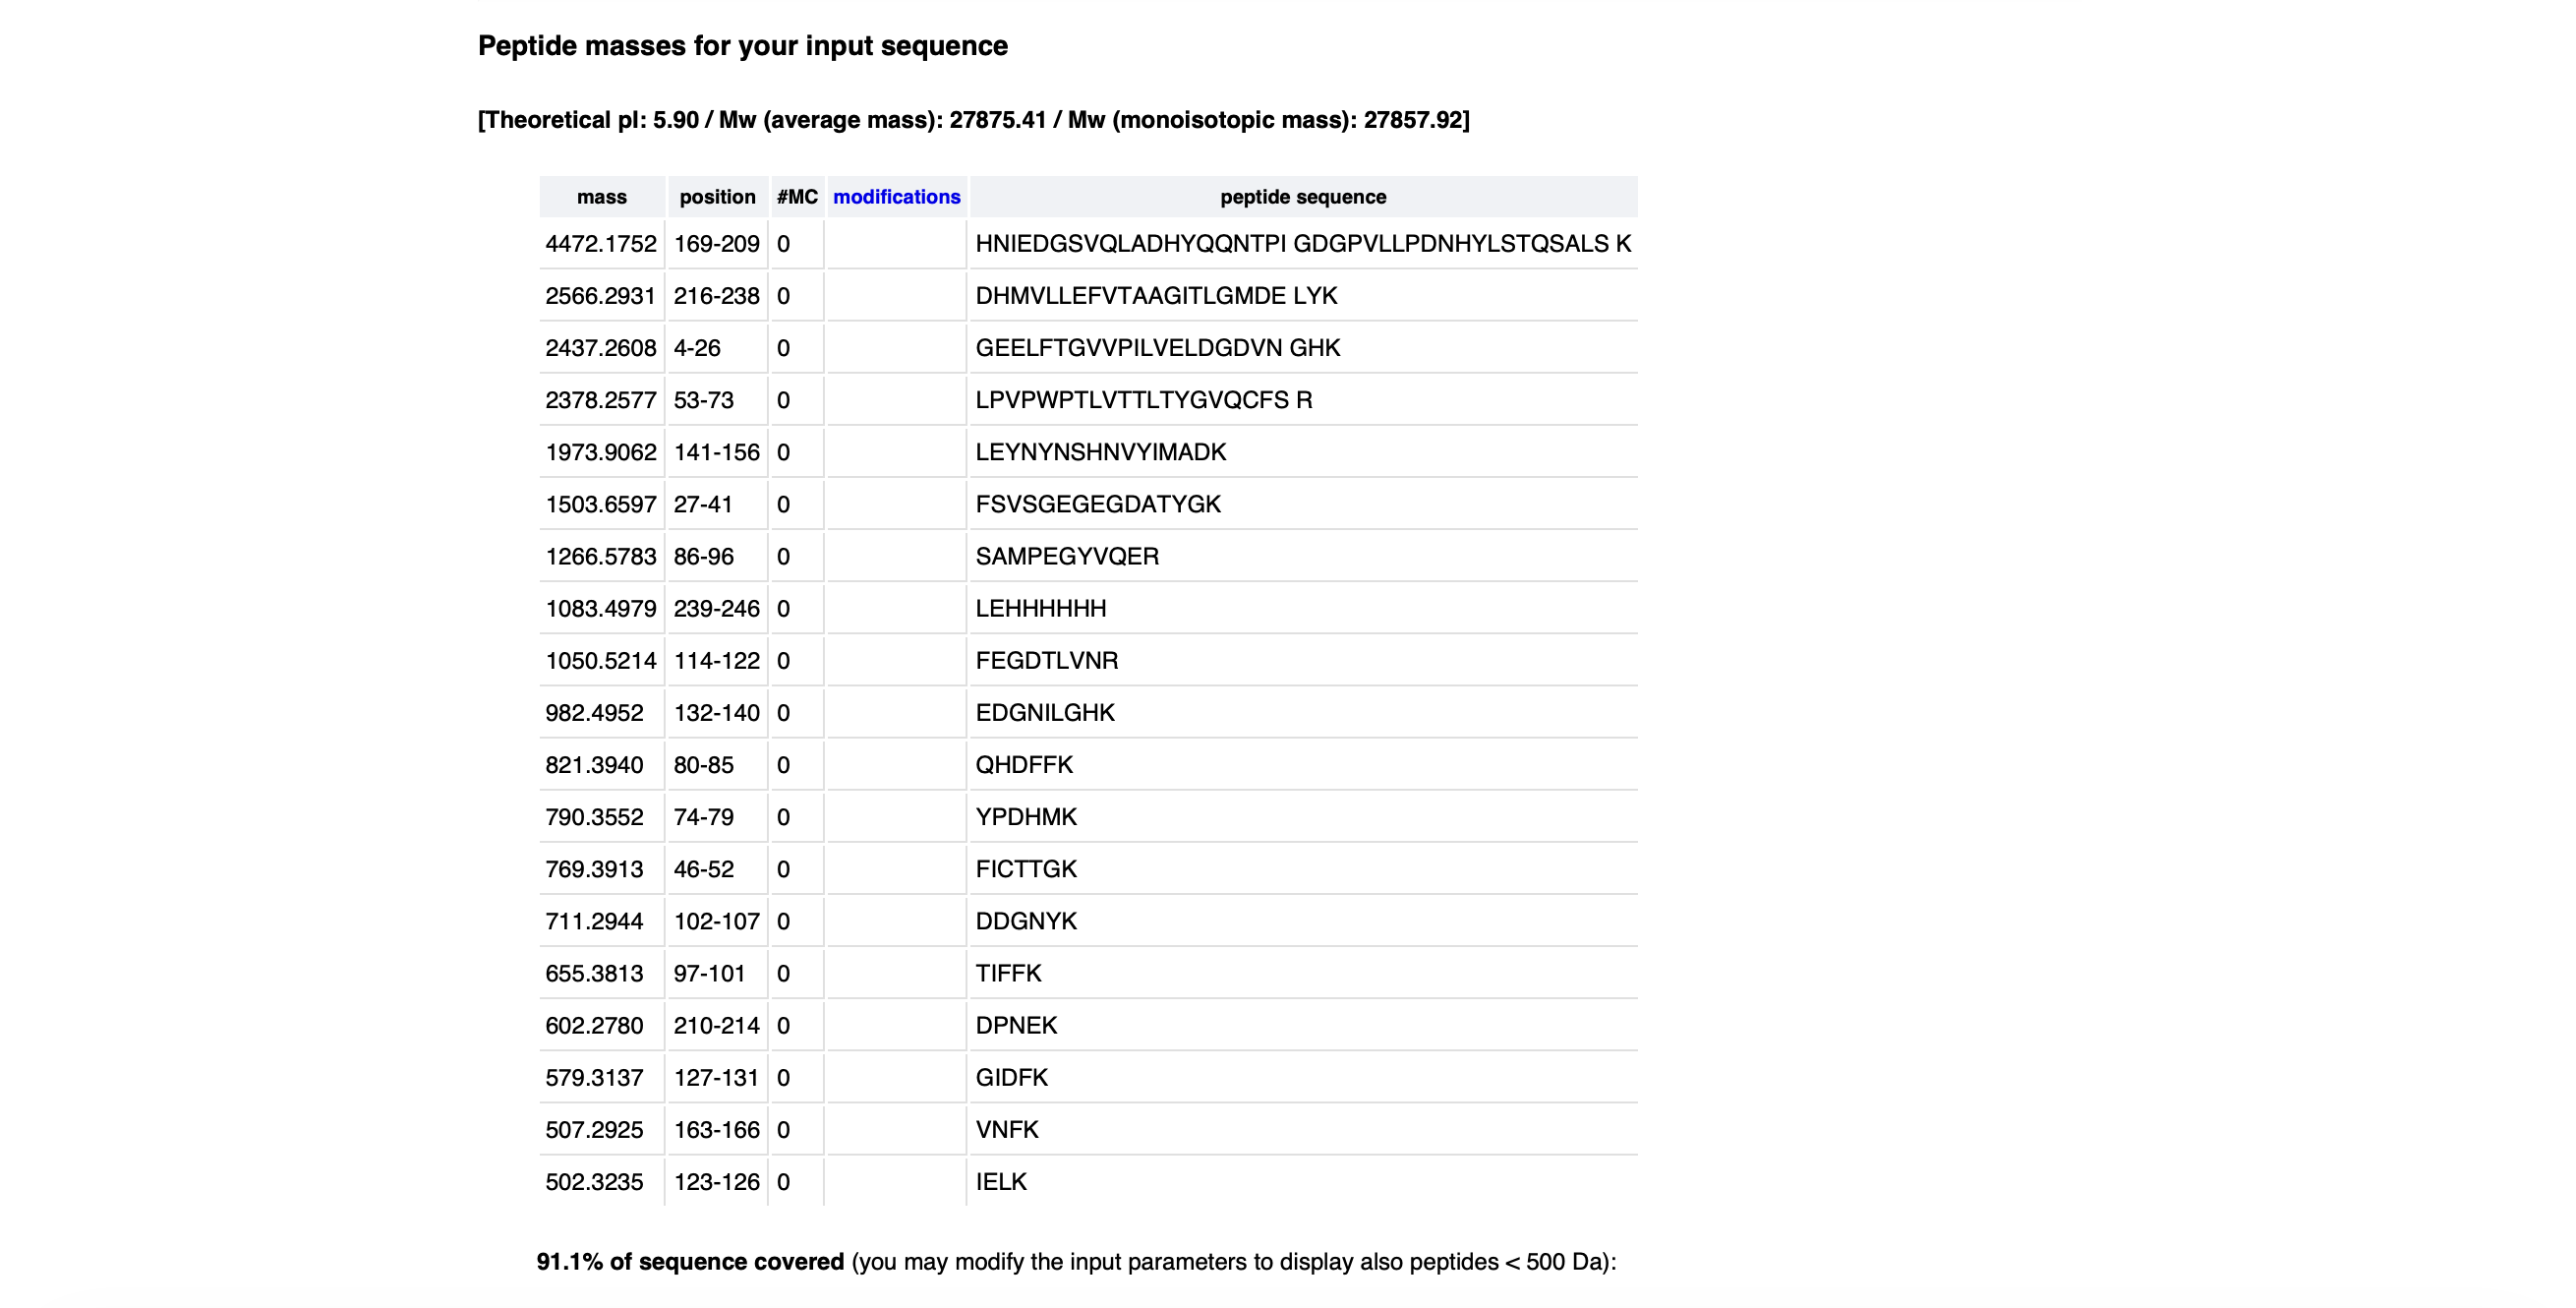
Based on the LC-MS data for the Peptide Map data generated in lab (please use Figure 3a as a reference) how many chromatographic peaks do you see in the eGFP peptide map between 0.5 and 6 minutes?
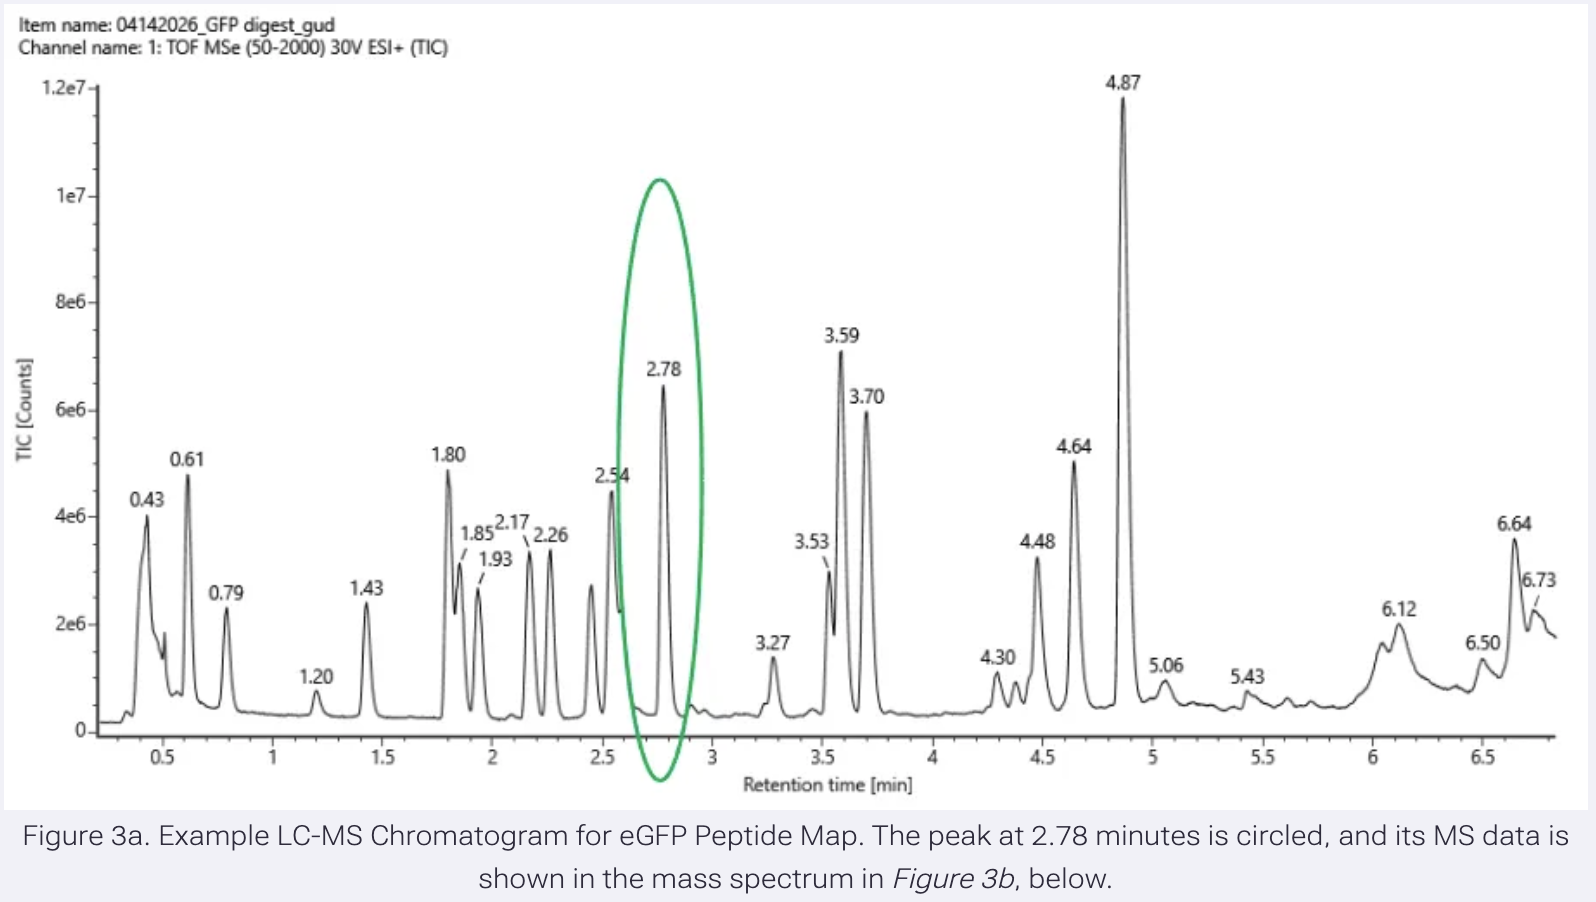
21 peaks
Assuming all the peaks are peptides, does the number of peaks match the number of peptides predicted from Step 2.3 and 2.4? Are there more peaks in the chromatogram or fewer?
No, there are more peaks in the chromatogram.
Identify the mass-to-charge (m/z) of the peptide shown in Figure 3b.
m/z of the peptide is 525.76712.
What is the charge (z) of the most abundant charge state of the peptide (use the separation of the isotopes to determine the charge state).
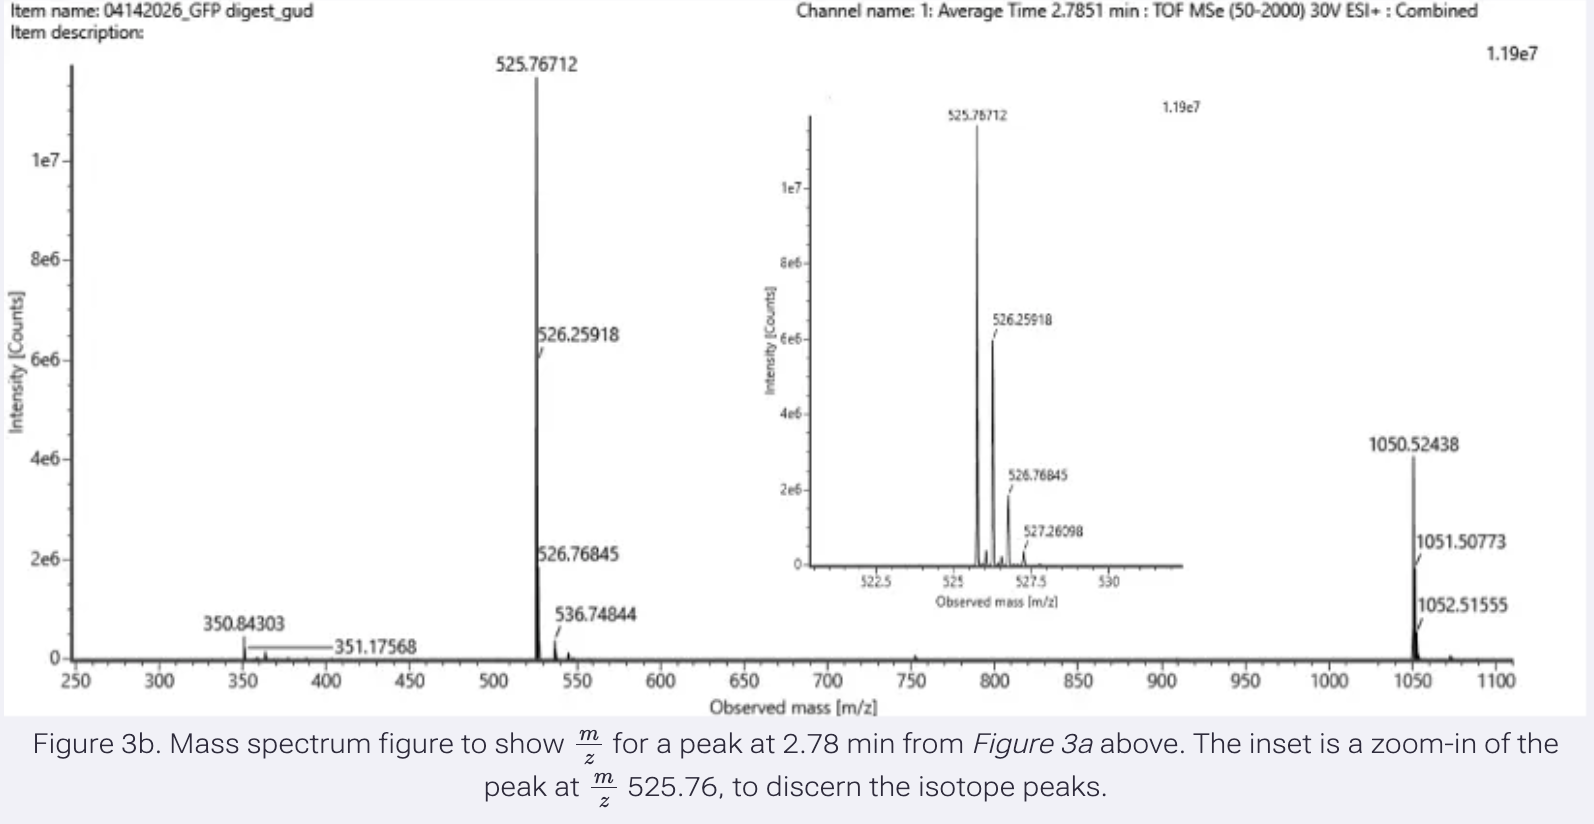
z = 1/ Δ m/z
Δ m/z = spacing between isotopic peaks.
m = 525.76712 m+1 = 526.25918
526.25918 - 525.76712 = 0.49206
Δ m/z = 0.49206
z = 1/ 0.49206
z = 2.0322724 z ≈ 2+
Calculate the mass of the singly charged form of the peptide ([M+H]+) based on its m/z and z.
m/z = (M + nH)/ n
Rearrange to:
[M + H]+ = (m/z x n) -H
where: m/z = 525.76712 n = 2.0322724 H = 1.00727 (mass of a proton H+)
Therefore:
[M+H]+ = (525.76712 x 2.0322724) - 1.00727
525.76712 x 2.0322724 = 1051.53424
[M+H]+ = 1051.53424 - 1.00727
[M+H]+ = 1050.52697 Da
Identify the peptide based on comparison to expected masses in the PeptideMass tool. What is mass accuracy of measurement? (Recall that Accuracy = ((MW experiment - MW theory) / MW Theory) x 1000000 )
Peptide Sequence: FEGDTLVNR Expected Mass: 1050.5214
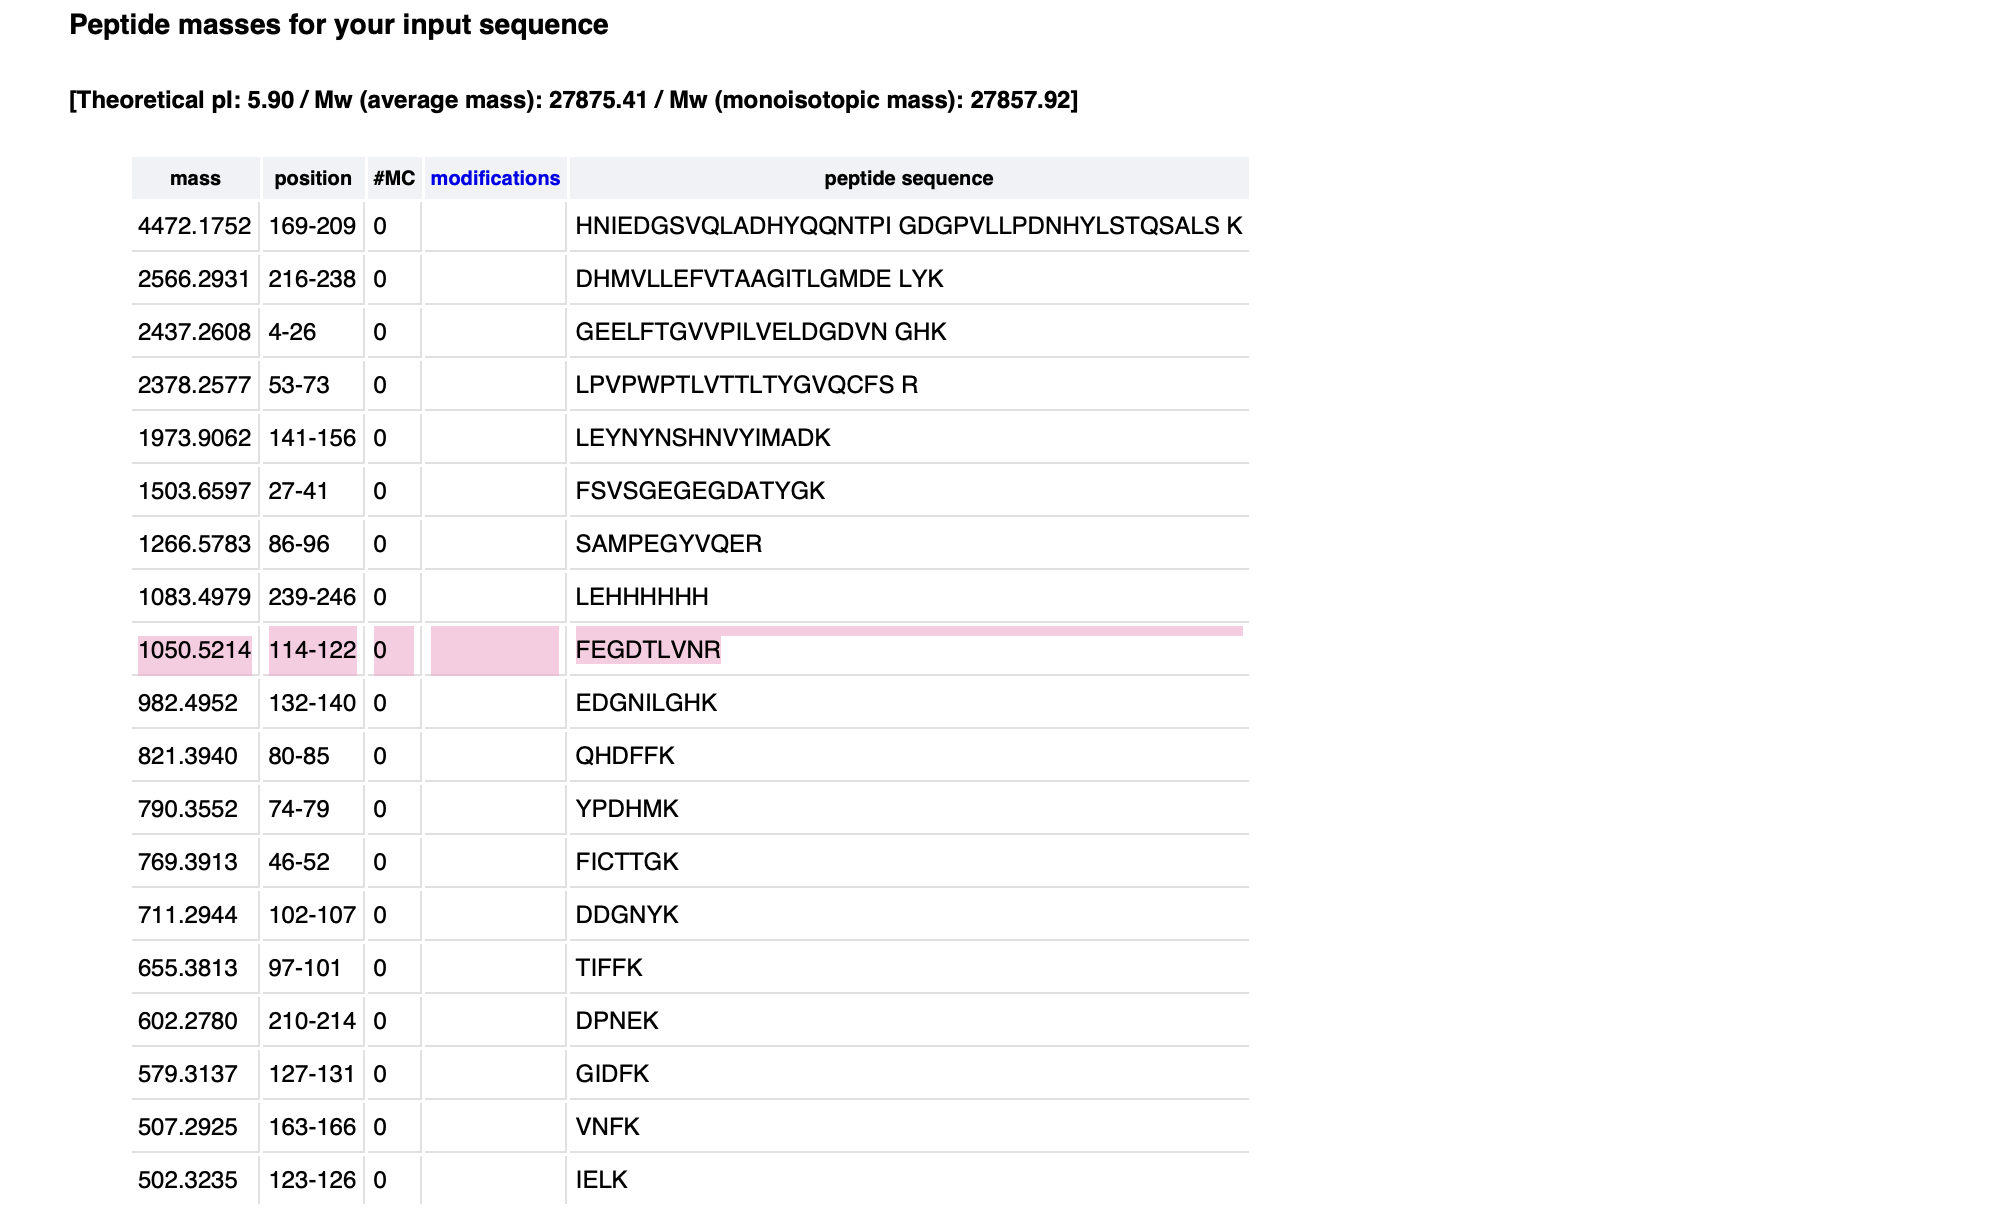
Accuracy = ((MW experiment - MW theory) / MW Theory) x 1000000 )
Accuracy = ((1050.52697 - 1050.5214) / 1050.5214) x 1000000)
Accuracy = (0.00557/1050.5214) x 1000000
Accuracy = 0.00000530212902 x 1000000
Accuracy = 5.30212902
Accuracy = 5.30 ppm
What is the percentage of the sequence that is confirmed by peptide mapping (Figure 5)?
88%
Homework: Waters Part IV — Oligomers
Using the known masses of the polypeptide subunits (Table 1) for KLH, identify where the following oligomeric species are on the spectrum shown below from the CDMS (Figure 7):
- 7FU Decamer
- 8FU Didecamer
- 8FU 3-Decamer
- 8FU 4-Decamer
| Polypeptide Subunit Name | Subunit Mass |
|---|---|
| 7FU | 340 kDa |
| 8FU | 400 kDa |
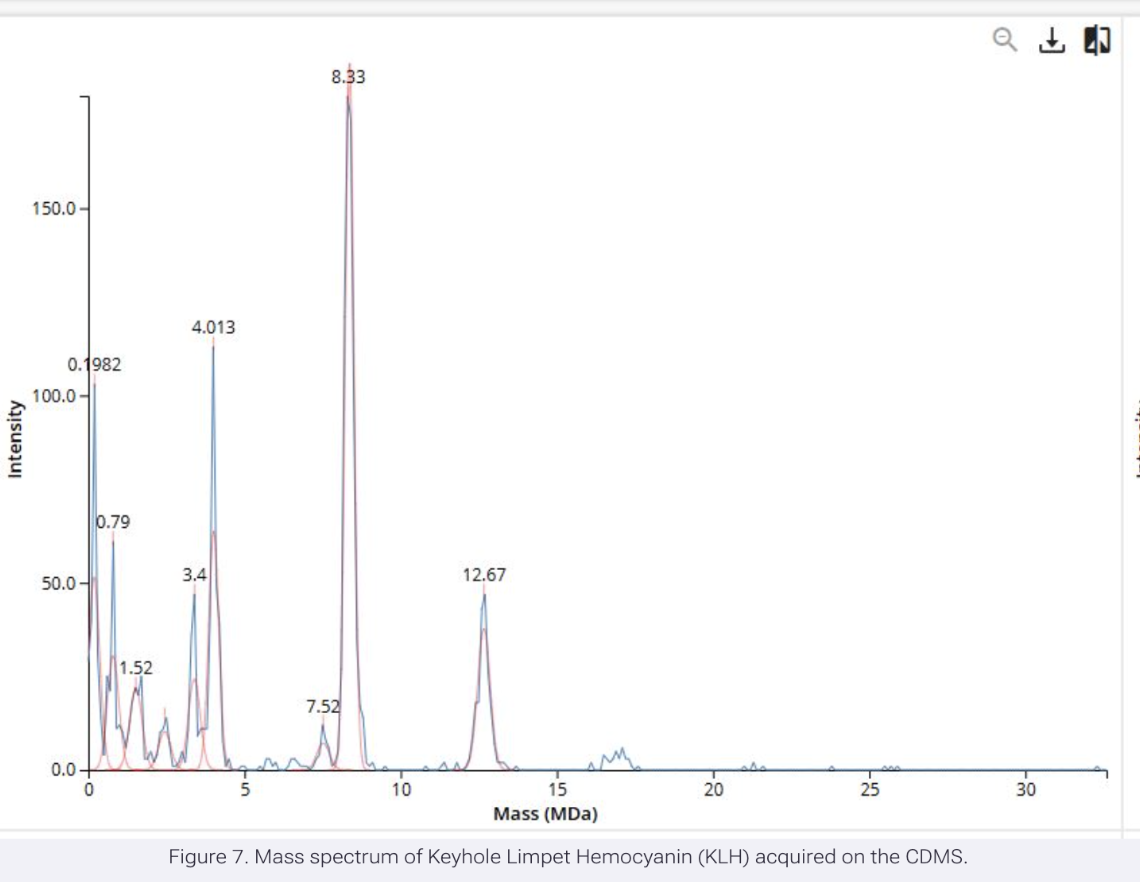
To solve this I calculated the masses of each oligomeric assembly from the monomer masses given in Table 1. I multiplied the subunit mass by the number of subunits in each oligomer:
7FU Decamer A decamer = 10 subunits
10 × 340 kDa = 3400 kDa 7FU Decamer = 3.4 MDa
8FU Didecamer A didecamer = 20 subunits
20 × 400 kDa = 8000 kDa 8FU Didecamer = 8.0 MDa
8FU 3-Decamer Three decamers = 30 subunits
30 × 400 kDa = 12000 kDa 8FU 3-Decamer = 12.0 MDa
8FU 4-Decamer Four decamers = 40 subunits
40 × 400 kDa = 16000 kDa 8FU 4-Decamer = 16.0 MDa
Therefore:
The peak at 3.4 MDa is the 7FU decamer The peak at 8.33 MDa is the 8FU didecamer The peak at 12.67 MDa is the 8FU 3-decamer And the small blue peak at approx. 16.0 MDa is the 8FU 4-Decamer
Homework: Waters Part V — Did I make GFP?
Please fill out this table with the data you acquired from the lab work done at the Waters Immerse Lab in Cambridge, or else the data screenshots in this document if you were unable to have lab work done at Waters.
| Theoretical | Observed / Measured (Intact LC-MS) | PPM Mass Error | |
|---|---|---|---|
| Molecular weight (kDa) | 27.875 kDa | 26.877 kDa | -35,819.6346 ppm |
Week 11 HW: Bioproduction & Cloud Labs
Important
Part A: The 1,536 Pixel Artwork Canvas | Collective Artwork
Contribute at least one pixel to this global artwork experiment before the editing ends on Sunday 4/19 at 11:59 PM EST.
I contributed 10 (I’m impatient and don’t know how to code haha!)
- Make a note on your HTGAA webpages including:
What you contributed to the community bioart project (e.g., “I made part of the DNA on the bottom right plate”)
I didn’t take note of which ones but they were pretty!
What you liked about the project?
I liked the excitement and working together. It was fun to not know what the picture would look like and see it evolve over time and every time you refreshed!
What about this collaborative art experiment could be made better for next year?
It took a while for me to grasp what we were doing and the onward workflow- maybe a simpler initial explanation with more layman language/ graphics would have been helpful.
Part B: Cell-Free Protein Synthesis | Cell-Free Reagents
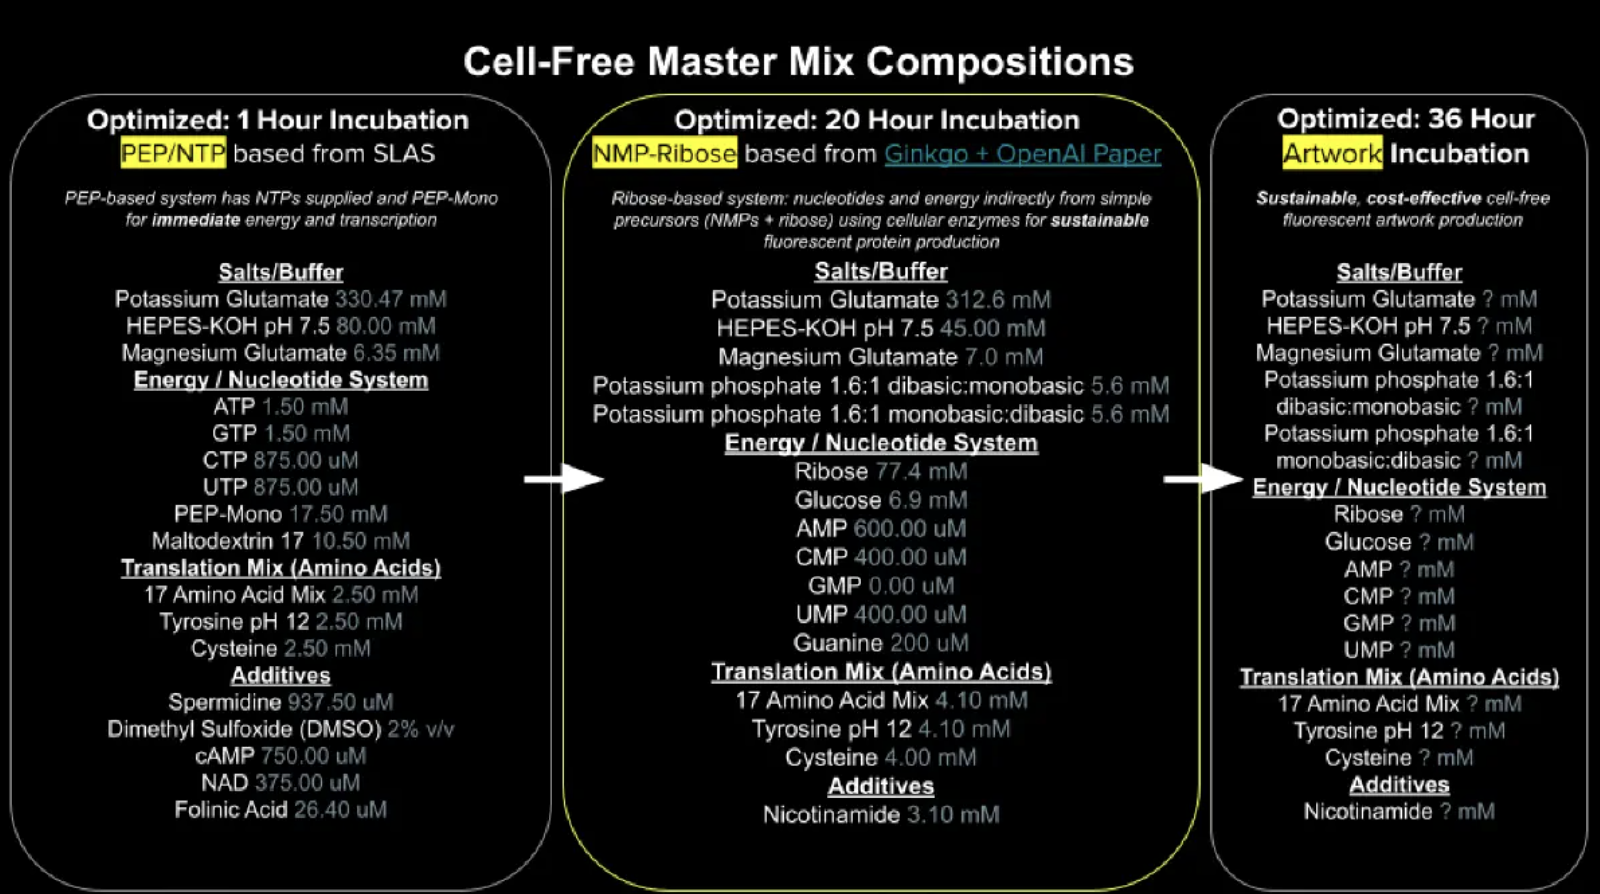
Referencing the cell-free protein synthesis reaction composition (the middle box outlined in yellow on the image above, also listed below), provide a 1-2 sentence description of what each component’s role is in the cell-free reaction.
E. coli Lysate
BL21 (DE3) Star Lysate (includes T7 RNA Polymerase)
This is a optimised, high yield E.coli cell free extract which provides all the machinery needed for transcription and translation e.g ribosomes, transcription factors, tRNAs, metabolic enzymes, chaperones. The DE3 indicates the strain carries the gene for T7 RNA polymerase. T7 RNA polymerase catalyses the formation of RNA from the DNA template, driving protein synthesis. T7RNA polymerase is one of the most efficient polymerases as it can complete a transcription cycle without requiring additional protein factors (McManus et al. 2019). The strain also carries a mutated rne gene (rne131) encoding a truncated RNase E enzyme, which reduces mRNA degradation and increases mRNA stability which makes the lysate higher yield.
Salts/Buffer
Potassium Glutamate:
A source of potassium ions for the reaction. These ions balance the charges from nucleic acid phosphate groups and other ionic compounds in the system, preservation of the ionic balance is essential for some protein nucleic acid interactions e. g ribosome stability (Jewett and Swartz, 2004). Glutamate can produce reducing equivalents such as NADH, which have a role in the generation of ATP via oxidative phosphorylation. This means that glutamate also contributes to energy regeneration in cell-free reactions (Jewett et al. 2008).
HEPES-KOH pH 7.5
Used to maintain the optimal, physiological pH of ph7.5 for the cell free system. As Smith et al. highlight in their 2026 paper highlights, pH drift, particularly acidification from metabolic byproducts is a major cause of titer collapse and the HEPES buffer had an outsized positive impact on yield (Smith et al. 2026)
Magnesium Glutamate
A source of magnesium ions for the reaction. The decrease in magnesium ions in the reaction due to the accumulation of inorganic phosphates causes protein synthesis to stop prematurely. Adding magnesium ions to CFPS has been shown to elongate the reaction time (Kim and Kim, 2009). Glutamate again contributes as an energy source in cell free reactions.
Potassium phosphate monobasic and dibasic
Together, these form a phosphate buffer that stabilises pH and supplies inorganic phosphate donors as a substrate for nucleotide regeneration pathways. This is particularly relevant in the NMP-based system (Nucleoside Monophosphate) we are using where phosphate drives NMP to NDP to NTP conversion.
Energy / Nucleotide System
Ribose
In an NMP cell-free system, ribose acts as the structural backbone needed to build and recycle NTPs. It is the source for the synthesis of phosphoribosyl pyrophosphate (PRPP) via the enzyme ribose-phosphate diphosphokinase. This activated PRPP intermediate acts as the ribose donor for phosphoribosyltransferases, which facilitate the salvage and conversion of the NMPs into NTPs required for transcription and translation (Banfalvi, 2021).
This PRPP route is most relevant to its relationship with guanine, where both Olsen et al and Smith et al found that GMP could be replaced with a combination of guanine and ribose without sacrificing protein yield. Ribose provides thet backbone that phosphoribosyltransferase enzymes use to convert free guanine into GMP, which is then phosphorylated to GTP (Smith et al. 2026)
Glucose
Is a cost effective energy source for the ATP regeneration, the system utilises glycolysis pathways present in the cell lysate to metabolise glucose and drive high-level protein synthesis.
Nucleoside Monophosphates: AMP, CMP, GMP, UMP
The source for all four NTPs required for transcription. The lysate’s endogenous kinase activities (adenylate kinase, nucleoside diphosphate kinase etc.) phosphorylate these to their di and triphosphate forms to get the NTPs. Olsen et al. established that NMPs provide a far better cost-to-titer ratio for a nucleotide regeneration strategy compared to adding pre-formed NTPs or pre-phosphorylated compounds (e.g PEP).
Guanine
is a nucleotide base added in combination with ribose as a cost-effective replacement for GMP, which is phosphorylated to GTP.
Translation Mix (Amino Acids)
17 Amino Acid Mix
Provides standard amino acid building blocks required for translation of desired protein. Glutamate, tyrosine, and cysteine are excluded from this mix because they require special handling (Whittaker, 2014).
Tyrosine
A amino acid required for the synthesis of certain proteins. It is supplied separately because of its very low aqueous solubility at neutral pH, requiring preparation at pH 12 and reduced concentration to prevent precipitation (Smith et al. 2026).
Cysteine
A amino acid required for the synthesis of certain proteins. Supplied separately because it is a highly reactive to oxidation in solution forming disulphide bonds and cystine. It must be handled carefully to maintain the cysteine pool for incorporation into proteins.
Additives
Nicotinamide
Nicotinamide is added to maintain high levels of NAD⁺/ NADH. Enzymes in the lysate convert nicotinamide to NAD⁺, replenishing the NAD⁺/NADH pool needed to sustain ATP regeneration throughout the reaction for transcription and translation (Jewett et al. 2008).
Backfill
Nuclease Free Water
Used to bring each reaction well to the defined total volume, ensuring all reactions are at equivalent concentration and volume without introducing RNase contamination that would degrade the mRNA template and collapse protein production.
References
Thermo Fisher Scientific. (n.d.). BL21 Star™ (DE3)pLysS One Shot™ chemically competent E. coli (C602003): FAQs. Retrieved April 24, 2026, from https://www.thermofisher.com/order/catalog/product/C602003/faqs
BenchChem Technical Support Team. (2025, December). The multifaceted role of potassium phosphate dibasic in molecular biology: A technical guide. BenchChem. https://pdf.benchchem.com/151/The_Multifaceted_Role_of_Potassium_Phosphate_Dibasic_in_Molecular_Biology_A_Technical_Guide.pdf
Harman, J. (2022). Development of a cell-free strategy for the directed evolution of enzymes for high-value natural products (MScRes thesis, University of Kent). https://doi.org/10.22024/UniKent/01.02.99209. Available at: https://kar.kent.ac.uk/99209/1/88Thesis_-_Joshua_Harman_complete.pdf
McManus, J. B., Emanuel, P. A., Murray, R. M., & Lux, M. W. (2019). A method for cost-effective and rapid characterization of engineered T7-based transcription factors by cell-free protein synthesis reveals insights into the regulation of T7 RNA polymerase-driven expression. Archives of Biochemistry and Biophysics, 674, 108045. https://doi.org/10.1016/j.abb.2019.07.010
Jewett, M. C., & Swartz, J. R. (2004). Mimicking the Escherichia coli cytoplasmic environment activates long-lived and efficient cell-free protein synthesis. Biotechnology and Bioengineering, 86(1), 19–26. https://doi.org/10.1002/bit.20026
Jewett, M. C., Calhoun, K. A., Voloshin, A., Wuu, J. J., & Swartz, J. R. (2008). An integrated cell‐free metabolic platform for protein production and synthetic biology. Molecular Systems Biology, 4(1), 220. https://doi.org/10.1038/msb.2008.57
Bánfalvi, G. (2021). Prebiotic pathway from ribose to RNA formation. International Journal of Molecular Sciences, 22(8), 3857. https://doi.org/10.3390/ijms22083857
Kim, H.-C., & Kim, D.-M. (2009). Methods for energizing cell-free protein synthesis. Journal of Bioscience and Bioengineering, 108(1), 1–4. https://doi.org/10.1016/j.jbiosc.2009.02.007
Whittaker, J. W. (2013). Cell-free protein synthesis: The state of the art. Biotechnology Letters, 35(2), 143–152. https://doi.org/10.1007/s10529-012-1075-4
Smith, A. A., Wong, E. L., Donovan, R. C., Chapman, B. A., Harry, R., Tirandazi, P., Kanigowska, P., Gendreau, E. A., Dahl, R. H., Jastrzebski, M., Cortez, J. E., Bremner, C. J., Morales Hemuda, J. C., Dooner, J., Graves, I., Karandikar, R., Lionetti, C., Christopher, K., Consiglio, A. L., … Shetty, R. P. (2026). Using a GPT-5-driven autonomous lab to optimize the cost and titer of cell-free protein synthesis. Preprint. https://doi.org/10.64898/2026.02.05.703998
Olsen, M. L., Copeland, C. E., Sundberg, C. A., Aw, R., Shaver, Z. M., Rao, G., Swartz, J. R., Karim, A. S., & Jewett, M. C. (2025). Design-driven optimization of low-cost reagent formulations for reproducible and high-yielding cell-free gene expression. bioRxiv. https://doi.org/10.1101/2025.08.01.668204
Describe the main differences between the 1-hour optimised PEP-NTP master mix and the 20-hour NMP-Ribose-Glucose master mix shown in the Google Slide above. (2-3 sentences)
The most fundamental difference between the two systems is their energy and nucleotide strategy. In the 1 hour system pre-formed NTPs (ATP, GTP, CTP, UTP) are used with PEP Mono as an immediate, high energy phosphate donor for rapid NTP regeneration. This enabling fast transcription and translation within 1 hour but at significantly higher reagent cost.
The 20 hour NMP/Ribose system relies on the lysate’s endogenous kinase machinery to phosphorylate cheap NMP to NTPs, with ribose, glucose and inorganic phosphate (from the potassium phosphate buffer). This is a slower but more cost-effective nucleotide regeneration strategy over 20 hours, as established by Olsen et al and Smith et al.
The 1 hour system also contains additional costly additives such as NAD⁺, folinic acid, cAMP, spermidine and DMSO, as the system relies on exogenously supplied cofactors, whereas the 20 hour system instead supplies nicotinamide as a cheap NAD⁺ precursor and relies on the lysate’s endogenous enzymes to maintain cofactors throughout a longer reaction.
Part C: Planning the Global Experiment | Cell-Free Master Mix Design
Given the 6 fluorescent proteins we used for our collaborative painting, identify and explain at least one biophysical or functional property of each protein that affects expression or readout in cell-free systems. (Hint: options include maturation time, acid sensitivity, folding, oxygen dependence, etc) (1-2 sentences each)
While sfGFP is designed to fold significantly faster than GFP variants and is much more stable, the chemical maturation of its chromophore, which involves cyclisation, dehydration and oxidation is still constrained by the need for molecular oxygen to modify the peptide backbone. This could be a dependancy that could be supplemented in the cell free system, so fluorescence is not reduced by poorly oxygenated or high-density cell-free reactions even when protein expression is strong.
mRFP1 has a relatively slow chromophore maturation kinetics and lower folding efficiency compared with newer red FPs such as mFruit and mCherry. Like all red fps it also requires an additional oxidation step to form the complete chromophore structure responsible for its red fluorescence and is prone to being dim and bleaching quickly, which often results in weak fluorescence output within the limited time window typical of TX–TL cell-free reactions. It also has low acid sensitivity.
Has a moderate acid sensitivity meaning optimal folding occurs under conditions that avoid extreme pH, so fluorescence intensity can decrease if the cell-free reaction becomes acidic during transcription–translation. Kaida and Miura, 2012 also show that mKO2 is particularly sensitive to oxygen availability compared to mAG (a monomeric Azami Green fluorescent protein), meaning that when oxygen levels drop (hypoxic conditions), mKO2 fluorescence drops off more sharply and quickly.
mTurquoise has a relatively low extinction coefficient (30,000 M⁻¹cm⁻¹) compared to other fluorescent proteins means it is less bright per molecule than alternatives, potentially limiting detection sensitivity at low expression levels.
mScarlet-I matures faster than previous RFPs but still undergoes a multi-step red chromophore maturation pathway that is slower and more oxygen-dependent than GFP proteins, often limiting early fluorescence accumulation in cell-free reactions. It also has a moderate acid sensitivity meaning pH drift during ATP consumption and transcriptional activity in cell-free systems could reduce fluorescence.
Electra2 belongs to the blue fluorescent protein class, which generally exhibits lower intrinsic brightness than green/red fluorescent proteins, and its chromophore formation proceeds through a non-fluorescent intermediate that limits its rate, delaying fluorescence development after translation. Blue fluorescent proteins often have lower photostability and are harder to detect with standard imaging systems, which can reduce signal strength in lysate-based cell-free reactions.
Part D: Hypothesis and Master-mix Experiment 1
Create a hypothesis for how adjusting one or more reagents in the cell-free mastermix could improve a specific biophysical or functional property you identified above, in order to maximize fluorescence over a 36-hour incubation. Clearly state the protein, the reagent(s), and the expected effect.
Protein:
mScarlet_I
Property:
Moderate acid-sensitivity and slower oxygen dependant maturation
Explanation:
mScarlet_I flourescence is limited by its sensitivity to pH drift which can occur as cell-free reactions metabolize glucose over 36 hours. The accumulation of organic acids (e.g. acetate, lactate) lowers the pH, which protonates the chromophore and quenches fluorescence prematurely. In addition, the maturation of its red chromophore requires an additional step of oxidative cyclisation which is energy intensive and can be limited by metabolic exhaustion.
Hypothesis and Expected Effects:
I hypothesise that the combination of 55 mM HEPES-KOH and 5.0 mM Nicotinamide will extend the window of mScarlet_I peak fluorescence compared to either reagent alone by simultaneously stabilising the reaction pH of 7.5 and sustaining the NAD+/NADH pool over 36 hours. This is because the increased HEPES-KOH will provide a greater buffering capacity to counteract ph drift and prevents acid induced quenching of the chromophore. Simultaneously, increasing the Nicotinamide sustains the metabolic energy required for the energy intensive multi-step chromophore maturation. I further hypothesise that in increasing these reagents in the mixture, I am slightly altering the ionic strength of the solution. Therefore, I am adding a slight increase of Magnesium Glutanate for ribosomal stability and therefore the efficiency of the translation. I am using a factorial experiment design that tests each reagent individually and in combination, ensuring that any observed improvements are attributable to specific reagent interactions.
The second phase of this lab will be to define the precise reagent concentrations for your cell-free experiment. You will be assigned artwork wells with specific fluorescent proteins and receive an email with instructions this week (by April 24). You can begin composing master mix compositions here.
I choose 8 wells of mScarlet_I and defined the precise concentrations of the master-mix across them to validate my hypothesis. I used a factorial experiment design with negative control in order to idetify which combination of reagent adjustments optimises the peak flourescence of the protein.

| Well | HEPES-KOH | Nicotinamide | Mg-Glutamate | Experiment |
|---|---|---|---|---|
| 1 Q3-B13 | 45.0 mM | 3.125 mM | 6.975 mM | Control |
| 2Q3-C13 | 55.0 mM | 3.125 mM | 6.975 mM | Variable A: Does +10mM HEPES increase flourescence |
| 3Q3-D13 | 45.0 mM | 5.000 mM | 6.975 mM | Variable B: Does +1.875mM Nic increase flourescence |
| 4Q3-E13 | 45.0 mM | 3.125 mM | 7.600 mM | Variable C: Does +0.625mM Mg increase flourescence |
| 5Q3-B11 | 55.0 mM | 5.000 mM | 6.975 mM | Combined Variables(A+B): Does HEPES + Nicotinamide increase flourescence |
| 6Q3-C11 | 55.0 mM | 3.125 mM | 7.600 mM | Combined Variables(A+C): Does HEPES + Mg increase flourescence |
| 7Q3-D11 | 45.0 mM | 5.000 mM | 7.600 mM | Combined Variables(B+C): Does Nicaotinamide + Mg increase flourescence |
| 8Q3-F4 | 55.0 mM | 5.000 mM | 7.600 mM | Combined Variables(A+B+C): Do Does HEPES + Nicaotinamide + Mg increase flourescence |
References
Andrews BT, Schoenfish AR, Roy M, Waldo G, Jennings PA. The rough energy landscape of superfolder GFP is linked to the chromophore. J Mol Biol. 2007 Oct 19;373(2):476-90. doi: 10.1016/j.jmb.2007.07.071. Epub 2007 Aug 15. PMID: 17822714; PMCID: PMC2695656.
Balleza, E., Kim, J. M., & Cluzel, P. (2018). Systematic characterization of maturation time of fluorescent proteins in living cells. Scientific Reports, 8, 1448. https://doi.org/10.1038/s41598-018-19355-0
Fraikin, N., Couturier, A., Mercier, R., & Lesterlin, C. (2025). A palette of bright and photostable monomeric fluorescent proteins for bacterial time-lapse imaging. Science Advances, 11(16), eads6201. https://doi.org/10.1126/sciadv.ads6201
Kaida, A., & Miura, M. (2012). Differential dependence on oxygen tension during the maturation process between monomeric Kusabira Orange 2 and monomeric Azami Green expressed in HeLa cells. Biochemical and Biophysical Research Communications, 421(4), 855–859. https://doi.org/10.1016/j.bbrc.2012.04.102
Goedhart, J., von Stetten, D., Noirclerc-Savoye, M. et al. Structure-guided evolution of cyan fluorescent proteins towards a quantum yield of 93%. Nat Commun 3, 751 (2012). https://doi.org/10.1038/ncomms1738
Papadaki, S., Wang, X., Wang, Y., Zhang, H., Jia, S., Liu, S., Yang, M., Zhang, D., Jia, J. M., Köster, R. W., Namikawa, K., & Piatkevich, K. D. (2022). Dual-expression system for blue fluorescent protein optimization. Scientific Reports, 12(1), 10190. https://doi.org/10.1038/s41598-022-13214-0
Week 12 HW: Building Genomes
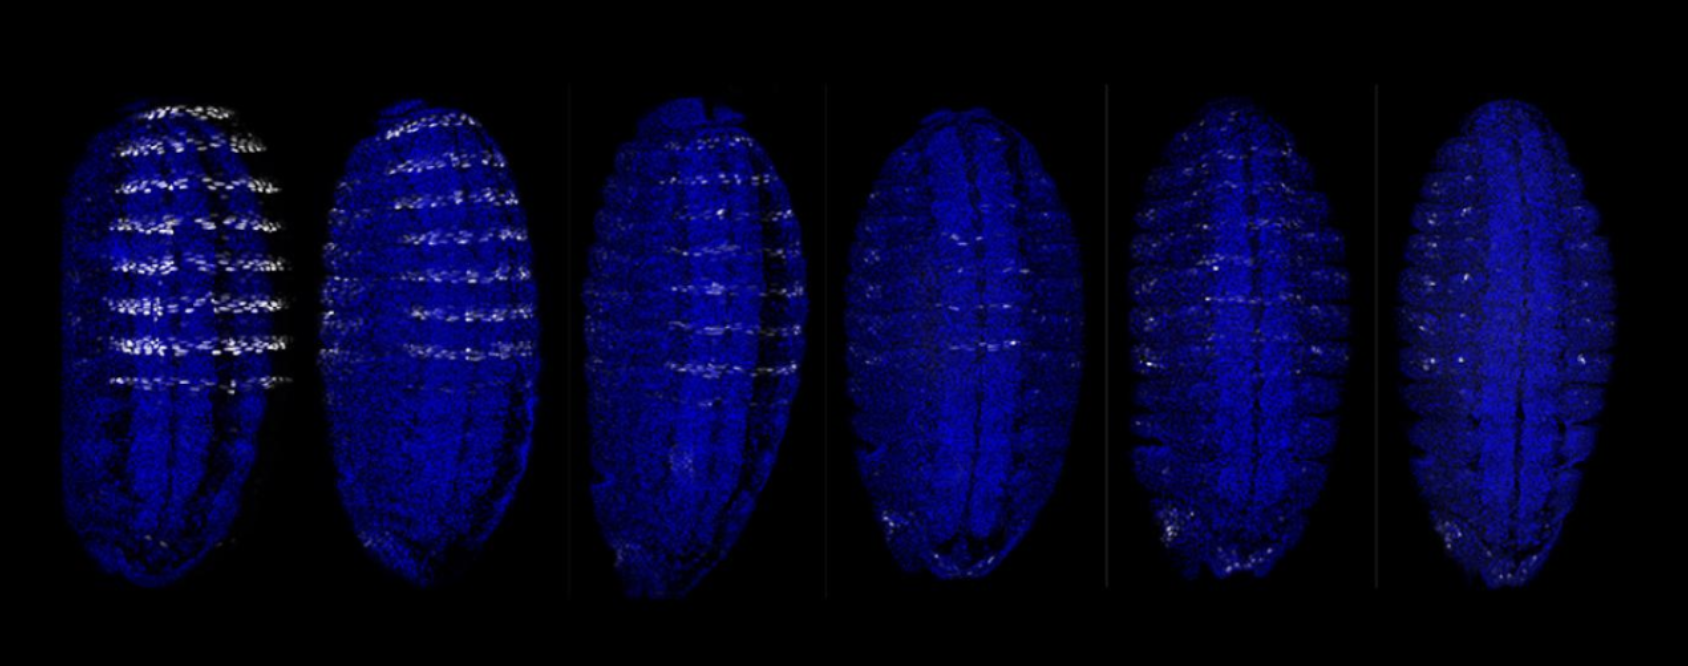
Important
See week 11 for homework :)
Week 13 HW: AI, Syn Bio and Scaling Health Innovation

Important
Homework is to work on our Final Projects :)
Week 14 HW: Bio-Design and Bio-Fabrication

Important
Resources
Homework is to work on our Final Projects :)