Week 10 HW: Imaging and Measurement
Homework: Final Project
Please identify at least one (ideally many) aspect(s) of your project that you will measure. It could be the mass or sequence of a protein, the presence, absence, or quantity of a biomarker, etc.
Please describe all of the elements you would like to measure, and furthermore describe how you will perform these measurements.
What are the technologies you will use (e.g., gel electrophoresis, DNA sequencing, mass spectrometry, etc.)? Describe in detail.
This project proposes a low-cost, portable biosensor for detecting and grading liver damage using a finger-prick blood sample. The system is designed to measure multiple circulating biomarkers associated with liver injury, primarily miR-122 (a liver-specific microRNA indicating early hepatic stress) and Keratin-18 (K18, a marker of hepatocyte cell death). These biomarkers are chosen because they reflect different stages and types of liver damage, improving diagnostic accuracy compared to single-marker approaches.
The biosensor operates using a paper-based microfluidic platform that distributes a small blood sample into separate reaction zones. Each zone contains freeze-dried cell-free synthetic biology systems (transcription-translation systems) engineered with genetic circuits such as toehold switches or antibody/aptamer-based detection modules. When target biomarkers are present, these circuits activate and produce a visible output signal, such as a color change or fluorescence, which can be observed directly or quantified using a smartphone.
Each biomarker is measured independently by its respective sensing circuit, producing a signal proportional to its concentration in the sample. miR-122 detection is based on RNA-triggered activation of synthetic gene expression, while K18 is detected through binding-based recognition systems that initiate a reporter signal. The combination of these outputs provides a multiplex biomarker profile of liver health.
The results from all biomarkers are then integrated into a single computational model that converts signal intensity into a standardized liver damage score. This score ranges from Grade 0 (healthy, normal biomarker levels) to Grade 4 (critical liver damage with strongly elevated biomarker signals), allowing the system to classify severity in a simple and interpretable way.
Overall, the biosensor combines synthetic biology, paper-based diagnostics, and multiplex biomarker detection to create an accessible, rapid, and scalable method for assessing liver damage using minimal patient input.
Homework: Waters Part 1 — Molecular Weight
We will be analyzing an eGFP standard onto a BioAccord LC-MS system to determine the molecular weight of intact eGFP and observe its charge state distribution in the denatured (unfolded) state. The conditions for LC-MS analysis of intact protein cause it to unfold and be detected in its denatured form (due to the solvents and pH used for analysis).
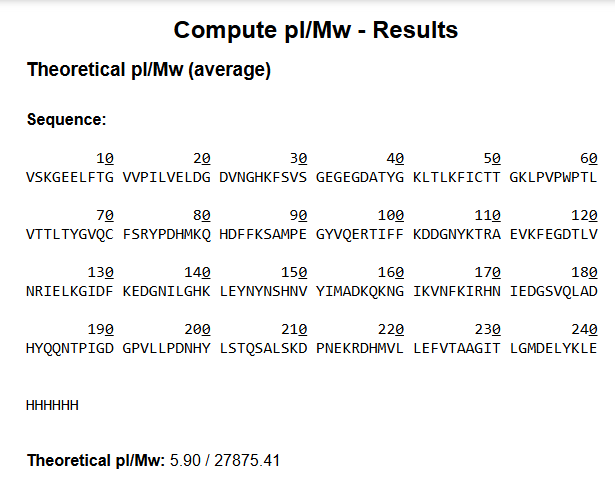
Based only on the predicted amino acid sequence of eGFP (see below) and any known modifications, what is the calculated molecular weight? You can use an online calculator like the one at https://web.expasy.org/compute_pi/ eGFP Sequence:
VSKGEELFTG VVPILVELDG DVNGHKFSVS GEGEGDATYG KLTLKFICTT GKLPVPWPTL VTTLTYGVQC FSRYPDHMKQ HDFFKSAMPE GYVQERTIFF KDDGNYKTRA EVKFEGDTLV NRIELKGIDF KEDGNILGHK LEYNYNSHNV YIMADKQKNG IKVNFKIRHN IEDGSVQLAD HYQQNTPIGD GPVLLPDNHY LSTQSALSKD PNEKRDHMVL LEFVTAAGIT LGMDELYKLE HHHHHH
- Note: This contains a His-purification tag and a linker.
With the Modifications (His Tag + linker)
Theoritical pI/MW: 5.90/27875.41
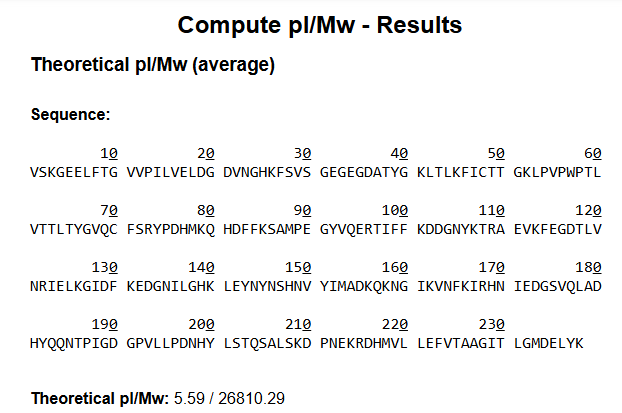
Without Modifications
Theoritical pI/MW: 5.59/26810.29
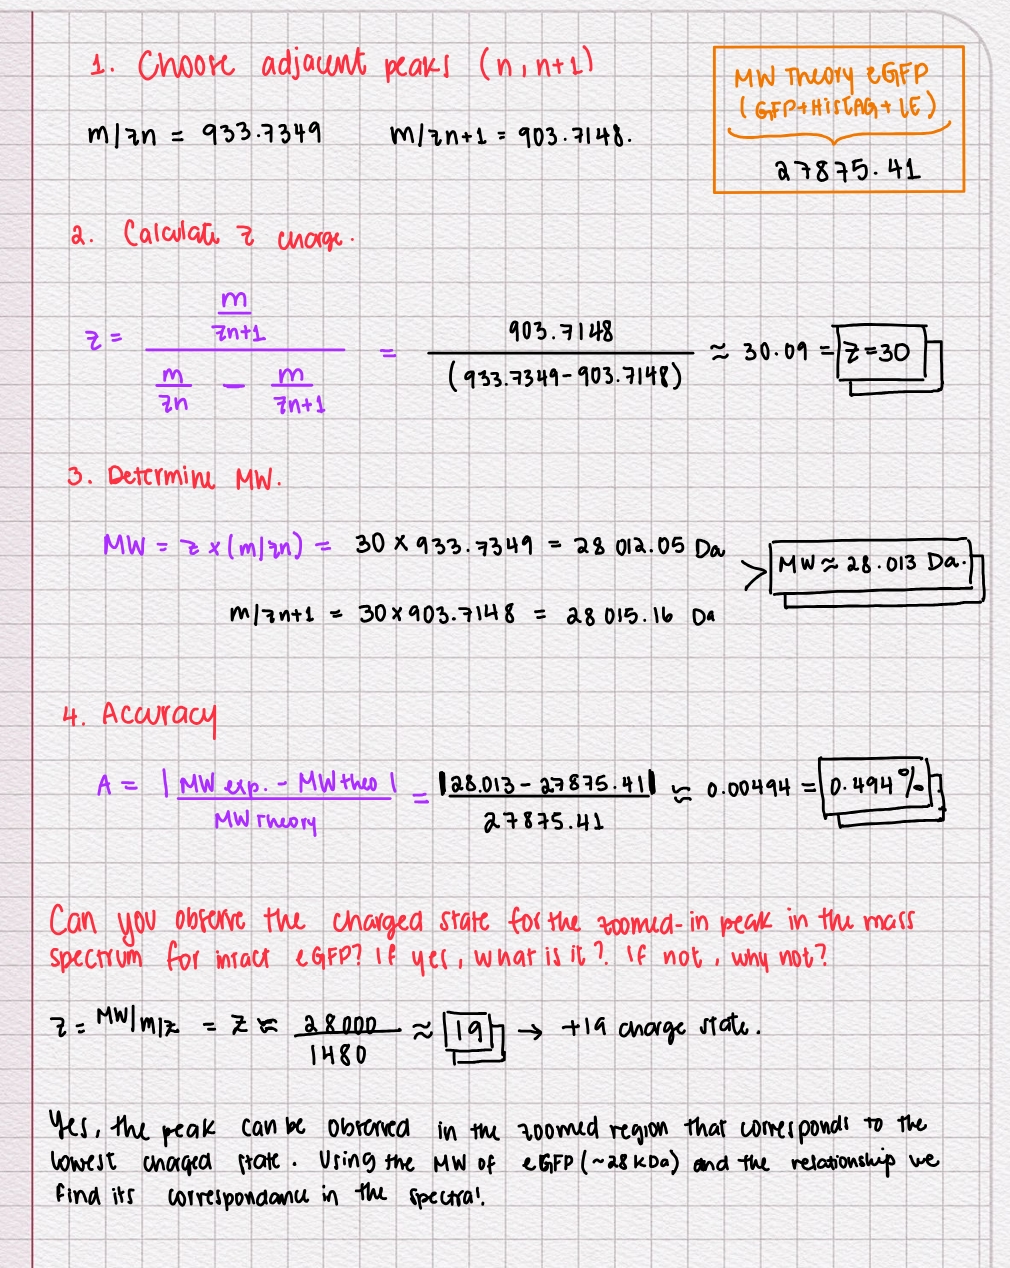
- Calculate the molecular weight of the eGFP using the adjacent charge state approach described in the recitation. Select two charge states from the intact LC-MS data (Figure 1) and:
- Determine z for each adjacent of peaks (n,n+1) using:
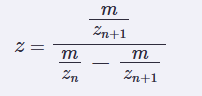
Determine the MW of the protein
Calculate the mass accuracy of the measurement using the deconvoluted MW from 2.2 and the predicted weight of the protein from 2.1
- Can you observe the charge state for the zoomed-in peak in the mass spectrum for the intact eGFP? If yes, what is it? If no, why not?
Homework: Waters Part 2 — Secondary/Tertiary structure
We will be analyzing eGFP in its native, folded state and comparing it to its denatured, unfolded state on a quadrupole time-of-flight MS. We will be doing MS only analysis (no liquid chromatography) on the Xevo G3-QToF MS.
- Based on learnings in the lab, please explain the difference between native and denatured protein conformations. For example, what happens when a protein unfolds? How is that determined with a mass spectrometer? What changes do you see in the mass spectrum between the native and denatured protein analyses (Figure 2)?
Native proteins are in their folded and biologically active structures, stabilized by a big a amount of chemical bonds and intreactions while h-bonds and hydrophobic and ionic interactions. In this state the protein is compact and has a relatively fixed 3d shape.
Denatured proteins have lost thier more complex structures due to the exposure of harsh conditions like low pH, heat or organic solvents. When the protein is unfolded its structure becomes extended and flexible and it’s basic sites and hydrophobic core becomes exposed and more accesible.
We cant directly look and measure the shape of the protein through mass spectrometry but the sturcutral differences can be seen indirectly as different charge state distribution and m/z envelopes.
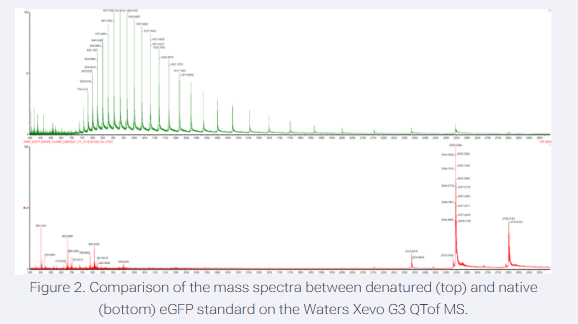
Some changes we can see in the mass spectrum between the native and denatured protein analysis is that native has a fewer number of peaks at higher m/z and a narrow destribution with lower charge states. For the denatured proteins there is a lot of peaks clustered at lower m/z, a wide envelope, and high charge states.
- Zooming into the native mass spectrum of eGFP from the Waters Xevo G3 QTof MS (see Figure 3), can you discern the charge state of the peak at ~2800 m/z? What is the charge state? How can you tell?
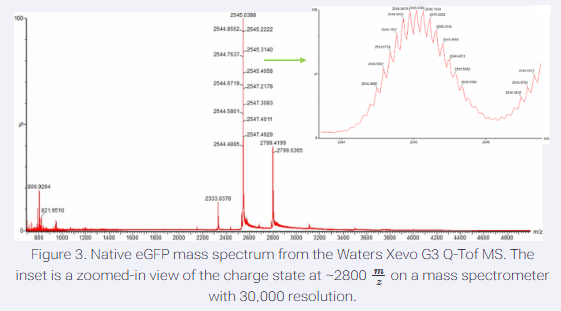
Yes, by using the relation between z, MW, and m/z. The zoomed-in native peak at ~2800 m/z corresponds to a +10 charge state, determined using the relationship z = M/(m/z) with the known protein mass (~27.8 kDa).
Homework: Waters Part III — Peptide Mapping - primary structure
We will digest the eGFP protein standard into peptides using trypsin (an enzyme that selectively cleaves the peptide bond after Lysine (K) and Arginine (R) residues. The resulting peptides will be analyzed on the Waters BioAccord LC-MS to measure their molecular weights and fragmented to confirm the amino acid sequence within each peptide – generating a “peptide map”. This process is used to confirm the primary structure of the protein.
There are a variety of tools available online to calculate protein molecular weight and predict a list of peptides generated from a tryptic digest. We will be using tools within the online resource Expasy (the bioinformatics resource portal of the Swiss Institute of Bioinformatics (SIB)) to predict a list of tryptic peptides from eGFP.
- How many Lysines (K) and Arginines (R) are in eGFP? Please circle or highlight them in the eGFP sequence given in Waters Part I question 1 above. (Note: adding the sequence to Benchling as an amino acid file and clicking biochemical properties tab will show you a count for each amino acid).
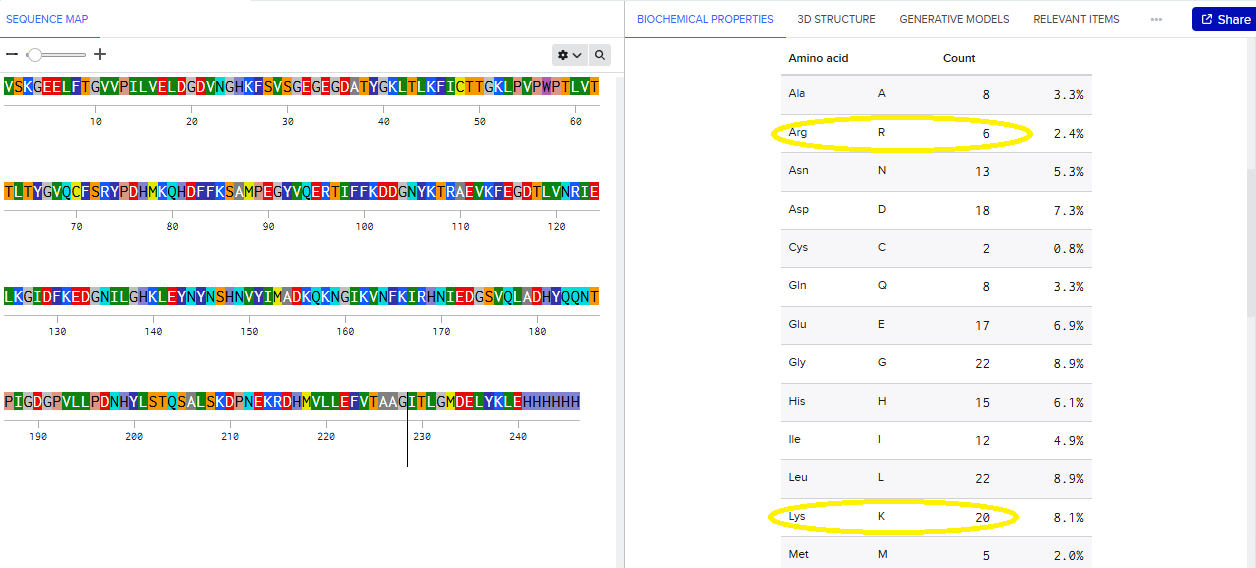
VSKGEELFTG VVPILVELDG DVNGHKFSVS GEGEGDATYG KLTLKFICTT GKLPVPWPTL VTTLTYGVQC FSRYPDHMKQ HDFFKSAMPE GYVQERTIFF KDDGNYKTRA EVKFEGDTLV NRIELKGIDF KEDGNILGHK LEYNYNSHNV YIMADKQKNG IKVNFKIRHN IEDGSVQLAD HYQQNTPIGD GPVLLPDNHY LSTQSALSKD PNEKRDHMVL LEFVTAAGIT LGMDELYKLE HHHHHH
Lysine (K): 20
Arginine (R): 6
- How many peptides will be generated from tryptic digestion of eGFP?
Navigate to https://web.expasy.org/peptide_mass/
Copy/paste the sequence above into the input box in the PeptideMass tool to generate expected list of peptides.
Use Figure 4 below as a guide for the relevant parameters to predict peptides from eGFP.
Click “Perform the Cleavage” button in the PeptideMass tool and report the number of peptides generated when using trypsin to perform the digest.
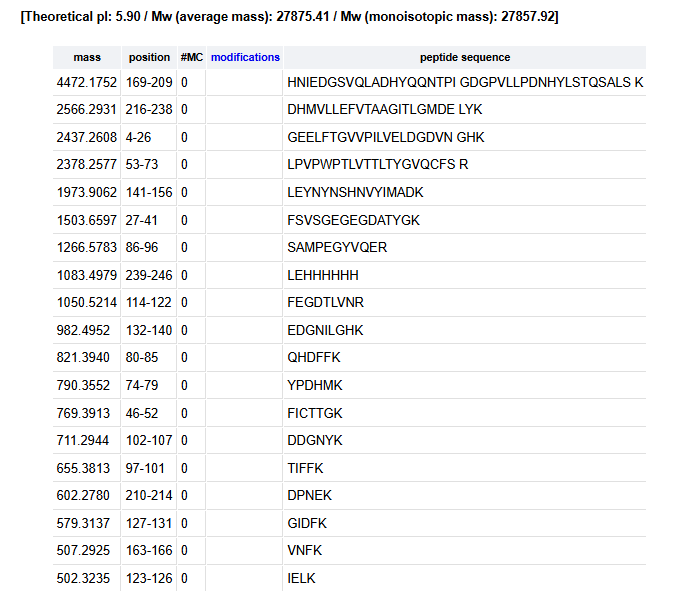
Masses Displayed:
- 4472.1752
- 2566.2931
- 2437.2608
- 2378.2577
- 1973.9062
- 1503.6597
- 1266.5783
- 1083.4979
- 1050.5214
- 982.4952
- 821.3940
- 790.3552
- 769.3913
- 711.2944
- 655.3813
- 602.2780
- 579.3137
- 507.2925
- 502.3235
- Based on the LC-MS data for the Peptide Map data generated in lab (please use Figure 5a as a reference) how many chromatographic peaks do you see in the eGFP peptide map between 0.5 and 6 minutes? You may count all peaks that are >10% relative abundance.
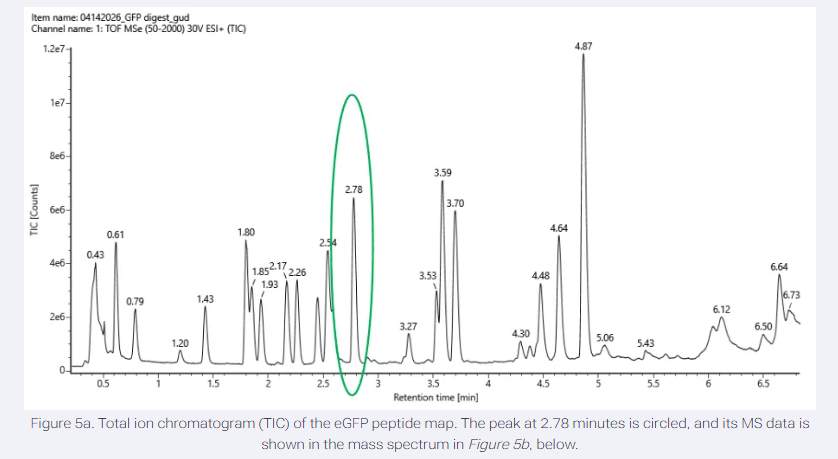
There are around 18-22 chromatographic peaks (≥10% relative abundance) are observed between 0.5 and 6 minutes.
- Assuming all the peaks are peptides, does the number of peaks match the number of peptides predicted from question 2 above? Are there more peaks in the chromatogram or fewer?
The observed chromatographic peaks closely correspond to the 19 predicted peptide masses from the digest. However, the match is not exact, as slightly more peaks are observed experimentally. This may be due to multiple charge states, incomplete digestion, or minor impurities.
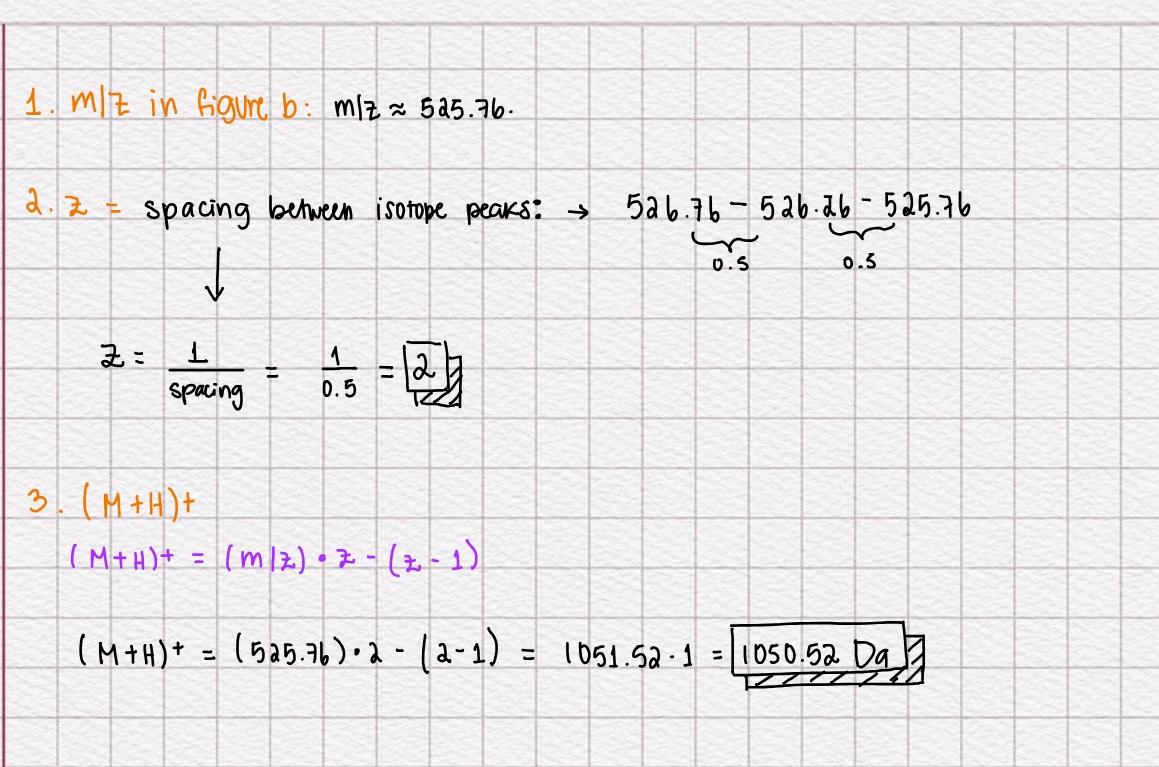
- Identify the mass-to-charge (m/z) of the peptide shown in Figure 5b. What is the charge (z) of the most abundant charge state of the peptide (use the separation of the isotopes to determine the charge state). Calculate the mass of the singly charged form of the peptide ([M+H]+) based on its m/z and z.
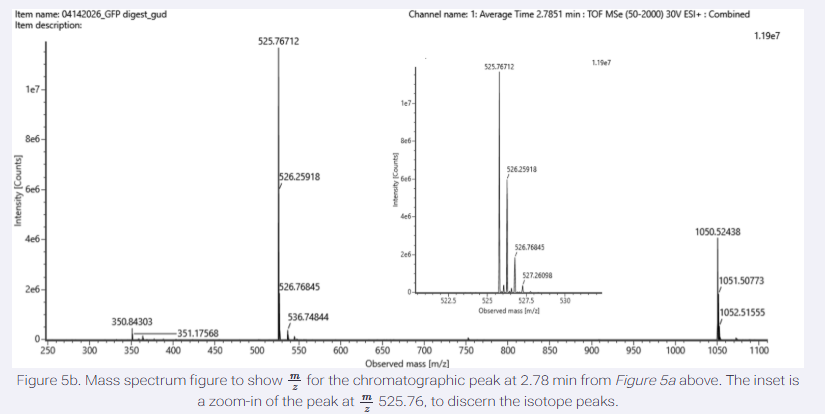
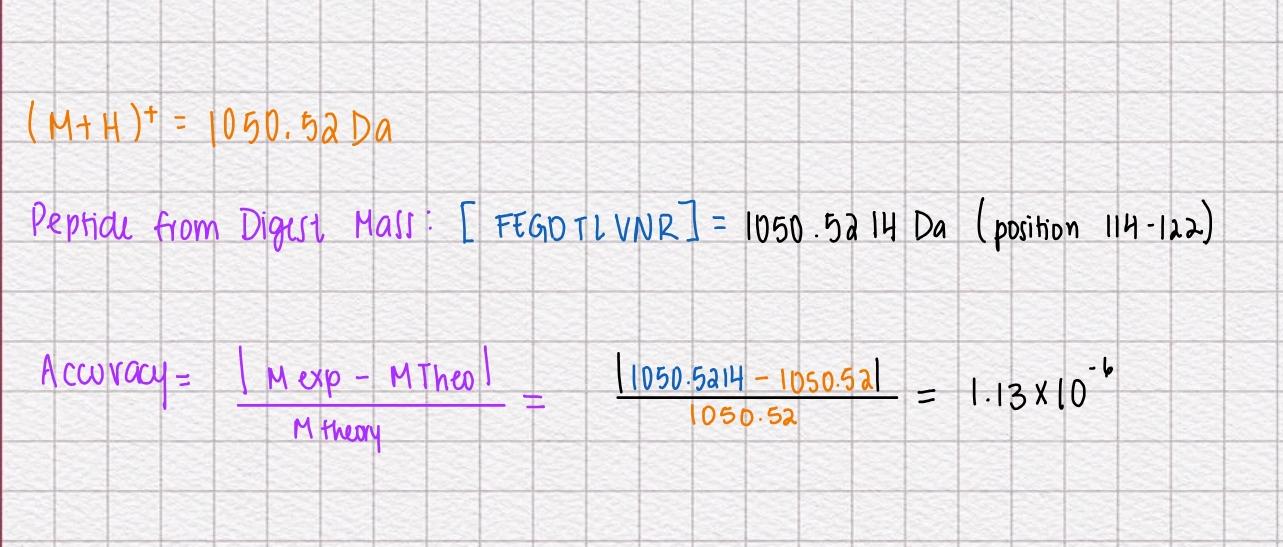
- Identify the peptide based on comparison to expected masses in the PeptideMass tool. What is mass accuracy of measurement? Please calculate the error in ppm. (Recall that accuracy formulae)
When calculated to ppm we get 1.33ppm which is a high accuracy.
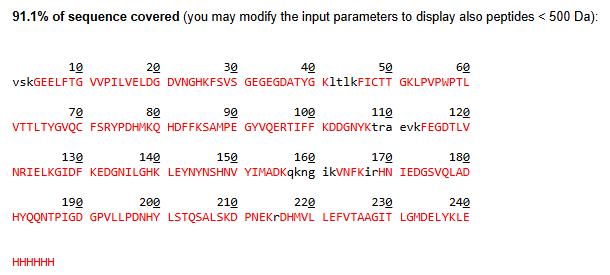
- What is the percentage of the sequence that is confirmed by peptide mapping? (see Figure 6)
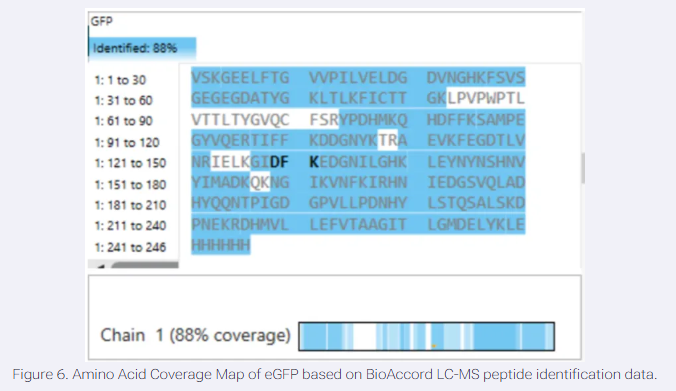
88% of the amino acids in that protein were detected. The white gaps in the sequence represent the 12% that the machine couldn’t confidently identify.
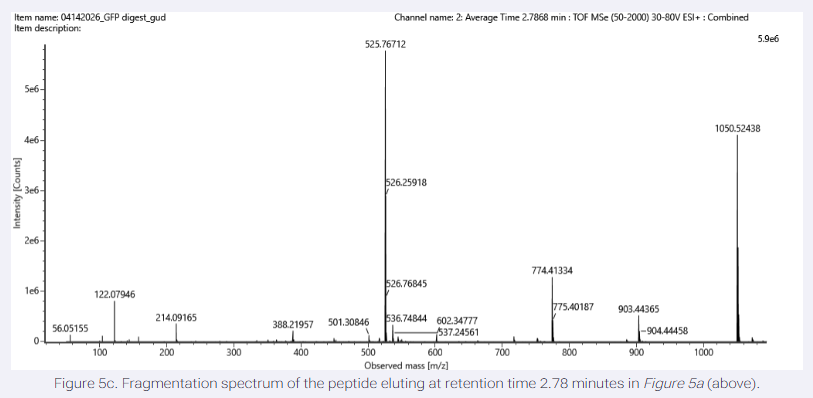
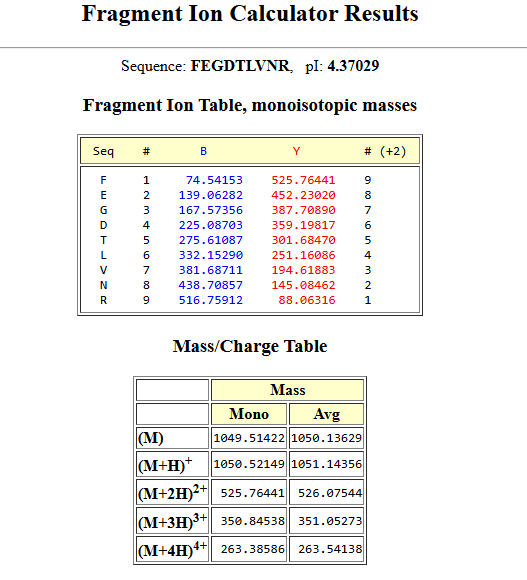
- Can you determine the peptide sequence for the peptide fragmentation spectrum shown in Figure 5c? (HINT: Use your results from Question 2 above to match the peptide molecular weight that is closest to that shown in Figure 5b. Copy and paste its sequence into this tool online to predict the fragmentation pattern based on its amino acid sequence: http://db.systemsbiology.net/proteomicsToolkit/FragIonServlet.html. What is the sequence of the eGFP peptide that best matches the fragmentation spectrum in Figure 5c?
peptide sequence (FEGDTLVNR) mathces the spectrum and mass calculated in previous questions.
- Does the peptide map data make sense, i.e. do the results indicate the protein is the eGFP standard? Why or why not? Consult with Figure 6, which depicts the % amino acid coverage of peptides positively identified using their calculated mass and fragmentation pattern.
Yes, the peptide map data makes perfect sense and confirms the protein is the eGFP standard.
The results indicate a high degree of confidence for the following reasons:
High Sequence Coverage: Figure 6 shows 88% amino acid coverage. This means the vast majority of the expected eGFP sequence was positively identified by the LC-MS, which is well above the industry standard for protein identification.
Mass Accuracy: The observed mass of the peptide fragment (e.g., FEGDTLVNR at 1050.5214 Da) matches the theoretical mass (1050.52 Da) with an extremely high accuracy of approximately 1.33 ppm.
Fragment Confirmation: The fragmentation spectrum in Figure 5c contains peaks that align perfectly with the theoretical fragment ion table. This “fingerprint” confirms that the internal sequence of the amino acids matches the known primary structure of eGFP.
Homework: Waters Part IV — Oligomers
We will determine Keyhole Limpet Hemocyanin (KLH)’s oligomeric states using charge detection mass spectrometry (CDMS). CDMS single-particle measurements of KLH allow us to make direct mass measurements to determine what oligomeric states (that is, how many protein subunits combine) are present in solution. Using the known masses of the polypeptide subunits (Table 1) for KLH, identify where the following oligomeric species are on the spectrum shown below from the CDMS (Figure 7):
- 7FU Decamer
- 8FU Didecamer
- 8FU 3-Decamer
- 8FU 4-Decamer
| Polypeptide Subunit Name | Subunit Mass |
|---|---|
| 7FU | 340 kDa |
| 8FU | 400 kDa |
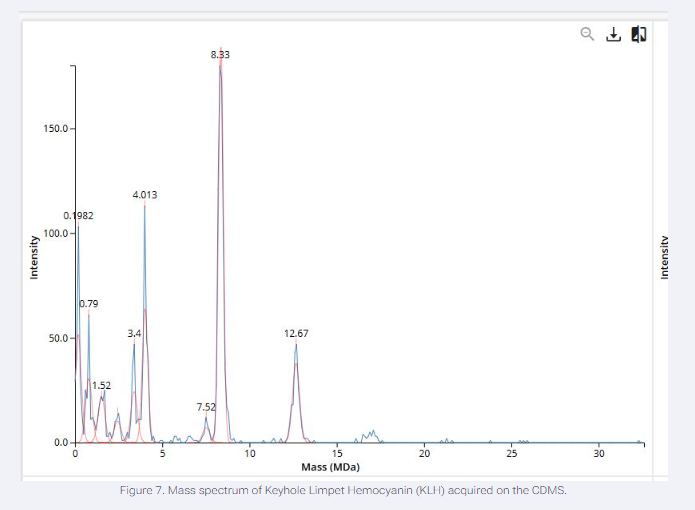
- 7FU DECAMER: 10x340kDa = 3.4 MDa = 3.4 Observed peak
- 8FU DECAMER: 10x400kDa = 8 MDa = 8.33 Observed peak
- 8FU 3-DECAMER: 10x400kDa = 12 MDa = 12.67 Observed peak
- 8FU 4-DECAMER: 10x400kDa = 16 MDa = 16.5 small cluster
Homework: Waters Part V — Did I make GFP?
Please fill out this table with the data you acquired from the lab work done at the Waters Immerse Lab in Cambridge, or else the data screenshots in this document if you were unable to have lab work done at Waters.
| Theoretical | Observed/measured on the Intact LC-MS | PPM Mass Error | |
|---|---|---|---|
| Molecular weight (kDa) | 28.013 | 27875.41 | 4.940 |