Week 10 HW: Advanced Imaging & Measurement Technology
Waters Corporation Mass Spectrometer
Homework: Final Project
For your final project:
- Please identify at least one (ideally many) aspect(s) of your project that you will measure.
- Lysis Rate
- Efficiency of Plating
- Please describe all of the elements you would like to measure, and furthermore describe how you will perform these measurements.
- Lysis Rate: This measures the rate at which the mutated m. smegma mycobacteriophage lyses or destroys bacteria. This would be measured in a wet lab setting by comparing percentages of bacteria across a control and another plate that has been exposed to a mutated form of m. smegma mycobacteriophage
- Efficiency of Plating: This measures the rate at which the mutated m. smegma mycobacteriophage can begin initiating a host infection. Believe this would also be measured in a wet lab setting by comparing percentages of bacteria across a control and another plate that has been exposed to a mutated form of m. smegma mycobacteriophage
- What are the technologies you will use (e.g., gel electrophoresis, DNA sequencing, mass spectrometry, etc.)? Describe in detail.
- Lysis Rate: I’d likely use a microplate reader as part of a wet lab extension of the final project
- Efficiency of Plating: I’d use a plauqe assay as part of a wet lab extension of the final project
Supporting prompts for this section listed below:
| Supporting Prompt | Model |
|---|---|
| Does Efficiency of Plating (EOP) mean the same thing as rates of lysing? Believe so. Do NOT hallucinate/make things up when replying to this prompt | Gemini |
| Explain how mutations are measured in this paper. Do NOT hallucinate/make things up when replying to this prompt | Gemini |
| In experiments like the one referenced in this paper, how are metrics like Lysis Rate and Efficiency of Plating traditionally measured? What tools are used? Do NOT hallucinate/make things up when replying to this prompt | Gemini |
Homework: Waters Part I — Molecular Weight
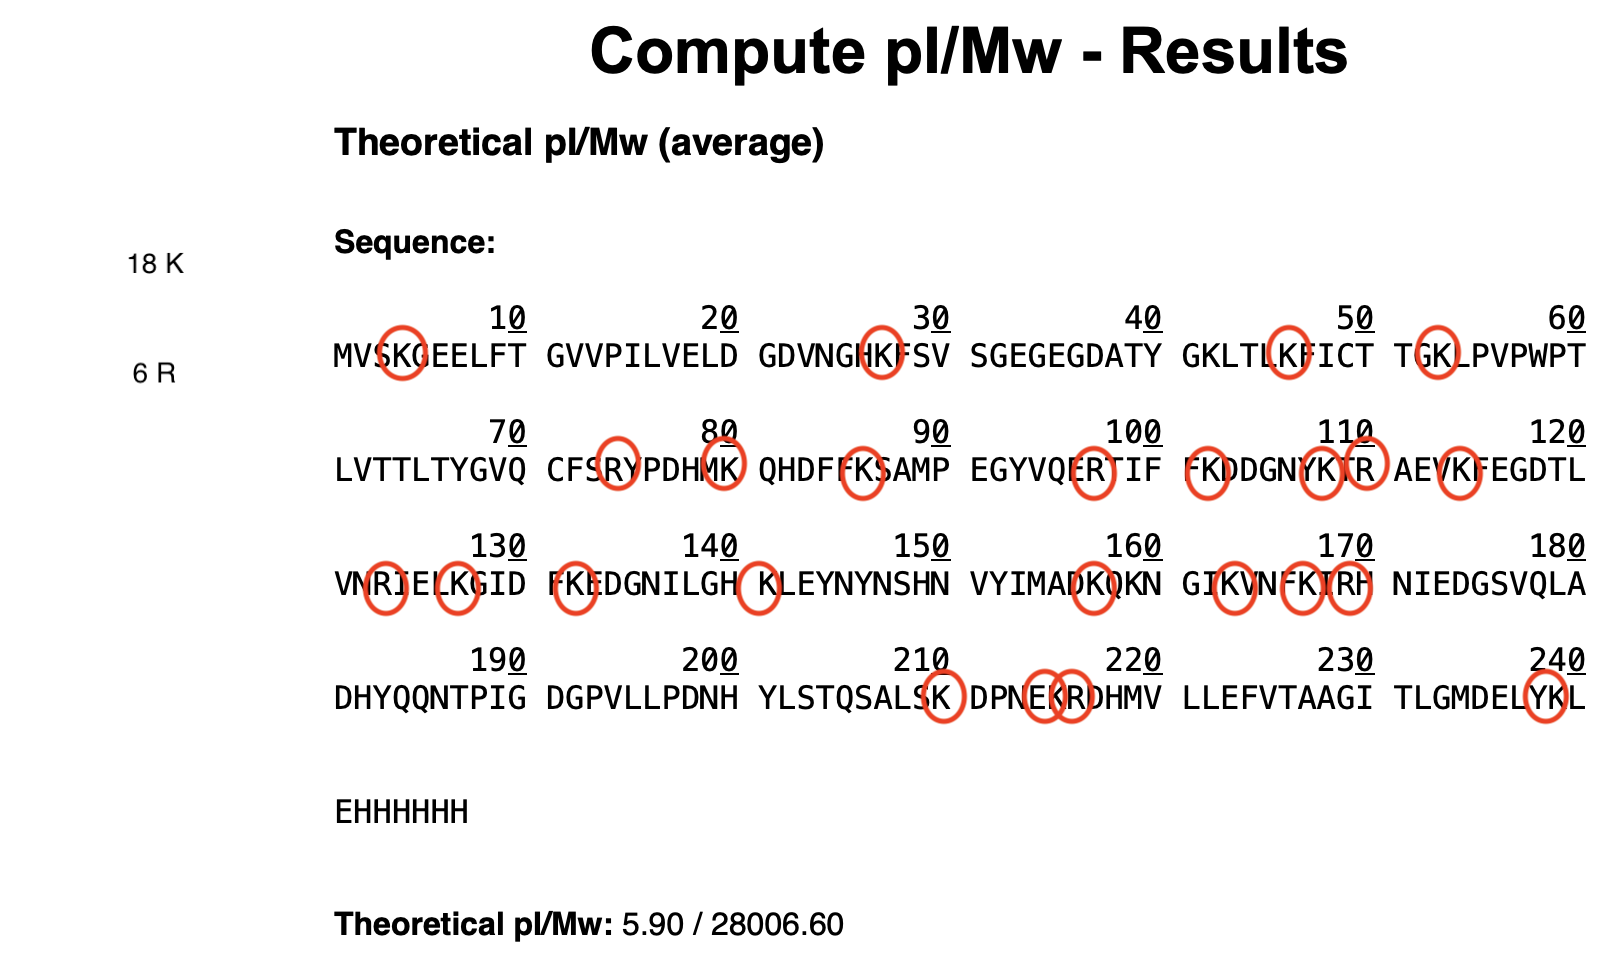
- Based on the predicted amino acid sequence of eGFP (see below) and any known modifications, what is the calculated molecular weight?
- The calculated molecular weight is 28006.60 Mw
Calculate the molecular weight of the eGFP using the adjacent charge state approach described in the recitation. Select two charge states from the intact LC-MS data and:
Determine z for each adjacent pair of peaks (n, n+1) using:
- Chose 933.7349 and 965.9684 from the Figure 1 chart. Based on the formula z = ~28.96
Determine the MW of the protein using the relationship between m/z, MW, and z
- MW = 27,983.85 Daltons
Calculate the accuracy of the measurement using the deconvoluted MW from 2.2 and the predicted weight of the protein from 2.1
- The result of the measurement I got was -0.0008 ppm
Can you observe the charge state for the zoomed-in peak in the mass spectrum for the intact eGFP? If yes, what is it? If no, why not?
- Believe the answer’s no because the zoomed-in peak from my understanding is not uniform. Instead it constitutes a variety of different charged states that cannot be discerned as a singular discrete value. Absolutely open to being wrong on this
Supporting prompts for this section listed below:
| Supporting Prompt | Model |
|---|---|
| In Section 1, question 2, what does the variable z stand for again? Do NOT hallucinate/make things up when addressing this prompt | Gemini |
| In the formula in the answer to the last prompt, what does the numerator represent? How does it correlate with the spikes in this image? Am aware that each spike represents an m over z ratio but am unsure where/how to begin. Do NOT hallucinate/make things up when replying to this prompt | Gemini |
| Not understanding how a spike with an 800 value on the left hand side can have a higher number of charges than a right hand spike with a value of 1000. Explain this to me, and if there was any hallucination(s) that have any implications for the results of the answer to the last prompt, say so. Do NOT hallucinate/make things up when replying to this prompt | Gemini |
| So to be clear in the hypothetical calculation in the answer to the last prompt, to get z you divided 848.97 (the numerator) by 875.44-848.97 (the denominator). Do NOT hallucinate/make things up when replying to this prompt | Gemini |
| Where is the predicted weight of the protein in 2.1 that is referenced in Section 1, question 3? Not exactly following. Do NOT hallucinate/make things up when replying to this prompt | Gemini |
| Think I’m doing something wrong. Got a theoretical MW of 28006.60 and an experimental MW of 26,409,038. I chose the 966.0037 and 966.0390 peaks. Apparently the results from the last equation should be in the 30-50 range and I got approx. 941 when I ran the equation. What did I do wrong/what am I missing? Do NOT hallucinate/make things up when replying to this prompt | Gemini |
Homework: Waters Part II — Secondary/Tertiary Structure
- Based on learnings in the lab, please explain the difference between native and denatured protein conformations. For example, what happens when a protein unfolds? How is that determined with a mass spectrometer? What changes do you see in the mass spectrum between the native and denatured protein analyses
- Believe native proteins are not manipulated in any way (i.e., their properties are not altered via heat or other impacts) while denatured proteins are proteins where these properties are destroyed via direct alteration, usually by applying something like heat or acidity. This is determined in a mass spectrometer via distribution of charges across respective proteins. In the denatured protein in Figure 2, there appears to be a somewhat more Gaussian charge distribution, where the native protein below has a more spread out charge distribution
- Zooming into the native mass spectrum of eGFP from the Waters Xevo G3 QTof MS (see Figure 3), can you discern the charge state of the peak at ~2800? What is the charge state? How can you tell?
- Observing a +10 charge state. This because the two peaks near ~2800 (2799.4199 and 2799.6365) have a 0.2166 difference between them, which equates to ~+10 when the 1/z is calculated
Supporting prompts for this section listed below:
| Supporting Prompt | Model |
|---|---|
| Looking over Section 2 question 2 and am pretty sure the answer is that there isn’t a single answer to the charge state of the peak at ~2800, based on the inset in the Figure 3 and its somewhat parabolic-looking curve. Feel free to tell me if/where or how my thinking is off and do NOT hallucinate/make things up when replying to this prompt | Gemini |
Homework: Waters Part III - Peptide Mapping - Primary Structure
- How many Lysines (K) and Arginines (R) are in eGFP? Please circle or highlight them in the eGFP sequence given in Waters Part I question 1 above.
- There are 18 Lysines (K) and 6 Arginines (R) in eGFP. (See screenshot below)
- How many peptides will be generated from tryptic digestion of eGFP? Believe 25 peptides will be generated
- Navigate to https://web.expasy.org/peptide_mass/
- Copy/paste the sequence above into the input box in the PeptideMass tool to generate expected list of peptides
- Use Figure 4 below as a guide for the relevant parameters to predict peptides from eGFP.
- Click “Perform the Cleavage” button in the PeptideMass tool and report the number of peptides generated when using trypsin to perform the digest.
- Confirmed 25 generated peptides (see screenshot below)
- Confirmed 25 generated peptides (see screenshot below)
Based on the LC-MS data for the Peptide Map data generated in lab (please use Figure 5a as a reference) how many chromatographic peaks do you see in the eGFP peptide map between 0.5 and 6 minutes? You may count all peaks that are >10% relative abundance.
- I count 25 peaks
Assuming all the peaks are peptides, does the number of peaks match the number of peptides predicted from question 2 above? Are there more peaks in the chromatogram or fewer?
- I see a chromatographic peak match
Identify the mass-to-charge (m/z) of the peptide shown in Figure 5b. What is the charge (z) of the most abundant charge state of the peptide (use the separation of the isotopes to determine the charge state). Calculate the mass of the singly charged form of the peptide based on its (m/z) and z.
- The charge (z) of the most abundant charge state of the peptide equals ~2.0323. The mass of the singly charged form of the peptide is 1,067.4760
Identify the peptide based on comparison to expected masses in the PeptideMass tool. What is mass accuracy of measurement? Please calculate the error in ppm.
- Think the peptide’s in position 115-123 (peptide sequence FEGDTLVNR). The mass accuracy of measurement’s ~0.0161 ppm
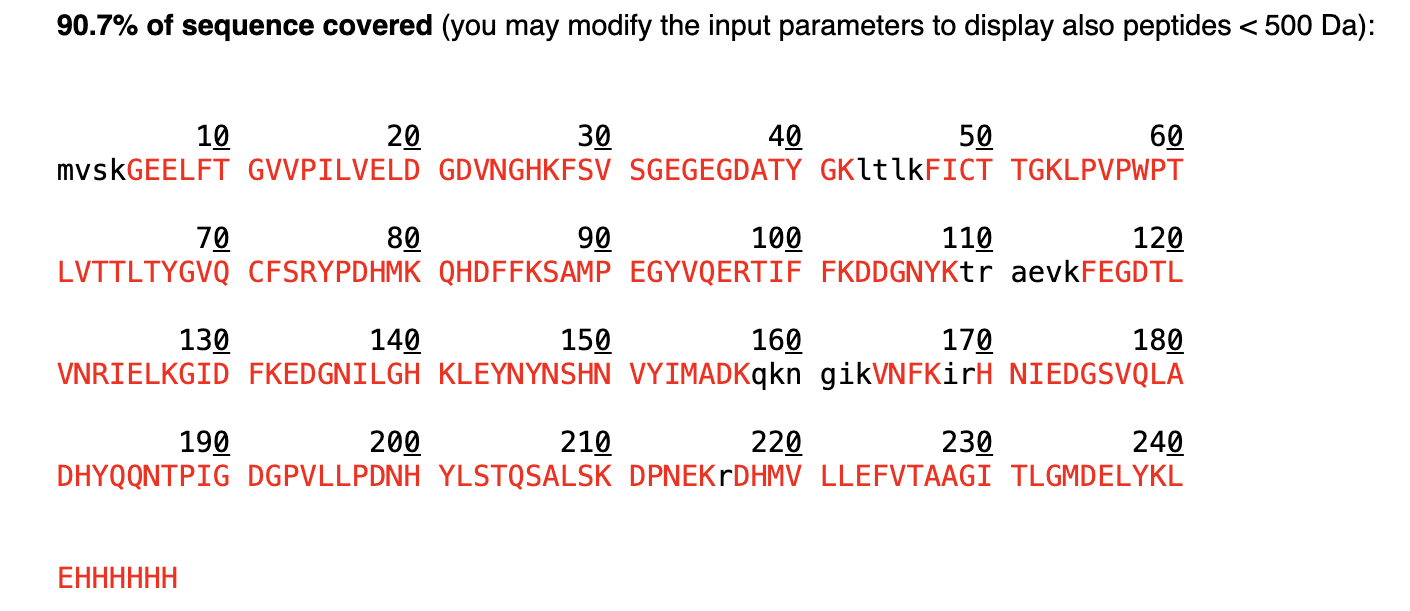
What is the percentage of the sequence that is confirmed by peptide mapping?
- According to the PeptideMass tool, 90.7% of the sequence is confirmed by peptide mapping
Supporting prompts for this section listed below:
| Supporting Prompt | Model |
|---|---|
| What is the relationship between a ’tryptic digestion of eGFP’ and the ’trypsin’ enzyme identified in the screenshot in Section III? Do NOT hallucinate/make things up when replying to this prompt | Gemini |
| So if they’re 18 Lysines (K) and 6 Arginines (R), then that would mean that there would be 24 cuts made and 24 peptides generated correct? Do NOT hallcuinate/make things up when replying to this prompt | Gemini |
| Not sure where to begin in terms of breaking down/starting to work on Question 5 in Section III. Any thoughts on where or how to begin? Do NOT hallucinate/make things up when replying to this prompt | Gemini |
| Believe you’re looking at the wrong question, specifically question 4 in Section III as opposed to question 5. Do not hallucinate and provide guidance on how to begin tackling question 5 in Section III | Gemini |
Homework: Waters Part IV - Oligomers
- 7FU Decamer
- Sits directly to the left of the 4.013 peak between 0 and 5 MDa axis in Figure 7
- 8FU Didecamer
- Very tall 8.33 MDa peak sitting between 5 and 10 MDa on the MDa axis in Figure 7
- 8FU 3-Decamer
- The 12.67 MDa peak sitting between 10 and 15 MDa on the MDa axis in Figure 7
- 8FU 4-Decamer
- The tiny peak sitting between 15 and 20 MDa on the MDa axis in Figure 7
| Supporting Prompt | Model |
|---|---|
| Looking over Section IV of this page, it appears as if the subunit masses are in kilo-Daltons and the Mass Spectrum readouts in Figure 7 are in Mega-Daltons, correct? Blanking on the relationship between kilo and Mega units of measurement. Do NOT hallucinate/make things up when replying to this prompt | Gemini |
Homework: Waters Part V - Did I Make GFP?
- See screenshots below:
| Theoretical | Observed/measured on the Intact LC-MS | PPM | |
|---|---|---|---|
| Molecular weight (kDa) | 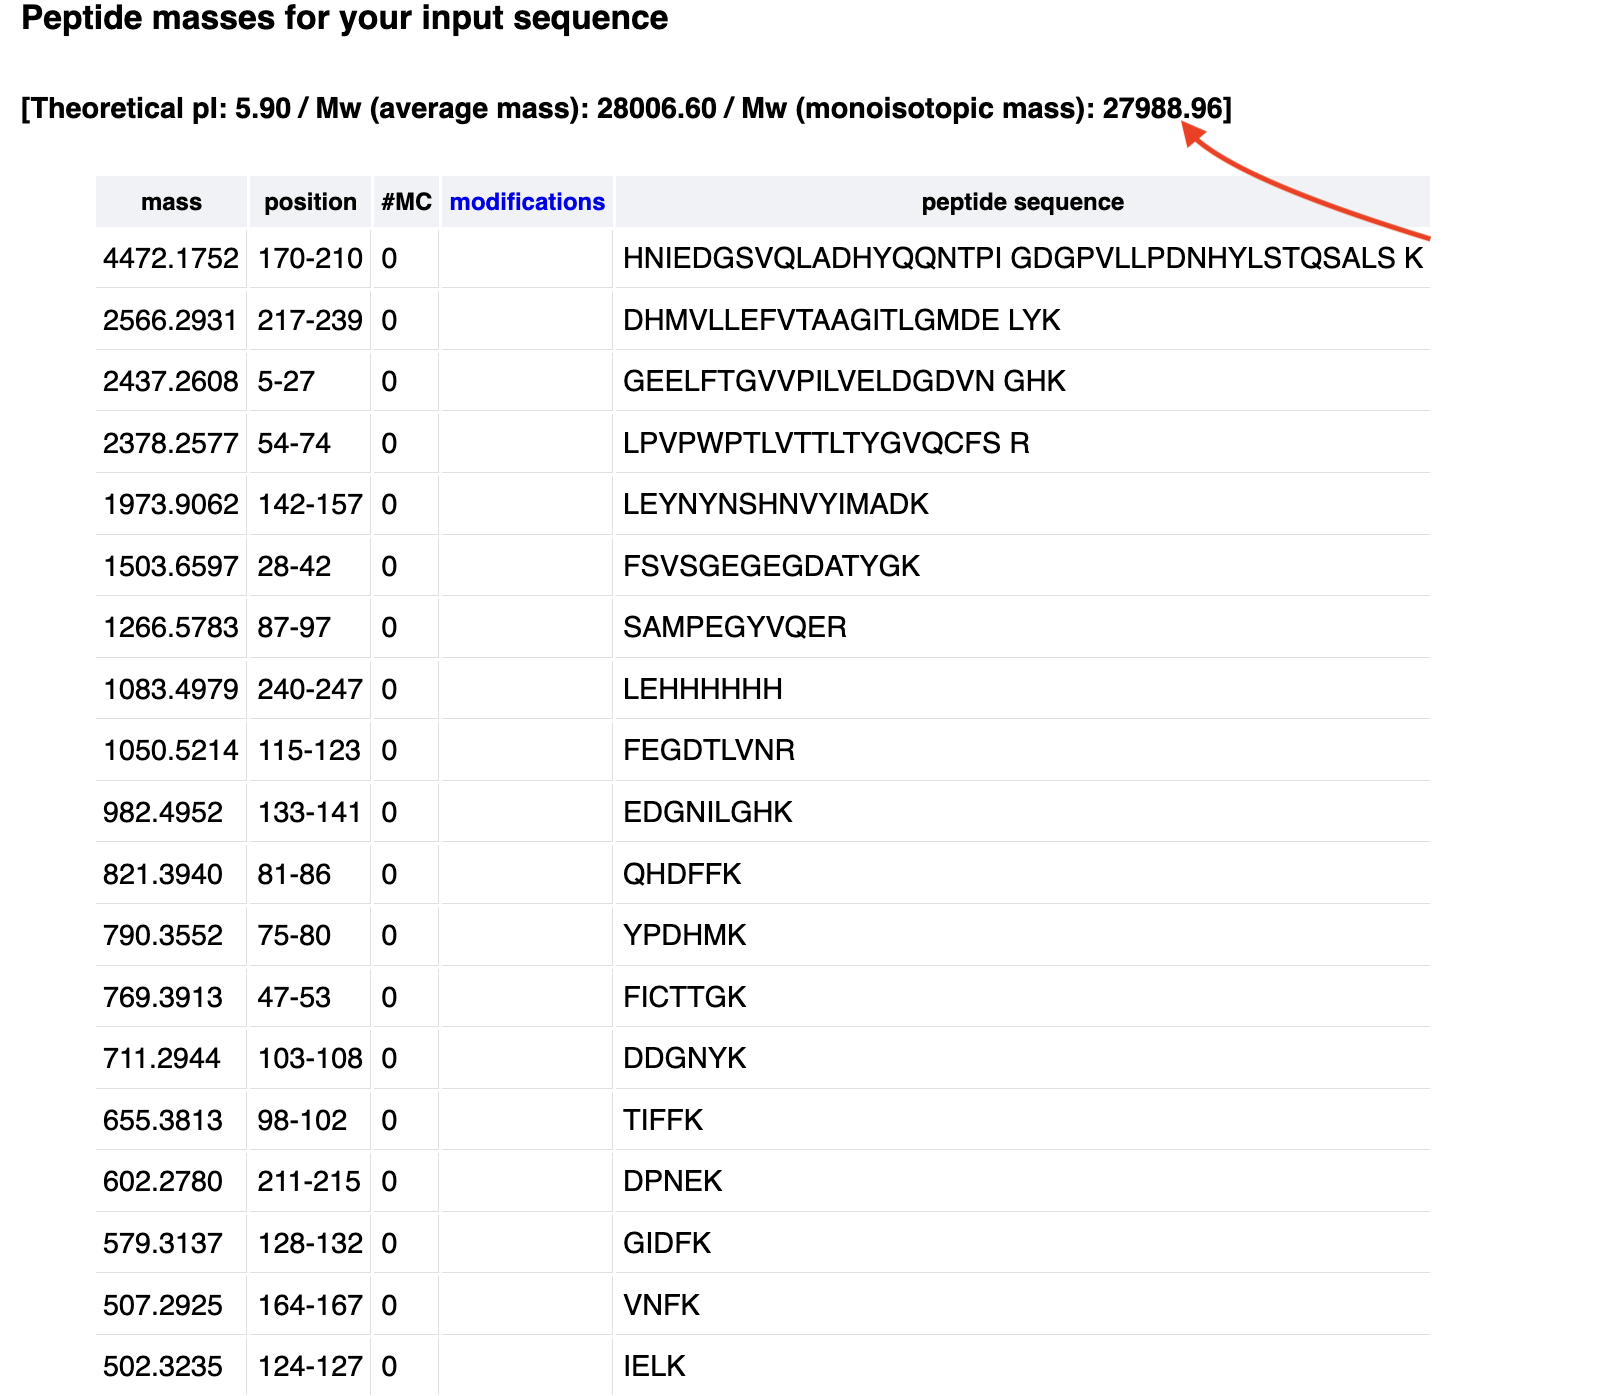
| 27,983.85 Daltons | -0.0008 ppm |