Group Final Project
Bacteriophage Engineering Group Project Inputs_William & Mary Node Group 1 2
Group Project_Protein Design 1
Selected Goal: Increased stability (easiest)
Brainstorm Session Questions:
- Which tools/approaches from recitation you propose using (e.g., “Use Protein Language Models to do in silico mutagenesis, then AlphaFold-Multimer to check complexes.”)
- We’ll attempt to run multi-environment/conditional modeling and simulation to down-select lysis stability approaches that show the greatest resilience across environments/conditions.
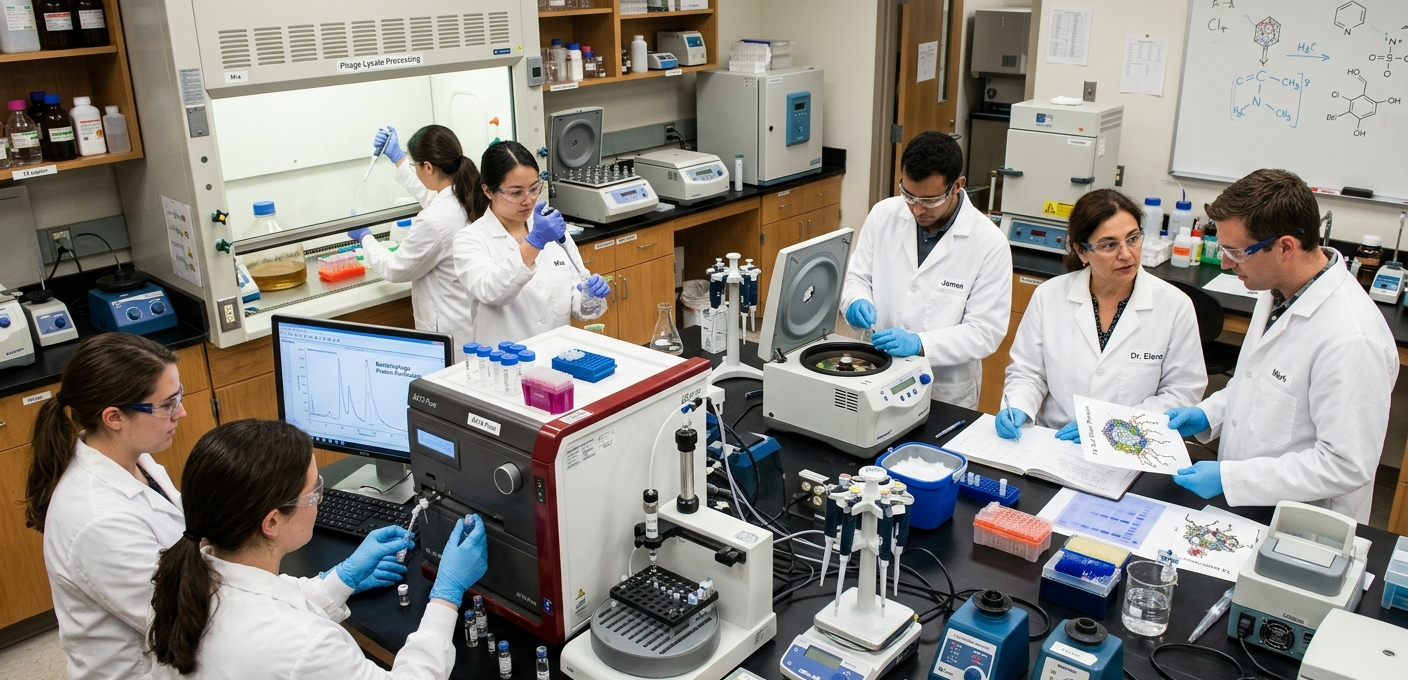
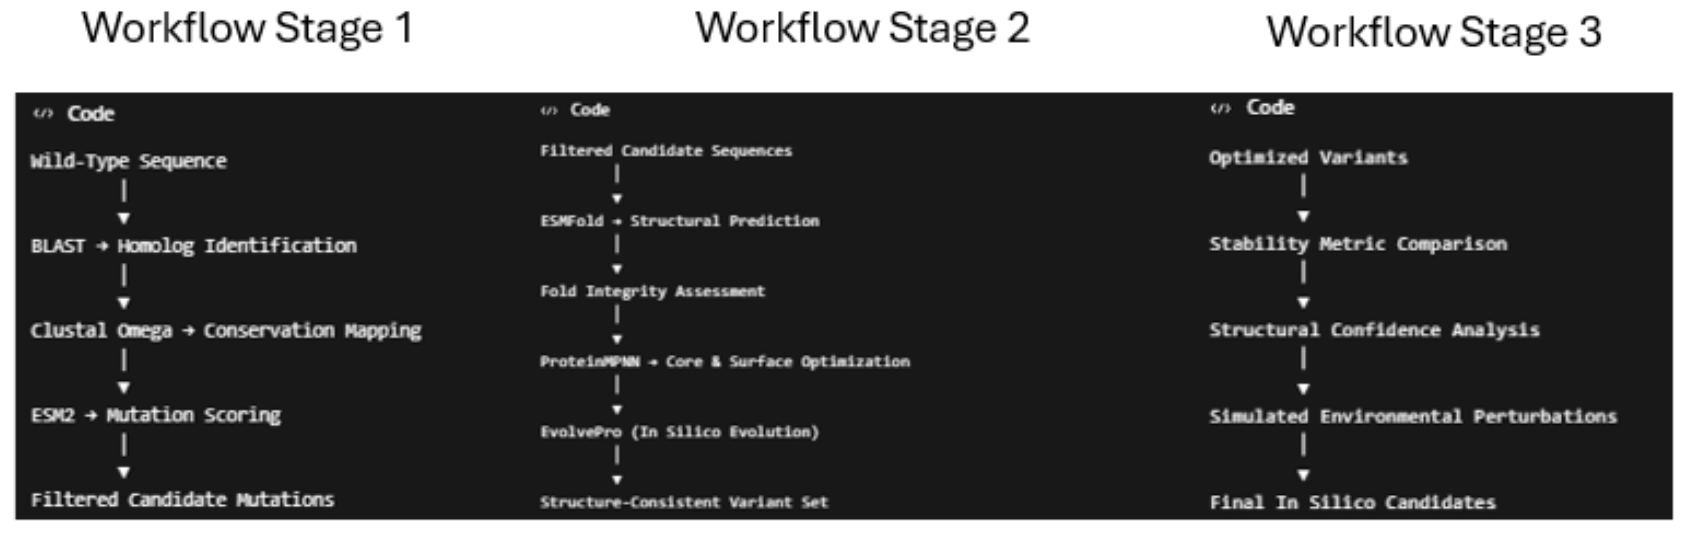
- The team has selected a project focused on enhancing the stability of the Lysis Protein, a decision influenced by the group’s current experience level. The primary objective is to improve thermodynamic stability while concurrently preserving the native protein fold and maintaining functional integrity. The proposed methodology involves utilizing BLAST for identifying homologous sequences, followed by Clustal Omega to ascertain conserved residues susceptible to mutation intolerance. Subsequently, ESM2 will be employed to score candidate substitutions based on evolutionary plausibility. This will be succeeded by the application of ESM-Fold to predict and refine the integrity of the protein fold, as well as to optimize existing backbones. The results may then be further subjected to EvolvePro for accelerated directed evolution. Tools like Boltz-1 and ProteinMPNN offer a capability for redesigning solvent-exposed residues and optimizing the core packing of the protein. We can cross their performance for comparison. All selected variant candidates are slated for computational stress-testing under a range of environmental conditions that could potentially induce destabilization. Selected variant candidates that pass the stress test are prioritized for downstream experimental validation.
- Why do you think those tools might help solve your chosen sub-problem?
- The previous bullet point addresses tool functionality in our workflow, explaining why and how various tools will assist us in accomplishing our goal
- Name one or two potential pitfalls (e.g., “We lack enough training data on phage–bacteria interactions.”).
- One potential pitfall is that we may have insufficient in vitro quality and quantity of data to test the environmental constraints of interest. Thus wet-lab work would be needed to back-up the findings, in addition to follow-up
- There are open questions regarding the validity of the stated research approach (i.e., if the approach makes sense relative to the larger goal of increased stability)
- Include a schematic of your pipeline
- See workflow schematic below
- See workflow schematic below
- Which tools/approaches from recitation you propose using (e.g., “Use Protein Language Models to do in silico mutagenesis, then AlphaFold-Multimer to check complexes.”)
Group Project_Protein Design 2 3
See results below
Notebook Inputs:
- Inputted L-Protein Mutants.csv file for analysis
- Noted Encounter Issues and Resolutions:
- Part 12 involved a step wherein the cell would be run and there would exist a prompt by which an upload of the “L-Protein Mutants - Sheet1.csv” was required. The current “L-Protein Mutants” file offered in the laboratory was listed as an excel file. We proceeded by saving the data into a .csv file that reflects the desired file name and uploading.
- Noted Encounter Issues and Resolutions:
Utilized experimental data [4]
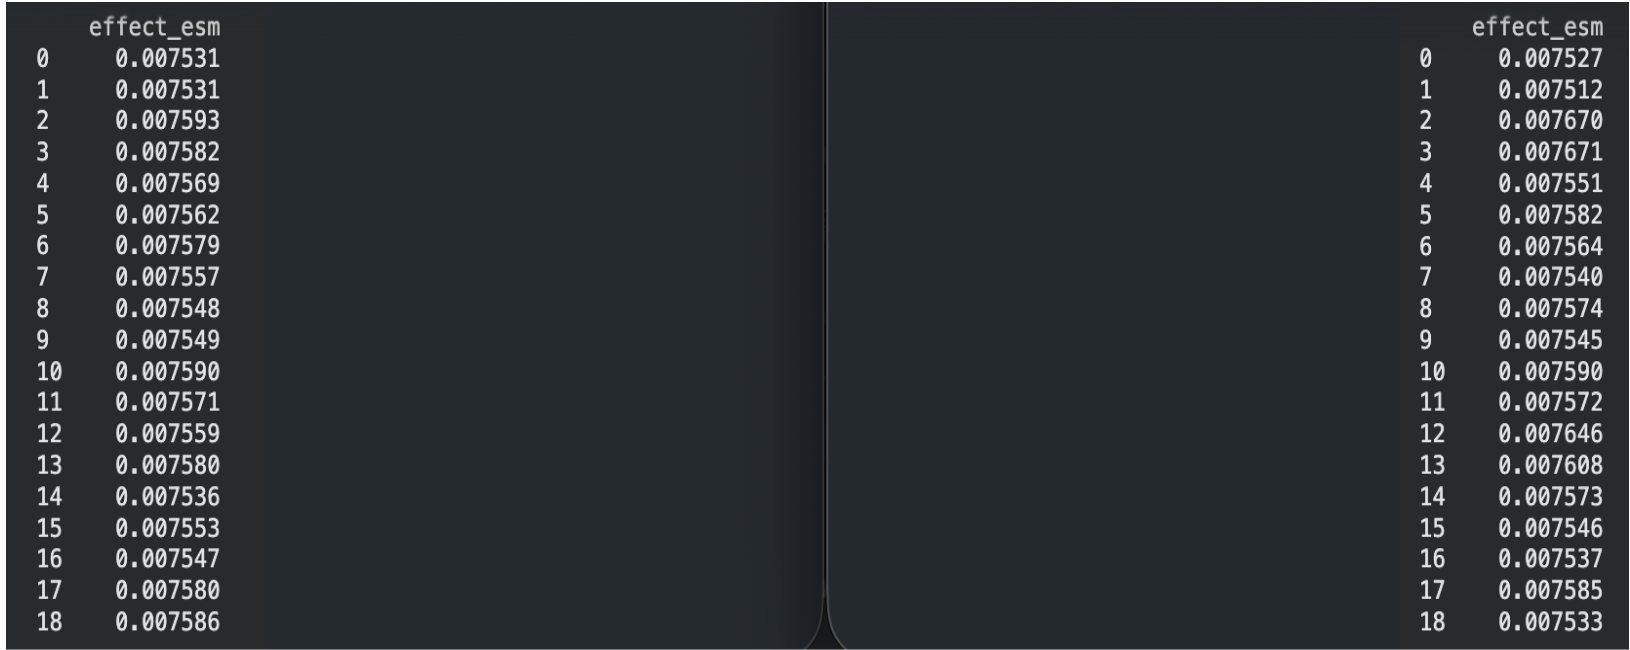
Experimental Correlation Results
- The results below indicate poor correlation between the experimental data and the scores from the notebook. The values indicate high levels of uncertainty between the experimental data and the notebook scores. These results indicate that:
- 5 Mutations
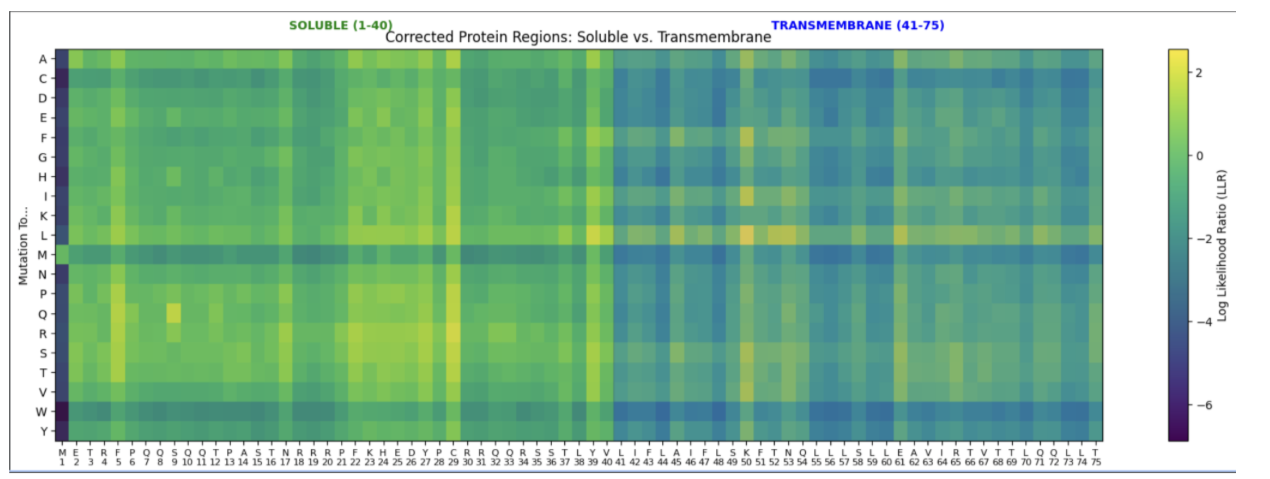
- A Heatmap of predicted mutations was given. The following mutations are chosen in coordinate form. While yellow indicates a high ratio, it shouldn’t be taken fully at face value.
- Xavier Results
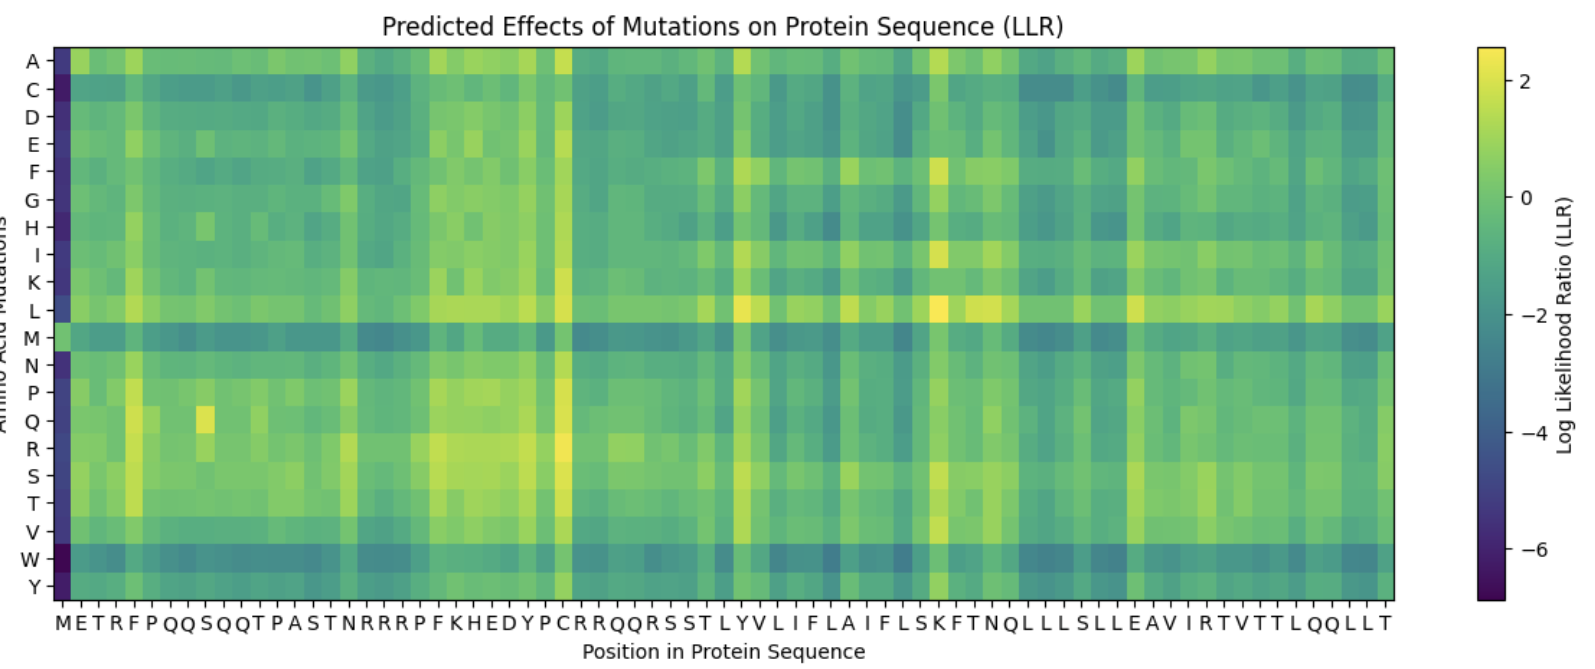
- Chose the using the Predicted Effects Graph (allows for a first pass)
- Soluble-Region: Y39 (L), F5 (S)
- Transmembrane Region: N53, E61, T52 (All L)
- Raphael Results
- The following are mutations propositions based on the Predicted Effects Graph:
- Soluble Region:
- F5Q: Clusal Omega shows that the 5 position is optimal for change as it is frequently switched. ESM-2 deems this mutation at this position to have the most promising score (1.795244).
- F5P: Clustal Omega shows 5 position as frequently changing. ESM-2 deems this mutation as third best for position 5 (1.596891).
- Transmembrane Region:
- E61L: Clustal Omega shows high variance at position 61. ESM-2 demonstrates a high score of 1.818098.
- F47L: Clustal Omega shows high variance at this position, showing the protein is most likely to retain functionality after a mutation here. ESM-2 demonstrates a decent positive score.
- Free:
- F5S, K50L, E61L: F5S mutation is supported by the Clustal Omega results as it is shown across multiple species. The K50L and E61L mutations are not supported as much by Clustal Omega but show high results in ESM-2.
- Soluble Region:
- The following are mutations propositions based on the Predicted Effects Graph:
- Jason Results
- Soluble Region:
- F5_R: Potentially reduces protein aggregation risk, increases solubility via Arginine inclusion
- S9_Q: Potential glutamine inclusion could lead to more stable hydrogen bonds
- C29_R: Current cysteine prone to potential misfolding. Arginine could improve solubility, potentially preventing clumping or misshapen configurations
- Transmembrane Region:
- L44_I: Increased isoleucine density might increase thermodynamic stability
- A62_V: Valine hydrophobicity might help protein orientation and improve lipid piercing
- Nana Results
- Soluble Region:
- Position 5 : F -> Q ( 1.79524445533752)
- Position 17: N -> R (1.32365107536315)
- Transmembrane Region:
- Position : 40 V -> L ( 1.79524445533752)
- Position 50 K -> L (2.56146419048309)
- Position 65 R -> L (1.0260357856750488)
- Mutants:
- Mutant 1: METRQPQQSQQTPASTNRRRPFKHEDYPCRRQQRSSTLYVLIFLAIFLSKFTNQLLLSLLEAVIRTVTTLQQLLT
- Mutant 2: METRFPQQSQQTPASTRRRRPFKHEDYPCRRQQRSSTLYVLIFLAIFLSKFTNQLLLSLLEAVIRTVTTLQQLLT
- Mutant 3: METRFPQQSQQTPASTNRRRPFKHEDYPCRRQQRSSTLYLLIFLAIFLSKFTNQLLLSLLEAVIRTVTTLQQLLT
- Mutant 4: METRFPQQSQQTPASTNRRRPFKHEDYPCRRQQRSSTLYVLIFLAIFLSLFTNQLLLSLLEAVIRTVTTLQQLLT
- Mutant 5: METRFPQQSQQTPASTNRRRPFKHEDYPCRRQQRSSTLYVLIFLAIFLSKFTNQLLLSLLEAVILTVTTLQQLLT
- Soluble Region:
- Xavier Results
- Generated Multimeric Assemblies
- Xavier Results
- Oligomer: METRSPQQSQQTPASTNRRRPFKHEDYPCRRQQRSSTLYVLIFLAIFLSKFTNQLLLSLLEAVIRTVTTLQQLLT:METRFPQQSQQTPASTNRRRPFKHEDYPCRRQQRSSTLLVLIFLAIFLSKFTNQLLLSLLEAVIRTVTTLQQLLT:METRFPQQSQQTPASTNRRRPFKHEDYPCRRQQRSSTLYVLIFLAIFLSKFLLQLLLSLLEAVIRTVTTLQQLLT:METRFPQQSQQTPASTNRRRPFKHEDYPCRRQQRSSTLYVLIFLAIFLSKFTLQLLLSLLEAVIRTVTTLQQLLT:METRFPQQSQQTPASTNRRRPFKHEDYPCRRQQRSSTLYVLIFLAIFLSKFTNQLLLSLLLAVIRTVTTLQQLLT
- Chain Separated Based on:
Chain A: F5S: position 5, F → S
Chain B: Y39L: position 39, Y → L
Chain C: T52L: position 52, T → L
Chain D: N53L: position 53, N → L
Chain E: E61L: position 61, E → L
METRSPQQSQQTPASTNRRRPFKHEDYPCRRQQRSSTLYVLIFLAIFLSKFTNQLLLSLLEAVIRTVTTLQQLLT
METRFPQQSQQTPASTNRRRPFKHEDYPCRRQQRSSTLLVLIFLAIFLSKFTNQLLLSLLEAVIRTVTTLQQLLT
METRFPQQSQQTPASTNRRRPFKHEDYPCRRQQRSSTLYVLIFLAIFLSKFLLQLLLSLLEAVIRTVTTLQQLLT
METRFPQQSQQTPASTNRRRPFKHEDYPCRRQQRSSTLYVLIFLAIFLSKFTLQLLLSLLEAVIRTVTTLQQLLT
METRFPQQSQQTPASTNRRRPFKHEDYPCRRQQRSSTLYVLIFLAIFLSKFTNQLLLSLLLAVIRTVTTLQQLLT
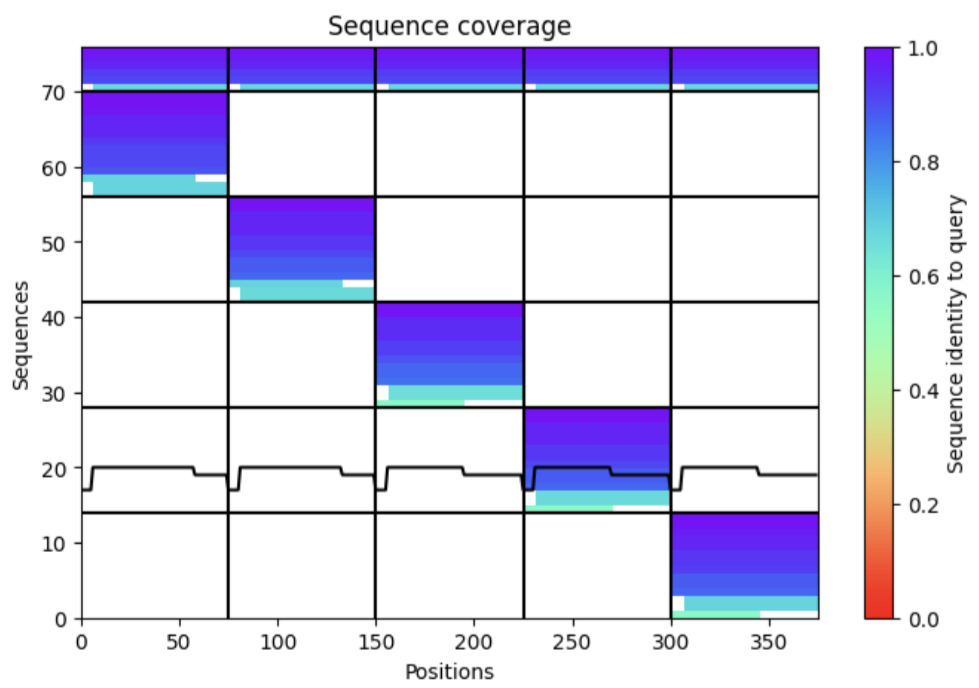
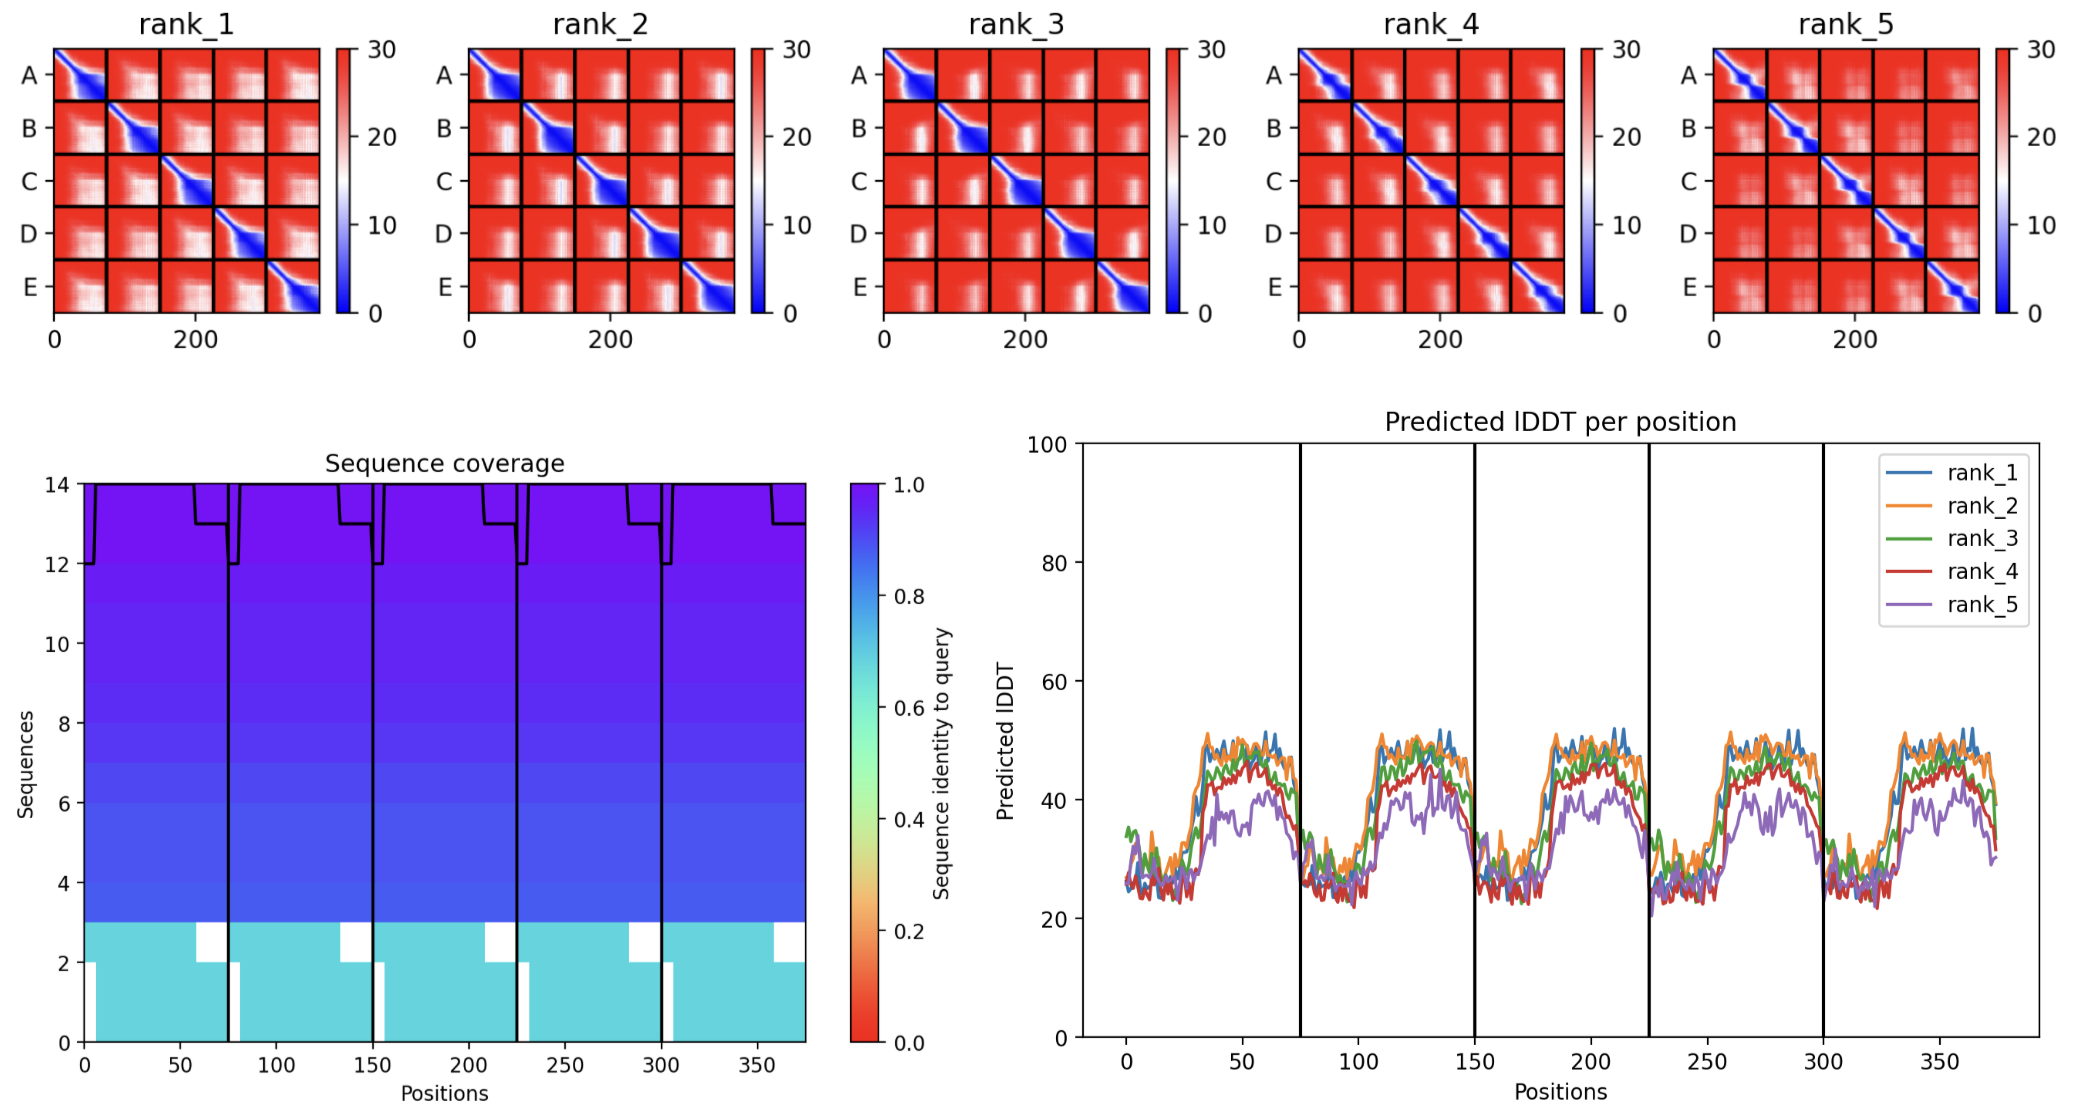
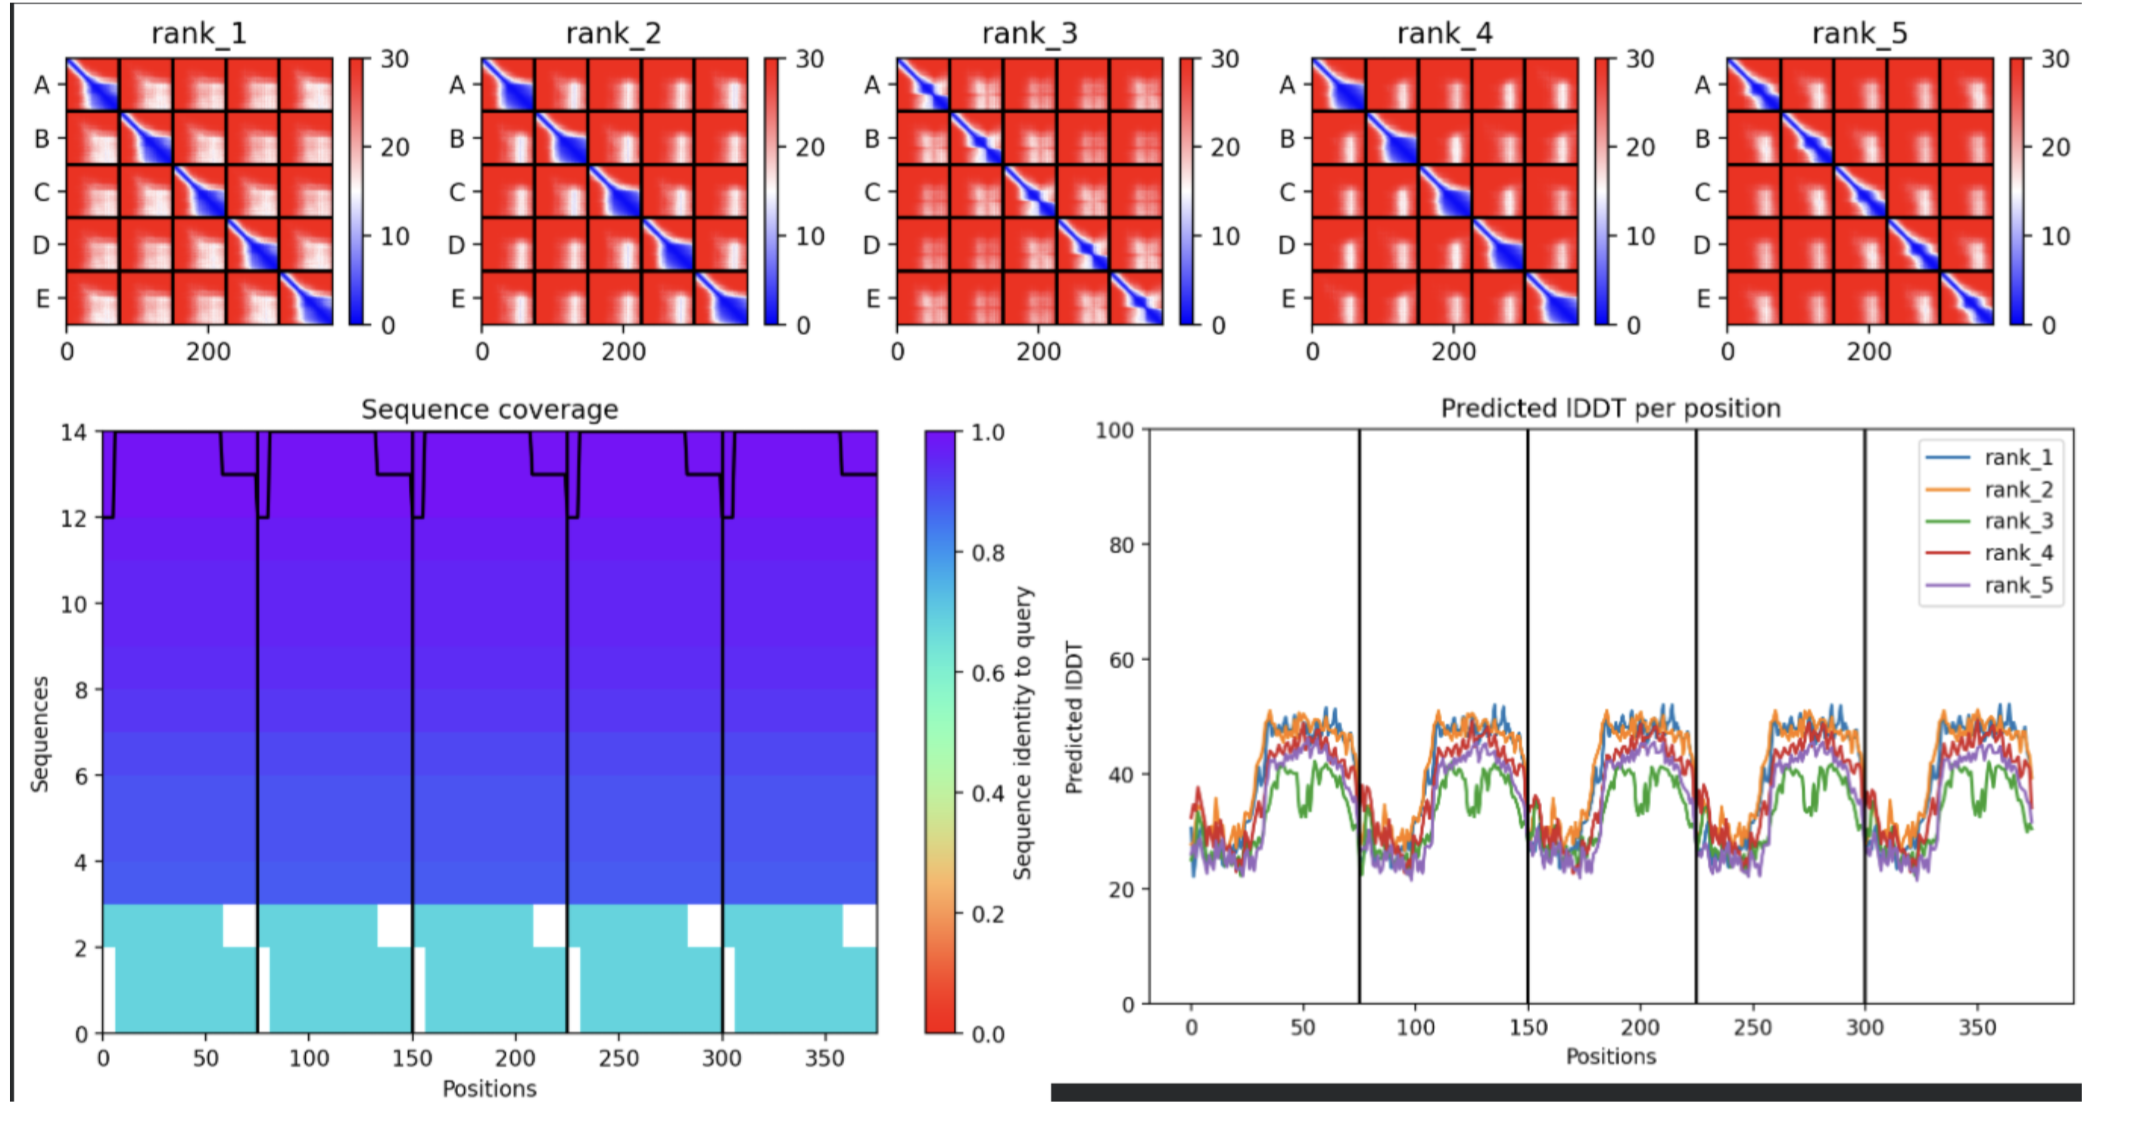
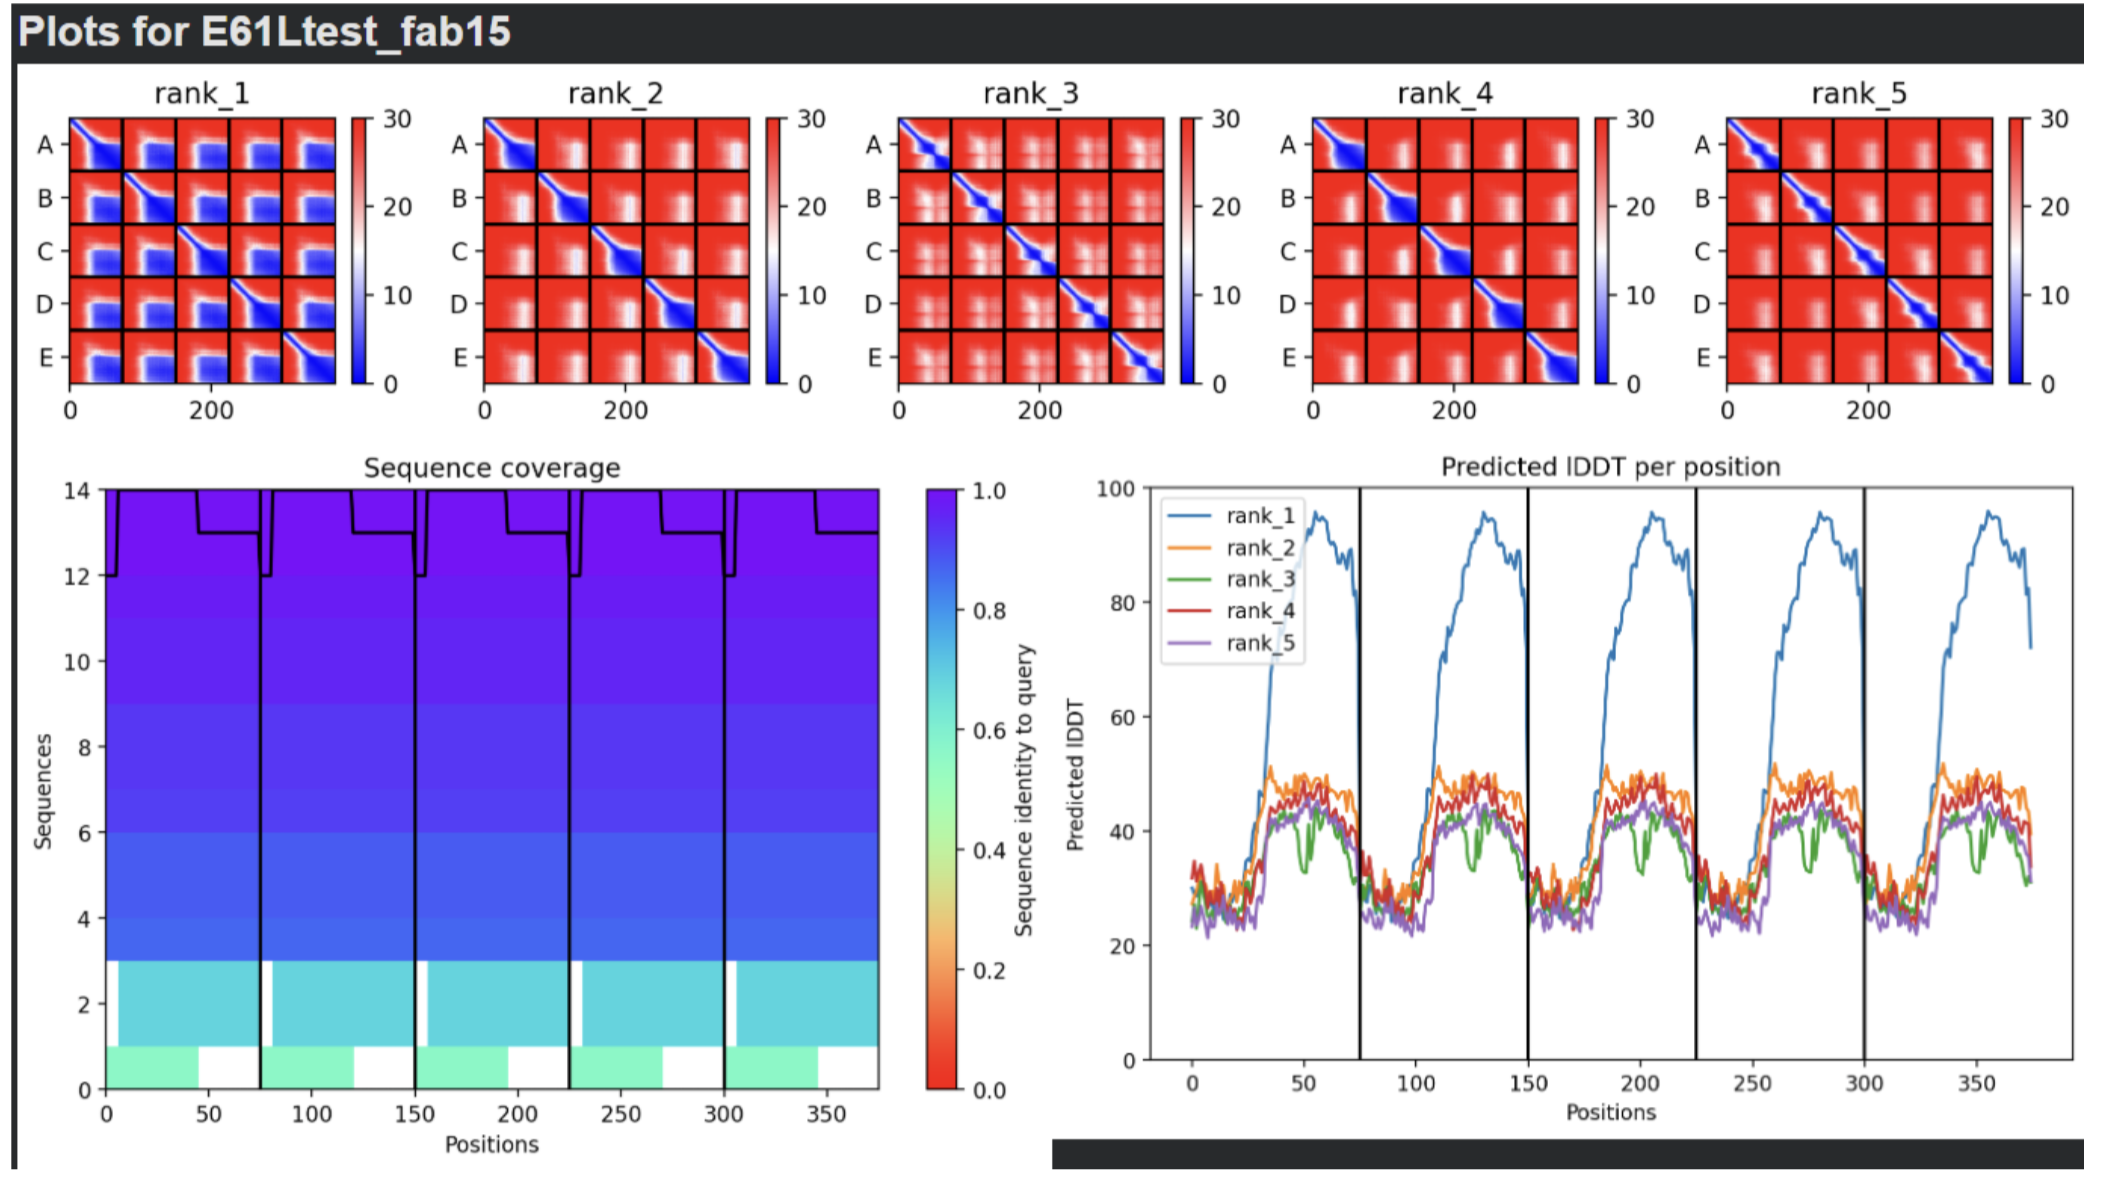
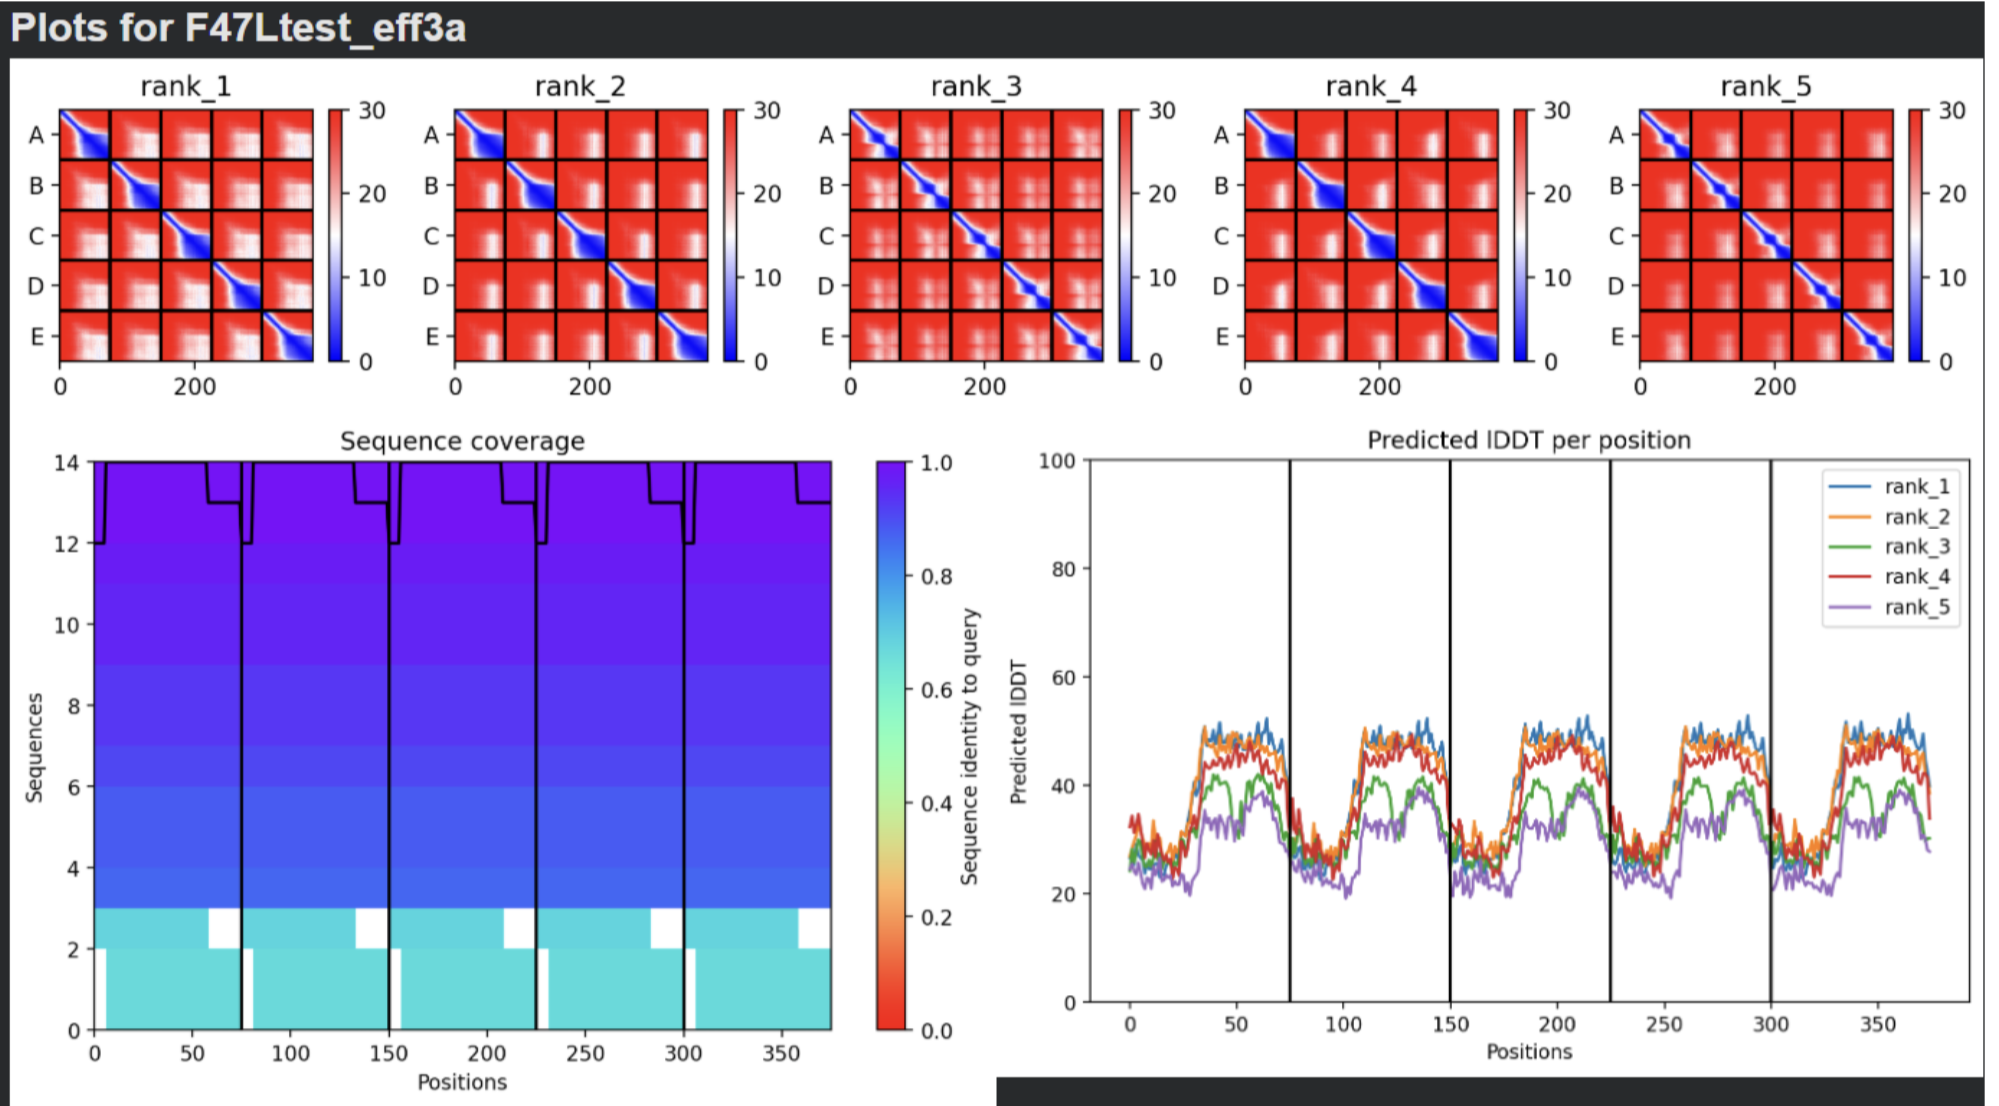
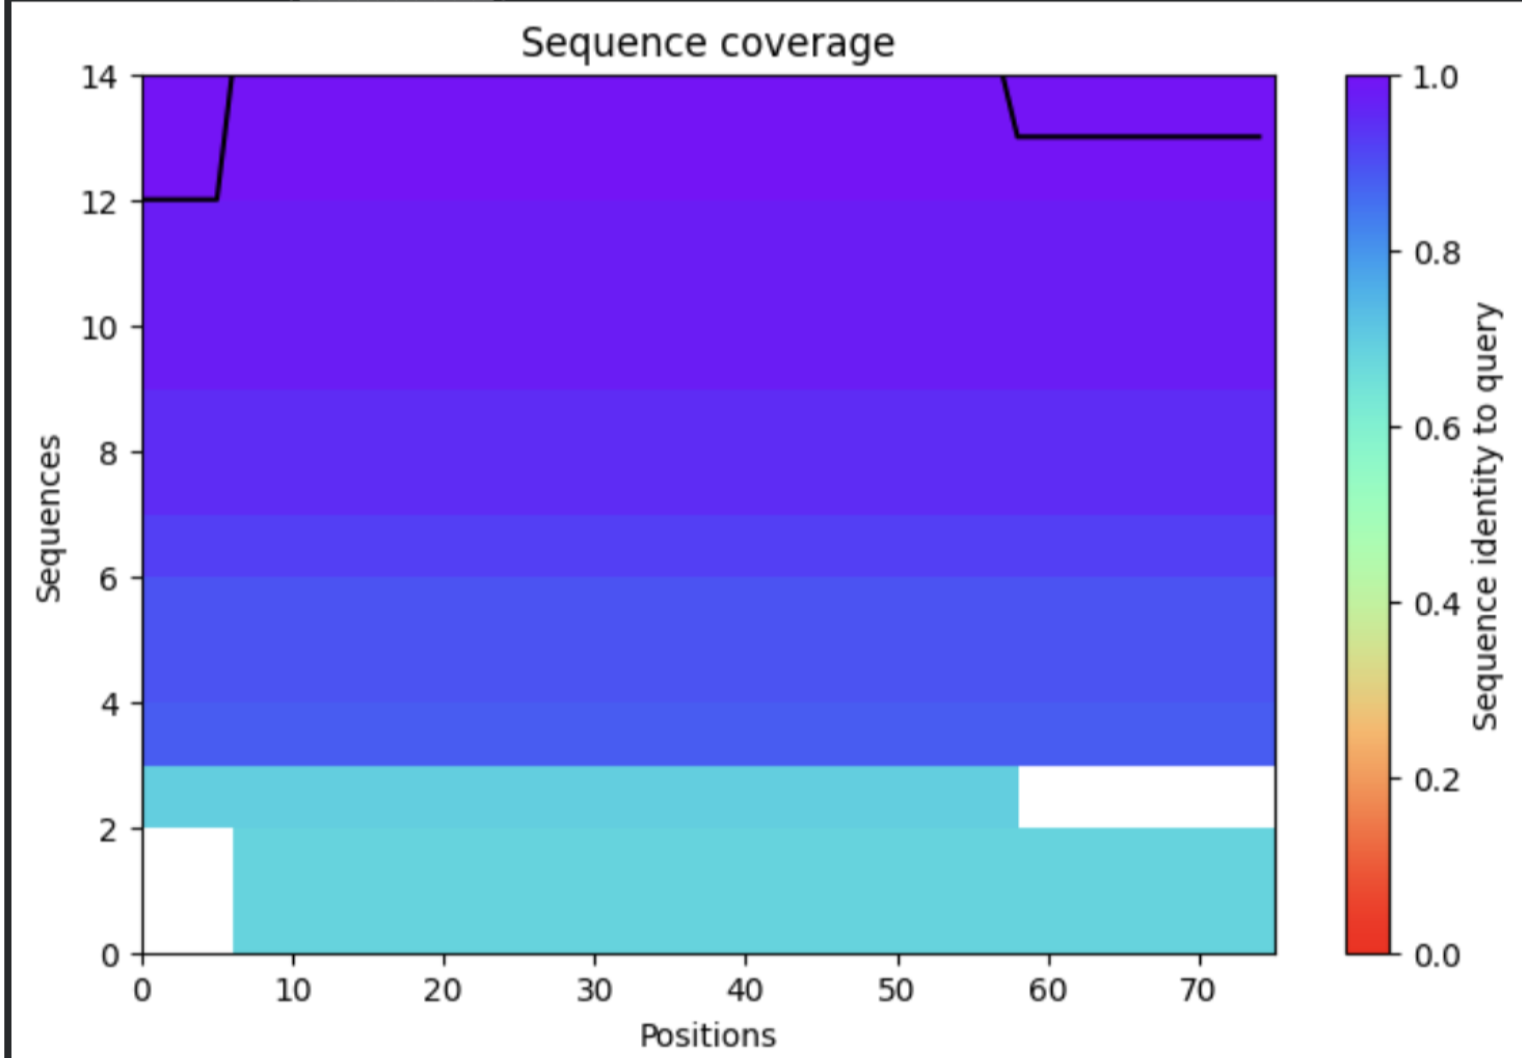
- Sequence Coverage Map
- Predictions
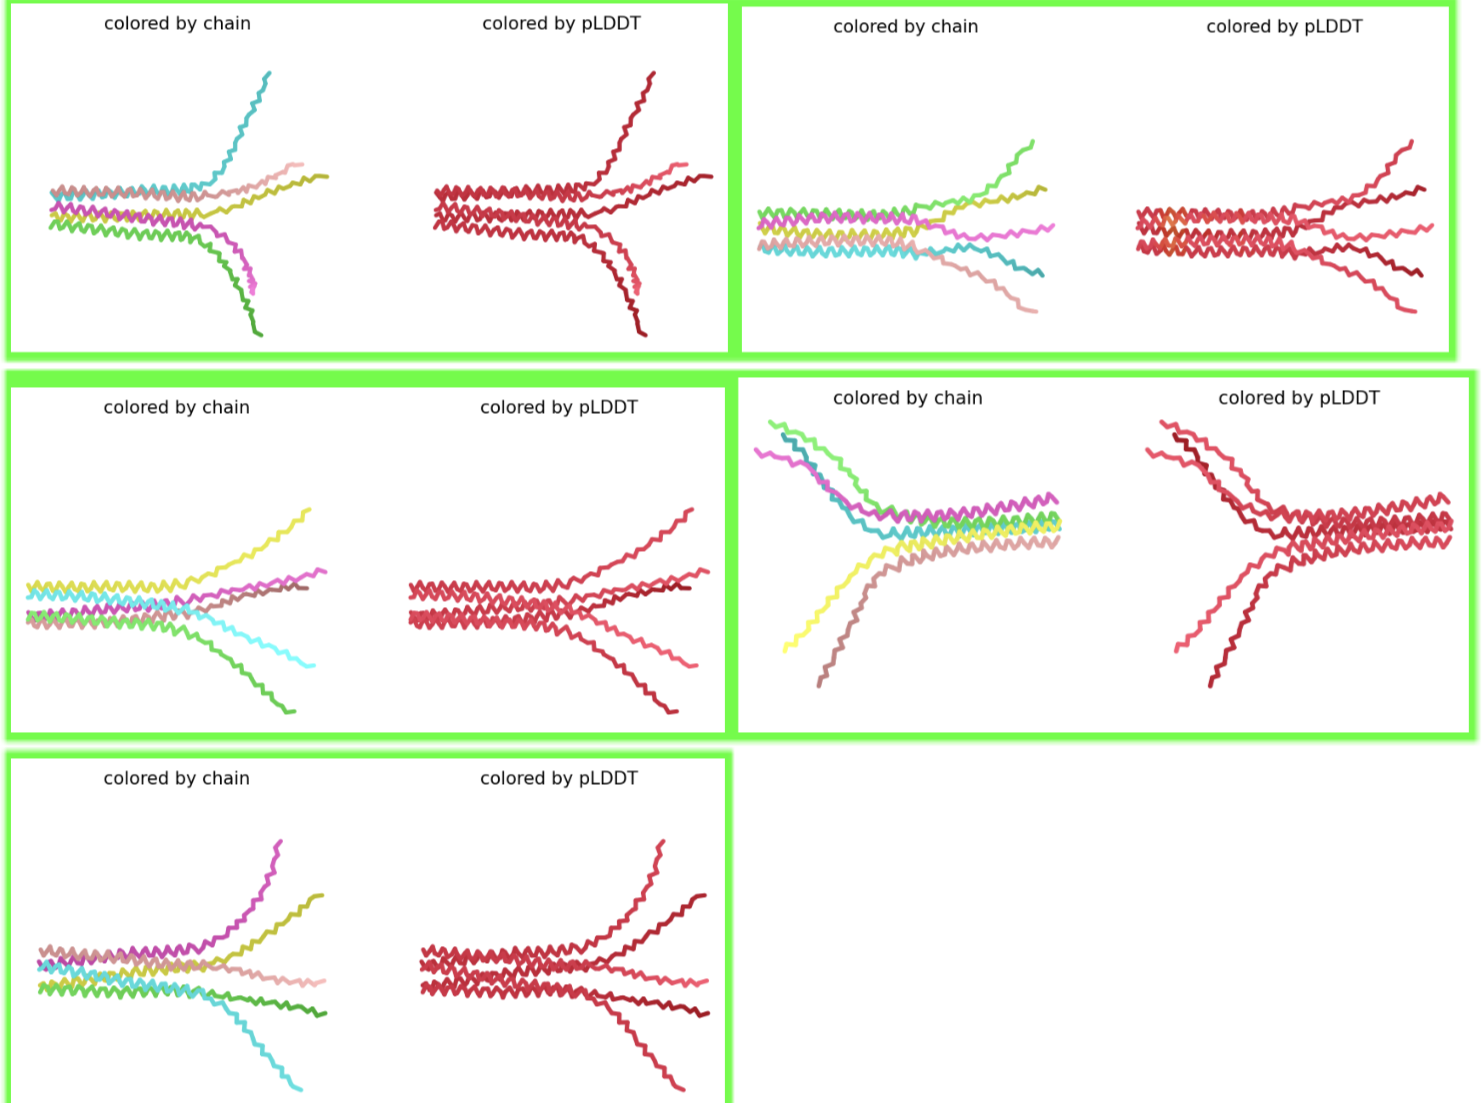
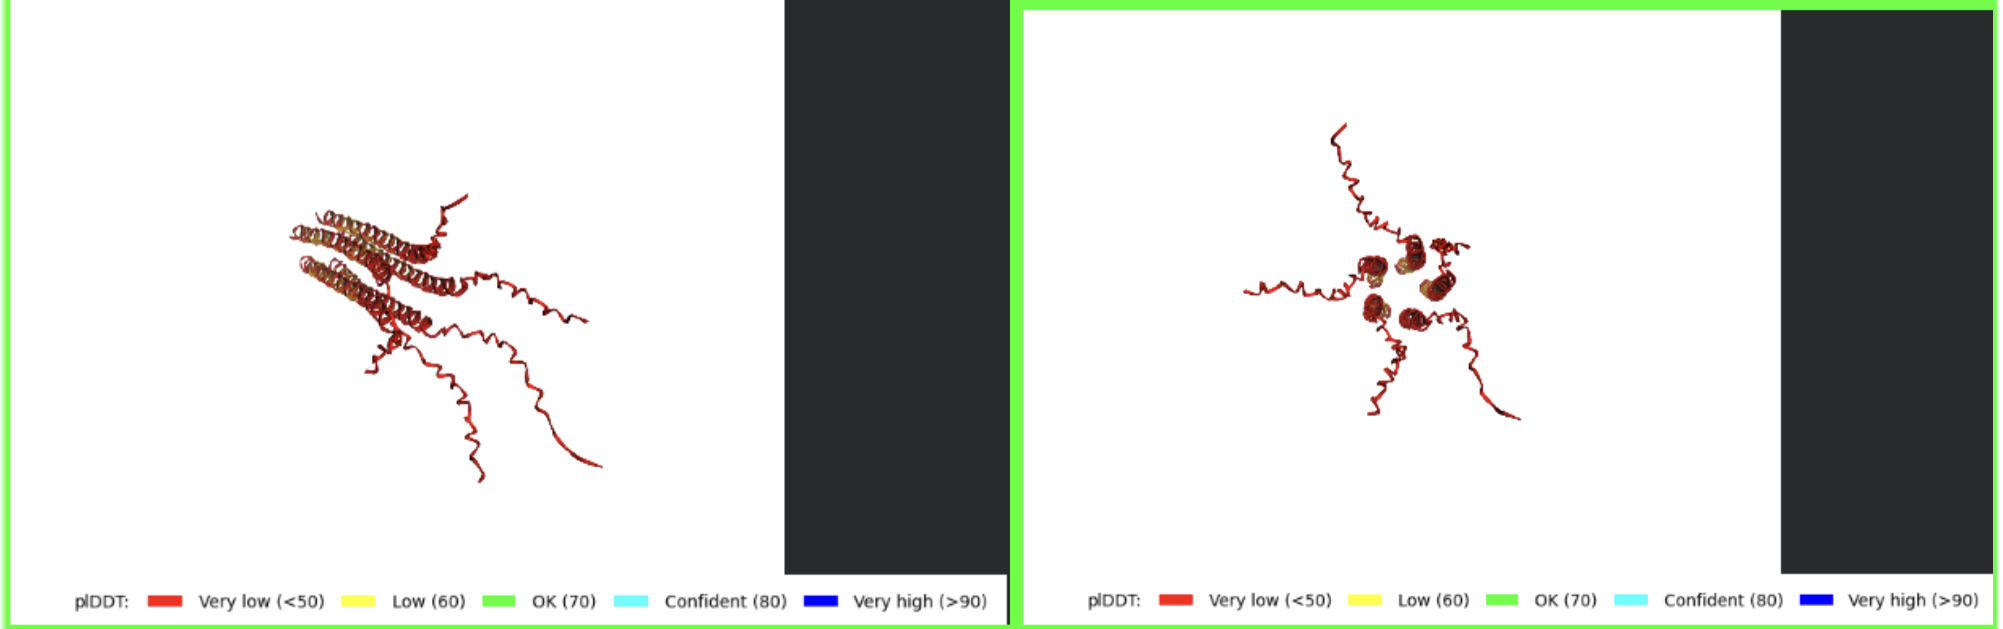
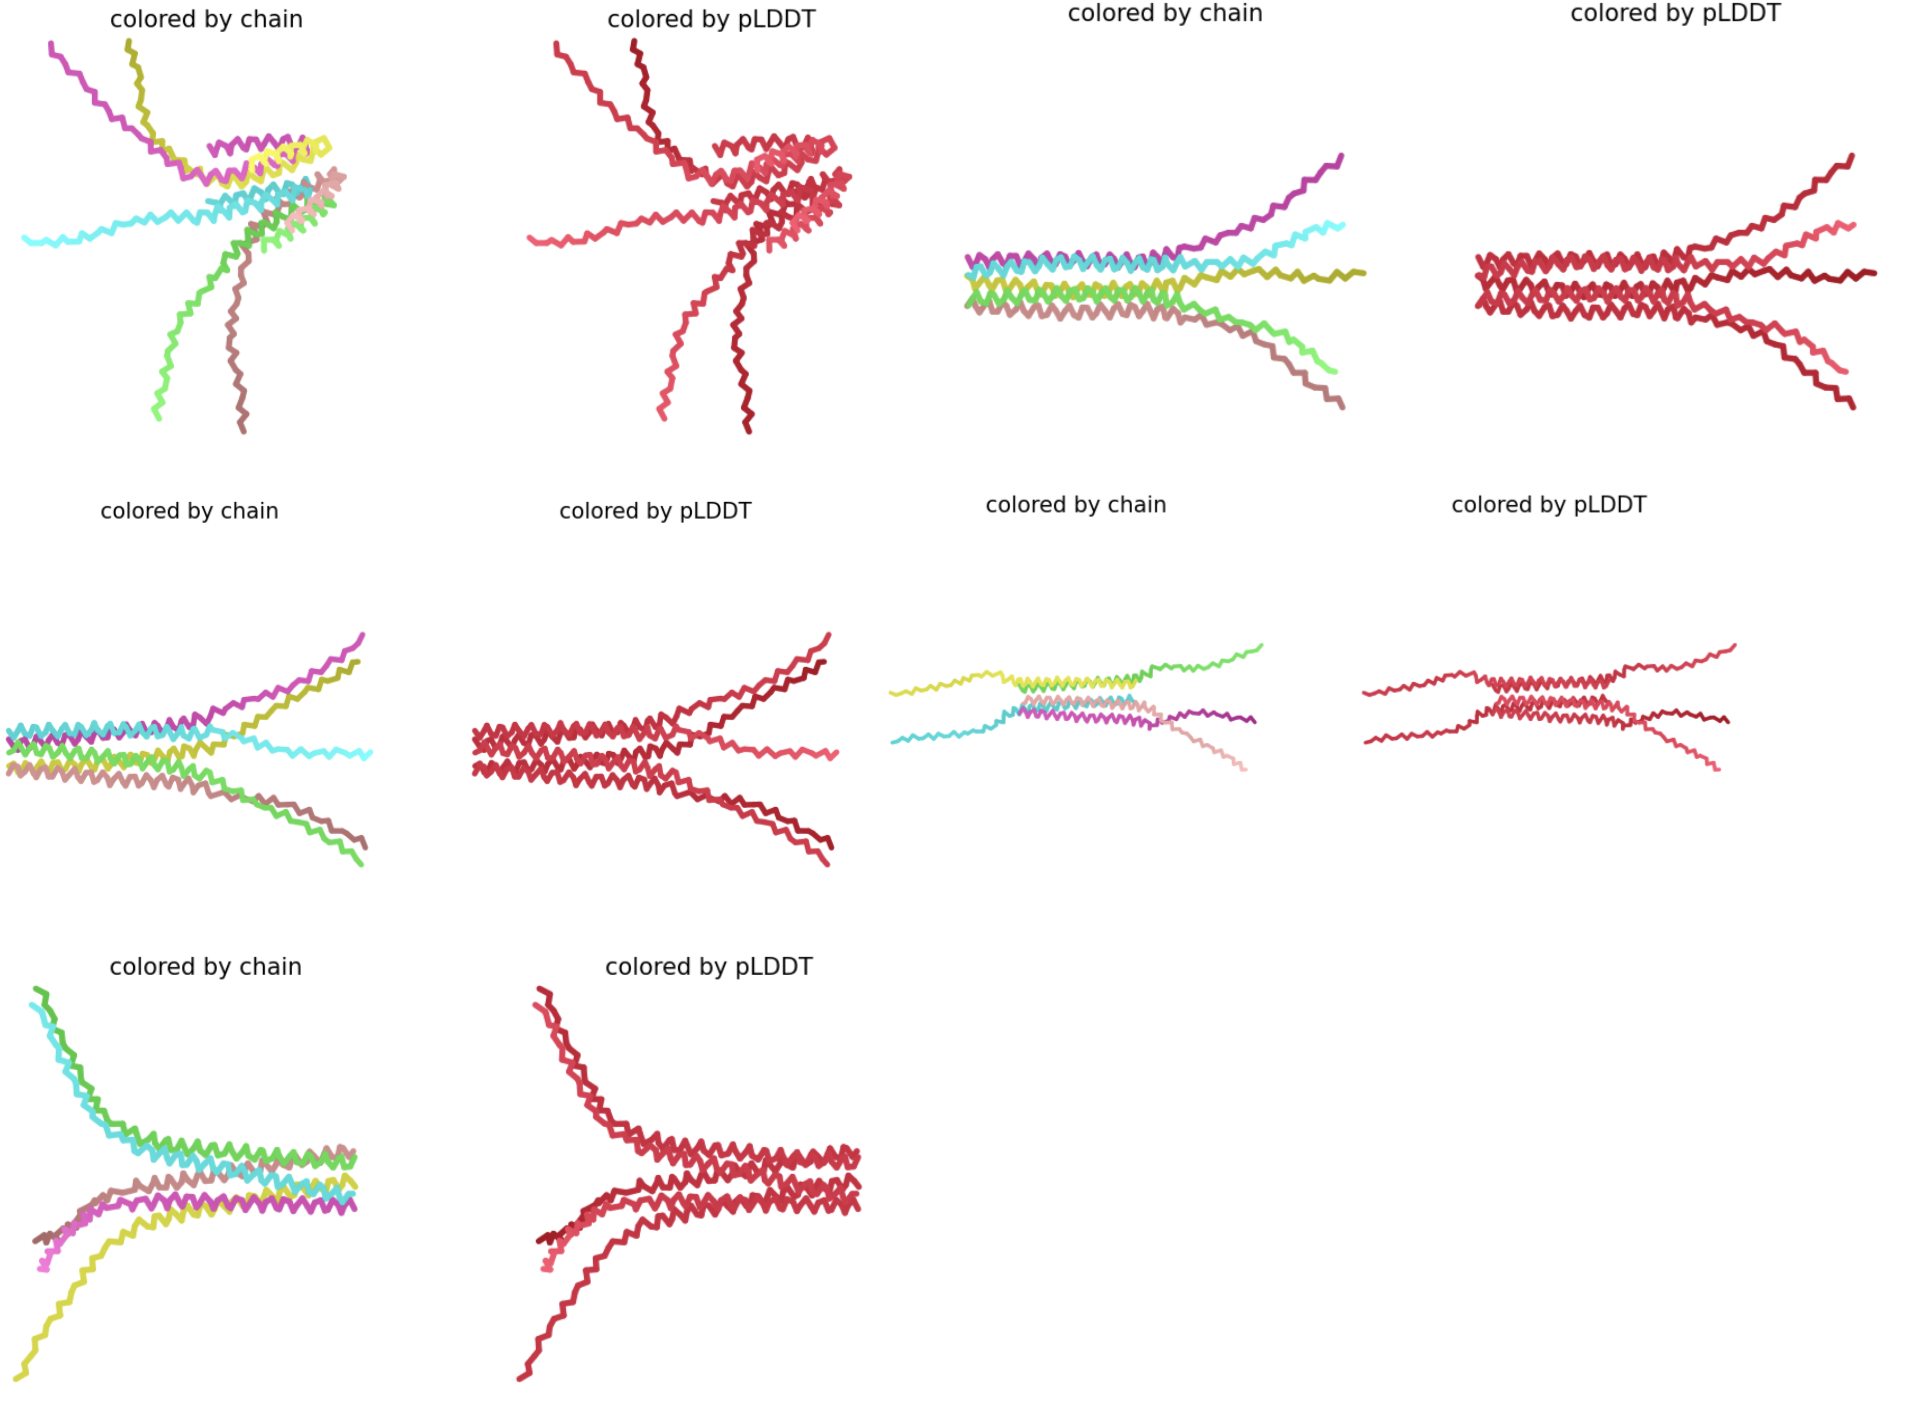
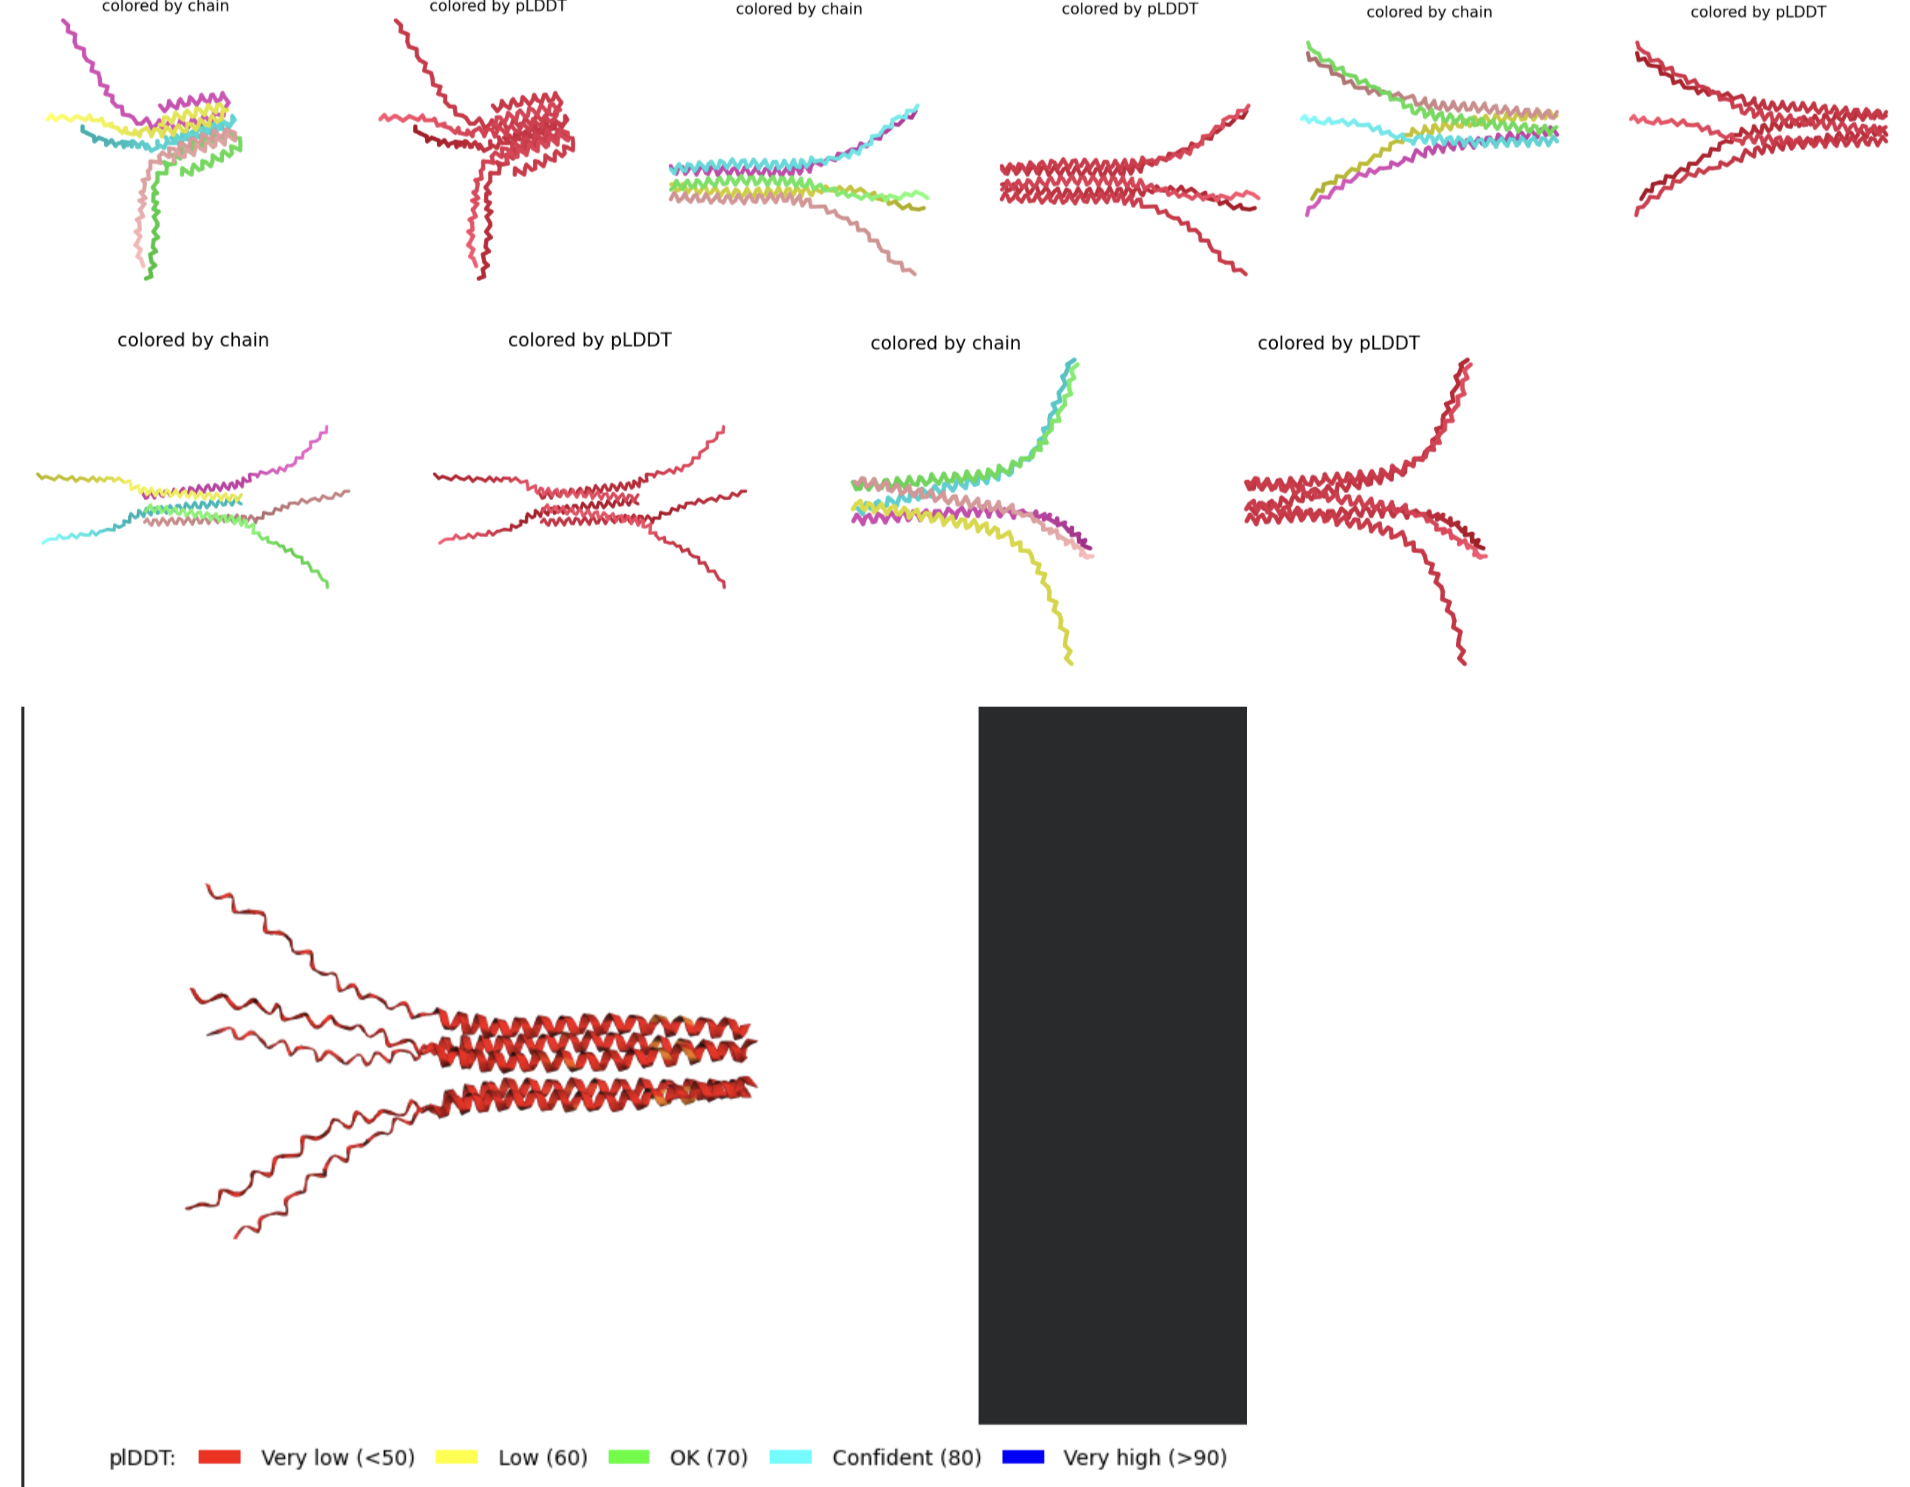
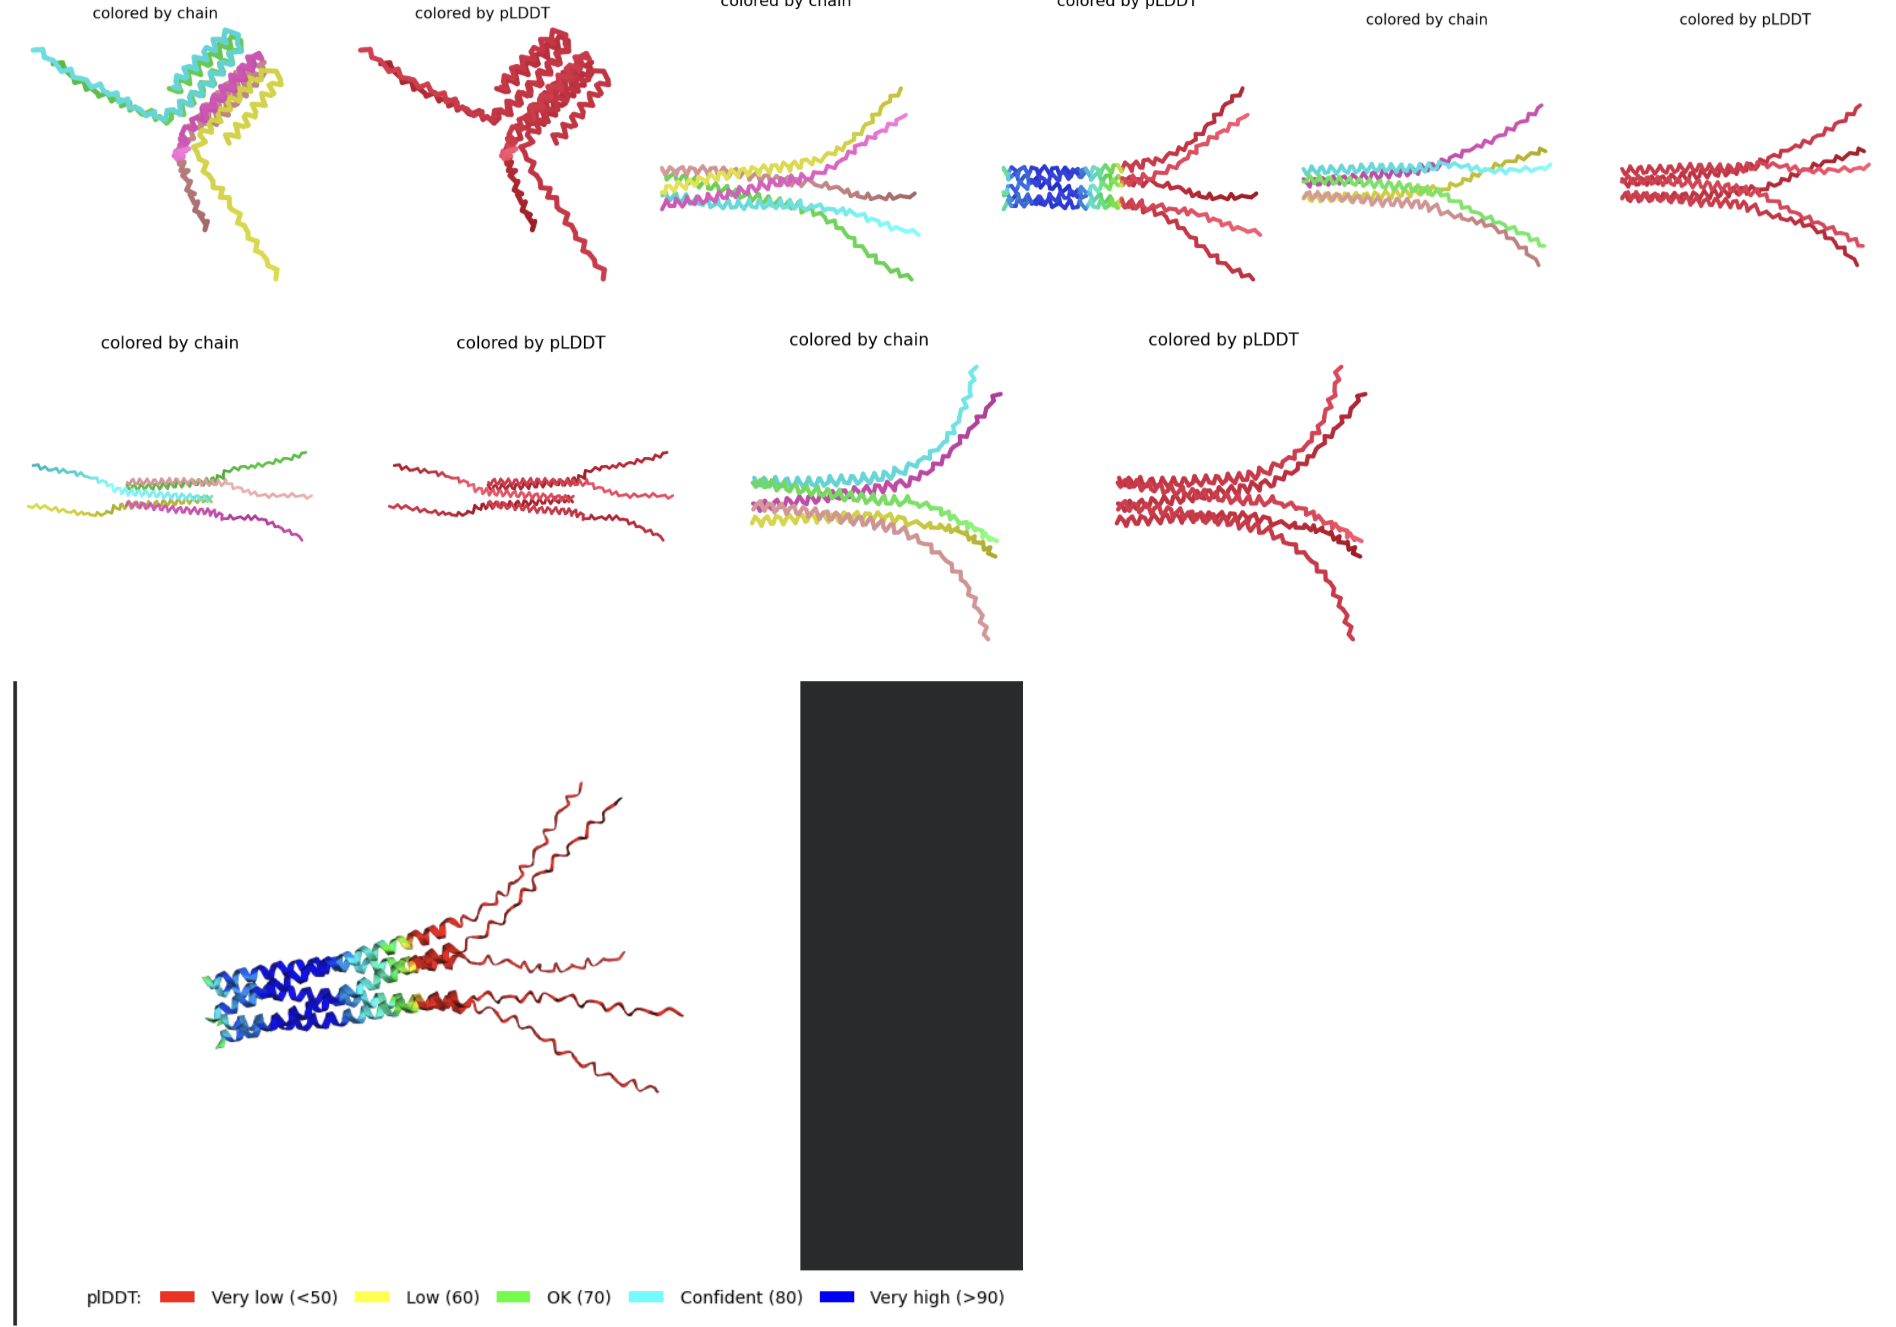
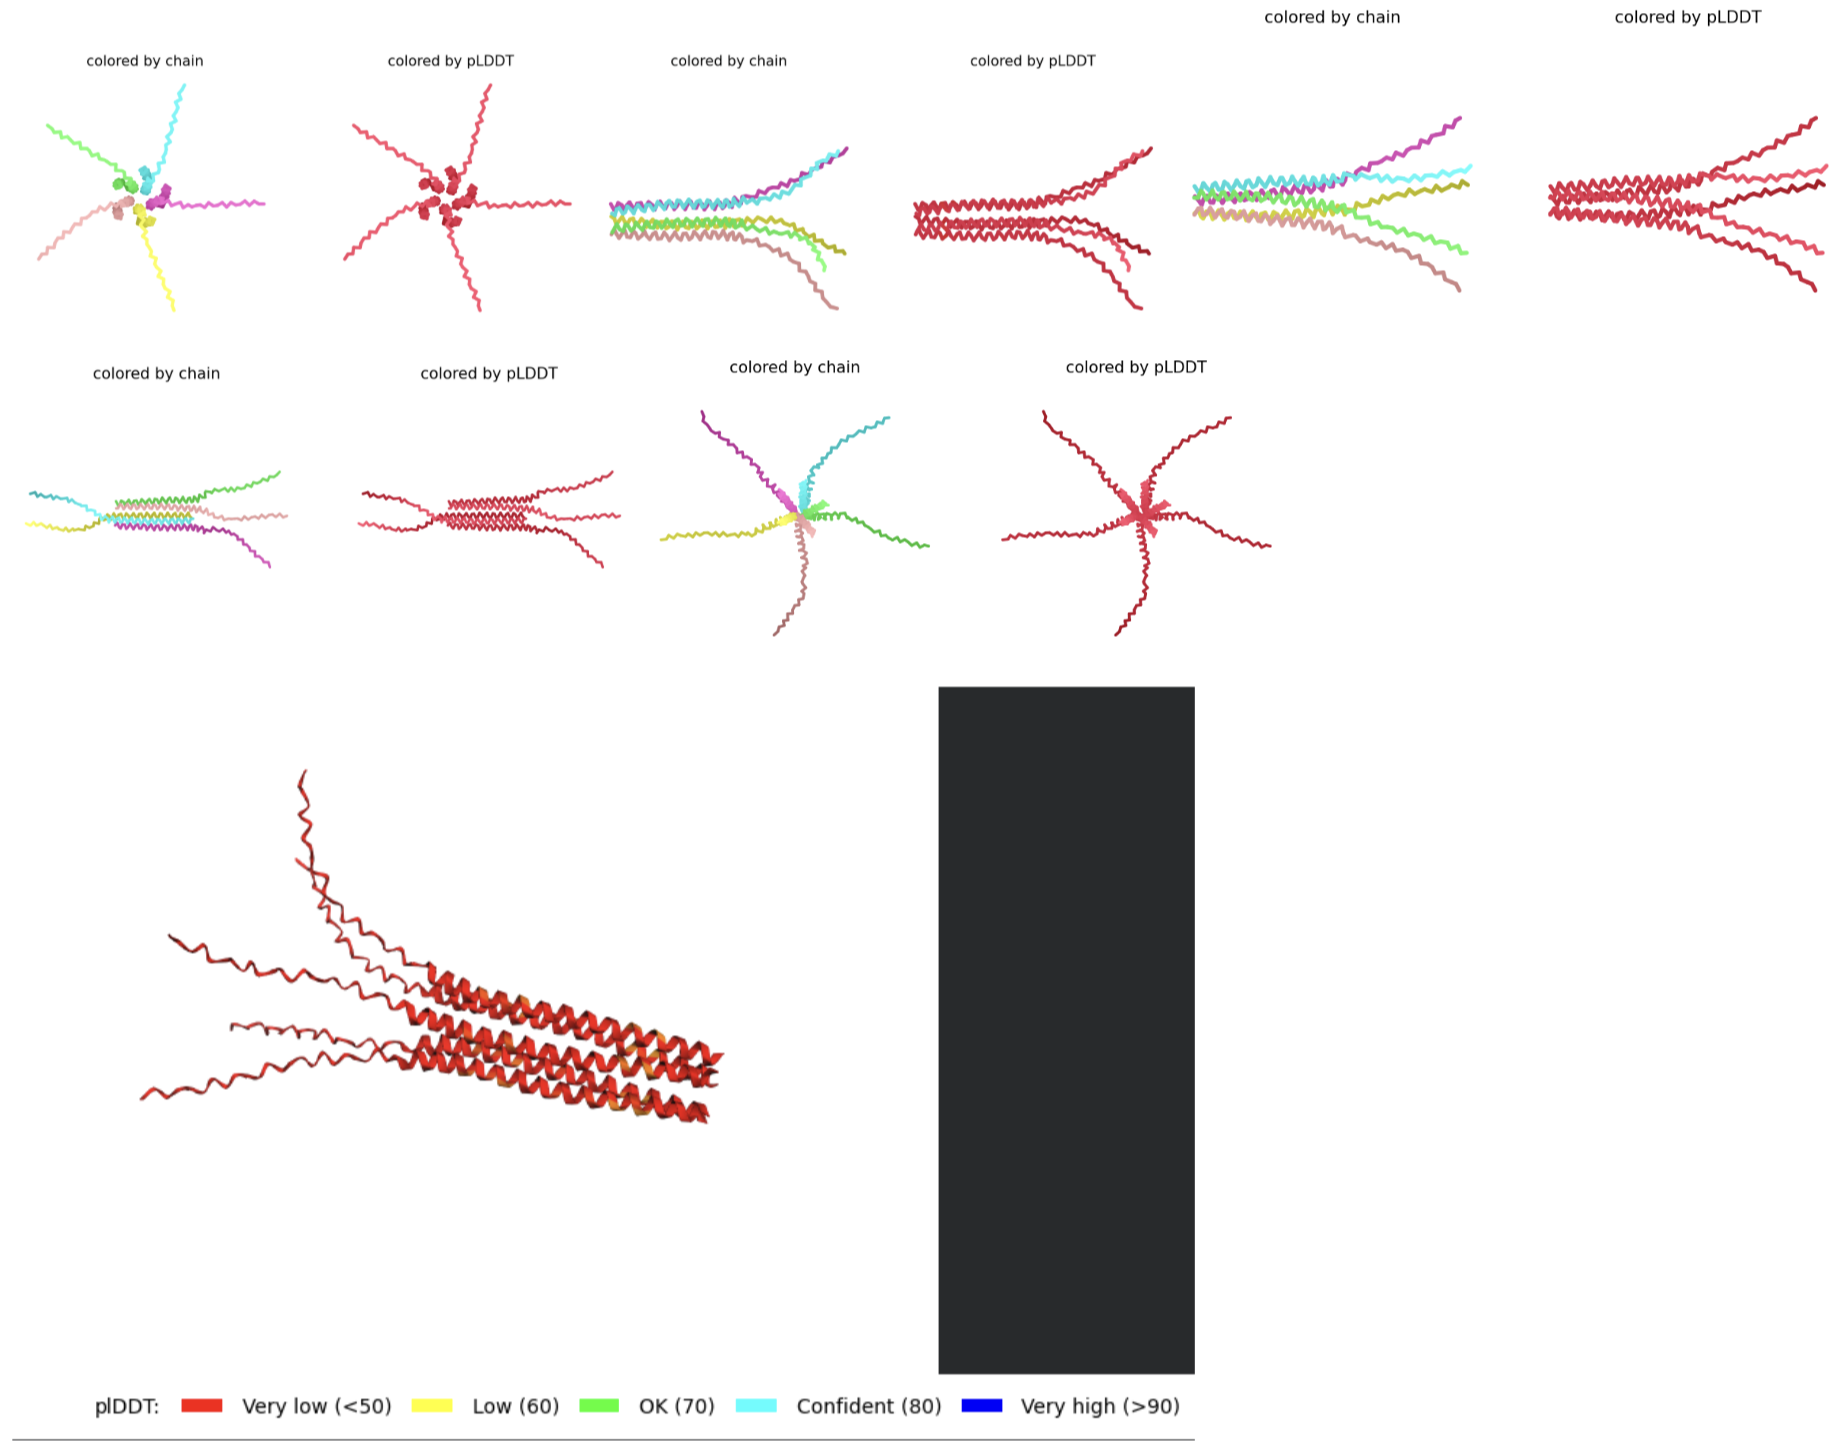
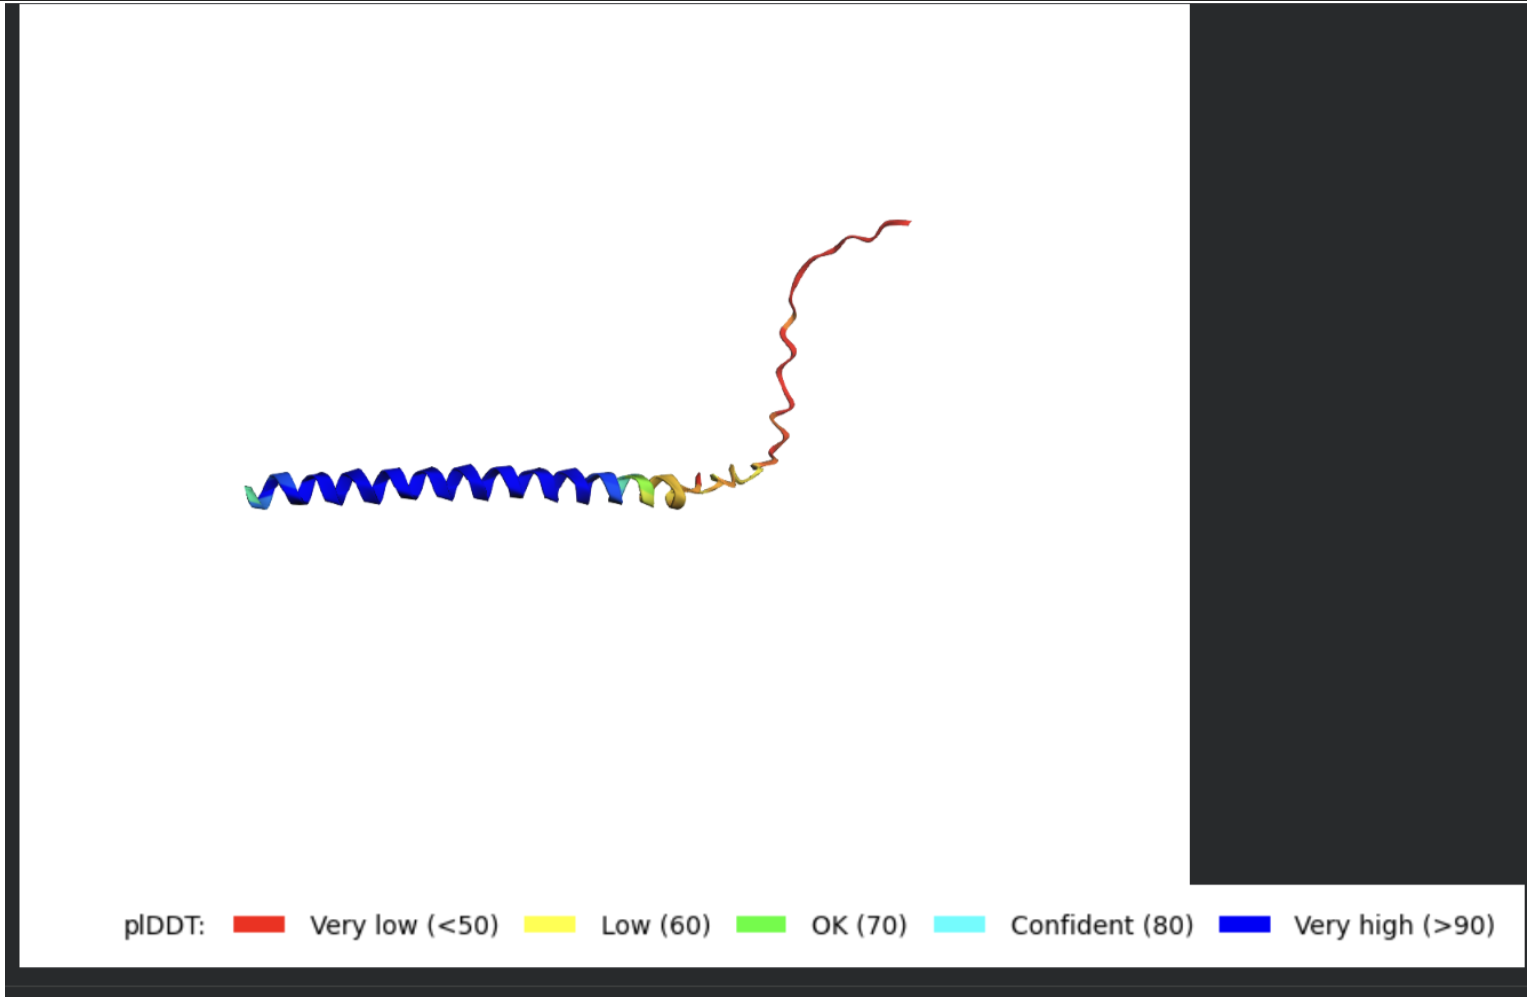
- Display 3D Structure
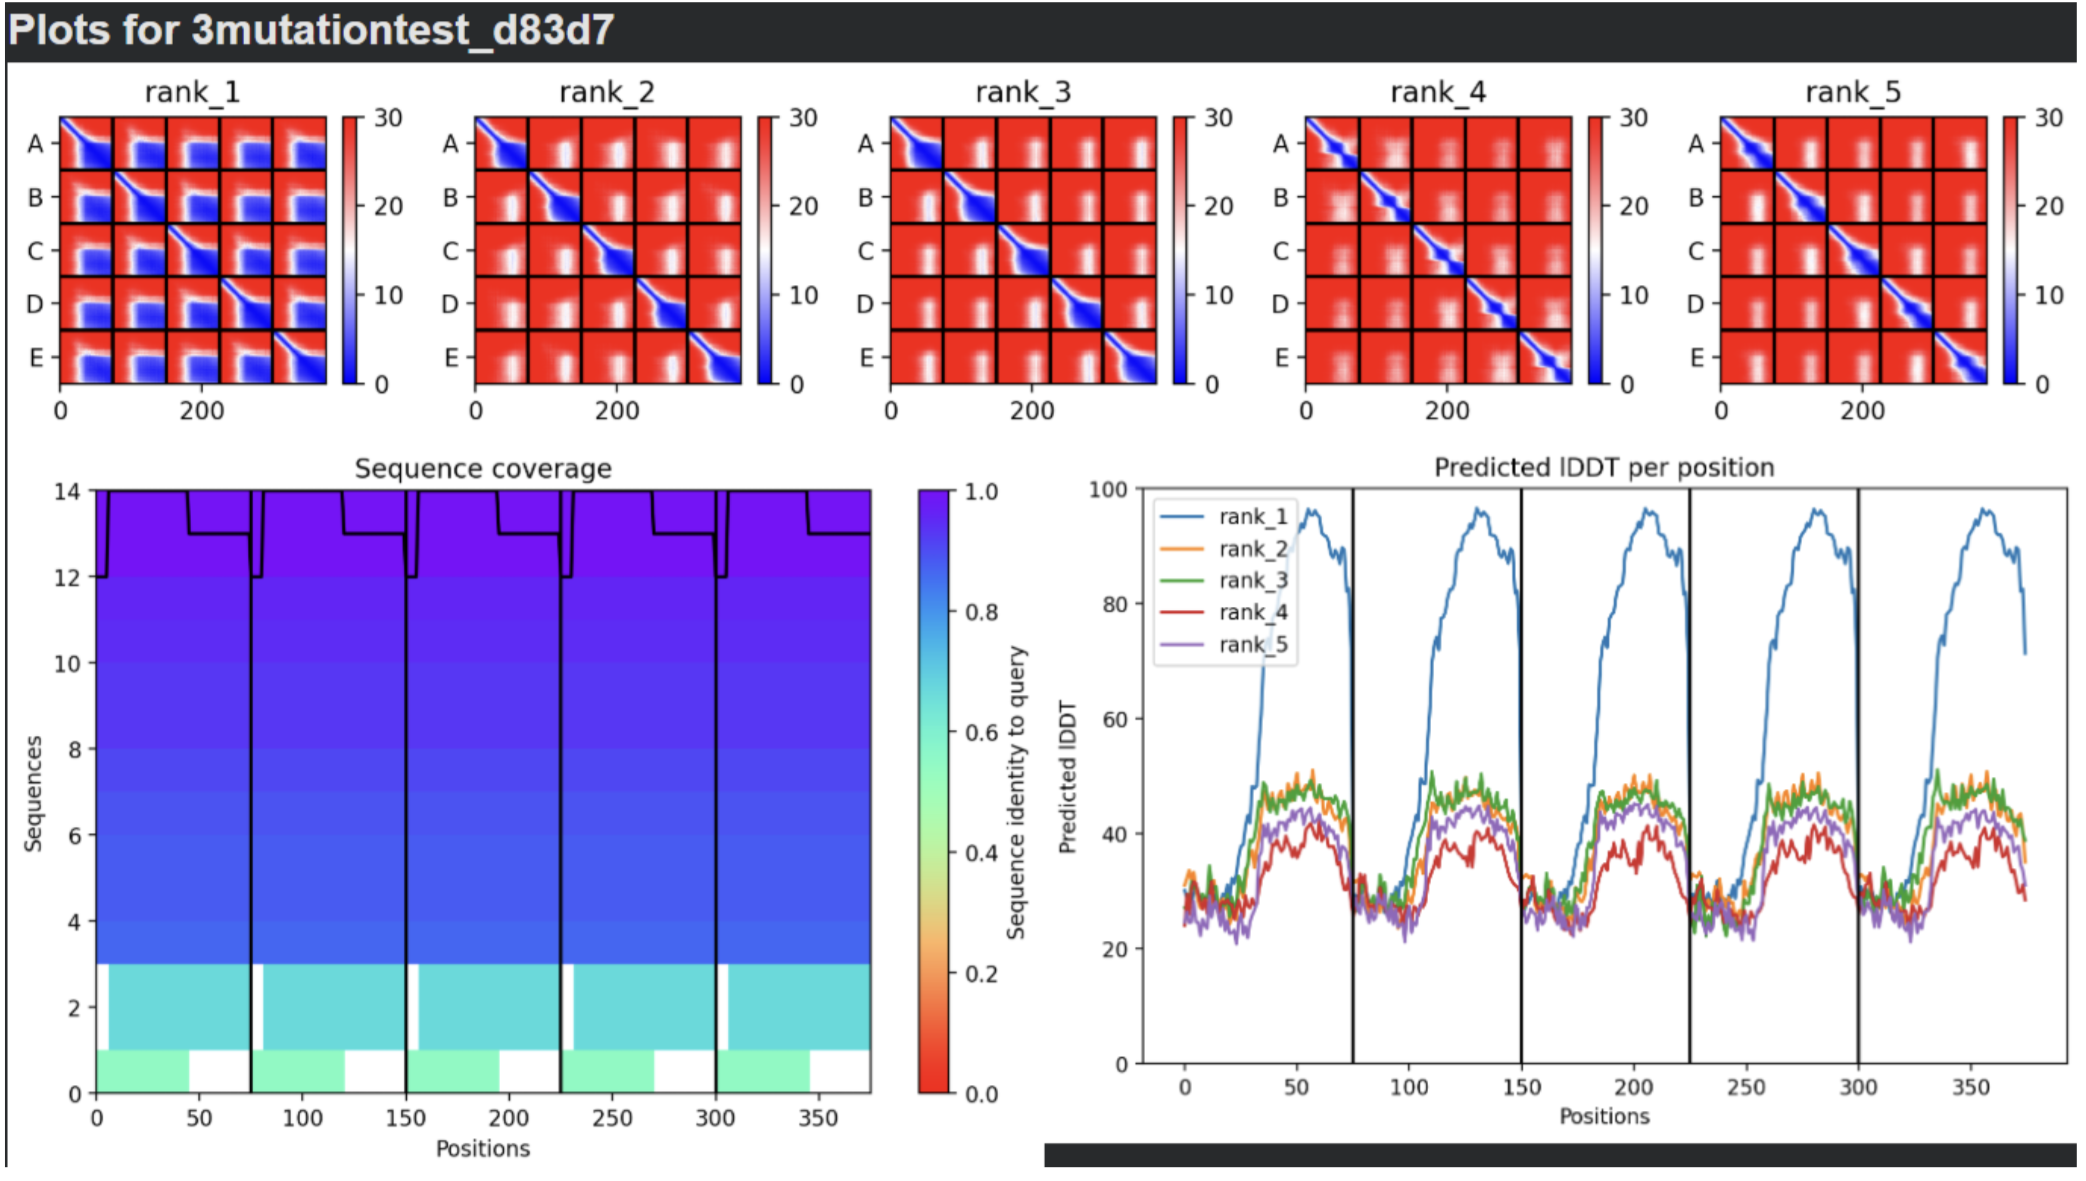
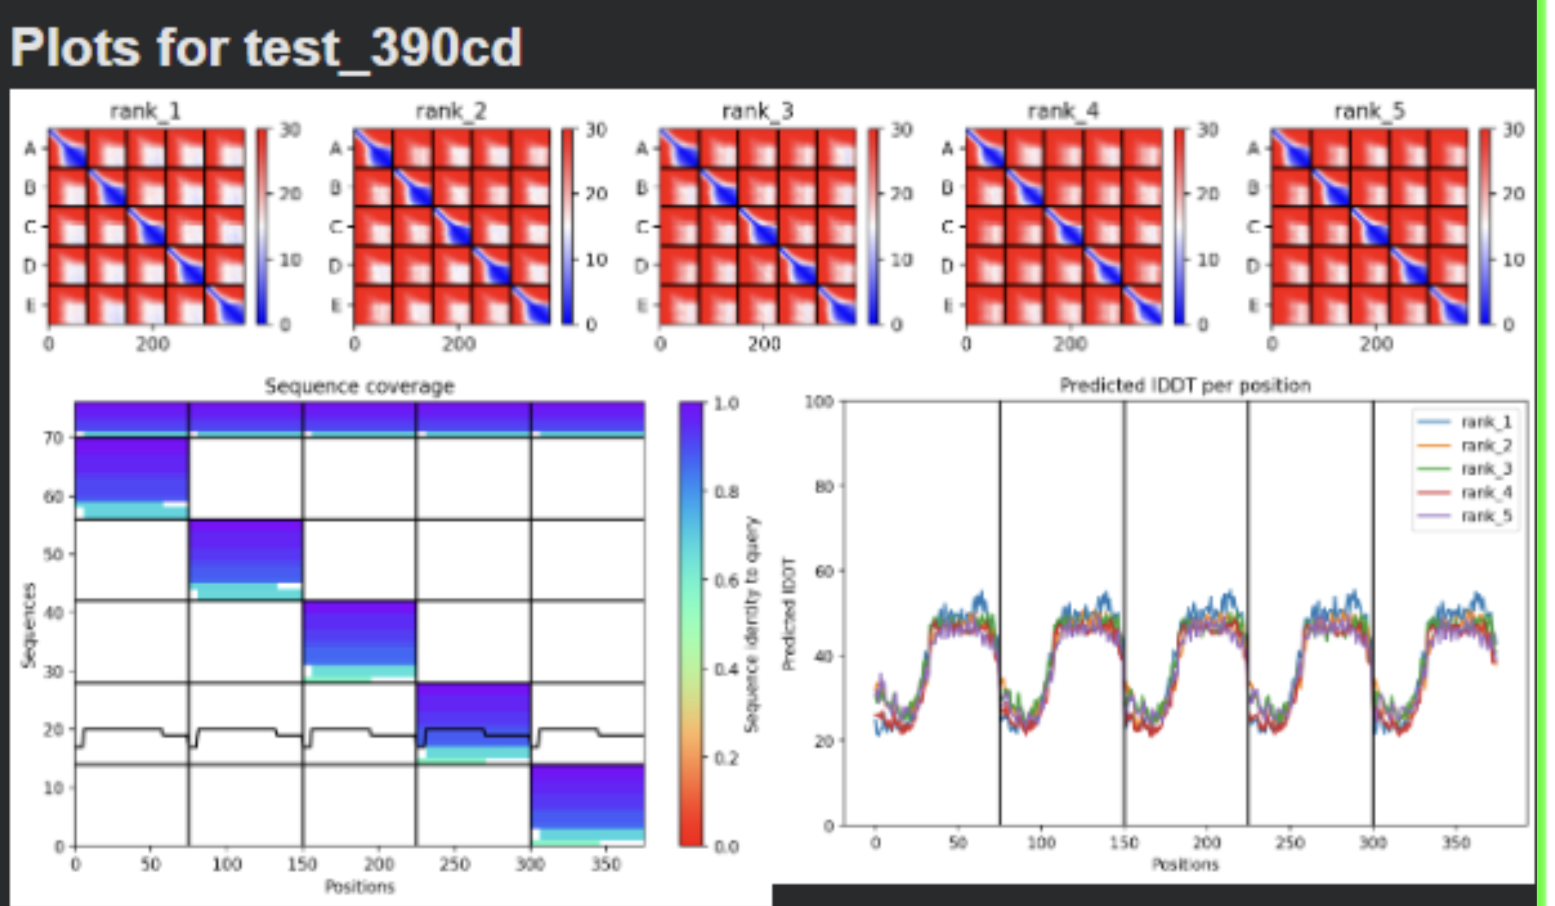
- Plots
- Raphael Results
- F5Q:
- F5P:
- E61L:
- F47L:
- F5S, K50L, E61L:
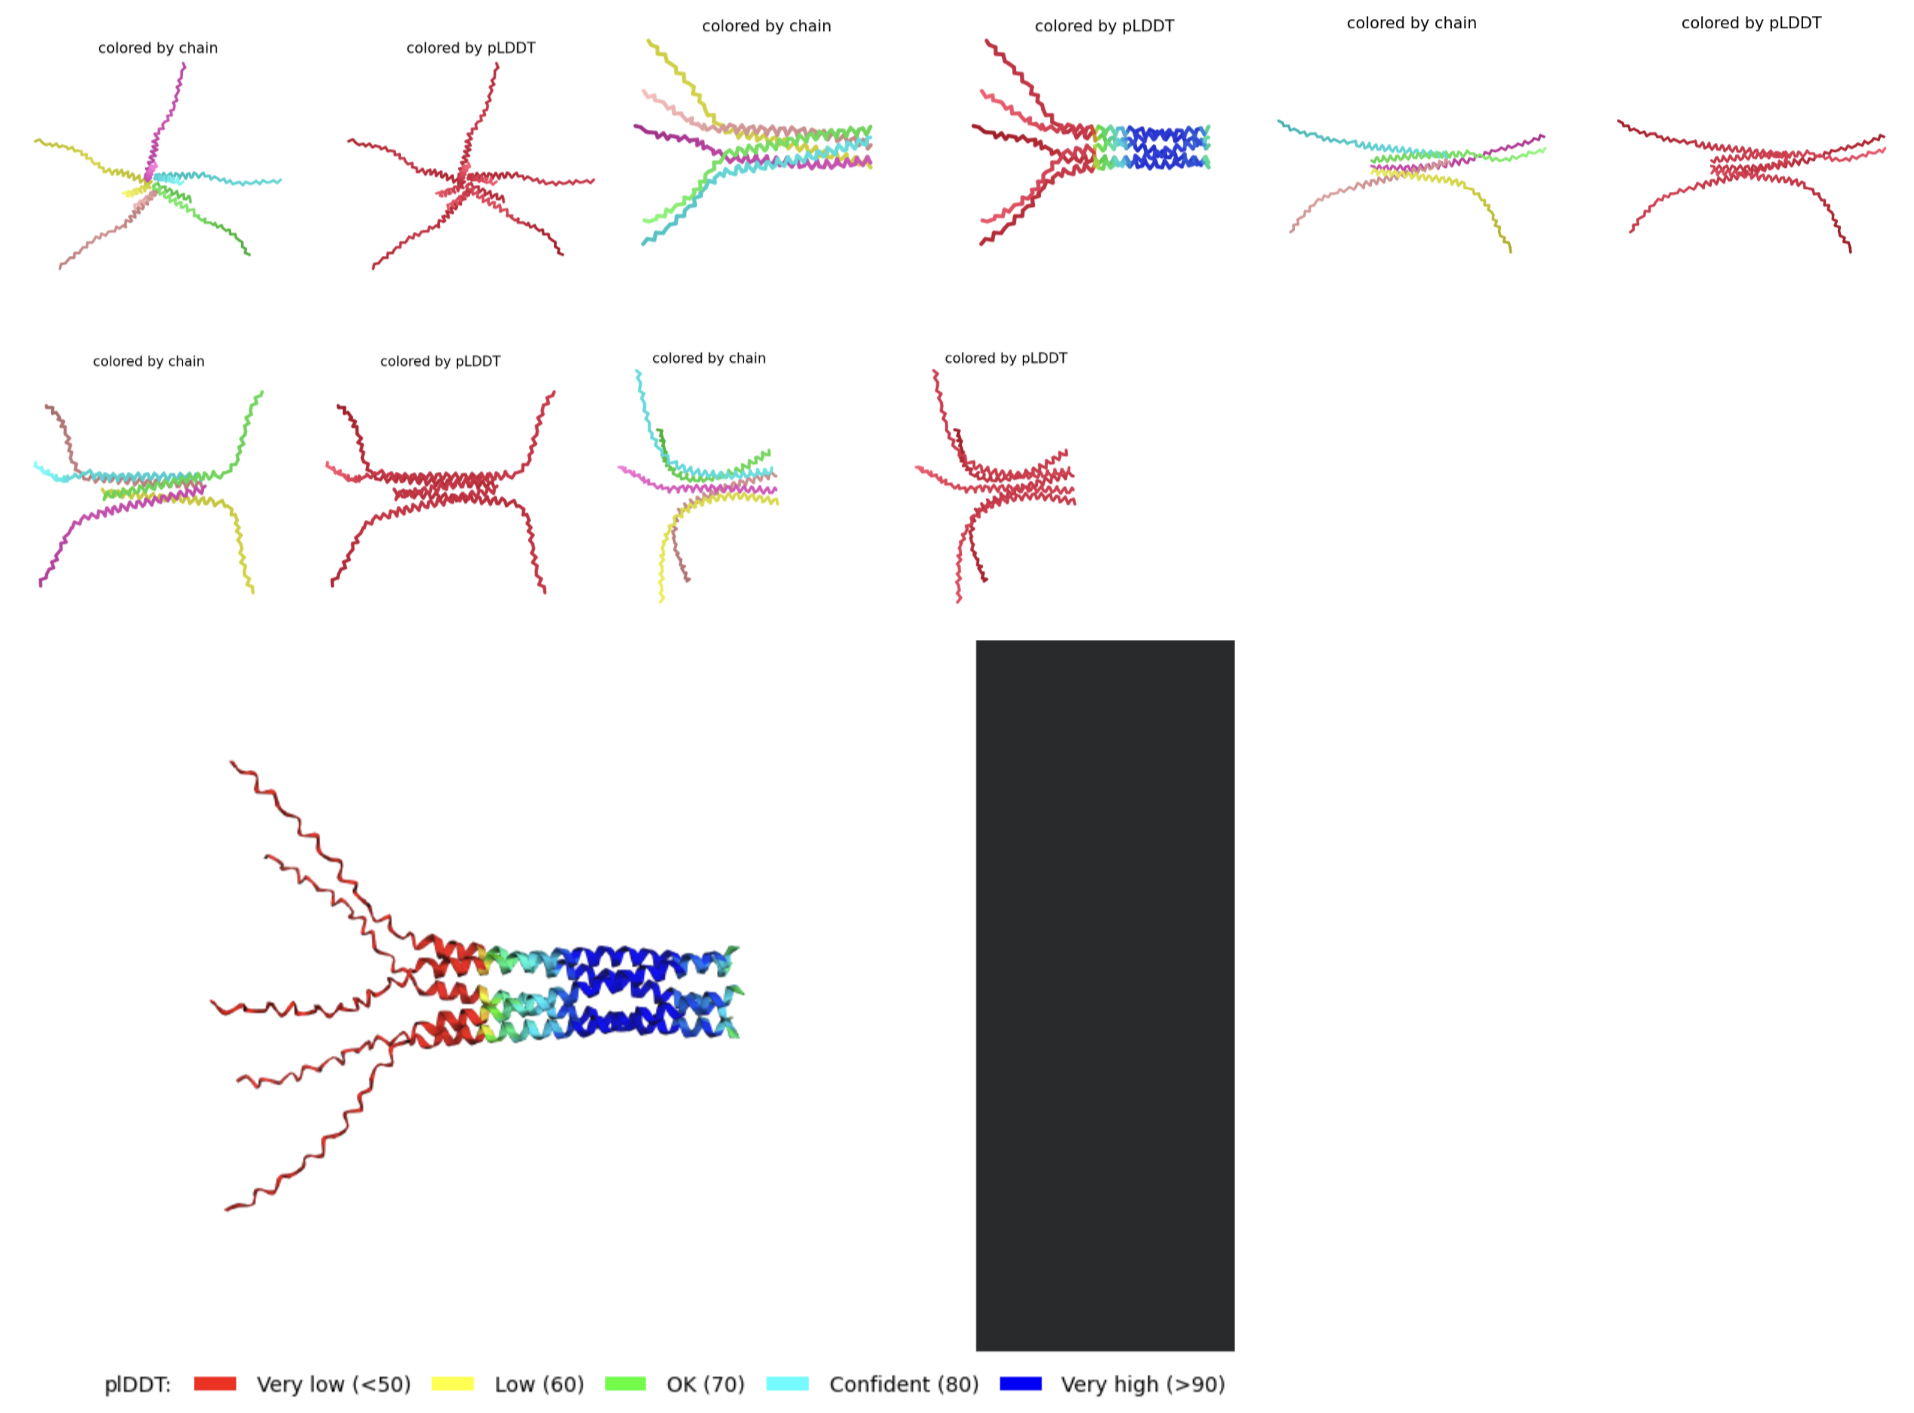
- RESULTS: Mutation 5 (F5S, K50L, E61L) produced very promising results. It seems that the soluble region cannot be improved (most likely due to its disordered nature which prevents it from forming a tangible final structure). But when the K at position 61 is changed into an L, the transmembrane region improves greatly. The stats for this rank are the following: pLDDT=62.4 pTM=0.565 ipTM=0.558.
- Multimeric Assembly:
- METRSPQQSQQTPASTNRRRPFKHEDYPCRRQQRSSTLYVLIFLAIFLSLFTNQLLLSLLLAVIRTVTTLQQLLT:METRSPQQSQQTPASTNRRRPFKHEDYPCRRQQRSSTLYVLIFLAIFLSLFTNQLLLSLLLAVIRTVTTLQQLLT:METRSPQQSQQTPASTNRRRPFKHEDYPCRRQQRSSTLYVLIFLAIFLSLFTNQLLLSLLLAVIRTVTTLQQLLT:METRSPQQSQQTPASTNRRRPFKHEDYPCRRQQRSSTLYVLIFLAIFLSLFTNQLLLSLLLAVIRTVTTLQQLLT:METRSPQQSQQTPASTNRRRPFKHEDYPCRRQQRSSTLYVLIFLAIFLSLFTNQLLLSLLLAVIRTVTTLQQLLT
- Multimeric Assembly:
- RESULTS: Mutation 5 (F5S, K50L, E61L) produced very promising results. It seems that the soluble region cannot be improved (most likely due to its disordered nature which prevents it from forming a tangible final structure). But when the K at position 61 is changed into an L, the transmembrane region improves greatly. The stats for this rank are the following: pLDDT=62.4 pTM=0.565 ipTM=0.558.
- F5Q:
- Jason Results
- Original Wild-Type Sequence 3D visualization and Sequence Coverage Map
- Multimeric Assembly based on mutations listed in 5.
- METRRPQQSQQTPASTNRRRPFKHEDYPCRRQQRSSTLYVLIFLAIFLSKFTNQLLLSLLEAVIRTVTTLQQLLT:METRFPQQQQQTPASTNRRRPFKHEDYPCRRQQRSSTLYVLIFLAIFLSKFTNQLLLSLLEAVIRTVTTLQQLLT:METRFPQQSQQTPASTNRRRPFKHEDYPRRRQQRSSTLYVLIFLAIFLSKFTNQLLLSLLEAVIRTVTTLQQLLT:METRFPQQSQQTPASTNRRRPFKHEDYPCRRQQRSSTLYVLIFIAIFLSKFTNQLLLSLLEAVIRTVTTLQQLLT:METRFPQQSQQTPASTNRRRPFKHEDYPCRRQQRSSTLYVLIFLAIFLSKFTNQLLLSLLVEVIRTVTTLQQLLT
- Multimeric Assembly Sequence 3D visualization and Sequence Coverage Map
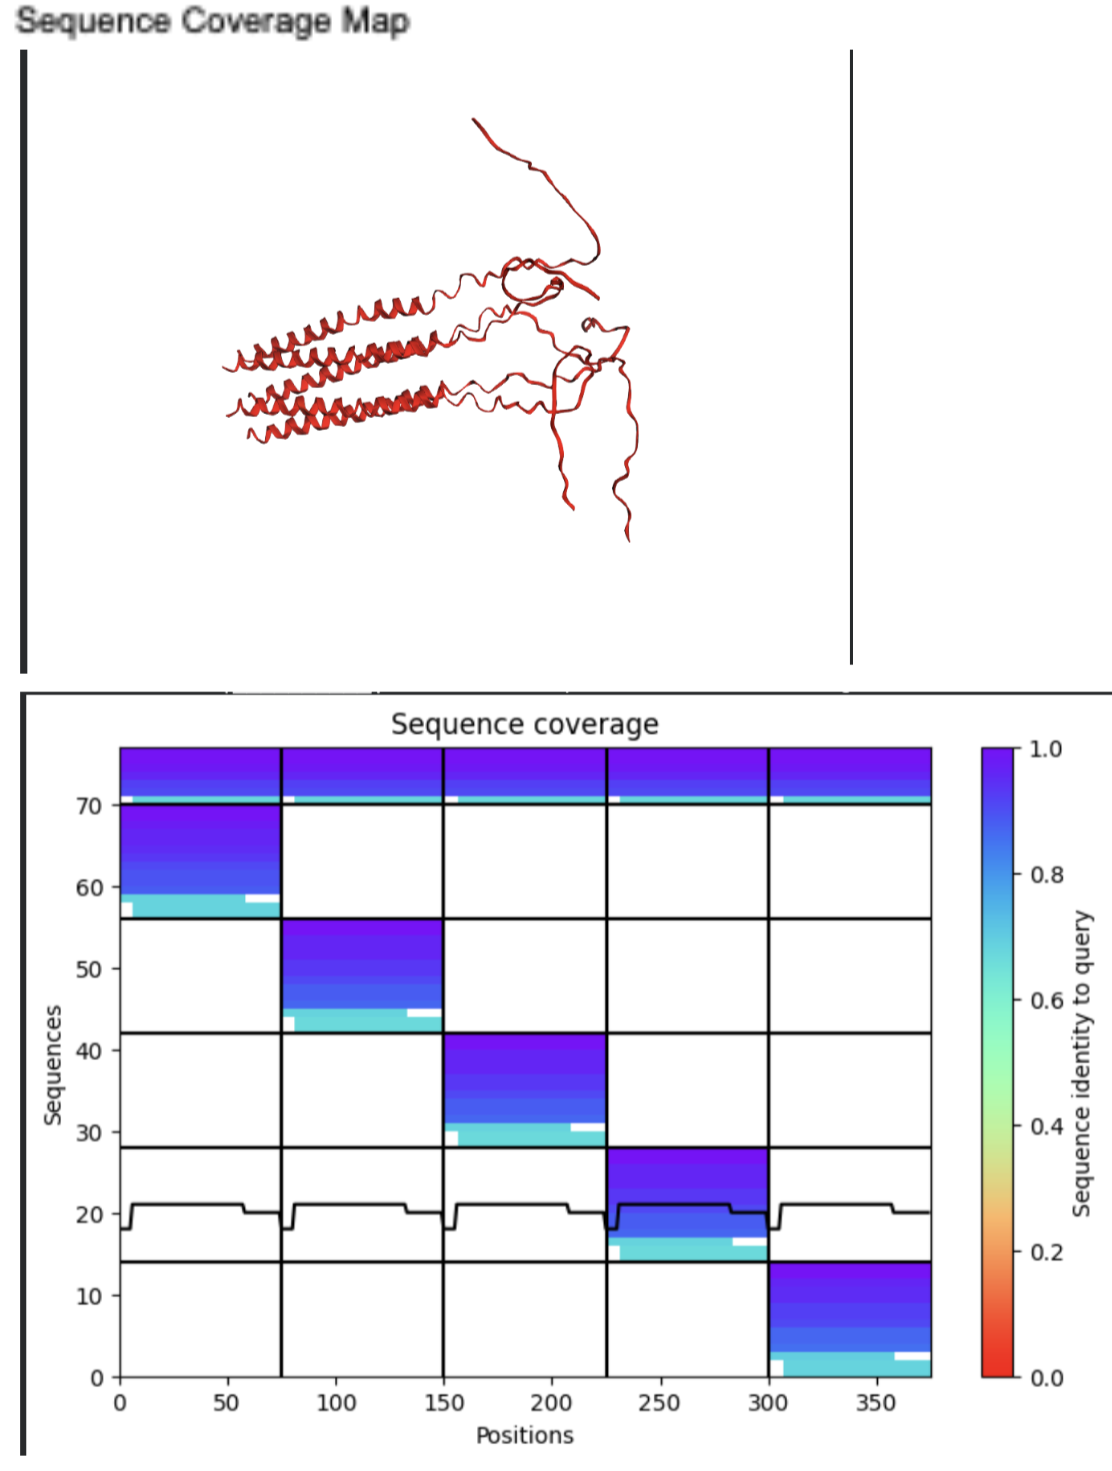
- Unfortunately it appears that my introduced mutations did not improve the lysis abilities of the L protein based on the results above
- Multimeric Assembly Sequence 3D visualization and Sequence Coverage Map
- METRRPQQSQQTPASTNRRRPFKHEDYPCRRQQRSSTLYVLIFLAIFLSKFTNQLLLSLLEAVIRTVTTLQQLLT:METRFPQQQQQTPASTNRRRPFKHEDYPCRRQQRSSTLYVLIFLAIFLSKFTNQLLLSLLEAVIRTVTTLQQLLT:METRFPQQSQQTPASTNRRRPFKHEDYPRRRQQRSSTLYVLIFLAIFLSKFTNQLLLSLLEAVIRTVTTLQQLLT:METRFPQQSQQTPASTNRRRPFKHEDYPCRRQQRSSTLYVLIFIAIFLSKFTNQLLLSLLEAVIRTVTTLQQLLT:METRFPQQSQQTPASTNRRRPFKHEDYPCRRQQRSSTLYVLIFLAIFLSKFTNQLLLSLLVEVIRTVTTLQQLLT
- Original Wild-Type Sequence 3D visualization and Sequence Coverage Map
- Nana Results
- Multimeric Assembly: METRQPQQSQQTPASTNRRRPFKHEDYPCRRQQRSSTLYVLIFLAIFLSKFTNQLLLSLLEAVIRTVTTLQQLLT:METRFPQQSQQTPASTRRRRPFKHEDYPCRRQQRSSTLYVLIFLAIFLSKFTNQLLLSLLEAVIRTVTTLQQLLT:METRFPQQSQQTPASTNRRRPFKHEDYPCRRQQRSSTLYLLIFLAIFLSKFTNQLLLSLLEAVIRTVTTLQQLLT:METRFPQQSQQTPASTNRRRPFKHEDYPCRRQQRSSTLYVLIFLAIFLSLFTNQLLLSLLEAVIRTVTTLQQLLT:METRFPQQSQQTPASTNRRRPFKHEDYPCRRQQRSSTLYVLIFLAIFLSKFTNQLLLSLLEAVILTVTTLQQLLT
- Xavier Results
All of Jason’s supporting prompts for this work listed below
| Supporting Prompt | Model |
|---|---|
| In the final 2 cells, what does the ’effect_esm’ variable mean? What do these numbers indicate from a scoring standpoint? How do they fit into a larger context regarding mutated amino acid efficacy? Do NOT hallucinate when answering this prompt | Gemini |
| Tell me where (i.e., in which cell) the 2.56 mutation value is located. Do NOT hallucinate when answering this prompt | Gemini |
| I want you to go back to the following item from the response from 2 prompts ago: “n your notebook, you have a cell uploading ‘L-Protein Mutants - Sheet1.csv’, which contains experimental data like “Lysis” and “Protein Levels.” The goal of calculating effect_esm is often to see if the high model scores correlate with high experimental activity (efficacy) in the lab” Based on the effect_esm scores located in the final 2 cells, help interpret if or how the high model scores correlate with high experimental activity (efficacy) in the lab. Explain why there is (or isn’t correlation) based on these scores, and the underlying rationale(s) behind any/all correlation or lack thereof Do NOT hallucinate when answering this prompt | Gemini |
| In the cell containing ‘interactive_heatmap(protein_sequence)’ there’s a graph titled ‘Predicted Effects of Mutations on Protein Sequence (LLR)’. How is this graph supposed to be read? How does one find the transmembrane and soluble regions from this graph (if that’s something one can find on this graph)? If coordinates with a single letter and 2 digits (ex. K32) can be discerned from this graph, how can they be discerned? Do NOT hallucinate when answering this prompt | Gemini |
| METRFPQQSQQTPASTNRRRPFKHEDYPCRRQQRSSTLYVLIFLAIFLSKFTNQLLLSLLEAVIRTVTTLQQLLT Take the protein sequence above and confirm that the first 40 positions (1-40) are the soluble region and positions 41-75 are the transmembrane region. If this is correct, explain why, and if this is incorrect, explain why Do NOT hallucinate when answering this prompt | Gemini |
| Ok. So if I see a vertical selection in the ‘Predicted Effects of Mutations on Protein Sequence (LLR)’ graph located in the cell containing ‘interactive_heatmap(protein_sequence)’ that seems to have a mostly yellow-ish or light green hue to it, what does that mean? What does it imply for nth mutations that could occur at that specific position in the sequence? Do NOT hallucinate when addressing this prompt | Gemini |
| If the first position in the following sequence shows up as a dark blue/almost purple color in the ‘Predicted Effects of Mutations on Protein Sequence (LLR)’ graph located in the cell containing ‘interactive_heatmap(protein_sequence)’, does that indicate a conserved region, or a region that should NOT be subject to amino acid mutations? Do NOT hallucinate when answering this prompt | Gemini |
| Ok. So based on that logic, where/how do I find other conserved regions/essentially no go areas for amino acid mutations based on the information located in the ‘Predicted Effects of Mutations on Protein Sequence (LLR)’ graph located in the cell containing ‘interactive_heatmap(protein_sequence)’? Are these indicated by blue-ish or purple horizontal bands emanating from particular amino acid mutations located on the Y axis of the graph? Clarify these questions Do NOT hallucinate when answering this prompt | Gemini |
| Yes, identify the coordinates of these solid dark blue vertical columns | Gemini |
| Ok. I’d like you to take all the logic leading up to the creation of the ‘Predicted Effects of Mutations on Protein Sequence (LLR)’ graph located in the cell containing ‘interactive_heatmap(protein_sequence)’ and extend that to a new cell at the bottom of this notebook containing an almost 100% identical ‘Predicted Effects of Mutations on Protein Sequence (LLR)’ graph compared with the ‘Predicted Effects of Mutations on Protein Sequence (LLR)’ graph located in the cell containing ‘interactive_heatmap(protein_sequence)’. The only difference is that I want visual indicators (maybe vertical red lines) indicating the beginnings and ends of the respective soluble and transmembrane regions of the sequence. This would make it easier to distinguish things in the graph. Leave all other code in the notebook untouched. Just extend the code behind the creation of the ‘Predicted Effects of Mutations on Protein Sequence (LLR)’ graph located in the cell containing ‘interactive_heatmap(protein_sequence)’ and its underlying logic to a new cell at the bottom of this notebook. Do NOT hallucinate when creating this code | Gemini |
| Ok. So taking a look at the ‘Predicted Effects of Mutations on Protein Sequence (LLR)’ graph in the penultimate cell with the soluble and transmembrane regions, it looks like the following mutations are promising/favored: –Soluble Region (First F): Amino Acid Mutation Q –Soluble Region (First S): Amino Acid Mutation Q –Transmembrane Region (First C): Amino Acid Mutation L –Transmembrane Region (First C): Amino Acid Mutation R If you can give specific graph coordinates for each of the mutations listed above, do so. If there isn’t enough granularity in what was written above, indicate as such. Do NOT hallucinate when addressing this prompt | Gemini |
| Apologies, not understanding the following: –How is it that C29 sits in the Soluble N-terminal region if the positions on the graph indicate it is within the Transmembrane region? Is there something wrong with the graph? How can these points be reconciled? –Not seeing a second C at position 65 within the wild-type sequence (METRFPQQSQQTPASTNRRRPFKHEDYPCRRQQRSSTLYVLIFLAIFLSKFTNQLLLSLLEAVIRTVTTLQQLLT) Do NOT hallucinate when replying to this prompt. If you are at risk of hallucinating, indicate as such | Gemini |
| Ok. So not exactly following the logic behind the placement of the dashed lines indicating the positional start and the ends of the soluble and transmembrane regions based on the X axis information. By that logic it visually looks like the first C located within the wild-type sequence (METRFPQQSQQTPASTNRRRPFKHEDYPCRRQQRSSTLYVLIFLAIFLSKFTNQLLLSLLEAVIRTVTTLQQLLT) falls right inside the transmembrane region. Clarify what’s going on Do NOT hallucinate when answering this prompt | Gemini |
| Yeah that’s the issue. Taking a look at this excerpt from the answer to the last prompt and seeing the essence of the issue: “You will find that the C is the 29th letter. If the red line is to the right of that C, then the C is correctly in the Soluble region.” The red line is to the left of the C in question. Clarify what’s going on here Do NOT hallucinate when answering this prompt | Gemini |
| Yes, please provide this code block | Gemini |
| Please explain this error: | Gemini |
| For the mutations that are favored/more yellow colored in the ‘Corrected Protein Regions: Soluble v. Transmembrane’ graph located in cell ‘0ZrSuXEGIzsR’, what is the biological logic/rationale behind why the model is giving these mutations yellow colors? Is it binding ability counterbalanced against potential damage to the protein structurally or negative therapeutic effects (toxicity, etc.)? Help clarify this (or these) biological logic/rationales Do NOT hallucinate when addressing this prompt | Gemini |
| To clarify, when we say the term ‘residue’ in the context of proteins, are we referring to amino acid positions located within the wild-type sequence (METRFPQQSQQTPASTNRRRPFKHEDYPCRRQQRSSTLYVLIFLAIFLSKFTNQLLLSLLEAVIRTVTTLQQLLT)? Do NOT hallucinate when addressing this prompt | Gemini |
| Ok. Tell me about the following residues (including their formal names) and why mutating them would or might make sense or would be favorable within the context of the wild-type sequence (METRFPQQSQQTPASTNRRRPFKHEDYPCRRQQRSSTLYVLIFLAIFLSKFTNQLLLSLLEAVIRTVTTLQQLLT): –Soluble Region: F5, S9, C29 –Transmembrane Region: K50 Do NOT hallucinate when addressing this prompt | Gemini |
| Might there be a similar K50L-style trade-off for E61L? Why or why not? Do NOT hallucinate when addressing this query | Gemini |
| So according to the ‘functional defect’ logic described during the course of the last 2 prompts, which 2 alternate yellow-ish colored mutations located in the Transmembrane region would be ideal for mutation, that would NOT hinder lysing abilities (i.e. ability to kill desired cells)? Do NOT hallucinate when addressing this prompt | Gemini |
| The residue in location 52 is labeled T. Is that Alanine? Did you mean residue 62 when describing Alanine in your reply to the last prompt? | Gemini |
| My only concern with these chosen mutations in the transmembrane region is that they’re not exactly yellow. They seem to be shades of lighter green, which isn’t outright blue, but still not exactly screamingly positive Do NOT hallucinate when addressing this prompt | Gemini |
| Think the following mutations might be worth pursuing based on their color (see ‘Corrected Protein Regions: Soluble v. Transmembrane’ graph in penultimate cell in workbook as reference): Reference on how to read what I wrote regarding the ‘Soluble Region’ and ‘Transmembrane Region’ below: LETTER[NUMBER] (X Axis)_Letter (Y Axis) Soluble Region: –F5_R –S9_Q –C29_R Transmembrane Region: –L44_I –A62_V This is all based on the following wild-type sequence (METRFPQQSQQTPASTNRRRPFKHEDYPCRRQQRSSTLYVLIFLAIFLSKFTNQLLLSLLEAVIRTVTTLQQLLT) Want to go beyond color justification to talk about the benefits of each mutation from a structural and/or functional standpoint Do NOT hallucinate when addressing this prompt | Gemini |
| What is a thiol group in simple terms? Why would the swap out of the Cytesine for Ariginine in C29 –> R be useful due to Arginine’s positive charge? Explain in simple terms | Gemini |
| What is the lipid bilayer? How does it relate to A62_V? | Gemini |
| How do I make a multimeric assembly based on mutations to the wild-type sequence located under the ‘Input protein sequence(s), then hit Runtime -> Run all’ cell? Do I just add each mutated sequence next to each other separated by colons and go from there? Do NOT hallucinate when addressing this query | Gemini |
| Ok. Here’s my wild-type sequence: METRFPQQSQQTPASTNRRRPFKHEDYPCRRQQRSSTLYVLIFLAIFLSKFTNQLLLSLLEAVIRTVTTLQQLLT Output 5 individual/separate mutated sequences based on the wild sequence above on the following modifications per individual/separated sequence: –Change the ‘F’ in the 5th position left of the 1st ‘M’ to an ‘R’ –Change the ‘S’ in the 9th position left of the 1st ‘M’ to a ‘Q’ –Change the ‘C’ in the 29th position left of the 1st ‘M’ to an ‘R’ –Change the ‘L’ in the 44th position left of the 1st ‘M’ to an ‘I’ –Change the ‘A’ in the 62nd position left of the 1st ‘M’ to a ‘V’ Do NOT hallucinate when addressing this prompt | Gemini |
| Thank you. What does the ‘Sequence coverage’ graphic under the ‘Run Prediction’ cell mean/display exactly? Do NOT hallucinate when addressing this prompt | Gemini |
| What do the results located under the ‘Run Prediction’ and ‘Display 3D structure’ cells indicate about the mutated sequences inputted? Are they strong or weak in combination relative to the goal of improving the stability and autofolding of the Lysis protein in the MS2 bacteriophage (from which the original wild-type sequence originated). I believe the results seem to be suboptimal based on the shape and color outputted in the ‘Display 3D structure’ cell but I’m not sure if that’s the case, and if it is, why that’s the case Do NOT hallucinate when addressing this prompt | Gemini |
This Bacteriophage Engineering Group Project was completed by a select group of William & Mary Node students in March 2026 (Xavier Lewis-Palmer, Raphael Aca, Nana Agyei Afrane-Asare, and Jason Ross) ↩︎
This is a Markdown version of the “HTGAA_Bacteriophage Engineering Group Project Brainstorming Doc.__William & Mary Node” Google Doc. (https://docs.google.com/document/d/1676c1tgFUlGaP-Bwp9_vDexbk3VsOJeuQeylNfvz76o/edit?usp=sharing) ↩︎
Based on Opt. 1: Mutagenesis workflow in Protein Design II - Phage HW Sheet (https://docs.google.com/document/d/e/2PACX-1vSKF3Q5PY_T-McPiQoCVr6A9HpUxHedSAPmqikf9pHeoMM1Xt_EDAKOuUR0WlNMP-TZAMErUPbARhGh/pub) ↩︎