Week 10 — Advanced Imaging & Measurement Technology
Final Project Measurements
Measure Expression of Chromophore (tsPurple)
Need to characterize how much tsPurpse protein from the “paint” straing of my consortia expresses at varous times and under various inducer levels in order to create a controlled system where the “paint” strain can be used to color the stromatlight biofilm layers.
Since the expression will be in biofilm to measure this I will use reflected light and a standard digital raspberry pi camera. I will measure reflectance in the absorbing wavelength (590nm) and compare it to reflectance in a wavelength like (660/950nm) that is not absorbed by the tsPurple. Comparing these two should give a differntial comparison of light expression.
Measure Calcium Absorbance
In the mineralizing “glue” component of my consortia, the glue protein it generates should be able to bind Calcium ions to the negatively charged aspartic acid tail. I need to measure how much calcium the protein can bind by
- Grow multiple cultures that produce csgA and csgA + calcium binding tail.
- Mix known about of calcium into a solution and add to csgA and csgA + calcium tail cultures
- After some time centrigue the sampled down and extract supernatant and then pass it through a 22nm syringe filter
- Combine supernatant with Sodium Carbonate or some other reagent that causes the calcium to precipatate
- Centrifuge/filter out calcium carbonate and dry it.
- Weigh calcium carbonate to compute remaining amount of calcium and infer how much calcium was aborbed by protein.
DNA Edit verification
Send plasmids to a Sanger sequencing service to verify that they the expected sequence after all of the igem constructions.
Molecular Weight - Part 1
Use calculator
Using the specified sequence and online calculator link I get a results
I am assuing we want to include the histine tail in the weight. If I remove the tail I get:
Use Mass Spec
We attach random numbers of protons to the molecule and measure m/z ratios in the mass spectrometer. Because we know mass of proton, even though we don’t initially know the charge of each peak, we can solve for the charge of peak by looking at how the mass/charge ratio changes between peaks.
- Using peaks 875.4421 and 903.7418 implies the 875.4421 peak we get 31.9 which rounds to charge of 32/32 protons for peak 875.4421
- Using peaks 903.7148 and 933.7439 imples that the 930.7148 peak we get 21.06 which rounds to charge of 31/31 protons for peak 903.7148
This makes it looks method is consistent
Now that we have the charges for peaks we can go back and infer the mass to get
- 875.4421 * 32 - 32 = 27982 daltons
- 903.7418 * 31 - 31 = 27985 daltons
This gives an error of .085 percent which is pretty small.
While you could do the calcultions we just did for the zoomed in calculation I don’t think it would be very accurate because we need to divide by the difference between measurements and the difference between measurements here is quite small.
Molecular Weight - Part 2
Denatured proteins unfold back into their original linear state. Looking at the two diagrams I am guessing that the denatured protein tends to pick up proteins moe uniformly, while the native protein tends to have structured stable states where it picks up a lot of proteins? Not really sure though. Let me ask Gemini now: “How can you tell whether or not a protein is denatured with mass spec?”.
Yes Gemini verifies above and ties it to the exposed Lysines and Argines when you unfold.
Again I don’t think you can discern the charge state on the zoom in given how small the differenes are. Too make matters worse it is possible that the gap between charged states isn’t even +1 proton?
Molecular Weight - Part 3
Mark the R and K
MVSKGEELFTG VVPILVELDG DVNGHKSVS GEGEGDATYG KLTLKFICTT GKLPVPWPTL VTTLTYGVQC FSRYPDHMKQ HDFFKSAMPE GYVQERTIFF KDDGNYKTRA EVKFEGDTLV NRIELKGIDF KEDGNILGHK LEYNYNSHNV YIMADKQKNG IKVNFKIRHN IEDGSVQLAD HYQQNTPIGD GPVLLPDNHY LSTQSALSKD PNEK====RDHMVL LEFVTAAGIT LGMDELYKLE HHHHHH
Run peptide digest
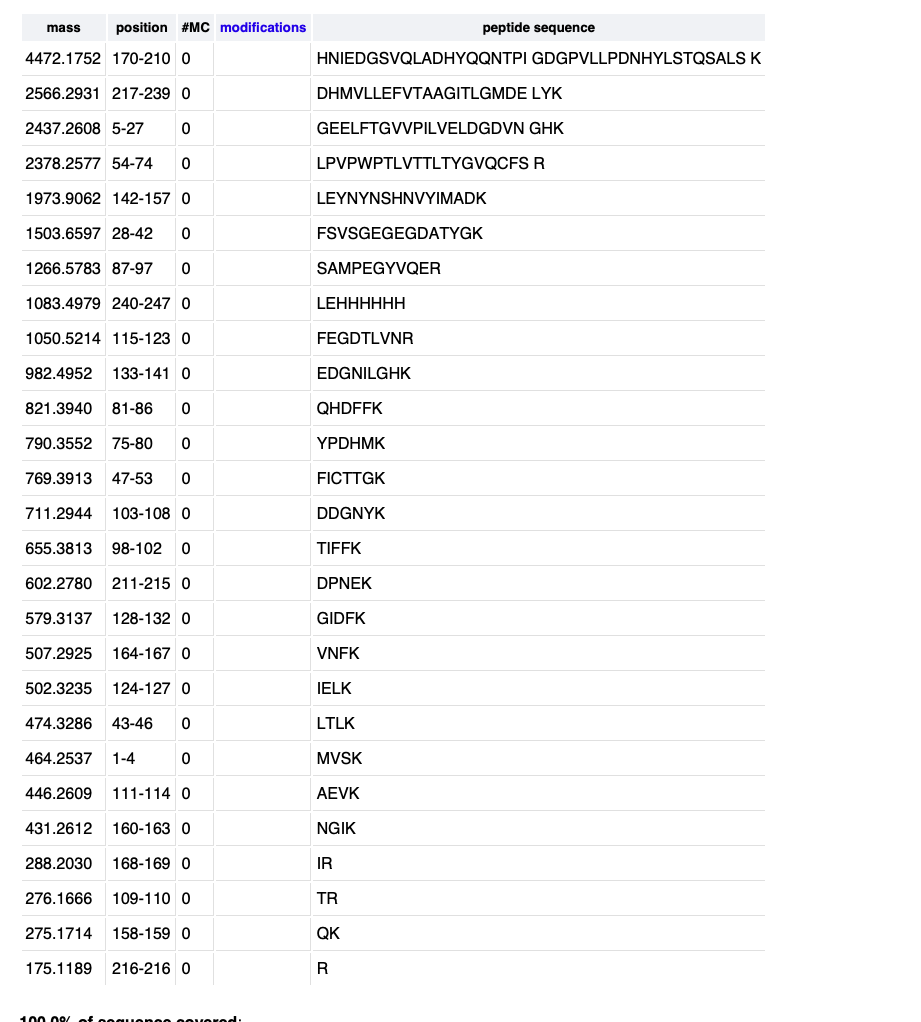
Peaks
I see 26 peaks in that range. It matches my digest size of 27 if I widern the range to include stuff below .5 also.
I thought you coulnd’t use the isotopic peaks to determine charge state, because you don’t know the isotopes and want the mass jumps would be. This is correct, but for biological molecues you can assume that you will usually have 1 dalton differences for C, N, O. If you have sulfur you could have two dalton jumps too, so you probably want to do multiples and looks for multiples before you average over set.
In this case you have two mass/charge ratios where you know the charge is the same and that the mass difference must be 1, so you can solve for charge state
- assume peak 525.7612 has some charge Z and mass M
- then peak 526.25918 has same charge Z but mass M+1
- So charge Z is 1/(526.25918-525.7612) = 2.008 so the charge is +2 protons
- This implies the mass M of this is 1051.52
- Which implies the mass of [M+H+] is 1052.52 as is M/Z since Z is 1 in this case.
Given this I the closest peptide mass is 1050.5214 for peptide FEGDTLVNR. So the error is .19 percent.
Reading the last figure it looks like 88 percent of the peptide is covered.
Molecular Weight - Part 4
This section is using charge detetion mass spec, which measures charge and m/z for a single ion, so it can directly compute the mass instead of infer it from charge states and assumptions about distributions. This is important for very large molecues (like viruses) where the incremental change between charge peaks is so small because the mass is so high relative to the charge that you can’t resolve the difference between the peaks.
This means answering this question about matching peaks to oligmers is just a matter of computuing masses.
Masses of units are
7FU 340 kDa
8FU 400 kDa
7FU Decamer, 10 units of 7FU so 3.5 MDa, which is closest to the 3.4 MDa peak
8FU Didecamer, 10 units of 8FU so 4 MDa, which is closest to the 4.013 MDa peak and about twice as frequent as 7FU Decamer
8FU 3-Decamer, 30 units of 8FU so 12 MDa, which is closest to the 12.67 MDa peak
8FU 4-Decamer, 50 units of 8FU so 16MDa, which is a small bump that isn’t labeled, which implies the 4-decamer is not very frequent in this particular sample
Molecular Weight - Part 5
I wasn’t in the lab so just repeating above.
| Theoretical | Observed/measured on the Intact LC-MS | PPM Mass Error | |
|---|---|---|---|
| Molecular weight (kDa) | 28006.60 | 27982 | 850 |
Theoretical was
Gemini Questions
- Are there standard ways to generate light with different wavelengths I need (using tsPurple), i.e. filters or different lens or light through prism/grating?
- What is adjacent charge state approach?
- Can you use isotopic measurements to calculate the charge state? I would think for an unknown material you wouldn’t know the charge/mass gaps between the different isotopes, so you couldn’t solve for the charge state.
- What is charge detection mass spec?