Week 10 HW: Advanced Imaging & Measurement Technology
Please identify at least one (ideally many) aspect(s) of your project that you will measure. It could be the mass or sequence of a protein, the presence, absence, or quantity of a biomarker, etc.
The main aspect to be measured is the expression and activity of the biosynthetic gene cluster (BGC). This includes:
- Presence and expression of BGC-associated enzymes
- Production of candidate metabolites
- Antibacterial activity against Leptospira
Please describe all of the elements you would like to measure, and furthermore describe how you will perform these measurements.
- BGC enzyme expression: Measured using Western blot to confirm protein presence and approximate expression levels.
- Metabolite production: Measured using LC-MS to detect and quantify candidate compounds produced by the BGC.
- Antibacterial activity: Evaluated through antibiograms to assess inhibition of Leptospira growth.
What are the technologies you will use (e.g., gel electrophoresis, DNA sequencing, mass spectrometry, etc.)? Describe in detail.
- Western blot: To detect specific proteins encoded by the BGC after separation by gel electrophoresis.
- Gel electrophoresis: For protein separation prior to blotting.
- LC-MS (Liquid Chromatography–Mass Spectrometry): Main analytical technique to identify and quantify metabolites based on retention time and mass-to-charge ratio.
- Antibiogram assays: To determine the antibacterial effectiveness of produced compounds.
PART 1
Based on the predicted amino acid sequence of eGFP (see below) and any known modifications, what is the calculated molecular weight? You can use an online calculator like the one at https://web.expasy.org/compute_pi/
MVSKGEELFTG VVPILVELDG DVNGHKFSVS GEGEGDATYG KLTLKFICTT GKLPVPWPTL VTTLTYGVQC FSRYPDHMKQ HDFFKSAMPE GYVQERTIFF KDDGNYKTRA EVKFEGDTLV NRIELKGIDF KEDGNILGHK LEYNYNSHNV YIMADKQKNG IKVNFKIRHN IEDGSVQLAD HYQQNTPIGD GPVLLPDNHY LSTQSALSKD PNEKRDHMVL LEFVTAAGIT LGMDELYKLE HHHHHH
Based on the website provided, the molecular weight is 26.94 kDa, which does not consider the linker and His tag. If we consider them, the new MW will then be 28 kDa. The former value is consistent with other GPFs from other databases such as Q9U6Y4 (26.17 kDa), P42212 (26.89 kDa) and Q9GZ28 (25.91 kDa).
Based on the predicted amino acid sequence of eGFP (see below) and any known modifications, what is the calculated molecular weight? You can use an online calculator like the one at https://web.expasy.org/compute_pi/
The expression is:
$ z = \frac{m/z_{n+1}}{\left(\frac{m}{z_n} - \frac{m}{z_{n+1}}\right)} $Then, considering peaks such as 800.5508 and 824.0635, $z$ is equal to 34.047.
Then, the molecular weight is given by:
$ MW = z \cdot \left(\frac{m}{z_n} - 1\right) $ $ MW = 34.047 \cdot (824.0635 - 1) = 28{,}023.329 \ \text{Da} = 28.02 \ \text{kDa} $With these values, the accuracy will be:
$ \frac{28.02 - 28}{28} = 7.14 \times 10^{-4} = 714 ppm $Can you observe the charge state for the zoomed-in peak in the mass spectrum for the intact eGFP? If yes, what is it? If no, why not?
The peak has an approximate value of 1473.74, and the neighboring peaks are 1473.88 and 1473.79. Given that the difference in the peaks is equal to the amount of charges, subrstracting the values gives:
$ 1473.88-1473.74 =0.06; \frac{1}{z} = 0.06; z \approx 17 $PART 2
Based on learnings in the lab, please explain the difference between native and denatured protein conformations. For example, what happens when a protein unfolds? How is that determined with a mass spectrometer? What changes do you see in the mass spectrum between the native and denatured protein analyses (Figure 2)?
When a protein unfolds, it allows external ions to interact with the structure through ion-molecule interactions such as ion-dipole forces. This increases the amount of charges and, therefore, the number of peaks, which is why it is shown a broader spectrum in the denatured protein than that of the native protein.
Zooming into the native mass spectrum of eGFP from the Waters Xevo G3 QTof MS (see Figure 3), can you discern the charge state of the peak at ~2800? What is the charge state? How can you tell?
Yes. Since the differences between peaks is around 0.1, the charge state is approximately +10.
PART 3
How many Lysines (K) and Arginines (R) are in eGFP? Please circle or highlight them in the eGFP sequence given in Waters Part I question 1 above. (Note: adding the sequence to Benchling as an amino acid file and clicking biochemical properties tab will show you a count for each amino acid).
MVS K GEELFTG VVPILVELDG DVNGH K FSVS GEGEGDATYG K LTL K FICTT G K LPVPWPTL VTTLTYGVQC FS R YPDHM K Q HDFF K SAMPE GYVQE R TIFF K DDGNY K T R A EV K FEGDTLV N R IEL K GIDF K EDGNILGH K LEYNYNSHNV YIMAD K Q K NG I K VNF K I R HN IEDGSVQLAD HYQQNTPIGD GPVLLPDNHY LSTQSALS K D PNE K R DHMVL LEFVTAAGIT LGMDELY K LE HHHHHH
Number of Lysines: 20 Number of Arginines: 6
How many peptides will be generated from tryptic digestion of eGFP?
Based on the website provided, there will be 19 fragments
Based on the LC-MS data for the Peptide Map data generated in lab (please use Figure 5a as a reference) how many chromatographic peaks do you see in the eGFP peptide map between 0.5 and 6 minutes? You may count all peaks that are >10% relative abundance.
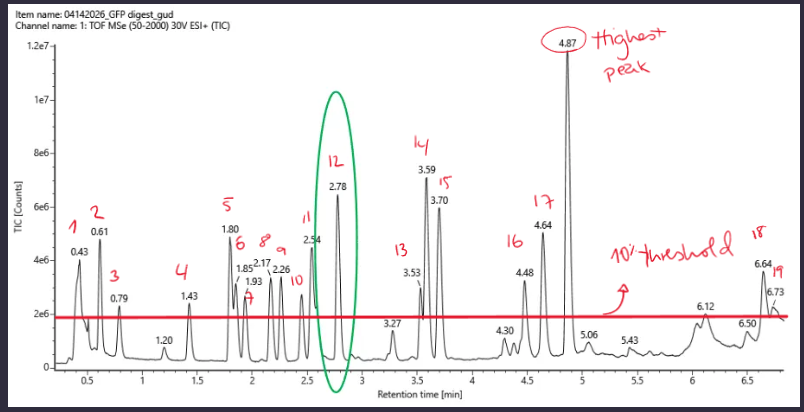
There are around 19 peaks based on the 10% of the highest peak which is 4.87.
Assuming all the peaks are peptides, does the number of peaks match the number of peptides predicted from question 2 above? Are there more peaks in the chromatogram or fewer?
Yes, there are around 19 peaks which match the number of fragments on the previous question.
Identify the mass-to-charge of the peptide shown in Figure 5b. What is the charge of the most abundant charge state of the peptide? (Use the separation of the isotopes to determine the charge state). Calculate the mass of the singly charged form of the peptide based on its mass-to-charge ration and charge state
The observed m/z is 525.76.
The isotope spacing is:
$\Delta (m/z) = 0.499 $Therefore, the charge state is:
$z \approx 2 $The neutral mass is:
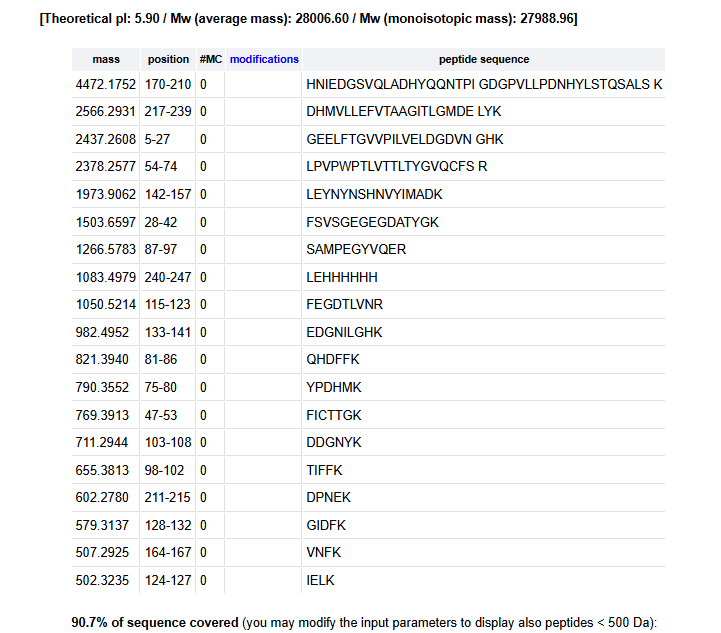
$M = (m/z)\cdot z - z \cdot 1.007 = 1049.51 \ \text{Da} $6. Identify the peptide based on comparison to expected masses in the PeptideMass tool. What is mass accuracy of measurement? Please calculate the error in ppm
Based on Figure 1, the closest match is the peptide is FEGDTLVNR with a mass of 1050.42 Da.
The accuracy is therefore:
$ \frac{1050.42 - 1049.51}{1050.42} = 8.66 \times 10^{-4} = 866.32 ppm $The calculated mass error is approximately 866 ppm, which is significantly higher than expected . This suggests that the peptide assignment (FEGDTLVNR) may be incorrect or that there is a mismatch between the experimental and theoretical mass definitions.
What is the percentage of the sequence that is confirmed by peptide mapping?
Based on the website, the coverage is at aroun 90.7%.
PART 4
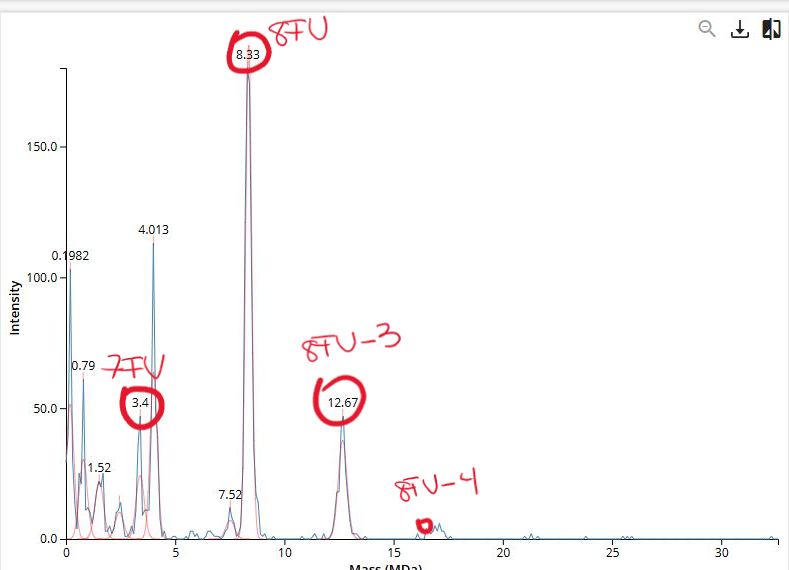
The Subunits are given in the following table:
Table 1. Oligomers and masses.
| Oligomeric Species | # Subunits | Subunit Mass (kDa) | Total Mass (kDa) | Total Mass (MDa) |
|---|---|---|---|---|
| 7FU Decamer | 10 | 340 | 3400 | 3.4 |
| 8FU Didecamer | 20 | 400 | 8000 | 8.0 |
| 8FU 3-Decamer | 30 | 400 | 12000 | 12.0 |
| 8FU 4-Decamer | 40 | 400 | 16000 | 16.0 |
Therefore, the following figure identifies the associated peaks:
PART 5
Please fill out this table with the data you acquired from the lab work done at the Waters Immerse Lab in Cambridge, or else the data screenshots in this document if you were unable to have lab work done at Waters.
Table 2. PPM mass error
| Theoretical (kDa) | Observed / Measured (kDa) | PPM Mass Error | |
|---|---|---|---|
| Molecular weight (kDa) | 28.00 | 28.02 | 714 |