Week 10: Imaging and Measurement
Week 10: Imaging and Measurement
title: “Week 10 — Advanced Imaging & Measurement Technology”
linkTitle: “Week 10 (Apr 7)”
weight: 200
description: |
Advanced Imaging & Measurement Tech (Evan Daugharthy, Waters Corp.)
Lab: Mass Spectrometry
This lecture presents a range of advanced technologies to do precision measurement of proteins at atomic scales, characterizing chemical composition, and detecting protein sequence and structure.
Lecture (Tues, Apr 7)
Advanced Imaging & Measurement Tech
(▶️Recording)
Evan Daugharthy, Lindsay Morrison.
Recitation (Wed, Apr 8)
Mass spectrometry
(▶️Recording | 💻Slides)
Waters Corp. Team
Lab (Thurs-Fri, Apr 9 - 10)
Homework — DUE BY START OF Apr 14 LECTURE
Homework is partly based on data that will be generated in the Waters Immerse Lab in Cambridge, MA. Students will characterize green fluorescent protein (eGFP, a recombinant protein standard) structure (primary, secondary/tertiary) in the lab using liquid chromatography and mass spectrometry, as well as Keyhole Limpet Hemocyanin (KLH) oligomeric states using charge detection mass spectrometry (CDMS). Data generated in the lab needed to do the homework is included both within this document and in the Appendix of the laboratory protocol.
Homework: Final Project
Assignees for the following sections
| MIT/Harvard students | Required |
| Committed Listeners | Required |
For your final project:
- Please identify at least one (ideally many) aspect(s) of your project that you will measure. It could be the mass or sequence of a protein, the presence, absence, or quantity of a biomarker, etc.
As I will be dopaminergically differentiating PC12 cells via mRNA approach, the first aspect for measurement in my project is to measure the quantity of dopamine released by PC12 cells into surrounding media. To measure dopamine concentration, I will need to measure with ELISA, which is an enzyme linked immunosorbent assay that is a plate-based quantitative immunoassay.
From Thermo Fisher’s ELISA kit, there are roughly 7 steps for the instant ELISA kits, from rehydration of standard and sample wells on plate, to incubation, to washing, adding TMB substrate, adding stop solution, and then to calculate results.
Absorbance is read at 450 nm on the Spark plate reader, and dopamine concentration will be calculated from a standard curve from the known dopamine concentrations ranging from 0 to 50 nM.
Expected range of dopamine should be 3- 50 nM and co-transfected wells with Nurr1-GFP and FoxA2 RFP will be 3-5x above negative control if we follow Kim et al (2017) closely.
- Please describe all of the elements you would like to measure, and furthermore describe how you will perform these measurements.
After successful transfection of my fusion proteins Nurr1+GFP and FoxA2+RFP, other elements I’m planning to measure will also include the presence of GFP and RFP florescence as measurements and validations for subcellular localizaiton of these fusion proteins in PC12 cells. Their presence will help confirm that the mRNA constructs were successfully taken up and translated into protein and localized to nucleus. This means dopamine synthesis will be activated in PC12 cells. This can be measured via live florescence microscopy and quantitative plate reader. One example will be use florescene microscopy where it will illuminate a sample with a specific wavelength of light, which will cause tagged structures (fluorophores) to emit a lower-energy glow that reveals specific cellular components. The expected results is to see GFP excited at ~488 nm and emitting at ~520 nm, whereas RFP will be excited at ~555 nm and emitting at ~610 nm. If GFP and RFP are both present and successfully transfected, the nucleus of these cells should overlay green and red to show a bit of yellow in the nucleus.
- What are the technologies you will use (e.g., gel electrophoresis, DNA sequencing, mass spectrometry, etc.)? Describe in detail.
I will be using ELISA kit, Spark plate reader, and florescence microscopy as mentioned above (description also above).
Homework: Waters Part I — Molecular Weight
Assignees for the following sections
| MIT/Harvard students | Required |
| Committed Listeners | Required |
We will analyze an eGFP standard on a Waters Xevo G3 QTof MS system to determine the molecular weight of intact eGFP and observe its charge state distribution in the native and denatured (unfolded) states. The conditions for LC-MS analysis of intact protein cause it to unfold and be detected in its denatured form (due to the solvents and pH used for analysis).
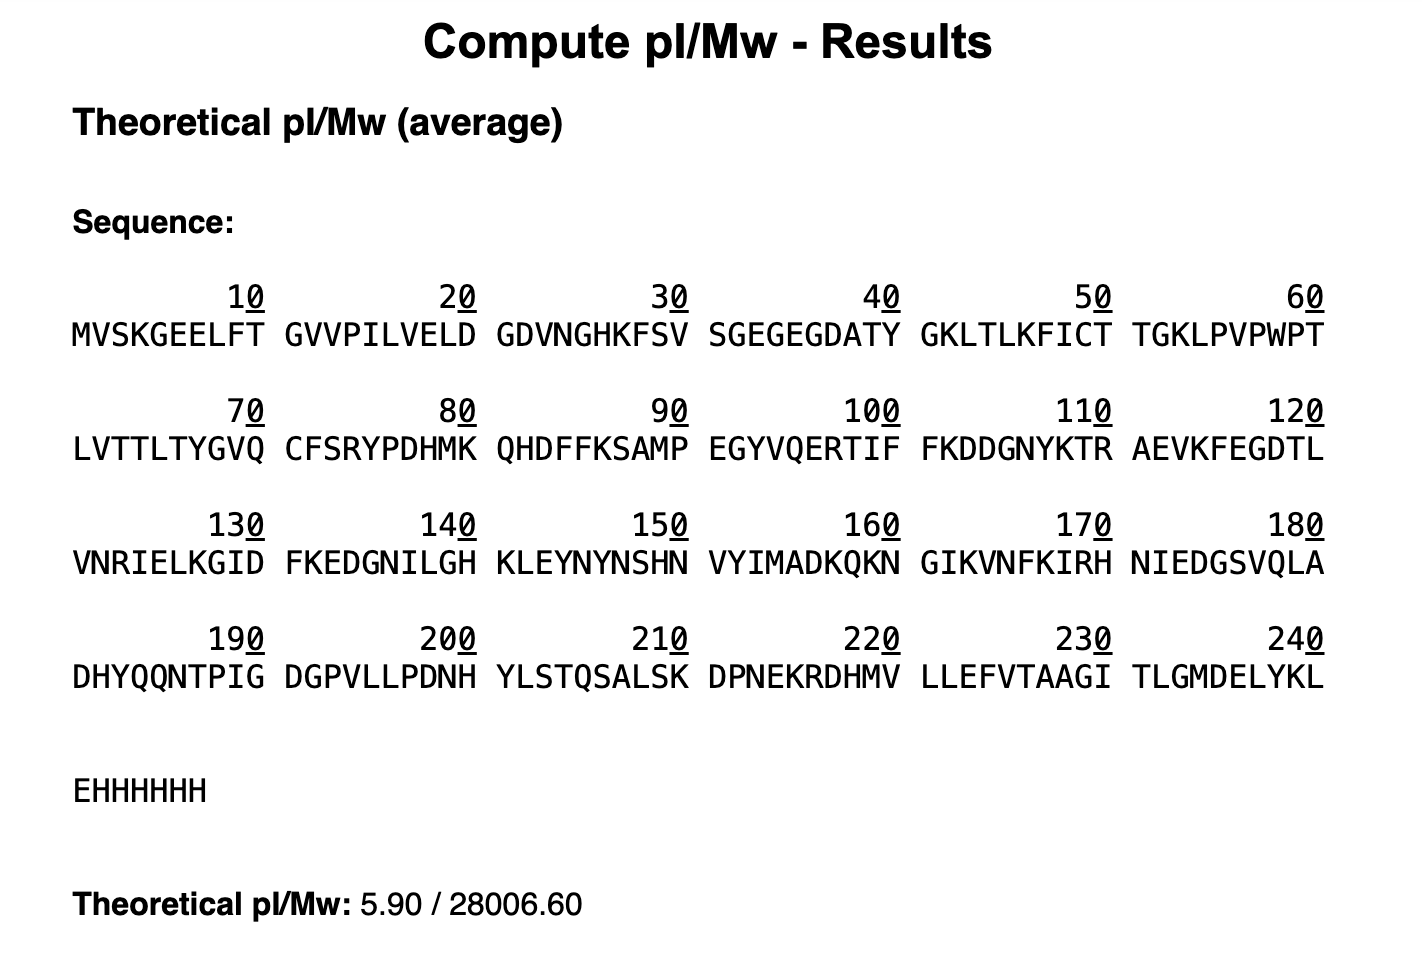
- Based on the predicted amino acid sequence of eGFP (see below) and any known modifications, what is the calculated molecular weight? You can use an online calculator like the one at https://web.expasy.org/compute_pi/
eGFP Sequence:
MVSKGEELFTG VVPILVELDG DVNGHKFSVS GEGEGDATYG KLTLKFICTT GKLPVPWPTL VTTLTYGVQC FSRYPDHMKQ HDFFKSAMPE GYVQERTIFF KDDGNYKTRA EVKFEGDTLV NRIELKGIDF KEDGNILGHK LEYNYNSHNV YIMADKQKNG IKVNFKIRHN IEDGSVQLAD HYQQNTPIGD GPVLLPDNHY LSTQSALSKD PNEKRDHMVL LEFVTAAGIT LGMDELYKLE HHHHHH
Note: This contains a His-purification tag (HHHHHH) and a linker (theLEbefore it).
- Calculate the molecular weight of the eGFP using the adjacent charge state approach described in the recitation. Select two charge states from the intact LC-MS data (Figure 1) and:
- Determine $z$ for each adjacent pair of peaks $(n, n+1)$ using: $$ {\large z} = {\Large \frac{\frac{m}{z_{n+1}}}{\frac{m}{z_n} - \frac{m}{z_{n+1}}}} $$
I selected these two peaks: Peak 1 (n): m/z = 933.7349 Peak 2 (n+1): m/z = 903.7148
Because mass is constant and m/z decreases as charge increases, the higher m/z peak (933.7349) carries the lower charge. Plugging into the formula: z=903.7148933.7349−903.7148=903.714830.0201=30.10≈30z = \frac{903.7148}{933.7349 - 903.7148} = \frac{903.7148}{30.0201} = 30.10 \approx 30z=933.7349−903.7148903.7148=30.0201903.7148=30.10≈30 So the charge state of the 903.7148 peak is z = 30, and the adjacent 933.7349 peak is z = 29.
- Determine the MW of the protein using the relationship between $\frac{m}{z_n}$, $MW$, and $z$
Each charge state arises from protons (mass = 1.00728 Da) attaching to the protein, so: M=(mz)×z − (z×1.00728)M = \left(\frac{m}{z}\right) \times z \ - \ (z \times 1.00728)M=(zm)×z − (z×1.00728) For the z = 30 peak (m/z = 903.7148): M=(903.7148×30) − (30×1.00728)M = (903.7148 \times 30) \ - \ (30 \times 1.00728)M=(903.7148×30) − (30×1.00728) =27,111.444 − 30.218=27,081.23 Da= 27{,}111.444 \ - \ 30.218 = \textbf{27,081.23 Da}=27,111.444 − 30.218=27,081.23 Da For the z = 29 peak (m/z = 933.7349): M=(933.7349×29) − (29×1.00728)M = (933.7349 \times 29) \ - \ (29 \times 1.00728)M=(933.7349×29) − (29×1.00728) =27,078.312 − 29.211=27,049.10 Da= 27{,}078.312 \ - \ 29.211 = \textbf{27,049.10 Da}=27,078.312 − 29.211=27,049.10 Da The difference between these two values is only 0.032 Da
- Calculate the accuracy of the measurement using the deconvoluted MW from 2.2 and the predicted weight of the protein from 2.1 using:
$$ \text{Accuracy} = \frac{|MW_{\text{experiment}} - MW_{\text{theory}}|}{MW_{\text{theory}}} $$
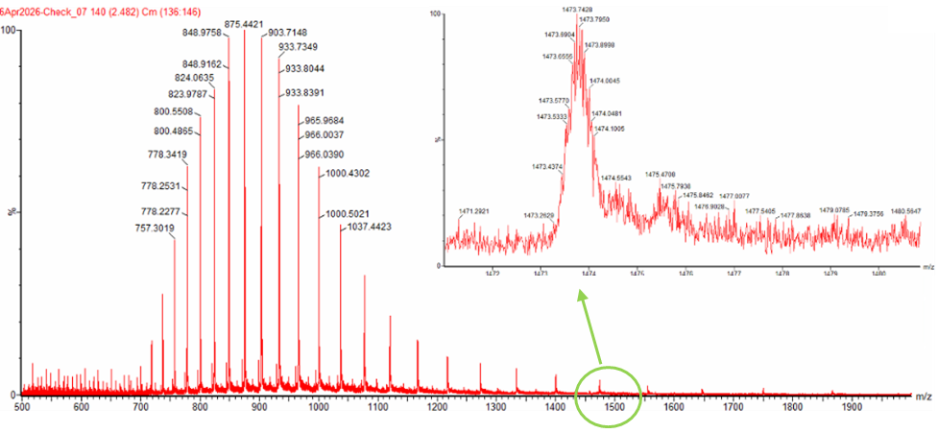
Figure 1. Mass Spectrum of intact eGFP protein from the Waters Xevo G3 LC-MS (a mass spectrometer with 30,000 resolution) with individual charge state peaks labeled with $\frac{m}{z}$ values.
Taking the average of the two calculated masses as the experimental MW: MWexp=27,081.23+27,049.102=27,065.16 DaMW_{\text{exp}} = \frac{27{,}081.23 + 27{,}049.10}{2} = 27{,}065.16 \ \text{Da}MWexp=227,081.23+27,049.10=27,065.16 Da Comparing to the theoretical MW of 26,941.48 Da: Accuracy=∣27,065.16−26,941.48∣26,941.48=123.6826,941.48=0.00459=4,591 ppm\text{Accuracy} = \frac{|27{,}065.16 - 26{,}941.48|}{26{,}941.48} = \frac{123.68}{26{,}941.48} = 0.00459 = \textbf{4,591 ppm}Accuracy=26,941.48∣27,065.16−26,941.48∣=26,941.48123.68=0.00459=4,591 ppm
- Can you observe the charge state for the zoomed-in peak in the mass spectrum for the intact eGFP? If yes, what is it? If no, why not?
No charge state cannot be seen from zoomed-in peak alone. The zoomed-in peak reveals the pattern of the charge state, but the charge state is determined by comparing the spacing between adjacent charge-state peaks in the full spectrum.
Homework: Waters Part II — Secondary/Tertiary structure
Assignees for the following sections
| MIT/Harvard students | Optional but highly recommended |
| Committed Listeners | Optional but highly recommended |
We will analyze eGFP in its native, folded state and compare it to its denatured, unfolded state on a quadrupole time-of-flight MS. We will be doing MS-only analysis (no liquid chromatography, also known as “direct infusion” experiments) on the Waters Xevo G3-QToF MS.
- Based on learnings in the lab, please explain the difference between native and denatured protein conformations. For example, what happens when a protein unfolds? How is that determined with a mass spectrometer? What changes do you see in the mass spectrum between the native and denatured protein analyses (Figure 2)?
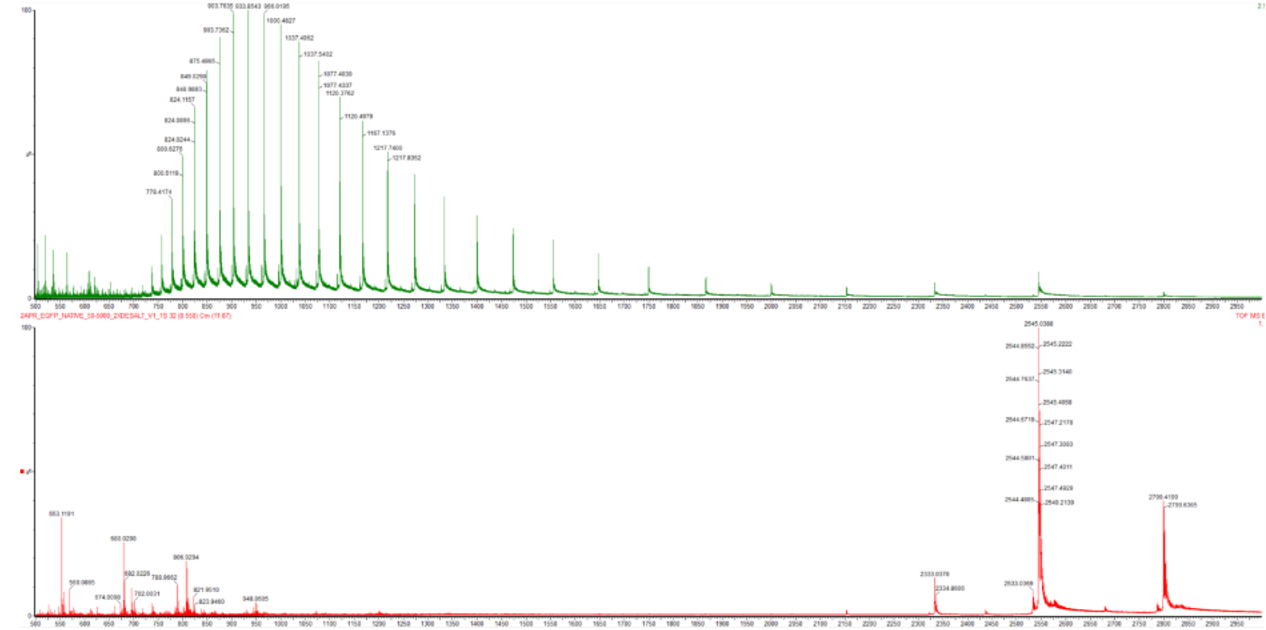
Figure 2. Comparison of the mass spectra between denatured (top) and native (bottom) eGFP standard on the Waters Xevo G3 QTof MS.
In their native state proteins retain their three dimensional architecture , the secondary structures (helices and sheets), the overall folded shape (tertiary structure), and any multi-subunit assemblies (quaternary structure) are all intact. When a protein denatures, all those structures collapses and it reverts to a loose, unfolded chain , essentially just its primary sequence with no organised shape remaining. unfolded proteins expose their hydrophobic surfaces so bonds are broken and charge states are more generated
- Zooming into the native mass spectrum of eGFP from the Waters Xevo G3 QTof MS (see Figure 3), can you discern the charge state of the peak at ~2800 $\frac{m}{z}$? What is the charge state? How can you tell?
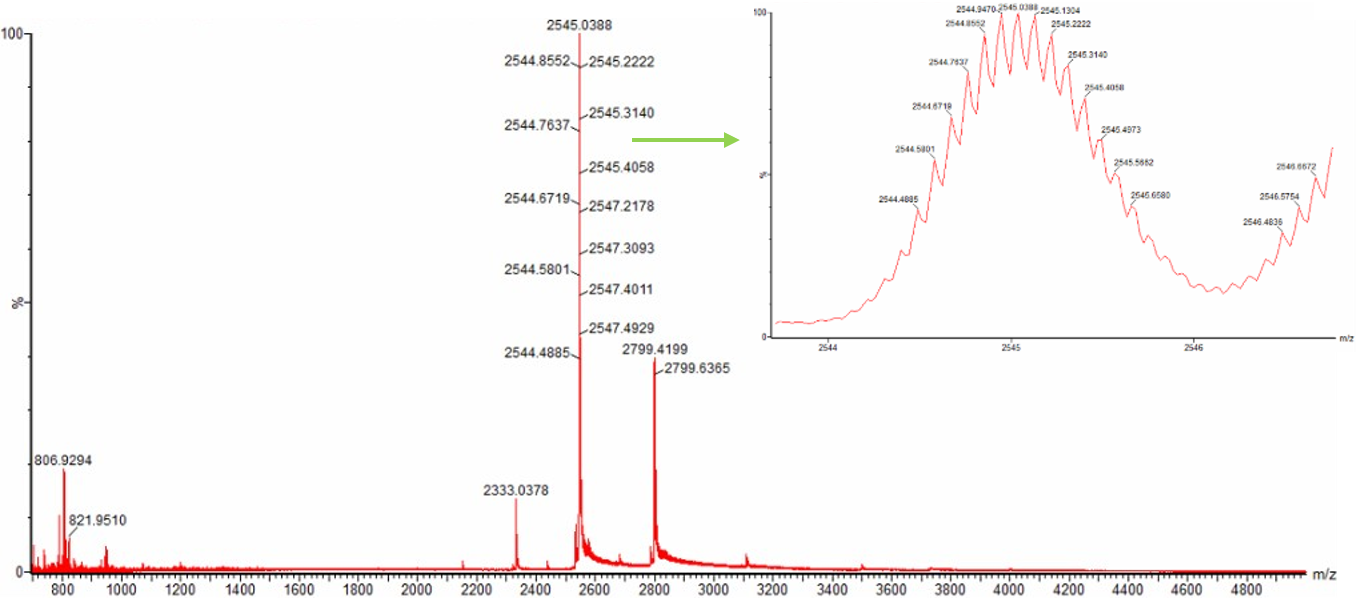
Figure 3. Native eGFP mass spectrum from the Waters Xevo G3 Q-Tof MS. The inset is a zoomed-in view of the charge state at ~2800 $\frac{m}{z}$ on a mass spectrometer with 30,000 resolution.
skipped…
Homework: Waters Part III — Peptide Mapping - primary structure
Assignees for the following sections
| MIT/Harvard students | Required |
| Committed Listeners | Required |
We will digest the eGFP protein standard into peptides using trypsin (an enzyme that selectively cleaves the peptide bond after Lysine (K) and Arginine (R) residues. The resulting peptides will be analyzed on the Waters BioAccord LC-MS to measure their molecular weights and fragmented to confirm the amino acid sequence within each peptide – generating a “peptide map”. This process is used to confirm the primary structure of the protein.
There are a variety of tools available online to calculate protein molecular weight and predict a list of peptides generated from a tryptic digest. We will be using tools within the online resource Expasy (the bioinformatics resource portal of the Swiss Institute of Bioinformatics (SIB)) to predict a list of tryptic peptides from eGFP.
- How many Lysines (K) and Arginines (R) are in eGFP? Please circle or highlight them in the eGFP sequence given in Waters Part I question 1 above. (Note: adding the sequence to Benchling as an amino acid file and clicking biochemical properties tab will show you a count for each amino acid).
From Benchling:
Amino Acid Frequencies Amino acid Count Ala A 8 3.2% Arg R 6 2.4% Asn N 13 5.3% Asp D 18 7.3% Cys C 2 0.8% Gln Q 8 3.2% Glu E 17 6.9% Gly G 22 8.9% His H 15 6.1% Ile I 12 4.9% Leu L 22 8.9% Lys K 20 8.1% Met M 6 2.4% Phe F 12 4.9% Pro P 10 4.0% Ser S 10 4.0% Thr T 16 6.5% Trp W 1 0.4% Tyr Y 11 4.5% Val V 18 7.3% Pyl O 0 0.0% Sec U 0 0.0%
There are 20 Lysines (K) and 6 Arginines (R) in eGFP.
- How many peptides will be generated from tryptic digestion of eGFP?
Navigate to https://web.expasy.org/peptide_mass/
Copy/paste the sequence above into the input box in the PeptideMass tool to generate expected list of peptides.
Use Figure 4 below as a guide for the relevant parameters to predict peptides from eGFP.
Click “Perform the Cleavage” button in the PeptideMass tool and report the number of peptides generated when using trypsin to perform the digest.
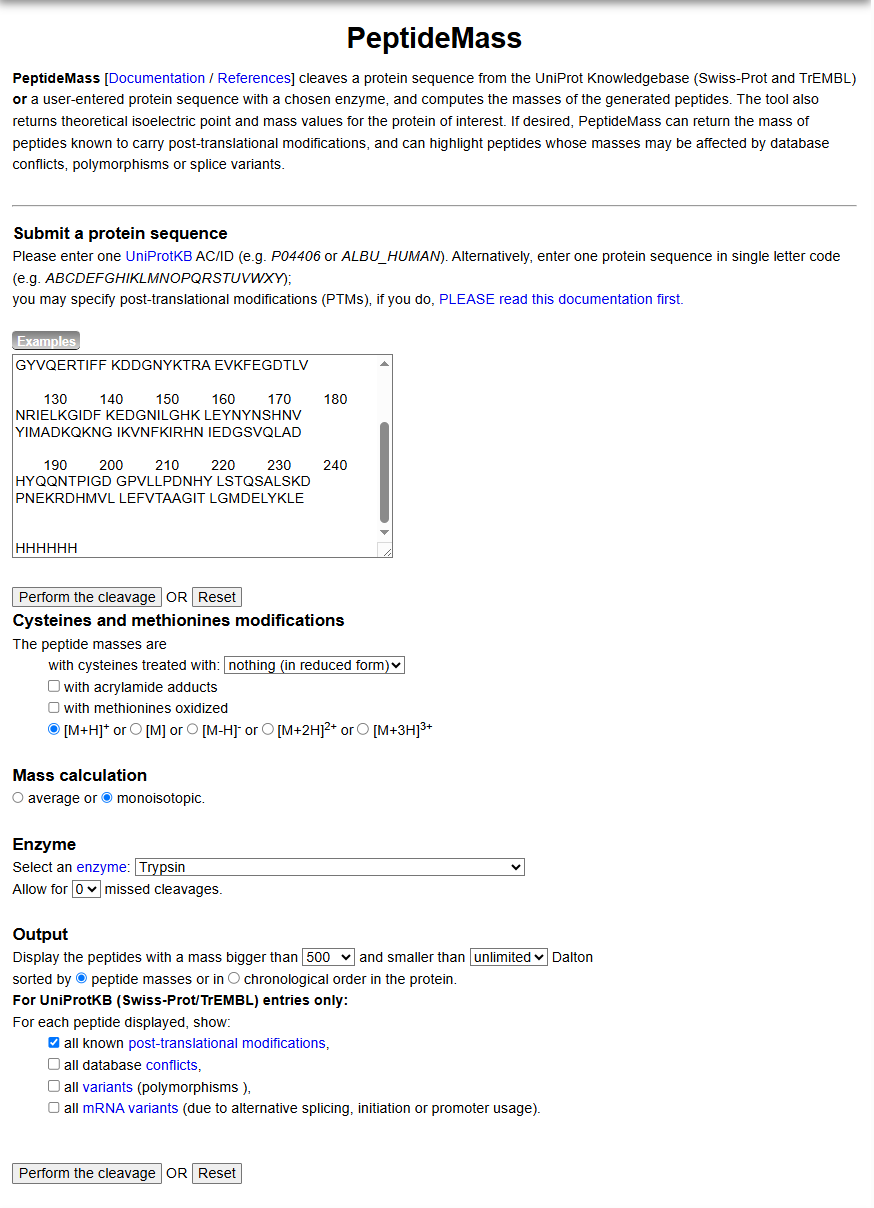
Figure 4. Example conditions for predicting the number of tryptic peptides from the eGFP standard. Please replicate all parameters shown above.
19 peptides are over 500Da and the predicted coverage for the detected peptides is 90.7%.
Sequence: 10 20 30 40 50 60 MVSKGEELFT GVVPILVELD GDVNGHKFSV SGEGEGDATY GKLTLKFICT TGKLPVPWPT
70 80 90 100 110 120
LVTTLTYGVQ CFSRYPDHMK QHDFFKSAMP EGYVQERTIF FKDDGNYKTR AEVKFEGDTL
130 140 150 160 170 180
VNRIELKGID FKEDGNILGH KLEYNYNSHN VYIMADKQKN GIKVNFKIRH NIEDGSVQLA
190 200 210 220 230 240
DHYQQNTPIG DGPVLLPDNH YLSTQSALSK DPNEKRDHMV LLEFVTAAGI TLGMDELYKL
EHHHHH
Selected enzyme: Trypsin Maximum number of missed cleavages (MC): 0 Cysteines modifications: All cysteines in reduced form Methionines modifications: Methionines have not been oxidized. Mass of displayed peptides:
500 Dalton Mass calculation: Using monoisotopic masses of the occurring amino acid residues and giving peptide masses as [M+H]+. Peptide masses for your input sequence
[Theoretical pI: 5.84 / Mw (average mass): 27869.46 / Mw (monoisotopic mass): 27851.90]
mass position #MC modifications peptide sequence 4472.1752 170-210 0 HNIEDGSVQLADHYQQNTPI GDGPVLLPDNHYLSTQSALS K 2566.2931 217-239 0 DHMVLLEFVTAAGITLGMDE LYK 2437.2608 5-27 0 GEELFTGVVPILVELDGDVN GHK 2378.2577 54-74 0 LPVPWPTLVTTLTYGVQCFS R 1973.9062 142-157 0 LEYNYNSHNVYIMADK 1503.6597 28-42 0 FSVSGEGEGDATYGK 1266.5783 87-97 0 SAMPEGYVQER 1050.5214 115-123 0 FEGDTLVNR 982.4952 133-141 0 EDGNILGHK 946.4390 240-246 0 LEHHHHH 821.3940 81-86 0 QHDFFK 790.3552 75-80 0 YPDHMK 769.3913 47-53 0 FICTTGK 711.2944 103-108 0 DDGNYK 655.3813 98-102 0 TIFFK 602.2780 211-215 0 DPNEK 579.3137 128-132 0 GIDFK 507.2925 164-167 0 VNFK 502.3235 124-127 0 IELK
90.7% of sequence covered (you may modify the input parameters to display also peptides < 500 Da):
- Based on the LC-MS data for the Peptide Map data generated in lab (please use Figure 5a as a reference) how many chromatographic peaks do you see in the eGFP peptide map between 0.5 and 6 minutes? You may count all peaks that are >10% relative abundance.
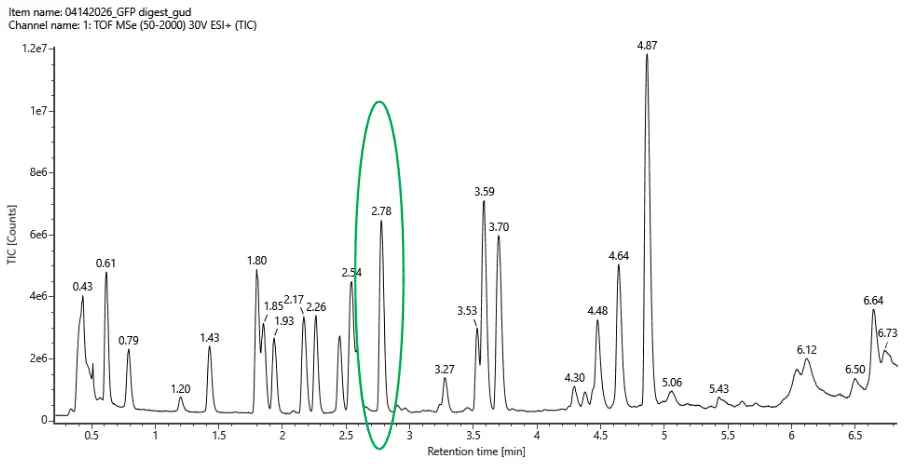
Figure 5a. Total ion chromatogram (TIC) of the eGFP peptide map. The peak at 2.78 minutes is circled, and its MS data is shown in the mass spectrum in Figure 5b, below.
Counting across the 0.5–6 minute window, there are roughly 20 peaks visible above the 10% relative abundance threshold.
- Assuming all the peaks are peptides, does the number of peaks match the number of peptides predicted from question 2 above? Are there more peaks in the chromatogram or fewer?
Pretty much, 20 observed peaks versus 19 predicted peptides is quite close. The slight excess is normal in LC-MS experiments, where things like background noise, trace impurities, or the occasional missed cleavage by trypsin can produce an extra signal or two.
- Identify the mass-to-charge ($\frac{m}{z}$) of the peptide shown in Figure 5b. What is the charge ($z$) of the most abundant charge state of the peptide (use the separation of the isotopes to determine the charge state). Calculate the mass of the singly charged form of the peptide ($\small{[M\!\!+\!\!H]^+}$) based on its $\frac{m}{z}$ and $z$.
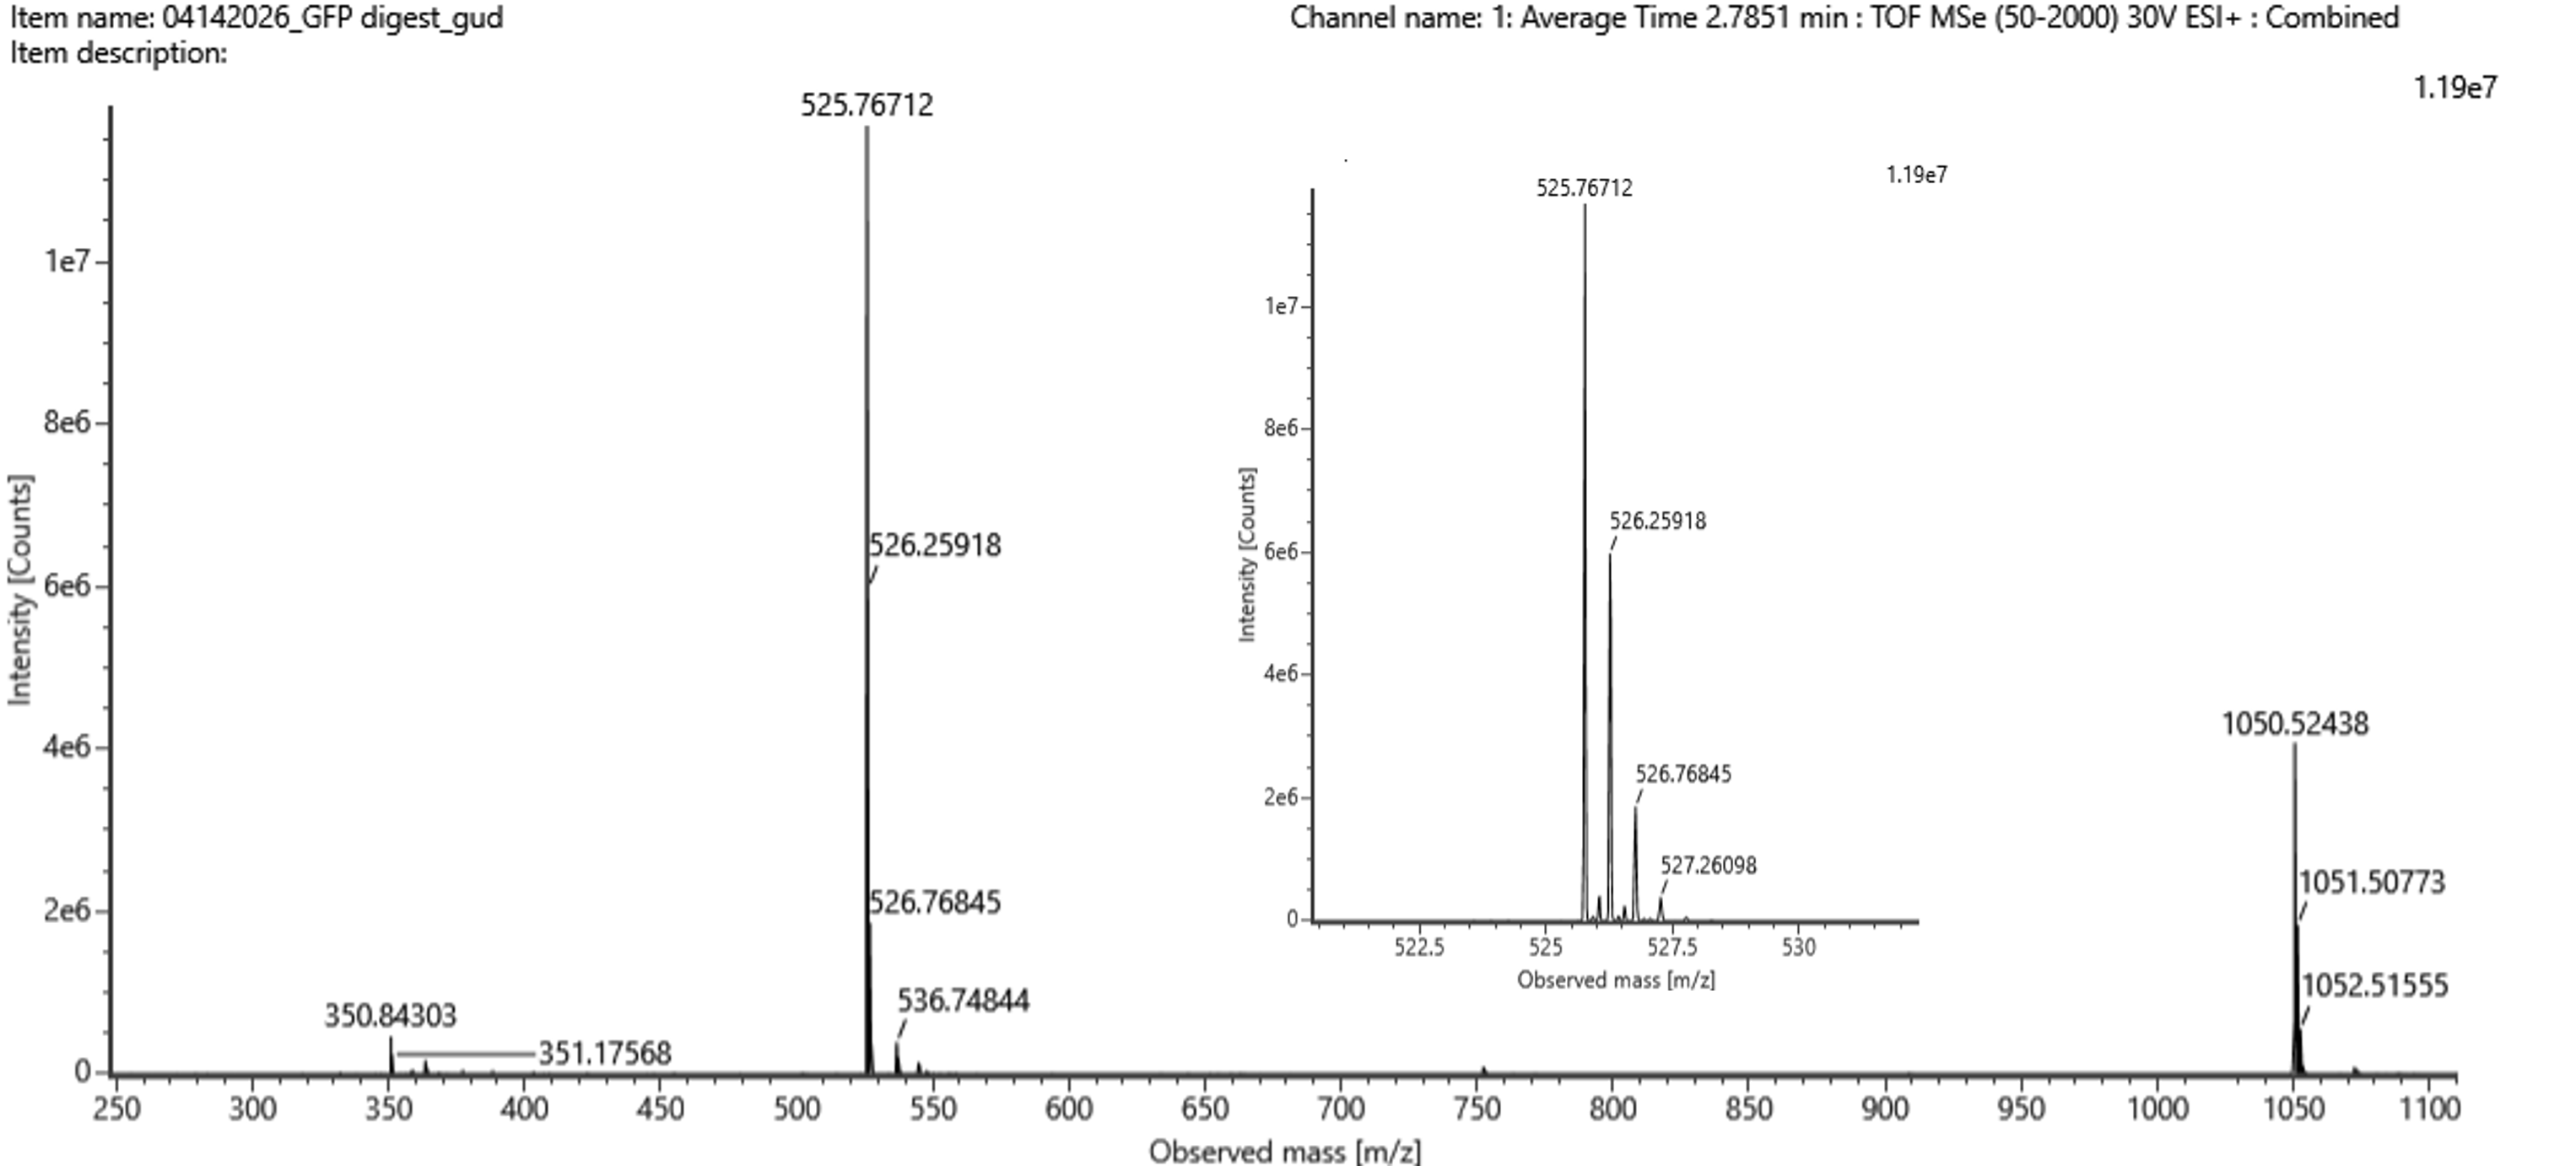
Figure 5b. Mass spectrum figure to show $\frac{m}{z}$ for the chromatographic peak at 2.78 min from Figure 5a above. The inset is a zoom-in of the peak at $\frac{m}{z}$ 525.76, to discern the isotope peaks.
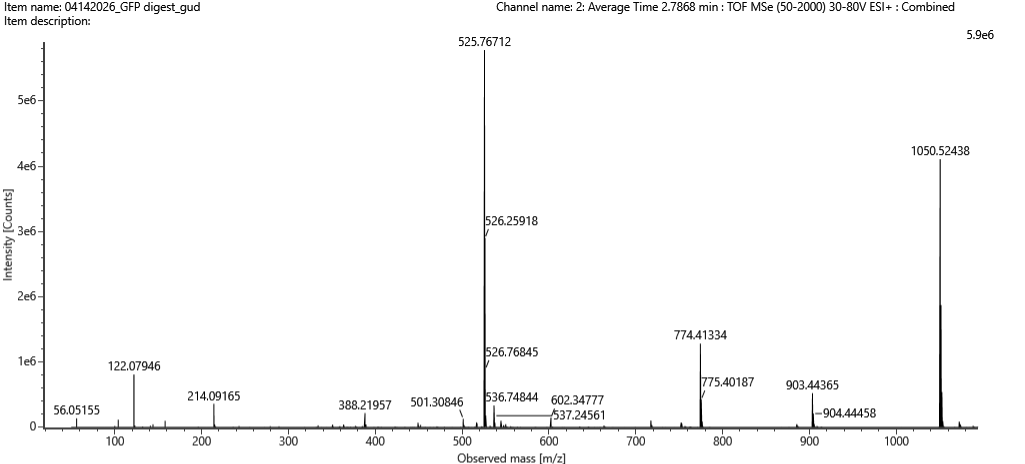
Figure 5c. Fragmentation spectrum of the peptide eluting at retention time 2.78 minutes in Figure 5a (above).
The most abundant peak in Figure 5b sits at m/z = 525.767. Looking at the isotope spacing in the zoomed inset, the peaks are separated by about 0.5 m/z units, which tells us the charge state is z = 2. Converting to the singly charged form gives a monoisotopic mass of approximately 1050.527 Da.
- Identify the peptide based on comparison to expected masses in the PeptideMass tool. What is mass accuracy of measurement? Please calculate the error in ppm. (Recall that $ \text{Accuracy} = \frac{|MW_{\text{experiment}} - MW_{\text{theory}}|}{MW_{\text{theory}}} $ )
Matching that mass against the PeptideMass output points to the peptide [FEGDTLVNR], which has a theoretical mass of 1050.521 Da. The difference between measured and theoretical is only about 2.0 ppm which is within expected accuracy range
- What is the percentage of the sequence that is confirmed by peptide mapping? (see Figure 6)
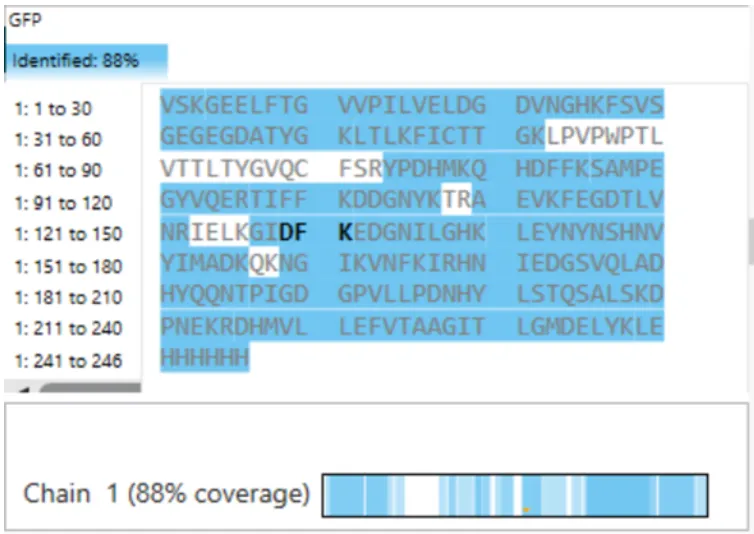
Figure 6. Amino Acid Coverage Map of eGFP based on BioAccord LC-MS peptide identification data.
The coverage map from the BioAccord run shows that 88% of the eGFP sequence was confirmed by peptide mapping.
Bonus Peptide Map Questions
- Can you determine the peptide sequence for the peptide fragmentation spectrum shown in Figure 5c? (HINT: Use your results from Question 2 above to match the peptide molecular weight that is closest to that shown in Figure 5b. Copy and paste its sequence into this tool online to predict the fragmentation pattern based on its amino acid sequence: http://db.systemsbiology.net/proteomicsToolkit/FragIonServlet.html. What is the sequence of the eGFP peptide that best matches the fragmentation spectrum in Figure 5c?
- Does the peptide map data make sense, i.e. do the results indicate the protein is the eGFP standard? Why or why not? Consult with Figure 6, which depicts the % amino acid coverage of peptides positively identified using their calculated mass and fragmentation pattern.
Homework: Waters Part IV — Oligomers
Assignees for the following sections
| MIT/Harvard students | Required |
| Committed Listeners | Required |
We will determine Keyhole Limpet Hemocyanin (KLH)’s oligomeric states using charge detection mass spectrometry (CDMS). CDMS single-particle measurements of KLH allow us to make direct mass measurements to determine what oligomeric states (that is, how many protein subunits combine) are present in solution. Using the known masses of the polypeptide subunits (Table 1) for KLH, identify where the following oligomeric species are on the spectrum shown below from the CDMS (Figure 7):
- 7FU Decamer
- 8FU Didecamer
- 8FU 3-Decamer
- 8FU 4-Decamer
KLH is made from two types of subunits inc a smaller 7FU subunit (340 kDa) and a larger 8FU subunit (400 kDa) . they naturally cluster together into rings of 10 (decamers) and larger stacked assemblies.
| Assignment | Calculation | Expected Mass | CDMS Peak Observed | Match |
|---|---|---|---|---|
| 7FU Decamer | 10 × 340 kDa | 3,400 kDa (3.40 MDa) | ~3.40 MDa | Exact |
| 8FU Decamer | 10 × 400 kDa | 4,000 kDa (4.00 MDa) | ~4.01 MDa | 0.3% off |
| 8FU Didecamer | 20 × 400 kDa | 8,000 kDa (8.00 MDa) | ~8.33 MDa | 4.1% off |
| 8FU 3-Decamer | 30 × 400 kDa | 12,000 kDa (12.00 MDa) | ~12.67 MDa | 5.6% off |
| 8FU 4-Decamer | 40 × 400 kDa | 16,000 kDa (16.00 MDa) | Not visible | — |
The 7FU Decamer matches its theoretical mass well. The larger assemblies (didecamer and 3-decamer) show slightly higher masses than predicted, which is expected as proteins tends to carry along some associated water, salt ions, or lipid molecules that add a small amount of extra mass on top of the protein itself. The 4-decamer doesn’t show up clearly in the spectrum at all, which suggests it’s either not forming in this sample, present in such small amounts that it falls below the detection threshold, or simply too heavy for the instrument to resolve clearly at the high-mass end. The two smaller peaks visible around 0.79 MDa and 1.52 MDa in Figure 7 are likely sub-decameric fragments , smaller incomplete assemblies such as dimers or tetramers of individual subunits that haven’t fully assembled into the complete decamer ring.
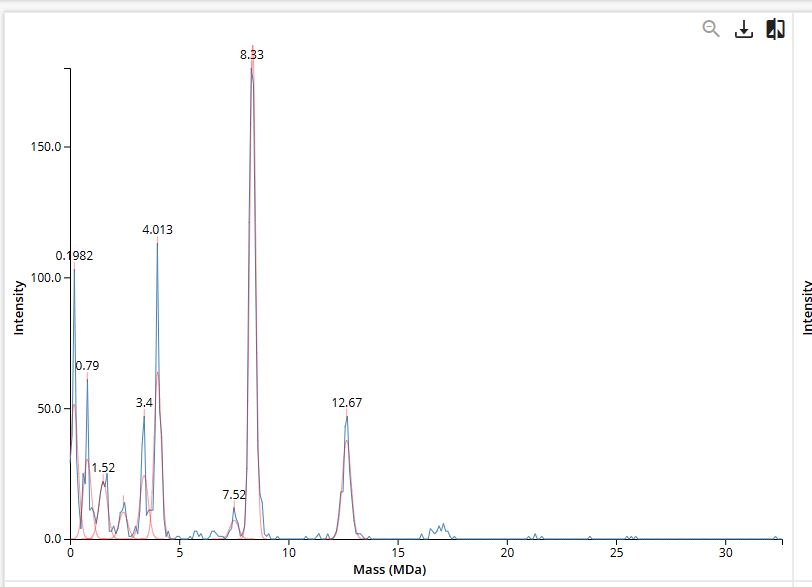
Figure 7. Mass spectrum of Keyhole Limpet Hemocyanin (KLH) acquired on the CDMS.
Homework: Waters Part V — Did I make GFP?
Assignees for the following sections
| MIT/Harvard students | Required |
| Committed Listeners | Required |
Please fill out this table with the data you acquired from the lab work done at the Waters Immerse Lab in Cambridge, or else the data screenshots in this document if you were unable to have lab work done at Waters.
| Property | Theoretical | Calculation | Observed (Intact LC-MS) | PPM Error |
|---|---|---|---|---|
| Molecular weight (kDa) | 28.007 kDa | From ExPASy sequence input | ~27.984 kDa | ~820 ppm |
| Chromophore correction | −20 Da | 28,007 − 20 = 27,987 Da | — | — |
| Peptide mapping coverage | 100% | 19 predicted peptides, 88% identified | 88% | — |
| Peptide FEGDTLVNR mass (Da) | 1050.5214 Da | From PeptideMass tool | 1050.5270 Da | ~5 ppm |
it worked. yes. the mass is within 820 ppm of the theoretical value, it can be explained by chomophore maturation which is when eGFP folds and forms its fluorescent chromophore. If it loses roughly 20 Da. The peptide map also independently confirms 88% of the amino acid sequence at under 5 ppm accuracy, meaning the instrument directly detected fragments covering nearly the entire protein. What was expressed and purified is very liekly to be eGFP.