Week 10 HW: Imaging and Measurement
Contents
Final project
Please identify at least one (ideally many) aspect(s) of your project that you will measure. It could be the mass or sequence of a protein, the presence, absence, or quantity of a biomarker, etc.
I’d like to measure the mass of produced PHB.Please describe all of the elements you would like to measure, and furthermore describe how you will perform these measurements.
How to measure the mass:- Centrifuge cell-free reaction to pellet insoluble PHB.
- Aspirate off supernatant into waste.
- Wash with water 2-3x, again pour off supernatant to waste.
- Dissolve remaining PHB pellet in chloroform.
- Weigh clean microtube.
- Transfer chloroform solution into the weighed microtube.
- Add methanol to precipitate out the PHB. Centrifuge to pellet.
- Aspirate off supernatant (methanol and chloroform) to waste.
- Leave tube open under fume hood to fully evaporate supernatant.
- Weigh again; amount of PHB produced = [final tube weight]-[starting tube weight]
Once the PHB mass is measured, I could re-dissolve in chloroform for molecular weight and polydispersity measurements using gel permeation chromatography. I could also confirm that it is PHB on GC-MS.
What are the technologies you will use (e.g., gel electrophoresis, DNA sequencing, mass spectrometry, etc.)?
I’d use a mass balance, gel permeation chromatography, and gas chromatography-mass spectrometry.
References
- Jossek, R; Steinbuchel, A. In vitro synthesis of poly(3-hydroxybutyric acid) by using an enzymatic coenzyme A recycling system. FEMS Microbiology Letters 1998, 168: 319-324. https://doi.org/10.1111/j.1574-6968.1998.tb13290.x
- Satoh, Y; Tajima, K; Tannai, H; et al. Enzyme-catalyzed poly(3-hydroxybutyrate) synthesis from acetate with CoA recycling and NADPH regeneration in Vitro. Journal of Bioscience and Bioengineering 2002, 95(4): 335-341. https://doi.org/10.1016/S1389-1723(03)80064-6
Waters Part I: Molecular Weight
- Based on the predicted amino acid sequence of eGFP and any known modifications, what is the calculated molecular weight? You can use an online calculator.
Using the online calculator: 28006.60 Da. However, GFP’s self-cyclization into the active fluorophore results in a loss of around 20 Da, according to this week’s lab. So the better theoretical molecular weight should be 28006.60-20 = 27986.60 - Calculate the molecular weight of the eGFP using the adjacent charge state approach described in the recitation. Select two charge states from the intact LC-MS data (Figure 1) and:
m/z: Charge state n is 903.7148; charge state n+1 is 875.4421- Determine z for each adjacent pair of peaks. $$ z = \frac{\frac{m}{z_{n+1}}}{\frac{m}{z_n} - \frac{m}{z_{n+1}}} $$ $$ z = \frac{875.4421}{903.7148 - 875.4421} = \frac{875.4421}{28.2727} $$ $$ z = 30.9642 = 31 $$
- Determine the MW of the protein. $$ MW = z*\frac{m}{z_n}-z = z(\frac{m}{z_n}-1) $$ $$ MW = 31*(903.7148-1) = 31*902.7148 $$ $$ MW = 27,984.1588 $$
- Calculate the accuracy of the measurement using the deconvoluted MW from 2.2 and the predicted weight of the protein from 2.1. $$ accuracy = \frac{|MW_{experiment} - MW_{theory}|}{MW_{theory}} $$ $$ accuracy = \frac{|27,984.1588 - 27986.60|}{27986.60} = \frac{2.4412}{27986.60} = 8.7227e-5 $$ $$ accuracy * 1,000,000 = 87.2275 ppm $$ This is >50ppm but it’s close, so this might be the right protein.
- Can you observe the charge state for the zoomed-in peak in the mass spectrum for the intact eGFP? If yes, what is it? If no, why not?
The picture is pretty blurry, so honestly i am having a hard time reading the numbers. But i think we can see isotope peaks labeled: 1473.7429, 1473.7950, [unreadable], 1474.0045, 1474.0481, 1474.1006. These all yield spacings around 0.05. This would indicate a charge state around 20.
Waters Part II: Secondary/Tertiary Structure
- Based on learnings in the lab, please explain the difference between native and denatured protein conformations. For example, what happens when a protein unfolds? How is that determined with a mass spectrometer? What changes do you see in the mass spectrum between the native and denatured protein analyses (Figure 2)?
Native protein conformation is the shape the protein is folded into when it is made by the cell, this is usually the active state for enzymes. Denatured protein conformation is when the protein is unfolded, and essentially a linear amino acid sequence. On mass spectometry, the denatured state exposes all possible sites for adding a charge for the clean z+1 peaks, whereas the native conformation has more limited (and frequently unknown) how many charges can and are added in different peaks. In a mass spec, the more linear/unfolded proteins add more charges, so the m/z peaks tend to be lower than those of a native protein (more peaks to the right). - Zooming into the native mass spectrum of eGFP from the Waters Xevo G3 QTof MS (see Figure 3), can you discern the charge state of the peak at ~2800 m/z? What is the charge state? How can you tell?
Once again, the low resolution of the screenshot is making it hard to read the numbers. A stretch that i’m decently confident about reads peaks at: 2545.1304, 2545.2222, 2545.3140, 2545.4058, 2545.4973. These all yield a spacing around 0.09. This would indicate a charge state around 11.
Waters Part III: Peptide Mapping - primary structure
- How many Lysines (K) and Arginines (R) are in eGFP? Please circle or highlight them in the eGFP sequence given in Waters Part I question 1 above.
MVSKGEELFTG VVPILVELDG DVNGHKFSVS GEGEGDATYG KLTLKFICTT GKLPVPWPTL VTTLTYGVQC FSRYPDHMKQ HDFFKSAMPE GYVQERTIFF KDDGNYKTRA EVKFEGDTLV NRIELKGIDF KEDGNILGHK LEYNYNSHNV YIMADKQKNG IKVNFKIRHN IEDGSVQLAD HYQQNTPIGD GPVLLPDNHY LSTQSALSKD PNEKRDHMVL LEFVTAAGIT LGMDELYKLE HHHHHH
- How many peptides will be generated from tryptic digestion of eGFP?
26, by my hand count. Using the online tool, 19. i think the difference is in not counting the very short peptides (< 5 amino acids, plus a couple of 4 AA peptides, likely because they have heavier side chains since it has a 500 Da cutoff). - Based on the LC-MS data for the Peptide Map data generated in lab (please use Figure 5a as a reference) how many chromatographic peaks do you see in the eGFP peptide map between 0.5 and 6 minutes? You may count all peaks that are >10% relative abundance.
I saw 23 peaks, but only 21 are labeled, so I’m guessing maybe only the labeled ones are >10% abundance? - Assuming all the peaks are peptides, does the number of peaks match the number of peptides predicted from question 2 above? Are there more peaks in the chromatogram or fewer?
No, there are more peaks in the chromatogram. - Identify the mass-to-charge (m/z) of the peptide shown in Figure 5b. What is the charge (z) of the most abundant charge state of the peptide (use the separation of the isotopes to determine the charge state). Calculate the mass of the singly charged form of the peptide ([M+H]+) based on its m/z and z.
The m/z of the peptide at the most abundant charge state is 525.76712. The z of the most abundant charge state is 2 (because the highest peak has isotope peaks that are 0.5 m/z apart). $$ \frac{MW+2H}{2} = 525.76712 $$ $$ MW + 2(1.00727) = 1051.53424 $$ $$ MW + 2.01454 = 1051.53424 $$ $$ MW = 1049.5197 $$ $$ [M+H]+ = MW+1H = 1049.5197 + 1.00727 $$ $$ [M+H]+ = 1050.52697 $$ - Identify the peptide based on comparison to expected masses in the PeptideMass tool. What is mass accuracy of measurement? Please calculate the error in ppm.
The peptide is FEGDTLVNR. $$ accuracy = \frac{|MW_{experiment} - MW_{theory}|}{MW_{theory}} $$ $$ accuracy = \frac{|1050.52697 - 1050.5214|}{1050.5214} = \frac{0.00557}{1050.5214} $$ $$ accuracy = 5.30212 e-6 * 1,000,000 = 5.3 ppm $$ This is <10 ppm, so it is probably the correct peptide. - What is the percentage of the sequence that is confirmed by peptide mapping?
88% - Can you determine the peptide sequence for the peptide fragmentation spectrum shown in Figure 5c?
FEGDTLVNR; mono; +1; B, Y. Mostly matches up. D peak at 717 is very small and unlabeled, but it looks like there’s a peak approximately there. There’s no N peak at 289, nor an R peak at 175. Also the three smallest peaks don’t match up with anything in the in-silico fragmentation (56, 122, 214). - Does the peptide map data make sense, i.e. do the results indicate the protein is the eGFP standard? Why or why not?
Mostly - the peptides that are not covered in the peptide mapping are either too large (>20 AA) or too small (<5 AA) for confident identification according to the informaiton provided in the lab.
Waters Part IV: Oligomers
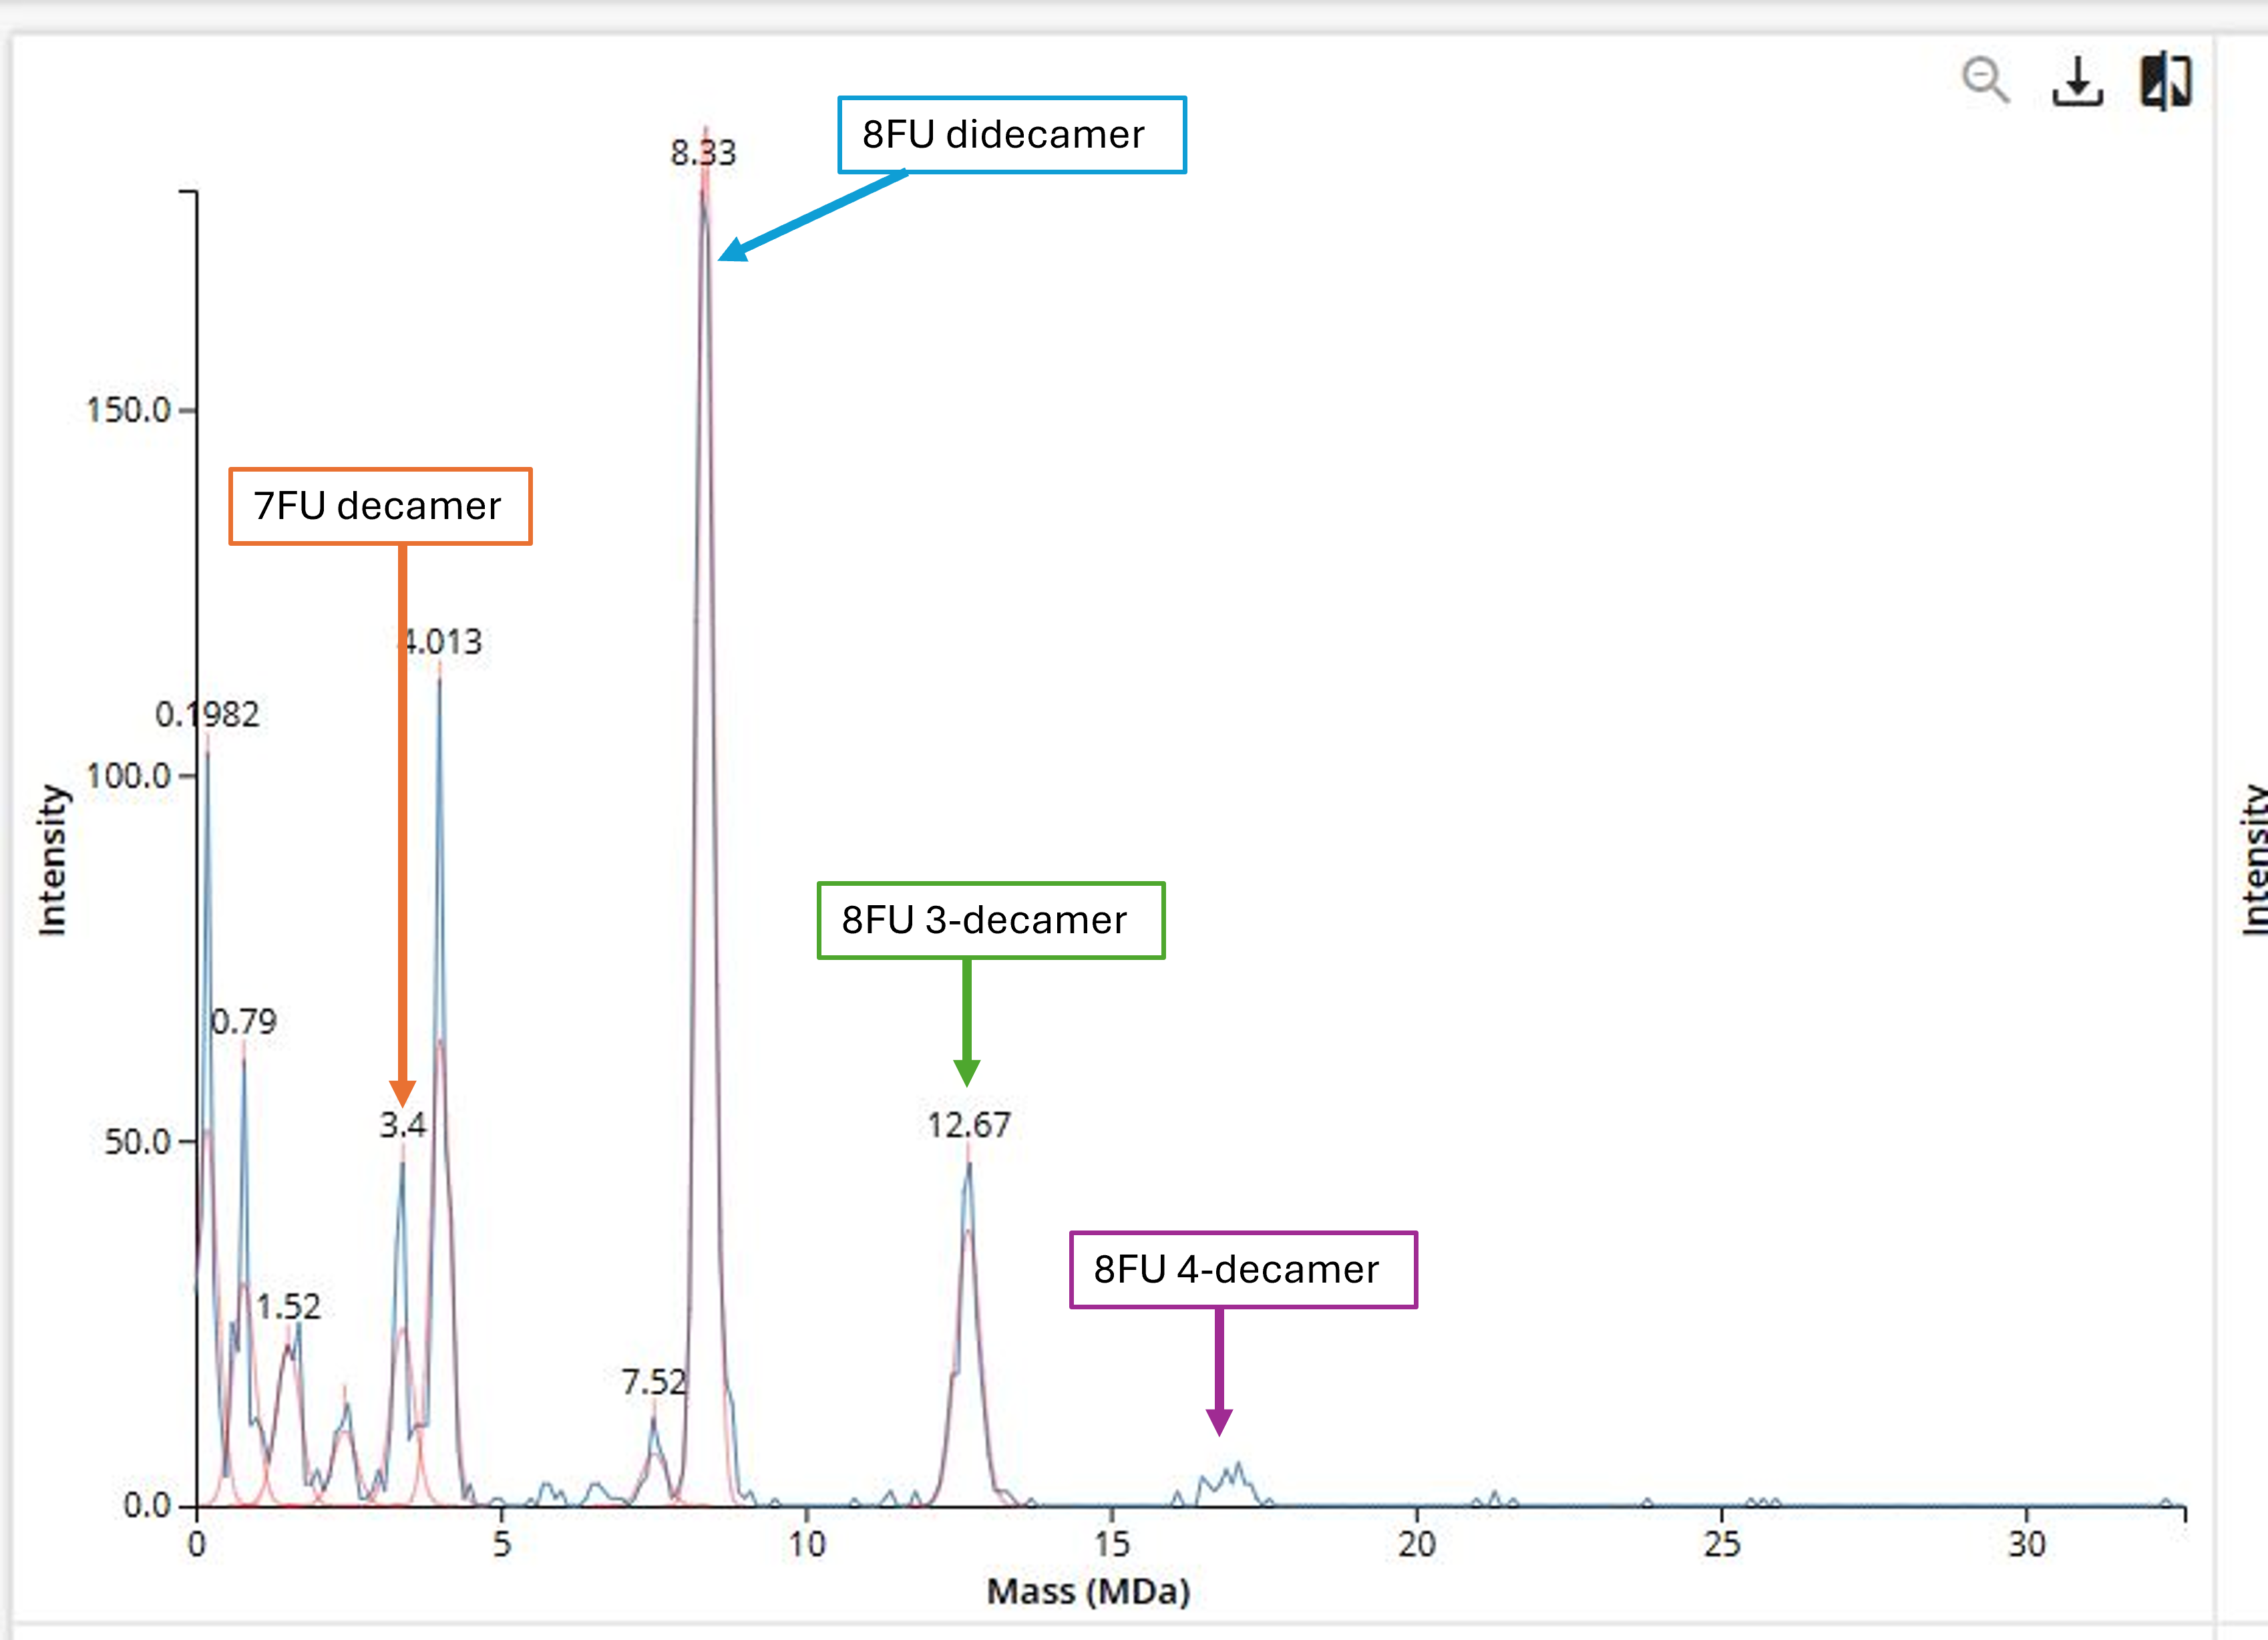
- 7FU decamer = 7FU mass *10 = 340 kDa *10 = 3400 kDa = 3.4 MDa
- 8FU didecamer = 8FU mass *20 = 8000 kDa = 8 MDa
- 8FU 3-decamer = 8FU mass *30 = 12000 kDa = 12 MDa
- 8FU 4-decamer = 8FU mass *40 = 16000 kDa = 16 MDa
Waters Part V: Did I make GFP?
Please fill out this table with the data you acquired from the lab work done at the Waters Immerse Lab in Cambridge, or else the data screenshots in this document if you were unable to have lab work done at Waters.
| Theoretical | Observed/measured on the Intact LC-MS | PPM Mass Error | |
|---|---|---|---|
| Molecular weight (kDa) | 27986.60 | 27,984.16 | 87.2 |
This error is close to 50 ppm, so it might be GFP. Especially with the pretty good peptide mapping, I think this is likely GFP, though I am not as confident as I would like to be.