Bioengineering postdoc researching the effects of genetically modified bacteria on soil microbiota. i love cyanobacteria! 💚 i’m interested in biomanufacturing with photosynthetic microbes.
First, describe a biological engineering application or tool you want to develop and why. I want to optimize a strain of cyanobacteria for biomanufacturing. Cyanobacteria can be engineered to produce many useful things from atmospheric carbon dioxide, from commodity chemicals to bioactive compounds for pharmaceuticals, but harvesting the products is often energy intensive and expensive, especially at an industrial scale. I am particularly interested in cyanobacterial bioplastics, such as polyhydroxyalkanoates, because this would be a closed-loop carbon cycle for biodegradable plastic.
Next, describe one or more governance/policy goals related to ensuring that this application or tool contributes to an “ethical” future, like ensuring non-malfeasance (preventing harm). Break big goals down into two or more specific sub-goals.
Goal: Prevent accidental release that could harm native ecosystems through microbial community shifts or production of commodity chemicals in the natural environment.
Subgoal: Include biocontainment systems in all commercially used industrial bioproduction strains.
Subgoal: Institute testing standards and protocols to notice any accidental release when it occurs.
Goal: Increase access to the genetic tools and strains used for cyanobacterial bioproduction to allow more chemicals to be manufactured in this carbon-neutral way.
Subgoal: Publish cyanobacterial genetic engineering research (such as new tools, etc.) in open access journals or make PDFs available on personal/lab websites.
Subgoal: Enable strain sharing.
Next, describe at least three different potential governance “actions” by considering the four aspects below (Purpose, Design, Assumptions, Risks of Failure & “Success”).
Policy to require specific risk mitigation and demonstration of effectiveness under realistic application conditions for engineered bacteria approval.
Purpose: Currently, engineered bacteria that might affect environment and public health need to be approved by the EPA, FDA, or USDA for commercial use. This new policy would enact specific requirements for approvals for engineered bacteria. Additionally, many publications about genetic biocontainment discuss it as potential risk mitigation, but the effectiveness of the biocontainment is only demonstrated under specific laboratory conditions (i.e. axenic, optimized media, etc.).
Design: This would be a change in current federal standards and approval processes. The EPA, FDA, and USDA would need to write and implement new policies, potentially train risk assessors and application managers, and develop testing procedures to ensure compliance. With the overturning of the Chevron doctrine, likely this sort of new policy would require the buy-in of either the companies trying to get their products approved or US Congress to pass new legislation.
Assumptions: Companies and reseachers abide by federal regulations regarding testing and approval. Risk assessment is done in good faith, rather than by companies prioritizing profit over safety. Risk assessment is done by trained ecological and biological risk assessors who know what to look for or be aware of.
Risks of Failure and Success: This could fail if the requirement is too stringent to allow any new products to be approved. This could also fail if the requirements are too lax, and not all risks are accounted for and mitigated. If experimental conditions do not properly reflect application conditions, what appeared to be effective mitigation in the lab might not be effective mitigation in application.
Researchers and inventors could also implement relevant and effective genetic biocontainment in any engineered bacteria used for commercial biomanufacturing.
Purpose: For risks around the unintended spread of engineered bacteria or their synthetic genetic constructs, genetic biocontainment can mitigate these risks by preventing proliferation and/or degrading the relevant DNA. By tying the biocontainment system to the intended use of the bacterium, researchers manage risk in a relevant manner, thus ensuring that the bacterium is specific to the intended application and minimizing spread thereby reducing risks.
Design: Any developer of an engineered bacteria that could be intentionally or unintentionally released would need to research biocontainment and engineer a system into their bacteria. This would require a change in the current culture of the field, where the risks of engineered bacteria spread and mitigation through biocontainment are sometimes discussed, but mostly considered somewhat niche. If it became common practice to consider application and risks thereof for the products of synthetic biology, I think the design of these sorts of safeguards would be more widespread. Any sort of research requires funding and incentive, so universities, grant funders, and biotech companies would need to start looking for these considerations in proposals to motivate it.
Assumptions: Genetic biocontainment is a good strategy to mitigate the potential ecological and public health risks of new synthetic biology products. These risks are limited to ones we think to test (i.e. microbial community shifts, horizontal gene transfer of antiobiotic resistance genes or other functions, proliferation of engineered bacteria in unintended location, local specific bacterial extinction event in the case of a particularly robust engineered bacterium).
Risks of Failure and Success: If we rely too heavily on genetic biocontainment, a failure of the genetic system could result in losing that protection against risk. It’s also possible risks would not be seriously considered because we too easily trust biocontainment to minimize the risk.
Establish professional society for cyanobacteria-specific or general photosynthetic-organism research to promote resesarch and tool sharing.
Purpose: Currently, microalgae research is generally lumped along with all other non-model microbes in synthetic biology. A professional association or conference specific to photobiocatalysis could be a gathering place to collect all relevant tools, protocols, and standards, as well as potentially institute a shared ethics or goal to include improving access to the research and its products.
Design: Perhaps a starting point would be to invite cyanobacteria, eukaryotic microalgae, macro-algae, and plant synthetic biologists to a conference on photobiocatalysis, along with industry representatives from companies using or creating engineered phototrophs. This might be best done under the banner of an existing synthetic biology or metabolic engineering professional association (such as the Society for Biological Engineering in the American Institute of Chemical Engineers). If there is enough interest at the conference, attendees could work together to establish a more specific sub-association, or just resolve to discuss access and research sharing at the conference itself.
Assumptions: This is a large enough field to host such a specific conference. It might be too niche, but I don’t think so; it might be a conference on the smaller side at first though probably.
Risks of Failure and Success: It’s possible industry and start-ups might not want to popularly share their research as there is an economic disincentive.
Next, score (from 1-3 with, 1 as the best, or n/a) each of your governance actions against your rubric of policy goals.
Does the option:
Risk Mitigation for Approval
Biocontainment in Practice
Photobiomanufacturing Professional Society
Enhance Biosecurity
• By preventing incidents
1
1
3
• By helping respond
2
3
3
Foster Lab Safety
• By preventing incident
2
n/a
2
• By helping respond
2
n/a
2
Protect the environment
• By preventing incidents
1
1
2
• By helping respond
1
2
2
Other considerations
• Minimizing costs and burdens to stakeholders
3
3
3
• Feasibility?
2
3
2
• Not impede research
3
2
1
• Promote constructive applications
1
2
1
Last, drawing upon this scoring, describe which governance option, or combination of options, you would prioritize, and why. Outline any trade-offs you considered as well as assumptions and uncertainties. I would prioritize the requirement of risk assessment and mitigation strategies for federal approval of engineered bacteria. I believe this would have the biggest impact in terms of allowing engineered bacteria to be used for public good (such as biomanufacturing) while preventing potential harm (such as ecosystem destabilization by permanently altering native microbiome in instances of escape). The development of genetic biocontainment tools and implementation thereof becoming regular practice in the field of engineered microbes would be awesome, but I think would be harder to bring about and would take longer - although it might actually have more impact. The establishment of a professional society could help institute such norms. Starting a new conference would probably be easiest in terms of discovering feasibility - proposing it to a handful of host organizations would rapidly identify whether this is currently worth pursuing or if it would need to be worked on for a while first.
References:
Chemla, Y; Sweeney, CJ; Wozniak, CA; et al. Engineering Bacteria for Environmental Release: Regulatory Challenges and Design Strategies. Authorea. July 05, 2024. DOI: 10.22541/au.171933709.97462270/v2
George, DR; Danciu, M; Davenport, PW; et al. A bumpy road ahead for genetic biocontainment. Nature Communications, 15(650). January 20, 2024. DOI: 10.1038/s41467-023-44531-1
Schmelling, NM; Bross, M. What is holding back cyanobacterial research and applications? A survey of the cyanobacterial research community. Nat Commun 15, 6758. August, 8, 2024. DOI: 10.1038/s41467-024-50828-6
Week2 Lecture Prep
Jacobson:
Nature’s machinery for copying DNA is called polymerase. What is the error rate of polymerase? How does this compare to the length of the human genome. How does biology deal with that discrepancy? Polymerase error rate: $1 : 10^{6}$. The human genome is around 3.2 Gb, or $3.2 * 10^{9}$ basepairs. Biological polymerases are error-correcting; they have have proofreading mechanisms. There are also mutation repair mechanisms.
How many different ways are there to code (DNA nucleotide code) for an average human protein? In practice what are some of the reasons that all of these different codes don’t work to code for the protein of interest? The average human protein is encoded within 1036bp. This might be answerable based on the last slide titled “Fabricational Complexity”, but I couldn’t quite figure out what these formulas are supposed to be calculating without explanation. So instead, we can do some back-of-the-napkin math together. 1036bp is $1036/3 \approx 345$ codons, or 344 amino acids (because of the stop codon at the end), assuming that the 1036bp figure doesn’t include introns. Most amino acids have either 4 or 2 codons that can encode for it, although a couple have more or less. We’ll average it out to approximately 3 codons per amino acid. I imagine that not all amino acids are used at the same frequency in human proteins, but I don’t actually know what it is off the top of my head, so we’re just going to go with what we have. Each possible DNA sequence for an amino acid sequence includes every combination with all possible codons for each amino acid. So assuming an average human protein has 344 amino acids, and the average number of codons per amino acid is 3, then there are $3^{344} = 1.3 E164$ different ways to code for an average human protein. In practice, not all tRNAs are synthesized at the same frequency, so it might take unreasonably long for certain codons to be recognized during chain extension; and during DNA replication, errors can be made and some errors will be more tolerable than others due to codon wobble.
LeProust:
What’s the most commonly used method for oligo synthesis currently? Phosphoramidite synthesis.
Why is it difficult to make oligos longer than 200nt via direct synthesis? There are side reactions that occur, causing the accumulation of errors (incorrect bases).
Why can’t you make a 2000bp gene via direct oligo synthesis? I think this is because of the side reactions in Q2, right? Like, the accumulation of errors limits oligo synthesis to around 200 bases in practice. Also, oligos are single-stranded DNA; a 2000bp gene is double-stranded, and therefore you’d either need to synthesize both strands and ligate them together, or synthesize one strand and use it as a template for PCR or something.
Church:
Given the one paragraph abstracts for these real 2026 grant programs sketch a response to one of them or devise one of your own: BioStabilization Systems - ARPA-H \
Biologic therapeutics are critically important for a number of diseases, but require careful and specific conditions at all points on the supply chain to maintain efficacy. Specifically, cell therapies and biologics require extreme cold to prevent degradation, thus making biologics inaccessible to people who don’t live near a specialized medical center. To solve this problem, we propose to express biologic therapeutics in extremophiles from abyssal marine sediment, which demonstrated little cell proliferation in low-oxygen environments but regained metabolic activity when incubated with oxygen. We predict that the faster cell turnover period at warmer temperature, oxygen-rich, and high-nutrient conditions will allow us to engineer these bacteria to produce the biologic therapeutic molecules. Once production is achieved, we will seal the cells into low-oxygen capsules for transport, which we predict will slow their metabolic rate enough to preserve the goal product until oxygen is provided again. If successful, this research could expand access to biologic therapeutics to anywhere that can aseptically incubate microbes at room temperature and purify the molecules therein.
References:
Morono, Y; Ito, M; Hoshino, T; et al. Aerobic microbial life persists in oxic marine sediment as old as 101.5 million years. Nat Commun 11, 3626. 2020. DOI: 10.1038/s41467-020-17330-1
Suzuki, Y; Webb, SJ; Kouduka, M; et al. Subsurface Microbial Colonization at Mineral-Filled Veins in 2-Billion-Year-Old Mafic Rock from the Bushveld Igneous Complex, South Africa. Microb Ecol 87, 116. 2024. DOI: 10.1007/s00248-024-02434-8
Personal notes/drafting
abstract formula:
1 sentence on the broad problem: Biologic therapeutics are critically important for a number of diseases, but require careful and specific conditions at all points on the supply chain to maintain efficacy.
1-2 sentences on the specific problem: How to transport cell therapies and biologics at room temperature, decentralizing medicine
1 sentence on the broad goal: We aim to express biologic compounds in extremophiles from the deep subsurface where energy and nutrients are limited.
2-3 sentences on methods: aerobic microbes from oxic abyssal marine sediment that proliferated at 10C with provision of nutrients and higher conc O2; might need to consider eukaryotic protein folding in prokaryotes; low O2 environment - maybe sealing the cells (post-therapeutic production, pre-shipping) into an airtight capsule would prevent metabolic activity including the breakdown of said therapeutics?
1 sentence on future work: maybe also try extremophiles found within old rock samples
1 sentence on conclusion/impact: expands access to biologics, especially to under-resourced communities
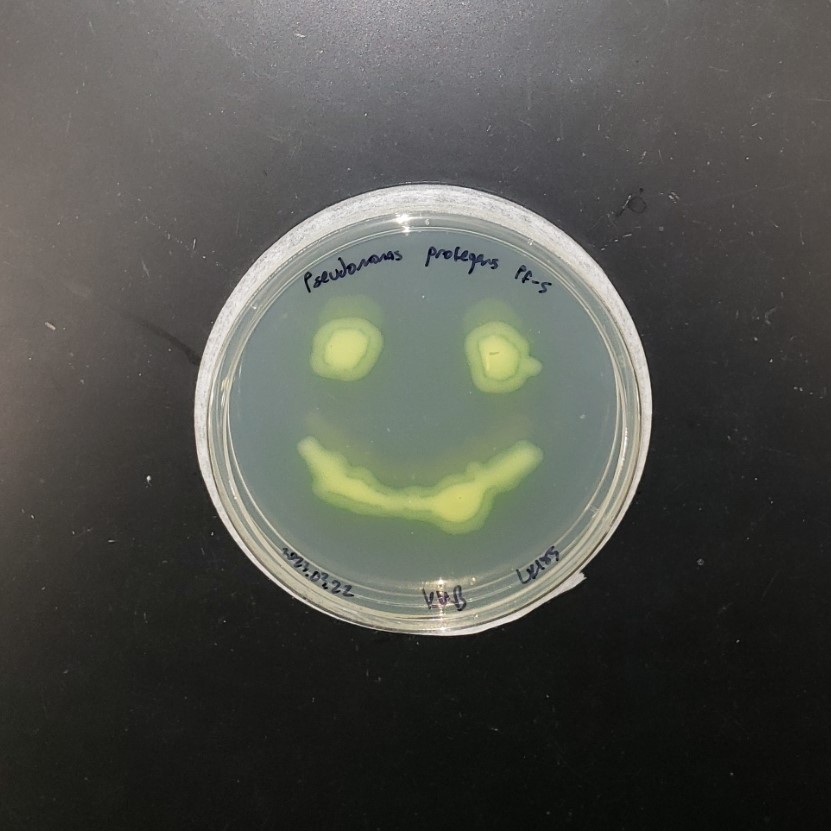
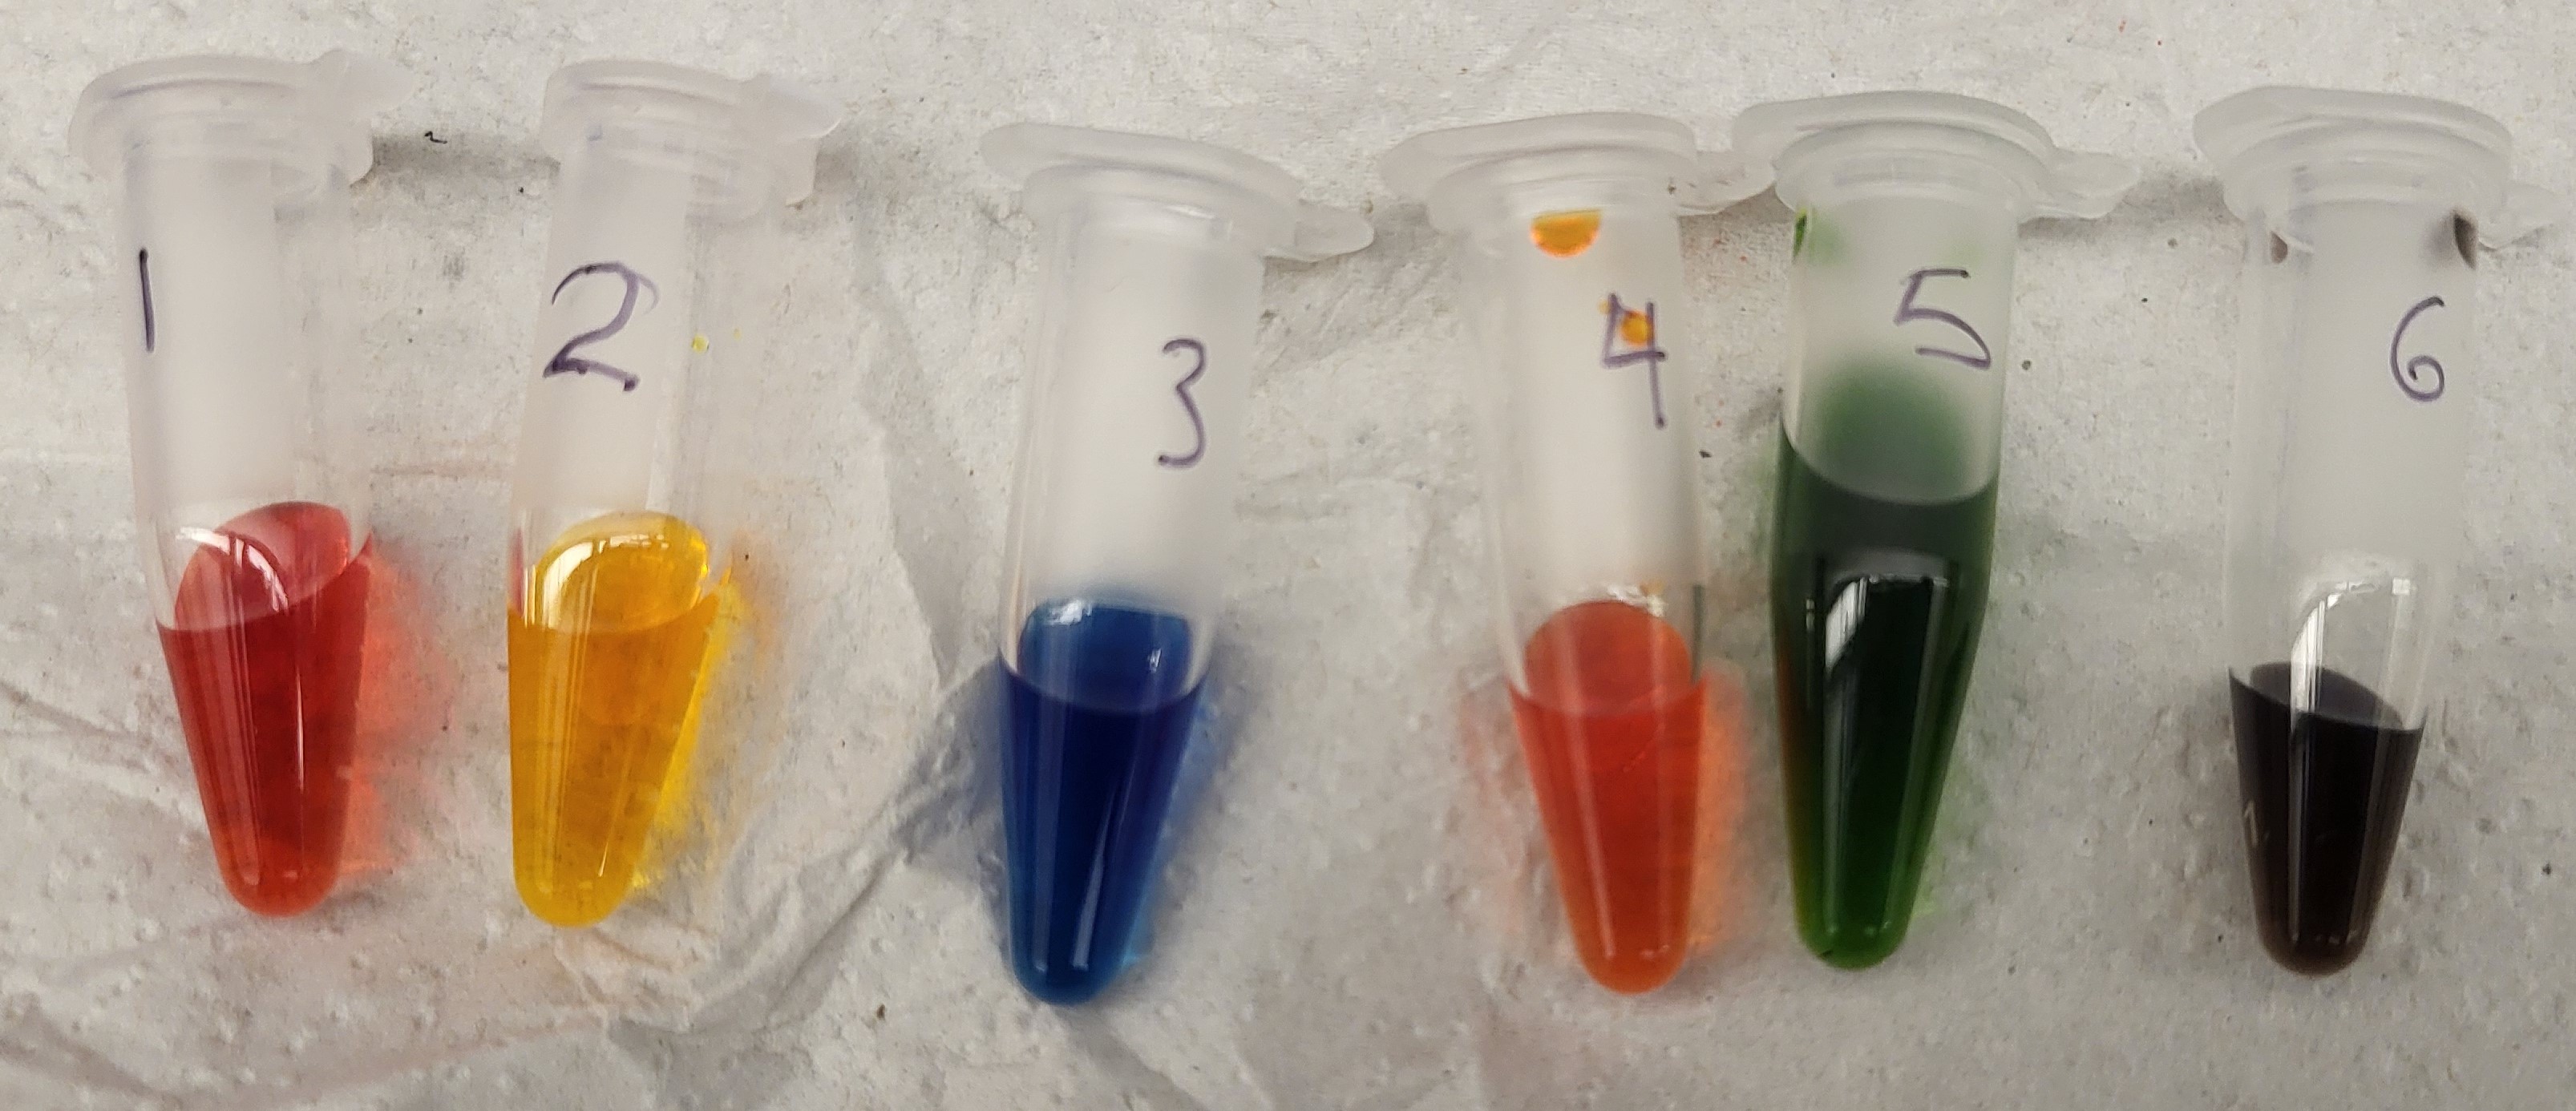
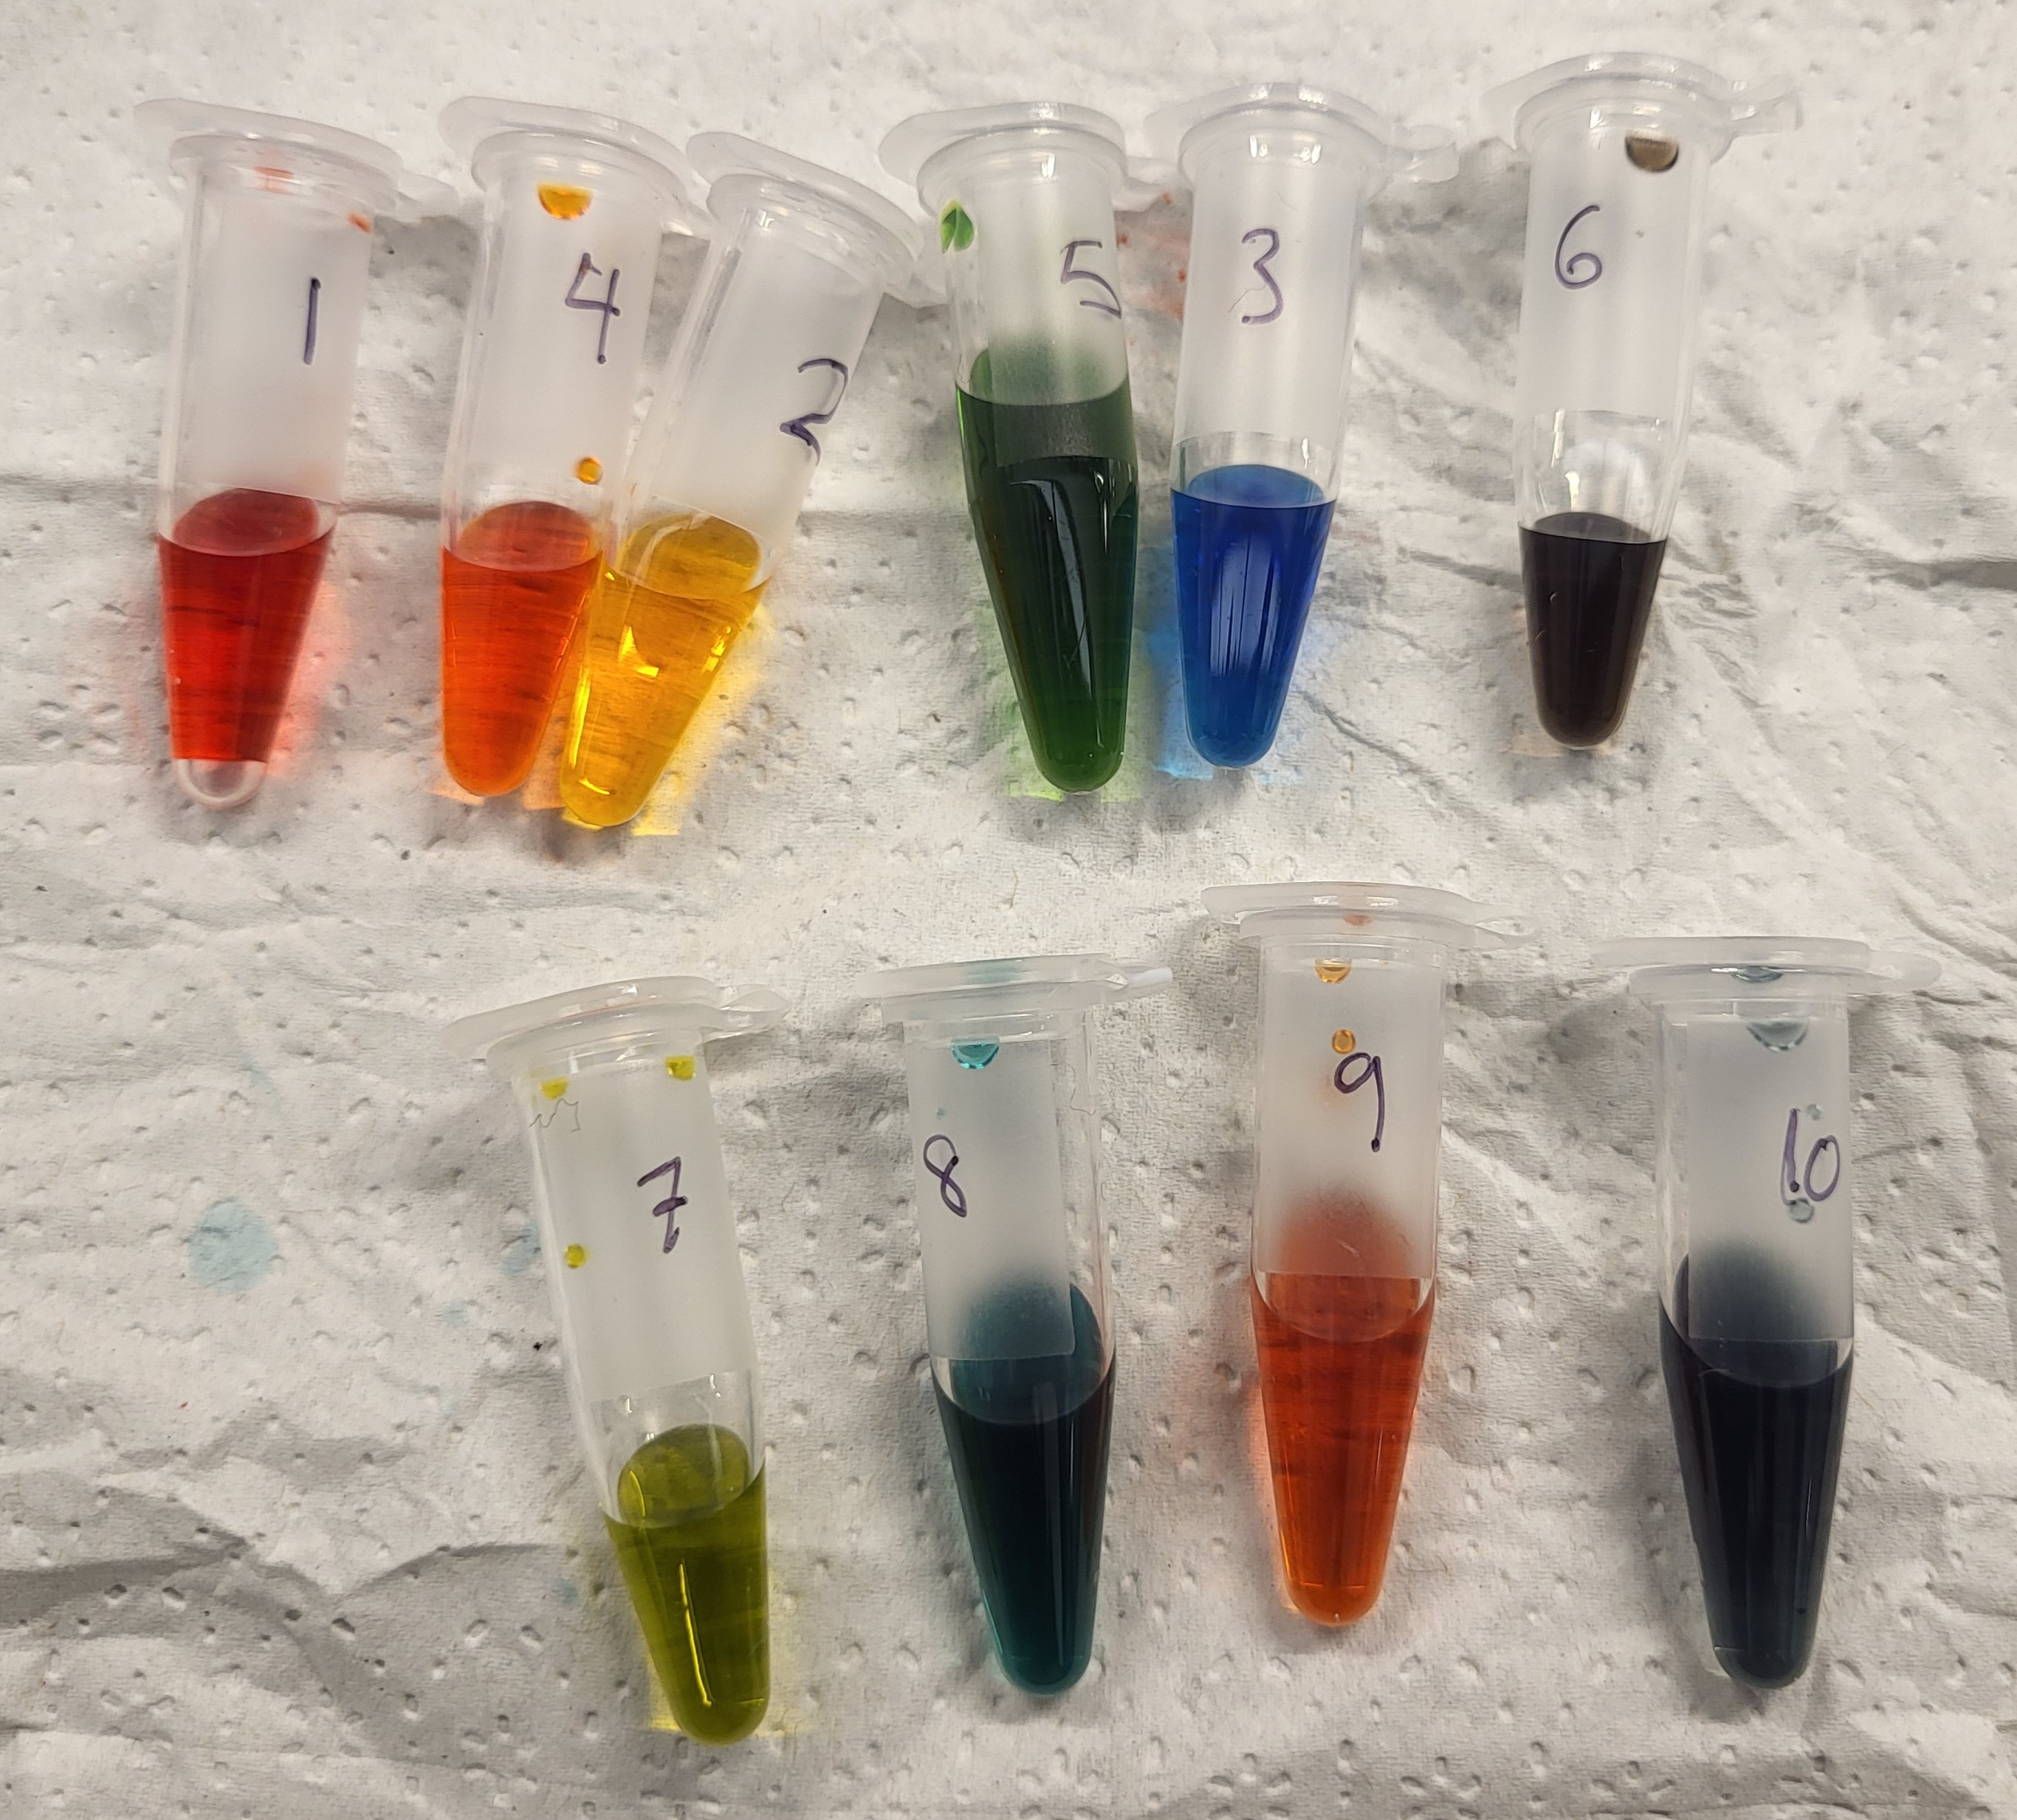
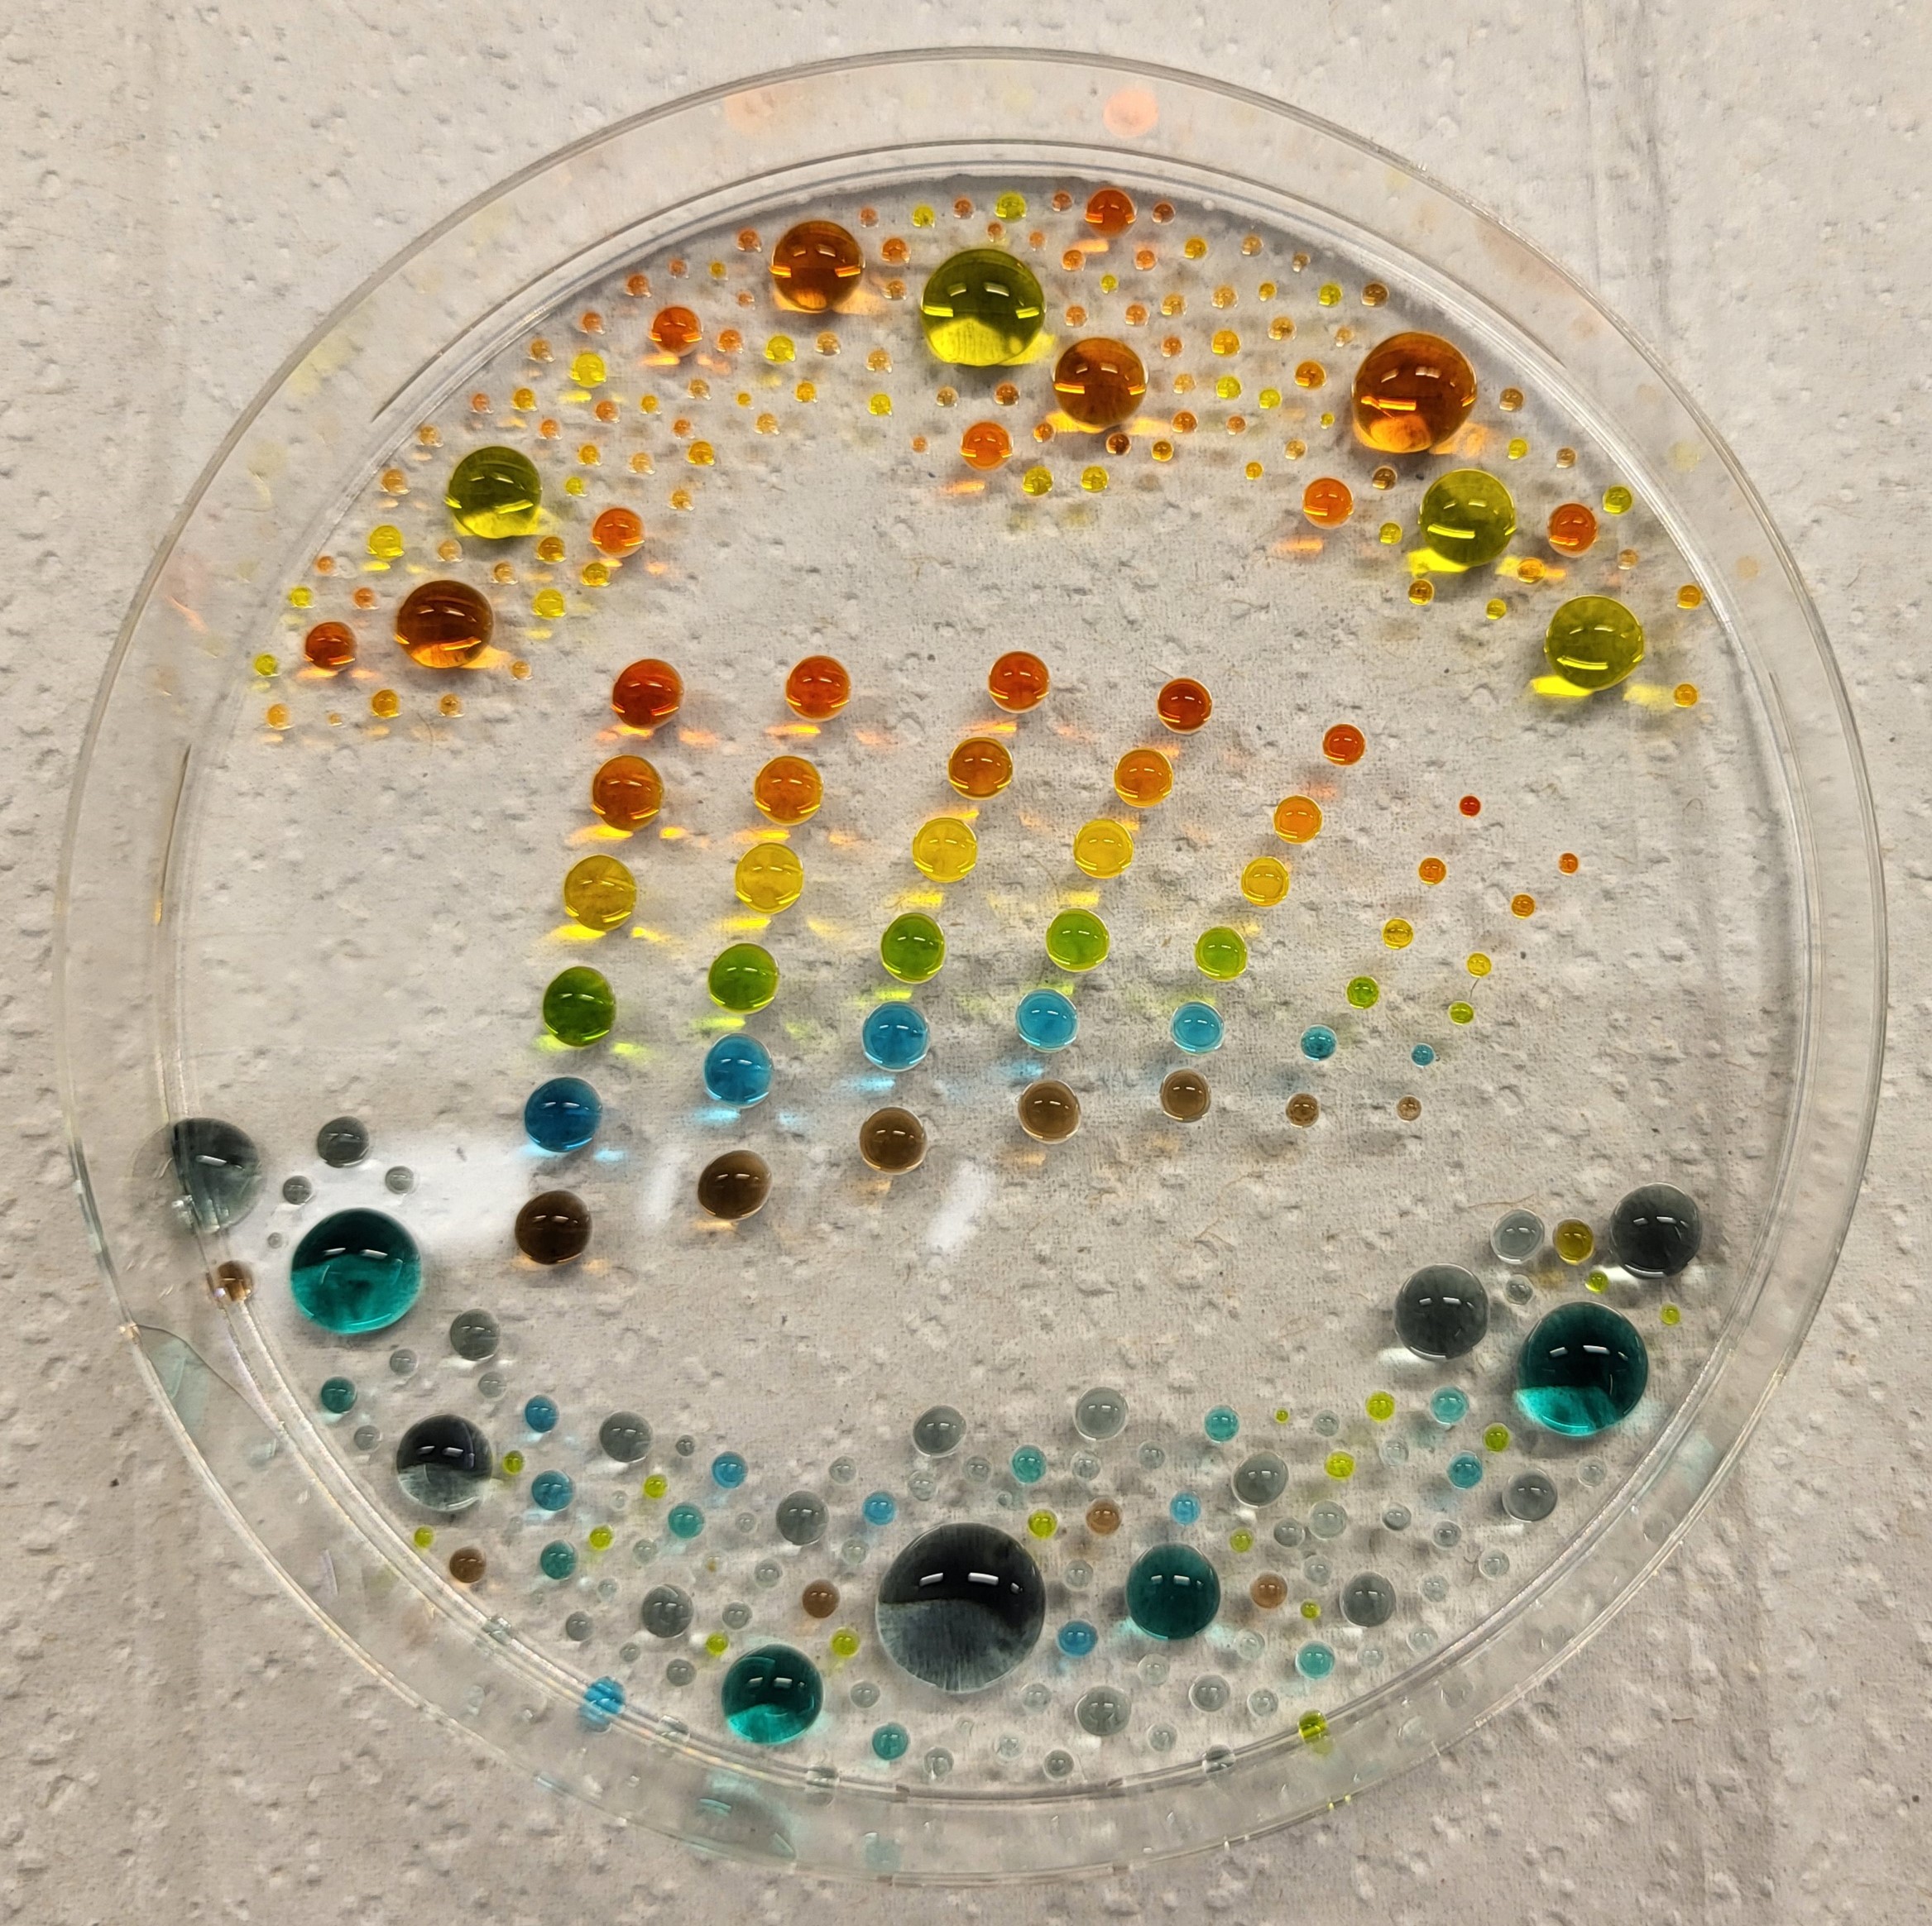
I couldn’t figure out how to use Ronan’s website other than the randomization button unfortunately. As a result, I went with a pretty simple smiley face design for my in-silico art.
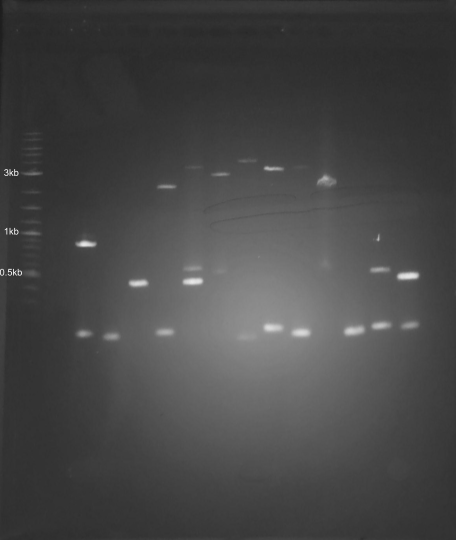
Part 2: Gel Art - Restriction Digests and Gel Electrophoresis
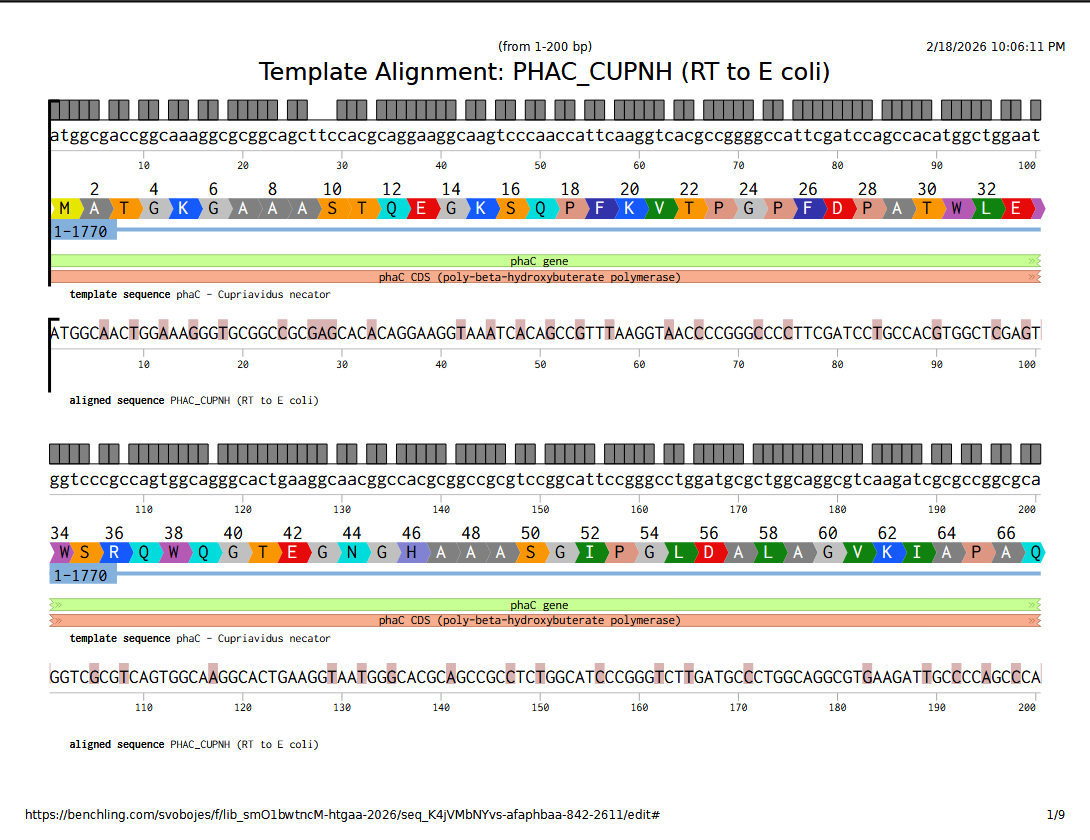
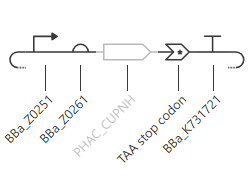
I’m interested in PhaC, a PHA synthase. This is an enzyme involved in the synthesis of polyhydroxyalkanoates (PHAs), a class of biopolymer that is considered a potential non-petroleum-derived thermoplastic. PHAs are also of interest for possible medical uses as biodegradable polymers. PhaC is the enzyme that catalyzes the polymerization step, adding on monomers to the chain.
I selected PhaC from Cupriavidus necator H16 whose primary product is poly(3-hydroxybutyurate). From UniProt, the accession number is P23608 · PHAC_CUPNH.
I used the Benchling back-translate tool set to match Escherichia coli K-12 naturally occuring codon usage because it didn’t have the native host C. necator as an option. They are in the same phylum (Pseudomonadota), so maybe it will be similar.
They are not that similar, it turns out; although that may have less to do with codon usage frequency and more to do with when the reverse translate tool used which codons. Here’s the DNA sequence alignment comparing the genomic sequence from C. necator with the E. coli optimized reverse translation. This sequence alignment was performed in Benchling, using MAFFT with pre-set parameters.
Full alignment viewable here.
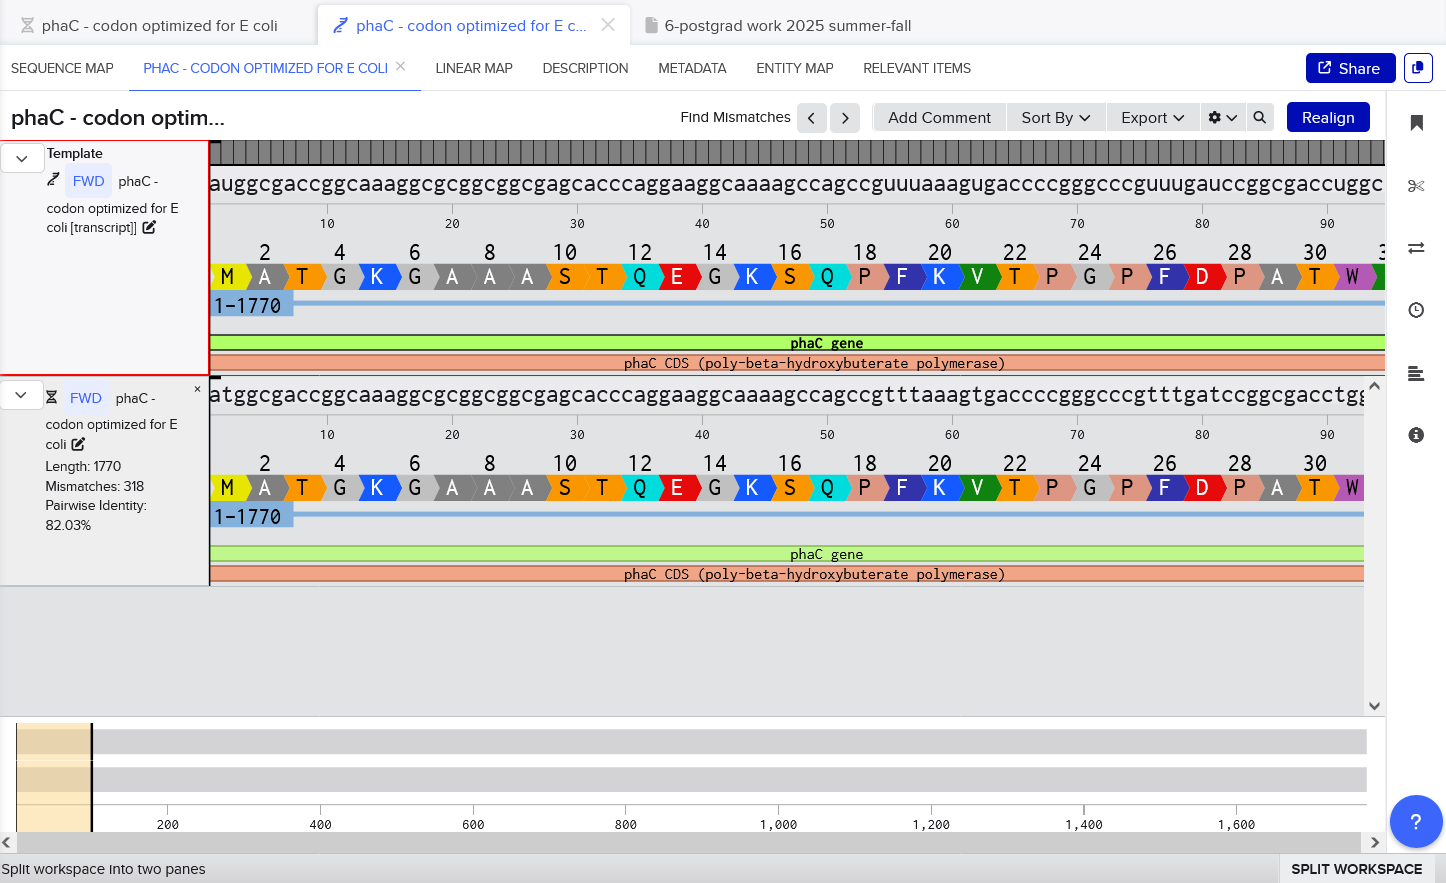
3.3 Codon optimize
I once again used the Benchling tool to codon optimize for E. coli K-12, but this time, I selected the Best Codon option in Benchling, and this was performed off the original C. necator phaC DNA sequence - although it should produce the same sequence if it was done as a reverse translate from the amino acid sequence too (since i confirmed that the phaC sequence does translate to the PhaC sequence with 100% identity).
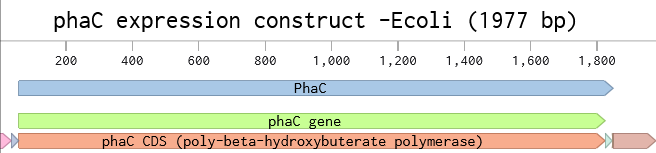
This sequence could be used to express PhaC in E. coli. I would probably put the gene onto an expression plasmid, under a strong constitutive promoter, just to ensure it works. After transforming E. coli with the plasmid, I would test expression by looking at protein production with a Western blot, and looking at cells under a microscope to look for PHA granules. I need to do a little more literature searching on heterologous expression of PhaC in E. coli - I think maybe other enzymes are needed for PHB synthesis.
3.5 Optional - how does it work in natural biological systems?
Describe how a single gene codes for multiple proteins at the transcriptional level. Different reading frames on the same string of DNA bases gives different codons that are off-set by which base (1-3) starts it. In this way, genes for multiple proteins can overlap on the same sequence of DNA.
Try aligning the DNA sequence, the transcribed RNA, and also the resulting translated Protein! I created the transcript by using Benchling to create a new RNA sequence off the reverse of my coodon-optimized sequence. I kept the annotations, so the translation should still be visible. Then I made a new alignment in Benchling using MAFFT with the automatic parameters. Again, the sequences match perfectly - although it’s not 100% identity because technically the T/U difference between DNA and RNA are considered mismatches, but we can see visually across the bottom of the screenshot that we don’t have any actual mismatches.
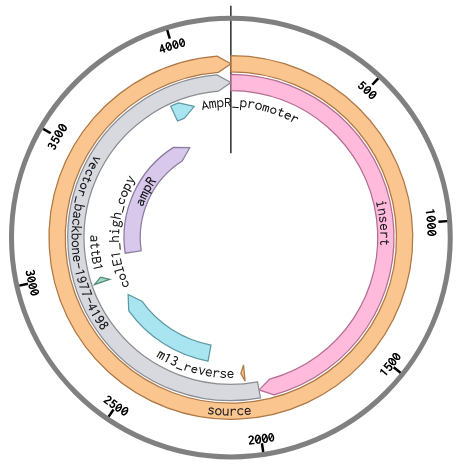
Part 4: Prepare a Twist DNA Synthesis Order
Following the instructions in the Week2 Homework, I added the J23106 promoter and an RBS at the beginning of my codon-optimized phaC sequence. My coding sequence already had a start and stop codon, so I didn’t need to add those. I inserted the 7x-His tag just before the stop codon, and then I put the terminator after the stop codon at the end.
I then set up the Twist order, as if I was going to order this cassette to be synthesized. Again, following the instructions for upload, I chose cloning vector pTwist Amp High Copy to make a full plasmid. My sequence was high complexity, so I went through the Twist codon optimization process to improve the sequence for easier synthesis. I chose E. coli as my host strain again, and selected the ORF that matched my gene. I chose the promoter and RBS, and terminator regions as regions to preserve during the codon optimization process so that it kept the sequences for the genetic parts that I chose. The optimized sequence was no longer high complexity as the regions of high GC% and repeats were changed.
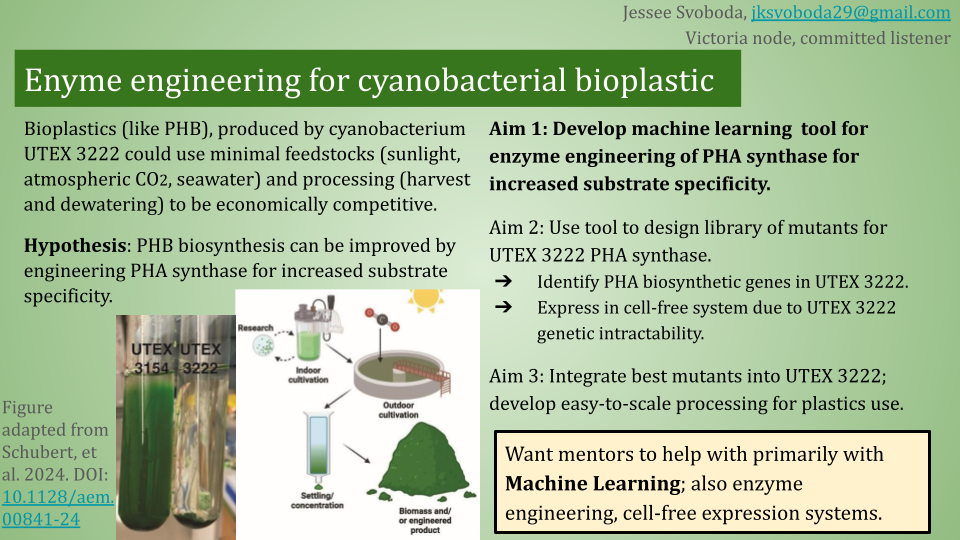
What DNA would you want to sequence (e.g., read) and why? I’d like to sequence the genomes of all cyanobacterial strains known to produce PHAs or specifically PHB (some already are sequenced, I think). I want to align all the known cyanobacterial PHA-synthases, and then align with the assembled genomes of the cyanobacterial strains known to produce PHAs that maybe aren’t annotated yet to try to find the PHA-synthases and add those to my comparisons.
In lecture, a variety of sequencing technologies were mentioned. What technology or technologies would you use to perform sequencing on your DNA and why? I would use third-generation sequencing on an Oxford nanopore. By using long-read technology, I would get much longer contigs, to make genomic assembly easier.
5.2 Write
What DNA would you want to synthesize (e.g., write) and why? I’d like to get a CRISPR-Cas12a multiplexed gRNA cassette synthesized. This would allow multiple genomic edits to occur simultaneously, if the appropriate repair templates are included (one for gRNA target).
What technology or technologies would you use to perform this DNA synthesis and why? I would submit an order to Twist to get this synthesized because it has multiple internal repeats because of the CRISPR region, which means traditional DNA synthesis technologies would struggle with this sequence.
5.3 Edit
What DNA would you want to edit and why? I’d like to improve PHA-synthase expression in my cyanobacterial chassis strain of choice (specific strain yet to be determined). This could be accomplished through promoter replacement if we’re staying in the genome rather than adding a plasmid, but I’d also be interested in knocking out other biosynthetic pathways to improve carbon flux towards PHA synthesis. So I’d want to edit the genomic DNA of a cyanobacterial chassis.
What technology or technologies would you use to perform these DNA edits and why? I’d use a CRISPR-Cas12a vector because it allows for multiplexed targeting, so I could make multiple genomic edits. Cas12a both processes the CRISPR-gRNA cassette and makes the cuts, so it requires fewer components than Cas9. Additionally, there’s some evidence suggesting Cas12a shows less off-target effects than Cas9.
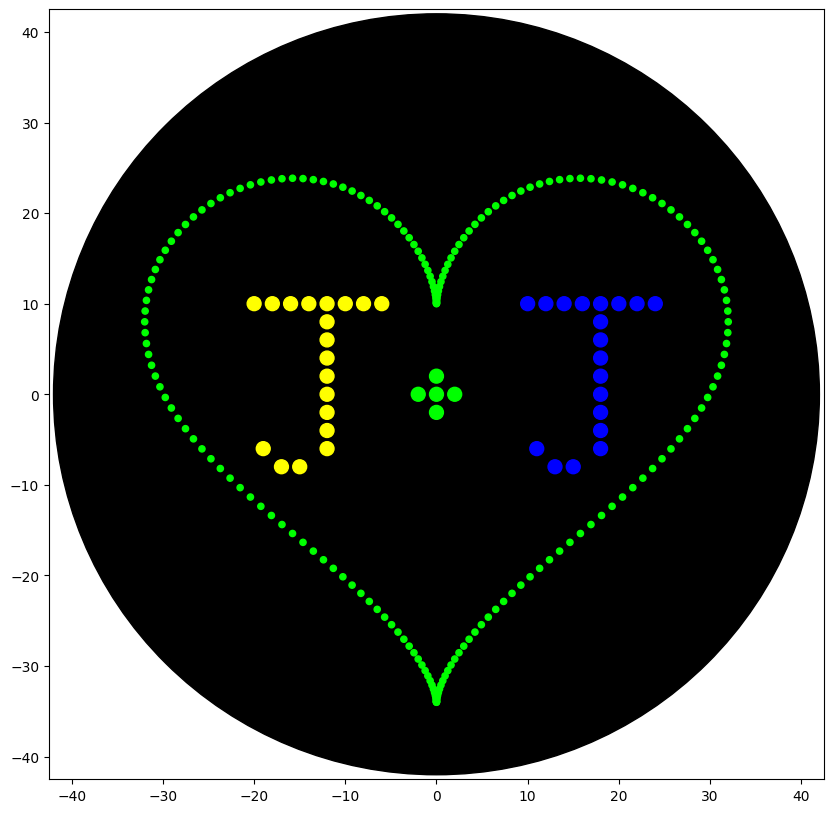
from opentrons import types

metadata = {    # see https://docs.opentrons.com/v2/tutorial.html#tutorial-metadata
    'author': 'JKS',
    'protocolName': 'heartJ',
    'description': 'writes the J+J inside a heart shape',
    'source': 'HTGAA 2026 Opentrons Lab',
    'apiLevel': '2.20'
}

##############################################################################
###   Robot deck setup constants - don't change these
##############################################################################

TIP_RACK_DECK_SLOT = 9
COLORS_DECK_SLOT = 6
AGAR_DECK_SLOT = 5
PIPETTE_STARTING_TIP_WELL = 'A1'

well_colors = {
    'A1' : 'Red',
    'B1' : 'Yellow',
    'C1' : 'Green',
    'D1' : 'Cyan',
    'E1' : 'Blue'       # if in a 24-well plate, this needs to be moved to e.g. D2
}

def run(protocol):
  ##############################################################################
  ###   Load labware, modules and pipettes
  ##############################################################################

  # Tips
  tips_20ul = protocol.load_labware('opentrons_96_tiprack_20ul', TIP_RACK_DECK_SLOT, 'Opentrons 20uL Tips')

  # Pipettes
  pipette_20ul = protocol.load_instrument("p20_single_gen2", "right", [tips_20ul])

  # Modules
  temperature_module = protocol.load_module('temperature module gen2', COLORS_DECK_SLOT)

  # Temperature Module Plate
  temperature_plate = temperature_module.load_labware('opentrons_96_aluminumblock_generic_pcr_strip_200ul',
                                                      'Cold Plate')
  # Choose where to take the colors from
  color_plate = temperature_plate

  # Agar Plate
  agar_plate = protocol.load_labware('htgaa_agar_plate', AGAR_DECK_SLOT, 'Agar Plate')  ## TA MUST CALIBRATE EACH PLATE!
  # Get the top-center of the plate, make sure the plate was calibrated before running this
  center_location = agar_plate['A1'].top()

  pipette_20ul.starting_tip = tips_20ul.well(PIPETTE_STARTING_TIP_WELL)

  ##############################################################################
  ###   Patterning
  ##############################################################################

  ###
  ### Helper functions for this lab
  ###

  # pass this e.g. 'Red' and get back a Location which can be passed to aspirate()
  def location_of_color(color_string):
    for well,color in well_colors.items():
      if color.lower() == color_string.lower():
        return color_plate[well]
    raise ValueError(f"No well found with color {color_string}")

  # For this lab, instead of calling pipette.dispense(1, loc) use this: dispense_and_detach(pipette, 1, loc)
  def dispense_and_detach(pipette, volume, location):
      """
      Move laterally 5mm above the plate (to avoid smearing a drop); then drop down to the plate,
      dispense, move back up 5mm to detach drop, and stay high to be ready for next lateral move.
      5mm because a 4uL drop is 2mm diameter; and a 2deg tilt in the agar pour is >3mm difference across a plate.
      """
      assert(isinstance(volume, (int, float)))
      above_location = location.move(types.Point(z=location.point.z + 5))  # 5mm above
      pipette.move_to(above_location)       # Go to 5mm above the dispensing location
      pipette.dispense(volume, location)    # Go straight downwards and dispense
      pipette.move_to(above_location)       # Go straight up to detach drop and stay high

  ###
  ### YOUR CODE HERE to create your design
  ###

  ### heart pattern taken from Selin Sahin (2023)
  def heart_pattern(n, r, color_string, center_location):
    # generate list of points forming the heart
    scaling_factor = -2/r  # calculate scaling factor to fit pattern within 40mm radius circle
    angle_step = 2*math.pi/n
    coords = []
    for i in range(n):
        angle = i * angle_step
        x = scaling_factor*r*(16*math.sin(angle)**3)
        y = scaling_factor*(-r*(13*math.cos(angle) - 5*math.cos(2*angle) - 2*math.cos(3*angle) - math.cos(4*angle)))
        coords.append((x, y))


####PICK UP TIP HERE####
    pipette_20ul.pick_up_tip()

    print_every = 1     # 1=print every point; 2=print every other point; 3=print every third...

    # now plot the points
    for i, (x,y) in enumerate(coords):
        #print(i,(x,y))
        if i % (100*print_every) == 0:  # 20uL/0.2uL = 100
            # every 20th point we're printing starting with the first, aspirate 20uL total from Well 1
            pipette_20ul.aspirate(min(20, math.ceil((len(coords)-i)/print_every)), location_of_color(color_string))
        # print every other point we've calculated (was too dense otherwise)
        if i % print_every == 0:
            adjusted_location = center_location.move(types.Point(x, y))
            dispense_and_detach(pipette_20ul, 0.2, adjusted_location)

    ####DROP TIP####
    pipette_20ul.drop_tip()

  ##################################
  #### DRAW PATTERN ####
  ##################################

  heart_pattern(200, 50, 'Green', center_location)

  ###### write
  # letter J1
  pipette_20ul.pick_up_tip()

  pipette_20ul.aspirate(8, location_of_color('Yellow'))

  cursor = center_location.move(types.Point(x=-20, y = 12))

  for i in range(8):
    dispense_and_detach(pipette_20ul, 1, cursor.move(types.Point(y=-2)))
    cursor = cursor.move(types.Point(x =2))

  cursor = cursor.move(types.Point(x=-10, y=-4))

  pipette_20ul.aspirate(8, location_of_color('Yellow'))
  for i in range(8):
    dispense_and_detach(pipette_20ul, 1, cursor.move(types.Point(x=2)))
    cursor = cursor.move(types.Point(y =-2))

  pipette_20ul.aspirate(3, location_of_color('Yellow'))
  for i in range(2):
    dispense_and_detach(pipette_20ul, 1, cursor.move(types.Point(x=-1)))
    cursor = cursor.move(types.Point(x =-2))

  cursor = cursor.move(types.Point(x=-1, y=2))
  dispense_and_detach(pipette_20ul, 1, cursor)

  pipette_20ul.drop_tip()

### +sign
  pipette_20ul.pick_up_tip()

  cursor = center_location.move(types.Point(x=-4))

  pipette_20ul.aspirate(5, location_of_color('Green'))
  for i in range(3):
    dispense_and_detach(pipette_20ul, 1, cursor.move(types.Point(x=2)))
    cursor = cursor.move(types.Point(x=2))

  cursor = cursor.move(types.Point(x=-2, y=2))
  dispense_and_detach(pipette_20ul, 1, cursor)

  cursor = cursor.move(types.Point(y=-4))
  dispense_and_detach(pipette_20ul, 1, cursor)

  pipette_20ul.drop_tip()

  # letter J2
  pipette_20ul.pick_up_tip()

  pipette_20ul.aspirate(8, location_of_color('Blue'))

  cursor = center_location.move(types.Point(x=10, y = 12))

  for i in range(8):
    dispense_and_detach(pipette_20ul, 1, cursor.move(types.Point(y=-2)))
    cursor = cursor.move(types.Point(x =2))

  cursor = cursor.move(types.Point(x=-10, y=-4))

  pipette_20ul.aspirate(8, location_of_color('Blue'))
  for i in range(8):
    dispense_and_detach(pipette_20ul, 1, cursor.move(types.Point(x=2)))
    cursor = cursor.move(types.Point(y =-2))

  pipette_20ul.aspirate(3, location_of_color('Blue'))
  for i in range(2):
    dispense_and_detach(pipette_20ul, 1, cursor.move(types.Point(x=-1)))
    cursor = cursor.move(types.Point(x =-2))

  cursor = cursor.move(types.Point(x=-1, y=2))
  dispense_and_detach(pipette_20ul, 1, cursor)

  pipette_20ul.drop_tip()
  # Don't forget to end with a drop_tip()
Post-lab questions
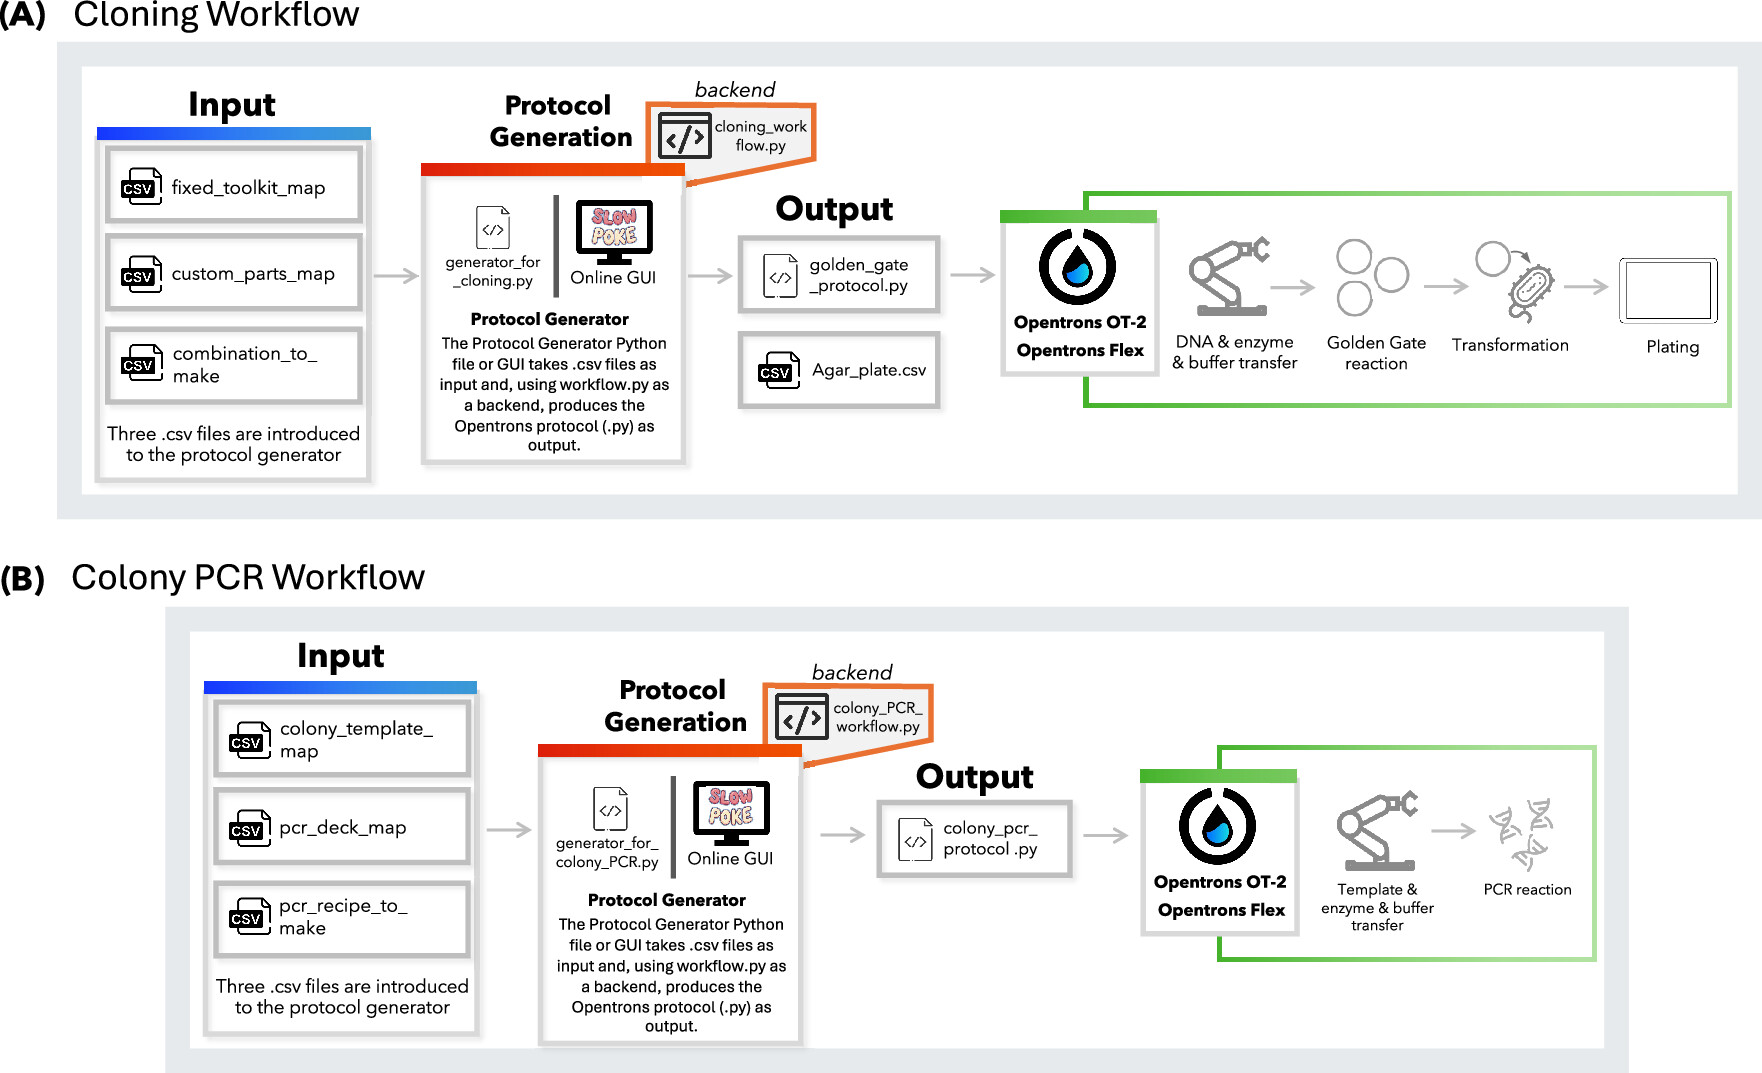
Find and describe a published paper that utilizes the Opentrons or an automation tool to achieve novel biological applications. A paper published this month in ACS Synthetic Biology details a new workflow for automating MoClo plasmid assembly and transformation, with a semi-automated colony PCR on an Opentrons OT-2 and Opentrons Flex. These workflows are designed to be user-friendly and output the Opentrons protocol from user-supplied CSV files, which provided README files describe how to produce.
Alternatively, the authors also developed a graphical user interface which requires no coding ability. This is a novel application because it is only the second automation of MoClo/Golden Gate cloning for Opentrons system (as opposed to advanced high-throughput liquid handling systems), and this new workflow does not require Python ability as the previously published AssemblyTron workflow.
These workflows were validated by assembling plasmids with the MoClo Yeast Toolkit and MoClo SubtiToolKit, and transforming these plasmids into Saccharomyces cerevisiae and sequentially Escherichia coli and Bacillus subtilis, respectively. With both toolkits, the automated procedure achieved efficiency comparable to the manual procedures (> 90% and 60%, respectively).
Figure 1: Schematic overview of the protocol design workflows developed for the Opentrons platform. Protocols can be generated using either the generator.py Python script via the command line or the online Slowpoke tool, which features a user-friendly GUI. Both tools run the workflow.py files in the backend. (A) Workflow for Golden Gate-based cloning, where users define genetic part layouts and assembly combinations. (B) Workflow for colony PCR, including colony selection, reagent layout, and reaction recipe input.
Malci, K; Meng, F; Galez, H; et al. Slowpoke: An Automated Golden Gate Cloning Workflow for Opentrons OT-2 and Flex. 2026. ACS Synthetic Biology, 15(2): 511-521. DOI: 10.1021/acssynbio.5c00629
Write a description about what you intend to do with automation tools for your final project. I’d want to utilize the Opentrons set-up in the Victoria node to enable the possible execution of my medium-term aim with as little scientist benchtime as possible. I don’t know the exact make and model of all modules that the Victoria Opentrons has, but below is a series of possible steps that might be automatable (best use of automation would be medium or high throughput, depending on the number of designs we are able to test):
Gibson Assembly or MoClo plasmid assembly
Transfer reaction components into wells
Heat block for digestion/ligation/PCR steps
Transformation of expression plasmid
Transfer plasmids and competent cells into wells
Heat block for heat shock
Transfer media into wells
Heated shaker for recovery
Incubator for overnight growth
Stamp onto new plate or pick into multiple liquid cultures for culturing
Incubator or heated shaker for overnight growth
Readout
Transfer cells (and reagents) into wells
Plate reader for fluorescent or colorimetric output
Final project ideas
Brainstorming:
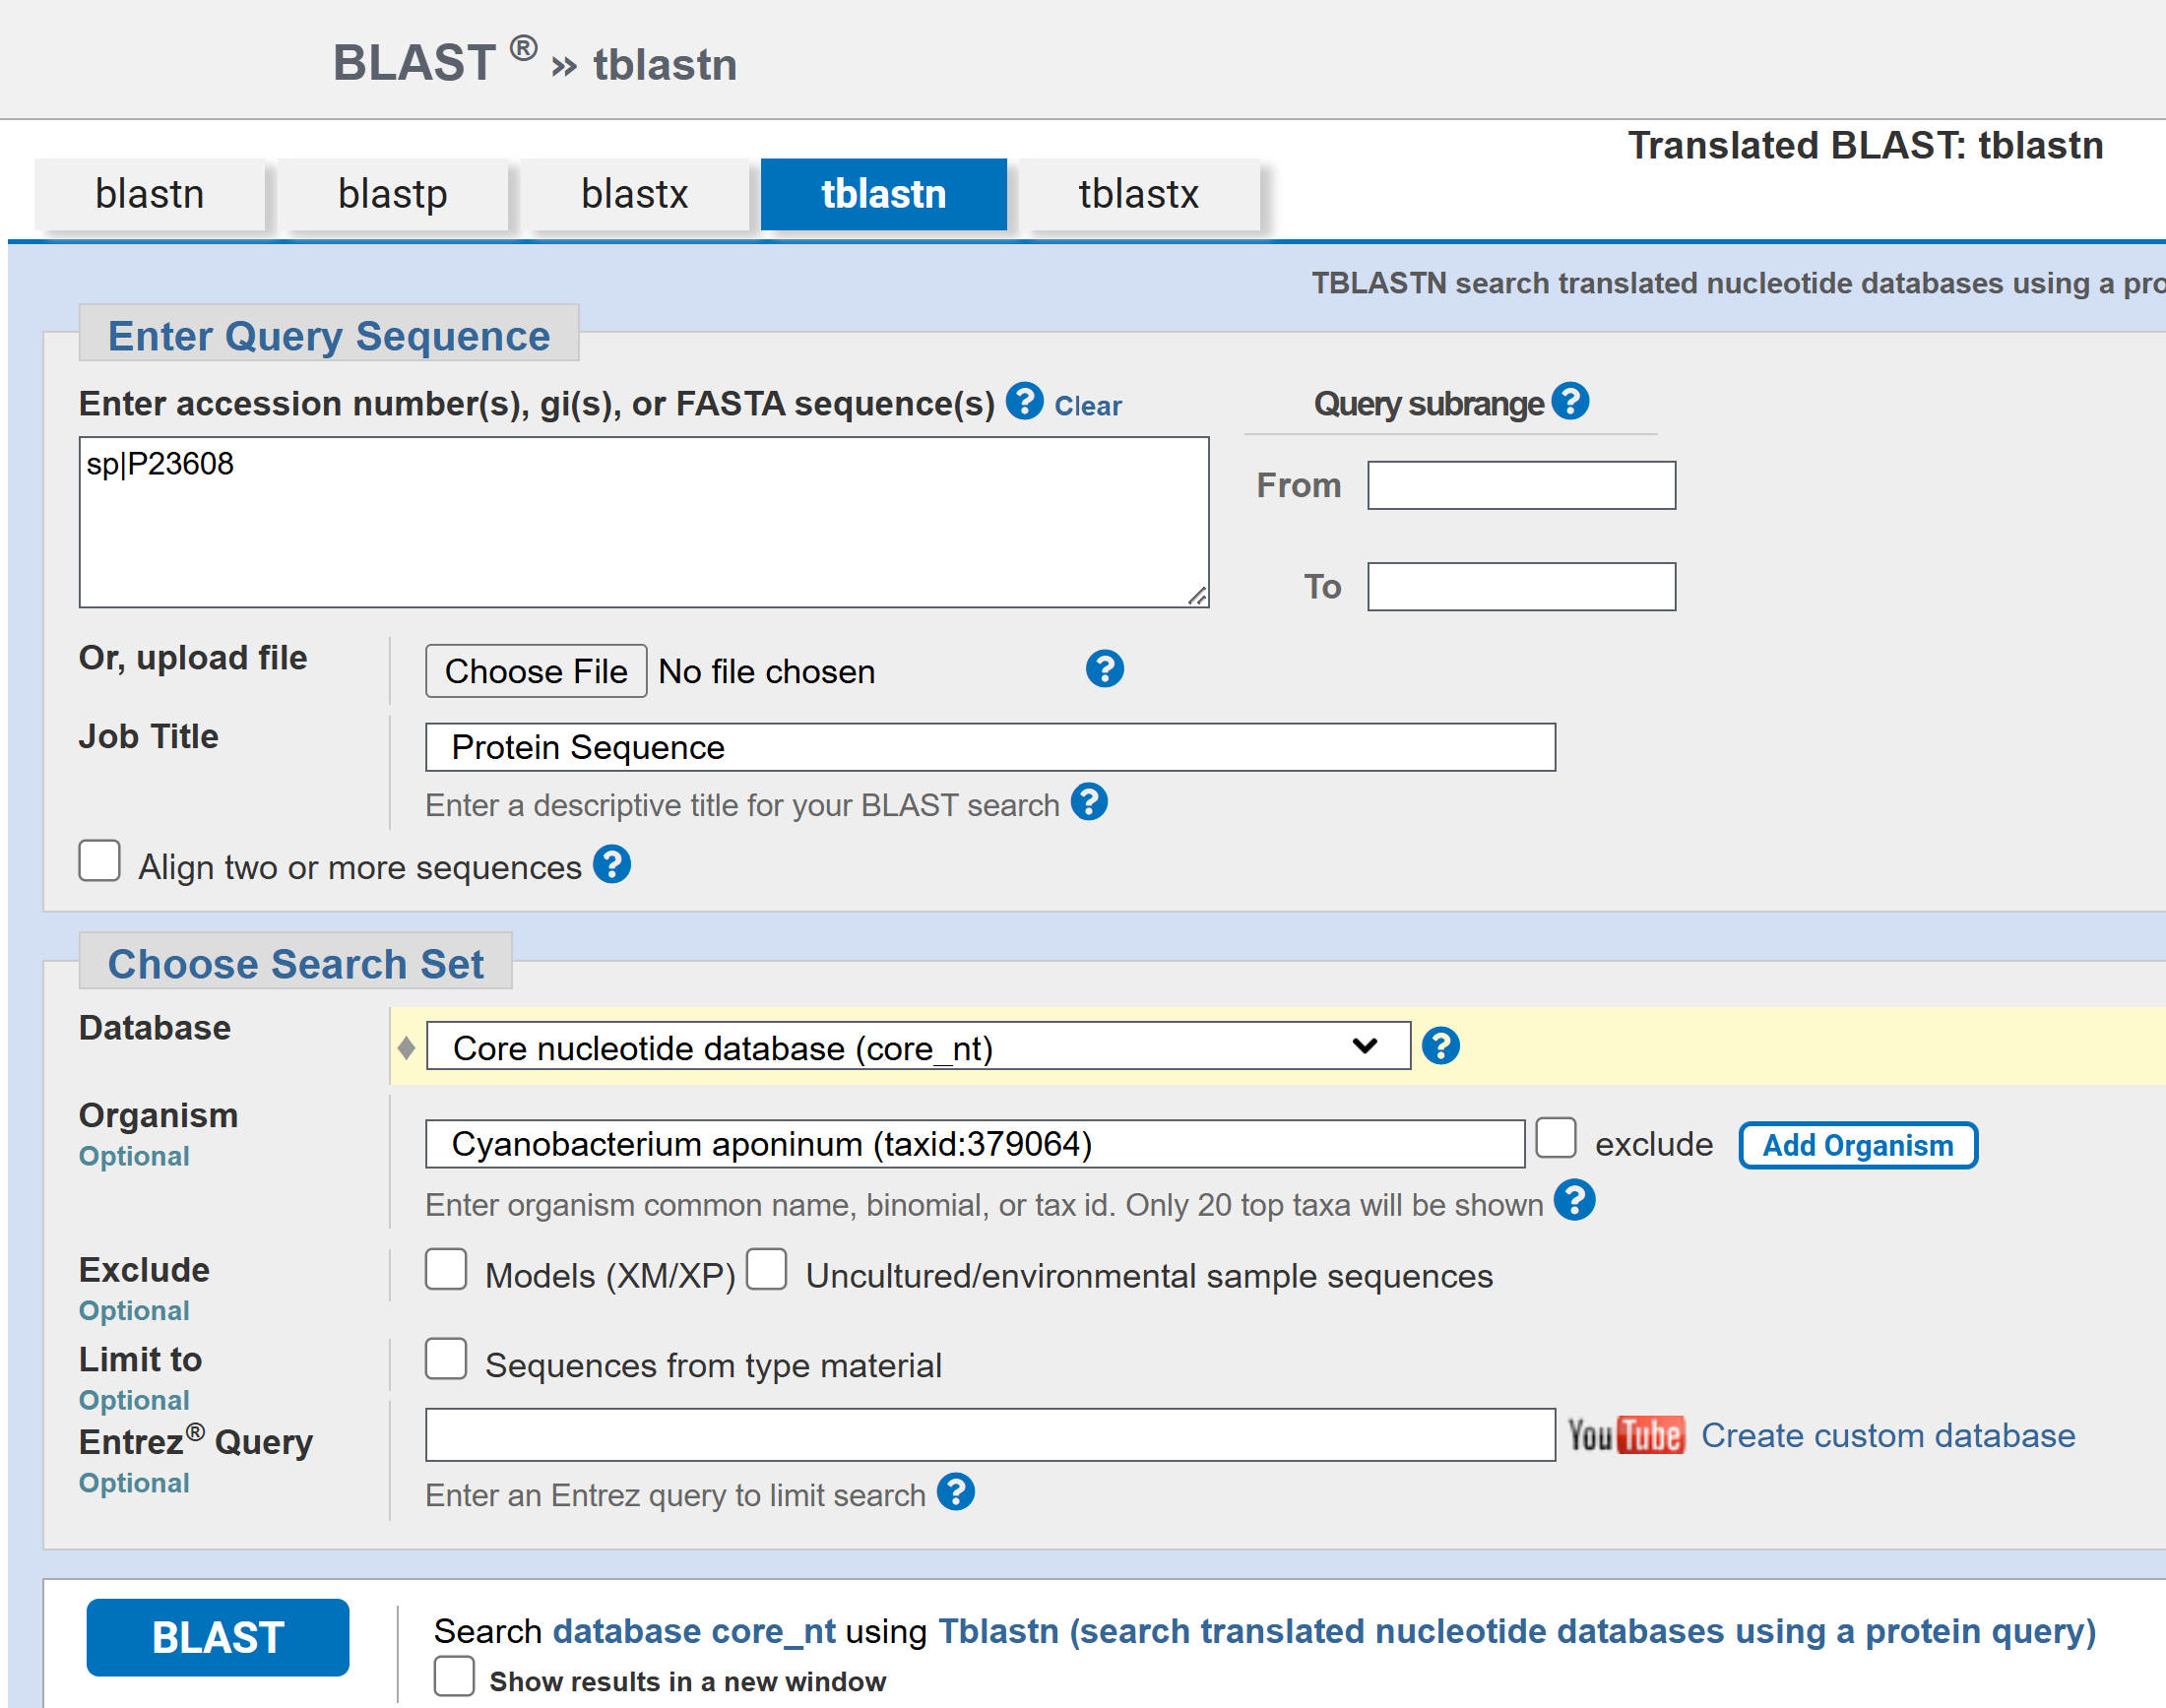
Identification of PhaC analog in Cyanobacterium aponium UTEX 3222 and overproducing or engineering for increased efficiency
BLAST/align with known PHA-synthases
Compare efficiency / mutations that improved turnover in other PhaC - test analogous mutations (aligned location, similar or different AAs). improved substrate specificity?
Site-specific saturation mutagenesis? Would be good use for automation
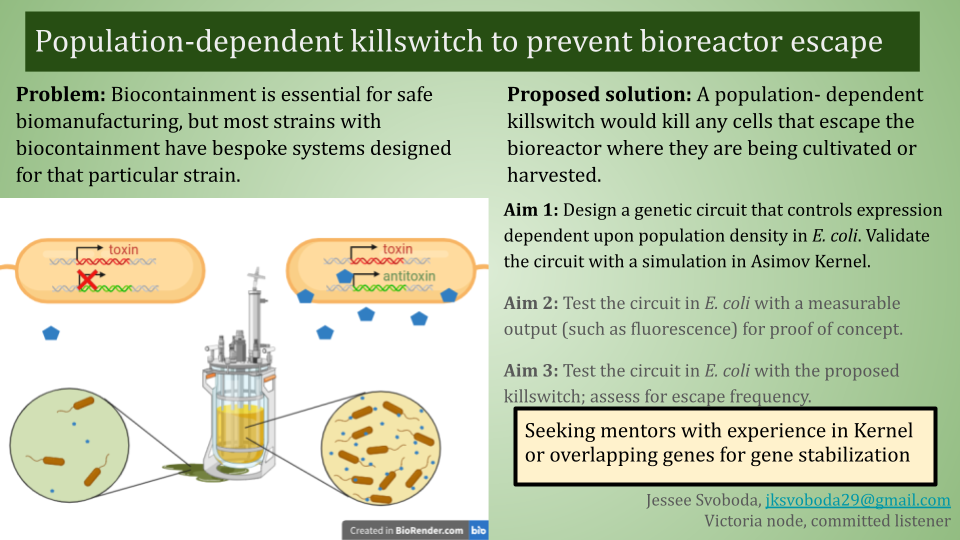
Quorum sensing based killswitch (i.e. cell dies if it escapes bioreactor)
Has to have some kind of inducible element or won’t grow after initial transformation
What’s good at quorum sensing already?
Something else??? Something in E coli that can be done on Opentron
Because it’s more convenient for a final project to be executed in Victoria remotely
Cyanobacterial expression plasmid across multiple cyano species
needs to include E coli machinery for manipulation and production (and conjugation, for relevant species)
Ideas:
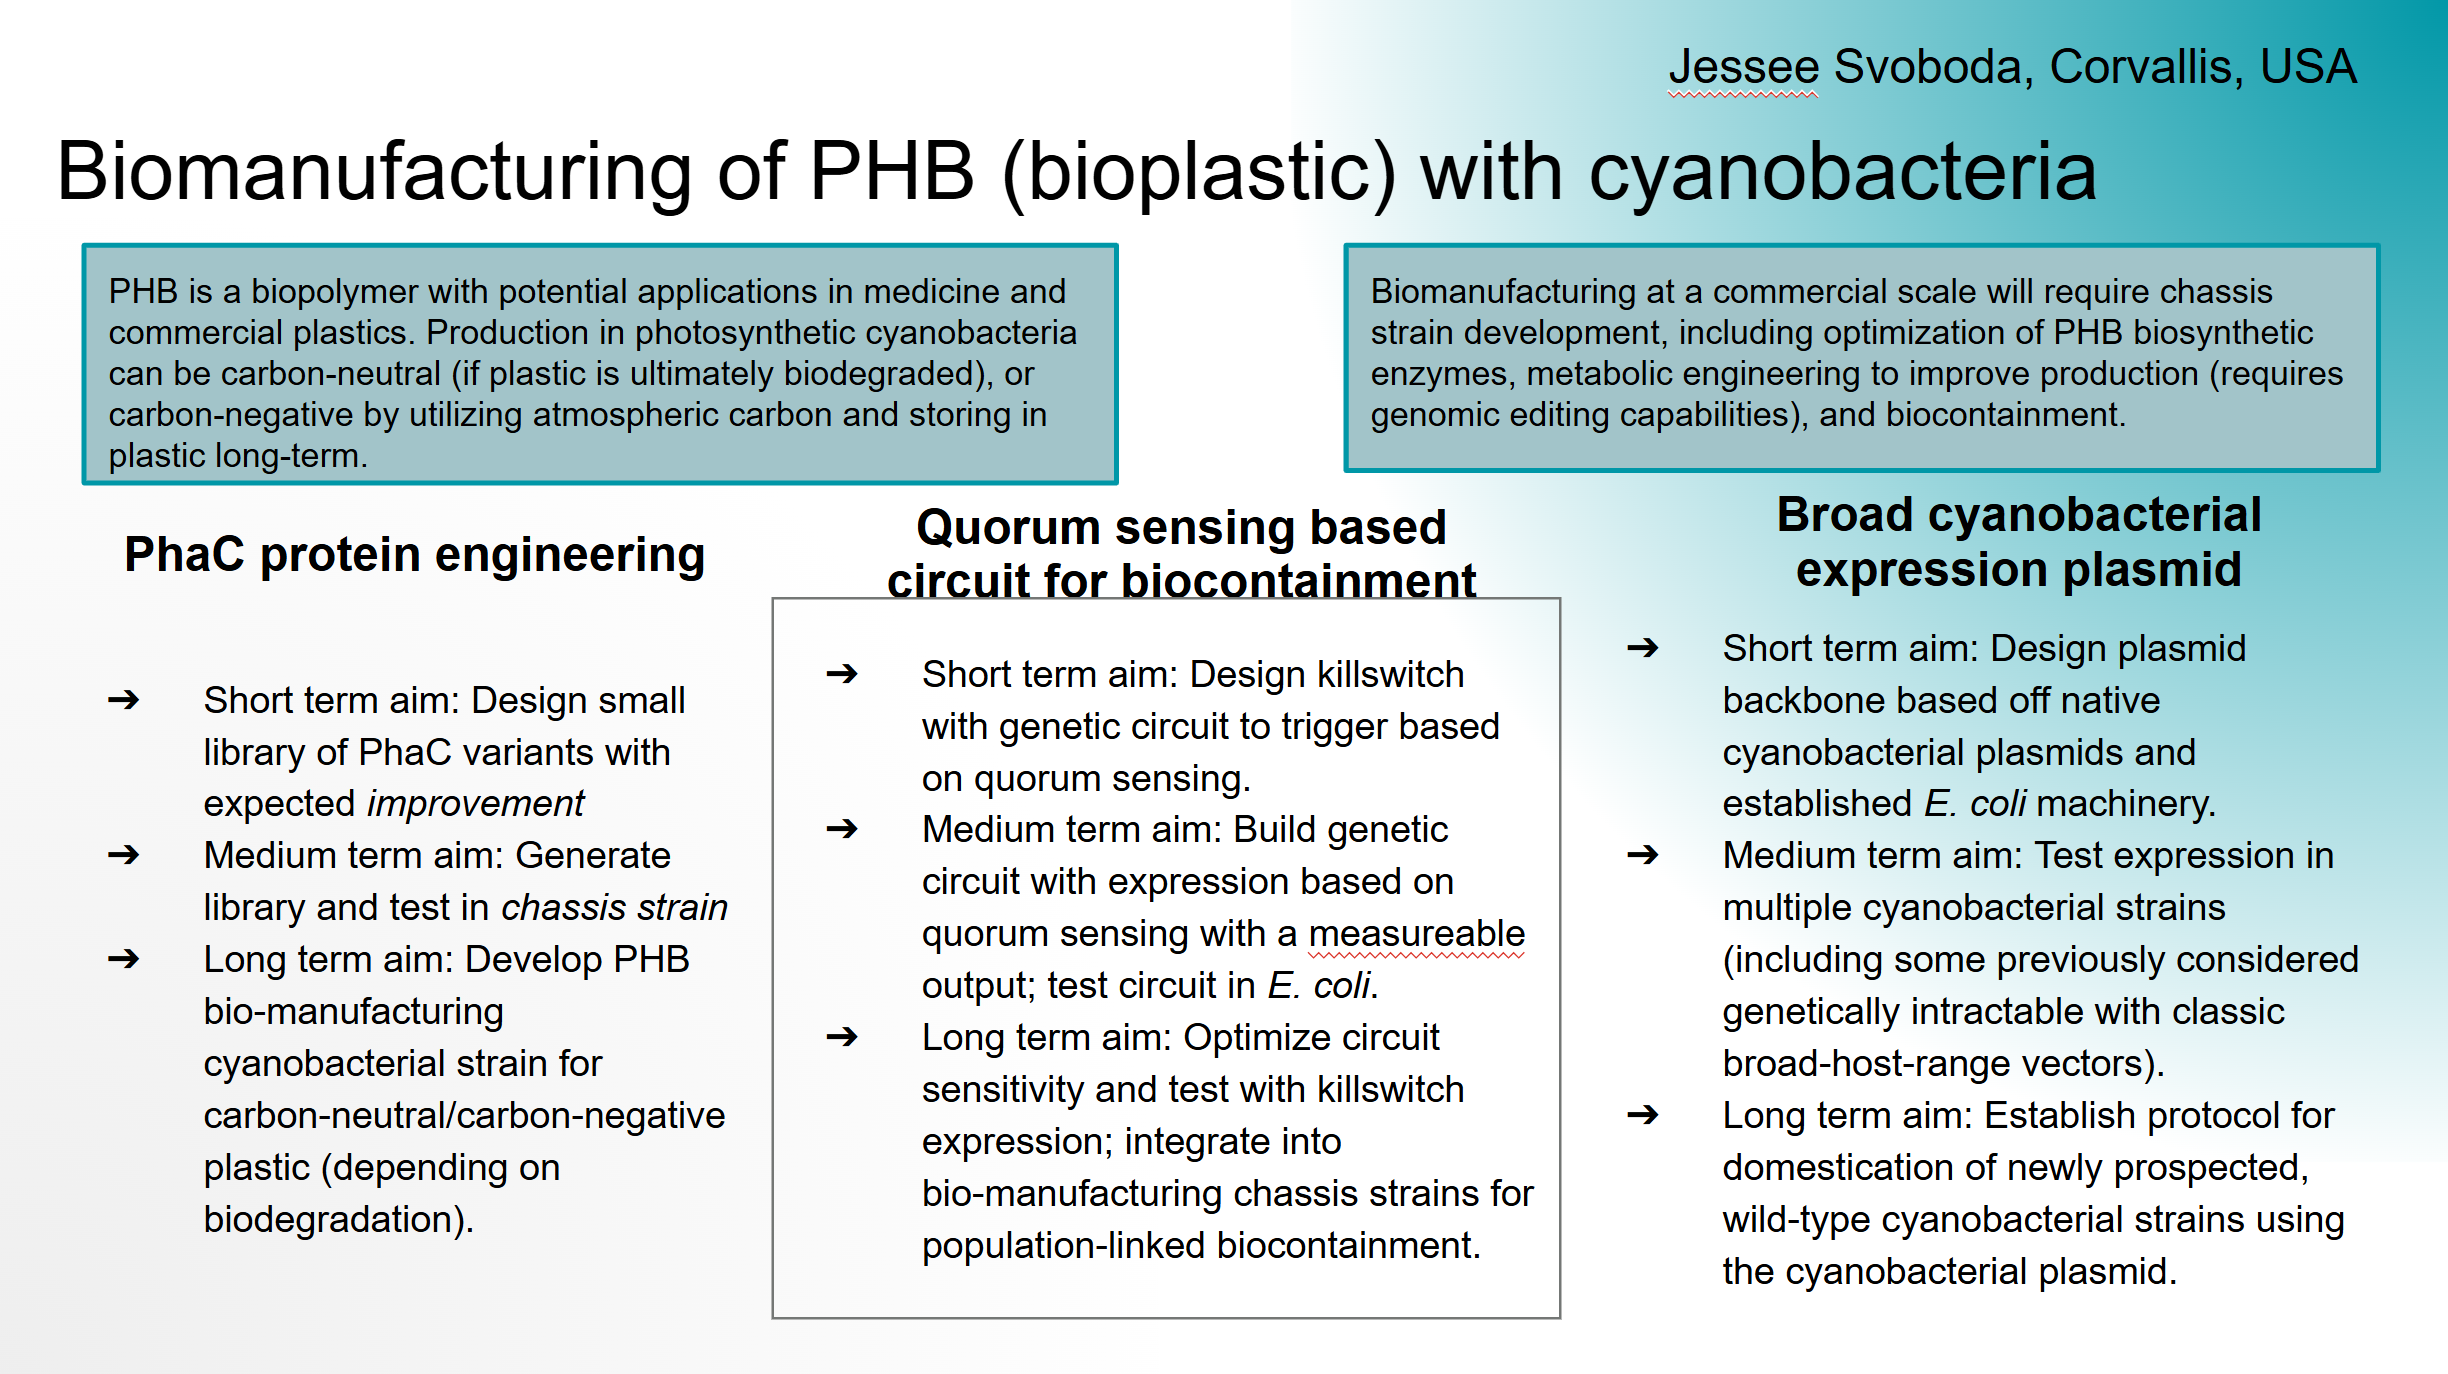
PhaC protein engineering
Short term aim: Design small library of PhaC variants with expected improvement
Medium term aim: Generate library and test in chassis strain
Long term aim: Develop PHB bio-manufacturing cyanobacterial strain for carbon-neutral/carbon-negative plastic (depending on biodegradation).
Quorum sensing based circuit for biocontainment
Short term aim: Design killswitch with genetic circuit to trigger based on quorum sensing.
Medium term aim: Build genetic circuit with expression based on quorum sensing with a measureable output; test circuit in E. coli.
Long term aim: Optimize circuit sensitivity and test with killswitch expression; integrate into bio-manufacturing chassis strains for population-linked biocontainment.
Broad cyanobacterial expression plasmid
Short term aim: Design plasmid backbone based off native cyanobacterial plasmids and established E. coli machinery.
Medium term aim: Test expression in multiple cyanobacterial strains (including some previously considered genetically intractable with classic broad-host-range vectors).
Long term aim: Establish protocol for domestication of newly prospected, wild-type cyanobacterial strains using the cyanobacterial plasmid.
Need to answer 9/11 questions; I skipped 7 and 11.
How many molecules of amino acids do you take with a piece of 500 grams of meat? (on average an amino acid is ~100 Daltons) $$ 500g * \frac{1 mol AA}{100g} = 5 mol AA $$
$$ 5 mol * \frac{6.02*10^{23} molecules}{1 mol} = 3.01 E24 molecules $$
Why do humans eat beef but do not become a cow, eat fish but do not become fish? We break down the proteins during digestion to the constituent amino acids. These amino acids are then used in our cells to build human proteins.
Why are there only 20 natural amino acids? It’s been hypothesized that the 20 naturally occurring amino acids fairly effectively cover the “chemical space”, which would indicate that more complex or diverse amino acids are not needed for increasing function. This includes variation in chemical properties like molecular size, hydrophobicity, and charge, but also rotational conformations. These twenty sufficiently cover the space for effective function while also being relatively low in energy (easy to synthesize). Another paper hypothesizes that all twenty natural amino acids predate the RNA world, and in fact were naturally synthesized prebiotically with mineral catalysts - thus suggesting that the development of the three-base 64-codon alphabet actually was because a two-base 16-codon alphabet would restrict to sixteen instead of the existing 20 amino acids.
Doig, AJ. Frozen, but no accident – why the 20 standard amino acids were selected. 2017. FEBS J, 284: 1296-1305. doi: 10.1111/febs.13982
Bywater RP. Why twenty amino acid residue types suffice(d) to support all living systems. 2018. PLoS One, 13(10):e0204883. doi: 10.1371/journal.pone.0204883
Can you make other non-natural amino acids? Design some new amino acids. There are a new non-cannonical amino acids that people have designed and used, by changing the residue for an unnatural one.
Where did amino acids come from before enzymes that make them, and before life started?
In 2018, Bywater suggested that amino acids were synthesized prebiotically, with the simpler structures occurring through aqueous reactions, and more complex structures requiring mineral catalysts. Many amino acids have been identified on meteorites, suggesting that amino acids could have originated in outer space, but more likely that the conditions to synthesize the “simpler” amino acids exist in multiple places. Other researchers have suggested that the “complex” amino acids must have been biosynthesized by early proteins made up of “simple” amino acids, and in particular, that histidine, phenylalanine, cysteine, methionine, tryptophan and tyrosine had to come after molecular oxygen because they have redox functionality.
Doig, AJ. Frozen, but no accident – why the 20 standard amino acids were selected. 2017. FEBS J, 284: 1296-1305. doi: 10.1111/febs.13982
Bywater RP. Why twenty amino acid residue types suffice(d) to support all living systems. 2018. PLoS One, 13(10):e0204883. doi: 10.1371/journal.pone.0204883
If you make an α-helix using D-amino acids, what handedness (right or left) would you expect? I would expect D-amino acids would form a left-handed helix because L-amino acids form right-handed helices.
Can you discover additional helices in proteins?
Why are most molecular helices right-handed? In general, naturally occuring amino acids are L-enantiomers, which leads to right-handed helices because of steric hindrance requiring the side chains to point outwards.
Why do β-sheets tend to aggregate? What is the driving force for β-sheet aggregation? Because beta sheets are flat, they can stack, and the large surface area means that the side-chains can have interactions (especially hydrophobic side-chains) between the sheets.
Why do many amyloid diseases form β-sheets? Can you use amyloid β-sheets as materials? Amyloids are ordered protein aggregates consisting of repeating beta sheet motif. Proteins that have an alternative folding structure with a lot of beta sheets become amyloids when they self-assemble into fibrils, and the alternative conformation with the beta sheets is energetically stable. Amyloid diseases usually are from a single amyloid-forming protein. Because of their tendency to self-assemble, I think you could use amyloid beta sheets as materials for DNA origami.
Riek R. The Three-Dimensional Structures of Amyloids. 2017. Cold Spring Harb Perspect Biol;9(2):a023572. doi: 10.1101/cshperspect.a023572.
Ow SY, Dunstan DE. A brief overview of amyloids and Alzheimer’s disease. 2014. Protein Sci;23(10):1315-31. doi: 10.1002/pro.2524.
Design a β-sheet motif that forms a well-ordered structure.
Part B: Protein Analysis and Visualization
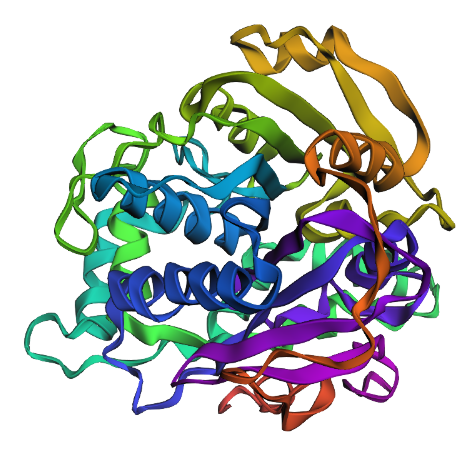
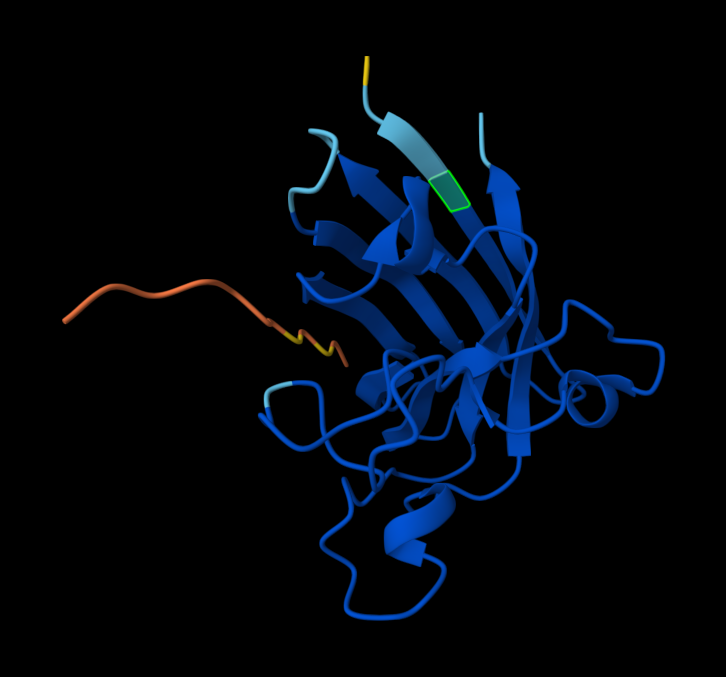
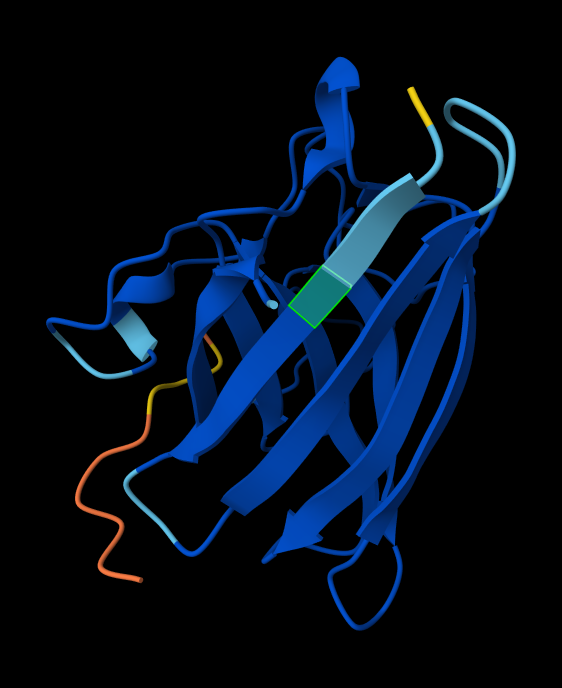
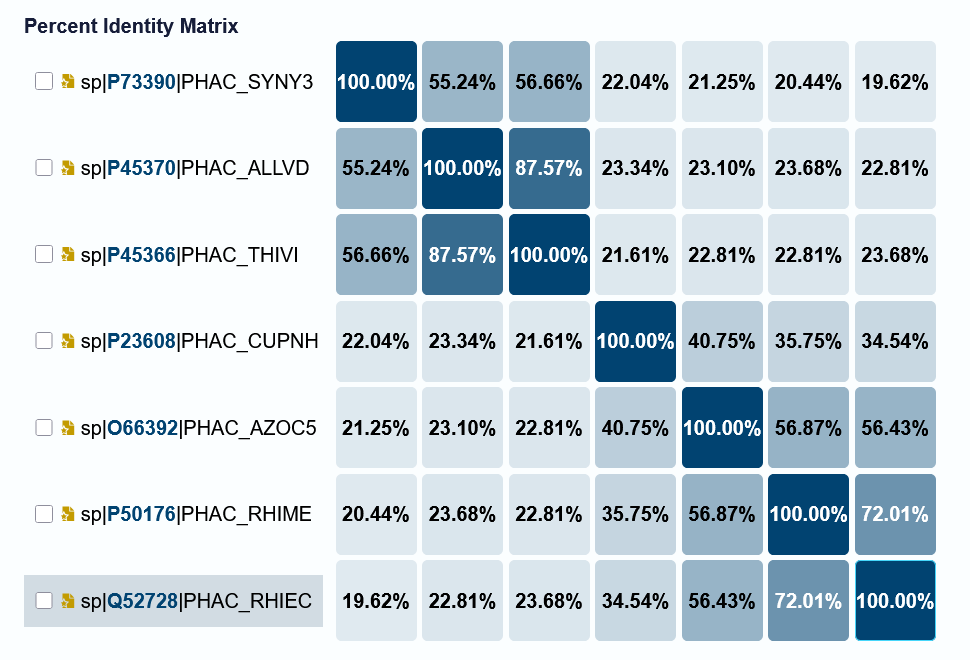
Briefly describe the protein you selected and why you selected it. I chose PhaC from Cupriavidus necator. PhaC is a polyhydroxyalkanoate-synthase, used in biopolymer production. I selected it because engineering PhaC is one of my potential final projects. The C-terminal domain is believed to be the catalystic domain, and it has a solved crystal structure. The N-terminal domain does not have a solved crystal structure, and is believed to potentially be involved in substrate specificity.
Identify the amino acid sequence of your protein. \
How long is it? What is the most frequent amino acid? 390 amino acids (when i removed the His-tag at the end). Most frequent amino acid is A (alanine).
How many protein sequence homologs are there for your protein? BLAST found 250 sequence homologs - mostly belonging to other bacteria that biosynthesize PHAs.
Does your protein belong to any protein family? It’s classified as a transferase.
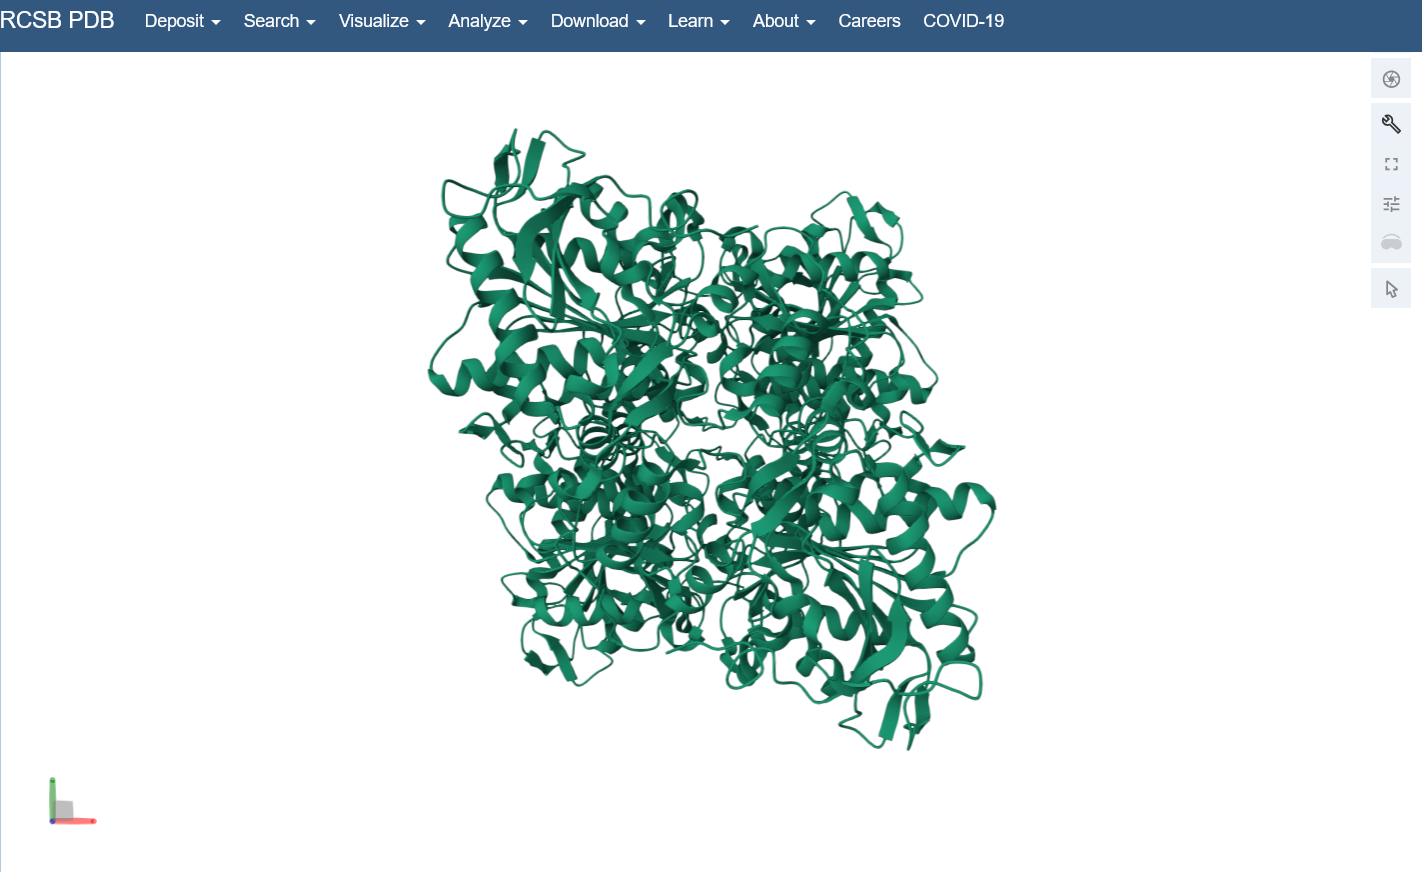
Identify the structure page of your protein in RCSB C. necator PhaC (C-terminal domain) has been uploaded to RCSB PDB here.
When was the structure solved? Is it a good quality structure? The structure was solved in 2016 by two different and unrelated groups, which is a good sign for repeatability (PDB 5HZ2 and 5T6O). It has a resolution of 1.8Å, which is a good quality structure.
Are there any other molecules in the solved structure apart from protein? Yes, there is a sulfate ion and a glycerol molecule.
Does your protein belong to any structure classification family? Nothing that I could find on SCOP.
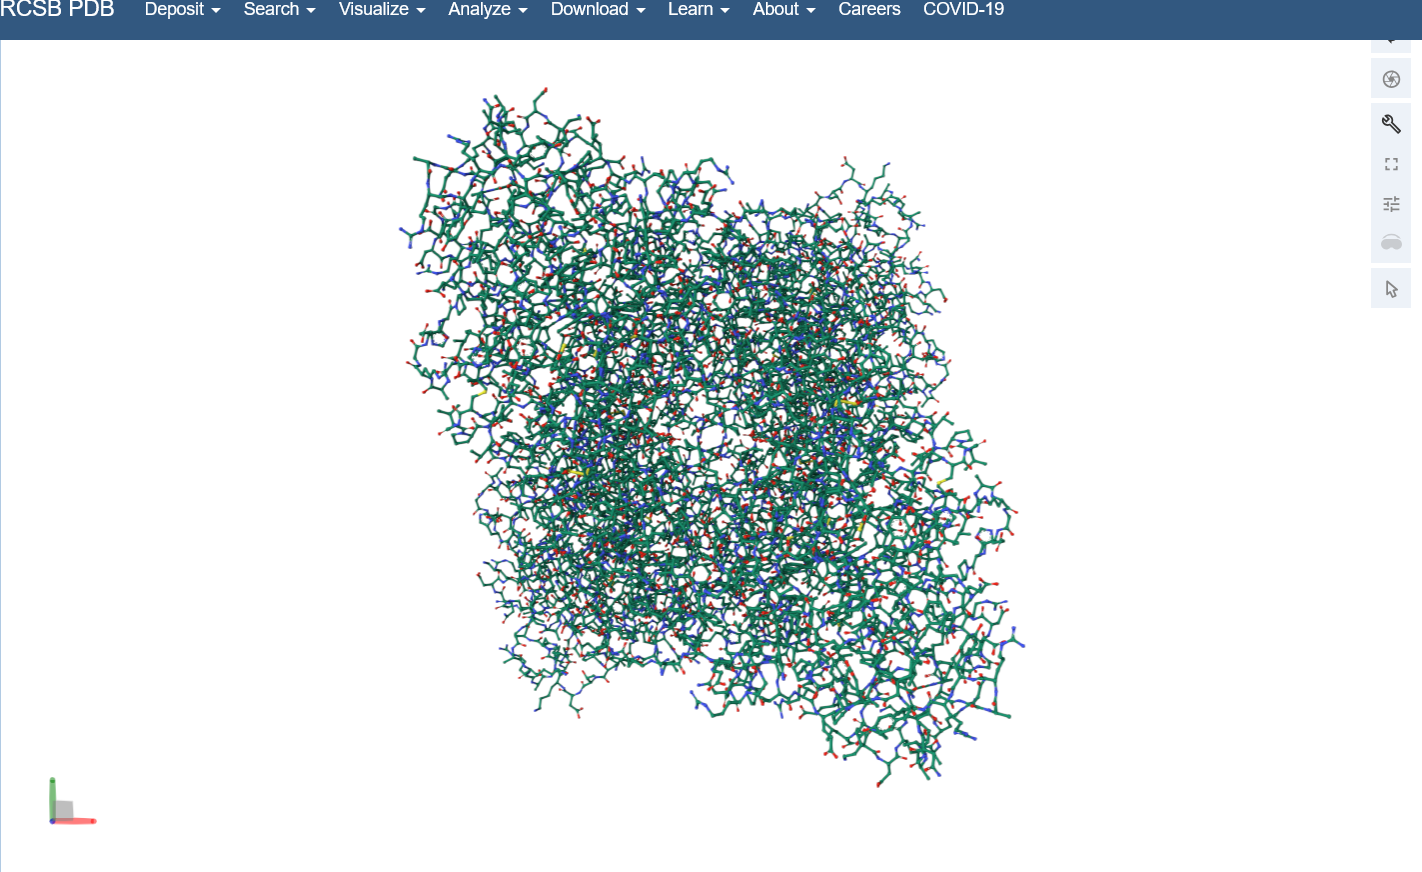
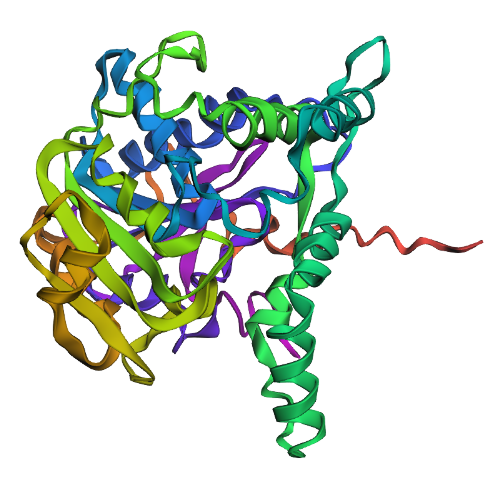
Open the structure of your protein in any 3D molecule visualization software: I used the structure viewer on the PDB website because I wasn’t able to download PyMol on my laptop (not enough memory space).
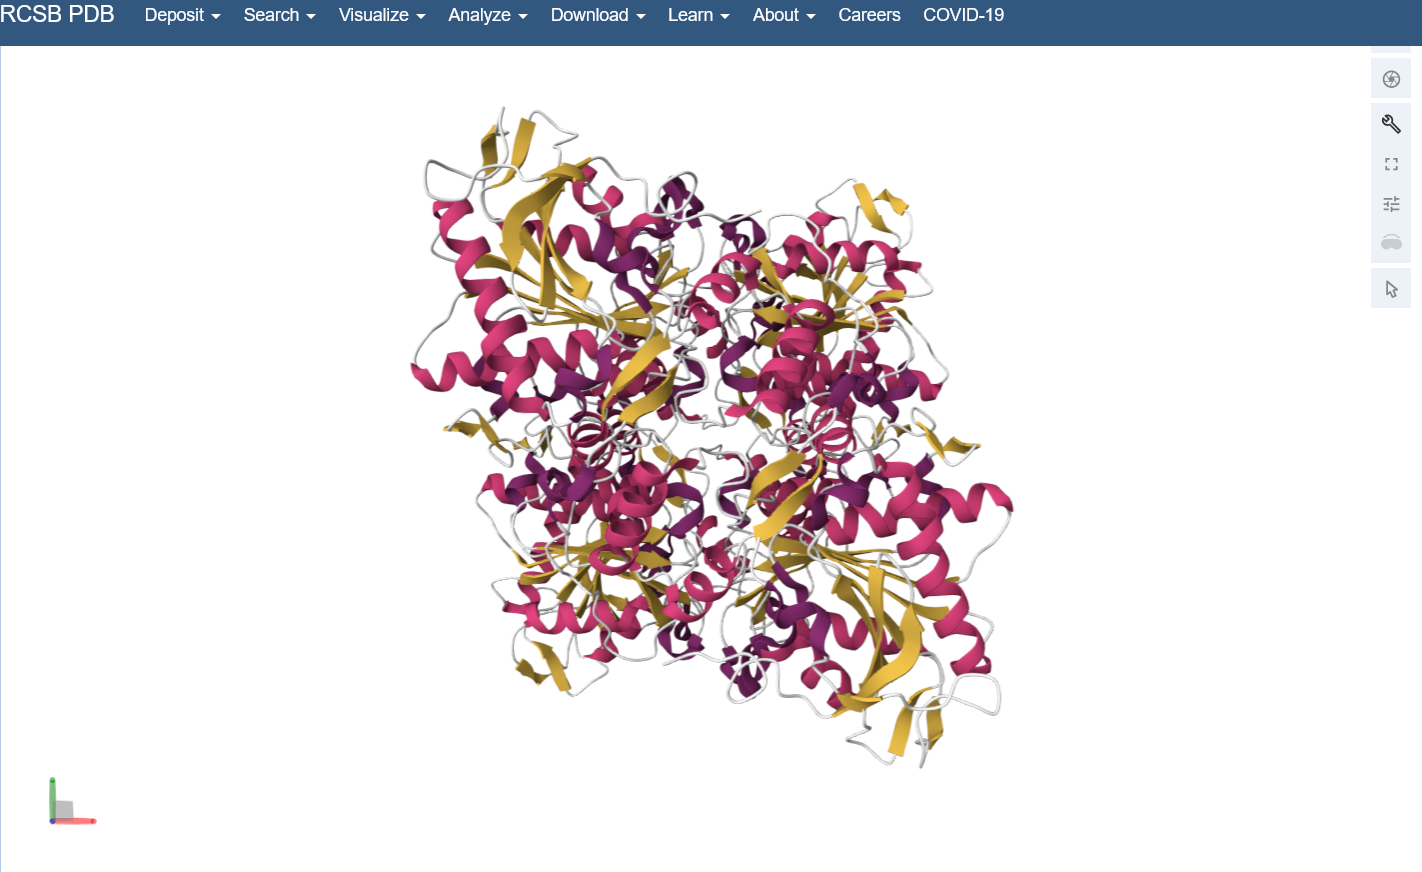
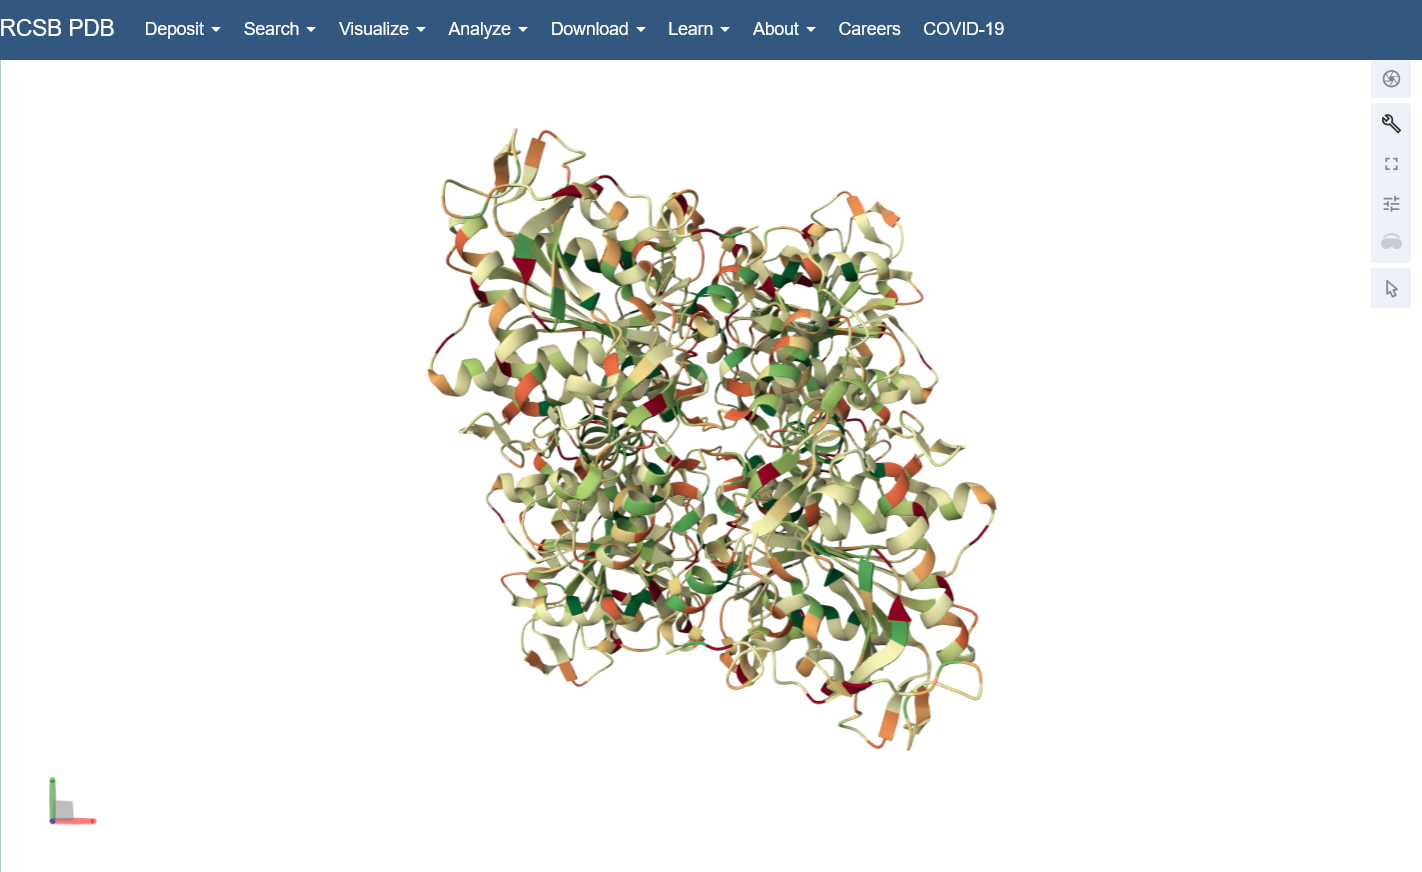
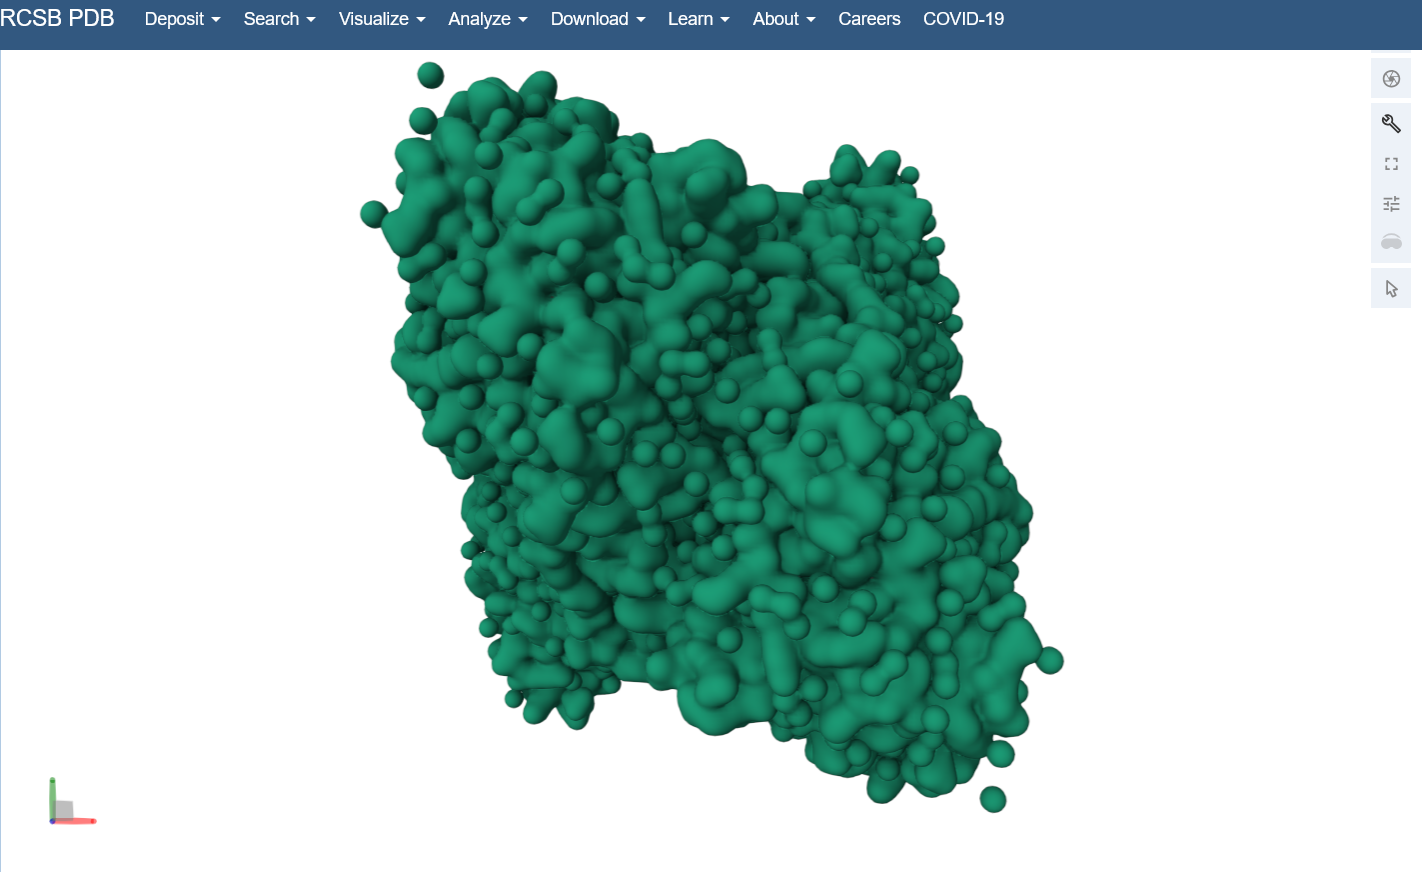
Visualize the protein as “cartoon”, “ribbon” and “ball and stick”.
Color the protein by secondary structure. Does it have more helices or sheets? I think it looks like it has more helices.
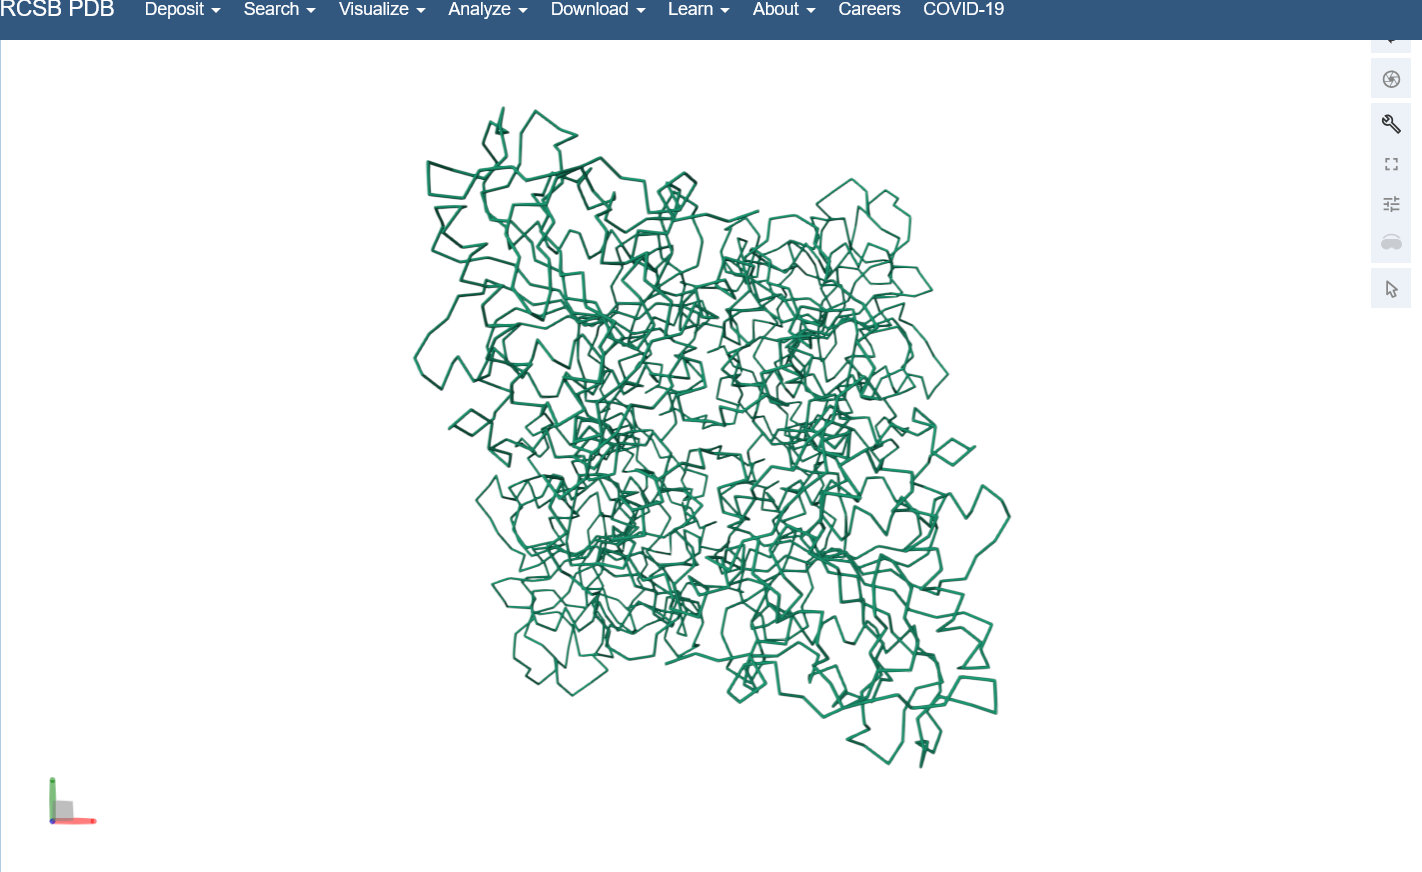
Color the protein by residue type. What can you tell about the distribution of hydrophobic vs hydrophilic residues? I colored by hydrophobicity of residue in the PDB structure viewer, because it was all one color when I selected color by residue molecule type. Not sure what was up with that, but I figured hydrophobicity would let me look at the hydrophobic vs hydrophilic residues. The hydrophobic residues are more clustered towards the insides of the structure.
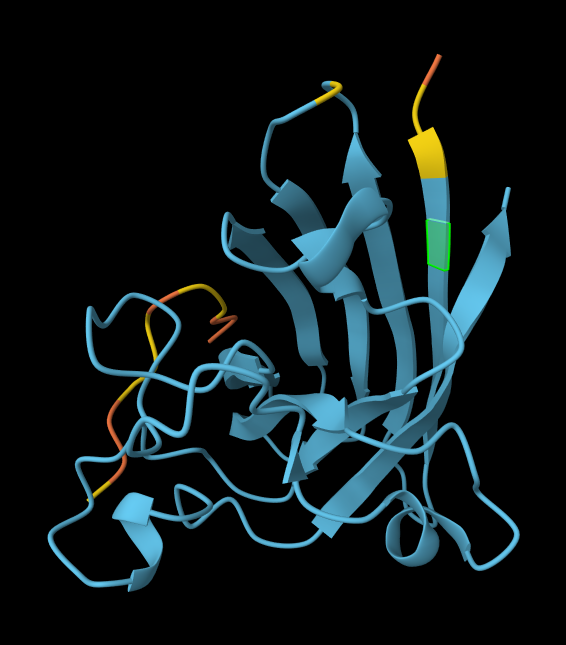
Visualize the surface of the protein. Does it have any “holes” (aka binding pockets)? Yes, you can kind of see the indentation in the center of the screenshot below.
Part C: Using ML-based Protein Design Tools
I’m continuing with the C-terminal domain of PhaC, 5HZ2 in PDB. Colab notebook.
C1. Protein Language Modeling
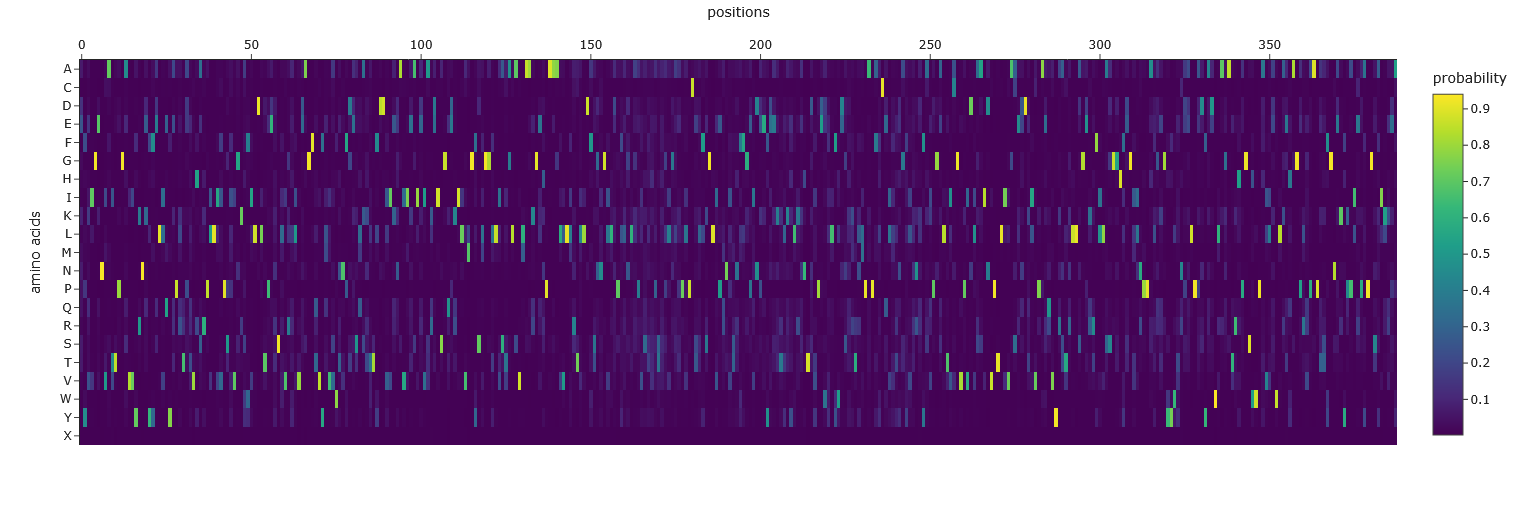
Deep Mutational Scans
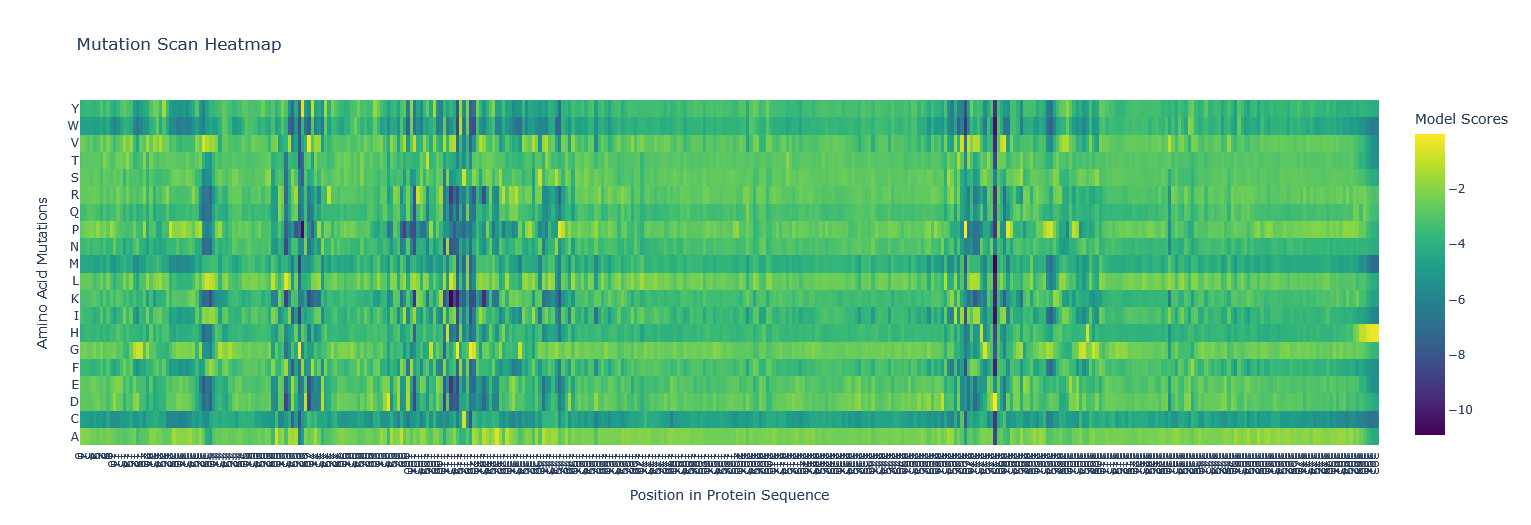
Use ESM2 to generate an unsupervised deep mutational scan of your protein based on language model likelihoods. I copied the FASTA protein sequence from PDB into the first line of cell3 of the Colab notebook replacing the string labeled “protein_sequence”.
Can you explain any particular pattern? (choose a residue and a mutation that stands out) Position 277 seems important - Aspartic acid is the only yellow/high score. Everything else is mostly dark blue, so very negative, which I think means not likely to be able to mutate. So likely, this is either important structurally or catalytically. Asp is one of the few charged amino acids, so that makes me think it might be catalytic.
Latent Space Analysis
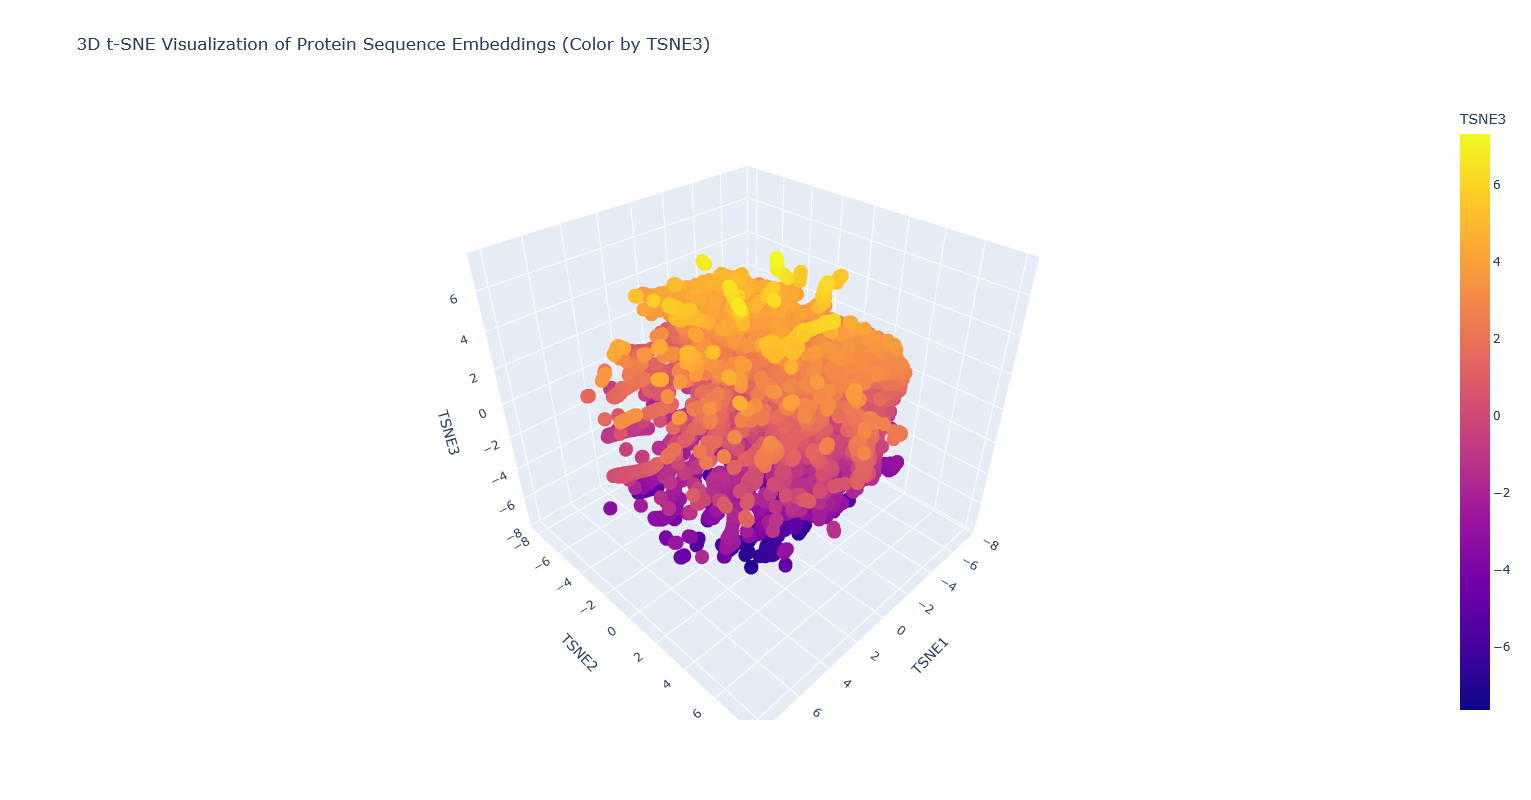
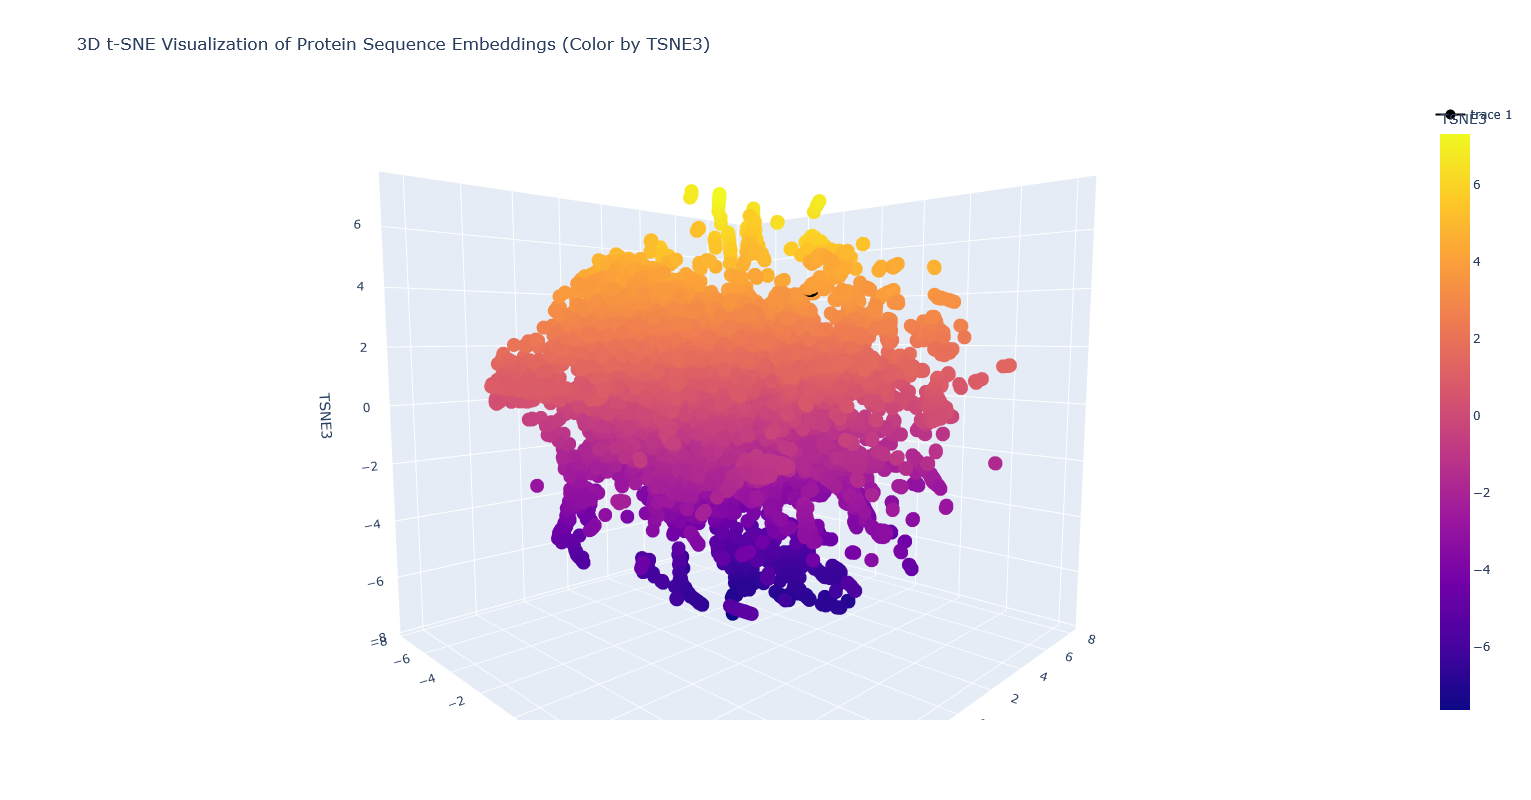
Use the provided sequence dataset to embed proteins in reduced dimensionality.
Analyze the different formed neighborhoods: do they approximate similar proteins? I think they probably mostly do, but it’s kind of hard to tell, because there are so many proteins that it’s hard to visually see which are clustered vs overlapping clusters, and also many of the proteins are just labeled “automated matches” which isn’t really helpful for identification.
Place your protein in the resulting map and explain its position and similarity to its neighbors. It’s nearest to a lipase, a few esterases/thioesterases, and some acetyl-transferases. These are all also from bacteria. I think this makes sense, because these are all kind of involved in biosynthesis of (sometimes long) carbon-containing molecules.
Note: PhaC is the partially covered black dot surrounded by orange-yellow dots.
Code for visualization:
New cell after cell53 of the Colab. i wrote the following code based off existing Python knowledge, and mostly looking at the prior couple cells.
# add my protein sequence to the sequences array

#make list collection to match the first thing in sequences that was printed above
record = SeqRecord(seq=Seq(protein_sequence), id='5hz2', name='PhaC', description='PhaC - polyhydroxyalkanoate synthase (Cupriavidus necator)', dbxrefs=[])

#print the original length of sequences array to compare
print(len(sequences))

#append my new entry to the sequences array
sequences.append(record)

#print new length of sequences array to compare to the old (should be one greater here)
print(len(sequences))

#print the final item of the sequences array (should be my new one)
sequences[len(sequences)-1]
Then ran former cell 54 (currently cell 55 since i added a new one) as usual. Separated out the visualization generation code into a separate cell. Ran the initial dataframe creation. Made a new cell to confirm what my sequence descriptor was:
protein_sequence_annotations[15177]
Then visualized with the following code in a single cell. The chunk that was added is after the fig_3d.update_layout and before fig_3d.show(). This chunk was adapted from the bit that was posted by Noureldin Rihan on the Discourse forum.
# Visualize with Plotly 3D scatter plot, coloring by TSNE3
fig_3d = px.scatter_3d(
    tsne_df_3d,
    x='TSNE1',
    y='TSNE2',
    z='TSNE3',
    color='TSNE3', # Color points based on the third t-SNE component
    title='3D t-SNE Visualization of Protein Sequence Embeddings (Color by TSNE3)',
    hover_name=protein_sequence_annotations[:len(embeddings_array)] # You can replace this with sequence IDs if available
)

fig_3d.update_layout(
    height=800 # Increase the height of the plot
)

#change color and size of my protein so it is easier to find in the huge latent space
#code adapted from Noureldin Rihan on Discourse forum https://forum.htgaa.org/t/issues-with-latent-space-analysis/382
# get the protein's index
my_point = tsne_df_3d.iloc[protein_sequence_annotations.index("PhaC - polyhydroxyalkanoate synthase (Cupriavidus necator)")]

# color it differently

fig_3d.add_scatter3d(
    x=[my_point["TSNE1"]],
    y=[my_point["TSNE2"]],
    z=[my_point["TSNE3"]],
    marker=dict(
        size=10, # Choose the dot size
        color="Black" # Choose a color
    ),
    text=["PhaC - polyhydroxyalkanoate synthase (Cupriavidus necator)"],
    hovertemplate="<b>%{text}</b><br>TSNE1: %{x:.2f}<br>TSNE2: %{y:.2f}<br>TSNE3: %{z:.2f}<extra></extra>"
)
fig_3d.show()
C2. Protein Folding
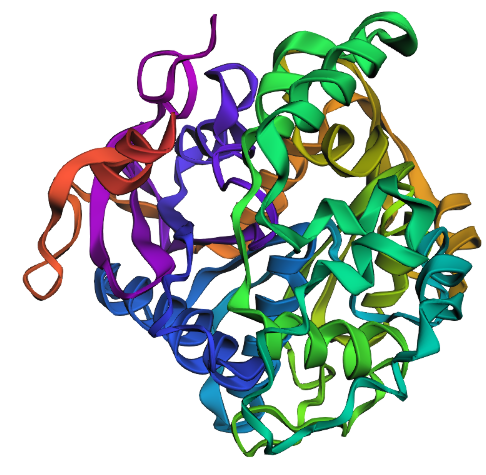
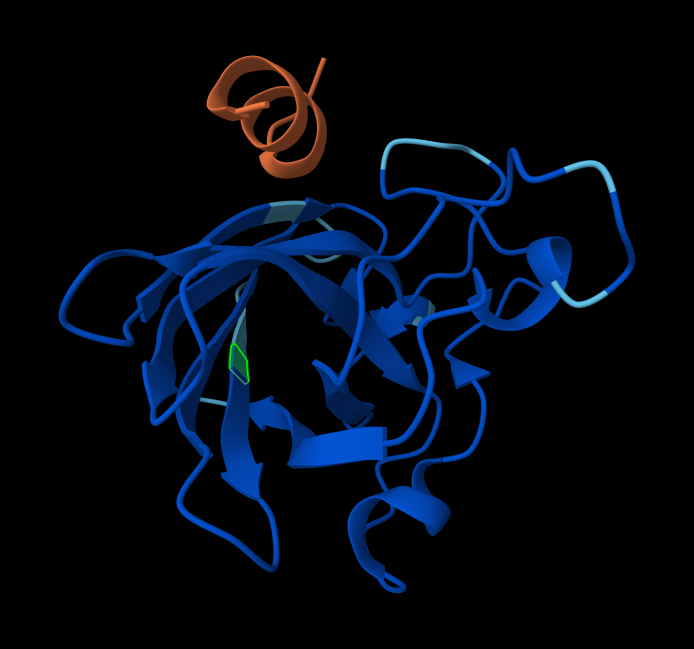
Fold your protein with ESMFold. Do the predicted coordinates match your original structure? This looks like a smaller and less intricate structure than the solved structure. I’m not sure what’s up with that.
Try changing the sequence, first try some mutations, then large segments. Is your protein structure resilient to mutations? I replaced all the Es with Ds and removed the His-tag at the end of the sequence. This yielded the following structure:
I think it looks similar. So at least with the small mutations it’s resilient. larger mutations probably not.
C3. Protein Generation
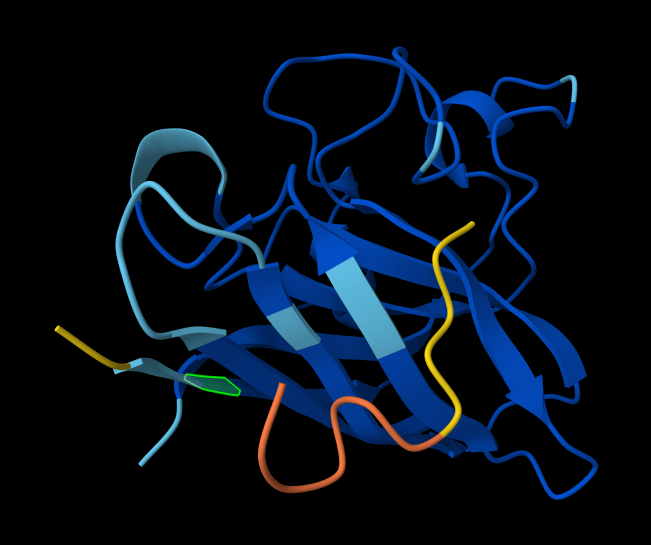
Analyze the predicted sequence probabilities and compare the predicted sequence vs the original one. The output from the third cell after the Inverse Folding with MPN heading:
Based on the heatmap, it has far less flexibility in sequence than the original.
Then after the heatmap cell, there was the last cell that gave a different output that also looked like a predicted sequence, so I’m unclear which one we should look at:
Input this sequence into ESMFold and compare the predicted structure to your original. Replacing the original 5HZ2 protein sequence with the new sequence from the last cell into ESMFold (cell 54) gives us this predicted structure below. Which I guess looks kind of similar to the original predicted structure, but still to me does not look like the PDB structure. The new sequence doesn’t have a His-tag at the end, but it does kind of look like it has a linear tail like a His-tag, which is neat.
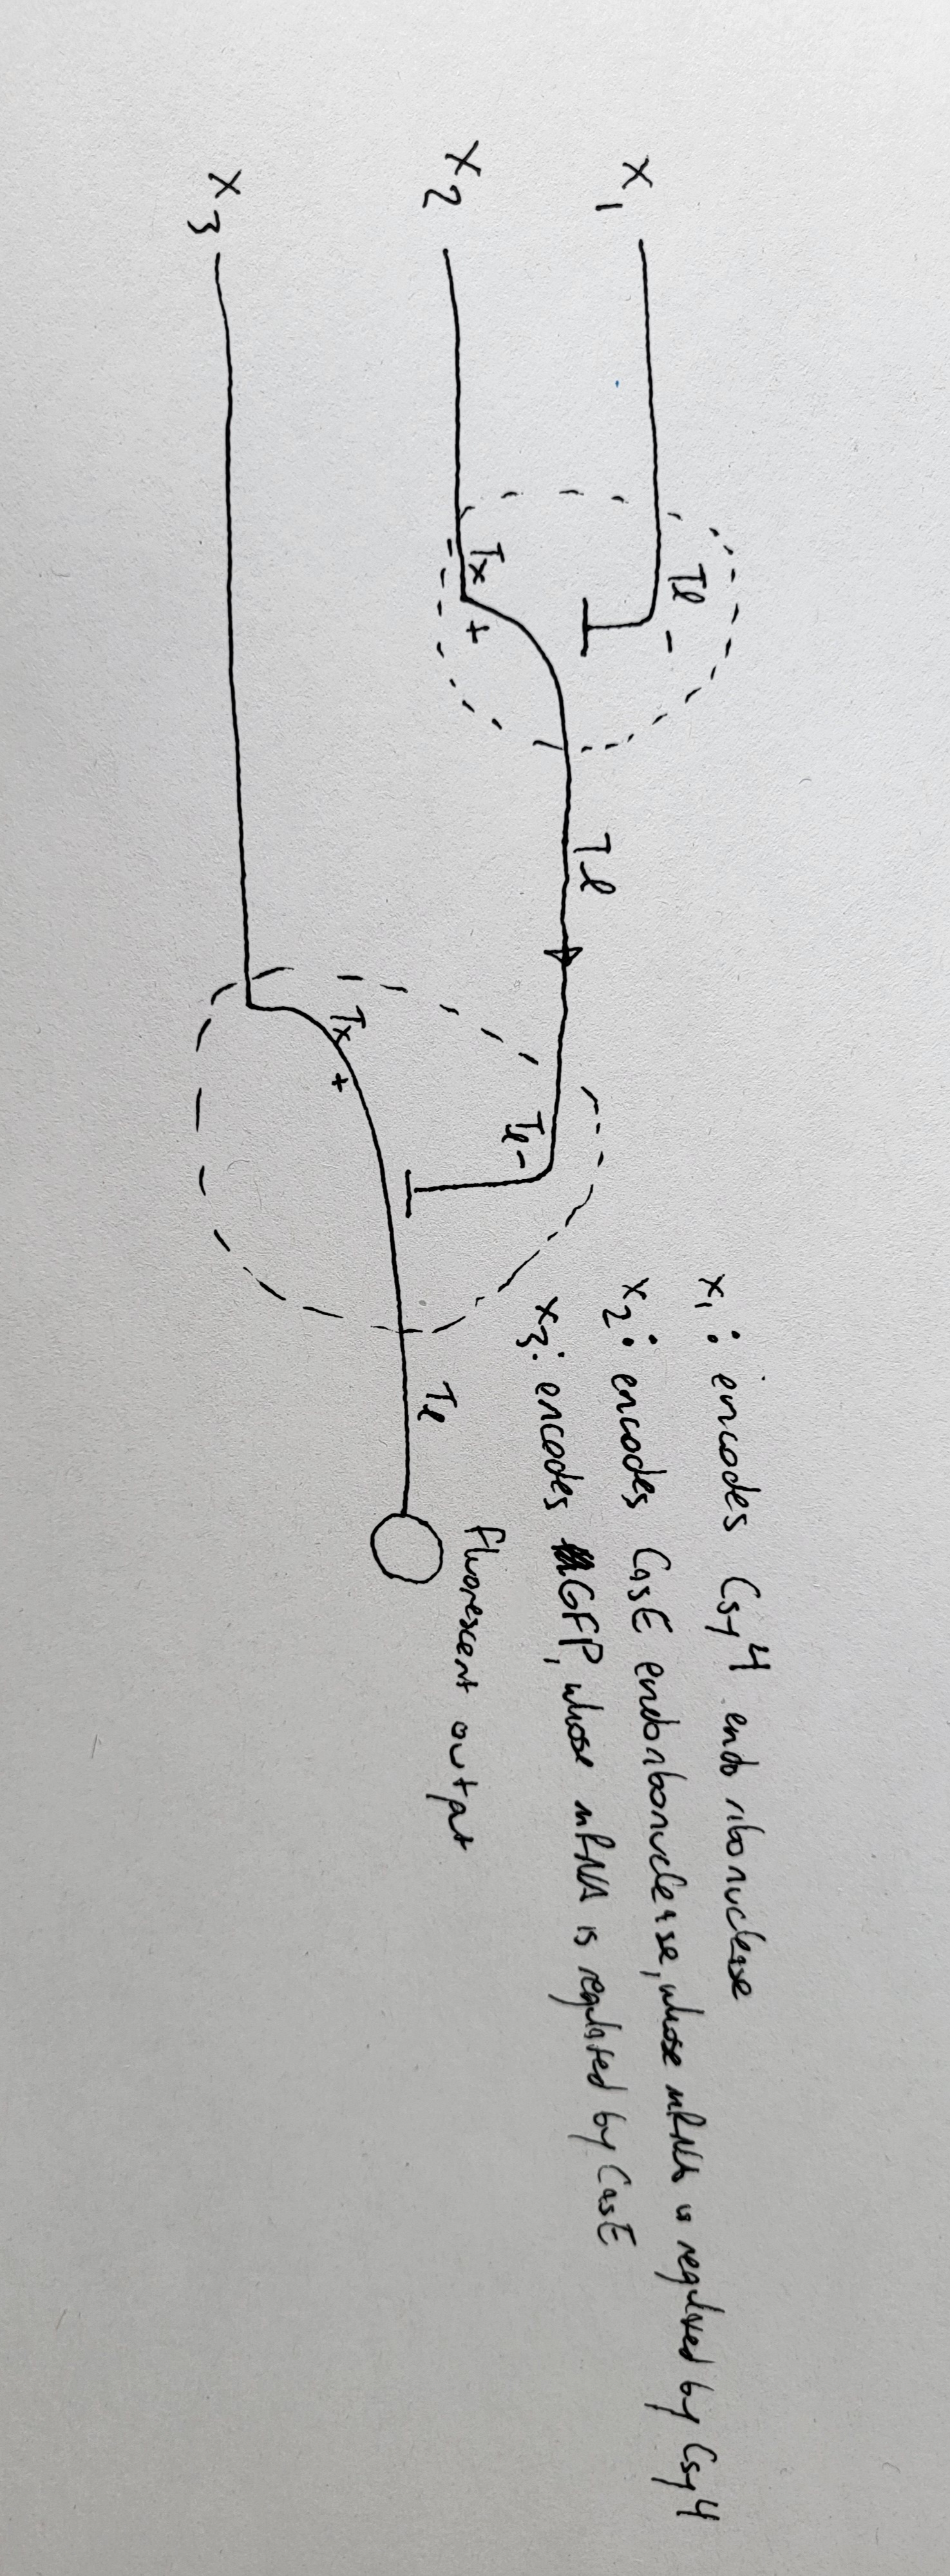
Part D: Group Brainstorm on Bacteriophage Engineering
What do we know:
E. coli DnaJ binds to denatured proteins to prevent/disassemble aggregates (native function in heat-shock).
DnaJ binds to the hydrophilic tail of MS2-L protein.
point mutation of highly conserved proline in DnaJ results in no lysis (so maybe no more binding of MS2-L tail?)
removal of MS2-L tail recovers lysis function (meaning DnaJ is only necessary when tail exists)
suggests hydrophilic tail aggregates in some way that prevents lysis except in presence of DnaJ to stop aggregation
so stability should be improved if we can figure out how the tail is interacting with the tail of other MS2-L molecules, and then mutating that away so there is no aggregation and dependence on DnaJ
graph TB;
 A[sequence and structure of MS2-L] -->|if geometry and chemical interactions are known| B[view interactions between MS2-L copies]
 A -->|if geometry and interactions are not known| C[model interactions with AlphaFold or something that can do protein interactions]
 B -->|visual analysis and mutation modeling| D[Identify important residues in MS2-L tail interactions]
 C -->|visual analysis and mutation modeling| D[Identify important residues in MS2-L tail interactions]
 D -->|use knowledge of hydrophobicity/charge/etc. OR use ESM2 mutational scan and select ones that it finds unlikely| E[Select dissimilar AAs to substitute in interacting residues]
 E -->|AlphaFold or similar| F[model protein folding in new AA sequence with selected mutations]
 F -->|something that can model protein interactions| G[model interactions between mutant MS2-L copies]
 G -->|select mutations that have similar hydrophilicity as original tail but less interaction with each other and maybe also with DnaJ| H[test mutations in lab]
Potential problems:
don’t know what can model protein-protein interactions
we might have covered this in class but i don’t remember. i can rewatch the lectures
what if modeling doesn’t show interactions between the tails? we know there probably has to be one…
might have to simplify by only modeling the tail section, but that is probably known already (will have to model folding and interactions with full protein sequence in later steps probably)
could start with DnaJ, what in MS2-L binds with the essential proline in DnaJ, and assume that it’s spatially close to that. then test various mutations of nearby residues
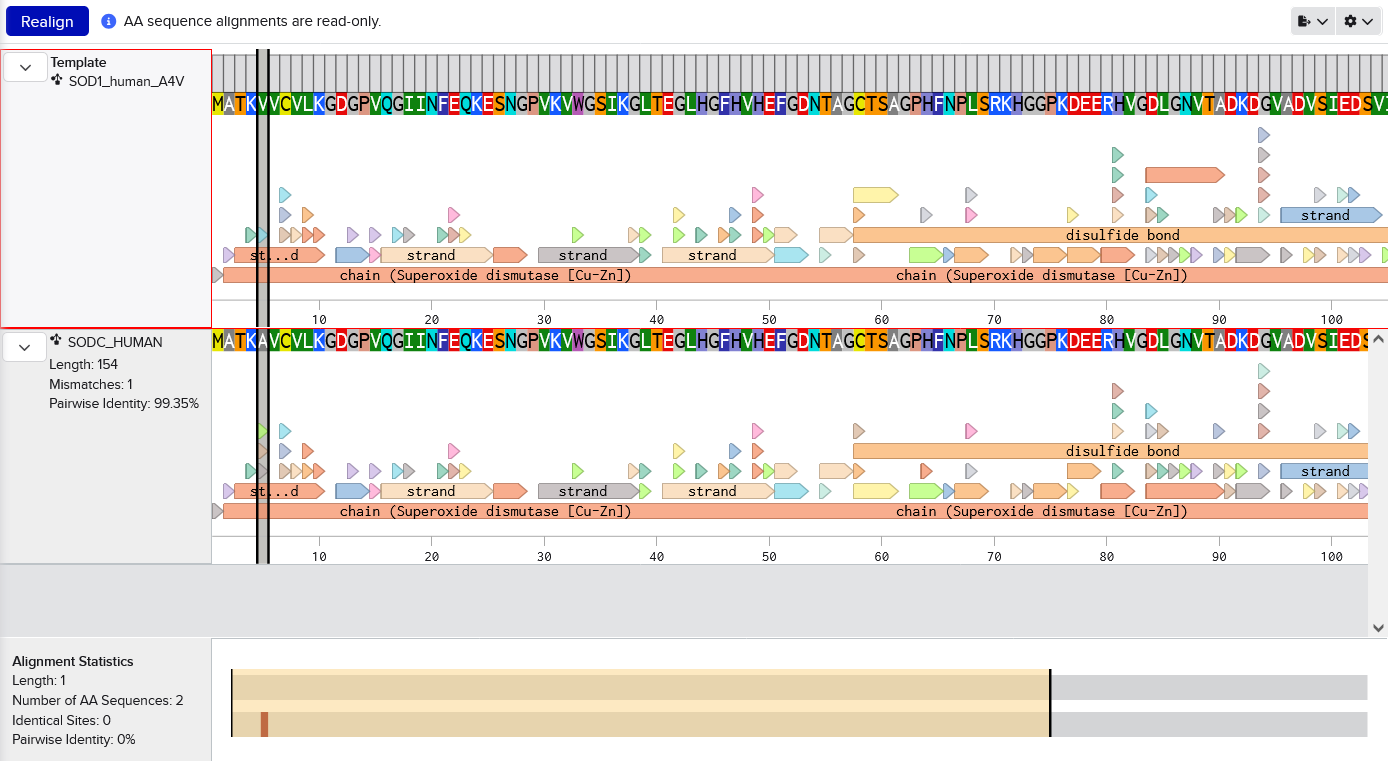
Begin by retrieving the human SOD1 sequence from UniProt (P00441) and introducing the A4V mutation. Imported from Uniprot into Benchling. Manually changed A at residue 5 to V (because this sequence includes the starting M which is not traditionally counted, I assume). Screenshot shows the mutation by aligning with the original sequence.
Using the PepMLM Colab linked from the HuggingFace PepMLM-650M model card:Colab
Generate four peptides of length 12 amino acids conditioned on the mutant SOD1 sequence.
These binders are from couple different runs because each run gives me one or more binders that contain amino acid single letter code X, which AlphaFold can’t handle because it’s non-standard.
KRVYVVAVEHWE
WLVPAVVLEWKK
WRYYVAGLRWKE
WRYYAAGARHGE
To your generated list, add the known SOD1-binding peptide FLYRWLPSRRGG for comparison.
Record the perplexity scores that indicate PepMLM’s confidence in the binders.
index
Binder
Pseudo Perplexity
1
KRVYVVAVEHWE
31.639343
2
WLVPAVVLEWKK
14.543342
3
WRYYVAGLRWKE
20.310199
4
WRYYAAGARHGE
9.566312
5
FLYRWLPSRRGG
Part 2: Evaluate Binders with AlphaFold3
Navigate to the AlphaFold Server: alphafoldserver.com
For each peptide, submit the mutant SOD1 sequence followed by the peptide sequence as separate chains to model the protein-peptide complex.
Record the ipTM score and briefly describe where the peptide appears to bind. Does it localize near the N-terminus where A4V sits? Does it engage the β-barrel region or approach the dimer interface? Does it appear surface-bound or partially buried?
index
Binder
Pseudo Perplexity
ipTM score
Localization
1
KRVYVVAVEHWE
31.639343
0.31
Within the beta-barrel, but not near the N-terminus.
2
WLVPAVVLEWKK
14.543342
0.34
Partially within the beta-barrel, partially within the more disordered region. Not near the N-terminus. More on the surface of the barrel, but a little buried within the disordered region.
3
WRYYVAGLRWKE
20.310199
0.29
Adjacent to the beta-barrel, but not near the N-termins. On the surface, possibly sterically interfering with the barrel because it’s an alpha-helix rather than linear.
4
WRYYAAGARHGE
9.566312
0.42
On top of beta-barrel, with one end somewhat near the N-terminus. On the surface of the barrel.
5
FLYRWLPSRRGG
0.30
In disordered region, not near the N-terminus or the beta-barrel. On the surface.
AlphaFold peptide 1, highlighted residue is A4V.
AlphaFold peptide 2, highlighted residue is A4V.
AlphaFold peptide 3, highlighted residue is A4V.
AlphaFold peptide 4, highlighted residue is A4V.
AlphaFold known peptide, highlighted residue is A4V.
In a short paragraph, describe the ipTM values you observe and whether any PepMLM-generated peptide matches or exceeds the known binder. Three of my 4 peptides have ipTM values above the known binder. Even my one peptide that has a lower value is almost the same (0.29 vs 0.3). Three of my peptides have very similar values, but one standout is much higher (0.42 vs 0.3). This would suggest that at least that peptide, if not all of them, is worth pursuing further.
Part 3: Evaluate Properties of Generated Peptides in the PeptiVerse
Structural confidence alone is insufficient for therapeutic development. Using PeptiVerse, let’s evaluate the therapeutic properties of your peptide! For each PepMLM-generated peptide:
Paste the peptide sequence.
Paste the A4V mutant SOD1 sequence in the target field.
Check the boxes: Predicted binding affinity; Solubility; Hemolysis probability; Net charge (pH 7); Molecular weightCompare these predictions to what you observed structurally with AlphaFold3. In a short paragraph, describe what you see. Do peptides with higher ipTM also show stronger predicted affinity? Are any strong binders predicted to be hemolytic or poorly soluble? Which peptide best balances predicted binding and therapeutic properties?
index
Binder
Pseudo Perplexity
ipTM score
Binding affinity
1
KRVYVVAVEHWE
31.639343
0.31
6.739
2
WLVPAVVLEWKK
14.543342
0.34
6.450
3
WRYYVAGLRWKE
20.310199
0.29
6.637
4
WRYYAAGARHGE
9.566312
0.42
6.401
5
FLYRWLPSRRGG
0.30
6.361
Actually for my peptides, the higher ipTM scores tend to have lower binding affinities predicted by PeptiVerse. The highest ipTM score was 0.42 from peptide 4 - it had the lowest pseudo perpexity score and one of the lower binding affinities. The second lowest ipTM score was 0.31 from peptide 1 - it had the highest psueo perplexity score and the highest binding affinity. The known peptide had a similar binding affinity as the rest of my peptides: 6.361. It’s actually lower than two of them and pretty close but slightly lower than the other two.
Peptide 1:
Property
Prediction
Value
Unit
Solubility
Soluble
0.549
Probability
Hemolysis
Non-hemolytic
0.099
Probability
Binding affinity
Weak binding
6.739
pKd/pKi
Net charge (pH 7)
-0.14
Peptide 2:
Property
Prediction
Value
Unit
Solubility
Soluble
0.904
Probability
Hemolysis
Non-hemolytic
0.091
Probability
Binding affinity
Weak binding
6.450
pKd/pKi
Net charge (pH 7)
0.76
Peptide 3:
Property
Prediction
Value
Unit
Solubility
Soluble
0.598
Probability
Hemolysis
Non-hemolytic
0.052
Probability
Binding affinity
Weak binding
6.637
pKd/pKi
Net charge (pH 7)
1.77
Peptide 4:
Property
Prediction
Value
Unit
Solubility
Soluble
0.982
Probability
Hemolysis
Non-hemolytic
0.023
Probability
Binding affinity
Weak binding
6.401
pKd/pKi
Net charge (pH 7)
1.85
Known peptide:
Property
Prediction
Value
Unit
Solubility
Soluble
0.608
Probability
Hemolysis
Non-hemolytic
0.047
Probability
Binding affinity
Weak binding
6.361
pKd/pKi
Net charge (pH 7)
2.76
Choose one peptide you would advance and justify your decision briefly. I’d probably choose either peptide 1 or peptide 4.
Peptide 1: has the highest pseudo complexity score. It has a similar ipTM as the known peptide, and a higher binding affinity. It also has good solubility, hemolysis, and charge predictions. AlphaFold predicted it to be within the beta-barrel.
Peptide 4: has the lowest pseudo perplexity score. It has a higher ipTM than the known peptide, and a similar binding affinity. It also has good solubility, hemolysis, and charge predictions. AlphaFold predicted it to be near the N-terminus.
I’d move forward with peptide 4 because of it has similar properties as the known peptide, but has possible binding location near the A4V mutation.
Part 4: Generate Optimized Peptides with moPPIt
Now, move from sampling to controlled design. moPPIt uses Multi-Objective Guided Discrete Flow Matching (MOG-DFM) to steer peptide generation toward specific residues and optimize binding and therapeutic properties simultaneously. Unlike PepMLM, which samples plausible binders conditioned on just the target sequence, moPPIt lets you choose where you want to bind and optimize multiple objectives at once.
Open the moPPit Colab linked from the HuggingFace moPPIt model card.Colab
Make a copy and switch to a GPU runtime: T4 GPU runtime
In the notebook:
Paste your A4V mutant SOD1 sequence.
Choose specific residue indices on SOD1 that you want your peptide to bind (for example, residues near position 4, the dimer interface, or another surface patch). I chose the first 10 residues, roughly centered around the A4V mutation.
Set peptide length to 12 amino acids.
Enable motif and affinity guidance (and solubility/hemolysis guidance if available). Generate peptides.
index
Binder
Binding affinity
Hemolysis
Solubility
1
CTRDYPVCRACR
7.1381
0.0499
1.0000
2
ACRGRRFAFFRV
6.8598
0.0189
1.0000
3
GSRRWWVYWHWR
7.5707
0.0225
1.0000
4
VWAAIWRREYGK
6.4160
0.0222
1.0000
After generation, briefly describe how these moPPit peptides differ from your PepMLM peptides. How would you evaluate these peptides before advancing them to clinical studies? These peptides are different from the PepMLM peptides. I’d go through the same process I did with the PepMLM peptides to evaluate these peptides: modeling with AlphaFold and and evaluate with PeptiVerse.
Part C: Final Project: L-Protein Mutants
We didn’t get to this part of the project unfortunately. But we did have some planning discussion.
My assumption was that DnaJ stabilizes the L-protein by preventing aggregation that would otherwise occur with the long tail.
Peter suggested:
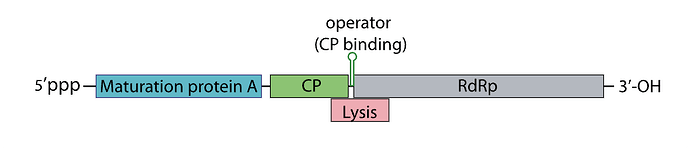
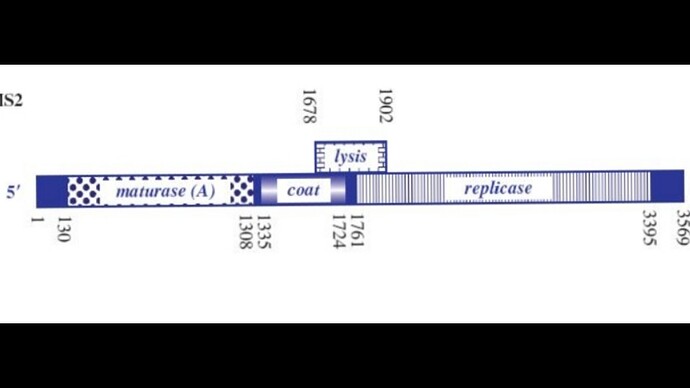
Sooo, the phage genome is very tightly regulated, I decided to take a look on how this regulation work, and it’s mainly based on RNA secondary structures
How the lysis protein is regulated:
The start codon and the shine-Dalgarno sequence are buried in an RNA hairpin, rendering virtually inaccessible to the ribosome, only when a ribosome slips during Coat protein’s translation termination does it get get translated, this has a very rare 5% chance of occuring
How the replicase protein is regulated:
There’s a 19 nt hair called the operator or TR (translation repression) located upstream of the replicase protein, as the CP is translated, dimers form, that binds the TR hairpin, repressing replicase translation and signaling the beginning of the capsid assembly
One of the things I noticed, the TR hairpin overlaps with the lysis protein too, so in theory, it does repress it too
I’ve attached a linear map of the MS2 genome to follow along, here is its source too: Emesvirus ~ ViralZone
Here’s the genome engineering idea I arrived at: the first 40 amino acids of the L protein seem to be dispensable, and they’re the ones that cause it to interact with the chaperone DnaJ. What if we shift the start codon from its original position at 1678 to 1795? This would produce an L protein without the troublesome soluble N-terminus.
There are several problems though:
We need to model the MS2 gRNA. Most models can only handle short sequences, while the MS2 genome is 3569 nt long, which is pretty large for current tools. One model that might work is RNAPro, but I couldn’t find a web server or a Colab notebook to run it. The source code is on Hugging Face, but I don’t have much coding experience so I couldn’t get it running.
If the start codon is shifted to this position, the L protein will compete with the replicase for translation, so we’d need to ensure there’s a strong SD sequence for the new L start site.
The translation regulation would basically be lost, since L translation would no longer be coupled to CP. That creates a risk of premature lysis, where L protein is translated at lethal levels before new virions are assembled.
I was wondering if there’s a way to bury the SD sequence for the 1795 L site so that it’s only accessible when the CP dimer binds to the TR hairpin. That might help mitigate the premature lysis problem. I’m not sure though whether the L region would stay accessible long enough to induce lysis. I also couldn’t find a paper on the assembly kinetics.
Another idea I had was increasing the CP dimer affinity to the TR hairpin so that the L region can stay accessible for long enough before assembly proceeds.
What are some components in the Phusion High-Fidelity PCR Master Mix and what is their purpose?
Phusion DNA polymerase - a high fidelity DNA polymerase, which means that it is an enzyme that adds single nucleotides to extend a DNA chain along a template with some sort of proof-reading ability. It is used for PCR, which means it has to be thermostable.
dNTPs - single nucleotide bases to be used by the polymerase to make DNA
buffer - buffer is used primarily for controlling the pH of the PCR reaction, but it also includes MgCl2 which is a required co-factor for the DNA polymerase.
What are some factors that determine primer annealing temperature during PCR? Primer annealing temperature is affected by the length of the primer and the GC content primarily.
There are two methods from this class that create linear fragments of DNA: PCR, and restriction enzyme digests. Compare and contrast these two methods, both in terms of protocol as well as when one may be preferable to use over the other. PCR is a method to produce many copies of a DNA sequence for which you already have a template. It requires a thermocycler, and PCR mix (thermostable DNA polymerase, dNTPs, appropriate buffer). To use it, you need to have template DNA and primers designed to bookend the sequence of interest. Restriction digests can linearize circular DNA or trim DNA sequences. It requires a heat block or incubator, the relevant restriction enzymes, and appropriate buffer. To use it, you need to have (typically a medium or high concentration amount) DNA that contains your sequence of interest already bookended by restriciton enzyme cutsites. Restriction digests can produce sticky ends or blunt ends; PCR will always produce blunt ends. Both methods will typically require some sort of purification step before further use (DNA cleaning and concentrating; gel extraction). PCR is useful when you need more of a particular sequence of DNA, when you want to make point mutations within a sequence (multi-step process), to add short sequences to the ends of the DNA sequence (such as restriction enzyme cutsites, adaptors, or overlaps). Restriction digestion is useful when you need to remove an insert from a plasmid backbone, to linearize a vector for electrophoresis or other analysis, and for restriction-digest cloning (including ensuring insert and vector have appropriate sticky ends for directional insertion).
How can you ensure that the DNA sequences that you have digested and PCR-ed will be appropriate for Gibson cloning? Ideally you would design and test in silico to ensure overlaps are appropriate. My first couple times trying Gibson assembly, i wrote it out by hand to convince myself i had done it correctly, but many molecular biology software options can now assist with this as well. You can exactly confirm your purified DNA fragments prior to Gibson assembly by sequencing them, but you can also just get a good idea of their size (which would at least tell you if you PCR’d a very different or non-specific products) by running them on a gel.
How does the plasmid DNA enter the E. coli cells during transformation? During a heat shock transformation, you shock the E. coli cells with an abrupt temperature change from on ice at 0°C (or sometimes room temperature around 20°C) to 42°C. This opens pores within the cell membrane that allow DNA to enter the cells, due to prior treatment with CaCl2 to neutralize the negative charge of the DNA.
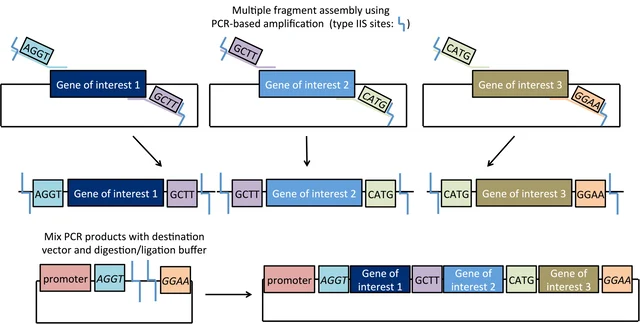
Describe another assembly method in detail (such as Golden Gate Assembly).
Explain the other method in 5 - 7 sentences plus diagrams (either handmade or online).
Golden Gate Assembly can be conceptualized as a cross between restriction digest cloning and Gibson Assembly. Like restriction digest cloning, restriction enzymes are used to digest both the insert and the vector to create compatible sticky ends for directional insertion. However, it uses Type IIS restriction enzymes (such as AarI) that cut outside their recognition site. Therefore with correct design, the recognition sites are removed in assembly. This allows for plasmid construction similar to Gibson assembly: design your insertion fragments and vector backbone to have compatible overhangs/overlaps with the adjacent sequences (often added during primer design in PCR), then add all fragments to the reaction mix which includes both a nuclease and a ligase for assembly. In Golden Gate assembly, the Type IIS restriction enzyme(s) find their recognition sites, cut nearby (at a pre-identified base), resulting in the designed 4-base overhangs. These overhangs can connect with matching overhangs from either the original construct or the intended adjacent fragment, which will be ligated into a closed dsDNA molecule (if the original construct is re-ligated, then the Type IIS enzyme again finds the recognition site and cuts again, thereby improving the efficiency).
Figure from Addgene’s Golden Gate Cloning page.
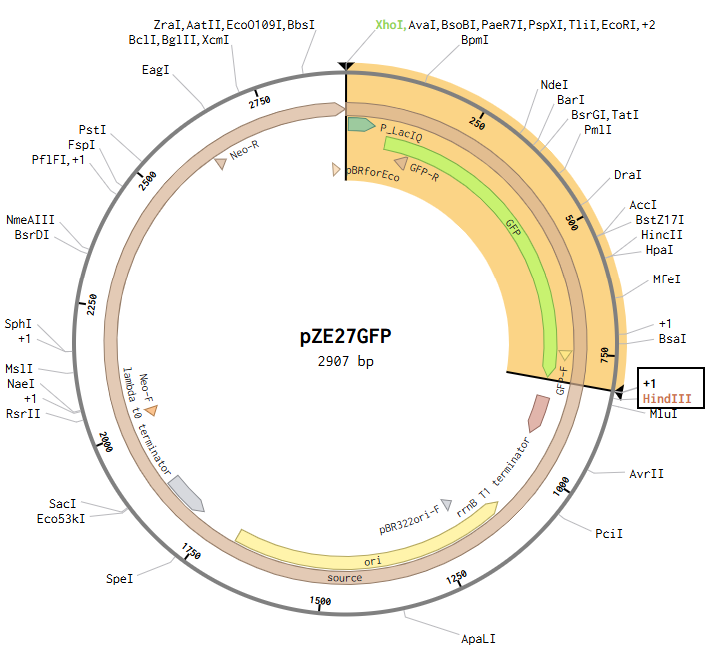
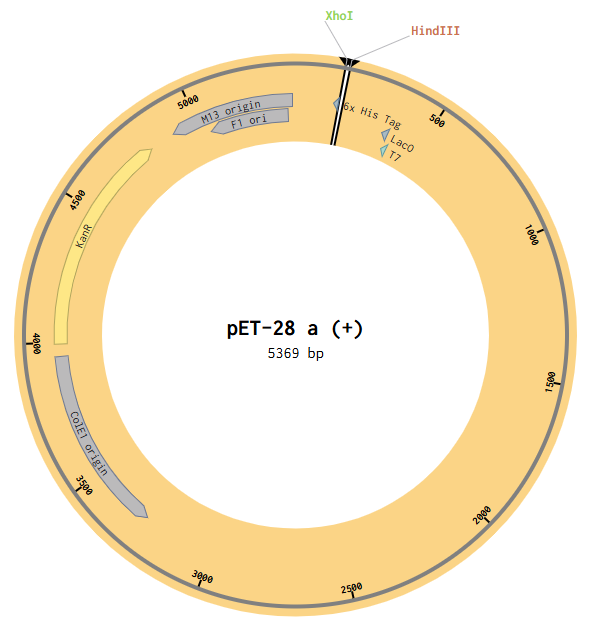
Model this assembly method with Benchling or Asimov Kernel! To compare assembly methods, I used Benchling’s Assembly Wizard tool to simulate the same plasmid construction using restriction digest, Gibson assembly, and Golden Gate assembly. My target plasmid is called “pGFP”, with a pET28a(+) backbone and an insert containing the gene for green fluorescent protein (GFP) under constitutive promoter P_LacIQ from plasmid pZE27GFP. I started by importing both pET28a(+) and pZE27GFP into Benchling from Addgene. I used Benchling’s auto-annotation tool on pET28a(+) for annotations. pZE27GFP was already annotated, but was missing the annotation for P_LacIQ, so I added an annotation from that by downloading the Genbank file from the Addgene site and using CTRL-F on the sequence to identify it in the original file. I wanted these annotations so that I knew the locations of the relevant sequences in my files for easier visual identification during the cloning simulation. Note that the GFP translation in the pZE27GFP file didn’t include the stop codon, but the stop codon was present, just not included in that translation annotation, and I was too lazy to fix this, so I just remembered that my sequence of interest included the three bases past the end of the translation annotation.
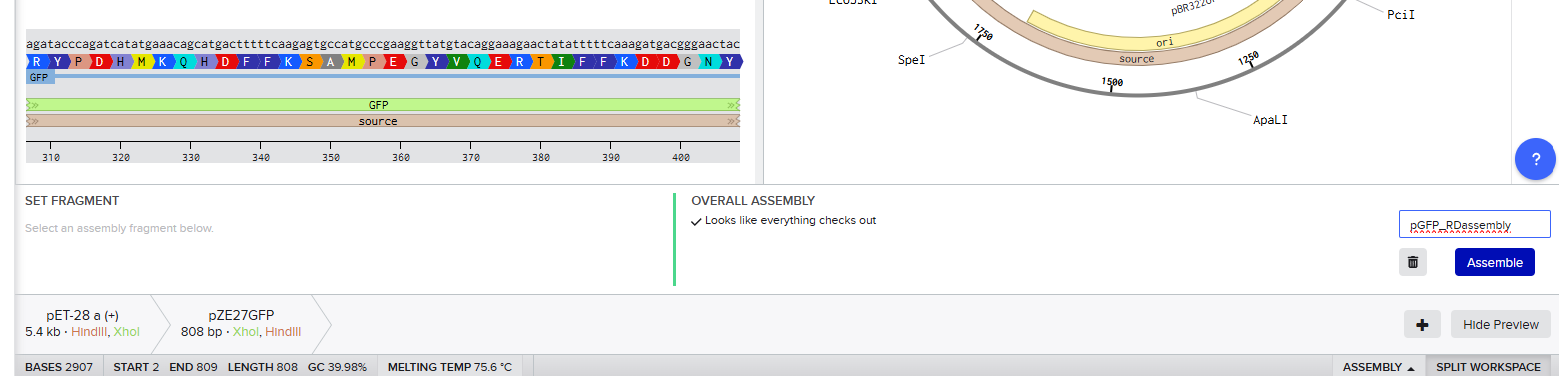
Restriction Digest
Opening the pZE27GFP file to the plasmid map view, I selected the Digests tool to show all single cutters on the map, and identified ones that were near the ends of goal insertion sequence (outside P_LacIQ and GFP): XhoI and HindIII.
Then I opened the pET28a(+) file to the plasmid map view, and selected the Digest option to only show the selected enzymes, and found these two enzymes cut in the insertion locus on the plasmid (between the T7 promoter and the His-tag).
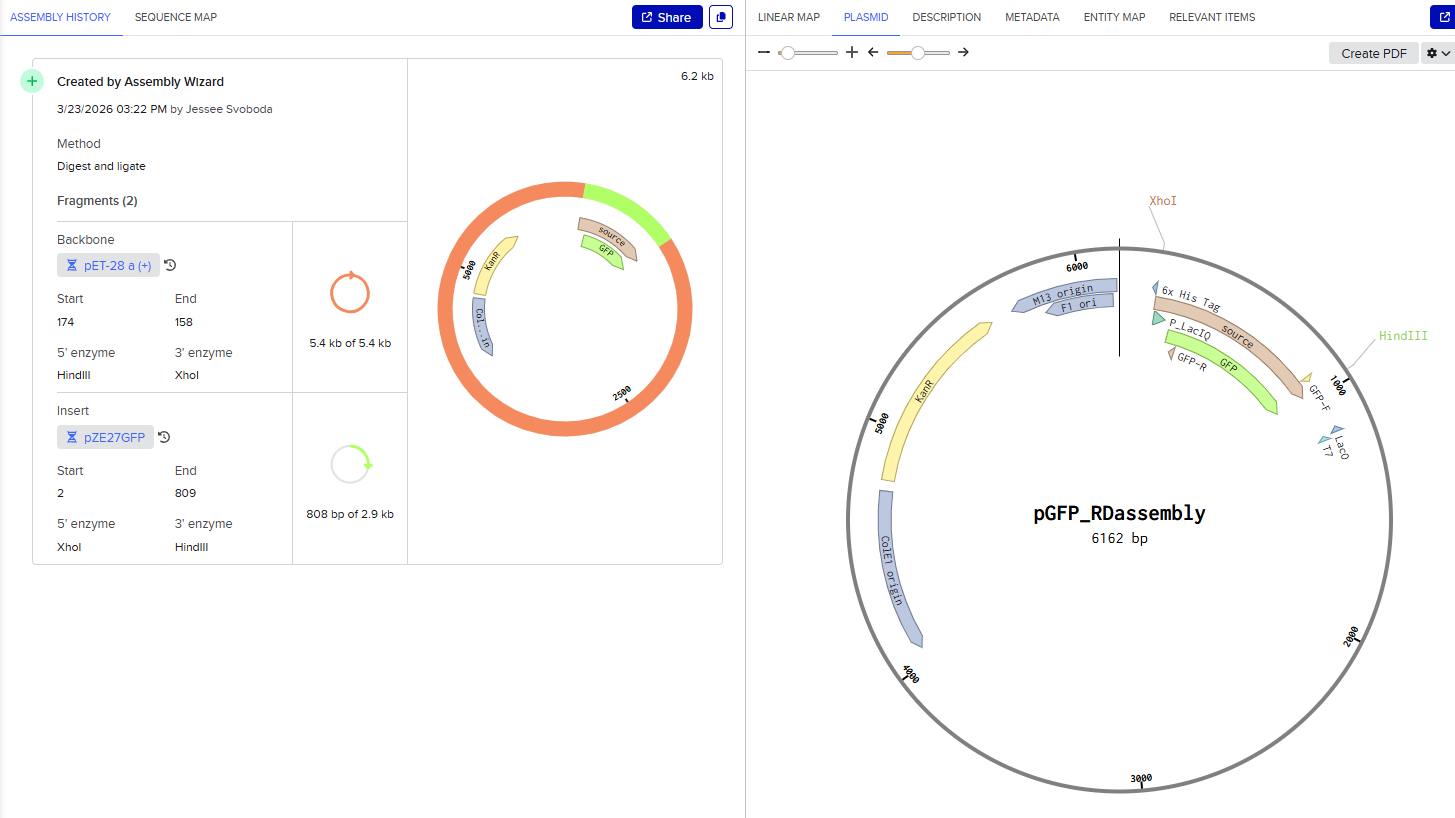
Since both enzymes were present on both starting constructs, I used the Assembly Wizard tool for Restriction Digest cloning, and selected the backbone and insert by highlighting the above sequences with the selected enzymes.
This resulted in a final assembly of pGFP_RDassembly. Note that both the XhoI and HindIII recognition sites are preserved in the final construct. While sticky-ended enzymes allow for directional insertion, this insert does not require directional insertion because it contains both the promoter and the gene. This is important because technically the insert is backwards for the vector as intended (for the T7 promoter and His-Tag on the backbone).
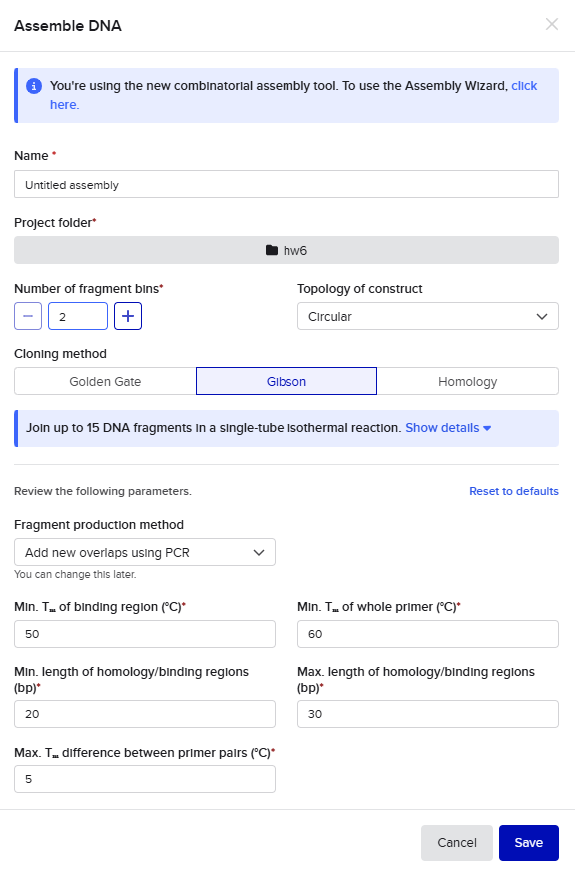
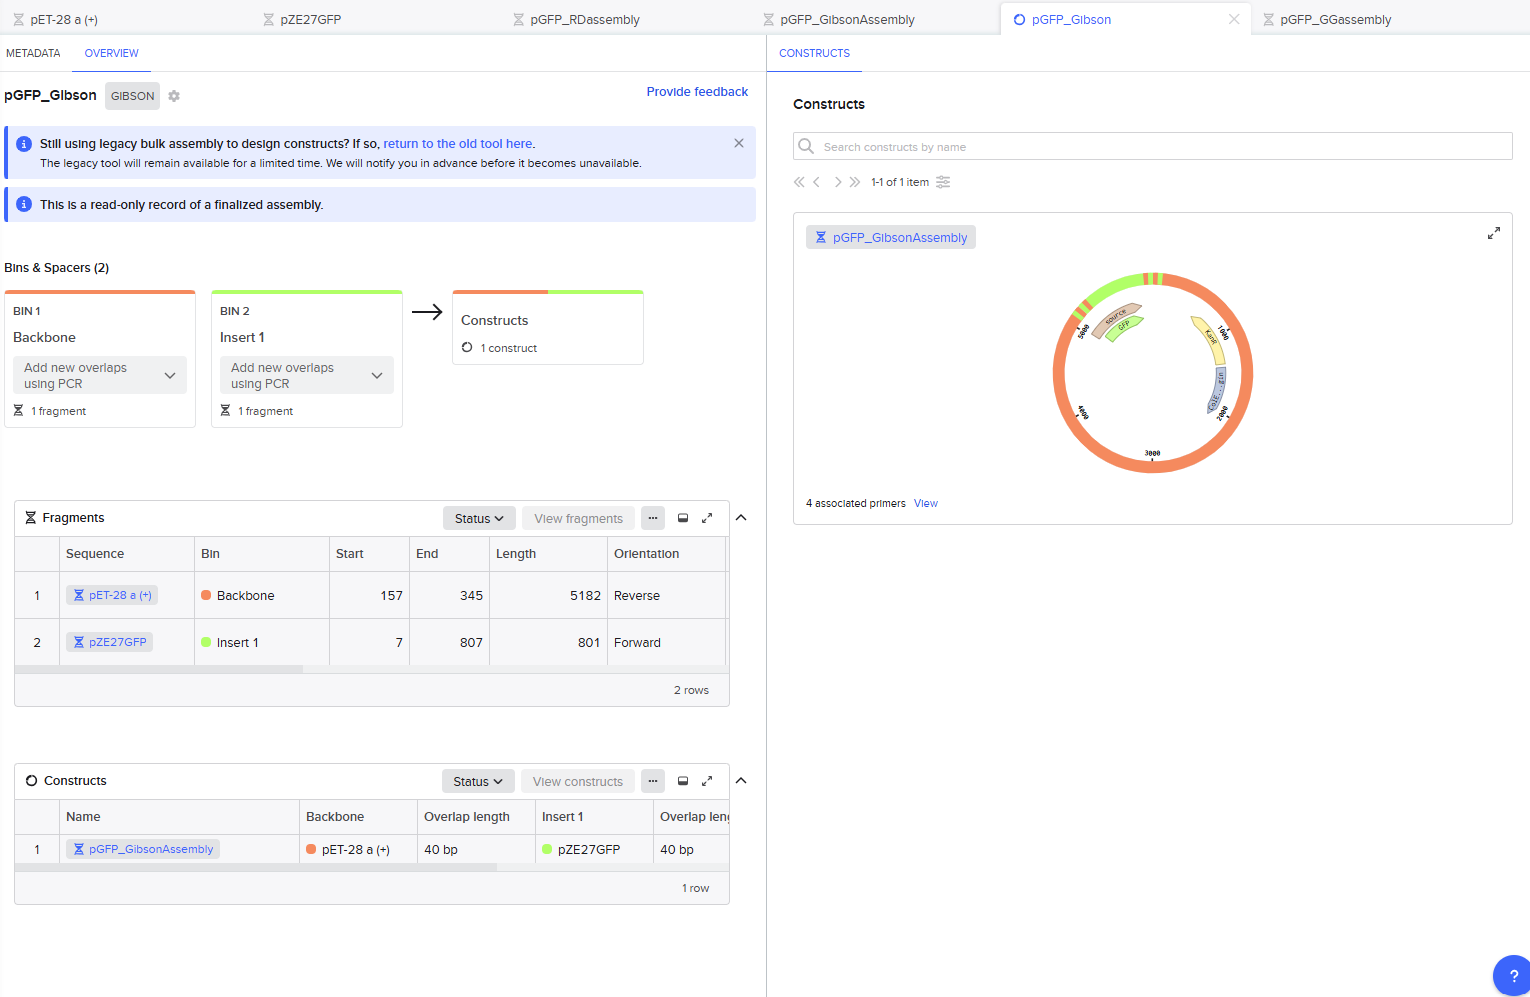
Gibson Assembly
For the Gibson assembly method, I started by opening the Assembly Wizard, and selecting the Gibson option, and opting to try the new combinatorial assembly tool instead. I retained all the default options.
This resulted in a final assembly of pGFP_GibsonAssembly. The primers were auto-generated by the tool, and are visible in the Benchling files for pET28a(+) and pZE27GFP the the naming convention following “pET28a-GA_forward”. The PCR products used in the final assembly are here (insert) and here (backbone).
Golden Gate Assembly
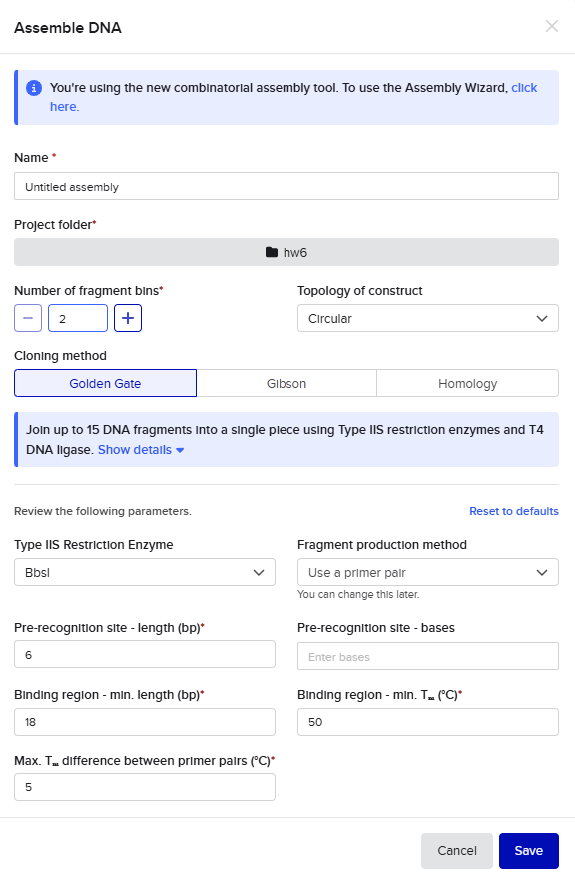
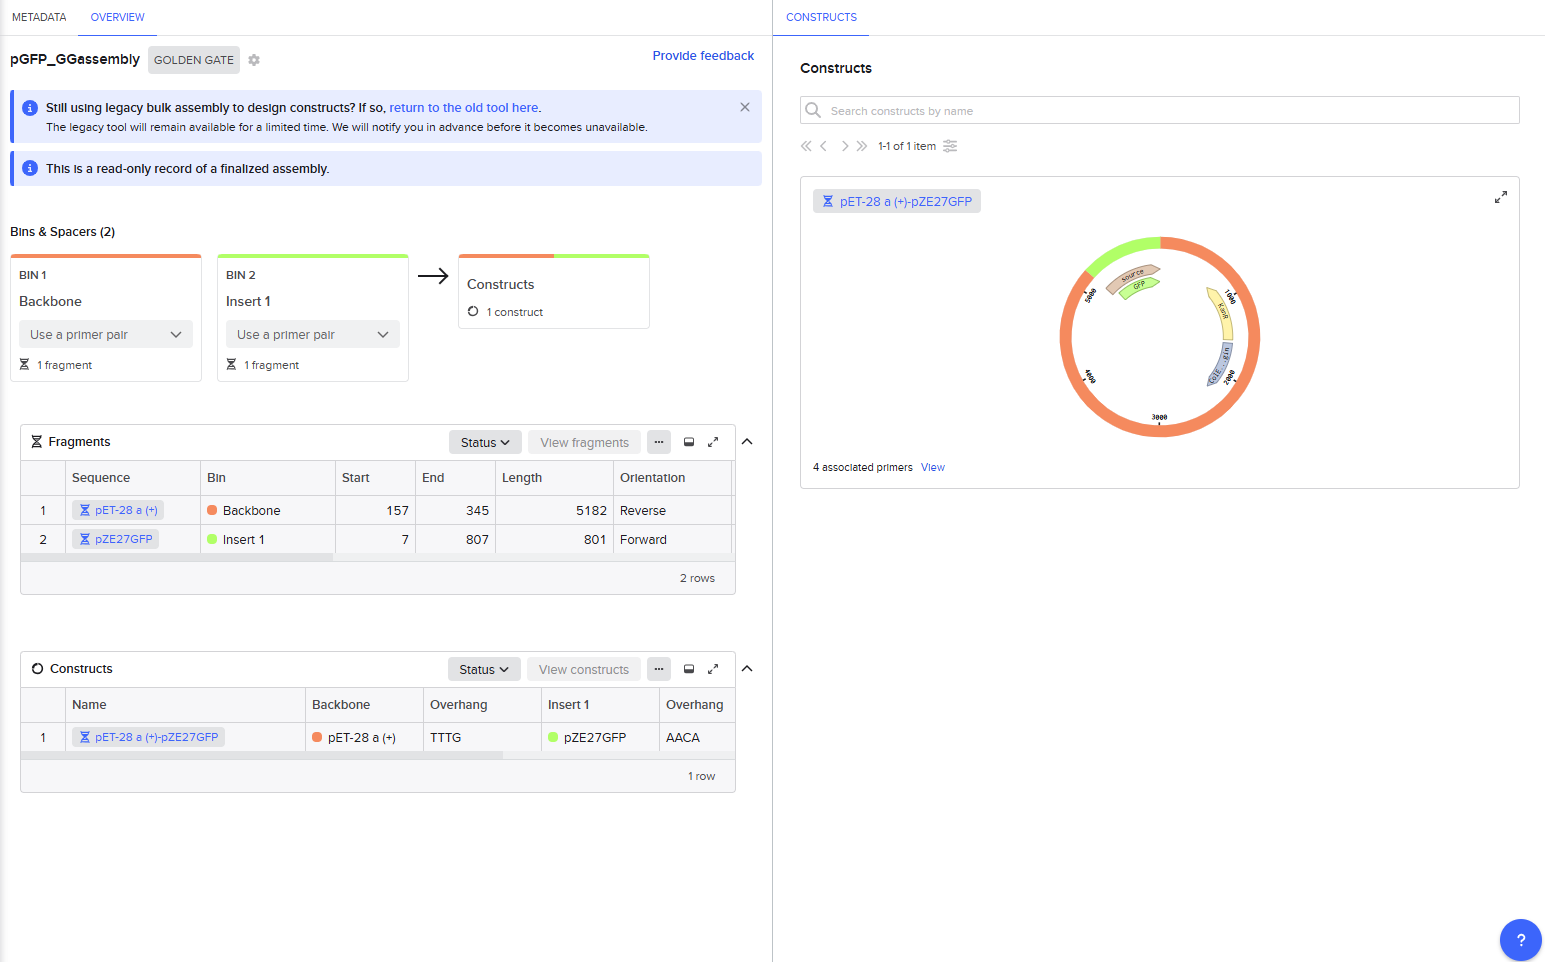
For the Golden Gate assembly method, I similarly started by opening the Assembly Wizard, used the new combinatorial assembly tool for Golden Gate. I retained all the default options. I selected “Use a primer pair” as the option under “Fragment production method”, and then retained the default options that auto-populated. Upon selecting my insert and backbone sequences, the tool threw a warning for a recognition site for the Type IIS enzyme within one of those sequences, so I went into the tool settings to instead select AarI as my enzyme. AarI was chosen somewhat arbitrarily because I’ve used it before; if it had also thrown an error, I would have simply gone down the list until I found a compatible enzyme that wouldn’t cut inside my sequences.
This resulted in a final assembly of GFP_GGassembly. The primers were auto-generated by the tool, and are visible in the Benchling files for pET28a(+) and pZE27GFP the the naming convention following “pET28a-GG_forward”. The PCR products used in the final assembly are here (insert) and here (backbone). Note that both fragments contain AarI recognition sites, but the final construct does not.
Asimov Kernel
See repository JKS_hw6 in Asimov Kernel.
Repressilator:
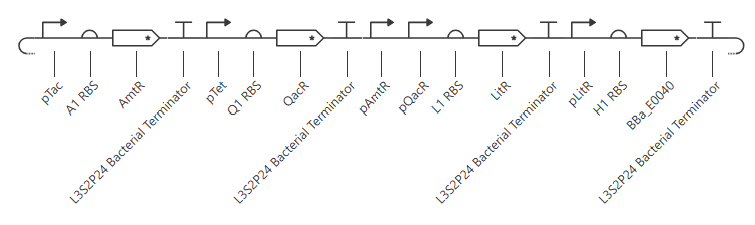
Repressilator reconstruction:
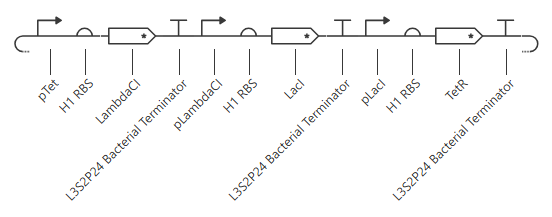
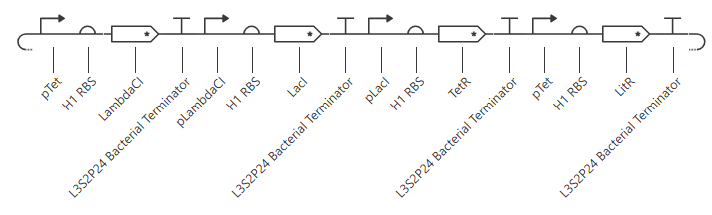
My initial attempt looks like
The Terminator chosen (L3S2P24 Bacterial Terminator) is the only one available in the Characterized Bacterial Parts repo. The H1 terminator was chosen arbitrarily as the shortest RBS; I just wanted the same RBS for each promoter-gene combo.
I wanted to add a backbone, but there’s no backbone available in the Characterized Bacterial Parts repo. Because the homework instructions said to use only the parts in this repo, I figured I’d try this first without the backbone.
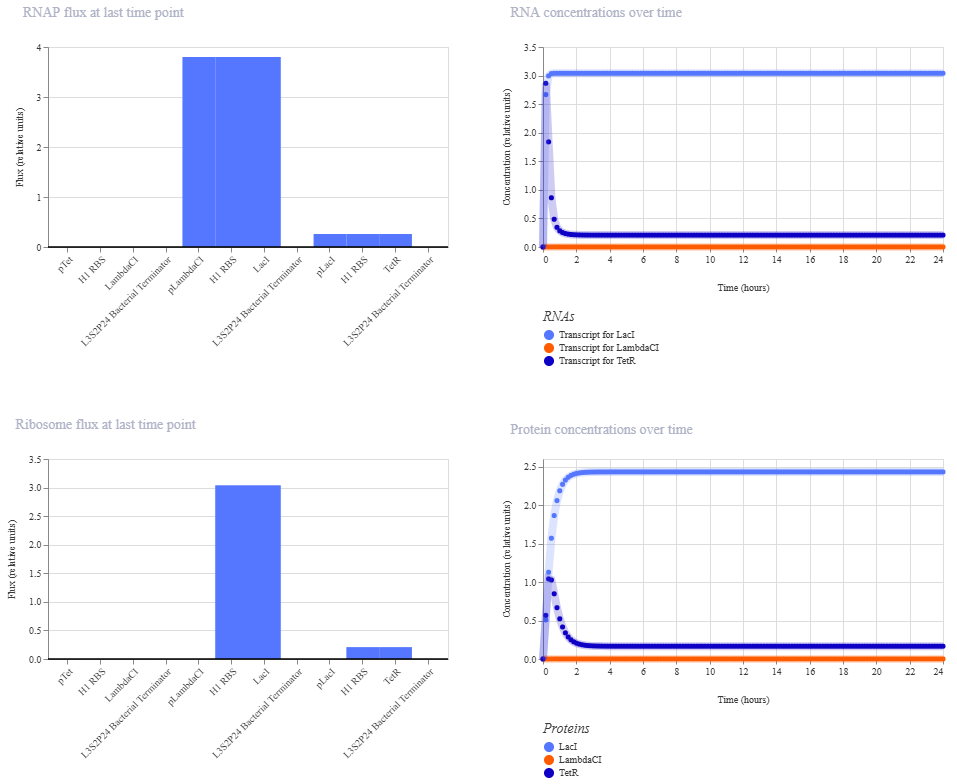
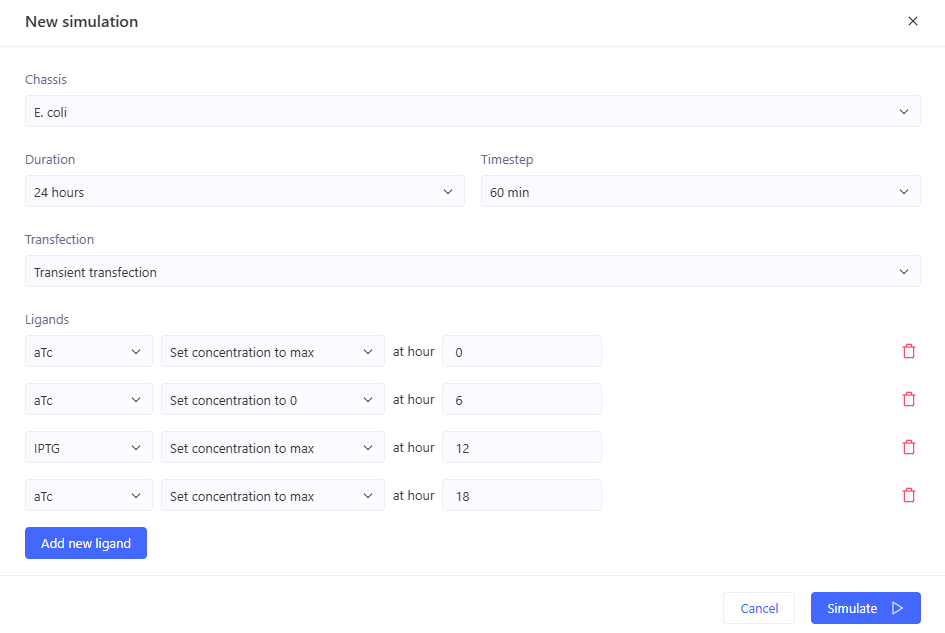
Unfortunately, this didn’t work. The outcome of my first simulation (E coli, 24h, 30min, no ligands) is below. Notice the lack of oscillations in the transcript and protein concentrations over time.
I have two potential solutions for this that I can think of before I check the pre-made Repressilator: first, I don’t have a backbone, which I do think I need, but I did still get a simulation without it, so maybe I don’t. Second, I don’t have a reporter protein. My recollection of the Repressilator paper includes a fluorescent output, so I’ll try adding a reporter gene next.
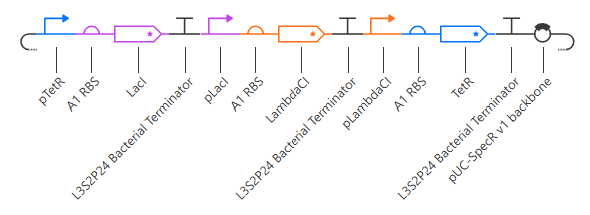
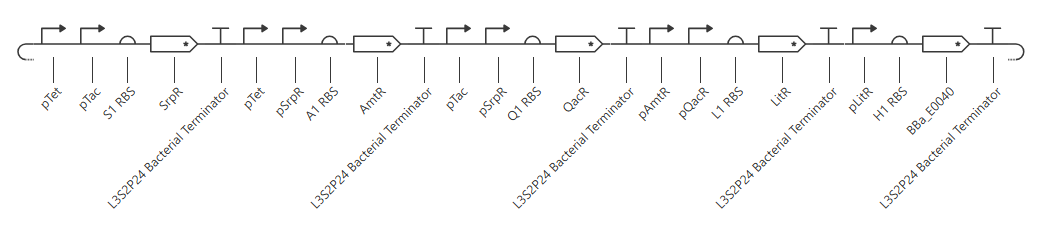
Second attempt:
pTet was chosen arbitrarily - it could have been any of the three promoters used prior. H1 RBS was used again for consistency. LitR was chosen arbitrarily as a reporter gene because I couldn’t find a fluorescent protein within the Characterized Bacterial Parts repo.
Unfortunately, this gave more or less the same kind of output with no oscillations. I’ll try adding in a backbone from outside the Characterized Bacterial Parts repo, but if that doesn’t work then I’ll have to go back and reference the demonstration repressilator. Adding pUC-SpecR-v1 backbone, but it didn’t change the output.
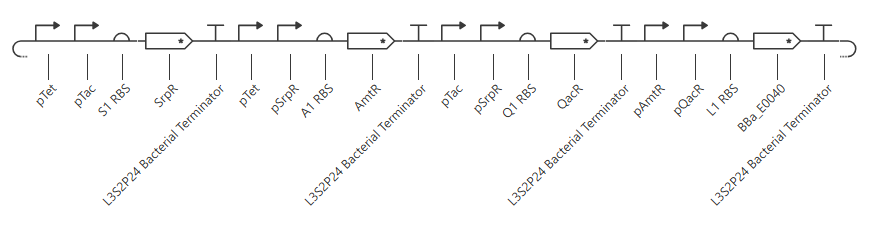
Checking the repressilator in the Bacterial Demos repo, I’m honestly not totally sure why mine didn’t work. It looks really similar:
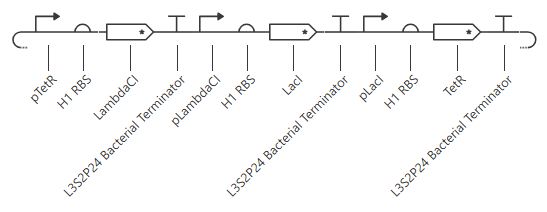
The terminator and backbone used are the same ones as I used. It has LacI/LambdaCI swapped from my original construct, but it should still work. Oh! I see - I accidentally grabbed pTet not pTetR originally. I went back and removed my pTet-LitR section, to return to my original construct, and then I replaced the pTet with pTetR.
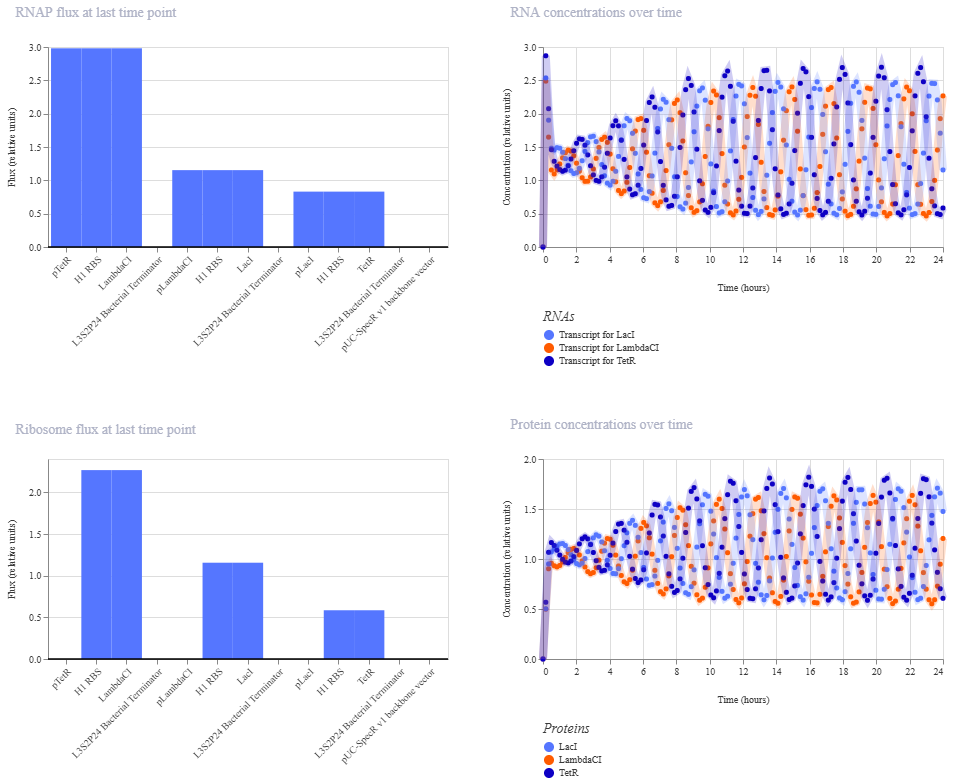
This worked! Here’s my new output:
And here’s the oscillations that I wanted to see. Awesome!
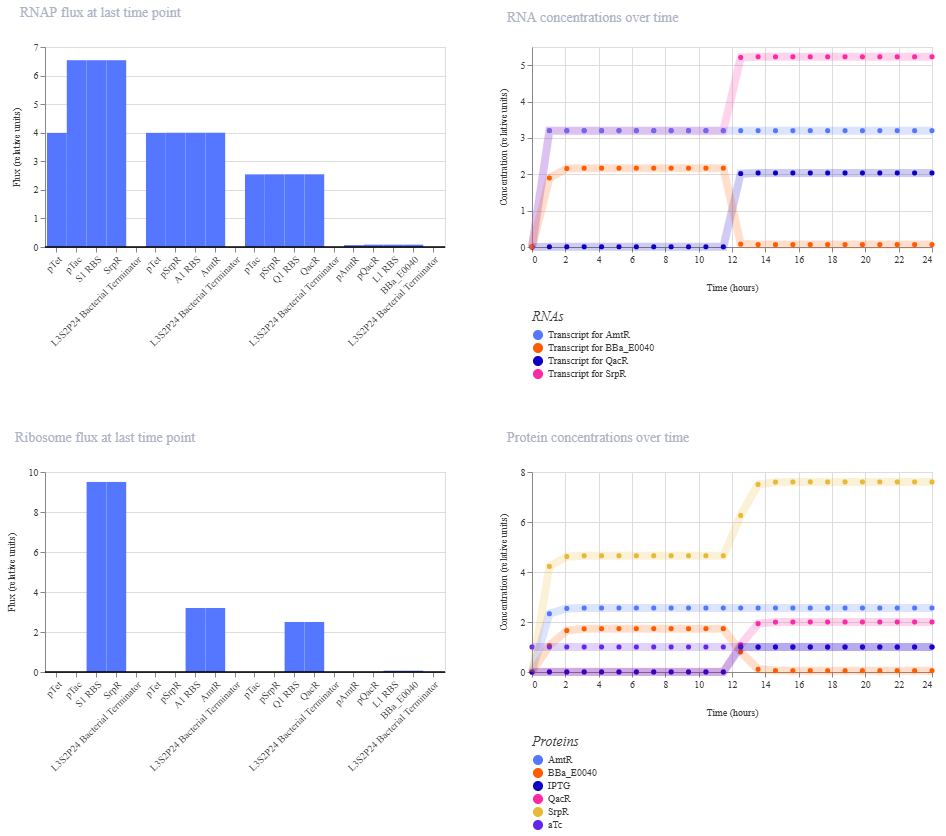
Construct1: OR gate
Construct 1: OR gate
Initial construct
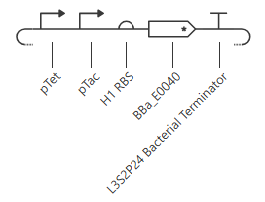
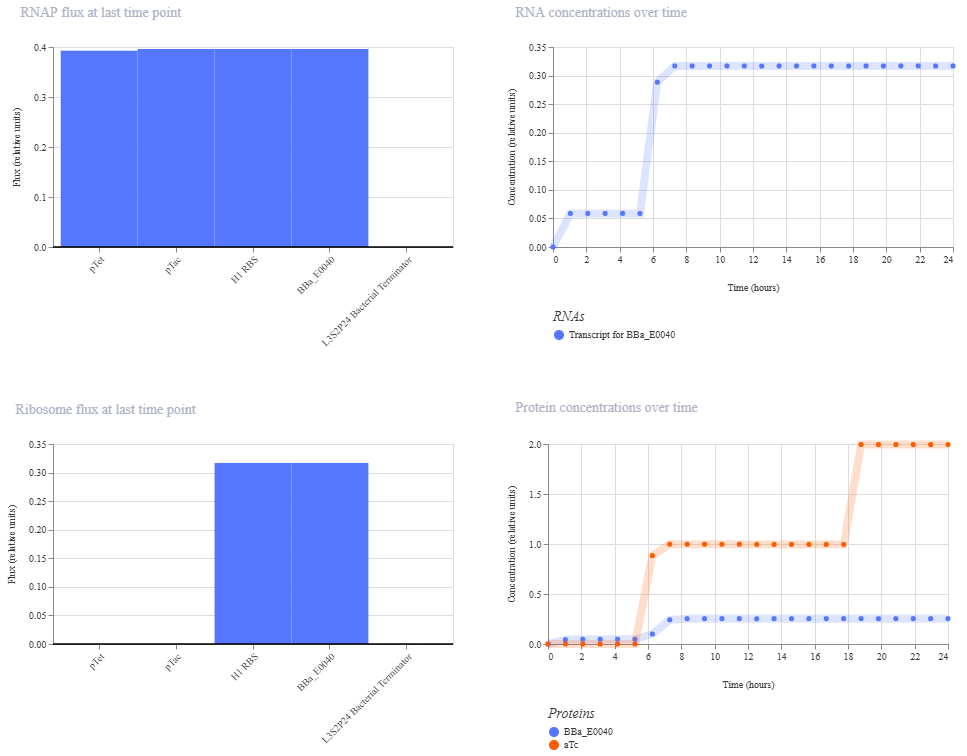
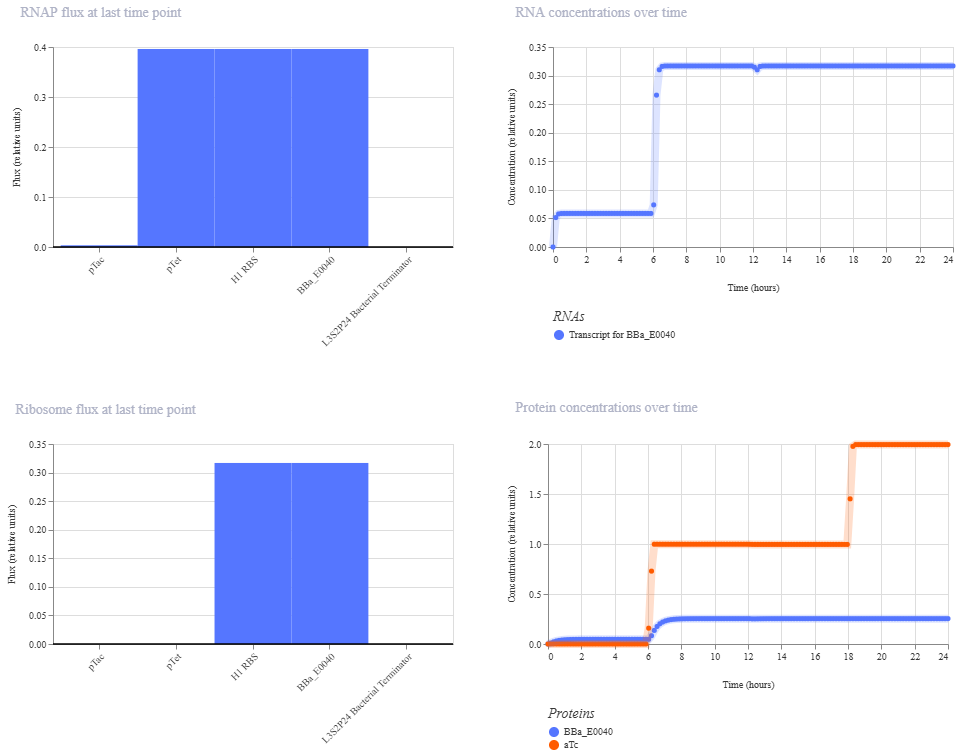
pTet is activated by aTc, pTac is activated by IPTG. BBa_E0040 is from the iGEM registry; encodes for GFP.
If aTc or IPTG is present, then GFP will be expressed.
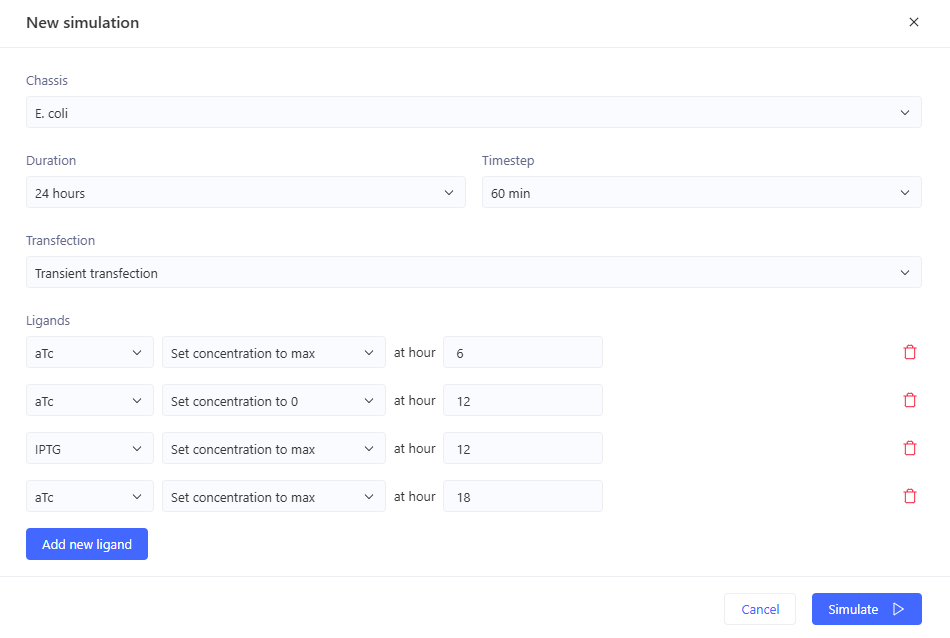
I’m a little surprised that there was as much of a difference between aTc and IPTG alone, but considering we are just looking at expression or not (rather than how much expression), i think this still worked. I am curious if I flip the order of pTet and pTac if that changes it at all. Kept the ligand amounts and times the same.
Just about the same. This makes me think that maybe setting the aTc concentration to 0 at time 12hr is maybe not working well, or maybe pTac is just that much stronger of a promoter than pTet.
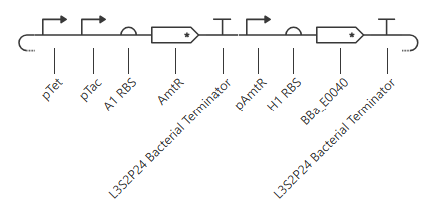
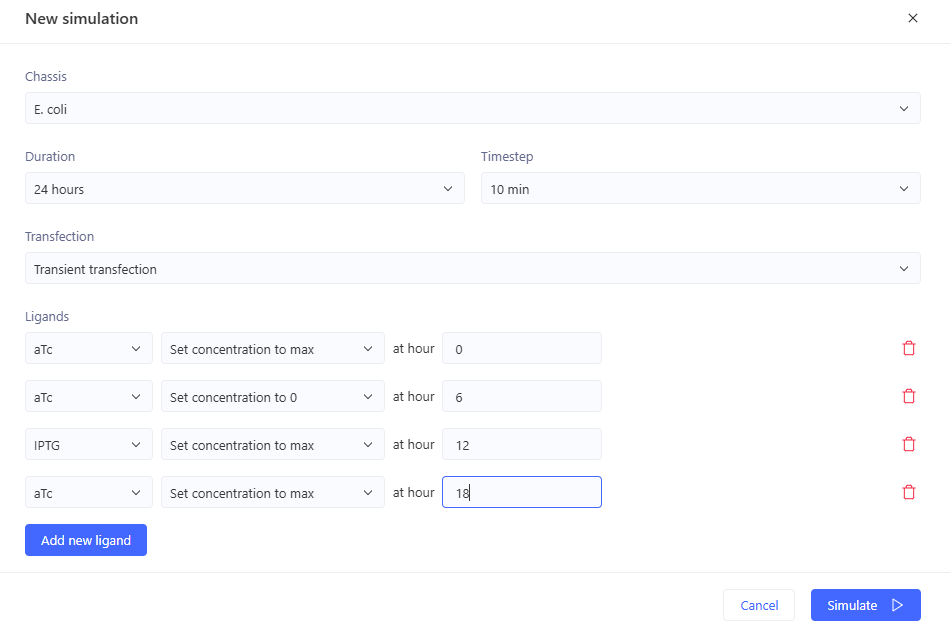
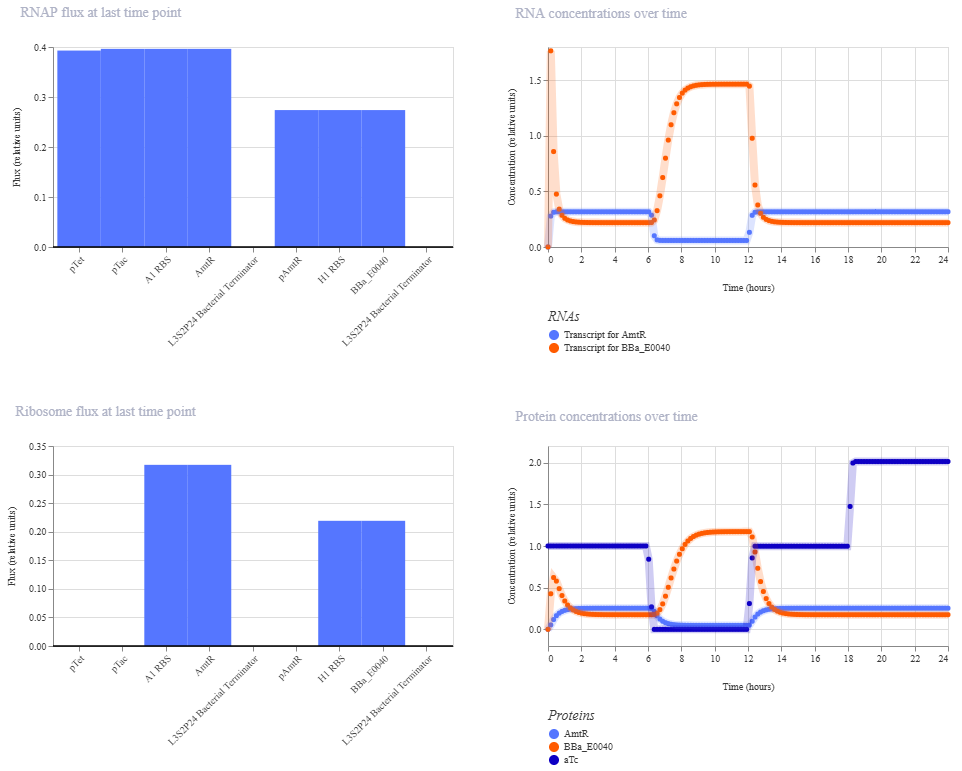
Construct2: NOR gate
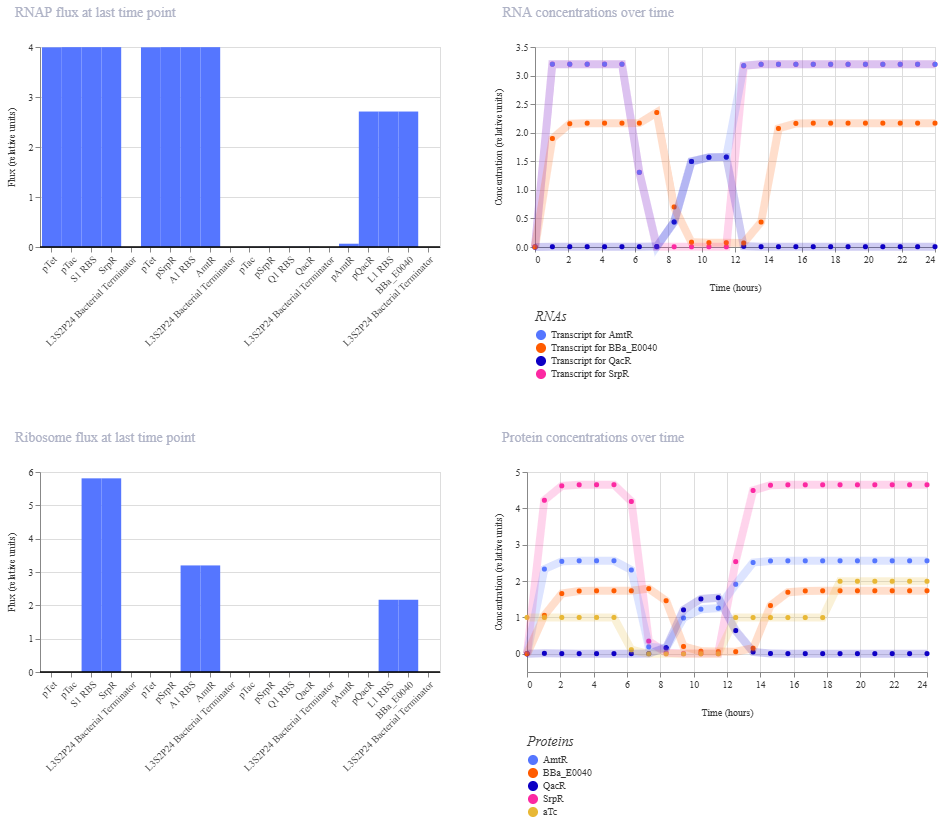
Construct2: NOR gate
Initial construction:
pTet is induced by aTc, pTac is induced by IPTG. BBa_E0040 encodes GFP.
If neither aTc nor IPTG are present, then GFP will be expressed.
Expected output:
aTc
IPTG
Output
0
0
1
1
0
0
0
1
0
1
1
0
Simulation:
0-6hrs: aTc => no output 6-12hrs: no ligands => GFP 12-18hrs: IPTG => no output 18-24hrs: aTc+IPTG => no output \
Expected outcome achieved.
Construct3: XOR gate
Construct3: NOR gate
I wanted to try to see if i could independently come up with a XOR gate without directly copying the one in the Bacterial Demos repo. Looking at my OR gate and NOR gate, I thought I’d be able to, but when I started to try to sketch it out, I kept getting stuck. Originally, I was thinking an OR gate minus an AND gate, and I had designs for both of those.
OR gate
Expected output:
aTc
IPTG
Output
0
0
0
1
0
1
0
1
1
1
1
1
AND gate
Expected output:
aTc
IPTG
Output
0
0
0
1
0
0
0
1
0
1
1
1
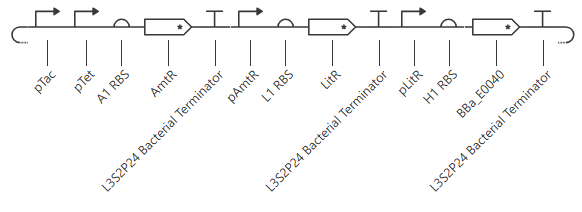
However, I couldn’t figure out how to combine these in a way that made sense. After drawing out probably a couple dozen circuits, I ended up consulting the XOR gate in the Bacterial Demos repo. Looking over it briefly (but not trying to track out the outcomes directly), I figured out a tiered method to design the circuit.
Line1: start with the output: GFP, under a repressible promoter. Line2: then below that draw that promoter’s transcription factor. add in a repressible promoter (but leave room for more if needed). Line3: then below that, draw the new promoter’s transcription factor. add in one of the two inducible promoters (leave room for more promoters if needed). But we have two inputs, so we need two inducible promoters. They can’t be on the same protein, because that wouldn’t give an OR gate. So add another promoter on line2. Line2: add another repressible promoter to the transcription factor for the GFP promoter. Line3: Below that, draw in the new promoter’s transcription factor, under the control of the other inducible promoter (leave room for more promoters if needed). But the inducible promoters need to be able to cancel each other out. Line3: So add the same repressible promoter to each transcription factor on this line. Line4: Below that, draw in that new promoter’s transcription factor, under the control of BOTH inducible promoters.
This yields the following circuit:
Expected outcome:
aTc
IPTG
SrpR
AmtR
QacR
LitR
Output
0
0
0
1
1
0
1
1
0
1
1
0
1
0
0
1
1
0
1
1
0
1
1
1
1
1
0
1
This is the opposite of an XOR gate (yielding output at Neither input or Both inputs, rather than yielding output at Either of only one input), so i just need to add one more layer of repressible promoter to get what I’m hoping for I think. Or I can replace the LitR with GFP and remove the section with GFP under pLitR.
New circuit for XOR gate:
Expected outcome:
aTc
IPTG
SrpR
AmtR
QacR
Output
0
0
0
1
1
0
1
0
1
1
0
1
0
1
1
0
1
1
1
1
1
1
1
0
Simulation:
0-6 hrs: aTc only 6-12 hrs: nothing 12-18 hrs: IPTG only 18-24 hrs: aTc and IPTG
This did not give the expected outcome. GFP doesn’t fall again at the end like it should.
I think there was just something with the simulation; either i didn’t set up the ligands properly, or it wasn’t enough time to equilibrate or something. Because when I run the different ligand combinations individually, or just one change over 24 hours it works like expected.
Here is the outcome for aTc high the entire time, and adding high IPTG at 12 hours. So it does work as expected.
What advantages do IANNs have over traditional genetic circuits, whose input/output behaviors are Boolean functions? IANNs do analog computing instead of digital. So functions are additive (positive or negative) rather than just present/absent. This means that they can respond to an input that’s beyond (over or under) a certain threshold, instead of just is the input present or not. Non-digital dosage. IANNs can also stack with multiple layers for multiple inputs as well.
Describe a useful application for an IANN; include a detailed description of input/output behavior, as well as any limitations an IANN might face to achieve your goal. IANNs can be used to identify cell types, such as cancer cells by differentiating them from the surrounding healthy cells. The cancer cells might not have a single unique signal to use as an identifier, but it might have a few different metabolites (or other signals) present in different amounts from the healthy cells. So an IANN can be used to recognize multiple inputs, and how much of those inputs are present (is it more/less than the baseline amount present in the healthy cells). The output might be fluorescence to tag tumor locations for a surgeon to excise, or maybe the output could be a medication for specific targeted release.
Draw a diagram for an intracellular multilayer perceptron where layer 1 outputs an endoribonuclease that regulates a fluorescent protein output in layer 2.
Fungal Materials
What are some examples of existing fungal materials and what are they used for? What are their advantages and disadvantages over traditional counterparts? Some existing fungal materials include fungal leather and fabrics for clothing, primarily of mycelium or cellulose; biocement, which uses bacteria or fungi to produce calcium carbonate around gravel; and fungal composite materials, which uses a fungal mycelium around an organic or agricultural substrate. Fungal composite materials can be leather-like fabrics, packaging, acoustic insulation, thermal insulation, and hard particle board or brick-like building materials for furniture or architecture.
What might you want to genetically engineer fungi to do and why? What are the advantages of doing synthetic biology in fungi as opposed to bacteria? Engineered fungi might form mycelium materials that can produce different colors; contain biosensors; have different material properties like hardness/flexibility; or be able to actively bioremediate the location that the mycelium-made object is placed in. Fungi are eukaryotic instead of prokaryotic like bacteria, which means there is more diversity both within the cell (organelles) and on a cell-to-cell level (cell differentiation). This complexity both increases the difficulty of synthetic biology in fungi over bacteria, but also allows for engineering that complexity (such as only having the bioremediation turned on in the fruiting bodies).
First DNA Twist Order
Design at least 1 insert sequence and place it into the Benchling/Kernel/Other folder you shared in the Google Form above. Document the backbone vector it will be synthesized in on your website. My first sequence is the wild-type Cupriavidus necator PhaC. For cell-free synthesis, it will be transcribed by T7 polymerase, so it needs to have those components. I designed it in Kernel, using the parts from the iGEM repository and the PhaC_Cnecator gene from the Uniprot repository.
The promoter, Bba_Z0251 is the T7 promoter with the consensus sequence. The RBS, Bba_Z0261 is a wild-type T7 RBS that has been characterized as a strong RBS by an iGEM team. The terminator, Bba_K731721 is a wild-type T7 terminator that has been characterized by an iGEM team. The Uniprot PhaC_Cnecator part has no DNA sequnce in Kernel, so I remade this circuit in Benchling, using the PhaC_Cnecator sequence that I had previously codon optimized for E. coli expression in homework2; and copied the regulatory elements from Kernel.
This will be synthesized into a Twist cloning vector. Ronan suggested a chloramphenicol marker for constructs at the Ginkgo Nebula facility, so I’ll use pTwist-Chlor-HighCopy.
Explain the main advantages of cell-free protein synthesis over traditional in vivo methods, specifically in terms of flexibility and control over experimental variables. Name at least two cases where cell-free expression is more beneficial than cell production. Cell-free protein synthesis avoids the requirements of a cold chain for shipping or storage, and it also can simplify complex living systems by instead adding in specific and known amounts of reagents (enzymes, nucleotides, amino acids, etc.). It is more beneficial than cell production in situations like biosensing in remote environments (infectious disease detection in remote or under-resourced locations) and biomanufacturing of toxic products (like some pharmaceuticals) because production won’t stop due to cell death.
Describe the main components of a cell-free expression system and explain the role of each component.
template nucleic acid: DNA or RNA encoding the gene of interest for protein
cell lysate (collection of active components, including the following - or the purified components could be added individually)
tRNA: recognizes RNA codons and adds new amino acids onto a protein chain during translation
polymerase: makes nucleic acids (DNA or RNA)
nucleotides: used by polymerase to make nucleic acids
buffer: maintains reaction pH to optimal level for enzyme function
other enzymes and cofactors, depending on the goal of the system (sometimes these are included through a cell lysate)
amino acids and ribosomes, if protein production is the goal
Why is energy provision regeneration critical in cell-free systems? Describe a method you could use to ensure continuous ATP supply in your cell-free experiment. Cell-free systems are essentially a series of chemical reactions (biological in nature, but still chemistry), which means that activation energy is required for some reactions. Energy provision regeneration is critical to ensure that the reactions continue to happen instead of stalling out early. Specifically, this is important in protein expression because translation is energetically expensive (requires ATP to attach amino acids to tRNAs). Cells generate ATP through a collection of metabolic processes; a cell-free system needs to be designed to ensure it has a way to generate ATP. One potential method is adding NAD and CoA to generate ATP from pyruvate without needing any additional enzymes.
Compare prokaryotic versus eukaryotic cell-free expression systems. Choose a protein to produce in each system and explain why. Prokaryotic systems are simpler than eukaryotic systems. Eukaryotic systems might have more components, especially for production of functional proteins, for chaperones or post-translational modifications. A prokaryotic system might be good to produce antimicrobial peptides because you don’t need to worry about the product killing the host. A eukaryotic system might be better at producing functional antibodies because antibodies are eukaryotic proteins and therefore might be more functional in a eukaryotic system.
How would you design a cell-free experiment to optimize the expression of a membrane protein? Discuss the challenges and how you would address them in your setup. A membrane protein is difficult to produce in a cell-free system because it likely has a hydrophobic area and a hydrophilic area because it is natively located within a membrane. This means that it is unlikely to be folded into the correct structure without a hydrophilic space for the hydrophilic component of the protein. To optimize the expression of a membrane protein in a cell-free experiment, you would need to stabilize it, for example, by providing liposomes or membrane vesicles in which the membrane proteins could localize for correct folding.
Imagine you observe a low yield of your target protein in a cell-free system. Describe three possible reasons for this and suggest a troubleshooting strategy for each. Three possible reasons for a low protein yield in a cell-free system is insufficient transcription, insufficient translation, or a badly designed DNA template. Insufficient transcription could be due to not adding enough nucleotides into the reaction. This could be tested by adding an mRNA template into the reaction to see if this solves it. Insufficient translation could be due inactive tRNA, inactive ribosomes, or not enough amino acids. This could be tested by spiking more of those individual, purified components (or fresh cell lysate) into the reaction - it’s possible one of those has been degraded. A badly designed DNA template might have a promoter that isn’t recognized by the polymerase provided in the cell-free system; this could be tested with a control reaction that includes a DNA template known to work in this established system.
Reference
Hunt, AC; Rasor, BJ; Seki, K; et al. Cell-Free Gene Expression: Methods and Applications. 2024. ACS Chemical Reviews 125(1): 91-149. DOI: 10.1021/acs.chemrev.4c00116
Homework questions from Kate Adamala
Design an example of a useful synthetic minimal cell as follows:
Pick a function and describe it.
What would your synthetic cell do? What is the input and what is the output? The SMC would produce PHB (bioplastic) using atmospheric carbon dioxide as a carbon source (effectively, photosynthesis producing PHB as the carbon storage molecule). The input is CO2 and sunlight. The output is PHB (and oxygen).
Could this function be realized by cell-free Tx/Tl alone, without encapsulation? Maybe, it would likely be at a low yield. The value of encapsulation here is to keep the intermediates in close spatial proximity to the biosynthetic enzymes for efficient biosynthesis of the final product. I’m also unsure if a thylakoid could exist without encapsulation. I’m not sure why it wouldn’t be able to; I just don’t think I’ve ever read of a cell-free thylakoid.
Could this function be realized by genetically modified natural cell? No. A cell, even a genetically modified one, would have to devote some carbon flux towards biomass and cell replication. Ideally, the synthetic cell wouldn’t have to, and all the carbon (consumed from atmospheric carbon dioxide) would go exclusively towards PHB production.
Describe the desired outcome of your synthetic cell operation. The synthetic cell would produce PHB from atmospheric carbon dioxide, with all carbon flux going towards PHB.
Design all components that would need to be part of your synthetic cell.
What would be the membrane made of? The membrane would be made up of lipids and cholesterol for flexibility. It also needs to include a thylakoid for light-harvesting.
What would you encapsulate inside? Enzymes, small molecules. Inside the SMC, I’d want the enzymes for PHB synthesis. This includes PhaC (the PHA synthase), and also all the enzymes required to build the precursor monomers. We’d maybe need a couple of Calvin Cycle enzymes, but it’s hard to say without drawing out all possible pathways of carbon flux - the idea would be for PHB to be the “energy storage” product. This might be easiest by using a cyanobacterial cell lysate, but ideally, we’d want to get to something simpler than that.
Which organism your Tx/Tl system will come from? Is bacterial OK, or do you need a mammalian system for some reason? (hint: for example, if you want to use small molecule modulated promotors, like Tet-ON, you need mammalian) It would be bacterial. Especially at first, it would have to come from a cyanobacterium, likely Synechocystis sp. PCC 6803 because it’s well-studied. It would be ideal to understand the system to the extent that we could use any bacterial system (such as E. coli), and simply include whatever cyanobacteria-specific proteins or metabolites are needed.
How will your synthetic cell communicate with the environment? (hint: are substrates permeable? or do you need to express the membrane channel?) The SMC would have to export the PHB. So some kind of membrane channel would need to be included.
Experimental details
List all lipids and genes. (bonus: find the specific genes; for example, instead of just saying “small molecule membrane channel” pick the actual gene.) Membrane: lipid, cholesterol, thylakoid membrane, chlorophyll, membrane channel Enzymes: bacterial Tx/Tl, PHB biosynthetic enzymes
How will you measure the function of your system? The system’s function would be measured by the PHB output, which could be BODIPY staining if PHB is not exported, or mass spectrometry if PHB is exported.
Homework questions from Peter Nguyen
Choose one application field — Architecture, Textiles/Fashion, or Robotics — and propose an application using cell-free systems that are functionally integrated into the material. Answer each of these key questions for your proposal pitch:
Write a one-sentence summary pitch sentence describing your concept. A chlorophyll-based paint for self-healing concrete can improve air quality in buildings suffering degradation.
How will the idea work, in more detail? Write 3-4 sentences or more. Self-healing bioconcrete is either live cells, or a cell-free system, integrated into concrete that produces calcium carbonate from atmospheric CO2 when cracks are exposed to water (which then fills in the cracks). My idea is to create freeze-dry a cell-free system expressing chlorophyll to turn into a paint to go on the outside of this building material. The chlorophyll provides an energy regeneration capacity for the calcium-carbonate cell-free system, while also producing oxygen, thereby improving the local air quality; effectively, photosynthesis that generates calcium carbonate from CO2 and light instead of generating glucose. This would mean that any cracks or chips seen on the inside of the building could be sprayed with water and lit with a plant light, and the combination of the two cell-free systems would repair the crack. The chlorophyll paint would have the further benefit of being visibly green when activated, so the repair process could be visually tracked.
What societal challenge or market need will this address? How do you envision addressing the limitation of cell-free reactions (e.g., activation with water, stability, one-time use)? This improves the self-healing concrete concept, which addresses the high CO2 emissions cost of traditional concrete manufacturing, as well as decreasing the amount of human work needed to repair broken concrete. The biggest limitation here is that it is one time use, but i think that making the chlorophyll into a paint addresses this because once the repair is completed, the new concrete could be painted over again.
Reference
Smirnova, M; Nething, C; Stolz, A; et al. High strength bio-concrete for the production of building components. 2023. NPJ Materials Sustainability, 1(4): s44296-023-00004-6. DOI: 10.1038/s44296-023-00004-6
Homework questions from Ally Huang
Provide background information that describes the space biology question or challenge you propose to address. Explain why this topic is significant for humanity, relevant for space exploration, and scientifically interesting. Ionizing radiation is a safety and health concern for space exploration because of how damaging it is to living organisms. Ionizing radiation is more harmful than non-ionizing radiation because it is higher energy and can pass through more materials (thereby making it harder to shield from). While in low Earth orbit, where the ISS is, most of the radiation is protected against by Earth’s magnetic field, but the astronauts aboard the ISS still experience more radiation than people on Earth. Any space exploration beyond low Earth orbit has to deal with higher amounts of ionizing radiation.
Name the molecular or genetic target that you propose to study. Melanin from Cryptococcus neoformans, biosynthesized by Lac1 with phenolic substrate such as dopamine; and control pigment chlorophyll, biosynthesized by ChlP with substrate geranylgeranyl-chlorophyll a
Describe how your molecular or genetic target relates to the space biology question or challenge your proposal addresses. C. neoformans is a fungus that utilizes the energy in radiation via radiosynthesis, analogous to plants utilizing the energy in sunlight via photosynthesis. A similarly radiotrophic fungus was grown on the ISS to investigate its potential as a shielding mechanism against the ionizing radiation in space. It’s known that the pigment melanin provides some protective effect against radiation, and it’s hypothesized that melanin plays an analogous role as chlorophyll in radiosynthesis and photosynthesis, respectively.
Clearly state your hypothesis or research goal and explain the reasoning behind it. Hypothesis: melanin will provide a greater protective effect against the radiation in space than chlorophyll a. The DNA in tubes with lac1 will have a lower mutation or fragmentation than tubes with chlP. The tubes containing lac1 will have a higher number of control (mRFP1) transcripts than tubes containing chlP. This difference in transcript counts might be attributable either to the higher DNA integrity due to melanin’s protection or to increased energy availability from radiosynthesis over photosynthesis (more radiation than sunlight in the test conditions).
Outline your experimental plan - identify the sample(s) you will test in your experiment, including any necessary controls, the type of data or measurements that will be collected, etc. All tubes contain BioBits cell-free expression system, the control gene for red fluorescent protein (mRFP1), and the substrates for both Lac1 and ChlP (dopamine and geranylgeranyl-chlorophyll a).
Negative control: no additional DNA
Condition 1: DNA encoding lac1 gene
Condition 2: DNA encoding chlP gene While these tubes could be visualized with the Molecular Fluorescence Viewer for red fluorescence, I believe visual analysis would be hampered by the pigment production. Better data would be obtained from purified nucleic acids. The DNA should be sequenced with long-reads to identify any fragmentation. The RNA should be used in RT-qPCR to quantify transcript counts.
Casadevall, A; Cordero, RJB; Bryan, R; et al. Melanin, radiation, and energy transduction in fungi. 2017. ASM Microbiology Spectrum, 5(2): 10.1128/microbiolspec.funk-0037-2016. DOI: 10.1128/microbiolspec.funk-0037-2016
Averesch, NJH; Shunk, GK; Kern, C. Cultivation of the dematiaceous fungus Cladosporium sphaeropermum aboard the International Space Station and effects of ionizing radiation. 2022. Frontiers in Microbiology, 13: 877625. DOI: 10.3389/fmicb.2022.877625
Williamson, PR; Wakamatsu, K; Ito, S. Melanin biosynthesis in Cryptococcus neoformans. 1998. ASM Journal of Bacteriology, 180(6): 1570-1572. DOI: 10.1128/jb.180.6.1570-1572.1998
Chen, GE; Canniffe, DP; Barnett, SFH; et al. Complete enzyme set for chlorophyll biosynthesis in Escherichia coli. 2018. Science Advances, 4(1): eaaq1407. DOI: 10.1126/sciadv.aaq1407
Please identify at least one (ideally many) aspect(s) of your project that you will measure. It could be the mass or sequence of a protein, the presence, absence, or quantity of a biomarker, etc. I’d like to measure the mass of produced PHB.
Please describe all of the elements you would like to measure, and furthermore describe how you will perform these measurements. How to measure the mass:
Centrifuge cell-free reaction to pellet insoluble PHB.
Aspirate off supernatant into waste.
Wash with water 2-3x, again pour off supernatant to waste.
Dissolve remaining PHB pellet in chloroform.
Weigh clean microtube.
Transfer chloroform solution into the weighed microtube.
Add methanol to precipitate out the PHB. Centrifuge to pellet.
Aspirate off supernatant (methanol and chloroform) to waste.
Leave tube open under fume hood to fully evaporate supernatant.
Weigh again; amount of PHB produced = [final tube weight]-[starting tube weight]
Once the PHB mass is measured, I could re-dissolve in chloroform for molecular weight and polydispersity measurements using gel permeation chromatography. I could also confirm that it is PHB on GC-MS.
What are the technologies you will use (e.g., gel electrophoresis, DNA sequencing, mass spectrometry, etc.)? I’d use a mass balance, gel permeation chromatography, and gas chromatography-mass spectrometry.
References
Jossek, R; Steinbuchel, A. In vitro synthesis of poly(3-hydroxybutyric acid) by using an enzymatic coenzyme A recycling system. FEMS Microbiology Letters 1998, 168: 319-324. https://doi.org/10.1111/j.1574-6968.1998.tb13290.x
Satoh, Y; Tajima, K; Tannai, H; et al. Enzyme-catalyzed poly(3-hydroxybutyrate) synthesis from acetate with CoA recycling and NADPH regeneration in Vitro. Journal of Bioscience and Bioengineering 2002, 95(4): 335-341. https://doi.org/10.1016/S1389-1723(03)80064-6
Waters Part I: Molecular Weight
Based on the predicted amino acid sequence of eGFP and any known modifications, what is the calculated molecular weight? You can use an online calculator. Using the online calculator: 28006.60 Da. However, GFP’s self-cyclization into the active fluorophore results in a loss of around 20 Da, according to this week’s lab. So the better theoretical molecular weight should be 28006.60-20 = 27986.60
Calculate the molecular weight of the eGFP using the adjacent charge state approach described in the recitation. Select two charge states from the intact LC-MS data (Figure 1) and: m/z: Charge state n is 903.7148; charge state n+1 is 875.4421
Determine z for each adjacent pair of peaks.
$$ z = \frac{\frac{m}{z_{n+1}}}{\frac{m}{z_n} - \frac{m}{z_{n+1}}} $$
$$ z = \frac{875.4421}{903.7148 - 875.4421} = \frac{875.4421}{28.2727} $$
$$ z = 30.9642 = 31 $$
Determine the MW of the protein.
$$ MW = z*\frac{m}{z_n}-z = z(\frac{m}{z_n}-1) $$
$$ MW = 31*(903.7148-1) = 31*902.7148 $$
$$ MW = 27,984.1588 $$
Calculate the accuracy of the measurement using the deconvoluted MW from 2.2 and the predicted weight of the protein from 2.1.
$$ accuracy = \frac{|MW_{experiment} - MW_{theory}|}{MW_{theory}} $$
$$ accuracy = \frac{|27,984.1588 - 27986.60|}{27986.60} = \frac{2.4412}{27986.60} = 8.7227e-5 $$
$$ accuracy * 1,000,000 = 87.2275 ppm $$
This is >50ppm but it’s close, so this might be the right protein.
Can you observe the charge state for the zoomed-in peak in the mass spectrum for the intact eGFP? If yes, what is it? If no, why not? The picture is pretty blurry, so honestly i am having a hard time reading the numbers. But i think we can see isotope peaks labeled: 1473.7429, 1473.7950, [unreadable], 1474.0045, 1474.0481, 1474.1006. These all yield spacings around 0.05. This would indicate a charge state around 20.
Waters Part II: Secondary/Tertiary Structure
Based on learnings in the lab, please explain the difference between native and denatured protein conformations. For example, what happens when a protein unfolds? How is that determined with a mass spectrometer? What changes do you see in the mass spectrum between the native and denatured protein analyses (Figure 2)? Native protein conformation is the shape the protein is folded into when it is made by the cell, this is usually the active state for enzymes. Denatured protein conformation is when the protein is unfolded, and essentially a linear amino acid sequence. On mass spectometry, the denatured state exposes all possible sites for adding a charge for the clean z+1 peaks, whereas the native conformation has more limited (and frequently unknown) how many charges can and are added in different peaks. In a mass spec, the more linear/unfolded proteins add more charges, so the m/z peaks tend to be lower than those of a native protein (more peaks to the right).
Zooming into the native mass spectrum of eGFP from the Waters Xevo G3 QTof MS (see Figure 3), can you discern the charge state of the peak at ~2800 m/z? What is the charge state? How can you tell? Once again, the low resolution of the screenshot is making it hard to read the numbers. A stretch that i’m decently confident about reads peaks at: 2545.1304, 2545.2222, 2545.3140, 2545.4058, 2545.4973. These all yield a spacing around 0.09. This would indicate a charge state around 11.
Waters Part III: Peptide Mapping - primary structure
How many Lysines (K) and Arginines (R) are in eGFP? Please circle or highlight them in the eGFP sequence given in Waters Part I question 1 above.
How many peptides will be generated from tryptic digestion of eGFP? 26, by my hand count. Using the online tool, 19. i think the difference is in not counting the very short peptides (< 5 amino acids, plus a couple of 4 AA peptides, likely because they have heavier side chains since it has a 500 Da cutoff).
Based on the LC-MS data for the Peptide Map data generated in lab (please use Figure 5a as a reference) how many chromatographic peaks do you see in the eGFP peptide map between 0.5 and 6 minutes? You may count all peaks that are >10% relative abundance. I saw 23 peaks, but only 21 are labeled, so I’m guessing maybe only the labeled ones are >10% abundance?
Assuming all the peaks are peptides, does the number of peaks match the number of peptides predicted from question 2 above? Are there more peaks in the chromatogram or fewer? No, there are more peaks in the chromatogram.
Identify the mass-to-charge (m/z) of the peptide shown in Figure 5b. What is the charge (z) of the most abundant charge state of the peptide (use the separation of the isotopes to determine the charge state). Calculate the mass of the singly charged form of the peptide ([M+H]+) based on its m/z and z. The m/z of the peptide at the most abundant charge state is 525.76712. The z of the most abundant charge state is 2 (because the highest peak has isotope peaks that are 0.5 m/z apart).
$$ \frac{MW+2H}{2} = 525.76712 $$
$$ MW + 2(1.00727) = 1051.53424 $$
$$ MW + 2.01454 = 1051.53424 $$
$$ MW = 1049.5197 $$
$$ [M+H]+ = MW+1H = 1049.5197 + 1.00727 $$
$$ [M+H]+ = 1050.52697 $$
Identify the peptide based on comparison to expected masses in the PeptideMass tool. What is mass accuracy of measurement? Please calculate the error in ppm. The peptide is FEGDTLVNR.
$$ accuracy = \frac{|MW_{experiment} - MW_{theory}|}{MW_{theory}} $$
$$ accuracy = \frac{|1050.52697 - 1050.5214|}{1050.5214} = \frac{0.00557}{1050.5214} $$
$$ accuracy = 5.30212 e-6 * 1,000,000 = 5.3 ppm $$
This is <10 ppm, so it is probably the correct peptide.
What is the percentage of the sequence that is confirmed by peptide mapping? 88%
Can you determine the peptide sequence for the peptide fragmentation spectrum shown in Figure 5c? FEGDTLVNR; mono; +1; B, Y. Mostly matches up. D peak at 717 is very small and unlabeled, but it looks like there’s a peak approximately there. There’s no N peak at 289, nor an R peak at 175. Also the three smallest peaks don’t match up with anything in the in-silico fragmentation (56, 122, 214).
Does the peptide map data make sense, i.e. do the results indicate the protein is the eGFP standard? Why or why not? Mostly - the peptides that are not covered in the peptide mapping are either too large (>20 AA) or too small (<5 AA) for confident identification according to the informaiton provided in the lab.
Please fill out this table with the data you acquired from the lab work done at the Waters Immerse Lab in Cambridge, or else the data screenshots in this document if you were unable to have lab work done at Waters.
Theoretical
Observed/measured on the Intact LC-MS
PPM Mass Error
Molecular weight (kDa)
27986.60
27,984.16
87.2
This error is close to 50 ppm, so it might be GFP. Especially with the pretty good peptide mapping, I think this is likely GFP, though I am not as confident as I would like to be.
Part A: The 1,536 Pixel Artwork Canvas | Collective Artwork
I made most of the big bulls-eye target in the upper right quadrant that occurred fairly early on in the editing time period. I made it largely during the recitation just by having it open in another window from the lecture and clicking another pixel whenever my timer ran out. I didn’t really contribute after that, but it was fun to see how people incorporated the target into one of the scissors handles, and then it ultimately disappeared. For future iterations, I’d really recommend publishing the viewable history link somewhere because I lost it after like a day and so then I wasn’t able to keep watching the changes and how they compared to previous versions.
Part B: Cell-Free Protein Synthesis | Cell-Free Reagents
Referencing the cell-free protein synthesis reaction composition (the middle box outlined in yellow on the image above, also listed below), provide a 1-2 sentence description of what each component’s role is in the cell-free reaction. \
E. coli Lysate
BL21 (DE3) Star Lysate (includes T7 RNA Polymerase): Lysate includes enzymes, nutrients, and cofactors; specifically, it includes the T7 RNA polymerase for rapid transcription of genes under T7 promoter.
Salts/Buffer
Potassium Glutamate: Potassium glutamate is a potassium source; potassium is an essential enzyme co-factor.
HEPES-KOH pH 7.5: HEPES buffer maintains pH at the optimal pH for enzyme efficiency; transcription and translation usually occurs at neutral pHs which the inside of a cell is. KOH is the hydroxide to adjust buffer to pH 7.5 to because potassium phosphate is used.
Magnesium Glutamate: Magnesium glutamate is a magnesium source; magnesium is an essential enzyme co-factor.
Potassium phosphate monobasic: Potassium phosphate is both a phosphate (energy) source and a potassium (enzyme co-factor) source; I’m unsure why both the monobasic and dibasic are included here. Monobasic is mildly acidic in comparison.
Potassium phosphate dibasic: Potassium phosphate is both a phosphate (energy) source and a potassium (enzyme co-factor) source; I’m unsure why both the monobasic and dibasic are included here. Dibasic is mildly basic in comparison.
Energy / Nucleotide System
Ribose: Ribose is a sugar molecule that is an essential component of nucleic acids and ATP. It’s used in nucleotide production (GMP from guanine) and possibly also energy regernation.
Glucose: Glucose is a sugar molecule that is used in ATP regeneration.
AMP: Adenosine monophosphate is a nucleotide used in transcription. It gets additional phosphate groups to become ATP, which is essential for energy, and so it is probably also used in ATP regeneration.
CMP: Cytidine monophosphate is a nucleotide used in transcription.
GMP: Guanosine monophosphate is a nucleotide used in transcription.
UMP: Uridine monophosphate is a nucleotide used in transcription.
Guanine: Guanine is the nucleoside base for GMP; it can be used to make GMP with ribose and phosphate probably?
Translation Mix (Amino Acids)
17 Amino Acid Mix: Amino acids are needed for translation because they are what proteins are made up of. I’m not sure why this is only 17 instead of 20.
Tyrosine: This is an amino acid needed for translation. I’m unsure why additional tyrosine would need to be added beyond the mix, maybe it’s not one of the 17?
Cysteine: This is an amino acid needed for translation. I’m unsure why additional cysteine would need to be added beyond the mix, maybe it’s not one of the 17?
Additives
Nicotinamide: Nicotinamide is part of NAD+/NADP+, and so is needed for energy regeneration in redox reactions.
Backfill
Nuclease Free Water: It’s an aqueous solution, so water fills out the rest of the reaction volume; nuclease-free water doesn’t contain active restriction enzymes to cleave DNA or RNA.
Describe the main differences between the 1-hour optimized PEP-NTP master mix and the 20-hour NMP-Ribose-Glucose master mix shown in the Google Slide above. The main difference appears to be in energy regeneration and cheapter components, because it uses nucleotide monophosphates instead of triphosphates. It also uses PEP-Mono (phosphoenol pyruvate, monosodium salt) for energy instead of nucleotides and sugars for energy generation through enzymatic pathways like glycolysis. PEP-Mono is a high energy phosphate-containing compound that can easily transfer phosphate groups for energy.
Bonus question: How can transcription occur if GMP is not included but Guanine is? GMP is produced with guanine, ribose, and phosphate that is provided separately in the cell-free mixture. not sure which specific enzyme(s) are involved
Part C: Planning the Global Experiment | Cell-Free Master Mix Design
Given the 6 fluorescent proteins we used for our collaborative painting, identify and explain at least one biophysical or functional property of each protein that affects expression or readout in cell-free systems. FPbase.org is not currently working, so i’m doing the best i can based off of skimming papers because i don’t have time to do a close reading of a whole bunch of them unfortunately. honestly, i’ll probably just try again later.
sfGFP: sfGFP was developed to be faster at folding into the active, fluorescent shape than wild-type GFP, resulting in a more robust and stable fluorescent protein.
mRFP1: Needs to bind to calcium?
mKO2
mTurquoise2
mScarlet_I
Electra2
Create a hypothesis for how adjusting one or more reagents in the cell-free mastermix could improve a specific biophysical or functional property you identified above, in order to maximize fluorescence over a 36-hour incubation. Clearly state the protein, the reagent(s), and the expected effect. Because mRFP1 is considered to be “somewhat slowly-maturing”, I predict that changing the co-factor concentrations could improve maturation time for brighter fluorescence sooner. So I want to increase the potassium and magnesium concentrations.
The second phase of this lab will be to define the precise reagent concentrations for your cell-free experiment. I wanted to test both the magnesium and the potassium concentrations for mRFP1. I chose wells Q2-G17 through Q2-G24 which are designated for mRFP1. Wells Q2-G17, G18, G19: I increased the potassium glutamate concentration by approximately 20% (specifically 19.9%). Wells G20, G21, G22: I increased the magnesium glutamate concentration by approximately 20% (specifically 17.9%). For the final two wells (G23 and G24), I increased the concentration of both salts to test the cumulative effect (potassium glutamate +19.9% and magnesium glutamate +17.9%).
For the first step, I would use 1 µL of the stock solution diluted into 499 µL of water to make 500 µL of a 10,000 µM solution. Then for the next step, I would use 1 µL of the 10,000 µM dilution, diluted into 99 µL of water to make 100 µL of a 100 µM solution.
Dilution practice 2
The stock concentration of a mystery substance (MS) is 5 M. If the molar mass of MS is 532 g/mol, what’s the concentration of the stock concentration in g/mL?
$$ 5 M = 5 \frac{mol}{L} $$
$$ 5 \frac{mol}{L} * 532 \frac{g}{mol} = 2,660 \frac{g}{L} $$
$$ 2,660 \frac{g}{L}* \frac{1L}{1,000 mL} = 2.66 \frac{g}{mL} $$
You will perform a serial dilution to get 100 uM of MS. Devise a plan to dilute a 5 M MS solution to 100 uM. How many dilution steps will we need? Which tubes should we use? Which pipettes? We will need two empty microtubes. For the first step, we’ll use a P20 for the stock solution, and a P1000 for the water. For the second step, we’ll use a P20 for dilution 1, and a P200 for the water.
graph LR;
  A[stock solution 5M] -->|1µL stock into 499µL water| B[dilution 1: 10,000µM]
  B -->|1µL dilution1 into 99µL water| C[final dilution: 100 µM]
Fill out the following chart to prepare a final reaction with 60 uL reaction volume. Why did we make 100 uM MS if we actually need 40 uM MS? Why not prepare 40 uM in serial dilutions?
If we had 40 µM MS, then when we added the loading dye, it would be diluted below 40 µM. So we need to have a high enough concentration of MS, that we can add loading dye to 1X concentration and still reach a final MS concentration of 40 µM.
Lab
Part 1: Mixing Color
I made my stock color solutions by adding dye to approximately 5 ml water in three different 12 ml test tubes: 3 drops of yellow dye, 1 drop of blue dye, 2 drops of red dye, and then vortexing to mix.
Following the protocol, I obtained 6 colors. Step 4 was done with P20 and P200 in steps as described; steps 5 and 6 were done in single steps with the P1000 and P200 respectively.
I made an additional 4 colors as follows:
Lime: 300 ul yellow, 50 ul blue
Teal: 25 ul yellow, 600 ul blue
Coral: 300 ul red, 50 ul yellow, 25 ul blue, 300 ul water
Slate: 100 ul red, 300 ul blue, 300 ul water
My step 7 artwork is below and also the above cover image.
Part 2: Performing Serial Dilution
I don’t know what the Mystery Substance (MS) is supposed to be. I used some purified pUC19 plasmid, at a concentration of 197 ng/ul because that’s something I had available. It’s a double-stranded DNA, so the molecular weight would be around 660 g/mol per base pair, or a total of $660 \frac{g/mol}{bp} * 2.7 kb = 1,800 kg/mol$ approximately. Therefore, my stock concentration is $ 0.197 \frac{g}{L} * \frac{mol}{1,800,000 g} = 1.094E-7 mol/L = 0.11 uM = 110 nM$.
To get an arbitrarily chosen 1 nM stock, I did the following serial dilution:
graph LR;
  A[0.11 uM stock solution ] -->|4.5 uL stock into 45.5 uL water| B[dilution: 0.01 uM]
Then I made the final solution according to the table. Again, the MS desired concentration was chosen arbitrarily.
Reagent
Stock concentration
Desired concentration
Volume
Loading dye
6X
1X
10 µL
MS
10 nM
1 nM
6 µL
dH2O
n/a
n/a
44 µL
I added 20 ul of the final solution to an agarose gel (1% w/v). I made the agarose gel by measuring out 0.5 g of agarose, and adding it to 50 ml of 1x TAE buffer, then microwaving until melted. I poured it into a gel mold with a well comb and let set fully before putting into the electrophoresis set-up to practice loading into a well.
i don’t have lambda DNA, but i do have Escherichia coli BL21 genomic DNA and a small collection of various plasmids and PCR products of varying rates.
we also have a handful of restriction enzymes but not a lot, and mostly not common ones.
i think my strategy is going to be:
sketch out a design
run a restriction digest on the E. coli genomic DNA to get a bunch of different-sized fragments. doesn’t particularly matter which one i think.
run the digest on a gel, and purify out the fragments of the size i want with a Qiagen or NEB kit; note: i am going to have to elute with pretty small volumes to keep them concentrated enough to show up in subsequent gels.
run a new gel with the purified fragments based on the design (possibly augmenting with PCR products if desired for brightness/intensity).
take photo to show off
for whatever reason, neither uploading Genbank files and downloading accession files for the E. coli genomic assembly in Benchling is working for me. i suspect it probably has to do with the size of the files and speed (or lack thereof) of my internet. so i can’t do much in-silico planning and testing. but i think my plan will work without it. it just means i’ll have to do more testing during instead of thinking/planning prior.
Lab Prep:
Sketch out a design. I found a photo of the Portland skyline with Mt. Hood in the background from the City of Portland’s Instagram. Photo credit: @james.is.jumbled. I traced the lines of primary visual components to get a line art style drawing, and then split it into a grid of 16 columns, for the 16 wells for the largest gel comb I have available. I recreated the gridded line art, scaled to a printout of the 1kb+ gel ladder, to approximate the size DNA fragments I would need in each column.
Restriction digest E. coli gDNA.
10 ul E. coli BL21 gDNA (125 ng/ul)
5 ul rCutSmart buffer
1 ul MspI (2018)
1 ul SpeI-HF (2015)
1 ul XbaI (2015)
2 ul NdeI (2009)
34 ul ultra-pure water
Combined the above components in a microtube (50 ul total reaction volume) and vortexed to mix. Incubated at 37C for an hour. Note that all enzymes are from NEB and are all past their expiration dates, but have been stored in a -20C freezer the whole time.
Gel purification of DNA fragments. I re-used an old gel for this first run. I combined 3ul of ladder with 2ul SYBR Green I dilution (diluted 1:50) and around 0.5ul loading dye on a scrap of parafilm, and loaded this mixture into well 5. I added 6ul of SYBR Green I dilution into the restriction digest along with 10ul of loading dye. I loaded around 33ul each into 2 lanes. I ran this electrophoresis for 40 minutes at 180mV.
Lanes:
1kb+ ladder (NEB)
Multi-enzyme digested E. coli gDNA
Multi-enzyme digested E. coli gDNA
PCR product
PCR product
PCR product
It was just smears, which I suppose isn’t too surprising, considering that I started with gDNA and all my enzymes were expired. From this gel, I cut out smears from the multi-enzyme digests at the following ranges: 1-0.1kb, 0.7-0.1kb. Using a Qiagen Qiaquick gel purification kit, I purified these semars individually. All purifications were eluted with 30 ul of elution buffer. I added these to tubes of PCR products for my gel art palette.
To another gel, I loaded the following into the wells, mixing each with 1ul of loading dye on parafilm prior to loading:
ladder
10ul A
2ul A
1ul A
linearized plasmid
15ul B
2ul B
1ul B
5ul A
These are not super clear, but I cut out additional smears from lanes 1, 6, and 9 at the following ranges: 0.5-0.1kb, 0.2-0.1kb. Eluted these with 25ul of elution buffer. Added these to my palette above: tubes .
This left me with the following palette (all sizes and size ranges are approximate):
A. PCR product: 6kb
B. PCR product: 5kb
C. PCR product: 4kb
D. PCR product: 3kb
E. PCR product: 1kb
F. PCR product: 700bp
G. PCR product: 650bp
H. PCR product: 500bp
J. PCR product: 200bp
K. PCR product: 100bp
L. smear from 100bp-1kb
M. smear from 100bp-700bp
N. smear from 100bp-500bp
O. smear from 100bp-200bp
Note that J and K are low concentration, and the smears didn’t show up well on the test plate, so I’m going to use larger volumes of those than I am for the rest.
I re-drew my gridded lineart with the PCR products that I know I have.
Gel Art lab
I cast a new electrophoresis gel by dissolving 1.3g agarose in 130ml 1x TAE, and pouring into a larger gel mold. This fit a comb with 16 wells. I allowed this to set before transferring into an electrophoresis set-up filled with 1x TAE. I loaded the following combinations into the wells, mixing each on parafilm with both 2ul of SYBR GreenI (50x dil) and appropriate volumes of loading dye, prior to loading. PCR products were 2ul each, except J and K which were 4ul each. Smears (L, M, N, O) were all in the range of 4-10ul per well.
ladder
empty well
E, L, I
J, O
H, N
D, I, O
C, F, M, H, I
B, F, M
A, J, O
B, I, O
C, J, O
D, F, M
J, O
G, N, I
H, N, J
empty well
Ran gel at 200V for around a half hour.
Not all the bands are the same brightness, which I can probably attribute to the variable DNA concentration of my various PCR products. It also looks like I must’ve mixed up the 4kb and 5kb tubes. None of the smears showed up at all, which was a little disappointing. Overall though, the art turned out pretty well, I think, even if it was more trial and error than in-silico design and then execution.
Week 3 Lab: Opentrons Art
For my design, I decided to do a heart with my partner’s and my initials inside it (‘J+J’). The colors were chosen for personal significance.
I started by copying the heart-pattern from example in the Colab by Selin Sahin, only changing the color to green.
Then I wrote out the letters, working off the HTGAA example by Eyal Perry. I had to do some trial and error, frequently running my simulation until it looked how I wanted.
Final code block:
from opentrons import types

metadata = {    # see https://docs.opentrons.com/v2/tutorial.html#tutorial-metadata
    'author': 'JKS',
    'protocolName': 'heartJ',
    'description': 'writes the J+J inside a heart shape',
    'source': 'HTGAA 2026 Opentrons Lab',
    'apiLevel': '2.20'
}

##############################################################################
###   Robot deck setup constants - don't change these
##############################################################################

TIP_RACK_DECK_SLOT = 9
COLORS_DECK_SLOT = 6
AGAR_DECK_SLOT = 5
PIPETTE_STARTING_TIP_WELL = 'A1'

well_colors = {
    'A1' : 'Red',
    'B1' : 'Yellow',
    'C1' : 'Green',
    'D1' : 'Cyan',
    'E1' : 'Blue'       # if in a 24-well plate, this needs to be moved to e.g. D2
}

def run(protocol):
  ##############################################################################
  ###   Load labware, modules and pipettes
  ##############################################################################

  # Tips
  tips_20ul = protocol.load_labware('opentrons_96_tiprack_20ul', TIP_RACK_DECK_SLOT, 'Opentrons 20uL Tips')

  # Pipettes
  pipette_20ul = protocol.load_instrument("p20_single_gen2", "right", [tips_20ul])

  # Modules
  temperature_module = protocol.load_module('temperature module gen2', COLORS_DECK_SLOT)

  # Temperature Module Plate
  temperature_plate = temperature_module.load_labware('opentrons_96_aluminumblock_generic_pcr_strip_200ul',
                                                      'Cold Plate')
  # Choose where to take the colors from
  color_plate = temperature_plate

  # Agar Plate
  agar_plate = protocol.load_labware('htgaa_agar_plate', AGAR_DECK_SLOT, 'Agar Plate')  ## TA MUST CALIBRATE EACH PLATE!
  # Get the top-center of the plate, make sure the plate was calibrated before running this
  center_location = agar_plate['A1'].top()

  pipette_20ul.starting_tip = tips_20ul.well(PIPETTE_STARTING_TIP_WELL)

  ##############################################################################
  ###   Patterning
  ##############################################################################

  ###
  ### Helper functions for this lab
  ###

  # pass this e.g. 'Red' and get back a Location which can be passed to aspirate()
  def location_of_color(color_string):
    for well,color in well_colors.items():
      if color.lower() == color_string.lower():
        return color_plate[well]
    raise ValueError(f"No well found with color {color_string}")

  # For this lab, instead of calling pipette.dispense(1, loc) use this: dispense_and_detach(pipette, 1, loc)
  def dispense_and_detach(pipette, volume, location):
      """
      Move laterally 5mm above the plate (to avoid smearing a drop); then drop down to the plate,
      dispense, move back up 5mm to detach drop, and stay high to be ready for next lateral move.
      5mm because a 4uL drop is 2mm diameter; and a 2deg tilt in the agar pour is >3mm difference across a plate.
      """
      assert(isinstance(volume, (int, float)))
      above_location = location.move(types.Point(z=location.point.z + 5))  # 5mm above
      pipette.move_to(above_location)       # Go to 5mm above the dispensing location
      pipette.dispense(volume, location)    # Go straight downwards and dispense
      pipette.move_to(above_location)       # Go straight up to detach drop and stay high

  ###
  ### YOUR CODE HERE to create your design
  ###

  ### heart pattern taken from Selin Sahin (2023)
  def heart_pattern(n, r, color_string, center_location):
    # generate list of points forming the heart
    scaling_factor = -2/r  # calculate scaling factor to fit pattern within 40mm radius circle
    angle_step = 2*math.pi/n
    coords = []
    for i in range(n):
        angle = i * angle_step
        x = scaling_factor*r*(16*math.sin(angle)**3)
        y = scaling_factor*(-r*(13*math.cos(angle) - 5*math.cos(2*angle) - 2*math.cos(3*angle) - math.cos(4*angle)))
        coords.append((x, y))


####PICK UP TIP HERE####
    pipette_20ul.pick_up_tip()

    print_every = 1     # 1=print every point; 2=print every other point; 3=print every third...

    # now plot the points
    for i, (x,y) in enumerate(coords):
        #print(i,(x,y))
        if i % (100*print_every) == 0:  # 20uL/0.2uL = 100
            # every 20th point we're printing starting with the first, aspirate 20uL total from Well 1
            pipette_20ul.aspirate(min(20, math.ceil((len(coords)-i)/print_every)), location_of_color(color_string))
        # print every other point we've calculated (was too dense otherwise)
        if i % print_every == 0:
            adjusted_location = center_location.move(types.Point(x, y))
            dispense_and_detach(pipette_20ul, 0.2, adjusted_location)

    ####DROP TIP####
    pipette_20ul.drop_tip()

  ##################################
  #### DRAW PATTERN ####
  ##################################

  heart_pattern(200, 50, 'Green', center_location)

  ###### write
  # letter J1
  pipette_20ul.pick_up_tip()

  pipette_20ul.aspirate(8, location_of_color('Yellow'))

  cursor = center_location.move(types.Point(x=-20, y = 12))

  for i in range(8):
    dispense_and_detach(pipette_20ul, 1, cursor.move(types.Point(y=-2)))
    cursor = cursor.move(types.Point(x =2))

  cursor = cursor.move(types.Point(x=-10, y=-4))

  pipette_20ul.aspirate(8, location_of_color('Yellow'))
  for i in range(8):
    dispense_and_detach(pipette_20ul, 1, cursor.move(types.Point(x=2)))
    cursor = cursor.move(types.Point(y =-2))

  pipette_20ul.aspirate(3, location_of_color('Yellow'))
  for i in range(2):
    dispense_and_detach(pipette_20ul, 1, cursor.move(types.Point(x=-1)))
    cursor = cursor.move(types.Point(x =-2))

  cursor = cursor.move(types.Point(x=-1, y=2))
  dispense_and_detach(pipette_20ul, 1, cursor)

  pipette_20ul.drop_tip()

### +sign
  pipette_20ul.pick_up_tip()

  cursor = center_location.move(types.Point(x=-4))

  pipette_20ul.aspirate(5, location_of_color('Green'))
  for i in range(3):
    dispense_and_detach(pipette_20ul, 1, cursor.move(types.Point(x=2)))
    cursor = cursor.move(types.Point(x=2))

  cursor = cursor.move(types.Point(x=-2, y=2))
  dispense_and_detach(pipette_20ul, 1, cursor)

  cursor = cursor.move(types.Point(y=-4))
  dispense_and_detach(pipette_20ul, 1, cursor)

  pipette_20ul.drop_tip()

  # letter J2
  pipette_20ul.pick_up_tip()

  pipette_20ul.aspirate(8, location_of_color('Blue'))

  cursor = center_location.move(types.Point(x=10, y = 12))

  for i in range(8):
    dispense_and_detach(pipette_20ul, 1, cursor.move(types.Point(y=-2)))
    cursor = cursor.move(types.Point(x =2))

  cursor = cursor.move(types.Point(x=-10, y=-4))

  pipette_20ul.aspirate(8, location_of_color('Blue'))
  for i in range(8):
    dispense_and_detach(pipette_20ul, 1, cursor.move(types.Point(x=2)))
    cursor = cursor.move(types.Point(y =-2))

  pipette_20ul.aspirate(3, location_of_color('Blue'))
  for i in range(2):
    dispense_and_detach(pipette_20ul, 1, cursor.move(types.Point(x=-1)))
    cursor = cursor.move(types.Point(x =-2))

  cursor = cursor.move(types.Point(x=-1, y=2))
  dispense_and_detach(pipette_20ul, 1, cursor)

  pipette_20ul.drop_tip()
  # Don't forget to end with a drop_tip()
Simulation image:
Unfortunately, the Victoria node was not able to run the Opentrons lab remotely as planned, as of 05/27/2026. Hopefully we can run it sometime this summer and I can upload a photo of a real plate.
Unfortunately this lab is not available for remote participation.
Week 7 Lab: Neuromorphic Circuits
We started off our node’s discussion of the neuromorphic circuits based off of a couple example circuits developed by TA Steven with help from ClaudeAI. Because I feel like I don’t really understand the analog vs binary computing, I was most interested in the design that explored that aspect.
Option C: Competing Inhibitors
Concept: One dominant ERN (CasE, high dose) controls the whole network. It kills both Csy4 and the green output directly.
CasE (strong) ──kills──▶ Csy4 (weak, dies) ──kills──▶ mNeonGreen (green, OFF)
Csy4 (dead) ──can’t kill──▶ PgU (survives, but has nothing to do)
Group
Plasmid
Amount
Role
X1
CasE
200 ng
Dominant enzyme
X1
eBFP2
50 ng
Blue control light
X2
Csy4_rec_CasE
100 ng
Csy4, killed by CasE
X2
mMaroon1
50 ng
Maroon control light
X3
PgU_rec_Csy4
100 ng
PgU, freed because Csy4 is dead
Bias
CasE_rec_mNeonGreen
150 ng
Green, killed by CasE
Expected result: Blue ON, Maroon ON, Green OFF
Why it’s interesting: Shows that dosage (ng amounts) determines who wins. You could run a second experiment with CasE reduced to 50 ng to see if the outcome changes — demonstrating the analog nature of the circuit.
Worth noting that there was significant confusion over the way that Claude worded the “Roles” of the Enzyme_rec_output constructs. The correct interpretation is as follows: CasE_rec_mNeonGreen means that the plasmid encodes for mNeonGreen with a recognition site for CasE (therefore, it is amount of mNeonGreen minus amount of CasE to determine if fluorescent green is present).
I was interested in the analog/dosing aspect of this circuit, but I thought it might be more interesting to include a different color, so we would see either Green or a different fluorescence, depending on which enzyme there was more of.
My first attempt looked like this:
Circuit Name
Transfection Group
Contents
Concentration (ng/ul)
DNA wanted (ng)
JKScircuit-1
X1
PgU
50
200
JKScircuit-1
X1
eBFP2
50
100
JKScircuit-1
X2
PgU_rec_Csy4
50
50
JKScircuit-1
X2
mMaroon1
50
100
JKScircuit-1
Bias
PgU_rec_mNeonGreen
50
100
JKScircuit-1
Bias
CasE_rec_Csy4_rec_mKO2
50
100
I figured that if there was more PgU than Csy4, then it would output orange. But if there was more Csy4 than PgU then it would output green. This is because PgU subtracts from mNeonGreen output, Csy4 subtracts from mKO2 output, and PgU subtracts from Csy4 output. So if there is high PgU, then mNeonGreen is not expressed; there is not enough Csy4 to compete with the PgU, and since there is not Csy4, there is nothing to inhibit the mKO2 output. If there is high Csy4, then there is not enough PgU to inhibit mNeonGreen (because it is mostly used up in competing with Csy4), and the remaining Csy4 inhibits mKO2. I figured that since I don’t have any CasE expressed in my system, it doesn’t matter that CasE could also inhibit mKO2. eBBFP2 and mMaroon1 are controls to check for transfection efficiency. I had the unbalanced DNA amounts because that tests the analog computing that I was interested in.
Unfortunately, this first attempt gave an error when I tried to put it into the Neuromorphic Wizard tool. Looking through our forum discussion post, I was able to somewhat troubleshoot off of this explanation TA Steven got from ClaudeAI when he was trying to troubleshoot Jessica Wu’s circuit:
Why it failed:
The Predict API only accepts X1 + X2 groups (no OR, NOT, Bias etc.)
Each group must have exactly: marker + ERN + ERN_rec_output
Based off this, I changed the Transfection Group for the last two lines from Bias to X1 or X2; because even though that’s what was in the example given in the lab, this suggested that the Neuromorphic Wizard API could only accept X1 and X2. So my second attempt looked like this:
Circuit Name
Transfection Group
Contents
Concentration (ng/ul)
DNA wanted (ng)
JKScircuit-2
X1
PgU
50
200
JKScircuit-2
X1
eBFP2
50
100
JKScircuit-2
X2
PgU_rec_Csy4
50
50
JKScircuit-2
X2
mMaroon1
50
100
JKScircuit-2
X2
PgU_rec_mNeonGreen
50
100
JKScircuit-2
X1
CasE_rec_Csy4_rec_mKO2
50
100
Unfortunately, this still gave an error. I suspect that the PgU_rec_Csy4 and PgU_rec_mNeonGreen being in the same transfection group is outside the bounds of what the API could accept, but biologically, I don’t think this would be a problem. Essentially, I am using PgU_rec_Csy4 as an ERN instead of as a ERN_rec_output. The proper solution is probably to instead put PgU_rec_mNeonGreen into an X3 group instead of in X2 with the PgU_rec_Csy4, but we didn’t have enough colors to use as transfection controls since I wanted to use two colors as outputs.
TA Steven put my circuit into ClaudeAI to troubleshoot as well, and gave me this feedback:
Fixed. Here’s what changed:
Original
Fixed
Why
X2: PgU_rec_Csy4 (output, no ERN)
X2: Csy4 (ERN)
X2 needs a standalone ERN
X2: mMaroon1
X2: mKO2
API only recognizes eBFP2/mKO2 as markers
X1: CasE_rec_Csy4_rec_mKO2
X1: Csy4_rec_mNeonGreen
No CasE source existed; output should be mNeonGreen
This is an asymmetric cross-inhibition — PgU is dosed 4x heavier than Csy4, so X1 should dominate the competition. The heatmap should show stronger suppression along the X1 axis.
Total DNA: 600ng (under limit).
This is frustrating because I’m pretty sure this is a limitation of the Neuromorphic Wizard API, and my circuit is biologically sound. The first one is what I suggested originally, that I am using PgU_rec_Csy4 as an ERN instead of as a ERN_rec_output. I’m not sure why X2 needs a standalone ERN. The second one is just that it doesn’t accept mMaroon1 as a marker, which is odd because it’s listed on the Parts list as an option. The third one is what I explained earlier; that since I don’t have any CasE expressed in my system, it doesn’t matter that CasE could also inhibit mKO2.
While I would have liked to see experimentally what would happen with my design, since I do think it’s valid biologically, we wanted to submit validated circuits only, since each node could only submit two circuits. So TA Steven submitted my circuit that was fixed by Claude because it was able to give a valid output on the Predict tab of the Neuromorphic Wizard.
Results:
I’m honestly not sure if this shows what I’d expect. I’m unclear on what these heatmaps are actually showing. Like I know that each dot is a cell that was transfected with the same things, but I’m not sure what exactly that means in regards to my circuit. I think I probably need to rewatch the lecture for clarity.
Week 9 Lab: Cell-Free Systems
Unfortunately, this lab is not available for remote participation.
Week 10 Lab: Mass Spectrometetry
Unfortunately, this lab was not available for remote participation. See this week’s homework for data analysis.
Which genes when transferred into E. coli will induce the production of lycopene and beta-carotene, respectively? Lycopene is produced from farnesyl diphosphate with the enzymes encoded by crtE, crtB, and crtL. Then to make beta-carotene, they need the additional enzyme encoded by crtY.
Why do the plasmids that are transferred into the E. coli need to contain an antibiotic resistance gene? The plasmids need an antibiotic resistance gene to ensure that the plasmid is retained. The plasmid is an extra metabolic cost for the cells to maintain, and culturing in antibiotics (that the plasmid has a resistance gene for) provides the pressure to keep and express the plasmid.
What outcomes might we expect to see when we vary the media, presence of fructose, and temperature conditions of the overnight cultures? With different culturing conditions, the cells might grow slower or faster, or produce more or less of the goal compounds.
Generally describe what “OD600” measures and how it can be interpreted in this experiment. OD600 is the measurement of optical density at 600 nm, which is generally used as a proxy for cell density because cells block light passing through the spectrophotometer. In this experiment, it can be interpreted into how well the cells grow.
What are other experimental setups where we may be able to use acetone to separate cellular matter from a compound we intend to measure? i’m not sure what this question is asking. like what other bioproduceable compounds are acetone-soluble?
Why might we want to engineer E. coli to produce lycopene and beta-carotene pigments when Erwinia herbicola naturally produces them? E. coli grows faster and is better studied, which means we have more genetic tools available to manipulate E. coli compared to E. herbicola and we know more about the metabolism so we might make more informed choices for metabolic engineering.
Post-lab questions (Committed Listeners)
Let’s get in touch with our metabolic pathway.
What are the enzymes of the carotene pathway? CrtE (geranylgeranyl diphosphate synthase), CrtB (phytoene synthase), CrtL (lycopene beta-cyclase), CrtY (lycopene cyclase), and CrtZ (beta-carotene hydroxylase).
Within this pathway, which is the rate determining step (the step that takes the longest)? Which enzyme is responsible for this step?
Notes for design of a DNA construct for bioproduction
The first thing to do is to decide what organism you are going to use for this (E. coli or S. cerevisiae) for production. Which would you choose and why (emphases on production differences)? I would choose E. coli for production because it has a faster growth rate and there are known bacterial genes for this biosynthesis pathway. I’d really only ever choose S. cerevisiae if my product required eukaryotic biosynthetic enzymes.
Now choose one of the enzymes and lets outline the parts of the construct for expression. I’ll go with CrtB.
What is the function of a promoter? The promoter is the RNA-polymerase recognition site that indicates the polymerase that this is the start of a gene and to begin transcription here.
What types of promoters do we have? There are constitutive, inducible, or repressible promoters of varying strengths. For E. coli, we would use bacterial or bacteriophage promoters (if the host strain contains phage polymerase).
If we wanted to turn off the transcription of a gene in response to a metabolite, what type of promoter would be most useful? What if we wanted this to increase in the presence of the metabolite? To turn off transcription in response to a metabolite, a repressible promoter would be more useful. To increase transcription in response to a metabolite, an inducible promoter would be more useful.
Now choose one of the genes of the metabolic pathway previously described (Carotene/lycopene )and choose one enzyme to make an expression construct. What promoter could you use for this? Why did you choose it? I would use a T7 promoter because it is a strong constitutive promoter, but it would have to be in an E. coli strain that includes T7 polymerase, such as BL21(DE).
What is the origin of replication? The origin of replication is the recognition point for DNA polymerase, for additional copies of the plasmid to be made - both for multiple copies within a single cell and for daughter cells in cell division.
What types of origin of replication do we have? Ori’s are relaxed if they are positively regulated by RNA or stringent if they are positively regulated by proteins. An ori is high-copy, medium-copy, or low-copy depending on the balance between positive and negative regulation. For plasmids that are produced in E. coli for transfection into another organism, the plasmid would need to have both an E. coliori and an ori for that other organism.
(Extra) What are compatibility groups? Compatibility groups refers to classifications of ori’s that are derived from the same sequence, and thus use the same cellular machinery for replication. For the most predictable and reproducible copy-numbers, plasmids with ori’s in the same compatibility group shouldn’t be used together in the same strain.
Now for the previously chosen promoter and gene what will be the best origin or replication? pMB1 ori is the ori in pUC plasmids, which is high-copy number, and therefore good for overexpression of an enzyme for increased biosynthesis.
(Mandatory for Global listeners, Optional MIT/Harvard) Elaborate further on other bioparts like RBS, terminators, operators you would use for a correct design and further bioproduction? For overexpression, I would use an RBS close to the consensus sequence, and probably a double terminator to prevent any leaky readthrough. Finally, I might add an operator like lacO (or fully replace my T7 promoter with an inducible promoter) to add inducible control over gene expression in case the high expression ended up producing a toxic amount of protein.
(Hot! Extra points) What are aptamers and riboswitches and how can they be used for metabolic tuning or engineering in prokaryotes? Aptamers and riboswitches are nucleic acid sequences that can bind to themselves and/or specific molecules, which allows for adding inducible control to promoters that are not typically inducible.
(Extra points) Now what approach can be used to join all these parts together? Make a quick analysis of their sequence in search of possibilities (search for restriction sites, etc) I’d probably use Gibson assembly to join all these parts so I don’t need to worry about designing restriction sites, just designing primers. However, Golden Gate assembly might work better if I want to be sub out different parts later.
(Extra Hot!!! Extra Points) Try to elaborate further on a biosynthetic pathway you would want to engineer in E. coli for production of a metabolite or product. What use could this bio-product have? Imagine dream applications!!!
(Extra points) For S. cerevisiae create an integration cassette for homologous recombination.
First let’s check some concepts of yeast engineering and homologous recombination this in this notes
As well as for prokaryotes, eukaryotic DNA designs need bioparts used for construction of a function design and further expresion. Now search for a biosynthetic pathway if interested and describe one of the genes of the pathway.
Now, remember that for making a functional construct there are a variety of biological parts needed for this, like ribosome binding sites or Kozak sequences, terminators, and promoters. List the ones you could use for DNA design.
In yeast engineering we use DNA construction designs for making genome integration. What chromosome site could you use for integration of these and why?
(Hot! Extra points) Following the next chart of how a DNA integration cassette should be designed and with the previously chosen parts elaborate the DNA sequence you could use to synthesize with Twist.
Enzyme engineering for (cyanobacterial) bioplastic production Imagine if plastic was an environmental solution, rather than an environmental problem. Carbon capture, utilization, and storage (CCUS) is an umbrella term for any sort of technology that pulls carbon out of the atmosphere and repurposes it into a useful product and/or moves it to long-term storage as a climate change mitigation strategy. One example is bioplastics made with photosynthesis. Plastics are polymers made up of primarily carbon, and when produced by photosynthetic organisms (such as cyanobacteria), that carbon can come directly out of the atmosphere. ![CCUS figure]
Group: Jessee Svoboda, Paula Carrodeguas, Iman Karibzhanova, Peter Hanna
From homework 4: Group Brainstorm on Bacteriophage Engineering What do we know:
E. coli DnaJ binds to denatured proteins to prevent/disassemble aggregates (native function in heat-shock). DnaJ binds to the hydrophilic tail of MS2-L protein. point mutation of highly conserved proline in DnaJ results in no lysis (so maybe no more binding of MS2-L tail?) removal of MS2-L tail recovers lysis function (meaning DnaJ is only necessary when tail exists) suggests hydrophilic tail aggregates in some way that prevents lysis except in presence of DnaJ to stop aggregation so stability should be improved if we can figure out how the tail is interacting with the tail of other MS2-L molecules, and then mutating that away so there is no aggregation and dependence on DnaJ graph TB; A[sequence and structure of MS2-L] –>|if geometry and chemical interactions are known| B[view interactions between MS2-L copies] A –>|if geometry and interactions are not known| C[model interactions with AlphaFold or something that can do protein interactions] B –>|visual analysis and mutation modeling| D[Identify important residues in MS2-L tail interactions] C –>|visual analysis and mutation modeling| D[Identify important residues in MS2-L tail interactions] D –>|use knowledge of hydrophobicity/charge/etc. OR use ESM2 mutational scan and select ones that it finds unlikely| E[Select dissimilar AAs to substitute in interacting residues] E –>|AlphaFold or similar| F[model protein folding in new AA sequence with selected mutations] F –>|something that can model protein interactions| G[model interactions between mutant MS2-L copies] G –>|select mutations that have similar hydrophilicity as original tail but less interaction with each other and maybe also with DnaJ| H[test mutations in lab] Potential problems:
Subsections of Projects
Individual Final Project
Enzyme engineering for (cyanobacterial) bioplastic production
Imagine if plastic was an environmental solution, rather than an environmental problem.
Carbon capture, utilization, and storage (CCUS) is an umbrella term for any sort of technology that pulls carbon out of the atmosphere and repurposes it into a useful product and/or moves it to long-term storage as a climate change mitigation strategy. One example is bioplastics made with photosynthesis. Plastics are polymers made up of primarily carbon, and when produced by photosynthetic organisms (such as cyanobacteria), that carbon can come directly out of the atmosphere.
![CCUS figure]
Some strains of cyanobacteria produce biopolymers called polyhydroxyalkanoates (PHAs) that can be used as drop-in replacements for conventional petroleum-derived plastics. The most common PHA is poly-3-hydroxybutyrate or PHB.
![PHA granules in cyano]
![PHB]
For my project, I wanted to use AI reasoning combined with traditional machine learning to engineer a more productive PHB synthase enzyme for cost-competitive plastic biomanufacturing.
Background
2024 was the hottest year on record, with the average global temperature over the 1.5C increase limit that environmentalists have been advocating for the last several decades (United Nations, 1.5C). Although many countries are pledging to decrease their greenhouse gas outputs, carbon will continue to be added to the atmosphere for the foreseeable future, even if at decreasing rates. Mitigation strategies, such as CCUS, will be an essential component to minimize, or even reverse course, on climate change.
In theory, cyanobacteria are a financially useful production chassis because they take advantage of ambient or waste feedstocks, such as sunlight, atmospheric carbon dioxide, non-potable water such as seawater or greywater (Schubert et al, 2024; Wlodarczyk et al, 2020). Unfortunately, the relatively low production and energy-intensive processing have prevented commercially-viable production from being realized. The visionary aim of my project is to develop a commercial-scale bioprocessing operation for a bioplastic PHB-production cyanobacteria strain, with the ultimate goal to provide a drop-in raw plastic for use in consumer goods and packaging.
Because some strains of cyanobacteria are natural PHA producers, they are a good potential production chassis for bioplastic. The ideal strain would grow well off atmospheric carbon, have high PHA production, and have other phenotypic traits that are beneficial for cheaper or easier bioproduction, such as salinity or pH tolerance for contamination prevention, nitrogen fixation for cheaper growth media, and fast settling for lower energy collection and dewatering. One possible good host strain is Cyanobacterium aponium sp. UTEX 3222 because it has planktonic growth, salinity tolerance, rapid settling, fast growth rate, and native PHA production (Schubert et al, 2024).
PHB synthase enzyme, PhaC
PHAs are produced through a biosynthetic pathway as an offshoot from sugar metabolism, believed to be for long-term energy storage. The key enzyme is the PHB synthase enzyme, PhaC (also called PHA synthase, PHB polymerase, etc.). There are four classes of PhaC enzyme, which preferentially utilize different monomers. The best studied PhaC is from Cupriavidus necator H16 (Neoh et al, 2022). PhaC has two domains: the catalytic C-domain that includes the catalytic triad His-Asp-Cys, and the N-domain. The N-domain has been demonstrated to be essential for enzymatic activity, although its exact role is still unknown - though it has been suggested to potentially play a role in substrate selectivity (Neo et al, 2022).
There has been a lot of research into increasing the substrate promiscuity of PhaC because variety in monomer composition results in different thermochemical properties of the resulting plastic (Antonio et al, 2000; Harada et al, 2021; Kane, 2021; Sivashankari et al, 2023; Timm et al, 1990; Tsuge et al, 2004; Ye et al, 2008). However, I hypothesized that increasing substrate specificity towards the 3HB monomer that results in PHB would increase the amount of PHB produced. I hoped that this also might have the secondary effects of normalizing the molecular weights of the polymer molecules produced and decreasing downstream purification costs because there would be fewer minor products to separate out.
ML/AI in protein science
My initial thought was to use machine learning to design new protein mutants; however, my early literature searches made me seriously consider the practical constraints I was operating under: namely, time (before the final project was due) and processing capability (of my personal laptop and home internet). Therefore, I expanded my original intention to include free-for-public-use large language model (LLM) agents, such as ChatGPT and Claude.ai.
Hypothesis
I hypothesized that PhaC mutants engineered for increased substrate specificity by AI and ML would have higher PHB productivity.
Project aims
Aim 1: Experimental
Generate PHB synthase mutants using LLM reasoning and traditional machine learning (ML).
Literature search
Train a free-use LLM for PHB synthase mutations.
Write prompts to minimize hallucinations by requesting suggestions be based on the data provided, describe what each suggestion is based on (including literature references to verify), and specifically identifying more speculative suggestions.
Aim 1.5
Multi-sequence alignment (MSA) of diverse bacterial PhaC of various classes.
Use Python scikit-learn library to train ML classifier for PHB synthase substrate preference based on the MSA.
Feed ML output back into LLM to generate additional mutations and hypothesized mechanisms.
Aim 2: Developmental
Test the highest-scored mutants for PHB production.
Design cell-free expression vector.
Make a library of phaC mutant sequences.
Test variants for PHB production.
DBTL cycle(s) with LLM, ML, and in vitro testing; iterate as resources allow.
Aim 2.5
Test best-performing mutants in cyanobacterial chassis.
Literature search to identify 1-3 cyanobacterial strains to use as production chassis.
Re-design expression cassette and selected phaC mutants for cyanobacterial expression.
Test for PHB production in cyanobacterial strains.
Aim 3: Visionary
Develop a scalable bioprocessing operation that can ultimately be used for commercial plastics production.
Develop a basis for each operation step at the bench scale.
Design scale-up for a pilot plant.
Methods
Enzyme selection
I’d originally planned to use the PhaC from my intended host strain C. aponium UTEX 3222, but I was unable to find a sequence for it. I searched for the UTEX 3222 PhaC sequence in the supplemental files of the paper that said it identified PHA biosynthetic genes, but it wasn’t included (Schubert et al, 2024). It also wasn’t listed on the full annotated genome assembly (ASM3863077v1) published to the NCBI. I BLASTed the C. necator PhaC against the UTEX 3222 genome assembly, as well as a few different PhaC’s from other cyanobacterial species, but none of these produced any results.
Therefore, I decided to move forward using C. necator PhaC, hereafter called PhaC_Cn.
PhaC_Cn mutagenesis data compilation
I’d originally planned to do a large MSA with diverse bacterial PhaC from all four classes. I did the following search on UniProt: (taxonomy_id:2) AND (protein_name:“Poly(3-hydroxyalkanoate) polymerase subunit PhaC”). This yielded 1,445 results. Using the internal UniProt tool, I tried to do an MSA (max 50 sequences), but this crashed my browser. I then tried to download a subset of these sequences for an MSA through Benchling or with Python code written with the help of Claude and a Python for Dummies book, but downloading hundreds of sequences froze my computer, and I gave up on the possibility of doing this on my personal laptop and home internet network. Below is the Identity Matrix of a 7 sequence MSA from UniProt that I was able to visualize, but 7 sequences is not enough to generate features or suggestions from, especially when they are so different.
So I decided to use PhaC_Cn mutagenesis data instead. I used Google Search to find peer-reviewed articles on machine learning and LLMs for protein design and PhaC_Cn, selecting the most relevant ones for further reading based ont the abstracts. From the papers I read, I additionally checked out their references for additional papers that could be helpful. Because I could only find limited mutagenesis data, I also included two other bacterial PhaC because they were listed in papers comparing the structures and sequences: PhaC from Aeromonas caviae (Harada et al, 2021) and PhaC from Chromobacterium sp. USM2 (Chuah et al, 2013). I imported these two PhaC amino acid sequences into Benchling, and aligned them with PhaC_Cn.
I started my conversation with Claude.ai by asking it about enzyme engineering with LLMs generally, to see what it knew.
i’m interested in enzyme engineering using LLMs. what can you tell me about that?
This produced a list of protein language models and tools (ESM-2, AlphaFold, ProteinMPNN, RFdiffusion, Progen2, and EVOLVEpro); practical workflows; active research topics; and limitations.
From there, I decided to ask what it thought of my hypothesis, hoping that would lead to a discussion of what the LLM needed to achieve this goal.
i’m specifically interested in mutations for substrate specificity in bacterial PhaC (polyhydroxyalkanoate synthase) enzymes. i have this idea that with the aligned protein sequences and some information on substrate preference for each one, an LLM might be able to output suggested sequences for a given substrate. Does an LLM seem like the correct tool for this?
Claude suggested that traditional ML would be a better option, but that combining LLM reasoning with ML could be a worthwhile approach. It included a warning that the biggest limitation was likely data availability. It gave four discrete options and a hybrid approach.
Option 1: Fine-tuned pLM (e.g., ESM-2) with substrate labels
Option 2: Supervised ML on alignment features
Option 3: EVE-style or EVOLVEpro unsupervised variant scoring
Option 4: Use an LLM as a reasoning layer over structured data
A hybrid pipeline:
Curate your MSA + substrate labels carefully (scl/mcl/mixed, specific monomers if known)
Identify key specificity-determining residues using mutual information or DCA (direct coupling analysis) between alignment columns and substrate labels — this gives you a reduced feature space
Use ESM-2 embeddings as features for a supervised model predicting substrate class
Score candidate mutations zero-shot using ESM-2 log-likelihood to filter for “natural-looking” sequences
Use structural context (the PhaC crystal structures / AlphaFold models) to sanity-check that suggested mutations are geometrically plausible in the binding pocket
The hybrid pipeline was had some similarities to the Protein Design II (week 5) homework, which I thought was a good sign.
I decided to move forward with options 2 and 4 since those were the approaches I’d had in mind earlier.
i’m most interested in Option 2 and Option 4. Could you please give me a very specific step-by-step instructions for both?
This prompt was a goldmine. It resulted in actually quite a lot of useful Python code for the ML approach, as well as the description of a context document that could be used for continuity between LLM reasoning sessions. I figured that between the context document and carefully worded prompts, I could also use it to minimize the chance of undetected hallucinations. Claude also suggested a pipeline for combining the two, from which I ultimately built my approach (though I didn’t exactly copy it because I thought my order worked better).
Literature (Option 4) → curated mutation DB
↓
MSA + MI analysis (Option 2) → top specificity positions
↓
LLM reasoning (Option 4) → mechanistic hypotheses about those positions
↓
ML scoring (Option 2) → rank candidate mutants quantitatively
↓
LLM (Option 4) → design wet-lab validation experiment
↓
Experimental results → feed back into both pipelines
I asked Claude for what specifically it wanted out of the context document so I could build it appropriately.
Please give me more information about the context document you would need if i wanted to go with LLM reasoning
This resulted in a list of sections, and it also offered to generate a template for me to start from. I asked it to do this.
please create a template markdown file for my context document
original context document template from Claude
While this template did contain some information on PhaC, I did not leave anything in that I did not have a reference to verify it because I wasn’t confident that it wasn’t hallucinations - and indeed, it did have some information that I suspect was hallucinations (although it may have simply been from a source I hadn’t personally read). However, going through the document, it relied heavily on an MSA that I simply wasn’t able to do, so I requested that Claude update the document to reflect the mutagenesis dataset.
i’m going to start with a dataset only containing PhaC from C. necator and known mutagenesis studies, not diverse PhaC from many different bacteria. Please update the context document template to reflect this, and let me know any particular warnings or considerations for this approach.
I filled in this context document with information that I could find in my references, and the mutagenesis data I had compiled. When I reuploaded it to Claude, it identified a few typos and questioned one of my references. I made the edits, but clarified that my reference said what I had asserted and Claude should continue to use it within my document and reasoning sessions, despite external data that Claude may have thought it had that disagreed with it. This may have been a hallucination, but I think Claude was actually just generalizing from other PhaC mutagenesis papers (not from C. necator).
I started with the warning from my context document.
Before we start, please keep in mind: My dataset consists only of C. necator PhaC1 (wild-type) and published point mutants of this single enzyme. I do not have a multi-species alignment. All positional reasoning should be grounded in (a) the experimental mutation database in Section 4, and (b) structural analysis of PDB 5T6O / AlphaFold model P23608. Do not infer specificity determinants from phylogenetic patterns — that data is not available.
Now let’s do the first reasoning session.
Claude asked for more direction, so I specificied that I wanted mechanistic reasoning.
Let’s start with mechanistic hypothesis building please.
Claude’s output for my first reasoning session started with a summary of information that I had included in my context document. While not particularly useful to me, it did confirm for me that it was drawing primarily from my context document and not as much external sources.
I refined my request with my next prompts for explicit suggestions:
That looks good - can you suggest a few single mutations within the N-terminus that would get us some data on how variation there affects substrate specificity?
Yes, and let’s include potential combinations if possible - combinations can exclude the N-terminus positions at this point since we lack data there.
This resulted in a suggestion of a series of 11 variants for a first wet lab experimental run: the base wild-type as a control, 7 single mutations, and 3 double mutations. It was fairly conservative in its recommendations, but I suspect that’s due to the limited data.
Finally, I asked Claude to update my context document with the log of our first reasoning session.
Yes, please log both this table and a summary of our reasoning session in the session log section.
For starters, my next steps are to continue with the ML in Aim 1.5. I hope that by using the public wifi at a library or a college campus, I’ll be able to download the sequences for the MSA. Then I can hopefully let my computer run the MSA over a long period of time. The detailed steps for aims 1.5 and onward can be found in my final report below.
Additionally, the feedback from TAs and fellow students after my presentation was to compare outputs from multiple LLMs, using my same context document and prompts. So I’d like to do that as well.
Antonio, RV; Steinbuchel, A; Rehm, BHA. Analysis of in vivo substrate specificity of the PHA synthase from Ralstonia eutropha: formation of novel copolyesters in recombinant Escherichia coli. FEMS Microbiology Letters 2000, 182(1): 111-117. https://doi.org/10.1111/j.1574-6968.2000.tb08883.x
Chek, MF; Hiroe, A; Hakoshima, T; et al. PHA synthase (PhaC): interpreting the functions of bioplastic-producing enzyme from a structural perspective. Applied Microbiology and Biotechnology 2018, 103: 1131-1141. https://doi.org/10.1007/s00253-018-9538-8
Chuah, J-A; Tomizawa, S; Yamada, M; et al. Characterization of site-specific mutations in a short-chain-length/medium-chain-length polyhydroxyalkanoate synthase: In vivo and in vitro studies of enzymatic activity and substrate specificity. Applied and Environmental Microbiology 2013, 79. https://doi.org/10.1128/AEM.00564-13
Dong, H; Yang, X; Shi, J; et al. Exploring the feasibility of cell-free synthesis as a platform for polyhydroxyalkanoate (PHA) production: Opportunities and challenges. Polymers 2023, 15(10). https://doi.org/10.3390/polym15102333
Harada, K; Kobayashi, S; Oshima, K; et al. Engineering of Aeromonas caviae polyhydroxyalkanoate synthase through site-directed mutagenesis for enhanced polymerization of the 3-hydroxyhexanoate unit. Frontiers of Bioengineering and Biotechnology 2021, 9. https://doi.org/10.3389/fbioe.2021.627082
Jossek, R; Steinbuchel, A. In vitro synthesis of poly(3-hydroxybutyric acid) by using an enzymatic coenzyme A recycling system. FEMS Microbiology Letters 1998, 168: 319-324. https://doi.org/10.1111/j.1574-6968.1998.tb13290.x
Kane, A. Toward engineering the substrate specificity of a PHA synthase (PhaC). Victoria University of Wellington, Masters thesis, 2021. https://doi.org/10.26686/wgtn.17152079
Neoh, SZ; Check, MF; Tan, HT; et al. Polyhydroxyalkanoate synthase (PhaC): The key enzyme for biopolyester synthesis. Current Research in Biotechnology 2022, 4: 87-101. https://doi.org/10.1016/j.crbiot.2022.01.002
Satoh, Y; Tajima, K; Tannai, H; et al. Enzyme-catalyzed poly(3-hydroxybutyrate) synthesis from acetate with CoA recycling and NADPH regeneration in Vitro. Journal of Bioscience and Bioengineering 2002, 95(4): 335-341. https://doi.org/10.1016/S1389-1723(03)80064-6
Schubert, MG; Tang, T-C; Goodchild-Michelman, IM; et al. Cyanobacteria newly isolated from marine volcanic seeps display rapid sinking and robust, high-density growth. Applied Environmental Microbiology 2024, 90(11). https://doi.org/10.1128/aem.00841-24
Sivashankari, RM; Mierzati, M; Miyahara, Y; et al. Exploring Class I polyhydroxyalkanoate synthases with broad substrate specificity for polymerization of structurally diverse monomer units. Frontiers in Bioengineering and Biotechnology 2023, 11. https://doi.org/10.3389/fbioe.2023.1114946
Sudesh, K; Taguchi, K; Doi, Y. Effect of increased PHA synthase activity on polyhydroxyalkanoates biosynthesis in Synechocystis sp. PCC 6803. International Journal of Macromolecules 2002, 30: 97-104. https://doi.org/10.1016/S0141-8130(02)00010-7
Taguchi, S; Nakamura, H; Hiraishi, T; et al. In vitro evolution of a polyhydroxybutyrate synthase by intragenic suppression-type mutagenesis. Journal of Biochemistry 2002, 131(6): 801-806. https://doi.org/10.1093/oxfordjournals.jbchem.a003168
Timm, A; Byrom, D; Steinbuchel, A. Formation of blends of various poly(3-hydroxyalkanoic acids) by a recombinant strain of Pseudomonas oleovorans. Applied Microbiology and Biotechnology 1990, 33: 296-301. https://doi.org/10.1007/BF00164525
Tsuge, T; Saito, Y; Narike, M; et al. Mutation effects of a conserved alanine (Ala510) in Type I polyhydroxyalkanoate synthase from Ralstonia eutropha on polyester biosynthesis. Macromolecular Bioscience 2004, 4(10): 963-970. https://doi.org/10.1002/mabi.200400075
Valentini, G; Malchiodi, D; Gliozzo, J; et al. The promises of large language models for protein design and modeling. Frontiers in Bioinformatics 2023, 3: 1304099. https://doi.org/10.3389/fbinf.2023.1304099
Wittenborn, EC; Jost, M; Wei, Y; et al. Structure of the catalytic domain of the class I polyhydroxybutyrate synthase from Cupriavidus necator. Journal of Biological Chemistry 2016, 291(48): 25264-25277. https://doi.org/10.1074/jbc.M116.756833
Wlodarczyk, A; Selao, TT; Norling, B; et al. Newly discovered Synechococcus sp. PCC 11901 is a robust cyanobacterial strain for high biomass production. Nature Communications Biology 2020, 3: 215. https://doi.org/10.1038/s42003-020-0910-8
Ye, Z; Song, G; Chen, G; et al. Location of functional region at N-terminus of polyhydroxyalkanoate (PHA) synthase by N-terminal mutation and its effects on PHA synthesis. Biochemical Engineering Journal 2008, 41(1): 67-73. https://doi.org/10.1016/j.bej.2008.03.006
Dataset scope note: This document is built around a single reference enzyme
(C. necator PhaC1) and published mutagenesis studies on that enzyme and its
close variants. It does NOT use diverse multi-species sequence alignments.
See Section 3 for implications and compensating strategies.
0. IMPORTANT
0.1 General
All sequences given or referred to here are amino acid sequences.
We are using the wild-type enzyme PhaC from Cupriavidus necator (PhaC_Cn) as the starting point.
PhaC is a polyhydroxyalkanoate synthase enzyme that polymerizes monomers into polyhydroxyalkanoate polymers.
PhaC_Cn preferred product is poly-3-hydroxybutyrate (PHB), which uses monomer 3HB.
0.2 Notation
PhaC_Cn is the wild-type sequence from Cupriavidus necator, also called Cn PhaC1.
All mutations are notated in the form of AXB, where A is the single letter code for an amino acid in PhaC_Cn, X is the amino acid position index number in PhaC_Cn, and B is the single letter code for the amino acid substituted in this mutation. Example: A510T is the C. necator wild-type amino acid sequence for PhaC with a single amino acid substitution from alanine to threonine at position 510.
C. necator is sometimes referred to as Ralstonia eutropha.
PHB is poly-3-hydroxybutyrate, sometimes also called polyhydroxybutyrate or poly[(R)-3-hydroxybutyrate].
Both the single letter codes and three letter codes for amino acids are used throughout this document.
PhaC_Cs is the wild-type sequence from Chromobacterium sp. USM2 (Class I, 42% pairwise identity with PhaC_Cn).
PhaC_Ps is the wild-type sequence from Pseudomonas sp. 61-3, also called Ps PhaC1 (Class II, 67% pairwise identity with PhaC_Cn).
PhaC_Ac is the wild-type sequence from Aeromonas caviae (Class I, 37% pairwise identity with PhaC_Cn).
1. Enzyme Family Background
1.1 Classification
Class
Subunit structure
Size
Native substrate preference
Example organism
I
Single subunit
~65 kDa
scl (C3–C5): 3HB, 3HV, 3HP
Cupriavidus necator H16
II
Single subunit
~60 kDa
mcl (C6–C14): 3HHx, 3HO, 3HD
Pseudomonas sp. 61-3
There are four classes, but we are not considering Classes III and IV at this point.
Class I and II share ~50% sequence identity; Class III/IV are more distantly related.
This project focuses exclusively on Class I, using Cn PhaC1 as the sole reference
1.2 Reaction chemistry
Catalyzes polymerization of (R)-3-hydroxyacyl-CoA thioesters into PHA
Ping-pong (double displacement) mechanism:
Acylation: acyl group transferred to catalytic Cys, CoA released
Transacylation: acyl group transferred to growing polymer chain
Lipase-like α/β hydrolase fold
Catalytic triad: Cys – His – Asp
C. necator PhaC1 (Cn) reference numbering: C319, D480, H508
All residue positions in this document use Cn PhaC1 numbering unless noted
1.3 Substrate scope terminology
Term
Chain length
Key monomers
Notes
scl
C3–C5
3HP, 3HB, 3HV
Native Cn PhaC1 preference
mcl
C6–C14
3HHx, 3HO, 3HD, 3HDD
Most Class II enzymes
Broad/mixed
C3–C14
scl + mcl
Often from engineered enzymes — rare
Specialty
varies
3H4MV, 3H2MB, aromatic
Non-standard monomers, almost exclusively from engineered enzymes
We are primarily interested in scl, specifically in 3HB because my hypothesis is that increasing substrate specificity for 3HB will increase PHB production.
1.4 Why substrate specificity is structurally interesting
Dimerization interface indirectly influences active site geometry (Class I/II enzymes)
N-terminal domain is not well conserved; suggested to possibly be involved in substrate selection.
2. Structural Information
2.1 Experimental structures for reference
PDB ID
Enzyme
Class
Resolution
Notes
5T6O
C. necator PhaC1
I
1.8 Å
Primary reference, this structure contains the catalytic domain only
5XAV
Chromobacterium sp. USM2 PhaC
I
1.48 Å
additional Class I reference
2.2 AlphaFold model for Cn PhaC1
UniProt accession: P23608
Overall pLDDT: 85.94
Confidence notes: high confidence in core domain, low in N-terminal region residues 1–61
Use AF model for: loop conformations, surface regions not in crystal structure
Prefer crystal structure (5T6O) for: active site geometry, tunnel dimensions
2.3 Key structural regions (Cn PhaC1 numbering)
Region
Residues
Function
Notes
N-terminal domain
1–200
Regulatory, dimerization, possibly involved in substrate selection
Less conserved, lower structure confidence; changes in positions 153 and 175 could affect substrate selection
Core catalytic domain
200–400
Contains Cys319
High confidence
C-terminal domain
401–589
Contains Asp480, His508
High confidence
Substrate-binding tunnel
Arg398, His481
Selectivity determinant
channel is ∼18 Å in length, leading into C319.
Dimer interface
70-88
Stability
Avoid mutations here
Product-egress route
Ser201, Asp421
Avoid mutations here
product channel lined by a series of hydrophobic residues leading from the active site to the surface of the protein at a ∼95° angle to the proposed substrate entrance channel, extending ∼12.5 Å long away from the β-sheet core of the catalytic domain and widens into a small solvent pocket near the surface of the protein by the two noted residues
2.4 Substrate-binding tunnel residues
(Fill this table carefully — it is the core of your structural reasoning)
Position
WT residue
Role in tunnel
Notes
398
Arg
Entrance region
strictly conserved in Class I enzymes
481
His
Entrance region
highly conserved in Class I enzymes; mutagenesis study showed that H481Q lost 80% activity of wild-type
How to fill this table: Open 5T6O in PyMOL or ChimeraX. Select C319.
Run: select tunnel_res, byres (all within 10 of resi 319). List those
residues here with distances. This is worth spending 1–2 hours on — it
will substantially improve LLM reasoning quality.
NOTE : fill section 2.5 when you have the time to go through PyMol. 2.3 and 2.4 were filled from literature.
2.5 Tunnel geometry notes
Estimated tunnel constriction in WT Cn PhaC1: ~[X] Å (from structural analysis)
Residues that form the constriction point: [list]
Estimated minimum cavity volume for 3HHx-CoA accommodation: [X ų if known]
[Add MD simulation or docking results here as they become available]
3. Dataset Scope, Limitations, and Compensating Strategies
This section is critical. Read before every LLM session.
3.1 What your dataset contains
Reference enzyme: C. necator H16 PhaC1 (wild-type)
Variants: Published point mutants from the mutagenesis literature; published point mutants predicted to impact substrate specificity from PhaC_Cs and PhaC_Ac mutagenesis data - these mutants have been formatted into PhaC_Cn sequence through alignment identification.
Labels: Substrate incorporation data from those studies
What it does NOT contain: Homologous PhaC sequences from other species, Class II sequences, or unlabeled natural variants
3.2 Implications and honest limitations
Issue
Explanation
Impact
No evolutionary signal
Without a multi-species alignment, you cannot use co-evolutionary analysis (MI, DCA) to identify specificity-determining positions
Cannot compute MI scores; Section 3.4 of the original template is not applicable
Narrow sequence space
All data points are close variants of one sequence (1 mutation from WT)
Model cannot extrapolate to distant sequence space; suggestions far from WT are unreliable
Sparse coverage
Published mutagenesis studies cover only a small fraction of all possible positions
Many positions have no experimental data; reasoning about them is purely structural/hypothetical
Publication bias
Literature overwhelmingly reports positive results (mutations that did something interesting)
Negative results (mutations with no effect) are underrepresented; hard to learn what doesn’t matter
Lab-to-lab variability
Different studies use different assay conditions, hosts, carbon sources
Quantitative comparisons across studies are unreliable
Limited combinatorial data
Few studies systematically explore epistatic interactions
Combining individually beneficial mutations may not be additive
3.3 What this dataset IS good for
The LLM can reason very effectively about:
Mechanistic hypotheses — why does mutation X change specificity, based on
structure and chemistry?
Interpreting your experimental results — what does an unexpected outcome tell
you about the mechanism?
Experimental design — which mutations to test next given what is known?
Identifying gaps — which positions have never been mutated but are
structurally important?
Literature synthesis — connecting observations across papers into a
coherent mechanistic model
3.4 Compensating strategies
To partially offset the lack of multi-species alignment data:
Lean heavily on structural reasoning (Section 2) — fill in the tunnel
residue table as completely as possible; this replaces alignment signal
as your primary source of positional hypotheses
Include Class II reference data explicitly — even if not in your training
set, you can add a “comparative note” section describing which Cn PhaC1
positions correspond to Class II residues (from manual alignment of just
Cn PhaC1 vs. Ps PhaC1). This gives the LLM evolutionary context without
requiring a full MSA.
Weight negative results equally to positive — if you can find papers
reporting mutations that failed to shift specificity, record them in
Section 4.3. They are highly informative and rare in the literature.
Be explicit about data gaps in prompts — tell the LLM “position X has
never been mutated in the literature” so it flags its reasoning as
structural/hypothetical rather than evidence-based.
Use the LLM to propose positions to structurally analyze — ask it which
tunnel residues it would prioritize examining in the crystal structure,
then verify those manually before including them in subsequent prompts.
3.5 Class II reference comparison
(Manual alignment of just Cn PhaC1 vs. one Class II enzymes —
fills in some evolutionary context without a full MSA)
Cn PhaC1 residue
Cn AA
Ps PhaC1 equivalent residue
Ps AA
Significance
153
D
130
E
N-terminal position predicted to affect selectivity
175
G
151
G
N-terminal position predicted to affect selectivity
201
S
179
G
PHB egress channel
319
C
296
C
catalytic triad residue C
398
R
370
R
Substrate tunnel entrance
421
D
393
D
PHB egress channel
480
D
451
D
catalytic triad residue D
481
H
452
H
Substrate tunnel entrance
508
H
479
H
catalytic triad residue H
How to fill this: Use a pairwise alignment tool (e.g. EMBOSS Needle at
https://www.ebi.ac.uk/Tools/psa/emboss_needle/) with Cn PhaC1 (UniProt P23608)
and Ps PhaC1 (UniProt Q9Z3Y1). This takes ~10 minutes and is worth doing.
I used Benchling
4. Experimental Mutation Database
(This is the heart of your dataset — populate as completely as possible)
4.1 Key literature to mine for Cn PhaC1 mutations
Tsuge et al. (2003) Macromolecules — F420 region, systematic Class I
Amara et al. (2002) — systematic Class I mutagenesis panel
Rehm et al. — early mechanistic mutagenesis
Nomura et al. — broad-specificity engineering attempts
Insomphun et al. — 3HHx incorporation focus
Hiroe et al. — combinatorial mutagenesis
[Add others as you find them — search PubMed: “PhaC mutagenesis” OR
“polyhydroxyalkanoate synthase substrate specificity”]
Mining tip: For each paper, extract: (1) every mutation tested,
including ones with no effect — these are just as valuable, (2) exact
assay conditions, (3) quantitative data where reported. Even a table
footnote saying “A300G showed no change in specificity” belongs here.
4.2 Gain-of-function mutations (change in substrate specificity or activity)
Mutation
Effect
Activity vs WT
Reference
Notes
F420S
Increased 3HB specificity
increase
Taguchi et al 2002
2.4-fold increase in specific activity towards 3HB; this differs from studies on other PhaC enzymes but is correct here
F318Y
Increased mcl incorporation
no data
Harada et al 2021
predicted from PhaC_Ac mutagenesis
Y440L
Increased mcl incorporation
no data
Harada et al 2021
predicted from PhaC_Ac mutagenesis
R101L
Allowed aromatic monomer incorporation
no data
Kane 2021
predicted from PhaC_Cs mutagenesis, possible false positive
A510D
Increased molecular weight of polymer produced
no data
Tsuge et al 2004
A510E
Increased molecular weight of polymer produced
no data
Tsuge et al 2004
A510M
Increased mcl incorporation
no data
Tsuge et al 2004
A510Q
Increased mcl incorporation
no data
Tsuge et al 2004
A510C
Increased mcl incorporation
no data
Tsuge et al 2004
A510G
Increased mcl incorporation
increased activity
Chuah et al 2013
predicted from PhaC_Cs mutagenesis
A510W
no change
increased activity
Chuah et al 2013
predicted from PhaC_Cs mutagenesis
A510S
Increased mcl incorporation
no change
Chuah et al 2013
predicted from PhaC_Cs mutagenesis
A510T
Increased mcl incorporation
no change
Chuah et al 2013
predicted from PhaC_Cs mutagenesis
4.3 Neutral mutations (no significant effect on specificity)
(Underrepresented in literature but critically important — record every
instance you can find)
Mutation
Region
Why tested
Outcome
Reference
Note
A510H
A510
A510 mutations known to have effect
No change in specificity
Chuah et al 2013
predicted from PhaC_Cs mutagenesis
A510I
A510
A510 mutations known to have effect
No change in specificity
Chuah et al 2013
predicted from PhaC_Cs mutagenesis
A510P
A510
A510 mutations known to have effect
No change in specificity
Chuah et al 2013
predicted from PhaC_Cs mutagenesis
A510V
A510
A510 mutations known to have effect
No change in specificity
Chuah et al 2013
predicted from PhaC_Cs mutagenesis
A510Y
A510
A510 mutations known to have effect
No change in specificity
Chuah et al 2013
predicted from PhaC_Cs mutagenesis
Deletion of residues 2-65
N-terminal
Little existing data on N-terminal
No change in specificity
Ye et al 2008
slight increase in activity
4.4 Deleterious mutations (loss of activity or expression)
Mutation
Effect
Reference
Note
A510F
Inactive
Chuah et al 2013
predicted from PhaC_Cs mutagenesis
A510K
Inactive
Chuah et al 2013
predicted from PhaC_Cs mutagenesis
A510L
Inactive
Chuah et al 2013
predicted from PhaC_Cs mutagenesis
A510N
Inactive
Chuah et al 2013
predicted from PhaC_Cs mutagenesis
A510R
Inactive
Chuah et al 2013
predicted from PhaC_Cs mutagenesis
H481Q
Reduced to 20% of wild-type activity
Wittenborn et al 2016
attributed to substrate binding loss
4.5 Combinatorial / double mutants
Mutations
Effect vs. singles
Reference
F420S + S80P
Reduced to 79% of wild-type activity, but with better thermostability
Taguchi et al 2002
4.6 Thermostability mutations
(Relevant when stacking specificity mutations)
Mutation
ΔTm
Effect on activity
Effect on specificity
Reference
S80P
increase in thermostability
Reduced to 27% of wild-type activity
none observed
Taguchi et al 2002
4.7 Positions that have NOT been mutated in literature
(Fill as you read — these are candidate positions for novel exploration)
Position
WT AA
Structural role
Why interesting
153
D
N-terminal
predicted to affect substrate specificity
175
G
N-terminal
predicted to affect substrate specificity
398
R
Substrate tunnel entrance
substrate binding
4.8 Data quality notes
Substrate specificity data given qualitative only due to differences in experimental conditions
In vitro CoA-release assays (DTNB) give intrinsic kinetic data but don’t
fully reflect in vivo selectivity under substrate competition
Some older studies used racemic substrates — stereospecificity may confound
apparent chain-length specificity
[Add specific notes about inconsistencies you notice across papers]
5.5 Catalytic and key residue positions (for quick reference)
Residue
AA
Role
C319
Cys
Catalytic — nucleophile; DO NOT MUTATE
D480
Asp
Catalytic triad; DO NOT MUTATE
H508
His
Catalytic triad; DO NOT MUTATE
R398
Arg
Tunnel entrance; strictly conserved - mutate with caution
H481
His
Tunnel entrance; highly conserved - mutate with caution
D153
Asp
N-terminal position predicted to affect selectivity; mutational target
G175
Gly
N-terminal position predicted to affect selectivity; mutational target
S201
Ser
PHB egress channel
D421
Asp
PHB egress channel
6. Engineering Target
6.1 Primary goal
[State precisely, e.g.:]
Increase substrate specificity towards 3HB specifically or scl generally with combinatorial mutations in the N-terminal and elsewhere, with the hypothesis that this will increase overall PHB production.
6.2 Secondary goals
Avoid total loss of activity
6.3 Acceptable tradeoffs
Up to 30% reduction in activity acceptable
6.4 Hard constraints — DO NOT VIOLATE
Do NOT mutate catalytic triad: C319, D480, H508
Avoid dimer interface residues: 70-88
6.5 What has already been tested
(Update after every experiment round — prevents redundant suggestions)
Mutation(s)
3HHx result
Other notable effects
Date
Notes
WT control
~0 mol%
Baseline
[date]
7. Production and Assay Context
7.1 Expression system
Host: Cell-free expression, E. coli BL21(DE3) lysate
Assay type: visual inspection for insoluble PHB granules
Substrate(s): 3HB-CoA
Buffer conditions: HEPES-KOH pH 7.5
7.4 PHA analysis
Extraction method: TBD
Monomer analysis: GC-MS for identification]
Quantification standard: LC-MS
Throughput: TBD
8. Reasoning Guidelines for LLM
8.1 Dataset context — tell the LLM explicitly at session start
Always include this statement at the top of each session prompt:
“My dataset consists only of C. necator PhaC1 (wild-type) and published point mutants of this single enzyme. I do not have a multi-species alignment. All positional reasoning should be grounded in (a) the experimental mutation database in Section 4, and (b) structural analysis of PDB 5T6O / AlphaFold model P23608. Do not infer specificity determinants from phylogenetic patterns — that data is not available.”
8.2 Prioritization criteria (in order, adjusted for this dataset)
Direct experimental evidence — mutations in Section 4 with measured outcomes
Structural/mechanistic reasoning — based on 5T6O crystal structure and
tunnel geometry (Section 2)
Analogy to Class II — using the pairwise comparison in Section 3.5,
noting explicitly when this is being used
Chemical intuition — physicochemical rationale for a substitution,
flagged as [SPECULATIVE] if no structural or experimental support
8.3 Required output format for mutation suggestions
For every suggested mutation, provide:
(a) Mutation in standard notation (e.g. A149F, Cn PhaC1 numbering)
(b) Primary evidence basis: Experimental / Structural / Class II analogy /
Chemical intuition [SPECULATIVE]
(c) Mechanistic rationale — specific, not generic
(d) Consistency with existing data in Section 4 — does it contradict anything?
(e) Confidence: High (direct experimental support) / Medium
(structural + analogy) / Low (chemical intuition only)
(f) Predicted risk: stability, expression, activity loss
8.4 Reasoning I do NOT want
Statements like “this position is conserved in mcl enzymes” — you do not
have alignment data to support this; use only the pairwise comparison in 3.5
Quantitative predictions of mol% outcomes
Suggestions violating hard constraints in Section 6.4
Suggestions already in Section 6.5 “already tested” table
Filling data gaps with plausible-sounding inventions — flag uncertainty explicitly
8.5 Especially useful prompts for this dataset type
Given the single-enzyme focus, these prompt types will be most productive:
Gap analysis: “Which tunnel-lining residues (Section 2.4) have never
been mutated in the literature (Section 4.7)? For each, give a structural
rationale for whether they are likely to affect specificity.”
Mechanistic interpretation: “Mutation X gave unexpected result Y.
Given the structural context of position X (distance to C319, neighboring
residues, tunnel role), propose 2–3 mechanistic explanations.”
Epistasis prediction: “Given that A149F and S325A are individually
beneficial, reason about whether their combination is likely to be additive,
synergistic, or antagonistic, based on their structural relationship.”
Experimental prioritization: “I can test 12 variants. Given the
mutation database and structural data, design a 12-variant panel that
maximizes information gained about specificity determinants.”
8.6 My background
PhD in bioengineering. Comfortable with molecular biology,
enzyme kinetics, and microbial fermentation. Less experienced with
structural biology and bioinformatics — please explain structural reasoning clearly but
do not oversimplify the biochemistry.
9. Session Log
(Prepend full context document + append this log to every session)
Mechanistic hypothesis building for PhaC_Cn scl selectivity
Suggest single N-terminal mutations to probe that region
Suggest single and combinatorial mutations outside the N-terminus
Consolidate all suggestions into a Round 1 experimental panel
Key outputs / hypotheses:
Hypothesis 1 — Two-point selectivity model:
scl selectivity in PhaC_Cn is established at two structural points:
Tunnel constriction (A510): Ala510 acts as a steric gate physically excluding acyl chains longer than ~C5 from reaching C319. This is the primary passive size filter. WT Ala at this position is already near-optimal for scl — bulkier substitutions (F, K, L, N, R) are inactive, and smaller substitutions (G, S, T) widen the tunnel and permit mcl incorporation.
Active site geometry (F420): Residues near the base of the active site, including F420, optimize catalytic geometry for the C4 acyl-enzyme intermediate. F420S gives a 2.4-fold increase in 3HB-specific activity, consistent with relief of steric strain in the binding pose for 3HB-CoA.
Hypothesis 2 — R398 and H481 are positioning/catalytic residues, not selectivity gates:
Both are strictly or highly conserved across Class I enzymes regardless of substrate preference. R398 likely contacts the CoA moiety to position the acyl chain for nucleophilic attack; H481 likely contributes to transition state stabilization. Neither is a primary chain-length selectivity determinant. Both are high-risk mutation targets.
Hypothesis 3 — Residual mcl leakiness has an uncharacterized structural origin:
WT PhaC_Cn incorporates very low levels of 3HO and 3HDD. Since A510 appears near-optimal for scl exclusion and F420S already improves 3HB activity, the residual mcl leakiness likely originates from dynamic flexibility elsewhere in the tunnel — possibly in the uncharacterized region between R398/H481 (entrance) and A510 (constriction). This region is not yet described in Section 2.4 and should be a priority for PyMOL analysis.
Hypothesis 4 — N-terminal domain role is genuinely unclear:
Deletion of residues 2–65 (Ye et al. 2008) shows no specificity change, suggesting the extreme N-terminus is dispensable. D153 and G175 are proposed as candidate positions based on Class II pairwise comparison only. G175 is conserved as Gly in both Class I and II, suggesting structural rather than selectivity role. D153 differs conservatively between classes (Asp vs. Glu) and is the stronger candidate. All N-terminal reasoning is [SPECULATIVE].
12 total variants including WT. Fits standard 12-well format with no spares — consider dropping Y440L (priority 10) to keep a spare well if expression failures are anticipated.
Flagged uncertainties / SPECULATIVE tags:
All N-terminal suggestions (D153E, D153A, G175A) are [SPECULATIVE] — grounded only in AlphaFold model (low pLDDT in this region) and Class II pairwise comparison. No structural data from 5T6O available for this region.
F318Y and Y440L are predictions transferred from PhaC_Ac (37% identity) — transfer reliability is unknown and should be treated as unvalidated until tested directly in PhaC_Cn.
F420S mechanistic basis (Hypothesis A: steric relief vs. Hypothesis B: electrostatic contribution) is not resolved by available data — both remain plausible.
The identity of tunnel residues between R398/H481 and A510 is not characterized in Section 2.4 — this gap limits mechanistic reasoning about the constriction region.
Epistasis between all combinations is unknown; F420S + A510G is the combination with the most interpretable expected outcome.
Action items:
Complete PyMOL tunnel analysis (Section 2.5) — residues within 10 Å of C319, focusing on the R398-to-A510 region
Verify structural position of F420 relative to C319 and catalytic triad in 5T6O
Identification of PhaC analog in Cyanobacterium aponium UTEX 3222 and overproducing or engineering for increased efficiency
BLAST/align with known PHA-synthases
Compare efficiency / mutations that improved turnover in other PhaC - test analogous mutations (aligned location, similar or different AAs). improved substrate specificity?
Site-specific saturation mutagenesis? Would be good use for automation
Quorum sensing based killswitch (i.e. cell dies if it escapes bioreactor)
Has to have some kind of inducible element or won’t grow after initial transformation
What’s good at quorum sensing already?
Something else??? Something in E coli that can be done on Opentron
Because it’s more convenient for a final project to be executed in Victoria remotely
Cyanobacterial expression plasmid across multiple cyano species
needs to include E coli machinery for manipulation and production (and conjugation, for relevant species)
Ideas:
PhaC protein engineering
Short term aim: Design small library of PhaC variants with expected improvement
Medium term aim: Generate library and test in chassis strain
Long term aim: Develop PHB bio-manufacturing cyanobacterial strain for carbon-neutral/carbon-negative plastic (depending on biodegradation).
Quorum sensing based circuit for biocontainment
Short term aim: Design killswitch with genetic circuit to trigger based on quorum sensing.
Medium term aim: Build genetic circuit with expression based on quorum sensing with a measureable output; test circuit in E. coli.
Long term aim: Optimize circuit sensitivity and test with killswitch expression; integrate into bio-manufacturing chassis strains for population-linked biocontainment.
Broad cyanobacterial expression plasmid
Short term aim: Design plasmid backbone based off native cyanobacterial plasmids and established E. coli machinery.
Medium term aim: Test expression in multiple cyanobacterial strains (including some previously considered genetically intractable with classic broad-host-range vectors).
Long term aim: Establish protocol for domestication of newly prospected, wild-type cyanobacterial strains using the cyanobacterial plasmid.
Mar 31, 2026
Leaning towards quorum sensing killswitch because it’s more aligned with my prior experience and knowledge, so i think it will take less research on my behalf. since i’m already falling behind on homeworks, i’m worried about how much time it would take to optimize a protein since i have no prior machine learning experience.
Quorum sensing notes:
auto-inducer: triggers expression
keep in mind phenolic compounds and other naturally occurring quorum quenching
also keep in mind the potential for auto-inducer production from other related bacteria; like if biomanufacturing strain escapes bioreactor but lands in soil with existing microbiome - we still want the escaped cells to die
maybe we could make a synthetic quorum sensing system for orthogonality: would require biosynthetic pathway for auto-inducer, auto-inducer recognition (inducible promoter, transcription factor, riboswitch, etc.), auto-inducer export pathway to preferentially or rapidly diffuse out of the cell
for killswitch activation at low population (cells escaped from bioreactor), maybe consider secondary/back-up activation from an environmental signal
potentially test circuit with fluorescence or colorimetric output first before killswitch/toxin-antitoxin genes
References
Miguel, CMTS; Santos, CA; Lima, EMF; et al. Quorum Sensing in Bacteria: From Mechanisms to Applications in Foods. 2026. Current Opinion in Food Science: 101394. DOI: 10.1016/j.cofs.2026.101394.
maybe autoinducer can also trigger expression of toxin repressor
killswitch trigger for population low (like Paula’s idea for targeted drug delivery):
low constitutive expression of antitoxin
autoinducer-triggered expression of toxin
maybe autoinducer can also trigger expression of antitoxin repressor
Apr 2, 2026
In Victoria node recitation last night, Derek suggested a possibility for cell-free testing of the system to be able to use the Gingko cloud lab instead. Originally i had figured that because i want it to be a killswitch system, that it needs to be in a living cell. Also because traditional quorum sensing systems are dependent on autoinducer concentration within vs outside the cell membrane. But Derek suggested considering instead how to design a quorum sensing system that would be cell-free like on a paper biosensor: that triggers when at a minimum concentration, rather than triggering at the first cell it sees.
Phrasing it that way made me think of the analog computing of the neuromorphic circuits: where inputs are additive (positive or negative). So to reach a minimum concentration rather than the very first thing present, there has to be a counter-actor to the sensed thing present; something that degrades or binds to the autoinducer or signalling metabolite that is expressed constitutively at a low level. So when the signalling molecule concentration is low (low population), it will be all used up by the counter-actor before it can trigger expression of the QS-controlled genes. When the signalling molecule concentration is high (high population), it will outnumber the counter-actor, so it can still trigger the QS-controlled genes.
For example, a riboswitch that recognizes a small molecule metabolite. The metabolite is produced and exported by cells, and when present, activates the gene of interest (in my switch a killswitch or fluorescent protein). We’d also want to express the riboswitch as an aptamer that is unconnected to the gene of interest to bind the metabolite at low concentrations, until a high concentration of the metabolite is reached and the metabolite outnumbers the loose aptamer and can trigger the riboswitch to activate gene expression.
Apr 3, 2026
Brainstorming and design
Drafts
Title:
Population-dependent killswitch to prevent bioreactor escape
Short description:
Biocontainment is essential for safe biomanufacturing, but most strains with biocontainment have bespoke systems designed for that particular strain. A population-dependent killswitch would kill any cells that escape the bioreactor where they are being cultivated or harvested. My initial idea is a toxin-antitoxin system expressed under control of a quorum-sensing circuit. Future considerations: safeguards against biocontainment escape through mutation, multiple levels of regulation.
Aims:
Design a genetic circuit that controls expression dependent upon cell population density in E. coli. The circuit will be designed with the intent for a final use with a killswitch, but fluorescent or colorimetric outputs might be used for initial design and validation. Validate the circuit with a simulation in Asimov Kernel.
Test circuit in E. coli with a measurable output (such as fluorescence).
Test circuit with killswitch; integrate into a biomanufacturing chassis strain for population-linked biocontainment.
Companies:
Asimov - I plan on using Kernel to design and simulate my genetic circuit. Basecamp Research - Maybe their AI can help me design overlapping genes to prevent killswitch escape via toxin gene mutation. Cultivarium - If successful, quorum-based biocontainment could be a useful genetic tool to port to new potential chassis microbes.
Project idea slide
Project description: Biocontainment is essential for safe biomanufacturing, but most strains with biocontainment have bespoke systems designed for that particular strain. A population-dependent killswitch would kill any cells that escape the bioreactor where they are being cultivated/harvested. Initial idea is a toxin-antitoxin system expressed under control of a quorum-sensing circuit. Need to consider safeguards against biocontainment escape through mutation, multiple levels of regulation.
Asimov: I plan on using Kernel to design and simulate my genetic circuit.
Basecamp Research: Maybe their AI can help me design overlapping genes to prevent killswitch escape via toxin gene mutation.
Cultivarium: if successful, quorum-based biocontainment could be a useful genetic tool to port to new potential chassis microorganisms.
References:
Leonard SP; Halvorsen TM; Lim B; et al. Synthetic overlapping genes stabilize genetic systems. 2026. mBio, 17(3):e0272525. DOI: 10.1128/mbio.02725-25.
Blazejewski, T; Ho, H-I; Wang, HH. Synthetic sequence entanglement augments stability and containment of genetic information in cells. 2019. Science, 365(6453): 595-598. DOI: 10.1126/science.aav5477
Last night in the Victoria node recitation, Derek was really talking about how cool the Kernel-Twist-Nebula-Waters pipeline is, and he mentioned that he was a little disappointed that not many projects seemed like they were fully utilizing it. Especially since he still isn’t back in Victoria, it seems like the only way i’ll be able to get any actual lab data unfortunately, so that’s different from my original plan with the quorum sensing. i ended up messaging Derek on Discourse to ask if it was too late to change my mind, and he said that while technically yes, since no one had signed up on my slide as a mentor yet, i could change it. So i went ahead and came up with a new slide and replaced my original response.
Description:
Current bioplastic production is too expensive to compete commercially with petroleum plastics. Bioplastics, such as PHA, produced by cyanobacteria are one possible solution because they require minimal feedstocks (atmospheric carbon dioxide, sunlight, non-potable water), but processing can be expensive (harvesting, dewatering, purification). Cyanobacterium UTEX 3222 is a new potential chassis for PHB bioplastic with lower processing intensity due to its phenotypic properties (planktonic grown and settling, potential native PHB production). This strain can be further improved by engineering PHA synthase for increased substrate specificity, to preferentially produce PHB (to decrease purification steps). Existing data on PHA synthase substrate preference and specificity can be used to train an ML tool, which could recommend mutations that could be tested in a cell-free expression system.
Companies:
Basecamp Research: Machine learning expertise and datasets
Biofabricate: experience with biomaterials marketing and maybe scale-up
Boltz.bio: ML for protein design (but it’s for drug discovery)
Cultivarium: specifically for aim3, UTEX 3222 is currently considered genetically intractable
Ginkgo: Cell-free protein expression system
Twist: DNA synthesis for my mutant library
Waters: MS to identify PHA (general) and PHB (specific) production
References
These are for using mass spectrometry for PHA analysis, for the Waters step of the pipeline.
Khang, TU; Kim, M-J; Yoo, JI; et al. Rapid analysis of polyhydroxyalkanoate contents and its monomer compositions by pyrolysis-gas chromatography combined with mass spectrometry (Py-GC/MS). 2021. International Journal of Biological Macromolecules, 174: 449-456. DOI: 10.1016/j.ijbiomac.2021.01.108
Johnston, B; Radecka, I; Chiellini, E; et al. Mass spectrometry reveals molecular structure of polyhydroxyalkanoates attained by bioconversion of oxidized polypropylene waste fragments. 2019. Polymers, 11(10):1580. DOI: 10.3390/polym11101580
Conners, EM; Bose, A. State-of-the-art methods for quantifying microbial polyhydroxyalkanoates. 2025. ASM Applied and Environmental Microbiology, 91(9):e00274-25. DOI: 10.1128/aem.00274-25
These are for machine learning for enzyme engineering.
Satoh, Y; Tajima, K; Tannai, H; et al. Enzyme-catalyzed poly(3-hydroxybutyrate) synthesis from acetate with CoA recycling and NADPH regeneration in Vitro. 2003. Journal of Bioscience and Bioengineering, 95(4): 335-341. DOI: 10.1016/S1389-1723(03)80064-6
Apr 9, 2026
Talking to Derek about the timeline in our Victoria node recitation last night, he suggested that everything for lab work will probably need to be ordered in the next two weeks to get data in time for final project presentations. He also said that if we want to run anything on the Ginkgo Nebula cloud lab, we need to talk with Ronan and see if he has the capacity for it. Given this timeline, i am almost definitely not going to be able to figure out any ML-guided protein engineering before the final ordering. What i’m thinking instead is to design initial constructs of PhaC from C. necator, PhaC from UTEX 3222, and a rational design for a UTEX 3222 PhaC mutant, all designed for cell-free expression. The reaction will probably include the monomer, since it’s simpler than using the full 5-enzyme cell free system from Satoh et al (reference 8 above) that used acetate as the feedstock, but I will need to double check the energy and CoA regeneration.
Apr 10, 2026
Enzyme sequence choices
PhaC enzyme from Cupriavidus necator was chosen as my wild-type. I used the amino acid sequence from Uniprot and codon-optimized it in Benchling for Escherichia coli. This was from homework 2 i think, and i just used that one.
For the mutant: I found a review paper (Ref1) that identified Ala510 in PhaC_Cnecator as having a role in substrate specificity: with A510M, A510Q, and A510C all increasing promiscuity (M, C both sulfur-containing residues; Q, C both polar residues; M, Q both larger residues); a related PhaC from Chromobacterium sp. USM2 found that changing the analogous A to M/W/V (all non-polar residues, larger than A) increased promiscuity; and the same PhaC from Chromobacterium sp. USM2 found that changing the analogous A to S (similar size, but polar) increased substrate specificity (towards short-chain-length PHAs, like PHB). It’s surprising that A->S had the oppposite effect as A->C, for these two different PhaC variants from different bacteria. But since I didn’t have time to read a lot more, I figured A510S was a good construct to test against the PhaC_Cnecator wild type to start with.
I tried to identify the PhaC sequence from UTEX 3222 to test as well, but I was unable to, as of yet. While the paper in which UTEX 3222 was prospected said the authors identified the genes encoding the PHA biosynthesis enzymes (Ref2), the genes weren’t annotated on the full genome sequence assembly, and I got no results BLASTing either C. necator PhaC or cyanobacterial PhaC from Synechocystis sp. PCC 6803 or the more closely relatated Microcystis aeruginosa sp. PCC 7608SL. I also tried BLASTing PhaE (another PHA biosynthetic enzyme) from a few different cyanobacterial strains as well, with still no results. All BLAST searches were tBLASTn to search for the nucleotide gene sequence within the genome assembly from the amino acid sequences from the various known PhaC
protein sequences. The genes were also not listed amongst the biosynthetic genes listed in the Supplementary Information from the UTEX 3222 paper. I was out of ideas at this point, and on a time constraint, so to get constructs added to the order list today, I decided to move forward just with the PhaC_Cnwt and PhaC_CnA510S for now. If/when I get my ML design program working, maybe I can email George Church (or whoever on the author list did the genome annotation) to try to run it through, but I can definitely start with the C. necator one.
Construct design
Derek sent me a message asking me to order constructs today. So I went into Kernel to design PhaC_Cnecator with T7 promoter, RBS and terminator for cell-free expression because the E. coli based cell-free expression kits I found online from both NEB and Thermo Fisher both used T7 polymerase. In Kernel, I used a T7 promoter, T7 RBS, and T7 terminator from the iGEM repository. I chose promoter Bba_Z0251 from the many options because it had a lot of documentation on its iGEM registry page, and matched the full consensus sequence (from the T7 promoters iGEM page). I chose RBS Bba_Z0261 from the many options because it was analyzed by the same iGEM team as the promoter I used. I used T7 terminator Bba_K731721 from the many options because it most closely matched a quick google search for the T7 terminator sequence. While Kernel did have a genetic part for PhaC_Cnecator in the Uniprot repository, it actually didn’t have a nucleotide sequence associated with it. So i copied the promoter, RBS, and terminator sequences from Kernel into Benchling, where I used the previously codon-optimized PhaC_Cnecator sequence from homework 2. I used Benchling’s translation tool to identify the Ala at position 510, and changed a single nucleotide to change A510 to A510S (Ala: GCC; Ser: TCC) for the mutant.
Then I exported the FASTA files for both constructs and uploaded them into the Twist portal for clonal genes. I couldn’t remember if it mattered using linear gene fragments or clonal genes within a plasmid, but I went with clonal plasmid because previous experience with linear fragment orders from Twist were pretty low concentration. I remembered from lecture that Ronan preferred us to use chloramphenicol for an antibiotic marker if needed, so I decided to use the pTwist-Chlor-HighCopy cloning vector. Twist’s interface found both genes to be complex, so I used its internal codon optimization to fix this issue: I identified the organism as E. coli, did not omit any restriction enzyme recognition sites, and selected the promoter, RBS, and terminator regions as sequences that should not be changed. To my surprise, these sequences were not identical except the one point mutation; they were optimized differently, but I suppose it doesn’t really matter. Then I exported the full constructs (including plasmid) GenBank files from Twist and re-uploaded into Benchling to generate the link for adding the spreadsheet.
After meeting with Derek to explain, he suggested using linear gene fragments instead of clonal, so I re-did the Twist ordering bit to generate prices and optimized fragment GenBank files. I elected to leave the adaptors on because I assume those will give long enough arms, but I’m not really sure. Derek said he’d check with Ronan.
Experimental design
I checked that Millipore Sigma does in fact carry my substrate, I think. The substrate being the PHB monomer: 3-hydroxy-butyryl-CoA. However, it’s very expensive, so I’ll see about also ordering the DNA and cheaper substrates for the 5-enzyme biosynthetic pathway with CoA recycling that was in one of the papers I found (Ref3). After comparing the even just of all the substrates I’d still need for the full pathway, it’s cheaper just to order the original substrate (since I’d still need at least a little bit of CoA, which is still expensive on its own) then to also get a bunch of additional DNA. Derek mentioned that I need to figure out what kind of purification is needed for Waters to analyze my PHB product at the end of the reaction.
Reference
Chek, MF; Hiroe, A; Hakoshima, T; et al. PHA synthase (PhaC): interpreting the functions of bioplastic-producing enzyme from a structural perspective. 2018. Applied Microbiology and Biotechnology, 103: 1131-1141. DOI: 10.1007/s00253-018-9538-8
Schubert, MG; Tang, T-C; Goodchild-Michelman, IM; et al. Cyanobacteria newly isolated from marine volcanic seeps display rapid sinking and robust, high-density growth. 2024. ASM Applied and Environmental Microbiology, 90: e00841-24. DOI: 10.1128/aem.00841-24
Satoh, Y; Tajima, K; Tannai, H; et al. Enzyme-catalyzed poly(3-hydroxybutyrate) synthesis fro macetate with CoA recycling and NADPH regeneration in Vitro. 2003. Journal of Bioscience and Bioengineering, 95(4): 335-341. DOI: 10.1016/S1389-1723(03)80064-6
Apr 13, 2026
After Derek talked to Ronan, he suggested going back to clonal genes. I used my original PhaC_Cn construct, but then I decided to just have the point mutation for the mutant and have the rest of the sequence be identical. So I copied the PhaC_Cn-pTwist construct into a new DNA sequence in Benchling, and made the point mutation (GCA->TCA), and then verified quickly in Twist that this sequence is still simple and the same price.
Updated idea slide for cell-free synthesis Aim 1 instead of LLM/ML
Apr ?, 2026
Wanted to get started on the AI/ML aspect, so i started looking into that. My original plan had been to use this as an opportunity to expand my Python capabilities and play around with scikit-learn, but unfortunately, i realized i just didn’t have the time for that before the end of the course. After hearing Victoria node TAs Derek and Piyush talk about the AI tutor they developed for the course, I thought about maybe working with an LLM like Claude instead since that would require less initial coding on my end, and could still work because proteins are not dissimilar to language.
Apr 27, 2026
Did some reading, and it turns out that people have used LLMs for protein design before.
INPUT REFERENCES!!
May 7, 2026
Made an account for Claude.ai and
Group Final Project
Group: Jessee Svoboda, Paula Carrodeguas, Iman Karibzhanova, Peter Hanna
From homework 4: Group Brainstorm on Bacteriophage Engineering
What do we know:
E. coli DnaJ binds to denatured proteins to prevent/disassemble aggregates (native function in heat-shock).
DnaJ binds to the hydrophilic tail of MS2-L protein.
point mutation of highly conserved proline in DnaJ results in no lysis (so maybe no more binding of MS2-L tail?)
removal of MS2-L tail recovers lysis function (meaning DnaJ is only necessary when tail exists)
suggests hydrophilic tail aggregates in some way that prevents lysis except in presence of DnaJ to stop aggregation
so stability should be improved if we can figure out how the tail is interacting with the tail of other MS2-L molecules, and then mutating that away so there is no aggregation and dependence on DnaJ
graph TB;
 A[sequence and structure of MS2-L] -->|if geometry and chemical interactions are known| B[view interactions between MS2-L copies]
 A -->|if geometry and interactions are not known| C[model interactions with AlphaFold or something that can do protein interactions]
 B -->|visual analysis and mutation modeling| D[Identify important residues in MS2-L tail interactions]
 C -->|visual analysis and mutation modeling| D[Identify important residues in MS2-L tail interactions]
 D -->|use knowledge of hydrophobicity/charge/etc. OR use ESM2 mutational scan and select ones that it finds unlikely| E[Select dissimilar AAs to substitute in interacting residues]
 E -->|AlphaFold or similar| F[model protein folding in new AA sequence with selected mutations]
 F -->|something that can model protein interactions| G[model interactions between mutant MS2-L copies]
 G -->|select mutations that have similar hydrophilicity as original tail but less interaction with each other and maybe also with DnaJ| H[test mutations in lab]
Potential problems:
don’t know what can model protein-protein interactions
we might have covered this in class but i don’t remember. i can rewatch the lectures
what if modeling doesn’t show interactions between the tails? we know there probably has to be one…
might have to simplify by only modeling the tail section, but that is probably known already (will have to model folding and interactions with full protein sequence in later steps probably)
could start with DnaJ, what in MS2-L binds with the essential proline in DnaJ, and assume that it’s spatially close to that. then test various mutations of nearby residues
From homework 5: Final Project: L-Protein Mutants
We didn’t get to this part of the project unfortunately. But we did have some planning discussion.
My assumption was that DnaJ stabilizes the L-protein by preventing aggregation that would otherwise occur with the long tail.
Peter suggested:
Sooo, the phage genome is very tightly regulated, I decided to take a look on how this regulation work, and it’s mainly based on RNA secondary structures
How the lysis protein is regulated:
The start codon and the shine-Dalgarno sequence are buried in an RNA hairpin, rendering virtually inaccessible to the ribosome, only when a ribosome slips during Coat protein’s translation termination does it get get translated, this has a very rare 5% chance of occuring
How the replicase protein is regulated:
There’s a 19 nt hair called the operator or TR (translation repression) located upstream of the replicase protein, as the CP is translated, dimers form, that binds the TR hairpin, repressing replicase translation and signaling the beginning of the capsid assembly
One of the things I noticed, the TR hairpin overlaps with the lysis protein too, so in theory, it does repress it too
I’ve attached a linear map of the MS2 genome to follow along, here is its source too: Emesvirus ~ ViralZone
Here’s the genome engineering idea I arrived at: the first 40 amino acids of the L protein seem to be dispensable, and they’re the ones that cause it to interact with the chaperone DnaJ. What if we shift the start codon from its original position at 1678 to 1795? This would produce an L protein without the troublesome soluble N-terminus.
There are several problems though:
We need to model the MS2 gRNA. Most models can only handle short sequences, while the MS2 genome is 3569 nt long, which is pretty large for current tools. One model that might work is RNAPro, but I couldn’t find a web server or a Colab notebook to run it. The source code is on Hugging Face, but I don’t have much coding experience so I couldn’t get it running.
If the start codon is shifted to this position, the L protein will compete with the replicase for translation, so we’d need to ensure there’s a strong SD sequence for the new L start site.
The translation regulation would basically be lost, since L translation would no longer be coupled to CP. That creates a risk of premature lysis, where L protein is translated at lethal levels before new virions are assembled.
I was wondering if there’s a way to bury the SD sequence for the 1795 L site so that it’s only accessible when the CP dimer binds to the TR hairpin. That might help mitigate the premature lysis problem. I’m not sure though whether the L region would stay accessible long enough to induce lysis. I also couldn’t find a paper on the assembly kinetics.
Another idea I had was increasing the CP dimer affinity to the TR hairpin so that the L region can stay accessible for long enough before assembly proceeds.